ad-a144 solyation and dielectric dispersion in … · consideration of london dispersion energies...
TRANSCRIPT

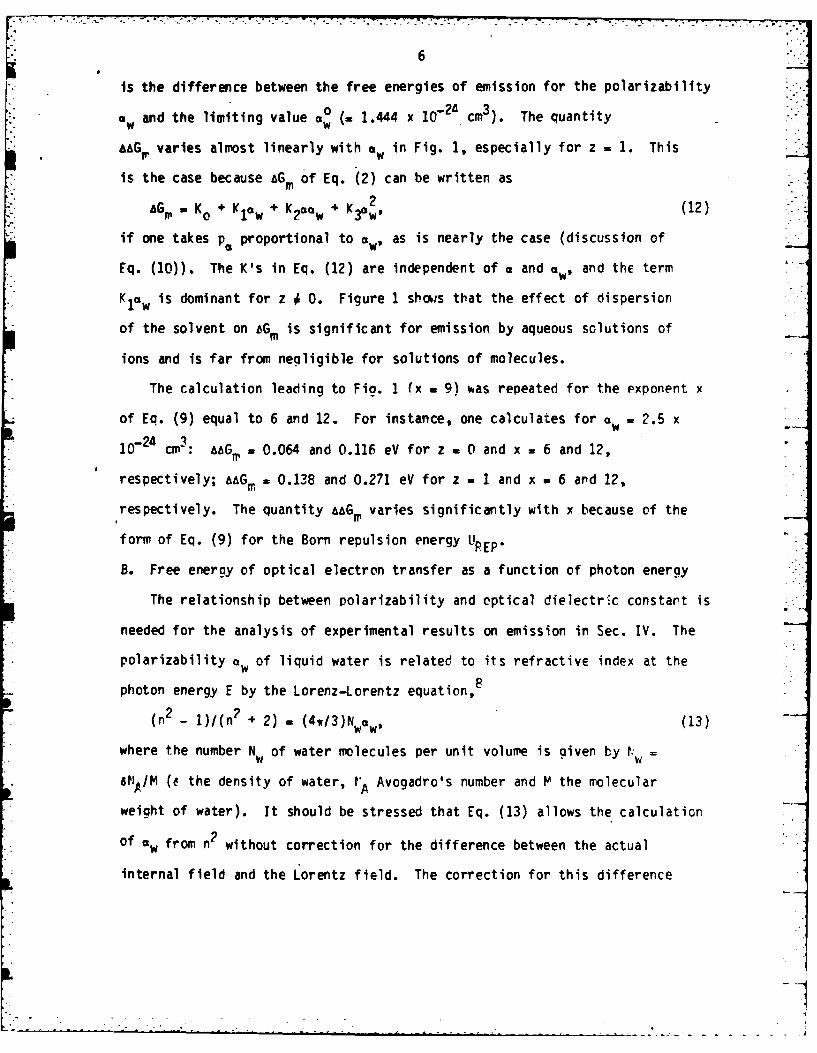
AD-A144 183 SOLYATION AND DIELECTRIC DISPERSION IN OPTICAL ELECTRON 1/iTRANSFER(U) NEW YORK UNIV NY DEPT OF CHEMISTRY
DELAHAY ET AL. JUL 84 NYU/DC/TR-6-NEW-SERIES-2
UNCLASSIFIED N08884-82-K-Oli3 F/'6 7/5 N
I~~~ EEEEEEEEMENEMf..ll~llfff
I lmll

-. 1. L50-
1111.8
MICROCOPY RESOLUTION TEST CHART
NATIONAL BUREAU OF STANDARDS- I963-At

OFFICE OF NAVAL RESEARCH
Contract NOOO14-82-K-0113
Task No. NR 359-258
TECHNICAL REPORT NO. NYU/DC/TR-6-NEW-SERIES-2
~ SOLVATION AND DIELECTRIC DISPERSION IN OPTICAL ELECTRON TRANSFER
by
Paul Delahay and Andrew Dziedzic
Accepted for publication In
The Journal of Chemical Physics
New York UniversityDepartment of Chemistry
New York, NY
DTIC. ELECTE
July 1984 AUG8 1984
C.D. (. B
LI
Reproduction in whole or in part is permitted forany purpose of the United States Government
This document has been approved for public releaseand sale; its distribution is unlimited
84 08 06 125

Unci assi fi ad4E9CURITY CLASSIFICATIO14 OF THIS PAGE (S 30' . Enre4__________________
REPORT DOCUMENTATION PAGE BEPOPI COUPLKTDG FORM0. NEPMR men 1. GOVT ACCESSION NO: 3. RECIPIENT'S CATALOG MUMMER
NYU/DC/TR-6-NEW SERIES-2 Al. /Y(4 ( ______________
4. TITLE (andE Ssab*ta.) S. TYPE OF REPORT & PERIOD COVEREDSOLVATION AND DIELECTRIC DISPERSION IN Technical ReportOPTICAL ELECTRON TRANSFER
S. PERFORMING ORG. REPORT NUMseR
7. AUTHOR(q) II. CONTRACT OR-GRANT NUMMER(.)
Paul Delahay and Andrew Dziedzlc N00014-82-K-0113
S. PERFORMING ORGANIZATION NME AND ADDRESS 10. PROGRAM ELEMENT. PROJECT. TASKAREA & WORK UNIT NUMBERSNew York University NR359-258
Now York, NY 10003
11. CONTROLLING OFFICE NAME AND A0DDRESS0 12. REPORT DATEOffice of Naval Research July 1984Arlington, VA 22217 13. MMER OF PAGES
14. MONITORING AGENCY NAMIE A ADORES4'ft d4fn0n h= CONN0111me OGIle) 15. SECURITY CLASS. (ofAl tdepe
IS& . CA-SSIPICATIONI DOWNGRADING
OISL DISTRIBUTION STATEMENT (of dots Repees
This document has been approved for public release and sale;its distribution is unlimited.
17. DISTRIUVUIOW STATEMENtT (of U,. o*UU intd i. *.f* 2It EIRIfE kerRuu
IS. SUPPLEMENTARY NOTES
Accepted for publication in the Journal of Chemical Physics.
IS. KEY WORDS (Con... vfWdej it .oa...a md I.WUd' OW Nook -- 6-.)
Dielectric dispersion SalvationPhotoelectron emission Vacuum ultravioletPol ari zabiIi ty
20. ABSTRACT (Centhe an 9"W09 side It uaa d@640 WIdS~00 OF, NOah M5.)The effect of dielectric dispersion of the solvent on the energeticsof optical electron transfer is determined quantitatively by variationsof the free energy of salvation of the species being photoionized. The1k solvation free energy varies because the solvent polarizability in theinner-s phere region of the photon absorbing species changes with photonenergy on account of dispersion. The salvation free energy is computedfor a varying polarizability of the solvent in the inner-sphere region
DD I '017 1473 EITIOrN or I NOVol Ois OBISOLETE Uncl ass I f i adJ A NS / N 01 2 -L -0 4 -6 01S E C U R IT Y C L A S S IF IC A T IO N O F T H IS 8 P A G E ( M N, D o-to Oin o

S11n -• 4 .4,v-
88CUI'Y CLASSIFICATION OF THIS PAGt (WbU Data R
and a fixed nuclear configuration of the solvent. The followinginteraction energies are considered: charge-induced dipole, dipole-induced dipole, induced dipole-induced dipole, formation of induceddipoles, solute-solvent London dispersion, solvent-solvent Londondispersion, solute-solvent and Solvent-solvent Born repulsion. Thechange of solvation free energy in aqueous solution is computed inthe 7 to 11 9V range from data on the refractive index of waterobtained by reflectance spectroscopy. The theory accounts quanti-tatively for the effect of dispersion on photoelectron emission byaqueous solutions of anions, cations and molecules.
Accession For
NTIS GRA&IDTIC TAB*unannouncedJustificatio
Distribution/ _
Availability Codes
!Avail and/orDist Special
UnclassifiedI6uRITY CLASIICATION OF TWIS PAGOMwhM Deft Rhmee)

Solvatlon and dielectric dispersion in optical electron transfer
Paul DELAHAY* and Andrew DZIEDZIC
*Department of Chemistry, N!ew York University, t!ew York, New York 10003R,
e
(Received )
The effect of dielectric dispersion of the solvent on the energetics of
optical electron transfer is determined quantitatively by variations of the
free energy of solvation of the species being photoionized. The solvation
free energy varies because the solvent polarizability in the inner-sphere
region of the photon absorbing species changes with photon energy on account
of dispersion. The solvation free energy is computed for a varying
polarizability of the solvent in the inner-sphere region and a fixed nuclear
configuration of the solvent.-<the-f-ollowing interaction energies are
r considered: charge-induced dipole, dipole-induced dipole, induced
dipole-induced dipole, formation of induced dipoles, solute-solvent London
dispersion, solvent-solvent London dispersion, solute-solvent and
solvent-solvent Born repulsion. The change of solvation free energy in
aqueous solution is computed in the 7 to 1] eV range from data on the
refractive indPx of water obtained by reflectance spectroscopy. The theory
accounts quantitatively for the effect of dispersion on photoelectron emission
by aqueous solutions of anions, cations and molecules.
I. INTRODUCTION
Photoionization of ions and molecules in aqueous solutions occurs at
photon energies (UV and vacuum LIV) at which the optical dielectric constant
Cop of the solvent differs from the limiting value in the visible ranoe
0
C OP (. 1.777 at 75"C) on account of dielectric dispersion. This change .-
from o to o affects the water molecules in the inner-sphere
solvation shell of the species being photoionized. The free enerUof
hydration of the ion or molecule absorbinq a rhoton is chanqer as a result of

2
dispersion, as was recently pointed out,1 and the free energy of
photoionization varies accordingly. This change of free energy was derived in
Pef. 1 by application of the Marcus theory of nonequilibrium polarization of a
continuous medium2 to the i.nner-sphere solvation shell. The resulting
equation was shown to account reasonably well for the effect of the variation
of cop with photon energy on the photoelectron emission by aqueous solutions
of 17 different inorganic anions in the 7 to 10 eV range.
The Marcus theory2 is formulated in terms of the macroscopic concept of
polarization, and its application to the inner-sphere solvation shell is more
tentative than the usual justified application to outer-sphere reorganization.
It seemed advisable therefore to develop a theory based on a discrete number ot
water molecules in the inner-sphere region. This is dcne in the present paper
on the basis of ideas developed in the treatment of ionic hydration. 3- This
new approach is also more detailed than the one in Ref. 1 as it includes
consideration of London dispersion energies and the interpretation of the
effect of dielectric dispersion on the photoionization of electrically neutral
mclecules. The new theory agrees very well with experiment.
II. FREE ENERGY OF OPTICAL ELFCTRON TRANSFER WITH VARYING SOLVENT
POLARIZABILITY
A. Free energy of optical electron transfer as a function of solvent
polarizability
The treatment is divided into two parts. Firstly, it will be shown that
the free energy characterizing the optical electron transfer is related
directly to the free energy of solvation of the species being photoionized..
Secondly, this solvation free energy will be computed for a varying
polarizability of the solvent and a fixed nuclear configuration of the
solvent. The araument is developed for photoelectron emission by solutions but
is of general validity for optical electron transfer.

3
Consider the photoelectron emission into the vapor phase by an aqueous
solution of ions or molecules denoted by C. This process is characterized by a.
free energy of emission aGm which will be related to the solvation free
energy of the species C. The chance of free energy between the initial and
final states of the emission process is obtained from the following sequence
where the symbols (aq) and (g) denote the liquid and gas phase, respectively:
C(aq) - C(g); C(g) = C+(g) + e-(g); C+(g) C+(aq). The free energy of
emission aGm is,
AGrp - I + aGs(C*) - aG S(C) + + eix (1)
where I is the ionization potential of C(g); aG5(C) and aGs(C) are free
energies of solvation; R (> 0) is the roorganizatinn free enPrny; e is the
electronic charge and x the surface potential of the solution.
Dielectric dispersion of the solvent affects the solvation free energy
AGs(C ) of the photon absorbing species C(aq). The following model is adopted:
The polarizability of the solvent molecules in the inner-sphere solvation
shell of the solvated solute C(aq) absorbing a photon of energy E has the value
0w corresponding to the energy F. Conversely, the polarizability of solvent
molecules in the outer-sphere solvation region of the solute is not affected by
absorption of a photon by the solute. This polarizability retains the value
a correspondina to the limiting value of the dielectric constantW OP
of the solvent in the visible range. The polarizability of the solvent
molecules in both inner- and outer-sphere solvation regions of the species
0produced by photoionization of C(aq) has its usual value o°. Hence, the
free eneray of solvaticn 6 (C) and the total free energy R for inner- arda
outer-sphere reorganization are not affected by dispersion. This model is
reasonable since electron transfer also involves electronic reorganization of
the solvent and these two processes cannot be separated sequentially.

The change of &Gm with the polarizability of the solvent therefore can be
calculated from Eq. (1) by retaining in the expression for a~s(C) only the
terms depending on this polarizability. Thus,
AG,- A - U(ep.) - U(ppa) - U(ppa) - UIN D - UL(C'w) - UL(w'w) - UREP' (2)
where A represents the sum of the terms of EQ. (1) except -AGs(C), the
contributions to aGs(C) independent of the solvent polarizability and the
free energy for Born charging of the outer-sphere solvation region. The U's
in Eq. (2) are the energies for the following interactions and processes3 '4:
U(ep) charge-induced dipole, U(pp,) dipole-induced dipole, U(pape)
induced dipole-induced dipole, UIN formation of induced dipoles, UL(C,w)
solute-solvent London dispersion, UL(WW) solvent-solvent London dispersion,
UPEP solute-solvent and solvent-solvent Born repulsion. The quadrupole-induced
dipole interaction energy is not included in Eq. (2) since it is negligible (ca.
0.01 eV).
Explicit forms of the eneraies in Eq. (2) are as follows3'4:
2U(ep) - - Nzep /r 2, (3)
U(pp) = 2bpp/ro (4)
U(pP) = bp/ro, (5)
U I FD "Np2aw" 6r6
L'L(Cw) - - (3I?)[IIw/(I + 1 )]al /rot (7)U ~_ ?/r6 ()
Ut(w'w) " - 0iwa/ oe)
UpEP - B - (llx){2U(ep.) + 3[U(ppa) + t'(ppo)].
+ 6[UL(Cw) + UL(ww)]) (9)
Notations are: N the number of water molecules in the inner-sphere hydration
shell; z the absolute value of the ionic valence of species C(aq); p the dipole
moment of the solvent; p the induced dipole moment; and ro the sum of the
L0

crystallographic radii rc of C(aq) and rw (m 1.3F ) of the water molecule on
the assumption that the center of the induced dipole is at the distance r + r
from the charge; I and Iw the ionization energies of C(g) and the solvent,
respectively, and a and aw the corresponding polarizabilities; b a structure
factor equal to 2.296 for tetrahedral coordination of water molecules in the
inner-sphere shell and b - 7.114 for octahedral coordination; c the product of
the numerical constant 3/4 (from Eq. (7) for I - Iw) and a structure
parameter, namely c - 1.722 and c - 5.336, respectively, for tetrahedral or
octahedral coordination of water molecules in the inner-sphere shell (values
of b and c in Ref. 3 and calculations in Ref. 4).
The Born repulsion energy U REP of Eq. (9) is obtaineo-, by minimizing
with respect to ro the sum of all the interaction energies involving the
ionic charge, dipoles, induced dipoles, London dispersion. The term B in Eq.
(9) represents the contribution independent of the solvent polarizability.
The exponent x is such that UPEP is proportional to roX. The exponent
x varies with the nature of the species involved over a range 7 fror 5 for Pe
to 12 for Xe, Au+ . Values of x from. F to 10 applied to the cations studied
in Ref. 3 and 4.
The induced dipole pa is obtained3'4 by minimizing with respect to
p0 the sum of the energies of Eqs. (3) to (6). Thus,
Pt Qw(tzero - 2bp)Iftr3 + 2bawl. (I)
The second term in the denominator is rather small (10 to 20 percent) in
comparison with the first term, and pa is nearly proportional to ow.
The change of the free energy of emission a m with the solvent
polarizability can now be calculated from Eqs. (2) to (10). Results are
displayed in Fig. 1 in which,
AG. aGj(aw) - AGm(O), (11)
. . . i
6I
is the difference between the free energies of emission for the polarizability
and the limiting value (= 1.444 x 10- 2 6 cm3). The quantity. w ndtelitn aua w
aG varies almost linearly with aw in Fig. 1, especially for z 1 1. This
is the case because aGm of Eq. (2) can be written as
aGm = Ko +K1 0 K2 aa w + w (12)wK3awif one takes pa proportional to aw, as is nearly the case (discussion of
Eq. (10)). The K's in Eq. (12) are independent of a and aw, and the term
K law is dominant for z 4 0. Figure 1 shOis that the effect of dispersion
of the solvent on AGm is significant for emission by aqueous solutions of
ions and is far from negligible for solutions of molecules.
The calculation leading to Fig. I (x 9) was repeated for the exponent x
of Eq. (9) equal to 6 and 12. For instance, one calculates for aw - 2.5 x
10- 24 cm3: aaGm = 0.064 and 0.116 eV for z a 0 and x = 6 and 12,
respectively; aAGm 0.138 and 0.271 eV for z = I and x = 6 and 12,
respectively. The quantity AAG varies significantly with x because of the
form of Eq. (9) for the Born repulsion energy U
B. Free energy of optical electron transfer as a function of photon energy
The relationship between polarizability and optical dielectric constart is
needed for the analysis of experimental results on emission in Sec. IV. The
polarizability aw of liquid water is related to its refractive index at thew8
photon energy E by the Lorenz-Lorentz equation,
(n2 - 1)2(np + 2) - (4,13)Nwaw, (13)
where the number N of water molecules per unit volume is given by f W =
JA/M (e the density of water, t'A Avogadro's number and M the molecular
weight of water). It should be stressed that Eq. (13) allows the calculation
of aw from n? without correction for the difference between the actual
internal field and the Lorentz field. The correction for this difference
L~
7
appears in the relationship between the polarization and the field as shown in
the Appendix. Equation (13) is valid for transparent and absorbing media, but-
the relationshp between n and the optical dielectric constant cop is not the
same: c n2 for transparent media; cI . n- k2 and £2 - 2nk
for absorbing media (k absorption coefficient; c, and c2 real and
imaginary parts of cop, respectively).
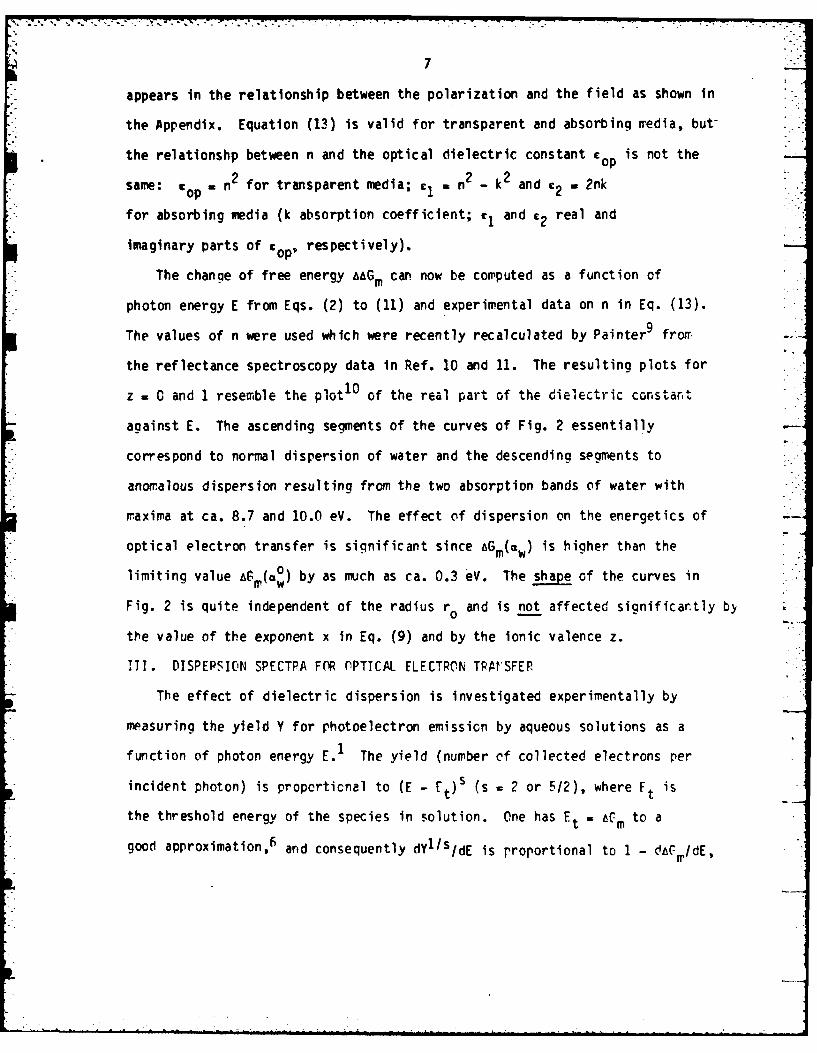
The change of free energy aGm can now be computed as a function of
photon energy E from Eqs. (2) to (11) and experimental data on n in Eq. (13).
The values of n were used which were recently recalculated by Painter9 from
the reflectance spectroscopy data in Ref. 10 and 11. The resulting plots for
z - 0 and 1 resemble the plot 10 of the real part of the dielectric constant
against E. The ascending segments of the curves of Fig. 2 essentially -
correspond to normal dispersion of water and the descending segments to
anomalous dispersion resulting from the two absorption bands of water with
maxima at ca. 8.7 and 10.0 eV. The effect of dispersion on the energetics of
optical electron transfer is significant since aGm(w is higher than the
limiting value AG(Cw) by as much as ca. 0.3 eV. The shape of the curves in
Fig. 2 is quite independent of the radius ro and is not affected significartly by
the value of the exponent x in Eq. (9) and by the ionic valence z.
III. DISPEP.ION SPECTPA FOR OPTICAL ELECTRON TRPA'SFER
The effect of dielectric dispersion is investigated experimentally by
measuring the yield Y for photoelectron emissicn by aqueous solutions as a
function of photon energy E.I The yield (number of collected electrons per
incident photon) is proporticnal to (E - rt)s (s = 2 or 512), where Ft is
the threshold energy of the species in solution. One has Et = tCm to a
good approximation,6 and consequently dY11l/dE is proportional to 1 - c /dE,

8
that is, to I - dAAGm/dE, where daGmldE varies with E because of dielectric
dispersion. A dispersion spectrum is obtained1 by plotting dYllM/dE aaainst E.
In the absence of dielectric dispersion, dispersion spectra would have the
shape of a step function to a first approximation: Y = 0 and dY11S/dE = 0
for E < Et; dY11/sdE is constant (1 C) for E > Et. Such a simple
dispersion spectrum can be expected in the ranae of photon energies in which
the change of free energy aaGm of Eq. (11) does not vary much with photon
energy, namely for F > 10 eV (Fig. 2). The dispersion spectrum of water (Sec.
IVC) is a good example of such a simple spectrum without major distortion from
dispersion. Actually, the emission law is more involved than the simple
proportionality of Y to (F - Et), in the vicinity of the threshcld energy,
and there is a progressive rise of dY112/dE with E over a few tenths of
electronvolt beyond the threshold energy. This increase is not related to
dispersion, and dispersion spectra therefore are examined in aeneral at phcton
enegies higher than the threshold energy by a few tenths of electronvolt.
Since dY11S/dE is proportional to 1 - daGmldE, that is, to I - dtAG loE,
the quantity -daaG dE was calculated as a function of the photon energy E
for z = 0 and 1 (Fig. 3). Differentiation was performed by means of
Savitsky-Golay convolutes as discussed in Pef. 1. The variations of the
polarizability a of the solute with photon energy were not considered. The
corresponding term (Eq. (7)) is small and the shape of the theoretical curve is
hardly affected by variation of a. No correction of the curves of Fig. 3 was
necessary for attenuation of the photon flux resulting from absorption in the
layer of liquid from which photoelectrons are emitted. Such a correction is
negligible for the absorption coefficient of liquid w.'ater 9- 11 (E < 11 eV)
within the thermalization length 13 of low-energy ouasifree electrons (2C to
4o A).
A6i

IV. COMPARISON OF THEORY AND EXPERIMENTAL DISPERSION SPECTRA
A. Anions
Theory and experiment will be compared for the dispersion spectra of anions
reported in Ref. 1 and for new spectra of different species. This comparison
is made in Fig. 4 (curve A) for azide ion (Etz 7.4 eV) which has a
dispersion spectrum typical of inorganic anions. The curves A and C in Fig. 4
have the same general shape except that the maxirum at 8.62 eV and minimum at
9.08 eV in the experimental spectrum A are much more pronounced than in the
theoretical spectrum C. However, reflectance spectral analysis is particularly
difficult in these regions because of the rapid variations of reflectance with
photon energy and the resulting sensitivity of the relative peak heights to the
smoothing and interpolation procedures. The photon energies at the extrema of
the theoretical curve of Fig. 3 for z - 1 nevertheless agree very well with the
corresponding average experimental photon energies for the 17 inorganic anions
studied in Pef. I (Table I) with a mean deviation of only 0.06 eV. This is
essentially the mean accuracy (0.04 eV) with which the extrema were located for
all anions.
Agreement with theory is also achieved for ferrocyanide ion (Et = F.2 eV
and 6.8 eV) which yields a dispersion spectrum (Fig. 4, curve B) similar to
those of other inorganic anions. The ion is ouite bulky (rc z 4.5 A.) arid the
number N of water molecules in the first solvation shell certainly exceed the
value N . 6 assumed in the construction of Fig. 3. Moreover, z = 4 (or 3
depending on the ionic equilibria in solution) and consequently the dispersion
effect should be enhanced in comparison to the case of K = and z = 1. This
enhancement, however, is compensated by the higher radius rc z 4.5 A than the
value rc,0 2.0 A prevailing approximately for usual inorganic anions. The
effect of dispersion for ferrocyanide ion therefore is similar in maanitude to
Ithe effect observed for uni- and divalent anions.

10
B. Cations
Results for cations are limited because emission by anions (Cl)
interferes above ca. 8.6 eV and most cations have threshold energies above 7
eV. The dispersion spectra for V2+ (Et = F.8 eV) and Cr2+ (Et a 7.0
eV) in Fig. 5 (curves A and B) are remarkably similar and exhibit the same
features as the theoretical curve. The magnitude of the dispersion effect for
these cations is comparable to the effect observed with anions (z = 1 or 2)
having crystallographic radii rc of the order of 2 A although the radii of
V2+ (0.88 A) and Cr2+ (0.84 A) are much shorter than for anions.
Complexation with chloride probably accounts for the magnitude of the
dispersion effct since the crystallographic radius ot species such as VL+
and CrCl + is comparable to that of anions.
C. Molecules
Water (Et . 10.040.02 eV14) has a dispersion spectrum (Fig. 6) which
very approximately resembles the step function expected in the absence of
dispersion for an emission yield proportional to (E - Et)" 2 (Sec. III).
This is the case because -daaGm/dE does not vary markedly with photon energy
in the 10.3 to 11 eV range (Fig. 3). Excellent plots of Y1/ 2 against photon
eneroy are indeed obtained14 for water as one expects for a free energy LG
nearly independent of E in the range covered by such plots. The spectrum of
Fig. 6 exhibits the usual maximum near 9.88 eV (Table I) below the extrapolated
threshold energy in a range of photon energies in which the emission yield is
very lew. The maxima at 10.33 and 10.69 eV and the minimum at 10.55 eV
predicted by theory (Fia. 3) are indeed observed (Table I).
The dispersion spectra of aqueous solutions of organic molecules are also
accounted for by the present theory. Results are shown in Fig. 7 for aniline
(Ft 7.3 eV, curve A), hydroquinone (Et 7.1 eV, curve P) and phenol
• -*...-..-. .. . . . . .

* -*- - -. . .. .n,. .-
"1.1
(Et r 7.6 eV, curve C). These substances exhibit (< 11 eV) two ionization
bands in the gas phase. The second threshold energies in solution are ca. 8.5,-
8.O and 8.3 eV on the assumption that the energy difference between the two
bands in the same for the gas phase 15'16 and solution.
The second transition band accounts for the difference between the
experimental (curves A, B, C) and theoretical (curve D) spectra in Fig. 7.
Thus, dY 12IdE for aniline (curve A) increases in the 8.5 to 8.95 eV range
because of the second transition. A maximum is reached at 8.95 eV because the
dispersion effect becomes dominant, and the expected minimum at 9.08 eV (Table
I) is observed. The same interpretation applies to hydroquinone (curve B).
1/2 V- rThe derivative dY /dE increases above the scCond thrchcld encrty ',, 0."
eV), but dispersion already shows up in the maxima near 8.17 and 8.66 eV (Table
I). The minimum near 9.08 eV expected from dispersion is well defined. Phenol
(curve C) displays the increase of dY1 2IdE beyond the second threshold
energy (Et V,8.3 eV) expected from the second transition, but dispersion soon
becomes dominant as shown by the maximum near 8.66 eV (Table I) and the rather
sharp drop to the usual maximum near 9.08 eV. The three spectra of Fig. 7, it
is concluded, do not present any unusual feature not accounted for by the
present theory once the complication arising from two consecutive transitions
is recognized.
CONCLUSION
The effect of dielectric dispersion of the solvent on the energetics of
optical electron transfer is understood quantitatively in its essential
aspects, and the theory thus developed agrees with experiment. The study of
the dispersion effect provides a unique way of investigating experimentally the
change of solvation free energy resulting from variation of the polarizability
of the solvent at constant nuclear configuration of the solvation shell.

12
ACKNOWLEDGMENT
This work was supported by the Office of Naval Research and the National
Science Foundation. Professor L. R. Painter (Physics, University of Tennessee)
kindly communicated unpublished results on the reflectance spectroscopy of
water.
APPENDIX
The molar polarization with correction for the difference between the
Lorentz and internal fields is8
[(n2 - 1)1(n 2 + 2)](M/1) - (4w13)NAaw, (14)
where the notations are the same as in Eq. (13) and the correction function is
G - 9copl(n2 + 2)[(?n2 + 1) - (w/a3)(2n 2 - 2)], (15)
the radius a being such that a3 = (314w)MINA6. Solving Eqs. (14) and (15)
for aw, one obtains
aw = (3/4w)(1/Nw)(n? - 1)(2n 2 + 1)/[9n2 + (n? - l)(2n2 - 2)]. (16)
The denominator is equal to (n2 + 2)(2n2 + 1), and the resulting value of
ow is that given by the Lorenz-Lorentz equation of Eq. (13).
REFFRENCES
IP. Delahay and A. Dziedzic, J. Chem. Phys., in press.
2P. A. Marcus, J. Chem. Phys. 24, 979 (1956).
3W. E. Morf and W. Simon, Helv. Chim. Acta 54, 794 (1971).
W. F. Morf, Betrag zur theoretischen Erfassung der Alkali- und
Erdalkaliionenselektivitit von Tr'goerantibiotika und Modellverbindunaen,
dissertation, ETH, Zurich, 1972, pp. ?3-50.
B. E. Conway, Ionic Hydration in Chemistry and Biophysics (Elsevier,
Amsterdam, 1981), pp. 312-341.

'., ".T" " . -. . ,. -2 .-.- .- - - -,--."' -o - , -- ." " ...-.-.-. : . ... .:. . - ; - :I; . . .. ..: - :- - . .
13
P. Delahay, Ace. Chem. Res. 15, 40 (1982).
7L. Paulinc, The Nature of the Chemical Pond, 3rd ed. (Cornell University
Press, Ithaca, 1960), p. 509.
8C. J. F. B'ttcher, Theory of Electric Polarisatien (Elsevier, Amsterdam,
1952), pp. 199-212, 238-253.9"L. P. Painter, private communication. -
10J. M. Heller, Jr., R. N. Ham, R. D. Birkhoff and L. R. Painter, J. Chem.
Phys. 60, 3483 (1974).11J. M. Heller, Jr., P. D. Eirkhoff and L. P. Painter, J. Chem. Phys. 67, --1
1858 (1977).
iThe plots of -daaGmlOE apainst E computed from the original n-values in
Ref. 10 for z - 0 and 1 were similar to the curves of Fig. 3 except that the
iraxima at 8.6F and 9.30 eV were hardly noticeable. Agreement with -
experimental dispersion spectra was less satisfactory than for Fig. 3.13H 'P. Neff, J. K. Sass, H. J. Lewerenz and H. Ibach, J. Phys. Chem. B, 1135
(1980).
PDelahay and K. von Purg, rhen. Phys. Lett. 83, 250 (1981).1 K. Kimura, S. Katsumata, Y. Achiba, T. Yanazaki and S. Iwata, Handbook of
Hel Photoelectron Spectra of Fundamental Organic M'olecules (Halsted Press, Nev,
York, 1981), pp. 190, 191.
ifT. Kobayashi and S. Nagakura, Bull. Chem. Soc. Japan 47, 2F63 (1974).

14_-
TABLE I. Photon energies at the extrema of dispersion spectra: theory vs.
experimental results
Extremum Theory8 Experimentb
(ev) (eV)
min 7.45 7.58 (0.02)
frax P.17 8.16 (0.0)
wrax 8. F;6 8.65 (0.03)
min 9.08 9.11 (0.03)
max 9.30 9.7 (..)
rain 9.40 9.63 (0.02)L
max 9.88 9.86 (0.04)
ira x 10.33 10.35J
min 10.55 10.50
max 10.F9 10.6F - 1
aPhoton energies from Fig. 3 (z 1 1). Maximum at 8.6f eV definitely indicatea
by the numerical values of -dazGm/dE calculated at 0.01 PV intervals.
bValues below 10 eV are average photon energies for 17 inorganic anions from
Pef. 1; standard deviation between parentheses. Values above 10 eV for water
(Sec. IVC and Fig. F).

15
List of Captions
Fig. 1. Variations of the change of free energy AAGm of Eq. (11) with the
polarizability w of the solvent for z -0 and 1. Data: rc =2 A, N° =6,
-2 3p . 1.834 debye, a = 3 x 10-24 ¢n I 4 eV, Iw = 12.6 eV, x .
Fig. 2. Variations of the change of free energy aGn of Eo. (11) with
photon energy for z a 0 and 1. Values of aAG for the values of
computed from Eq. (13) for the data on the refractive index n of water fror
Painter.9
Fig. 3. Variations of -dAaGIdE with photon energy E for z - 0 and 1. Same
data as for Fig. 1. Photon energies indicated at the extrema of the curve for
z - 1 are also valid for z 0.
Fig. 4. Dispersion spectra of 1 M sodium azide (A) and 0.05 F' potassium
ferrocyanide (B) in aqueous solution compared with the variations of
-da&G /dE with photon energy (C) of Fig. 3 for z a 1.
Fig. S. Dispersion spectra of 0.5 M VCI, (A) and 1 !v CrCl2 (B) in aqueOuS
solution compared with the variations of -daaG./dE with photon energy (C) of
Fia. 3 for z - 1.
Fig. 6. Dispersion spectru of water.
Fla. 7. Dispersion spectra of 0.01 M aniline (A), 0.05 F. hydroquinone (B) and
0.1 M phenol (C) in acueous solution compared with the variations of
-daaG /dE with photon energy (0) of Fig. 3 for z 0.
" "71

0.2
AAGm
(eV) z.
0.1
0I
1.5 2 2.5
POLARIZABILITY aw (l0'24 cm
FIG. 1
0
cc
z0
o co
00

Y-)
000XN
00
cc 0
ccct
a, U.z0
00
c0 c
N cN
3p/W)Vvpm

w-cc
I. . . . -. - i"
II
I "E:a
0.3- O 0 )(B)
- .0
0 (A)
0(C)..
0.3
PHOTON ENERGY (eV)
FIG. 4
-0.3

iw
I0.
0 C
-0.2
I L7 8PHOTON ENERGY (eV)
FIG. 5

CIO
Cul
0
10 10.5PHOTON ENERGY (eV)
FIG. 6

A
B~0 (A)
0 (C)
0.(Bsof
8 9*
PHOTO ENERY (eV
0. 1.GD

A L,'4L/13/83/0 1,3E /413-2
TECIN.CAL REPORT DISTRIBUTION LIST, GEN
No. No.Copies Cocies
0?'ice of Naval Research 2 Naval Ocean Systems Center 1
Attn- Code 113 Attn: Technical Library
800 N. Quincy Street San Diego, California 92152
Arlington, Virginia 22217
ONR Pasadena Detachment 1 Naval Weapons Cwter
Attn: Dr. R. J. Marcus Attn: Dr. A. B. Amster
1030 East Green Street Chemistry DivisionPasadena, California 91106 China Lake, California 93555
Commander, Naval Air Systems I Scientific Advisor 1Command Commandant of the Marine Corps
Attn: Code 3'0C (H. Rosenwasser) Code RD-i'ashingtcn, D.C. 20360 Washington, D.C. 20380
"aval Civil Engineering Laboratory Dean William Tolles
AtTn: Dr. R. W. Orisko Naval Postgraduate School
Port Hueneme, Califcrnia 93401 Monterey, California 93940
Superintendent 1 U.S. Army Research Officehemistry division, Code 6100 Attn: CRO-AA-IPldval Research Laboratory P.O. Box 12211'Washington, D.C. 20375 Research Triangle Park, NC 27709
"efen-e rechn'ca! tr ,tr.itn,, Centn:- M r. linricet Scha-erBuilding 5, Caeron Station DTNSRDC Code 2830Alexandria, Virginia 22314 Annapolis, Maryland 21402
07 'SROC Mr. John Boyle i
Attn: Dr. G. Bosmajian Materials Branch
clied Che~mistry Vivision Naval Shio Engineering Cente-
Annaoolis, Maryland 2!01 Ohiladelphi4.Pennsylvania 1911?
"aval Ocean Systems Center Mr. A. M. Anzalone
Attn: Dr. S. Yamamoto Administrative Librarian
Marine Sciences Division PLASTEC/ARRADCOMSan Diego, California 91232 Bldg 3401
Dover, New Jersey 07801

OL/413/83/01359/413-2
TECHNICAL REPORT DISTRIBUTION LIST, 359
Dr. Paul Delahay Or. E. YeagerDepartment of Chemistry Department of ChemistryNew York University Case Western Reserve UniversityNew York, New York 10003 Cleveland, Ohio 44106
Or. P. J. Hendra Or. C. E. MuellerDepartment of Chemistry The Electrochemistry BranchUniversity of Southampton Naval Surface Weapons CenterSouthampton S09 5NH White Oak LaboratoryUnited Kingdom Silver Spring, Maryland 20910
Or. T. Katan Or. Sam PeroneLockheed Missiles and Chemistry & Materials
Space Co., Inc. Science DepartmentP.O. Box 504 Lawrence Livermore National Lab.Sunnyvale, California 94088 Livermore, California 94550
Or. 0. N. Sennion Or. Royce W. MurrayDepartment of Chemical Engineering Department of Chemistry8righma Young University University of North CarolinaProvo, Utah 84602 Chapel Hill, North Carolina 27514
Or. R. A. Marcus Or. G. GoodmanOeoartment of Chemistry Johnson ControlsCalifornia Institute of Technology 5757 North Green Bay AvenueOasadena, California 91125 Milwaukee, Wisconsin 53201
Mr. Joseph McCartney Dr. 9. BrummerCode 7121 EIC IncorporatedNaval Ocean Systems Center 111 Chapel StreetSan Diego, California 92152 Newton, Massachusetts 02158
Or. J. J. Auborn Or. Adam Heller3el Laboratories Bell LaboratoriesMurray Hill, New Jersey 07974 Murray Hill, New Jersey 07974
Or. Josech Singer, Code 302-1 Electrochimica Corporation4IASA-Lewis Attn: Technical Library21000 Brookpark Road 2485 Charleston RoadCleveland, Ohio 44135 Mountain View, California 94040
Or. P. P. Schmidt LibraryOepartment of Chemistry Duracell, Inc.Oakland University Burlington., Massachusetts 01803Rochester, Michigan 48063
Or. H. Richtol Or. A. 8. EllisChemistry Deoartment Chemistry Departmentr ensselaer Polytechnic institute University of Wisconsin-roy, New 'fork 12181 Madison, Wisconsin 53706

r U! , .r .,k, . .. .. .. . .I .. . - .- - . -I--- -.- ,- . . . . . . . . . . . ., -T-. .
0L/413/83/01359/413-2
TECHNICAL REPORT DISTRIBUTION LIST, 359
Dr. M. Wrighton Or. M. M. NicholsonChemistry Department Electronics Research CenterMassachusetts Institute Rockwell International
of Technology 3370 Miraloma AvenueCambridge, Massachusetts 02139 Anaheim, California
Or. 8. Stanley Pons Or. Michael J. WeaverDepartment of Chemistry Department of ChemistryUniversity of Utah Purdue UniversitySalt Lake City, Utah 84112 West Lafayette, Indiana 47907
Donald E. Mains Or. R. David RauhNaval Weapons Support Center EIC CorporationElectrochemical Power Sources Division III Chapel StreetCrane, Indiana 47522 Newton, Massachusetts 02158
"S. Ruby Dr. Aaron WoldDOE (STOR) Department of ChemistryM.S. 68025 Forrestal Bldg. Brown UniversityWashington, D.C. 20595 Providence, Rhode Island 02192
Or. A. J. Bard Or. Martin FlelschmannDepartment of Chemistry Department of ChemistryUniversity of Texas University of SouthamptonAustin, Texas 78712 Southampton S09 5NH ENGLAND
Dr. Janet Osteryoung Or. R. A. OsteryoungOepartment of Chemistry Department of ChemistryState University of New York State University of New YorkBuffalo, New York 14214 Buffalo, New York 14214
Or. Oonald W. Ernst Or. Denton ElliottNaval Surface Weapons Center Air Force Office of ScientificCode R-33 ResearchWhite Oak Laboratory Bolling AFESilver Spring, Maryland 20910 Washington, D.C. 20332
Mr. James R. Moden Or. R. NowakNaval Undermater Systems Center Naval Research LaboratoryCode 3632 Code 6130Newport, Rhode Island 02840 Washington, D.C. 20375
Or. Bernard Soielvogel Dr. 0. F. ShriverU.S. Army Research Office Oepartment of ChemistryP.0. Box 142211 Northwestern UniversityResearc triangle Park, NC 27709 Evanston, Illinois 60201
Or. Willfam Ayers Or. Aaron FletcherCD tnc. Naval Weapons CenterP.O. Box 5357 Code 3852North 3ranch, New Jersey 08876 China Lake, California 93555-

01/413/83/01359/413-2
TECHNICAL REPORT DISTRIBUTION LIST, 359
Or. David Aikens Or. 0. H. WhitmoreChemistry Department Department of Materials ScienceRensselaer Polytechnic Institute Northwestern UniversityTroy, New York 12181 Evanston, Illinois 60201
Or. A. P. S. Lever Or. Alan 8ewickChemistry Department Department of ChemistryYork University The University of SouthamptonOownsview, Ontario M3J1P3 Southampton, S09 5NH ENGLAND
Or. Stanislaw Szpak Dr. E. AndersonNaval Ocean Systems Center NAVSEA-56Z33 NC #4Code 6343, Bayside 2541 Jefferson Davis HighwaySan Diego, California 95152 Arlington, Virginia 20362Dr. Gregory Oarringto Dr. Bruce Dunn
Deoartment of Materials Science Department of Engineering &and Engineering Applied Science
University of Pennsylvania University of CaliforniaPhiladelphia, Pennsylvania 19104 Los Angeles, Cal.ifornia 90024
4. L. Robertson Dr. Elton CairnsManager, Electroctiemical Energy & Environment Division
and Power Sources Division Lawrence Berkeley LaboratoryNaval Weapons Suoport Center University of CaliforniaCrane, Indiana 475Z2 Berkeley, California 94720
Or. T. Marks Or. 0. Ciprisleoartnent of Chemistry Allied CorporationNorthwestern University P.O. Box 3000Rr Evanston, Illinois 60201 Morristown, New Jersey 07960
Or. Micha Tomkiewicz Or. M. PhilpottDeoartment of Physics IBM CorporationBrooklyn College 5600 Cottle Road3rooklyn, New York 11210 San Jose, California 95193
Or. Lesser glum Or. Donald SandstromOeoartment of Physics Department of PhysicsUniversity of Puerto Rico Washington State UniversityVio Piedras, Puerto Rico 00931 Pullman, Washington 99164
Or. Joseph Gordon, II Or. Carl KannewurfI3M Corporation Department of Electrical EngineeringK33/281 and Camputer Science-600 Cottle Road Northwestern UniversitySan Jose, California 95193 Evanston, Illinois 60201

Ii
01/413/83/01359/413-2
TECHNICAL REPORT DISTRIBUTION LIST, 359
Or. Robert Somoano Dr. Edward FletcherJet Propulsion Laboratory Department of Mechanical EngineeringCalifornia Institute of Technology University of MinnesotaPasadena, California 91103 Minneapolis, Minnesota 55455
Dr. Johann A. Joebstl Dr. John FontanellaUSA Mobility Equipment R&D Command Departmenht of Physics
OROME-EC U.S. Naval Academy -J
Fort Belvoir, Virginia 22060 Annapolis, Maryland 21402 9.
Or. Judith H. Ambrus Or. Martha GreenblattNASA Headquarters Department of ChemistryM.S. RTS-6 Rutgers UniversityWashington, D.C. 20546 New Brunswick, New Jersey 08903
L
Or. Albert R. Landgrebe Dr. John WassonU.S. Department of Energy Syntheco, Inc.M.S. 68025 Forrestal Building Rte 6 - Industrial Pike RoadWashington, D.C. 20595 Gastonia, North Carolina 28052
Or. J. J. Brophy Or. Walter RothOepartment of Physics Department of PhysicsUniversity of Utah State University of New YorkSalt Lake City, Utah 84112 Albany, New York 12222
Dr. Charles Martin Or. Anthony SammellsDepartment of Chemistry Eltron Research Inc.Texas A&M University 710 E. Ogden Avenue #108College Station, Texas 77843 Naperville, Illinois 60540
Or. H. Tachikawa Or. W. M. RisenOeoartment of Chemistry Department of ChemistryJackson State University Brown UniversityJackson, Mississippi 39217 Providence, Rhode Island 02192
Or. Theodore 3eck Dr. C. A. AngellElectrochemical Technology Corp. Oeparttment of Chemistry3935 Leary Way N.W. Purdue UniversitySeattle, Washington 98107 West Lafayette, Indiana 47907
Dr. Farrell Lytle Or. Thomas Davis3ceing Engineering and Polymer Science and Standards
Construction Engineers DivisionP.O. Box 3707 National Bureau of StandardsSeattle, Washington 98124 Washington, D.C. 20234
Dr. Robert GotschollU.S. Oeoartment of SnergyMS G-226Washington, D.C. 20545

-, t
'AAA