low electrical percolation thresholds and nonlinear
TRANSCRIPT

HAL Id: hal-01674146https://hal-upec-upem.archives-ouvertes.fr/hal-01674146
Submitted on 1 Jan 2018
HAL is a multi-disciplinary open accessarchive for the deposit and dissemination of sci-entific research documents, whether they are pub-lished or not. The documents may come fromteaching and research institutions in France orabroad, or from public or private research centers.
L’archive ouverte pluridisciplinaire HAL, estdestinée au dépôt et à la diffusion de documentsscientifiques de niveau recherche, publiés ou non,émanant des établissements d’enseignement et derecherche français ou étrangers, des laboratoirespublics ou privés.
Low electrical percolation thresholds and nonlineareffects in graphene-reinforced nanocomposites: a
numerical analysisXiaoxin Lu, Julien Yvonnet, Fabrice Detrez, Jinbo Bai
To cite this version:Xiaoxin Lu, Julien Yvonnet, Fabrice Detrez, Jinbo Bai. Low electrical percolation thresholds andnonlinear effects in graphene-reinforced nanocomposites: a numerical analysis. Journal of CompositeMaterials, SAGE Publications, In press, accepted, 10.1177/0021998317753888. hal-01674146

Low electrical percolation thresholds and nonlineareffects in graphene-reinforced nanocomposites: a
numerical analysis
Xiaoxin Lua,b, Julien Yvonnetb,∗, Fabrice Detrezb, Jinbo Baia,∗∗
aCentrale Supélec, Laboratoire de Mécanique des Sols, Structures et Matériaux,UMR 8579 CNRS,
Grande Voie des Vignes, 92290 Châtenay Malabry, FrancebUniversité Paris-Est, Laboratoire de Modélisation et Simulation Multi Echelle,
UMR 8208 CNRS,5 Boulevard Descartes, 77454 Marne-la-Vallée Cedex 2, France
AbstractA numerical model of graphene-reinforced nanocomposites taking into
account the electric tunneling effect is employed to analyze the influence ofmicrostructural parameters on the effective electric conductivity and the per-colation thresholds of the composite. The generation procedure for the ran-dom microstructures of graphene reinforced nanocomposites is described. Ef-fects of the barrier height, of graphene aspect ratio and alignment of graphenesheets have been quantitatively evaluated. The results show that both highergraphene aspect ratio and lower barrier height can lead to smaller percola-tion threshold, and the alignment of graphene sheets results in anisotropicelectrical behavior without affecting the percolation threshold. The numer-ical model also shows the importance of the tunneling effect to reproducethe nonlinear electric behavior and the low percolation thresholds reportedin the literature. Finally, results are compared with available experimentaldata.Keywords:Nanocomposites, Graphene, Electric conduction, Tunnel effect, Percolationthreshold
∗Corresponding author Email: [email protected]∗∗Corresponding author Email: [email protected]
Preprint submitted to Journal of Composite Materials December 24, 2017

1. Introduction
The introduction of graphene-based nanomaterials has prompted the de-velopment of flexible nanocomposites for emerging applications in variousfields, including energy conversion [1], energy storage [2], electronic mate-rials [3], sensors [4], and chemical screening applications [5]. Graphene isamong the materials with the highest in-plane electric conductivity [6], andits incorporation in a polymer matrix to increase the electric conductivityof almost insulating polymers is of high importance for materials-by-design.Numerous experimental and theoretical studies have reported that dispersingtwo-dimensional fillers such as graphene sheets in polymer matrix can sig-nificantly improve the electric properties of the resulting composites [7–12].They exhibit an increase of several orders of magnitude of the electric con-ductivity even at extremely low volume fractions of graphene sheets [13–17],denoting the percolation phenomenon. This phenomenon can be explainedby the formation of percolating paths between graphene sheets through thematrix. The percolation threshold of a random assembly of widthless discshas been evaluated in last century for the permeability problem [18], domi-nated by the radius and the number of the discs. However, the introductionof nano fillers brings more complexity to the study of connectivity perco-lation of the composite. Mathew et al. [19] have presented Monte Carlosimulation study on the percolation in a random array of 3D impenetrablehard platelets, revealing the influence of the filler’s aspect ratio.
Experimental works have evidenced that electrical properties of grapheneor nanotube-reinforced nanocomposites are significantly dependent on themicrostructure parameters such as the size [20], the orientation of fillers [17,21], as well as the inherent characteristics of polymer matrix [22, 23].
Tunneling electric conductivity is a quantum phenomenon which allowselectric conductivity across small isolating barriers like thin polymer inter-phases between two highly conducting fillers. Especially when the character-istic distances between graphene sheets reduces to the order of nanometers,it has been shown that electric tunneling effect plays an important role inexplaining very low percolation thresholds as well as nonlinear electric con-duction [24, 25] in such materials. In the works of Otten et al. [26] andAmbrosetti et al. [27], the tunneling effect has been taken into accountto analyze the percolation threshold of nanocomposites with polydispersenanofillers, where the former focuses on carbon nanotube and the latter ex-tends to various particle shapes.
2

For design purpose, numerical models of conduction at the scale of aRepresentative Volume Element (RVE) containing a significant number ofgraphene sheets is required to fully understand the conditions for perco-lation and determining optimal configurations and microstructural param-eters to increase the performances of these materials. Complete ab initioor atomistic simulations including electric conductivity in large systems likepolymers-graphene reinforced composites are nowadays not feasible, and clas-sical homogenization methods or Monte Carlo techniques [28–34] are unableto explain the nonlinear effects and low percolation thresholds in graphene-polymer nanocomposites. Simulations of larger systems require continuumdescription of fields and related numerical methods. Recently, some con-tinuum models have been developed to determine the effective AC and DCelectrical properties of graphene nanocomposites taking into account theirmorphological and physical features, which take the effective-medium the-ory or self-consistent effective medium theory as backbone [31, 35, 36]. Amulti-scale multi-physics finite element method has also been proposed topredict the electrical response of the graphene/polymer composite under DCloading, in which the representative volume element (RVE) is filled with ran-domly dispersed nano-platelet conductive inclusions by Monte Carlo modeland with the use of a unit cell [37].
In this work, we employ the continuum numerical tunneling model frame-work introduced in [38] to quantitatively analyze the effects of barrier heightand configuration of graphene sheets versus electric percolation thresholds ingraphene-polymer nanocomposites. This methodology provides the possibil-ity to analyze the influence of these various factors on the electrical conductiv-ity as well as the percolation threshold separately, and can be easily extendedto investigate the effect of different graphene distributions. First, the con-tinuum model is presented taking into account the tunneling effect, in whichthe graphene is modeled as a highly conductive surface in order to avoid themeshing restrictions. Then, the geometrical modeling of graphene/polymernanocomposites is provided. The generation of the random microstructure isimplemented by Markov chains method [39, 40]. According to the numericalanalysis, the nonlinear electric behavior of the graphene reinforced nanocom-posite is characterized, and the effective conductivities of nanocompositeswith various barrier height between graphene and polymer as well as differ-ent graphene aspect ratio are studied. In addition, the effect of alignmentof graphene sheets with respect to the effective conductivity is investigated.Finally, we provide comparisons between the results provided by the pro-
3

posed model and some available experimental data. In the present work,the influence of the defects (e.g. nanopres) in the composite is neglected, andthe aggregation of graphene fillers is not taken into account.
2. Continuum model
In this model, the graphene sheets are explicitly described at the scaleof a Representative Volume Element (RVE) composed of a polymer matrixand randomly distributed and oriented graphene sheets, modeled as highlyconducting imperfect interfaces [41]. Another originality of the mentionedwork is the modeling of the electric tunneling effect between graphene sheets.
In this model, the total electric power of the system, W , is defined by
2W =∫
Ωωb(x)dΩ +
∫Γ
ωs(x)dΓ, (1)
where Ω ⊂ R3 is the domain defining the RVE, Γ denotes collectively thesurfaces associated with graphene and the density functions ωb and ωs areexpressed by
ωb(x) = ji(x)Ei(x), ωs(x) = jsi (x)Es
i (x), (2)
where Ei(x) = −∇iϕ(x) = −ϕ,i(x) is the electric field, j(x) is the currentdensity vector and ϕ(x) is the electric potential, where:
ji =[k0
p
]ij
Ej (3)
with k0p is the electric conductivity tensor of the polymer matrix when ne-
glecting tunneling effect. In the above, the superscript s denotes surfacequantities, e.g., js is the surface current density. The surface electric fieldis defined with respect to its bulk counterpart as: Es
i = PijEj = −∇si ϕ =
−Pij∇iϕ with Pij(x) = δij −ni(x)nj(x) is a projector operator characterizingthe projection of a vector along the tangent plane to Γ at a point x ∈ Γ andn is the unit normal vector to Γ. The local constitutive relationships relatingj and js with E are defined in the graphene sheets by
jsi (x) = ks
ijEsj , (4)
4

where ks denotes the surfacic electric conductivity of graphene and is depen-dent on the thickness t through:
ksij = tSij, Sij = [kg]ij − [kg]iknk[kg]jknk
[kg]klnknl
. (5)
In (5), kg denotes the second-order electric conductivity tensor of the bulkgraphite and n the normal vector to the graphene sheet (see [38, 41] for moredetails).
ji =
[k0
p
]ij
Ej if d(x) ≥ dcut,G(E, d) Ei
|E| if d(x) < dcut,(6)
where dcut is a cut-off distance above which the tunneling effect can be ne-glected and G is defined by [42]
G (E, d) = 2.2e3 |E|2
8πhΦ0exp(− 8π
2.96he |E|(2m)
12 Φ
320 )
+[3 · (2mΦ0)12
2](e/h)2 |E| exp[−(4πd
h)(2mΦ0)
12 ] (7)
where Φ0 is the energy barrier height that the electrons cross and h, e and mdenote Plank’s constant, the charge of an electron and a material parameter.
Minimizing (1) with respect to the displacement field, and using Eqs.(3)-(6), we obtain the weak form which can be solved by the finite elementmethod (see more details in [38]):∫
Ωji(ϕ) · ∇(δϕ)dΩ −
∫Γ
Pij∇jϕksikPkl∇l(δϕ)dΓ = 0, (8)
where δϕ ∈ H1(Ω), δϕ = 0 over ∂Ω, and ϕ ∈ H1(Ω), ϕ satisfying the periodicboundary conditions over ∂Ω
ϕ(x) = −Eixi + ϕ(x) on ∂Ω (9)
and where ϕ(x) is a periodic function over Ω, such as⟨ϕ(x)
⟩= 0.
The effective electric conductivity tensor k is defined as:
kij(E) = ∂J i(E)∂Ej
, (10)
5

β( i )
α( i ) γ
( i)
z
x
y
n( i )
z
y
x
x’
y’
r( i )
r( i )
r( i )y
x
z
Figure 1: Scheme of the position and oriention of graphene sheet in the 3D space.
where J is the effective current density whose components are expressed by:
J i = 1V
(∫Ω
ji(x)dΩ +∫
Γjs
i (x)dΓ)
, (11)
and E is the effective electric field given by:
Ei = 1V
∫Ω
Ei(x)dΩ. (12)
3. Geometrical modeling of graphene/polymer nanocomposites
In the following, the in-plane dimensions of graphene sheets are 15 × 15nm2 and the RVE side length of the cubic domain is 80 nm. We considermulti-layer graphene platelets, also called here sheets, which have a finitethickness t. The related aspect ratio η = L/t denotes the ratio between thelength of the platelet and its thickness. It is worth noting that changing theaspect ratio does not change the discretization here, as t only changes in Eq.(5). The position and orientation of ith graphene sheet in RVE are definedby 6 degrees of freedom
r(i)
x , r(i)y , r(i)
z , α(i), β(i), γ(i)
where r(i)x , r(i)
y , r(i)z are the
coordinates of the center of graphene sheet, and α(i), β(i), γ(i) are the Euler
6

angles. Note that α(i), β(i) give the orientation of the unit normal of graphenesheet, n(i), and γ(i) gives the orientation of graphene sheet around the unitnormal n(i) (see Figure 1). In this study, the graphene sheets are modeledby square planes with side length L = 15 nm. This assumption is due to thehighly thin thickness of graphene and relies on the imperfect surface model.
The different microstructures are generated by a Markov-chain with hard-inclusion Metropolis algorithm (see [39, 40] for review in the case hard-spheres). First, an initial configuration of the system is chosen such thatgraphene sheet centers are located on a cubic lattice and have random ori-entation without overlapping. Then, one randomly chosen graphene sheet isattempted to move for each step of Metropolis algorithm. A new position forthe graphene sheet under consideration is chosen by six random parameters:(∆x, ∆y, ∆z) ∈ [−δx, δx]3, ∆α ∈ [−π, π], ∆β ∈ [−δβ, δβ] and ∆γ ∈ [−δγ, δγ].The parameter (∆x, ∆y, ∆z, ∆γ) and are generated with an uniform dis-tribution over their definition domains and the couple of increment angles(∆α, ∆β) are generate with an uniform distribution on the part of the unitsphere defined by δβ. The new position of graphene sheet is then defined by(x(i) +∆x, y(i) +∆y, z(i) +∆z, α(i) +∆α, β(i) +∆β, γ(i) +∆γ). The parametersδx, δβ and δγ are adjusted to give about 50% acceptance of the new position.Periodic boundary conditions are employed throughout the simulation.
Therefore, the acceptance step of this Metropolis algorithm reduces tochecking that this displacement does not cause overlap between graphenesheets. To control the overlapping, the graphene sheets are discretized bya compact centered square lattice of small fictitious spherical particles withradius δ. The non-overlapping condition is
r2ij ≥ δ2 ∀i, j , (13)
where rij is a distance between the fictitious spherical particles i and j.To generate a series of independent isotropic RVE samples as random
maps, the positions and orientations are saved during a Markov-chain sam-pling with regular interval to ensure the statistic independence of two RVEs.Note that the first RVE is saved when the orientation of the unit normal ofgraphene sheets is isotropic in an average sense. One example of obtainedrealization of isotropic graphene nanocomposite RVE is illustrated in Fig. 2., where 25 graphene sheets are distributed randomly in an RVE, and wherethe size of each graphene platelet is 15 × 15 × 0.3 nm3, and the side lengthof the platelets is 80 nm, leading to a volume fraction is 0.33 vol%. Finally
7
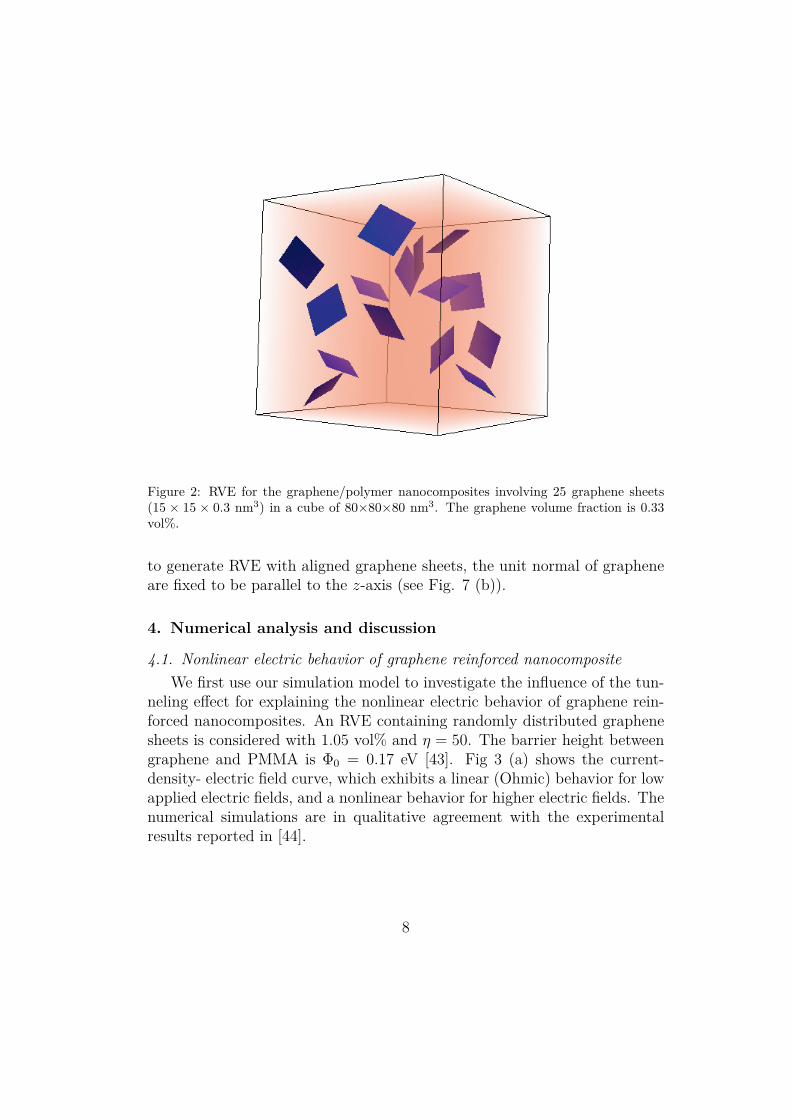
Figure 2: RVE for the graphene/polymer nanocomposites involving 25 graphene sheets(15 × 15 × 0.3 nm3) in a cube of 80×80×80 nm3. The graphene volume fraction is 0.33vol%.
to generate RVE with aligned graphene sheets, the unit normal of grapheneare fixed to be parallel to the z-axis (see Fig. 7 (b)).
4. Numerical analysis and discussion
4.1. Nonlinear electric behavior of graphene reinforced nanocompositeWe first use our simulation model to investigate the influence of the tun-
neling effect for explaining the nonlinear electric behavior of graphene rein-forced nanocomposites. An RVE containing randomly distributed graphenesheets is considered with 1.05 vol% and η = 50. The barrier height betweengraphene and PMMA is Φ0 = 0.17 eV [43]. Fig 3 (a) shows the current-density- electric field curve, which exhibits a linear (Ohmic) behavior for lowapplied electric fields, and a nonlinear behavior for higher electric fields. Thenumerical simulations are in qualitative agreement with the experimentalresults reported in [44].
8

0 0.002 0.004 0.006 0.008 0.01 0.012 0.0140
0.5
1
1.5
2
2.5
E(V/nm)
J(
/(
))A
cm2
Φ0=0.17 eV
γ=50
f=1.05 vol%
0 0 00. 2 0 00. 4 0 00. 6 0 00. 810
−5
10−3
10
10
−1
Figure 3: Current density-electric field curve of the nanocomposite with 1.05 vol%graphene, Φ0 = 0.17 eV, η = 50.
4.2. Effect of barrier height on the percolation thresholdIn the following, we study the effects of barrier height between graphene
and various polymers on the nonlinear response of the nanocomposite. In oursimulations, we have considered that the percolation threshold correspondsto a sharp variation of the effective conductivity above 10−8 S/m. In Fig.4, the effective conductivity component k11 is plotted as a function of thegraphene volume fraction for the values Φ0 = 0.17 eV, 0.3 eV, 1.0 eV andwithout tunneling effect. The aspect ratio is η = 50 and applied electricfield E = 1.25 × 10⁻³ V/nm. It should be noted that for small barrierheight (0.17 eV and 0.3 eV), the computation results of electric conductivitytaking into account the tunneling effect are much larger than the predictionswithout tunneling effect, while for Φ0 = 1.0 eV, the effective conductivitycharacteristics exhibit no obvious difference either with or without tunnelingeffect. The percolation thresholds corresponding to Φ0 = 0.17, 0.3, 1.0 eVare 0.79 vol%, 0.92 vol% and 1.58 vol% respectively. We can see from thesesimulations that the lower the barrier height is, the lower the percolationthreshold. Experimental results reporting percolation thresholds for differentpolymer matrices and graphene types can be found in [7, 45–47].
4.3. Effect of graphene aspect ratio on the percolation thresholdNext, we use our numerical model to estimate the percolation threshold
f ∗ of the nanocomposite as a function of the graphene volume fraction andaspect ratio for graphene sheets. In Fig. 5, the effective conductivity tensor
9

0.25 0.5 0.75 1 1.25 1.5 1.75 2 2.25 2.5−10
−8
−6
−4
−2
0
2
Graphene volume fraction (vol%)
Log
10(k
11)
(S/m
)
η= 50
Φ0=0.17 eV, φc= . %0 79 vol
=0.3 eV, φc= . %0 92 vol
=1.0 eV, φc= %1.58 vol
Without tunnel ,effect φc= %1.58 vol
Φ0
Φ0
Figure 4: Effective conductivity versus graphene sheets volume fraction for several barrierheights Φ0, E=1.25 × 10⁻³ V/nm, η = 50; ϕc denotes to the percolation threshold.
0.25 0.75 1.25 1.75 2.25 2.75 3.25 3.75 4.25 4.75−10
−9
−8
−7
−6
−5
−4
−3
−2
−1
0
Graphene volume fraction (vol%)
Log
10(k
11)
(S/m
)
η=100, φc= . %0 33vol
η=50, φc= . %0 79 vol
η=20, φc= . %1 65 vol
Φ0=0.17 eV
Figure 5: Effective conductivity k11 as a function of the graphene volume fraction forseveral graphene aspect ratios η, E=1.25 × 10⁻³ V/nm, Φ0 = 0.17 eV; ϕc denotes to thepercolation threshold.
10

component k11 is computed for different aspect ratios η = 20, 50 and 100as a function of volume fraction. The side length of the graphene is fixed,and the various aspect ratios are obtained by changing the thickness of thegraphene sheets. For each case, the values are averaged over 30 realizationsof random distributions of graphene sheets within the RVE. As the behaviorof the composite is nonlinear, the results of conductivity are presented for afixed electric field E = 1.25 × 10⁻³ V/nm. The barrier height is Φ0 = 0.17eV. According to our numerical simulations, the effective conductivity clearlydepends on the aspect ratio, a larger η provides lower percolation threshold.The obtained percolation thresholds for η = 20, 50, and 100 are 1.65 vol%,0.79 vol%, and 0.33 vol% respectively.
4.4. Effect of alignment of graphene sheetsNext, we evaluate the effect of alignment of graphene sheets on the effec-
tive conductivity of the composite. For this purpose, we consider on one handa microstructure with graphene sheets whose both positions and orientationsare randomly distributed, and on the other hand a microstructure wherepositions of graphene sheets are randomly distributed but the orientation isfixed. Each point corresponds to the mean value over 30 realizations. Resultsare presented in Fig. 6. To clearly evidence the anisotropy, we have plottedthe three components of the effective conductivity tensor. The parametersare E=1.25 × 10⁻³ V/nm, Φ0 = 0.17 eV and η = 50.
As expected, the numerical model clearly captures the anisotropic behav-ior of aligned graphene sheets (see Fig. 6 (b)). Another conclusion is thataligning the graphene sheets does significantly increase either the maximumeffective conductivity in the direction normal to the graphene sheets or thepercolation threshold, as compared to randomly oriented sheets. However,the increase in conductivity after the percolation threshold is sharper in thecase of aligned graphene sheets.
Finally, we depict in Fig. 7 the current density field in the polymermatrix when tunneling effect is taken into account for aligned and randomlyoriented graphene sheets, to show the percolation path of electric current inboth these configurations. The parameters are η = 50 and Φ0 = 0.17 eV,f = 1.05 vol%. The electrical field is applied on the X-direction.
11

0.1 0.3 0.5 0.7 0.9 1.1 1.3 1.5 1.7 1.9−10
−8
−6
−4
−2
0
Graphene volume fraction (vol%)
Log
10(E
ective c
onductivity)
(S/m
)ff
k11
k22
k33
(a)
0.1 0.3 0.5 0.7 0.9 1.1 1.3 1.5 1.7 1.9−10
−8
−6
−4
−2
0
Graphene volume fraction (vol%)
Lo
g1
0(E
ffe
ctive
co
nd
uctivity)
(S/m
)
k11
k22
k33
(b)
Figure 6: Effective conductivity tensor components as a function of the graphene volumefraction: (a) random positions and orientations of graphene; (b) random positions anddirection of graphene normal to Z-axis.
2e-5
5e-51e-42e-4
5e-41e-32e-3
5e-3
Current A/( )cm2
Z
Y X
(a)
5 0 5. e-
1 0 4. e-
1. e-5 3
1.0e-5
2 0 3. e-
Current (A / )cm2
Z
Y X
(b)
Figure 7: Current density in the polymer matrix of microstructure with graphene volumefraction f = 1.05 vol%: (a) random positions and orientations of graphene; (b) randompositions and direction of graphene normal to Z-axis.
12

5. Comparison between numerical and experimental results
In the following, the obtained numerical results are compared with avail-able experimental data reported by Stankovich [45] and Zhang [48] respec-tively. The electric conductivity of the polymer matrix is fixed at 10−10 S/min the simulation, and the various types of polymer are represented by differ-ent choices of barrier height. In these works, the percolation threshold andelectric conductivities of graphene reinforced nanocomposites were measuredas a function of graphene volume fraction.
Fig. 8 shows the experimental results of electric conductivity of polystyrene-graphene composites as a function of graphene volume fraction measured in[45], where the graphene was prepared by complete exfoliation of graphiteand the dispersion of individual graphene sheets at molecular-level. Thepercolation threshold is exhibited to be 0.1 vol%. The estimated electricconductivities of the composites containing two different aspect ratios ofgraphene platelets, 200 and 500, obtained from the numerical simulation inour study are also plotted in Fig. 8. Assuming the barrier height to be0.17 eV, we can see that the percolation threshold for composites containinggraphene sheets with η = 200 occurred at relatively higher graphene volumefraction, ϕc = 0.2 vol%, than that of the composites containing graphenewith η = 500, where ϕc = 0.08 vol%. In general, the graphene plateletsin the matrix have various aspect ratio due to the preparation method andtheir possible aggregation during the synthesis. The proposed numerical es-timations considering the aspect ratio range of 200 − 500 are in reasonableagreement with the experimental data for low graphene volume fraction.
Fig. 9 plots the electric conductivities of polyethylene terephthalate-graphene nanocomposites as a function of graphene volume fraction. A highaspect ratio of η = 146 is obtained for graphene sheets from laser granularityanalyzer. The experimental measured percolation threshold [48] is about 0.5vol%. Similarly, two different aspect ratios of graphene sheets, 50 and 150,were considered in the numerical modeling with the barrier height of 0.3 eV,leading to a range of percolation threshold from 0.25 vol% to 0.8 vol%. Theexperimentally measured electric conductivities roughly lie between the twonumerical curves for the two considered aspect ratios. It should be noted thatdue to the computational limitations, the contrast of conductivities betweengraphene and polymer matrix cannot be higher than 1016. Therefore, we haveto take the electric conductivity of polymer matrix as 10−10 S/m, which maybe one reason of discrepancy between experimental and numerical results for
13

0 0.5 1 1.5 2 2.510
−20
10−15
10−10
10−5
100
105
Graphene volume fraction (vol%)
Ele
ctr
ic c
onductivity (
S/m
)
Experimental results, φc= . %0 1 vol
η=200
η=500
Φ0=0.17 eV
, φc= . %0 2 vol
, φc= . %0 08 vol
Figure 8: Experimentally measured [45] and predicted electric conductivities ofpolystyrene-graphene composites with various aspect ratio of graphene sheets (η =200, 500); ϕc denotes to the percolation threshold.
low graphene volume fraction. There are some other reasons which may alsobring this discrepancy. Firstly, the dispersion state of graphene is hard tocontrol in the experimental preparation, and the aggregation of graphene inthe microstructure may lead to the heterogeneity of the macroscopic property.However, in our present work, the numerical simulation is based on randomlydistributed graphene sheets. Moreover, the numerical simulation ignores thedefects in the nanocomposite especially the ones on the interface betweengraphene and polymer. The simulation of electric conductivity at highgraphene volume fraction requires large computational complexity due to therefined meshes. For this reason, we did not explored further higher volumefractions, and as the present work focuses on the determination of percolationthresholds. Higher volume fractions could be investigated in future studies.In addition, in the composites the defects like pores are inevitable, but canbe optimized by modifying the preparation process. In this work, we did nottake the porosity into account because it is not the key influencing factorson the percolation threshold. In addition, we did not consider the non-uniform graphene distribution as the graphene aggregation in this work, butthe present framework, described in more details in [38], could be used withlarger RVE in future studies to investigate aggregates of graphene platelets.
14

0 0.5 1 1.5 2 2.5 310
−15
10−10
10−5
100
105
Graphene volume fraction (vol%)
Ele
ctr
ic c
onductivity (
S/m
)
Experimental results, φ =0.5 vol%c
η=50, φ =0.8 vol%c
η=150, φ =0.25 vol%c
Φ0=0.3 eV
Figure 9: Experimentally measured [48] and predicted electric conductivities of polyethy-lene terephthalate/graphene nanocomposites with various aspect ratio of graphene sheets(η = 50, 150); ϕc denotes to the percolation threshold.
6. Conclusion
The numerical simulations show that introducing tunneling effect allowsreproducing both low percolation thresholds and nonlinear electrical effectsin graphene-reinforced nanocomposites. We report that lower percolationthresholds can be obtained for lower barrier height between the polymer andthe graphene sheets and for higher aspect ratios of graphene platelets. Theproposed numerical predictions show that aligning the graphene sheets leadsto a sharper increase of the effective electric conductivity after the percolationthreshold as compared to randomly oriented sheets, but without significantenhancement of percolation thresholds and maximum effective conductivity.Finally, the proposed numerical results were compared to experimental data,showing encouraging agreement and similar trends.
7. Acknowledgements
The financial supports from Institut Universitaire de France (IUF) andChina Scholarship Council (CSC) are gratefully acknowledged.
References
[1] L. Britnell, R. M. Ribeiro, A. Eckmann, R. Jalil, B. D. Belle,A. Mishchenko, Y. Kim, R. V. Gorbachev, T. Georgiou, S. V. Moro-
15

zov, A. N. Grigorenko, A. K. Geim, C. Casiraghi, A. H. CastroNeto,K. S. Novoselov, Strong light-matter interactions in heterostructures ofatomically thin films, Science 340 (6138) (2013) 1311–1314.
[2] M. F. El-Kady, R. B. Kaner, Scalable fabrication of high-power graphenemicro-supercapacitors for flexible and on-chip energy storage, NatureCommunications 4 (2013) 1475.
[3] K. S. Kim, Y. Zhao, H. Jang, S. Y. Lee, J. M. Kim, K. S. Kim, J. H.Ahn, P. Kim, J. Y. Choi, B. H. Hong, Large-scale pattern growth ofgraphene films for stretchable transparent electrodes, Nature 457 (7230)(2009) 706.
[4] M. S. Mannoor, H. Tao, J. D. Clayton, A. Sengupta, D. L. Kaplan, R. R.Naik, N. Verma, F. G. Omenetto, M. C. McAlpine, Graphene-basedwireless bacteria detection on tooth enamel, Nature Communications 3(2012) 763.
[5] W. Guo, C. Cheng, Y. Wu, Y. Jiang, J. Gao, D. Li, L. Jiang, Bio-inspiredtwo-dimensional nanofluidic generators based on a layered graphene hy-drogel membrane, Advanced Materials 25 (42) (2013) 6064–6068.
[6] K. S. Novoselov, A. K. Geim, S. V. Morozov, D. Jiang, Y. Zhang, S. V.Dubonos, I. V. Grigorieva, A. A. Firsov, Electric field effect in atomicallythin carbon films, science 306 (5696) (2004) 666–669.
[7] J. Liang, Y. Wang, Y. Huang, Y. Ma, Z. Liu, J. Cai, C. Zhang, H. Gao,Y. Chen, Electromagnetic interference shielding of graphene/epoxy com-posites, Carbon 47 (3) (2009) 922–925.
[8] H. Kim, C. W. Macosko, Processing-property relationships of polycar-bonate/graphene composites, Polymer 50 (15) (2009) 3797–3809.
[9] J. Hicks, A. B. A. Ural, A computational study of tunneling-percolationelectrical transport in graphene-based nanocomposites, Applied PhysicsLetters 95 (21) (2009) 213103.
[10] X.-Y. Qi, D. Yan, Z. Jiang, Y.-K. Cao, Z.-Z. Yu, F. Yavari, N. Ko-ratkar, Enhanced electrical conductivity in polystyrene nanocompositesat ultra-low graphene content, ACS applied materials & interfaces 3 (8)(2011) 3130–3133.
16

[11] Y. Wang, J. W. Shan, G. J. Weng, Percolation threshold and electricalconductivity of graphene-based nanocomposites with filler agglomera-tion and interfacial tunneling, Journal of Applied Physics 118 (6) (2015)065101.
[12] L. He, S. C. Tjiong, Low percolation threshold of graphene/polymercomposites prepared by solvothermal reduction of graphene oxide in thepolymer solution, Nanoscale research letters 8 (1) (2013) 132.
[13] P. Fan, L. Wang, J. Yang, F. Chen, M. Zhong,Graphene/poly(vinylidene fluoride) composites with high dielec-tric constant and low percolation threshold, Nanotechnology 23 (36)(2012) 365702.
[14] E. Tkalya, M. Ghislandi, R. Otten, M. Lotya, A. Alekseev, P. van derSchoot, J. Coleman, G. de With, C. Koning, Experimental and theoret-ical study of the influence of the state of dispersion of graphene on thepercolation threshold of conductive graphene/polystyrene nanocompos-ites, ACS Applied Mater. Interfaces 6 (17) (2014) 15113–15121.
[15] C. Gao, S. Zhang, F. Wang, B. Wen, C. Han, Y. Ding, M. Yang,Graphene networks with low percolation threshold in abs nanocompos-ites: selective localization and electrical and rheological properties, ACSapplied materials & interfaces 6 (15) (2014) 12252–12260.
[16] A. Trionfi, D. Wang, J. Jacobs, L.-S. Tan, R. Vaia, J. Hsu, Direct mea-surement of the percolation probability in carbon nanofiber-polyimidenanocomposites, Physical review letters 102 (11) (2009) 116601.
[17] F. Du, J. E. Fischer, K. I. Winey, Effect of nanotube alignment on per-colation conductivity in carbon nanotube/polymer composites, PhysicalReview B 72 (12) (2005) 121404.
[18] E. Charlaix, Percolation threshold of a random array of discs: a numer-ical simulation, Journal of Physics A: Mathematical and General 19 (9)(1986) L533.
[19] M. Mathew, T. Schilling, M. Oettel, Connectivity percolation in suspen-sions of hard platelets, Physical Review E 85 (6) (2012) 061407.
17

[20] M. B. Bryning, M. F. Islam, J. M. Kikkawa, A. G. Yodh, Very lowconductivity threshold in bulk isotropic single-walled carbon nanotube–epoxy composites, Advanced materials 17 (9) (2005) 1186–1191.
[21] N. Yousefi, M. M. Gudarzi, Q. Zheng, S. H. Aboutalebi, F. Sharif,Jang-KyoKim, Self-alignment and high electrical conductivity of ul-tralarge graphene oxide–polyurethane nanocomposites, Journal of Ma-terials Chemistry 22 (25) (2012) 12709–12717.
[22] W. Bauhofer, J. Z. Kovacs, A review and analysis of electrical percola-tion in carbon nanotube polymer composites, Composites Science andTechnology 69 (10) (2009) 1486–1498.
[23] R. Haggenmueller, C. Guthy, J. R. Lukes, J. E. Fischer, K. I. Winey,Single wall carbon nanotube/polyethylene nanocomposites: thermal andelectrical conductivity, Macromolecules 40 (7) (2007) 2417–2421.
[24] A. B. Oskouyi, U. Sundararaj, P. Mertiny, Current-voltage character-istics of nanoplatelet-based conductive nanocomposites, Nanoscale Re-search Letters 9 (1) (2014) 369.
[25] P. Sheng, Fluctuation-induced tunneling conduction in disordered ma-terials, Physical Review B 21 (6) (1980) 2180.
[26] R. H. Otten, P. van der Schoot, Connectivity percolation of polydisperseanisotropic nanofillers, The Journal of chemical physics 134 (9) (2011)094902.
[27] G. Ambrosetti, C. Grimaldi, I. Balberg, T. Maeder, A. Danani, P. Ryser,Solution of the tunneling-percolation problem in the nanocompositeregime, Physical Review B 81 (15) (2010) 155434.
[28] W. Bauhofer, J. Z. Kovacs, A review and analysis of electrical percola-tion in carbon nanotube polymer composites, Composites Science andTechnology 69 (2009) 1486–1498.
[29] P. Castaneda, J. Willis, The effect of spatial distribution on the effec-tive behavior of composite materials and cracked media, Journal of theMechanics and Physics of Solids 43 (12) (1995) 1919–1951.
18

[30] Z. Fan, F. Gong, S. T. Nguyen, H. M. Duong, Advanced multifunctionalgraphene aerogel–poly (methyl methacrylate) composites: Experimentsand modeling, Carbon 81 (2015) 396–404.
[31] X. Xia, Y. Wang, Z. Zhong, G. J. Weng, A frequency-dependent the-ory of electrical conductivity and dielectric permittivity for graphene-polymer nanocomposites, Carbon 111 (2017) 221–230.
[32] Y. Wang, G. J. Weng, S. A. Meguid, A. M. Hamouda, A continuummodel with a percolation threshold and tunneling-assisted interfacialconductivity for carbon nanotube-based nanocomposites, Journal of Ap-plied Physics 115 (19) (2014) 193706.
[33] C. Grimaldi, I. Balberg, Tunneling and nonuniversality in continuumpercolation systems, Physical Review Letters 96 (6) (2006) 066602.
[34] R. H. Otten, P. van der Schoot, Continuum percolation of polydispersenanofillers, Physical Review Letters 103 (22) (2009) 225704.
[35] R. Hashemi, G. J. Weng, A theoretical treatment of graphene nanocom-posites with percolation threshold, tunneling-assisted conductivity andmicrocapacitor effect in AC and DC electrical settings, Carbon 96 (2016)474–490.
[36] X. Xia, Z. Zhong, G. J. Weng, Maxwell–Wagner–Sillars mechanism inthe frequency dependence of electrical conductivity and dielectric per-mittivity of graphene-polymer nanocomposites, Mechanics of Materials109 (2017) 42–50.
[37] A. Manta, M. Gresil, C. Soutis, Predictive model of graphene basedpolymer nanocomposites: Electrical performance, Applied CompositeMaterials 24 (2) (2017) 281–300.
[38] X. Lu, J. Yvonnet, F. Detrez, J. Bai, Multiscale modeling of nonlinearelectric conductivity in graphene-reinforced nanocomposites taking intoaccount tunnelling effect, Journal of Computational Physics 337 (2017)116–131.
[39] W. Krauth, Statistical mechanics: algorithms and computations,Vol. 13, OUP Oxford, 2006.
19

[40] S. Torquato, Random heterogeneous materials: microstructure andmacroscopic properties, Vol. 16, Springer Science & Business Media,2013.
[41] J. Yvonnet, Q.-C. He, C. Toulemonde, Numerical modelling of the effec-tive conductivities of composites with arbitrarily shaped inclusions andhighly conducting interface, Composites Science and Technology 68 (13)(2008) 2818 – 2825.
[42] J. G. Simmons, Electric tunnel effect between dissimilar electrodes sepa-rated by a thin insulating film, Journal of Applied Physics 34 (9) (1963)2581–2590.
[43] R. Rahman, P. Servati, Effects of inter-tube distance and alignment ontunnelling resistance and strain sensitivity of nanotube/polymer com-posite films, Nanotechnology 23 (5) (2012) 055703.
[44] J. Wang, S. Yu, S. Luo, B. Chu, R. Sun, C.-P. Wong, Investigationof nonlinear i-v behavior of cnts filled polymer composites, MaterialsScience and Engineering: B 206 (2016) 55–60.
[45] S. Stankovich, D. A. Dikin, G. H. Dommett, K. M. Kohlhaas, E. J.Zimney, E. A. Stach, R. D. Piner, S. T. Nguyen, R. SRuoff, Graphene-based composite materials, nature 442 (7100) (2006) 282–286.
[46] J. Y. Jiang, M. S. Kim, H. M. Jeong, C. M. Shon, Graphite oxide/poly(methyl methacrylate) nanocomposites prepared by a novel method uti-lizing macroazoinitiator, Composites Science and Technology 69 (2)(2009) 186–191.
[47] S. Ansari, E. P. Giannelis, Functionalized graphene sheet-poly (vinyli-dene fluoride) conductive nanocomposites, Journal of Polymer SciencePart B: Polymer Physics 47 (9) (2009) 888–897.
[48] H.-B. Zhang, W.-G. Zheng, Q. Yan, Y. Yang, J.-W. Wang, Z.-H.Lu, G.-Y. Ji, Z.-Z. Yu, Electrically conductive polyethylene terephtha-late/graphene nanocomposites prepared by melt compounding, Polymer51 (5) (2010) 1191–1196.
20