low earth orbital satellites for personal communication ...pws.npru.ac.th/sartthong/data/files/low...
TRANSCRIPT

Low Earth Orbital Satellitesfor Personal Communication
Networks

For a complete listing of the Artech House Mobile Communications Library,turn to the back of this book.

Low Earth Orbital Satellitesfor Personal Communication
Networks
Abbas Jamalipour
Artech HouseBoston • London

Library of Congress Cataloging-in-Publication DataJamalipour, Abbas
Low earth orbital satellites for personal communication networks / Abbas Jamalipourp. cm.—(Artech House mobile communications library)
Includes bibliographical references and index.ISBN 0-89006-955-7 (alk. paper)1. Artificial satellites in telecommunication. 2. Mobile communication systems.
I. Title. II. Series: Artech House telecommunications library.TK5104.J35 1997621.3845—dc21 97-32244
CIP
British Library Cataloguing in Publication DataJamalipour, Abbas
Low earth orbital satellites for personal communication networks1. Artificial satellites in telecommunicationI. Title621.3’8254
ISBN 0-89006-955-7
Cover and text design by Darrell Judd.
© 1998 ARTECH HOUSE, INC.685 Canton StreetNorwood, MA 02062
All rights reserved. Printed and bound in the United States of America. No part of this bookmay be reproduced or utilized in any form or by any means, electronic or mechanical, in-cluding photocopying, recording, or by any information storage and retrieval system, with-out permission in writing from the publisher.
All terms mentioned in this book that are known to be trademarks or service marks havebeen appropriately capitalized. Artech House cannot attest to the accuracy of this informa-tion. Use of a term in this book should not be regarded as affecting the validity of any trade-mark or service mark.
International Standard Book Number: 0-89006-955-7Library of Congress Catalog Card Number: 97-32244
10 9 8 7 6 5 4 3 2 1

Low Earth Orbital Satellites for Personal Communication Networks
Contents
Preface ixAcknowledgments xi
Introduction xiiiOrganization of this book xv
1 Mobile Satellite Communications 11.1 Communications satellites 2
1.1.1 Preliminary issues 21.1.2 History of communications satellites 5
1.2 Orbital dynamics of satellite systems 71.2.1 Kepler’s first law 81.2.2 Kepler’s second law 81.2.3 Kepler’s third law 81.2.4 An example: The geostationary orbit 10
v
1.3 Mobile satellite communications systems 121.3.1 Orbit selection 121.3.2 Mobile satellite systems 18
1.4 Summary 27
2 Communications with LEO Satellites 332.1 Preliminary issues in LEO satellite systems 35
2.1.1 Required number of LEO satellites and orbits 352.1.2 Hand-off 412.1.3 Intersatellite links 432.1.4 Spot beams 462.1.5 Doppler shift effect 51
2.2 Specific issues in LEO satellite systems 552.2.1 Selection of a multiple-access scheme 562.2.2 Traffic considerations 64
2.3 Modeling the LEO satellite systems 672.4 Summary 72
3 Application of CDMA in LEO Satellite Systems 773.1 Performance evaluation of analog systems 79
3.1.1 Traffic modeling 793.1.2 SIR: The measure of performance 823.1.3 Traffic assignment control 91
3.2 Performance of integrated voice/data systems 963.2.1 System considerations 963.2.2 Extension of the traffic model 993.2.3 Simulation environment 1013.2.4 Performance measurement 1033.2.5 Dynamic nonuniform traffic concepts 108
3.3 Summary 113
4 Spread-Slotted Aloha for LEO Satellite Systems 1174.1 Spread-slotted Aloha 119
vi Low Earth Orbital Satellites for Personal Communication Networks
4.1.1 The Aloha multiple-access scheme 1194.1.2 Spreading the Aloha packets 123
4.2 Employing spread-slotted Aloha in a LEOsatellite system 130
4.2.1 Distribution of users 1324.2.2 Throughput analysis 1344.2.3 Probability of packet success 136
4.3 Numerical examples 1444.4 Summary 151
5 Modified Power Control in Spread-Slotted Aloha 1575.1 Worst case in throughput performance 159
5.1.1 Intracell interference versus intercell interference 1605.1.2 Performance of nonworst cases 164
5.2 Modified power control scheme 1685.2.1 Purpose and structure of the scheme 1695.2.2 Numerical examples 1725.2.3 Some practical notes on realization of the scheme 179
5.3 Summary 180
6 Transmit Permission Control Scheme for6 Spread-Slotted Aloha 185
6.1 Transmit permission control scheme:Nonfading channel 187
6.1.1 Basic considerations 1886.1.2 Transmit permission control 1906.1.3 Throughput performance of transmit permission control 1956.1.4 Average delay performance of transmit permission
control 202
6.2 Transmit permission control scheme: Fading channel 2096.2.1 Fading channel model and analysis 2096.2.2 Numerical examples of the performance of the system 212
Contents vii
6.3 Adaptive transmit permission control schemes 2146.3.1 ATPC method 1 2156.3.2 ATPC method 2 2176.3.3 Performance of ATPC methods 217
6.4 Summary 219
7 Further Considerations in LEO Satellite Systems 2237.1 Packet admission control scheme 224
7.1.1 System and traffic models 2257.1.2 Evaluation of heavy-traffic performance 2287.1.3 Concepts of the scheme 2327.1.4 Performance of the scheme 233
7.2 Power control 2367.2.1 The near-far problem 2367.2.2 Implementation of power control 2377.2.3 Effects of imperfections in power control 238
7.3 Multibeam LEO satellites 2417.3.1 General expression for antenna gain 2427.3.2 Spot-beam antenna gain 2437.3.3 Performance of spot-beam antennas 245
7.4 Concept of adaptive array antennas 2487.5 Summary 251
List of Acronyms 257
About the Author 261
Index 263
viii Low Earth Orbital Satellites for Personal Communication Networks

Low Earth Orbital Satellites for Personal Communication Networks
Preface
I , there has been a rush of research toward therealization of a global personal communication network that canprovide reliable, ubiquitous, and cost-effective communication serv-
ices to individuals via small and single-standard hand-held terminals. Thattrend is expected to continue through the first decade of the next century.The exponential increase in the number of subscribers for mobile tele-phones during the last five years, as well as increasing trends for multi-media communications, is driving the future of mobile communicationsystems.
To meet the communication requirements in the upcoming century,global personal communication networks (PCNs) have become one of thehottest topics in the field of communications. An important and funda-mental question in such plans is which system meets all those require-ments. Current cellular systems, although they have good potential forproviding voice and data communications in urban areas, would not be aproper choice for a global system. On the other hand, in accordance with
ix
the research for satellite communication systems, there has been a wide-spread desire to set up a single global communication system by satellites,which may be the only solution for the globalization of communicationsnetworks.
Thus, low Earth orbital (LEO) satellites seem to have some propertiesover conventional geostationary satellites that make them appropriatecandidates for establishing PCNs on a global basis. LEO satellites, whilehaving the important features of conventional geostationary satellites,such as wide coverage area, direct radio path, and flexibility of thenetwork architecture, provide some additional fundamental advantagesfor global communication networks, for example, short propagationdelay, low propagation loss, and high elevation angle in high latitudes.
In recent years, the literature as well as the industry have paid muchattention to the commercial use of LEO satellites for establishing a globalPCN. Although the history of research on the application of LEO satellitesgoes back to the early 1960s, the realization of using such satellites onlow-altitude orbits for PCN applications is in its infancy. A search throughthe literature that yielded only a small number of written materialsrelated to this important part of future global communication serviceprompted me to write this book.
This book is a theoretical study of some of the problems related tothe use of LEO satellites for a global communication service. Throughoutthis book, the reader will find different aspects of the problems thatshould be considered during the design of any LEO satellite communica-tion networks, as well as a number of references to those systems thatcannot be found in the literature so easily. I believe engineers and studentscan use the contents of this book to start working on LEO satellitesystems, but the materials should be modified during the practical reali-zation of LEO satellite systems and according to collected statistics. Inthat manner, this book will be much more useful if it is used in conjunctionwith up-to-date technical papers containing practical data of real LEOsatellite systems.
This book presents an analytical framework to study the performanceof LEO satellite systems, and several problems related to employing thosesystems in a global PCN are discussed. A major part of the book focuseson the performance of LEO satellite systems when they employ one oftwo promising multiple access candidates: code division multiple access
x Low Earth Orbital Satellites for Personal Communication Networks

(CDMA) or spread-slotted Aloha. Another major viewpoint of this bookis the problem of nonuniform distribution of the traffic loads around theworld, which should be serviced by the LEO satellite system in a globalPCN, and is considered here as an original point of view in the LEOsatellite systems.
Chapters 1 and 2 are an introduction to the satellite communicationssystem theory as a bridge from the conventional geostationary satellitesto the LEO satellites. Some general issues in satellite systems, especiallyLEO satellite systems, are introduced and these two chapters can be usedas an introductory course in satellite systems. The rest of the bookpresents special analyses for the LEO satellite systems and hence is usefulin an advanced or graduated course about LEO satellite systems. Thelatter part is very much related to spread spectrum techniques. Severalexcellent textbooks on spread spectrum and CDMA are available, so I donot provide all the fundamentals here. The text, nevertheless, is self-con-tained: any significant results are derived in the text. Still, to understandChapters 3 through 7, the reader should have at least an undergraduateelectrical engineering background with some probability and communi-cation engineering content. As a text for a graduate-level course, the bookcan be covered in one semester or, with some compromises, even in onequarter.
AcknowledgmentsI would like to express my heartfelt gratitude to my colleagues at NagoyaUniversity, where I did most of the analyses. Prof. A. Ogawa establisheda good environment and helped me a lot during my stay at the university.Prof. R. Kohno from Yokohama National University, in Japan, Prof. B.Vucetic from Sydney University, in Australia, and many others encour-aged me during the writing of this book; I express my sincere thanks toall of them. Many parts of this book have been published in internationaljournals. I acknowledge the constructive comments from the anonymousreviewers of the IEEE, the IEICE, and others that helped me improvethose papers and thus this current book. The reviewers at Artech Housealso provided many useful comments and suggestions, most of which havebeen incorporated in the book. I hope that the materials given here can
Preface xi

help designers of future LEO satellite PCNs design reliable and realisticsystems and that we see the first commercial stage of a global communi-cation network provided by the LEO satellites soon.
A. JamalipourNagoya University, Japan
1998
xii Low Earth Orbital Satellites for Personal Communication Networks

Low Earth Orbital Satellites for Personal Communication Networks
Introduction
T of personal communication networks (PCNs) on aglobal basis has recently become one of the hottest topics in the fieldof communications. Future PCNs are expected to offer reliable,
ubiquitous, and cost-effective communication services to individuals viasmall hand-held terminals, while low Earth orbital (LEO) satellite commu-nication systems seem to have properties that make them appropriate forsupporting PCNs. Like conventional geostationary satellite systems, LEOsatellite systems offer a wide coverage area, a direct radio path, and aflexible network architecture. Unlike their conventional counterparts,however, LEO satellites also provide small propagation delay and loss,and a high evaluation angle at high latitudes.
This book discusses the use of LEO satellite system for a global PCNand the different problems related to that utilization. The discussionfocuses on the performance of LEO satellite systems with employmentof either CDMA or spread-slotted Aloha. The selection of a multiple
xiii

access scheme that can efficiently share the limited frequency spectrumto a large number of users is a fundamental issue in any mobile commu-nication system. Another major viewpoint of this book is the problem ofnonuniform distribution of the traffic loads around the world, whichshould be serviced by the LEO satellite system in a global PCN and whichis considered here as an original point of view in the LEO satellite systems.
While there does not appear to be a single multiple access techniquethat is superior to others in all situations, there are characteristics ofspread spectrum waveforms that give CDMA certain distinct advantages.The two basic problems that the mobile radio system designer faces aremultipath fading of the radio link and interference from other users in thereuse environment. Spread spectrum signals are effective in mitigatingmultipath because their wide bandwidth introduces frequency diversity.They also are useful in mitigating interference, again because of their widebandwidth. The result of those effects is a higher capacity potentialcompared to that of non-spread multiple access methods. Using thespread spectrum techniques in conjunction with the simple conventionalslotted Aloha multiple access scheme, namely, spread-slotted Aloha, alsoresults in an interesting multiple access scheme, which is considered inthis book. In such a system, the collisions between transmitted packetsare acceptable as long as the level of multiple access interference is smallcompared to the strength of the power of the desired packet.
The geographical traffic nonuniformity problem is basically not thecase for the conventional geostationary satellite systems, because ofrelatively wide coverage of a single geostationary satellite to aboutone-third of the globe. However, for a LEO satellite system, in which thecoverage of a single satellite can be as small as a part of a country or anocean, the problem becomes important. Generally, LEO satellite systemsare planned to service all parts of the globe, including areas with relativelysmall numbers of users. In addition, in urban areas, the number of thefuture hand-held PCN terminals with the dual capability of direct accessto the satellite system and their source country cellular system is expectedto be large. The service area of a LEO satellite may cover a number ofsuch small cities as well as the urban areas. Then the total traffic of thesatellite becomes much higher than that of its neighbor satellite. In short,this problem results in nonoptimal usage of the communication facilitiesof the LEO satellite systems.
xiv Low Earth Orbital Satellites for Personal Communication Networks

This book presents analytical frameworks for evaluating the perform-ance of the LEO satellite systems under those specifications. A numberof techniques to improve the performance of those systems are intro-duced. Those techniques are grouped into two types. The first groupincludes methods that are modified versions of the conventional powercontrol necessary in spread spectrum systems. In such methods, accord-ing to the average level of traffic loads of satellites, different requiredusers’ transmitting powers are requested. Different types of these meth-ods are employed in both CDMA and spread-slotted Aloha systems. Bynumerical examples, it is shown that they can improve significantly thesignal-to-interference ratio and throughput characteristics of the LEOsatellite systems. As will be shown, these methods are proper solutionsto the nonuniform traffic distribution problem. The second group con-siders the control of transmissions of users to achieve significant improve-ment in the performance of the LEO satellite systems in both uniformand nonuniform traffic distributions. The method of controlling thetransmissions of users enhances the throughput characteristics of the LEOsatellite system comparably higher than those that can be achieved in aconventional spread-slotted Aloha scheme. It also maintains the im-proved characteristics in a wide range of change of the offered traffic load.
Organization of this bookChapter 1 discusses the general ideas of applying satellites in communi-cations systems. It also briefly describes the orbital dynamics in satellitesystems. An overview of conventional geostationary satellite systems isfollowed by some objections to those systems, such as the need of lowelevation angles at high latitudes as well as large propagation loss anddelay. After that, we present some proposals for the LEO satellite systemsthat are evidence for the necessity of consideration of LEO satellitesystems in future mobile communications.
Chapter 2 introduces the concept of communications with LEOsatellites. The chapter presents some preliminary issues in those systems,including the calculations of the required number of satellites and or-bits in a global satellite constellation, the concept of hand-off betweenLEO satellites for a continuous communication, the issue of networking
Introduction xv
LEO satellites via intersatellite links, the idea of spot-beam antennas, andthe problem of Doppler shift. After that, the text discusses two specificissues in a LEO satellite system: the selection of multiple access and theproblem of traffic nonuniformity. The chapter discusses the meaning ofand alternatives to the multiple access schemes in general and in LEOsatellite systems specifically. The chapter finishes by introducing themathematical model of a LEO satellite system and its alternative, whichwill be used throughout the rest of the book.
Chapter 3 examines application of CDMA in LEO satellite systems.The chapter focuses the discussion on an analog system and derives thesignal-to-interference ratio as the measure of the performance in such asystem. We introduce a mathematical nonuniform traffic distributionmodel and compare the performance of the system under uniform andnonuniform traffic distributions. After that, the discussion continues inan integrated voice/data scenario. In both cases, we propose a controlscheme on the level of the transmitting power of the users and show theeffect of such control on the performance of the system.
Chapter 4 introduces the combination of spread spectrum and slottedAloha multiple access schemes. A spread-slotted Aloha scheme is intro-duced and then such a composite multiple access is applied on the uplinksof the LEO satellite communication system. The chapter explains theconventional (unspread) Aloha schemes as well as the combination ofthem with CDMA. After that, we present the necessary mathematics forthe calculation of the throughput in the LEO satellite systems employingspread-slotted Aloha. We also compare the performance of the systemunder uniform and nonuniform traffic distributions and show how thetraffic nonuniformity degrades the average value of total throughput inthe system.
Chapter 5 proposes a new method for improving the throughputperformance of LEO satellite systems by searching the worst case of theperformance of the system. The chapter proposes a modified powercontrol scheme applicable in a spread-slotted Aloha LEO satellite systemfaced with nonuniform traffic distribution. An analysis of the perform-ance of a LEO satellite system in different traffic situations is alsopresented, and some practical considerations for applying this method ina real satellite system are also examined.
xvi Low Earth Orbital Satellites for Personal Communication Networks
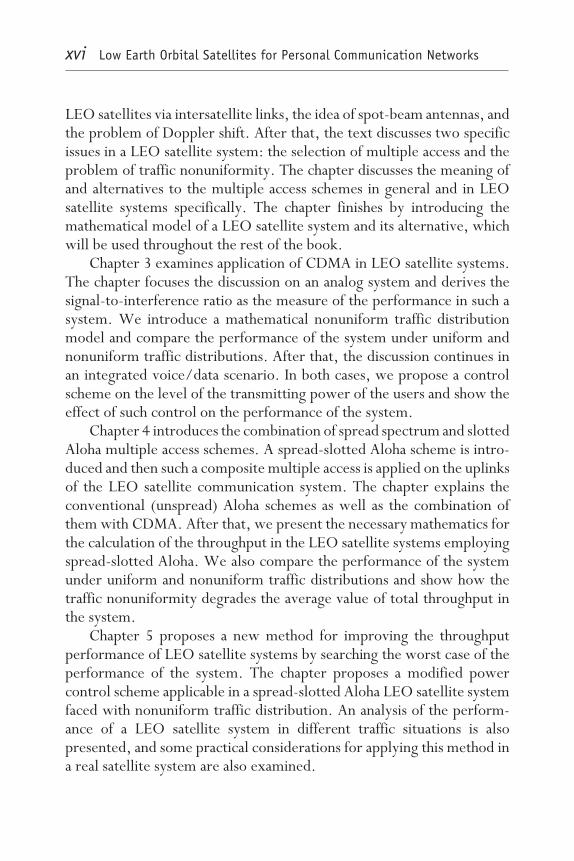
Chapter 6 introduces the concepts of controlling the transmissions ofusers, namely, a transmit permission control scheme. The chapter pro-vides the mathematical calculations of the average delay in both uniformand nonuniform traffic distributions. The performance improvement ofthe proposed scheme is shown in fading and nonfading satellite channels.It also is shown that the proposed method can be applied in both uniformand nonuniform traffic situations. After that, a modification to theproposed method based on an adaptive control of the transmissions toimprove the performance more is presented.
The last chapter discusses some further considerations of LEO satel-lite systems. The chapter proposes a packet admission control schemethat is very similar to the transmit permission control scheme. In the newscheme, which is again applicable in a spread-slotted Aloha system,transmission of packets is controlled according to the distance of users totheir connecting satellites as well as traffic distribution. It is shown thatthe method can provide improved throughput performance in heavytraffic situations. Chapter 7 also examines some imperfections in thesystem, especially the one that appears in power control. The effect of animperfect power control and the sectorizations of antennas on the per-formance of the system and how they change the mathematical resultsgiven in other chapters are some of the subjects of this chapter. Thechapter finishes by introducing concepts of adaptive array antennas,recently proposed for the LEO satellite systems.
Introduction xvii
Low Earth Orbital Satellites for Personal Communication Networks
1Mobile Satellite
Communications
T in the number of subscribers for mobiletelephones during the last five years can be assumed to be the trendof future mobile communications systems. Rather than the simple
voice communications of the 1980s and the early 1990s, people now askfor a wide variety of personal communications, including voice, data,facsimile, and electronic mail, made available by the exploitation ofwireless spectrum and the development of low-cost, low-power commu-nications devices. In different countries, such systems are referred toas PCNs, personal communications services (PCS), universal mobile telecom-munications services (UMTS), universal personal telecommunications (UPT),and most recently, the future public land mobile telecommunication system(FPLMTS). Such systems and services proposed to reach their ultimate
1

goal by providing reliable, ubiquitous, and cost-effective communica-tions to personal subscribers, either universally or continentally.
In addition to a wide variety of services, consumers are now seekinga single terminal and a single access number that can be used internation-ally. Unfortunately, there are many different standards through theworld. Each continent or even each country has its own standard, whichrequires a different terminal even for voice communications. One exam-ple of such an idea is now realized partly by the Japanese personal handyphone system (PHS, formerly PHP), in which a user can use a smallhand-held terminal as a cellular mobile phone and as a cordless phoneconnected to a home telephone line. Although we still are a bit far fromcomplete realization of such a single-terminal, single-number system, weshould expect it in near future.
This book focuses on a strong candidate for realizing such a system:The LEO satellite system. This chapter briefly describes satellite commu-nications systems in general; subsequent chapters examine satellites inlow-altitude orbits.
1.1 Communications satellites
1.1.1 Preliminary issues
It was not until about four centuries ago that the realization was madethat the shape of our planet is spherical. As a direct consequence of thatshape, it is impossible to send radio waves directly from one point on theglobe to another point when the receiver point is not in the line of sightof the transmitter. Hence, a middle point must receive the signal andtransmit it to the next visible point until the path between the originaltransmitter and the final receiver is complete. The middle points canbe, for example, relay stations with tall antenna towers, as shown inFigure 1.1(a). However, since so many parts of the globe are occupiedby water, it is impossible or very expensive to use such towers. That kindof relay station can be used for communications between far points onlyon land.
To establish long-distance communications between continents, an-other possibility is to use the Earth’s atmosphere or the ionosphere layer.
2 Low Earth Orbital Satellites for Personal Communication Networks
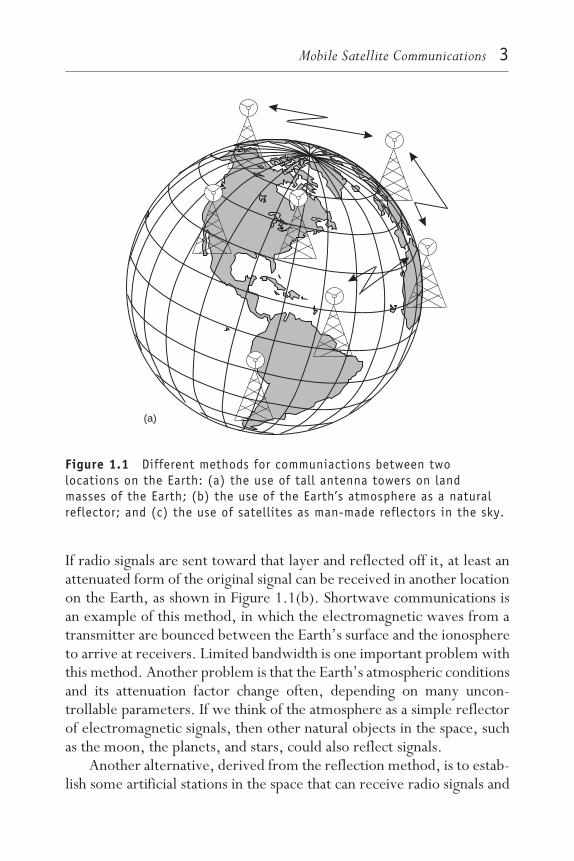
If radio signals are sent toward that layer and reflected off it, at least anattenuated form of the original signal can be received in another locationon the Earth, as shown in Figure 1.1(b). Shortwave communications isan example of this method, in which the electromagnetic waves from atransmitter are bounced between the Earth’s surface and the ionosphereto arrive at receivers. Limited bandwidth is one important problem withthis method. Another problem is that the Earth’s atmospheric conditionsand its attenuation factor change often, depending on many uncon-trollable parameters. If we think of the atmosphere as a simple reflectorof electromagnetic signals, then other natural objects in the space, suchas the moon, the planets, and stars, could also reflect signals.
Another alternative, derived from the reflection method, is to estab-lish some artificial stations in the space that can receive radio signals and
(a)
Figure 1.1 Different methods for communiactions between twolocations on the Earth: (a) the use of tall antenna towers on landmasses of the Earth; (b) the use of the Earth’s atmosphere as a naturalreflector; and (c) the use of satellites as man-made reflectors in the sky.
Mobile Satellite Communications 3

transmit them to another point on the Earth—a ground station, a relayantenna, or the final destination receiver, as shown in Figure 1.1(c). Thisis the basic idea of man-made satellite communications systems, used formany years until now.
Thus, we can define a communications satellite as a means forcommunication between two widely separate points on the ground.Although that definition seems simple, it is not well known. Many peoplethink of a satellite as a means for broadcasting television signals. Think ofthe many homes equipped with satellite dishes used for television and ofweather photographs taken from satellites and shown on the news. Here,however, we are defining a satellite as an essential part of global telecom-munications carrying large amounts of data and telephone traffic world-
Ionosphere Layer
(b)
Figure 1.1 (continued).
4 Low Earth Orbital Satellites for Personal Communication Networks

wide. A telecommunications satellite also can be thought of as a star pointin the sky receiving data from one point and transmitting them to severalpoints on the ground.
We should note that a communications satellite can do many activitiesother than simple reflection of radio signals, such as switching facilities,navigation (e.g., global positioning system (GPS)), information processing,and remote sensing. Such activities are determined according to thepayload of the satellite and the purpose for which the satellite is launched.Throughout this book, the word satellite is used indicate telecommunica-tions purposes; we do not discuss, for example, broadcasting satellites.
1.1.2 History of communications satellitesWith the advent of man-made satellites, extensive research and develop-ment work has made in various countries to utilize the satellites as a means
(c)
Figure 1.1 (continued).
Mobile Satellite Communications 5
of long-distance telecommunications. The result was rapid progress insatellite communications systems. Today, satellite communications areindispensable as a basic tool of human social activities. This system, as anepoch-making, modern communication means, is now broadly utilizednot only in telecommunications but also in broadcasting, meteorologicalobservations, navigation, and resource exploitation as well as spaceresearch.
A communications satellite provides a number of features not readilyavailable with other means of communications. Perhaps the most impor-tant feature of a satellite is its unique ability to cover wide areas on theEarth’s surface. As a consequence of that wide coverage, a satellite canform the star point of a communication network linking many userssimultaneously, users who may be widely separated geographically.Moreover, the wide coverage of a satellite enables communication insparsely populated areas that are difficult to access by other communica-tion means. It is worth mentioning that providing communications be-tween small cities located great distances apart is an expensive task if weignore the satellite as a means of communications.
As already mentioned, a satellite can be used as a means for commu-nication between two locations on the Earth separated by a large distance.If we consider the reflection role of a satellite in such communications,that is, receiving a signal from the source location and forwarding it tothe destination location, and if we agree that such communication isrepeated at different hours every day, then maybe the most properreflector will be the one that is fixed from the viewpoint of an object onthe Earth. Because the Earth is continuously rotating, the satellite shouldalso rotate with the same angular speed and in the same direction as theEarth, in order to be fixed with any objects on the Earth. That is theconcept behind launching satellites on the geostationary Earth orbit (GEO).A satellite on a GEO is referred to as geostationary satellite or, in someliterature, as a GSO (geostationary satellite orbit) satellite.
As will be discussed in Section 1.2, it can be shown by mathematicalanalysis that there is only one GEO and that it is at an altitude of about36,000 km and in the equatorial plane. When the position of a satelliteis always stationary related to the Earth, the synchronization processbetween satellite and Earth stations becomes simple. In addition, withthree geostationary satellites rotating in the plane of the equator, sepa-
6 Low Earth Orbital Satellites for Personal Communication Networks

rated by 120 degrees of longitude, it is possible to cover almost all partsof the land masses on the Earth, except for the north and the south polarregions. Simplicity in synchronization in addition to global coverage byonly three satellites were why satellite systems on geostationary orbitwere so successful in last three decades.
The most noteworthy achievement in satellite communications is thatin 1964 the International Telecommunications Satellite Organization (INTEL-SAT) was established to provide a means of fixed-satellite service amongnations and that as early as 1965 satellite communications were put intopractical commercial use. The stage of development up to the practicalapplication of satellite communications, however, would be the age ofexperimental space radio communication, detailed descriptions of whichare available in much of the literature [1–6]. The International MaritimeTelecommunication Satellite Organization (INMARSAT), another key-pio-neered satellite system for mobile purposes, is discussed in Section 1.3.
1.2 Orbital dynamics of satellite systemsBefore discussing our main topic, that is, communications with LEOsatellites, we should review the dynamics of satellite systems. Becausethis book is from a communications engineering viewpoint, we will notdiscuss either the dynamics of the orbits or their mechanics in detail. Forthose subjects, the reader is referred to well-written books on thedynamics of satellite systems, for example, Roddy; Elbert; and Pritchard,Suyderhoud, and Nelson [1,4,5].
A satellite is an artificial body in space, but it has to follow the samelaws in its rotation as the planets do in their rotation around the sun.Three important laws for planetary motion derived empirically by Johan-nes Kepler (1571–1630) were derived again by Isaac Newton, in 1665,according to Newton’s laws of mechanics and gravitation theory. Ke-pler’s laws are general and can be applied to any two objects in space. Itis usual to refer to the more massive object as primary and the smallerone as secondary. Using those labels, for a satellite rotating around theEarth, the Earth is the primary object and the satellite the secondaryobject. The following explanations of Kepler’s three laws can be used todescribe satellite systems as well. We use the words Earth and satellite
Mobile Satellite Communications 7
instead of primary and secondary, respectively, to emphasize the applicationof Kepler’s laws to satellite systems.
1.2.1 Kepler’s first lawKepler’s first law states that when a satellite rotates around the Earth, itsrotating path is on an ellipse, with the Earth on one of the two focal pointsof that ellipse. If we denote the semimajor axis and the semiminor axis ofthe ellipse by ra and rp, respectively (Figure 1.2), then the eccentricityparameter, e, can be defined as
e =√ra
2 − rp2
ra(1.1)
The semimajor axis and the eccentricity are the two orbital parame-ters in satellite communications systems. Note that in the case of e = 0,the orbit becomes circular. The point in the orbit where the satellite isclosest to the Earth is called the perigee, and the point where the satelliteis farthest from the Earth is called the apogee. Therefore, the semimajorand semiminor axes sometimes are referred to as the apogee radius andthe perigee radius, respectively.
1.2.2 Kepler’s second lawKepler’s second law states that in equal time intervals, a satellite willsweep out equal areas in its orbital plane. For example, Figure 1.2 showsthat the satellite sweeps out the equal areas indicated by a1 and a2. If wedenote the average velocity of the satellite during its sweeping of areasa1 and a2 by V1 (m/sec) and V2 (m/sec), respectively, it is obvious thatV2 < V1. Using this law, we will show later that a GEO should becircular, not elliptical. Kepler’s second law also states that if a satellite isfar from the Earth, there is a longer time during which the satellite isvisible from the viewpoint of a specific object on the Earth.
1.2.3 Kepler’s third lawDifferent from the first and second laws, Kepler’s third law providesmore mathematical facilities. Kepler’s third law states that there is a
8 Low Earth Orbital Satellites for Personal Communication Networks
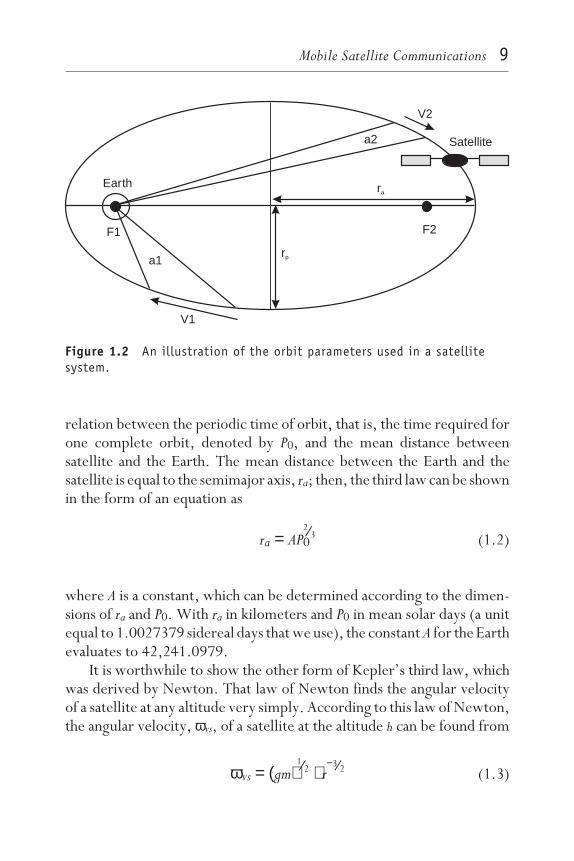
relation between the periodic time of orbit, that is, the time required forone complete orbit, denoted by P0, and the mean distance betweensatellite and the Earth. The mean distance between the Earth and thesatellite is equal to the semimajor axis, ra; then, the third law can be shownin the form of an equation as
ra = AP02⁄3 (1.2)
where A is a constant, which can be determined according to the dimen-sions of ra and P0. With ra in kilometers and P0 in mean solar days (a unitequal to 1.0027379 sidereal days that we use), the constant A for the Earthevaluates to 42,241.0979.
It is worthwhile to show the other form of Kepler’s third law, whichwas derived by Newton. That law of Newton finds the angular velocityof a satellite at any altitude very simply. According to this law of Newton,the angular velocity, ωvs, of a satellite at the altitude h can be found from
ωvs = (gm)1⁄2 ⋅ r
−3⁄2 (1.3)
Earth
Satellitea2
V2
ra
rp
F2
V1
a1
F1
Figure 1.2 An illustration of the orbit parameters used in a satellitesystem.
Mobile Satellite Communications 9

where (gm)1⁄2 = 631.3482 km
3⁄2/s; g is the gravity constant; m is the massof the Earth; and r is the radius of the satellite orbit, equal to the sum ofaverage equatorial radius of the Earth, R, and the altitude of satellite, h.
Because Kepler’s third law provides a fixed relation between theperiod and the size, it can be used to find, for example, the rotation periodof a satellite that is on a geostationary orbit. It should be noted that (1.2)assumes an ideal situation, one in which the Earth has a perfectly sphericalshape and uniform mass. That equation also assumes that no perturbingforces, such as gravitational forces of the sun and the moon and atmos-pheric drag, are acting on the orbit. The gravitational pulls of the sun andthe moon have a negligible effect on LEO satellites, but they do affectsatellites in geostationary orbit. On the other hand, atmospheric dragaffects mostly satellites on lower orbits and has negligible effect on GEOsatellites.
1.2.4 An example: The geostationary orbit
For an example of an application of Kepler’s laws, consider the evaluationof altitude of the geostationary orbit. We will show that there is only oneorbit in the equatorial plane on which a satellite can rotate around theEarth in a 24-hour period, and that altitude is about 35,780 km.
As mentioned before, a geostationary orbit is the orbit on which asatellite appears stationary relative to any objects on the Earth. When asatellite is on the geostationary orbit, the antennas of ground stations canbe kept pointed to the satellite automatically, because the Earth is rotatingwith the same period as the satellite. That makes the tracking process forantennas simple.
For a satellite to be stationary with the rotation of the Earth, it is notenough only to have a geosynchronous orbit, that is, one that has the sameorbital period as the Earth’s spin period. A satellite on any geosynchro-nous orbit with some inclination other than zero would appear to movein a figure-eight pattern when viewed from a fixed location on the Earth[1]. (The inclination angle is the angle at which a satellite orbit is tiltedrelative to the Earth’s equator. That is, it is the angle between the orbitalplane and the Earth’s equatorial plane.) On the other hand, to have the
10 Low Earth Orbital Satellites for Personal Communication Networks

constant angular velocity for a satellite the same as that of the Earth,Kepler’s second law requires a circular orbit. Therefore, a geostationaryorbit is only a circular orbit in the equatorial plane, that is, with zeroinclination, and has the same orbital period as the Earth.
To find the altitude of the geostationary orbit, we can use Kepler’sthird law. If we denote the altitude of the satellite and the averageequatorial radius of the Earth by h and R, respectively, then for thecircular orbit, we have
ra = rp = R + h (1.4)
It can be shown that [1] for the geostationary orbit P0 defined in (1.2)is equal to 0.9972695. Then, according to the Kepler’s third law, wehave
R + h = 42241 ⋅ (0.99727)2⁄3 (1.5)
which, with h = 6378.14 km, results in an altitude of 35,786 km for thegeostationary orbit. Because (1.4) has only one numerical answer, we cansay that there is only one geostationary orbit for the Earth that is in theequatorial plane. Any other orbit at some inclination other than zerocould not to be referred to as a geostationary orbit.
The fact of having only one geostationary orbit emphasizes that itshould be used efficiently. As for any two successive satellites on GEO,there should be enough spacing to avoid physical collisions betweensatellites, there is a limitation on the number of geostationary satellites.Currently, there are hundreds of geostationary satellites that belong todifferent countries. The available frequency spectrum assigned to GEOsatellite systems is a more important limitation for these systems. Thetwo limitations imposed by the problems of frequency spectrum utiliza-tion and space utilization can be considered as reasons for launchingsatellites to orbits other than the geostationary orbit.
Mobile Satellite Communications 11
1.3 Mobile satellite communications systems
1.3.1 Orbit selection
1.3.1.1 Problems with geostationary satellitesMuch research has been dedicated to establishing a common, globalstandardization for communications. Satellites are the only means ofproviding coverage to all parts of the globe, even those parts for whichthe communications service is a very expensive or difficult task. There isalways a question on the best Earth orbit constellation that can realize anappropriate global communications service [7]. Unfortunately, satellitesin geostationary orbit could not support all the requirements for futureglobal communications systems, perhaps chief among them being the sizeof terminal required in the next generation of communications systems.A satellite in geostationary orbit has many advantages, such as widecoverage, high-quality and wideband communications, availability formobile communications, and economic efficiency. Also, their synchro-nization with the rotation of the Earth makes the tracking process muchsimpler than the one required for nongeostationary orbits. However,GEO satellites suffer from some disadvantages when compared to otherlower-altitude orbits.
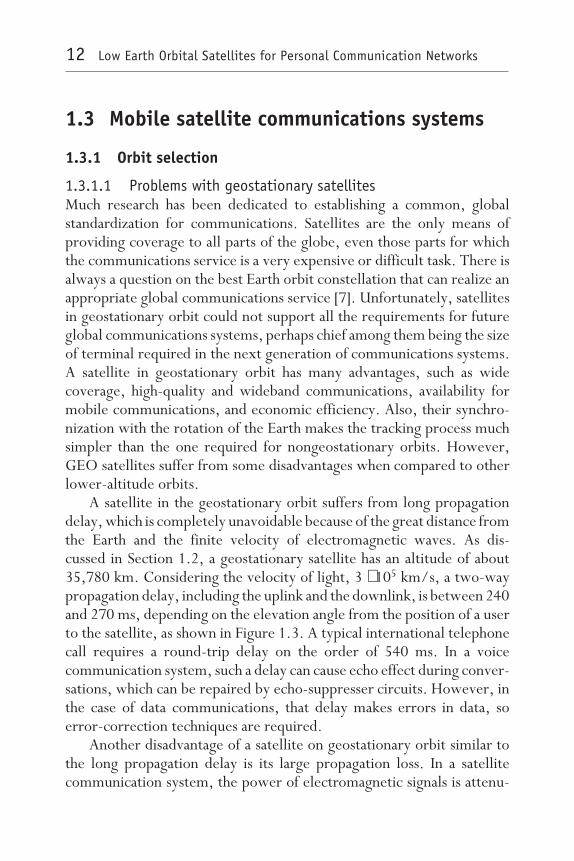
A satellite in the geostationary orbit suffers from long propagationdelay, which is completely unavoidable because of the great distance fromthe Earth and the finite velocity of electromagnetic waves. As dis-cussed in Section 1.2, a geostationary satellite has an altitude of about35,780 km. Considering the velocity of light, 3 ⋅ 105 km/s, a two-waypropagation delay, including the uplink and the downlink, is between 240and 270 ms, depending on the elevation angle from the position of a userto the satellite, as shown in Figure 1.3. A typical international telephonecall requires a round-trip delay on the order of 540 ms. In a voicecommunication system, such a delay can cause echo effect during conver-sations, which can be repaired by echo-suppresser circuits. However, inthe case of data communications, that delay makes errors in data, soerror-correction techniques are required.
Another disadvantage of a satellite on geostationary orbit similar tothe long propagation delay is its large propagation loss. In a satellitecommunication system, the power of electromagnetic signals is attenu-
12 Low Earth Orbital Satellites for Personal Communication Networks

ated with the second power of the distance that the signal propagates. Forexample, if the propagation distance between a transmitter and a receiverbecomes double, we need four times the power level at the transmitterto have the same power level at the receiver. If we think about futurehand-held mobile terminals with limited power supply, that high-powerrequirement will not allow use of a satellite on the geostationary orbit.Even with the current high technologies of batteries and hardware,the smallest terminal for a geostationary satellite is as large as the sizeof an A4 paper and as heavy as 2.5 kg (used in standard mini-M ofINMARSAT-M).
The next fundamental objection to a geostationary satellite is the lackof coverage at far northern and southern latitudes. Because a geostation-ary satellite is flying in the plane of the equator, many areas with high
Elevation Angle (degrees)
Pro
paga
tion
Tim
e(m
sec)
225
235
245
255
265
275
285
0 10 20 30 40 50 60 70 80 90
Figure 1.3 Relationship between elevation angle and propagationdelay in a geostationary satellite system.
Mobile Satellite Communications 13
latitudes require very low angles of elevation to access the satellite.However, experimental measurements have shown that for consistentservice, especially in urban areas, elevation angles as high as 40 degreesare desirable. Such high elevation angles are difficult to achieve withgeostationary satellites even in the capitals of Europe. As we will discusslater, with polar low Earth orbital constellation, those high elevationangles are easily achievable.
These objections to geostationary satellites, along with other prob-lems, such as the high cost of launching a satellite into geostationary orbitand the influence on the space station of an eclipse, suggest the use ofother orbits for mobile satellite communication systems. Especially, it ispossible to have short propagation time and loss (i.e., smaller-size users’terminals), as well as high elevation angles at high latitudes by theconstellation of satellites on LEO or medium Earth orbit (MEO). Althoughwe have only one geostationary orbit and limited space for a constellationof satellites, there are (at least theoretically) an infinite number ofnongeostationary orbits. That gives the satellite system designer muchmore flexibility in network architecture.
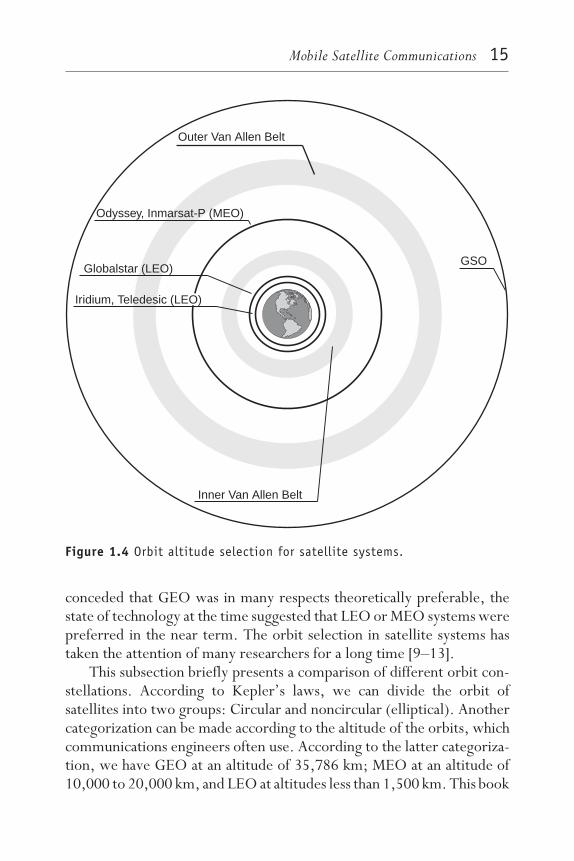
1.3.1.2 Comparison of different orbitsEven though it may seem that the altitude of a satellite can be freelychosen, the existence of two Van Allen radiation belts limits orbitselection. As illustrated in Figure 1.4, the two Van Allen belts arecentered on the Earth’s geomagnetic axis, at altitudes ranging from 1,500to 5,000 km and from 13,000 to 20,000 km. To minimize the radiationdamage to electronic components that would result from a relativelyunshielded, lightweight satellite, as in the case of LEO satellites, it isbetter to put the satellites out of these belts. Extensive ionizing radiationseverely reduces useful satellite life. Many LEO or MEO satellite systemproposals consider the altitude outside these two belts, as are shown inthe figure.
Although serious consideration of LEO satellite systems for commer-cial purpose did not start until the 1990s, even in the early 1960s therewas a comparison study of the merits of GEO versus LEO and MEO [8].In that study, the convenience of GEO was weighed against the practicaldifficulty of attaining it and the inherent technical advantages of LEO,such as less time delay and higher angles of elevation. While it was
14 Low Earth Orbital Satellites for Personal Communication Networks
conceded that GEO was in many respects theoretically preferable, thestate of technology at the time suggested that LEO or MEO systems werepreferred in the near term. The orbit selection in satellite systems hastaken the attention of many researchers for a long time [9–13].
This subsection briefly presents a comparison of different orbit con-stellations. According to Kepler’s laws, we can divide the orbit ofsatellites into two groups: Circular and noncircular (elliptical). Anothercategorization can be made according to the altitude of the orbits, whichcommunications engineers often use. According to the latter categoriza-tion, we have GEO at an altitude of 35,786 km; MEO at an altitude of10,000 to 20,000 km, and LEO at altitudes less than 1,500 km. This book
Outer Van Allen Belt
Inner Van Allen Belt
Odyssey, Inmarsat-P (MEO)
Globalstar (LEO)
Iridium, Teledesic (LEO)
GSO
Figure 1.4 Orbit altitude selection for satellite systems.
Mobile Satellite Communications 15

is concerned with circular orbit satellite systems; hence, we will notdiscuss highly elliptical orbits (HEO), for example proposed in ELLIPSOsystem of Ellipsat.
Figure 1.5 illustrates an approximate comparison of the number ofsatellites for global coverage, relative cost per satellite, and relative costfor launching different proposed satellite system constellations. As it canbe seen from Figure 1.5, as the altitude of the satellites becomes lower,more satellites are required for global coverage. For example, the pro-posed LEO satellite system by Motorola, named IRIDIUM, requires 66satellites for its complete global coverage plan. On the other hand a GEOsatellite system requires only three satellites to cover the Earth.
1
10
100
1,000
100 1,000 10,000 100,000
Required Number of Satellites
Cost per one Satellite (M$)
Launching Cost (M$)
Altitude of the Satellite Orbit (km)
Figure 1.5 Comparison of satellite systems according to their altitudes.
16 Low Earth Orbital Satellites for Personal Communication Networks
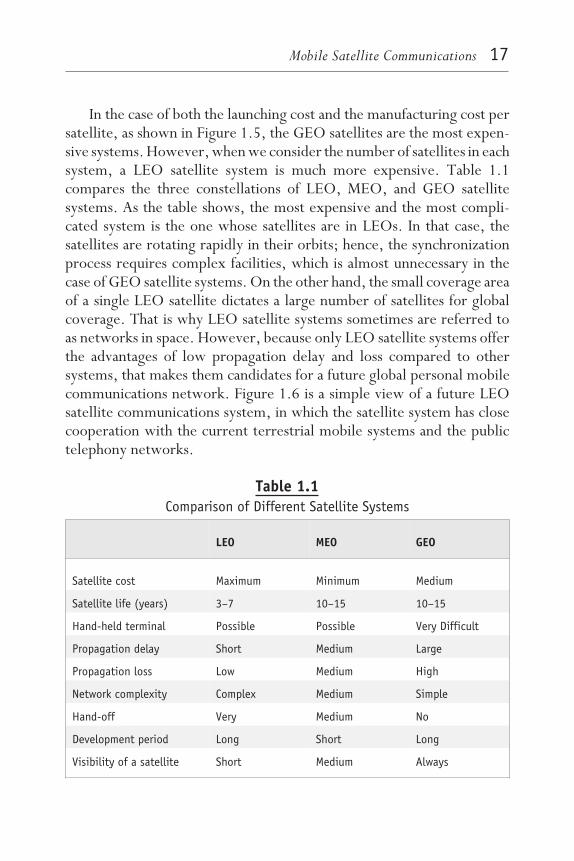
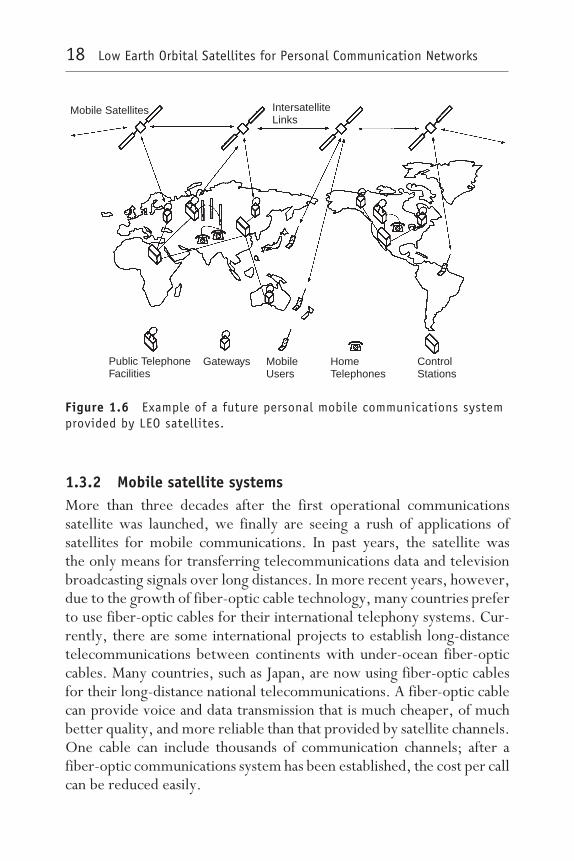
In the case of both the launching cost and the manufacturing cost persatellite, as shown in Figure 1.5, the GEO satellites are the most expen-sive systems. However, when we consider the number of satellites in eachsystem, a LEO satellite system is much more expensive. Table 1.1compares the three constellations of LEO, MEO, and GEO satellitesystems. As the table shows, the most expensive and the most compli-cated system is the one whose satellites are in LEOs. In that case, thesatellites are rotating rapidly in their orbits; hence, the synchronizationprocess requires complex facilities, which is almost unnecessary in thecase of GEO satellite systems. On the other hand, the small coverage areaof a single LEO satellite dictates a large number of satellites for globalcoverage. That is why LEO satellite systems sometimes are referred toas networks in space. However, because only LEO satellite systems offerthe advantages of low propagation delay and loss compared to othersystems, that makes them candidates for a future global personal mobilecommunications network. Figure 1.6 is a simple view of a future LEOsatellite communications system, in which the satellite system has closecooperation with the current terrestrial mobile systems and the publictelephony networks.
Table 1.1Comparison of Different Satellite Systems
LEO MEO GEO
Satellite cost Maximum Minimum Medium
Satellite life (years) 3–7 10–15 10–15
Hand-held terminal Possible Possible Very Difficult
Propagation delay Short Medium Large
Propagation loss Low Medium High
Network complexity Complex Medium Simple
Hand-off Very Medium No
Development period Long Short Long
Visibility of a satellite Short Medium Always
Mobile Satellite Communications 17
1.3.2 Mobile satellite systemsMore than three decades after the first operational communicationssatellite was launched, we finally are seeing a rush of applications ofsatellites for mobile communications. In past years, the satellite wasthe only means for transferring telecommunications data and televisionbroadcasting signals over long distances. In more recent years, however,due to the growth of fiber-optic cable technology, many countries preferto use fiber-optic cables for their international telephony systems. Cur-rently, there are some international projects to establish long-distancetelecommunications between continents with under-ocean fiber-opticcables. Many countries, such as Japan, are now using fiber-optic cablesfor their long-distance national telecommunications. A fiber-optic cablecan provide voice and data transmission that is much cheaper, of muchbetter quality, and more reliable than that provided by satellite channels.One cable can include thousands of communication channels; after afiber-optic communications system has been established, the cost per callcan be reduced easily.
Mobile Satellites IntersatelliteLinks
Public TelephoneFacilities
Gateways MobileUsers
HomeTelephones
ControlStations
Figure 1.6 Example of a future personal mobile communications systemprovided by LEO satellites.
18 Low Earth Orbital Satellites for Personal Communication Networks

Although fiber-optic cables can provide cheap telecommunicationsfor high-traffic, fixed applications worldwide, for mobile communica-tions they would not be useful. Moreover, even for some fixed applica-tions, establishment of fiber-optic systems in rural areas with lowcommunication traffic, such as in small towns, is not economical. Formobile communications as well as communications in isolated areas,wireless systems, especially satellite wireless systems, will be around fora long time.
Mobile communications with satellites can be put into two differentcategories according to the satellite constellations. In communicationswith GEO satellites, because the satellites are synchronized with theEarth, mobile communication includes the communication of physicallymobile objects through satellites. However, with satellites that are not insynchronization with the Earth, such as satellites in nongeostationaryorbits, mobile communications can include both fixed and mobile objectson the Earth through those satellites. Note that with a typical value ofh = 1,500 km in a LEO satellite system, the satellite has a linear groundspeed of about 7.1 km/s, not comparable to the speed of any object ofthe Earth. Therefore, any mobile or fixed terminal on the Earth can beassumed to be a fixed object in a LEO satellite system.
The anticipated global cellular and paging market size through thenext century will mandate satellites for mobile communication. It isanticipated that by the year 2000 the number of global mobile phones andpagers will be more than 140 million each. Satellite systems are the onlymeans for supporting such a large number of terminals. LEO satellites,especially, will play a major role in preparing the communications indus-try for the 21st century.
The following subsections describe some mobile satellite communi-cations systems currently under operation. These systems use GEOsatellites; hence, their mobile terminals still are too large and too heavyto be considered for future global PCNs. We also examine some of theproposals that use satellites in lower orbits. Generally, LEO satellitesystems have been categorized into two groups: “big-LEO” and “little-LEO,” according to the payload of the satellites, their frequency bands,and the variety of services they provide. Simply said, big-LEO systemshave larger capacity and voice transmission, whereas little-LEO systemshave less capacity and limited nonvoice services. Because LEO satellite
Mobile Satellite Communications 19
systems are still under development, interested readers can get moreupdated information on each system in publications from the satellitecompanies. The information provided in this chapter is given only tointroduce the high-speed progress in LEO satellite communications sys-tems, commercially started just in the current decade. It is noteworthythat in the less than 10 years since 1990, in the United States alone, 17companies have filed applications or announced plans to develop satellitesystems in nongeostationary orbits. Some analysts project that by theyear 2000 there will be 813 small satellites in nongeostationary orbits,increasing to 1,322 satellites by the year 2005. A detailed discussion ofthe regulatory issues for the new age of satellite systems can be foundin [14].
1.3.2.1 Mobile satellite systems in operationThe beginning of the first generation of mobile satellite communicationssystems (sometimes referred to as mobile satellite services, or MSS) wassignaled by the start of service of INMARSAT, in 1982. INMARSATstands for INternational MARitime telecommunication SATellite organ-ization and is a GEO satellite system using L-band (1.5–1.6 GHz)mostly to provide different services to ships. In the first generation ofMSS, INMARSAT defined five standards: standard A (1982), standard B(1993), standard C (1991), standard M (1992/1993), and aeronauticalstandard (1992). All these standards considered different services world-wide, including voice, facsimile, and data. INMARSAT A and B aremostly considered the service to ships, and INMARSAT C is planned toservice to small crafts, fishing boats, and land mobiles. The standardaeronautical service is a bit different from others because it considers theservice to commercial and private aircraft. The weight of INMARSATterminals in its different standards ranges between 25 kg in standard A tothe lightest one in standard C, about 5 kg. In 1996, there were about71,900 INMARSAT terminals around the world; more than one-third ofthem maritime terminals using standard A.
For the first generation of mobile satellite communications, we alsocan consider other systems such as QUALCOMM, started in 1989and servicing North America; ALCATEL QUALCOMM, in 1991 forEurope; and the Japanese system NASDA, in 1987 for their nationalservices.
20 Low Earth Orbital Satellites for Personal Communication Networks
Around 1995, the second generation of MSS was started to reducethe size and the cost of user terminals, and also internetworking withterrestrial systems. In this generation, INMARSAT defined its mini-Mstandard in 1995 with worldwide voice, data, facsimile, and telex servicesat a 2.4-Kbps data rate. This standard is realized by its small terminals,laptop size and weighing 2.5 kg. In 1996, mini-M had 150 users. AmericanMobile Satellite Corporation (AMSC), NSTAR of Japan, European mobilesatellite (EMS), and OPTUS of Australia are other satellite systemsincluded in the second generation of MSS.
Detailed descriptions of those GEO-based mobile satellite commu-nication systems, with either global or continental service, can be foundin some literature [9,10]. The two-decade age of these GEO satellitesystems shows that, although their services are acceptable for maritimeand aeronautical purposes, they are not good candidates for futurepersonal communication systems. Future personal communication sys-tems will require very small, light users’ terminals, similar to the onesnow used in cellular systems, which is not expected to be realizable inthose GEO systems. The need for such small terminals should be foundthrough nongeostationary orbits, especially the LEOs.
1.3.2.2 Little-LEO mobile satellite systemsLittle-LEO mobile satellite systems are a category of LEO systems thatutilize satellites of small size and low mass for low-bit-rate applicationsunder 1 Kbps. The Federal Communications Commission (FCC) has allocatedfrequency bands of 137–138 MHz for downlinks and 148–149.9 MHzfor uplinks to these systems, which is a heavily utilized spectrum world-wide for private and government services. Now three organizations havereceived their licenses, namely, Orbital Communications Corporation(ORBCOMM), with 36 satellites at the altitude of 775 km; Volunteers inTechnical Assistance (VITASAT); and STARNET, with 24 satellites at thealtitude of 1,000 km. Several others have proposed systems.ORBCOMM has a national service plan in the United States, and bothVITASAT and STARNET have global services. The mass of satellites inthese systems ranges from 40 kg in ORBCOMM to 150 kg in STARNET.Nonvoice two-way messaging and positioning with low-cost transceiv-ers, which would be equipped with alphanumeric displays, are the majorcharacteristics of these systems.
Mobile Satellite Communications 21

Little-LEO satellite systems prefer a spectrum below 1 GHz, becauseit enables the use of lower cost transceivers; however, that spectrum isheavily utilized worldwide. Little-LEO proponents are continuing towork with regulatory offices to identify suitable frequency bands forfuture use, but it is not likely that such frequencies would be available ona global basis.
1.3.2.3 Big-LEO mobile satellite systemsAnother category for LEO satellite systems is the so-called big-LEOsatellite systems. Compared to the little-LEO systems, satellites in big-LEO systems are expected to be bigger and to have more power andbandwidth to provide different services to their subscribers. Those serv-ices may include voice, data, facsimile, and radio determination satelliteservices (RDSS). Big-LEO systems will use the underutilized spectrumavailable in the L-band, because of the commercial failure of the proposedRDSS systems. Currently, the frequency spectra of 1610–1626.5 MHzfor uplinks and 2483.5–2500 MHz for downlinks are assigned to thesesystems. It is interesting to note that, although the names of these systemsinclude LEO, their frequencies are the ones usually utilized in MEO andGEO satellite systems.
Most of the proposed big-LEO systems would offer global service tohand-held terminals by the means of satellites on lower altitudes movingvery fast instead of a fixed point in the sky, as for GEO satellite systems.The bigger size of the satellites in these systems enables them to have morecomplex data-processing facilities in the satellite than the simple store-and-forward feature of satellites in little-LEO systems. An importantparameter in the development of these systems is their internetworkingwith terrestrial systems and, especially, dual-mode terminals. That makesthe system more economical in different parts of the globe and also moreflexible to handle increasing traffic loads in future.
Several big-LEO systems are being proposed. Some of the moreimportant systems are described here. Interested readers are referred tomore detailed descriptions of these systems [15–19].
IRIDIUM Motorola proposed its big-LEO satellite system, IRIDIUM, forglobal coverage and a variety of services, including voice (full-duplex,
22 Low Earth Orbital Satellites for Personal Communication Networks
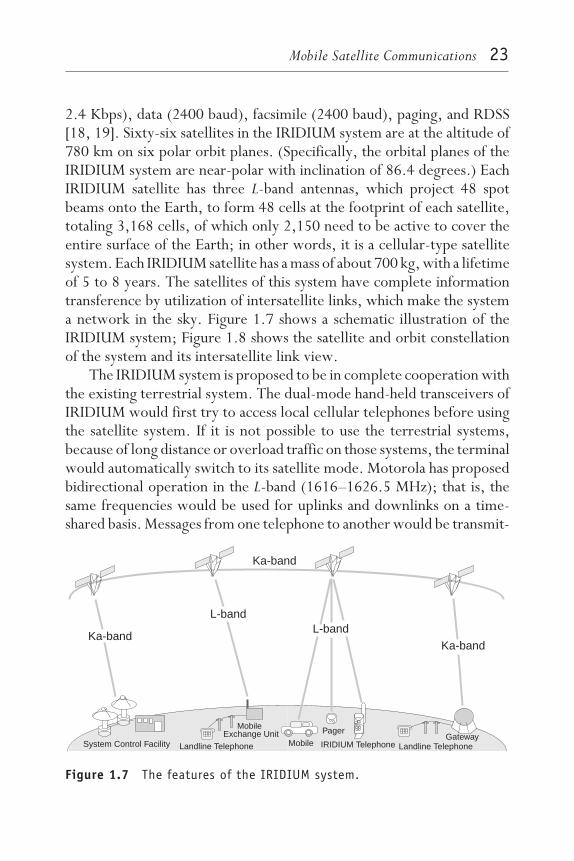
2.4 Kbps), data (2400 baud), facsimile (2400 baud), paging, and RDSS[18, 19]. Sixty-six satellites in the IRIDIUM system are at the altitude of780 km on six polar orbit planes. (Specifically, the orbital planes of theIRIDIUM system are near-polar with inclination of 86.4 degrees.) EachIRIDIUM satellite has three L-band antennas, which project 48 spotbeams onto the Earth, to form 48 cells at the footprint of each satellite,totaling 3,168 cells, of which only 2,150 need to be active to cover theentire surface of the Earth; in other words, it is a cellular-type satellitesystem. Each IRIDIUM satellite has a mass of about 700 kg, with a lifetimeof 5 to 8 years. The satellites of this system have complete informationtransference by utilization of intersatellite links, which make the systema network in the sky. Figure 1.7 shows a schematic illustration of theIRIDIUM system; Figure 1.8 shows the satellite and orbit constellationof the system and its intersatellite link view.
The IRIDIUM system is proposed to be in complete cooperation withthe existing terrestrial system. The dual-mode hand-held transceivers ofIRIDIUM would first try to access local cellular telephones before usingthe satellite system. If it is not possible to use the terrestrial systems,because of long distance or overload traffic on those systems, the terminalwould automatically switch to its satellite mode. Motorola has proposedbidirectional operation in the L-band (1616–1626.5 MHz); that is, thesame frequencies would be used for uplinks and downlinks on a time-shared basis. Messages from one telephone to another would be transmit-
Ka-band
Ka-band
L-bandL-band
Ka-band
System Control Facility Landline Telephone Landline TelephoneGateway
IRIDIUM Telephone
Pager
Mobile
MobileExchange Unit
Figure 1.7 The features of the IRIDIUM system.
Mobile Satellite Communications 23

ted from the hand-held unit to the satellite and then transmitted fromsatellite to satellite using Ka-band (23.18–23.38 GHz) intersatellite linksuntil the satellite viewing the destination telephone is reached. Thissystem also has gateway/telemetry, tracking, and control links workingat 19.4–19.6 GHz (downlinks) and 29.1–29.3 GHz (uplinks) again onKa-band, as shown in Figure 1.7. IRIDIUM satellites have on-boardprocessing facilities that can demodulate a signal, read addresses, androute signals directly to one of the four adjacent satellites: two in the sameorbit (north-south) and one in each adjacent (east-west) orbit via inter-satellite crosslinks.
The IRIDIUM system uses time division multiple access (TDMA) as themultiple access scheme and time division multiplexing (TDM). The connec-
Figure 1.8 Satellite and orbit constellation for the IRIDIUM systemand the intersatellite links in that system.
24 Low Earth Orbital Satellites for Personal Communication Networks
tions to the terrestrial telephone network would be via gateway Earthstations that could be regional or even in each country, as shown inFigure 1.7. IRIDIUM is the only big-LEO system that has on-boardprocessing with switching via cross-links. It also is the only system thatuses TDM, so only one band (1616.0–1626.5) is used for both uplinkand downlink communications. The major problem in development ofthis system would be the difficulty in synchronization of its TDMA framesduring the fast motion of satellites at the altitude of 780 km.
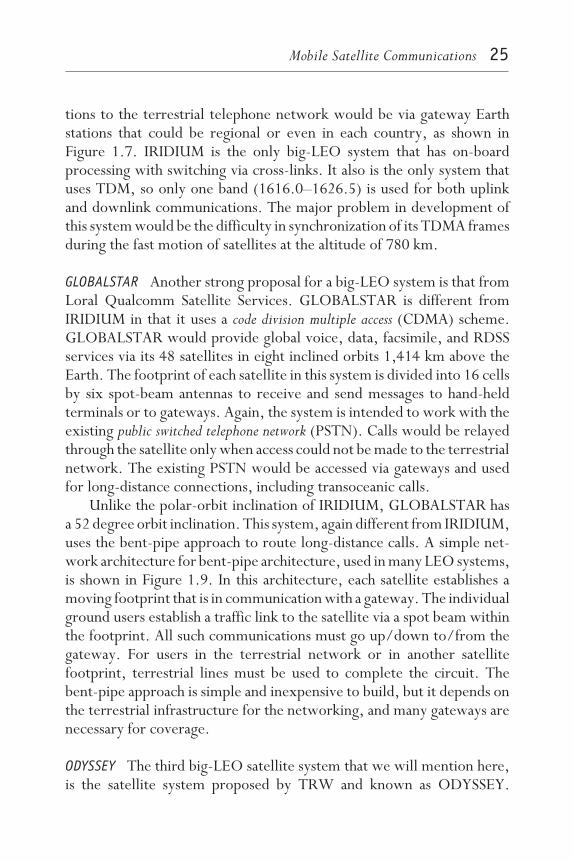
GLOBALSTAR Another strong proposal for a big-LEO system is that fromLoral Qualcomm Satellite Services. GLOBALSTAR is different fromIRIDIUM in that it uses a code division multiple access (CDMA) scheme.GLOBALSTAR would provide global voice, data, facsimile, and RDSSservices via its 48 satellites in eight inclined orbits 1,414 km above theEarth. The footprint of each satellite in this system is divided into 16 cellsby six spot-beam antennas to receive and send messages to hand-heldterminals or to gateways. Again, the system is intended to work with theexisting public switched telephone network (PSTN). Calls would be relayedthrough the satellite only when access could not be made to the terrestrialnetwork. The existing PSTN would be accessed via gateways and usedfor long-distance connections, including transoceanic calls.
Unlike the polar-orbit inclination of IRIDIUM, GLOBALSTAR hasa 52 degree orbit inclination. This system, again different from IRIDIUM,uses the bent-pipe approach to route long-distance calls. A simple net-work architecture for bent-pipe architecture, used in many LEO systems,is shown in Figure 1.9. In this architecture, each satellite establishes amoving footprint that is in communication with a gateway. The individualground users establish a traffic link to the satellite via a spot beam withinthe footprint. All such communications must go up/down to/from thegateway. For users in the terrestrial network or in another satellitefootprint, terrestrial lines must be used to complete the circuit. Thebent-pipe approach is simple and inexpensive to build, but it depends onthe terrestrial infrastructure for the networking, and many gateways arenecessary for coverage.
ODYSSEY The third big-LEO satellite system that we will mention here,is the satellite system proposed by TRW and known as ODYSSEY.
Mobile Satellite Communications 25

ODYSSEY would provide global voice, data, facsimile, and RDSS serv-ices via its 12 satellites on three orbits of 10,354 km altitude. Though thataltitude would be considered a MEO, according to frequency spectrumused by this system, it can be included in the big-LEO category. TheODYSSEY system would employ dynamically steerable satellite antennasto provide global coverage principally to land masses and the coastal areasof the world. As the satellites move over the Earth, the antenna beamswould be steered to keep the satellite footprint stationary. The system isintended to work on a complementary basis with the existing terrestrialtelephone systems, including cellular telephones. Orbit inclination of thissystem is 50 degrees. The multiple access scheme for this system is alsoCDMA with frequency division duplexing. ODYSSEY considers 37 spotbeams in each satellite footprint.
ARIES Constellation Communications Inc. has proposed a LEO satellitesystem, named ARIES, that would provide global voice, data, facsimile,and RDSS. This system would consist of 48 satellites in four polar planesat an altitude of 1,020 km. Each ARIES satellite would have seven antenna
Satellite -thjSatellite -thi
Terrestrial LineGateway Gateway
User's TerminalUser's Terminal
Figure 1.9 An example of the bent-pipe network architecture used inmany LEO satellite systems.
26 Low Earth Orbital Satellites for Personal Communication Networks

beams to enable the system to provide global coverage. Hand-heldterminal or vehicular transceiver units coupled to the satellites andgateway stations would provide interconnections to public or privateterrestrial telephone networks.
1.3.2.4 Other mobile satellite systemsSeveral other LEO satellite systems have been proposed. One is thesatellite system proposed by the European Space Agency (ESA) calledLEONET. This system has 15 satellites on three orbits of 54 degreesinclination and 37 spot beams in each satellite footprint. The altitude ofthe satellites would be 6,390 km, that is, in the first Van Allen belt; hence,severe shielding would be required for each satellite’s body.
INMARSAT proposed its intermediate circular orbit (ICO) system,which is a MEO satellite system, with 12 satellites on the 45 degree orbitinclination at an altitude of 10,400 km. ICO has been proposed withTDMA and frequency division duplexing (FDD) as multiple access and du-plexing, respectively. This system also utilizes the bent-pipe architecture.
Another system, proposed by Ellipsat, is ELLIPSO. The systemwould provide voice, data, facsimile, and RDSS via its 15 satellites inelliptical inclined orbits and up to nine satellites in equatorial circularorbits with a maximum altitude of 7,800 km. The satellite system wouldprovide coverage of the entire northern hemisphere and of the southernhemisphere up to 50 degrees south latitude. The elliptical orbit satelliteswould spend a greater proportion of their orbital periods over thenorthern latitudes. This orbital strategy would provide greater servicecapability to the areas having the greater land masses, the larger popula-tions, and potentially the larger markets for services. ELLIPSO is alsoplanned to cooperate with the terrestrial PSTN.
1.4 SummaryThis chapter discussed the unavoidable role of satellites in long-distancecommunications. It briefly introduced the fundamental dynamics ofsatellite systems and discussed the advantages and disadvantages of asatellite on a geostationary orbit. It also examined the need for employing
Mobile Satellite Communications 27
satellites on nongeostationary orbits in future personal communicationsystems.
The chapter reviewed the features of the most important mobilesatellite communications systems for both geostationary and nongeosta-tionary orbits. The systems described here, in addition to several othersnot mentioned, are evidence of the fact that the LEO satellite system isnot a dream. Although in many features, such as synchronization withground users and gateways, the LEO systems require much more com-plexity, their unique features of low propagation delay and loss and widecoverage area by each satellite are what future PCNs will require. Muchresearch recently has been done on LEO satellite systems to show theirimportant role in the future communications systems [20–37].
References[1] Roddy, D., Satellite Communications, Englewood Cliffs, NJ: Prentice-Hall, 1989.
[2] Williamson, M., The Communications Satellite, Bristol and New York: AdamHilger, 1990.
[3] Jansky, D. M., and M. C. Jeruchim, Communication Satellites in the GeostationaryOrbit, Norwood, MA: Artech House, 1987.
[4] Elbert, B. R., Introduction to Satellite Communication, Norwood, MA: ArtechHouse, 1987.
[5] Pritchard, W. L., H. G. Suyderhoud, and R. A. Nelson, Satellite CommunicationSystems Engineering, 2nd ed, Englewood Cliffs, NJ: Prentice-Hall, 1993.
[6] Miya, K., et al., Satellite Communications Technology, 2nd ed, Tokyo: KDDEngineering and Consulting, 1985.
[7] Adams, W. S., and L. Rider, “Circular Polar Constellations ProvidingContinuous Single or Multiple Coverage Above a Specified Latitude,”J. Astronaut. Sci., Vol. 35, 1987.
[8] Pritchard, W. L., “Criteria for the Choice of Synchronous or Medium-AltitudeSystems,” IEEE Trans. Commun. Syst., Vol. CS-12, No. 2, 1964, pp. 131–137.
[9] Global Mobile Communications Systems Under Development, Washington, DC:Washington Business, Oct. 18, 1993.
[10] Wu, W. W., et al., “Mobile Satellite Communications,” Proc. IEEE, Vol. 82,No. 9, 1994, pp. 1431–1448.
28 Low Earth Orbital Satellites for Personal Communication Networks

[11] Ananasso, F., and F. D. Priscoli, “The Role of Satellites in PersonalCommunication Services,” IEEE J. Select. Areas Commun., Vol. 13, No. 2, 1995,pp. 180–196.
[12] Vatalaro, F., et al., “Analysis of LEO, MEO, and GEO Global Mobile SatelliteSystems in the Presence of Interference and Fading,” IEEE J. Select. AreasCommun., Vol. 13, No. 2, 1995, pp. 291–300.
[13] Katayama, M., and N. Morinaga, “Technical Feasibility of CommunicationSystems Using Non-Geostationary Satellites,” Proc. IEICE Joint Conference ofCommunication Network, Signal, and System,1990, pp. 211–215.
[14] Abeshhouse Stern, J., “Small Satellites: Worldwide Developments and Trendsin Communications and Remote Sensing,” Tech. Report of IEICE, SANE96-60,October 1996, pp. 23–49.
[15] M. Werner, M., et al., “Analysis of System Parameters for LEO/ICO-SatelliteCommunication Networks,” IEEE J. Select. Areas Commun., Vol. 13, No. 2,1995, pp. 371–381.
[16] Pickholtz, R. L., “Communications by Means of Low Earth OrbitingSatellites,” Modern Radio Science 1996, J. Hamelin, ed., Oxford SciencePublications, U.R.S.I, pp. 133–149.
[17] Hatlelid, J. E., and D. E. Sterling, “A Survey of Small Spacecraft inCommercial Constellations,” Proc. AIAA/Utah State University Conf. SmallSatellites, Utah, Aug. 1991, pp. 2–7.
[18] Grubb, J. L., “The Traveler’s Dream Come True,” IEEE Commun. Mag.,No. 11, 1991, pp. 48–51.
[19] Leopald, R. J., “The Iridium Communication System,” Proc. SingaporeICCS/ISITA ’92, Singapore, 1992, pp. 451–455.
[20] Usui, T., et al., “Satellite Constellations for a Multiple LEO SatellitesNetworks,” IEICE Trans., Vol. J75-A, No. 8, 1992, pp. 1370–1378.
[21] Kaniyil, J., et al., “A Global Message Network Employing Low Earth-OrbitingSatellites,” IEEE J. Select. Areas Commun., Vol. 10, No. 2, 1992, pp. 418–427.
[22] Chakraborty, D., “Survivable Communication Concept via Multiple LowEarth-Orbiting Satellites,” IEEE Trans. Aeroso. Electron. Syst., Vol. 25, No. 6,1989, pp. 879–889.
[23] Katayama, M., and A. Ogawa, “A Study of the Communication Systems WithSmall Satellites,” Proc. 4th Symp. Small Satellites, Tokyo, Japan, 1992, pp. 27–34.
[24] Ganz, A., Y. Gong, and B. Li, “Performance Study of Low Earth-OrbitSatellite Systems,” IEEE Trans. Commun., Vol. 42, No. 2/3/4, 1994,pp. 1866–1871.
Mobile Satellite Communications 29
[25] Katayama, M., A. Ogawa, and N. Morinaga, “Satellite CommunicationSystems With Low Earth Orbits and the Effects of Doppler Shift,” IEICE Trans.Commun., Vol. J76B-II, No. 5, 1993, pp. 382–390.
[26] Katayama, M., and N. Morinaga, “A Study of the Communication SystemsUsing the Low-Altitude Nongeostationary Satellites,” Proc. IEEE Int. Conferenceon Systems Engineering, Kobe, Japan, 1992, pp. 452–456.
[27] Hashimoto, Y., et al., “A Study on a LEO Satellite Communication System forExperimental,” Proc. 4th Symp. on Small Satellites, Tokyo, 1992, pp. 41–43.
[28] Hu, L-R., and S. S. Rappaport, “Personal Communication Systems UsingMultiple Hierarchical Cellular Overlays,” IEEE J. Select. Areas Commun., Vol. 13,No. 2, 1995, pp. 406–415.
[29] Viterbi, A. J., “A Perspective on the Evaluation of Multiple Access SatelliteCommunication,” IEEE J. Select. Areas Commun., Vol. 10, No. 6, 1992,pp. 980–983.
[30] Bulloch, C., “The European Mobile Satellite Arena—INMARSAT, ALCATEL,QUALCOMM, and ESA,” Via Satellite, Sept. 1992.
[31] Jamalipour, A., et al., “Signal-to-Interference Ratio of CDMA in LowEarth-Orbital Satellite Communication Systems With Nonuniform TrafficDistribution,” Proc. IEEE GLOBECOM Conf., San Francisco, CA, 1994,pp. 1748–1752.
[32] Jamalipour, A., et al., “Performance of an Integrated Voice/Data System inNonuniform Traffic Low Earth-Orbit Satellite Communication Systems,”IEEE J. Select. Areas Commun., Vol. 13, No. 2, 1995, pp. 465–473.
[33] Jamalipour, A., et al., “Throughput Analysis of Spread-Slotted Aloha in LEOSatellite Communication Systems With Nonuniform Traffic Distribution,”IEICE Trans. Commun., Vol. E78-B, No. 12, 1995, pp. 1657–1665.
[34] Jamalipour, A., et al., “A Modified Power Control Scheme for Remedying theEffects of Traffic Nonuniformity in LEO Satellite Communications Systems,”International J. Wireless Information Networks, Vol. 3, No. 1, 1996, pp. 29–39.
[35] Jamalipour, A., et al., “Transmit Permission Control on Spread Aloha Packetsin LEO Satellite Systems,” IEEE J. Select. Areas Commun., Vol. 14, No. 9, 1996,pp. 1748–1757.
[36] Jamalipour, A., et al., “Adaptive Transmit Permission Control onSpread-Slotted Aloha Packets Applicable in LEOS Systems,” IEICE Trans.Commun., Vol. E79-B, No. 3, 1996, pp. 257–265.
[37] Jamalipour, A., and A. Ogawa, “Traffic Characteristics of LEOS-Based GlobalPersonal Communications Networks,” IEEE Commun. Mag., Vol. 35, No. 2,1997, pp. 118–122.
30 Low Earth Orbital Satellites for Personal Communication Networks

Selected bibliographyBate, R. R., D. D. Mueller, and J. E. White, Fundamentals of Astrodynamics, NewYork: Dover Publications, 1971.
Jansky, D. M., and M. C. Jeruchim, Communication Satellites in the GeostationaryOrbit, Norwood, MA: Artech House, 1987.
Jensen, J., et al., Design Guide to Orbital Flight, New York: McGraw-Hill, 1962.
Miller, M. J., B. Vucetic, and L. Berry, eds., Satellite Communications: Mobile andFixed Services, Boston: Kluwer Academic Publishers, 1993.
“Mobile Satellite Communications for Seamless PCS,” special issue of IEEE J. Select.Areas Commun., Vol. 13, No. 2, Feb. 1995.
Pelton, J. N., and W. W. Wu, “The Challenge of 21st Century SatelliteCommunications: INTELSAT Enters the Second Millennium,” IEEE J. Select. AreasCommun., Vol. 5, No. 4, May 1987, pp. 571–591.
Pratt, T., and C. W. Bostian, Satellite Communications, New York: Wiley, 1986.
Mobile Satellite Communications 31

Low Earth Orbital Satellites for Personal Communication NetworksCommunications with LEO Satellites
2Communications with
LEO Satellites
T in Chapter 1 of different mobile satellite commu-nication systems, and the disadvantages of geostationary satellitesystems, make it clear that for future global PCNs utilizing very small
hand-held terminals LEO satellites have a special position over othersystems. This chapter examines LEO satellite systems and their specifi-cations, including some practical, systematic problems with the LEOsatellite systems and possible solutions.
Section 2.1 discusses some preliminary issues in the design of globalLEO satellite systems. We start with the calculations of the number ofsatellites and the number of orbits required for a global coverage. Wecompare our numerical results to the ones specified in the proposals ofLEO satellite systems and show how some of those designs assign someredundancies in their systems. Because the LEO satellites are in a con-tinuous relative motion with the Earth, it would be necessary to change
33
the connection of a user to different satellites, a procedure referred to ashand-off. The issue of intersatellite links, proposed, for example, in theIRIDIUM system, follow the discussion of hand-off. Intersatellite linksmay reduce the costs for terrestrial public telephony networks and makea satellite system completely independent of the ground facilities. More-over, those links can make the communications system much morereliable in cases of disasters on the Earth, such as earthquakes. Suchlinkage is not, however, essential; many systems do not include it in theirproposals, in order to reduce the total cost of their systems. The issuesof the partitioning of satellites’ footprints by spot-beam antennas and theDoppler shift effects in LEO satellite systems also are discussed inSection 2.1. The arrangement of spot beams is a new issue in satellitesystems, which is opposite to the advantage of the wide coverage areaoften mentioned in satellite literature. The Doppler shift effect is adisadvantage for LEO satellite systems; their fast movement makes net-work control difficult.
Section 2.2 explains two issues in the implementation of LEO satellitesystems. The first issue is the selection of a multiple-access schemeappropriate for LEO satellite systems. We discuss a group of multiple-access schemes and their possibilities for employment in a LEO satellitesystem. Two new and interesting multiple-access schemes—code divi-sion multiple access and spread-slotted Aloha—are introduced, and thereasons for employing those schemes are discussed. The selection of anefficient multiple-access scheme is an important issue in any wirelesscommunications systems faced with large numbers of users utilizing acommon channel. The second issue is the problem of geographical trafficnonuniformity, which does not affect conventional geostationary satellitesystems, just LEO satellite systems [1,2]. Geographical traffic nonunifor-mity is an important problem, and ignoring it during system design leadsto incorrect and unreliable system expectations.
Section 2.3 introduces some concepts for LEO satellite system mod-els suitable for analysis of the performance of such systems. In particular,we define the different areas considered in LEO satellite systems, includ-ing service area, coverage area, and interference area. A useful model fora LEO satellite system should contain sufficient information necessary foranalyzing the performance of the system and should be as simple aspossible for mathematical tractability. The model should be competent
34 Low Earth Orbital Satellites for Personal Communication Networks
with the realistic model of the LEO satellite systems, which often is verycomplicated. This chapter introduces a simple LEO satellite systemmodel and shows how that simple satellite system model can offer almostthe same qualitative characteristics as the complicated real system modelwith simpler mathematics.
2.1 Preliminary issues in LEO satellite systemsThe design of a satellite system is a complicated, difficult task. It takesseveral years to design different parts of a system. A wide variety ofengineers from many fields are involved in the design process, and for asatellite system for communications purposes electrical engineers areincluded in only one of those fields. Even that one field, a wide varietyof electrical engineers are involved in different aspects of system design,such as electronics engineers for designing the power supply and elec-tronic equipment, antenna engineers for designing transponder and wavepropagation processing, and system and network engineers for the designof protocols, access schemes, and so on. Because this book is from anelectrical engineering viewpoint, many issues not related to the electricalaspects of satellite systems cannot be discussed here. Even many subjectsrelated to communications, for example, antenna gain, are not discussedin details here. Readers are referred to other books about such issues.
In addition to the difficulties in the design of general satellite systems,in the case of LEO satellite systems, a number of new problems occur.This section briefly discusses some primary design issues for thesesystems.
2.1.1 Required number of LEO satellites and orbitsIt is obvious that a satellite at a higher altitude can provide wider coveragethan one at a lower altitude. Chapter 1 mentioned that a geostationarysatellite can cover about one-third of the globe; therefore, three satellitesare sufficient for a global coverage. A LEO satellite system, on the otherhand, requires tens of satellites for global coverage. In this section, wecalculate the expected number of satellites and orbits for global coverage.
To calculate these parameters, assume a single satellite, as illustratedin Figure 2.1. Any location on the Earth can be seen from a satellite by
Communications with LEO Satellites 35

an angle, the elevation angle, denoted by θ. A minimum value of thatangle, denoted by θmin, defines the limits of the service area of a satellite.Because of the spherical shape of the Earth and natural obstacles, such asmountains, any location with an elevation angle less than θmin cannot beeasily seen from the satellite, so a reliable communication cannot berealized in very low elevation angles. For a single satellite, the circularfootprint of the satellite as its service area, which means that any userlocated in the spherical segment of the Earth under the elevation angle ofθmin can be serviced by the satellite. The actual limits of the service area
Center of the Earth
R
θmin
α α
R
hSubsatellite Point
θmin
Figure 2.1 Geometrical considerations in a satellite system.
36 Low Earth Orbital Satellites for Personal Communication Networks
of a satellite are determined according to other parameters, such as thenumber of satellites and orbits in a satellite system.
According to simple mathematics, we can find the extent of thefootprint of a satellite according to θmin and its altitude, h. Then, byreference to the geometric relations shown in Figure 2.1, the half-sidedangle of the footprint, α, measured at the center of the Earth can be givenby
α = cos−1
R
R + hcosθmin
− θmin (2.1)
where R is the average value of the radius of the Earth, about 6,378 km.Now, we can use the value of α given in (2.1) to calculate a lower
limit for the necessary number of satellites [3]. To cover the entire surfaceof the Earth, the footprints of the satellites should overlap. Withoutassuming any specific satellite constellation and to find the minimumnumber of satellites for global coverage, consider the largest possibleeffective footprint of a satellite as the largest hexagon inscribed into thefootprint, as shown in Figure 2.2. Each hexagon consists of six isoscelesspherical triangles, each with a central angle of 60 degrees and twoidentical angles ψ at the periphery of the footprints. Considering thespherical shape of the Earth (which is not well seen in the figure), therelation for the angle ψ is given by
tan ψ =
12 √3 α
12α ⋅ cos α
= √3cos α
(2.2)
If σ denotes the spherical excess of the triangles, it is equal to
σ = 2ψ − 2π⁄3 (2.3)
Then, the area of a hexagon will be given by
Ahex = 6R2σ (2.4)
Communications with LEO Satellites 37

Therefore, with the scenario shown in Figure 2.2, at least n satellites arenecessary to cover the whole surface of the globe, where n is given by
n = 4πR2
Ahex= π
3ψ − π(2.5)
Figure 2.3 plots the required minimum number of satellites for globalcoverage for different minimum elevation angles, according to (2.5). Thefigure also shows the number of satellites that are proposed by some LEOsatellite systems and the GEO satellite system. The IRIDIUM system, asdescribed in Chapter 1, has 66 satellites at an altitude of 780 km, with aminimum elevation angle of 8.2 degrees. GLOBALSTAR and ODYSSEYhave 48 satellites1 (at 1,400 km altitude) and 12 satellites (at 10,400 kmaltitude) with 20- and 30-degree minimum elevation angles, respectively.
α α
α
α
12
3α
60
ψ
ψ
SubsatellitePoint
Figure 2.2 Geometric relations of the hexagons inscribed in footprintsin global coverage.
38 Low Earth Orbital Satellites for Personal Communication Networks
1. Actually, GLOBALSTAR has 56 satellites; 48 satellites would be operational, and theother 8 would be on-orbit spares.

As can be seen in Figure 2.3, the number of satellites in GLOBALSTARand ODYSSEY constellations is only slightly larger than the value weobtain from Figure 2.3. On the other hand, the number of satellites inthe IRIDIUM system is much larger than the values we have obtained.One reason would be the assumption of minimum overlapping betweenthe footprints of satellites in deriving (2.5). As mentioned in Chapter 1,in the IRIDIUM system, there is a lot of overlapping between serviceareas, to ensure more reliable communications.
The analysis presented here of the minimum number of satellites forglobal coverage can be sufficient, for example, in a GEO satellite systemin which the satellites are in the plane of the equator and perfectlyequispaced. In a real situation, orbits in general cannot maintain such a
Min. Elevation Angle10 degrees20 degrees30 degrees45 degrees
ODYSSEYh = 10,400 kmn = 12
IRIDIUMh = 780 kmn = 66
GLOBALSTARh = 1,400 kmn = 48
GEO Satelliteh = 35,780n = 3
100 1,000 10,000 100,000
Altitude of Satellites (km)
Req
uire
dN
umbe
rof
Sat
ellit
es
1
10
100
1,000
*
*
*
*
Figure 2.3 Required minimum number of satellites for a globalcoverage with different minimum elevation angles θmin.
Communications with LEO Satellites 39
geometry, because the natural axis of symmetry is the rotation axis of theEarth. Thus, more complicated analysis is necessary.
For mobile satellite systems, besides the minimum number of satel-lites, the minimum number of orbits2 of those satellites also must bedetermined. To determine the required number of orbits, we considerthe coverage of a satellite at the equator. Such a situation is shown inFigure 2.2. Then, on the condition of at least two satellites in each orbit,each orbit would cover 3Rα of the equator. Hence, the minimum numberof orbits for a global coverage is given by
Ω = 2π3α (2.6)
where x denotes the smallest integer equal to or greater than x. Theminimum number of orbits for different orbit altitudes is shown inFigure 2.4. As can be seen in the figure, the resulting plots are very nearto the values proposed by the LEO and MEO mobile satellite systems.
For a satellite system utilizing polar orbits, such as IRIDIUM, a morerealistic estimation of the required number of satellites in each orbit canbe given by
n′ = 2π√3 α (2.7)
which results in a total number of satellites Ω ⋅ n′. For example, for anelevation angle of 8.2 degrees of the IRIDIUM, we have Ω = 6 and n′ = 11,which are the design parameters proposed by Motorola. It is noteworthythat some commercial proposals of big-LEO satellite systems considerlarger numbers of satellites and orbits than the minimum requirementspresented here, to make more than one satellite visible to each Earth userat any onetime. Although that increases the cost of the system, it alsorealizes some advantages, such as simplifying the hand-off process as auser moves from the service area of one satellite to the service area of
40 Low Earth Orbital Satellites for Personal Communication Networks
2. The minimum number of orbits are typically called planes because all orbits that followthat Keplerian path will be in a plane.
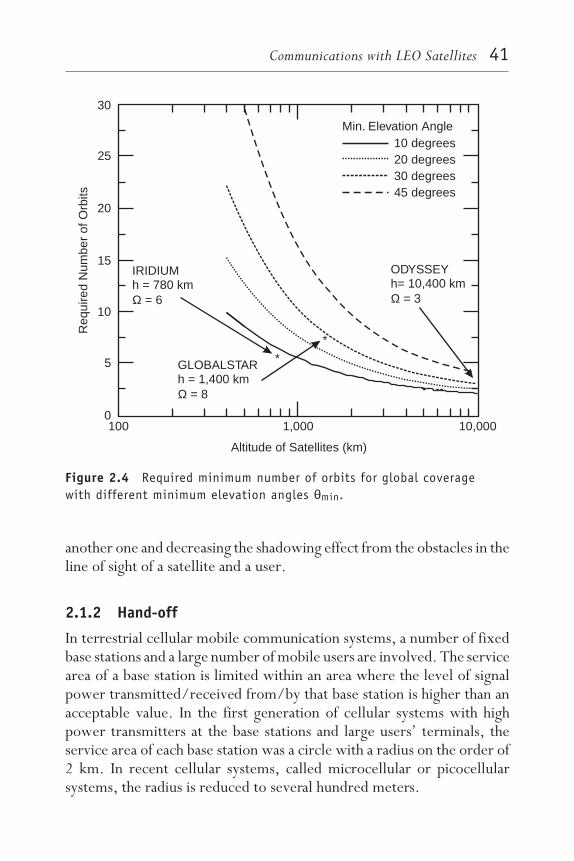
another one and decreasing the shadowing effect from the obstacles in theline of sight of a satellite and a user.
2.1.2 Hand-off
In terrestrial cellular mobile communication systems, a number of fixedbase stations and a large number of mobile users are involved. The servicearea of a base station is limited within an area where the level of signalpower transmitted/received from/by that base station is higher than anacceptable value. In the first generation of cellular systems with highpower transmitters at the base stations and large users’ terminals, theservice area of each base station was a circle with a radius on the order of2 km. In recent cellular systems, called microcellular or picocellularsystems, the radius is reduced to several hundred meters.
30
25
20
15
10
5
0100 1,000 10,000
Altitude of Satellites (km)
Req
uire
dN
umbe
r of
Orb
its
IRIDIUMh = 780 km
= 6Ω
ODYSSEYh= 10,400 km
= 3Ω
GLOBALSTARh = 1,400 km
= 8Ω
*
*
Min. Elevation Angle10 degrees20 degrees30 degrees45 degrees
Figure 2.4 Required minimum number of orbits for global coveragewith different minimum elevation angles θmin.
Communications with LEO Satellites 41

When a mobile user during an active connection leaves the servicearea of one base station and enters the service area of another, somemechanism must switch the old connection to a new connection withoutany interruption in the connection. Those mechanisms, referred to ashand-off protocols,3 have been studied widely for cellular systems in lastfew years. It is obvious that as the radii of service areas become smaller,the number of hand-offs increases. For example, in the Japanese picocel-lular system, PHS (which has a large number of small base stations, eachwith a service area with a radius in the range of 100-500m), there wouldbe many hand-offs during a typical 3-minute call. Of course the prob-ability of changing the connection with base stations during a call is closelyrelated to the speed of the mobile user. In a cellular system withhigh-speed mobile users, the probability is very high. In a system in whichthe users are mostly pedestrians, as in the case of PHS, the probability islow enough. In fixed telephony networks, the usual measure of theperformance is blocking probability, that is, the probability with which auser wanting to make a connection to a desired destination, is refusedbecause of loss of an idle channel in the system. In a mobile telephonysystem, in addition to that measure, we have a new measure related tohand-off. Sometimes this new measure is referred to as the “averagenumber of hand-offs in a typical 3-minutes call” or as the “hand-off rate.”An ideal hand-off protocol should be transparent to the users, who shouldnot sense the change of connection to a new base station. If the numberof hand-offs increased, the probability of interrupting the connectioncould be increased to unacceptable values because of nonideal protocols.
In the case of LEO satellite systems, the base stations (i.e., thesatellites) move, and all mobile or fixed users on the ground appear almostas fixed users, because of the high ground speed of the satellites. In thatcase, a scenario similar to that of cellular systems exists; the only differ-ence is that the mobility of users in a cellular system is replaced by themobility of base stations in a LEO satellite system. For example, a LEOsatellite at the altitude of 800 km in a complete orbit of the Earth requiresabout 100 minutes. In such a situation the largest visibility period of a
42 Low Earth Orbital Satellites for Personal Communication Networks
3. In the literature, the mechanisms also are called hand-over protocols. The term hand-offis used in analog systems, while hand-over is used in digital systems. This text uses theterm hand-off, even though we sometimes are referring to a digital system.
given user to the satellite (depending on the minimum elevation angle)would be about nine minutes or less. Therefore, there would be thenecessity of changing the connection between users and satellites duringeach connection with enough high probabilities. If the footprint of asatellite is partitioned into smaller cells, then, in addition to the hand-offbetween the satellites, hand-off between the cells of a satellite’s footprintwould be required as well.
A simple hand-off mechanism that is usually used in cellular systemsand that would be applicable in LEO satellite systems, is having two upperand lower threshold bounds on the power of the received signals fromusers. Base stations continuously monitor the power of the receivedsignals from users on uplinks. When the level of power of a userconnected to a given base station falls below the upper limit, the basestation assumes the user is moving to the next service area. At the sametime, the base station of the new service area also senses the receivedpower from that user above the lower bound. With the control channelsbetween base stations, information on a connection can be exchangedbetween two base stations, and a new connection provided. In the caseof a LEO satellite system with a large enough number of satellites, someareas commonly would be covered by two or more satellites at the sametime; hand-off then can take place when a user is located in such areas.That way, the connections between satellites, which may be providedthrough the ground gateways or intersatellite links, have a dominant rolein providing a reliable and successful hand-off without any sensitive callinterrupt.
2.1.3 Intersatellite links
Another issue that has to be considered when a large number of LEOsatellites are used in a system is establishment of a network between thosesatellites in order to interchange different kinds of information as well asroute calls through a network in space. In the case of GEO satellitesystems, in which the footprint of a satellite may cover several gatewayson the Earth, such a network between satellites, or the intersatellite link(ISL), has not been considered so strictly. In GEO satellite systems, anintercontinental long distance call can be routed through gateways on theEarth; an additional cost for communications between satellites would
Communications with LEO Satellites 43

not be necessary. However, for a LEO satellite at low altitudes and smallcoverage, all Earth gateways usually are out of sight of the satellite. Anexample of this situation would be a satellite over the Pacific Ocean.
Establishing a network between satellites is a complex and expensivetask, because of large distances between satellites and the change of therelative positions of satellites, which requires antenna steering. Also, toestablish ISLs, each satellite is required to have additional transmitters,receivers, and antennas, which increase the payload weight and the costof the satellite. However, satellites in a system utilizing ISLs do not haveto see the Earth gateway stations at all times, making the satellite systemcompletely independent of the terrestrial facilities. Of course, becauseof economic considerations, all LEO satellite systems, including the onesthat utilize ISL (such as IRIDIUM), propose internetworking with exist-ing terrestrial systems. But the possibility of independence of the terres-trial systems is a great advantage of LEO satellite systems.
It often is said that since satellites are in the sky they can providecommunications to the Earth even in the case of disasters. Experience,however, shows that that belief is not realistic. For example, at the timeof a strong earthquake in Kobe, Japan, on January 17, 1995, four of thefive GEO satellite gateway stations in the area were completely damaged,and the fifth one did not work because of the cut power supply, resultingin no communications for several hours. Providing voice communicationsin the area by portable satellite terminals took several hours and a lot ofexpense. In such situations, communication with satellites without anylarge and fixed gateways on the Earth is a great success, which can beprovided by LEO satellite systems and their hand-held terminals, whichutilize intersatellite links.
ISLs have been considered not only for LEO satellite systems but alsofor other systems in which different orbits are engaged. Some proposalsfor global communications propose a combination of satellites on low,medium, and even geostationary orbits. In such systems, for example,LEO satellites can cover local and dense traffics, and GEO (MEO)satellites can act as gateways or control stations for the LEO satellites andalso cover wider areas and sparser traffics. In such systems, links betweenLEO and GEO (MEO) that can be termed as intersatellite links, allowfor the exchange of information and control data between satellites ofdifferent orbits.
44 Low Earth Orbital Satellites for Personal Communication Networks

For a LEO satellite system, there are two types of intersatellite links,because the satellites are in several orbits. The first type is the linkbetween satellites on the same orbital plane, called intraorbit intersatel-lite links. In this type, the satellites fly in a fixed successive arrangement,and the antennas can be almost fixed. The second type is a link betweensatellites on different (adjacent) orbital planes, called interorbit inter-satellite links. Unlike intraorbit intersatellite links, in the second type,the ISLs require antenna steering. Moreover, because in the secondtype, the distances between satellites in different orbits vary within a largerange and the Earth may interrupt their mutual line of sight, intersatellitecommunications have to be switched on and off at certain intervals.Figure 2.5 is an example of a LEO satellite system with the two typesof ISLs.
Orbital Planes
A Satellite
Intra-Orbit ISL
Inter-Orbit ISL
Figure 2.5 Two types of intersatellite links in a LEO satellite system.
Communications with LEO Satellites 45
IRIDIUM [4], for example, is a LEO satellite system that has proposedboth types of ISLs (see Figure 1.8). Having an intersatellite network is acomplex task that is very expensive, but it can provide reliable, Earth-in-dependent personal communications in any part of the globe. A callstarted in a hand-held terminal on any part of the globe can travel longdistances to another hand-held terminal through the networks of satellitesand without any terrestrial facility. This may be one of ideals for the futurePCNs that can be realized by LEO satellite systems [5,6].
2.1.4 Spot beamsOne of the great advantages of a satellite system in communications is thewide area that can be serviced by a single satellite. In the case ofconventional GEO satellite systems, that feature can provide long-dis-tance intercontinental calls as well as real-time broadcasting throughoutthe entire globe. Even in the case of LEO satellite systems, in which thefootprint of a single satellite is much smaller than that of a GEO satellite,it is still several times larger than the coverage area of a terrestrial station.A satellite can provide communications between two widely separatedlocations on the Earth, even when they are not in each other’s line of sightdue to spherical shape of the globe or geographical obstacles.
Although the wide-coverage feature is attractive, there are somedisadvantages to it. For example, satellite signals ignore political bounda-ries as well as geographical ones, which may or may not be a desirablefeature. Some countries do not like to receive special-program broadcast-ing via satellite signals (at least for public receptions). Also, transmittingsignals to all parts of the footprint of a satellite requires a high level ofpower, provided by a satellite’s batteries, power that is wasted in sparselypopulated areas. In addition, many countries have their own satellites fornational purposes, which do not require whole coverage in the footprintof satellites.
The concept of partitioning the footprint of satellites to more specificareas has been used for a long time in GEO satellite systems. In the caseof GEO satellite systems, it is necessary to cover only the desirable areasfor the purpose of a given satellite system and that enough number ofgateway stations to be included in those areas. This can be done by
46 Low Earth Orbital Satellites for Personal Communication Networks

arranging the projection of antennas on the satellite transponders to thedesired areas.
In the case of LEO satellite systems, besides those requirements,which basically are designed for personal communications with hand-heldterminals in addition to the communications of satellites with largegateway stations, it is preferable to have very small areas within thefootprint of each satellite. Imagine the LEO satellite systems as anextension of the existing terrestrial systems, in which cellular-type basestations are replaced by LEO satellites [7]. In the case of terrestrial cellularsystems, there are many activities to reduce the size of the cell intomacrocells, microcells, and picocells, which can be applied in LEOsatellite systems as well. In that manner, many big-LEO satellite systemproposals consider the partitioning of the footprint of satellites into smallareas, called cells, by very sharp spot-beam antennas on spacecraft. Thisis the concept of multicell LEO satellite systems. A simple illustration ofsuch a configuration of small areas inside the footprint of a LEO satelliteis shown in Figure 2.6.
By using multiple spot-beam antennas, the footprint of each satelliteis divided into smaller areas, called cells (the name is borrowed fromterrestrial systems). The basic concept of partitioning the footprint of asatellite into small cells came from the same idea used in current terres-trial cellular systems. Generally, as an advantage, with multiple-cellconfiguration, we can reuse the frequency bands in sufficiently separatedcells or improve the bandwidth efficiency [8]. Another advantage is thatby dividing a wide service area into small cells, the radio frequency (RF)power of users can be reduced due to the concentration of power intosmaller areas, equivalent to a higher satellite antenna gain. With thepower concentrated in small cells, the requirements for the variance inpower of the user transmitters (which should be changed according tothe location of user) can be more limited. With multiple spot-beamantennas, the power is reduced approximately by the number of cells ineach satellite footprint. The issue of having lower transmission power isa key issue for realizing a global PCN with hand-held terminals.
As mentioned in Chapter 1 and to be discussed in more detail inSection 2.2, some big-LEO satellite systems, like IRIDIUM, proposed
Communications with LEO Satellites 47

TDMA as the multiple access in their systems. Many others, likeGLOBALSTAR, use CDMA, because CDMA exhibits attractive featuresin cellular systems that may be true for LEO satellite systems as well. Theselection of a multiple-access scheme is closely related to the advantagesof partitioning the satellite’s footprint into small cells. We start thediscussion of that selection with a review of the frequency considerationsin the two systems.
In the IRIDIUM system proposal, the available 1616.0–1626.5 MHzband is divided into 31.5 kHz subbands with enough guard bands to spacethe individual carriers 41.67 kHz apart in a frequency division multiplexing(FDM) structure. In each 31.5-kHz subband, 89.96-ms TDMA framesare transmitted using quadrature phase shift keying (QPSK) modulation ata rate of 50 Kbps to form four uplink and four downlink channels. The
Footprint of satellites Inserted cells within footprints
Figure 2.6 Partitioning of the footprint of a LEO satellite into smallerareas.
48 Low Earth Orbital Satellites for Personal Communication Networks
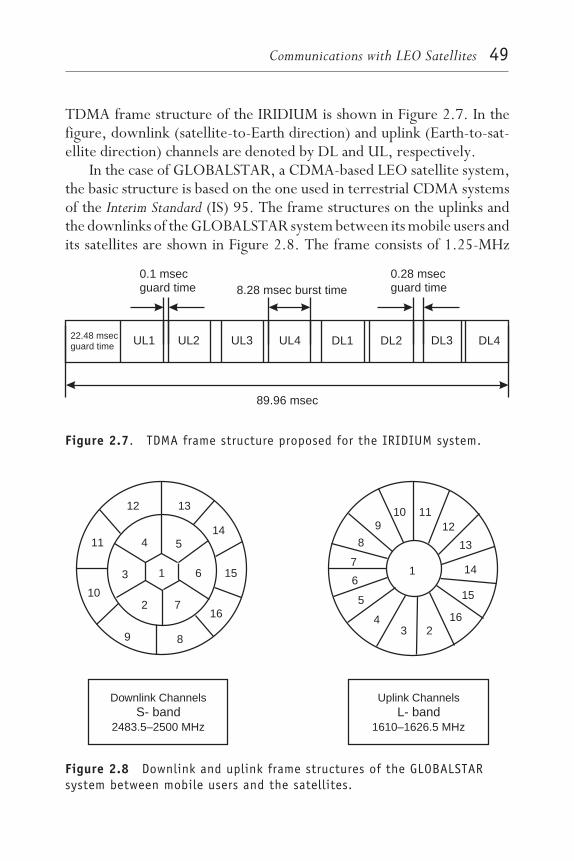
TDMA frame structure of the IRIDIUM is shown in Figure 2.7. In thefigure, downlink (satellite-to-Earth direction) and uplink (Earth-to-sat-ellite direction) channels are denoted by DL and UL, respectively.
In the case of GLOBALSTAR, a CDMA-based LEO satellite system,the basic structure is based on the one used in terrestrial CDMA systemsof the Interim Standard (IS) 95. The frame structures on the uplinks andthe downlinks of the GLOBALSTAR system between its mobile users andits satellites are shown in Figure 2.8. The frame consists of 1.25-MHz
0.1 msecguard time 8.28 msec burst time
0.28 msecguard time
22.48 msecguard time UL1 UL2 UL3 UL4 DL1 DL2 DL3 DL4
89.96 msec
Figure 2.7. TDMA frame structure proposed for the IRIDIUM system.
1
2
3
4 5
6
7
89
10
11
12 13
14
15
16
1
234
5
6
7
8
910 11
12
13
14
15
16
Downlink ChannelsS- band
2483.5–2500 MHz
Uplink ChannelsL- band
1610–1626.5 MHz
Figure 2.8 Downlink and uplink frame structures of the GLOBALSTARsystem between mobile users and the satellites.
Communications with LEO Satellites 49

FDM subbands with FDD, so that the 1.25-MHz subbands required pertraffic channel are paired. In this system, the 1.6-GHz band is subdividedinto segments and used for transmitting each 1.25-MHz uplink. Similarly,the 2.4-GHz band is divided into an equal number of segments and is usedfor the corresponding 1.25-MHz band in the downlinks. As can be seenin Figure 2.8, the available frequency bandwidth in each direction is16.5 MHz. In this system, there also are links between the satellites andits Earth gateways in C-band at the frequencies of 5091–5250 MHz and6875–7055 MHz for uplinks and downlinks, respectively.
As mentioned, one advantage of partitioning the footprint of a satel-lite into smaller cells is the availability of frequency reuse in sufficientlyseparated cells, to improve the bandwidth efficiency of the system. In thecase of TDMA systems, that can limit the level of interference from ad-jacent cells. Typically, a seven-frequency reuse pattern is used, wherebythe central spot is surrounded by six spots whose FDM frequencies aredifferent for each spot in any cluster of seven spots, as illustrated inFigure 2.9.
For CDMA, it is possible to reuse the same frequency in spots. Thatis because of the feature of CDMA in which the wideband signal mitigatesmultiple-access interference by using a correlation receiver that discrimi-nates between desired and undesired signals. Therefore, it often is saidthat for CDMA the frequency reuse pattern is one, and then, the advan-
f1
f2
f3
f4
f5
f6
f7
Cluster of seven cells
Figure 2.9 Seven-frequency reuse pattern in a TDMA system.
50 Low Earth Orbital Satellites for Personal Communication Networks
tage of spot beams in LEO satellite systems utilizing CDMA is not asstrong as in the systems employing TDMA or FDMA schemes. Asevidence of this, we can look at the parameters in proposals for theIRIDIUM and the GLOBALSTAR systems. The former one uses satellitesat an altitude of 780 km, and the latter one uses satellites at 1,400 km.That means the footprint of a GLOBALSTAR satellite is much larger thanthat of the IRIDIUM. However, the GLOBALSTAR considers only 16spot beams (fixed array) in each satellite footprint, compared to 48 forIRIDIUM. One reason for that is the less expected advantage due to spotbeams in the case of CDMA and other spread-spectrum-based schemes.Section 2.2 discusses the advantages of spot beams in the case of CDMA-based systems, considering the traffic issues in LEO satellite systems.
When the footprint of a LEO satellite is divided into smaller cells, akind of hand-off other than the one explained in Subsection 2.1.2 isnecessary. In that case, when a user leaves one cell and enters anotherone, a new communication should be arranged, and the past connectioncanceled. Therefore, in a multicell LEO satellite system we have toarrange a hand-off mechanism between the cells within each satellite’sfootprint in addition to the hand-off required between the footprint ofsatellites, making the hand-off procedure more complex.
2.1.5 Doppler shift effectDoppler shift is the problem of receiving higher or lower frequencies thanthe original transmitted frequency. It is caused by the relative high speeddifference between a transmitter and a receiver. For example, if atransmitter with the frequency f moves very rapidly, a fixed receiverbehind the transmitter receives the signal at a lower frequency equal tof − ∆f1, whereas another fixed receiver in the front of the transmitterreceives the signal at a higher frequency equal to f + Df2. The change inthe frequency, ∆f, depends on several parameters, such as the distancebetween the transmitter and the receiver, the speed of the electromag-netic waves, and their relative velocity.
As shown in Chapter 1, in the case of satellite systems with low Earthaltitudes, each satellite has a relatively high ground speed; hence, thesystem would be affected by high values of Doppler frequency shift.Figure 2.10 illustrates the scenario during the movement of a LEO
Communications with LEO Satellites 51
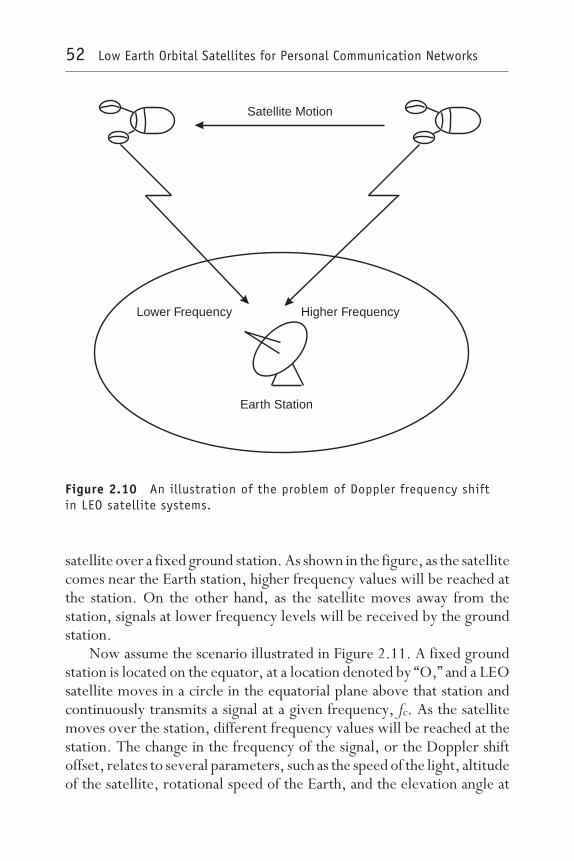
satellite over a fixed ground station. As shown in the figure, as the satellitecomes near the Earth station, higher frequency values will be reached atthe station. On the other hand, as the satellite moves away from thestation, signals at lower frequency levels will be received by the groundstation.
Now assume the scenario illustrated in Figure 2.11. A fixed groundstation is located on the equator, at a location denoted by “O,” and a LEOsatellite moves in a circle in the equatorial plane above that station andcontinuously transmits a signal at a given frequency, fc. As the satellitemoves over the station, different frequency values will be reached at thestation. The change in the frequency of the signal, or the Doppler shiftoffset, relates to several parameters, such as the speed of the light, altitudeof the satellite, rotational speed of the Earth, and the elevation angle at
Satellite Motion
Earth Station
Higher FrequencyLower Frequency
Figure 2.10 An illustration of the problem of Doppler frequency shiftin LEO satellite systems.
52 Low Earth Orbital Satellites for Personal Communication Networks

which the station is seen by the satellite. The change in frequency can begiven by a differential equation as [9]
∆f = 1C
dD(t)dt
(2.8)
where ∆f is the Doppler frequency offset from the frequency fc, C is thephase velocity of the light in free space (3 ⋅ 108 m/s), and D(t) is a timefunction for the distance of the satellite and the Earth station.
The shift in frequency due to the Doppler shift effect is closely relatedto the carrier frequency of the transmitted signal and the modulationmethod. Here, we assume a binary phase shift keying (BPSK) modulation,although similar results can be derived in the case of the more usualmodulation technique in satellite systems, QPSK. In addition, to simplifythe problem, we define the normalized Doppler shift as the value ofDoppler shift offset divided by the carrier frequency. Figure 2.12 showsthe normalized Doppler shift for different orbit altitudes, calculated withthe carrier frequency and rate of 2.4 GHz and 19.4 Kbps, respectively.The horizontal axis in the figure is the time difference between thesubsatellite point and the location of Earth station at the point denotedby “O.” The time indicated as zero is the instant when the subsatellitepoint is at the location of the Earth station.
Satellites Orbit
CoverageAngle of aSatellite
Earth StationA BO
Figure 2.11 Schematic diagram of Doppler shift effects in LEO satellitesystems.
Communications with LEO Satellites 53
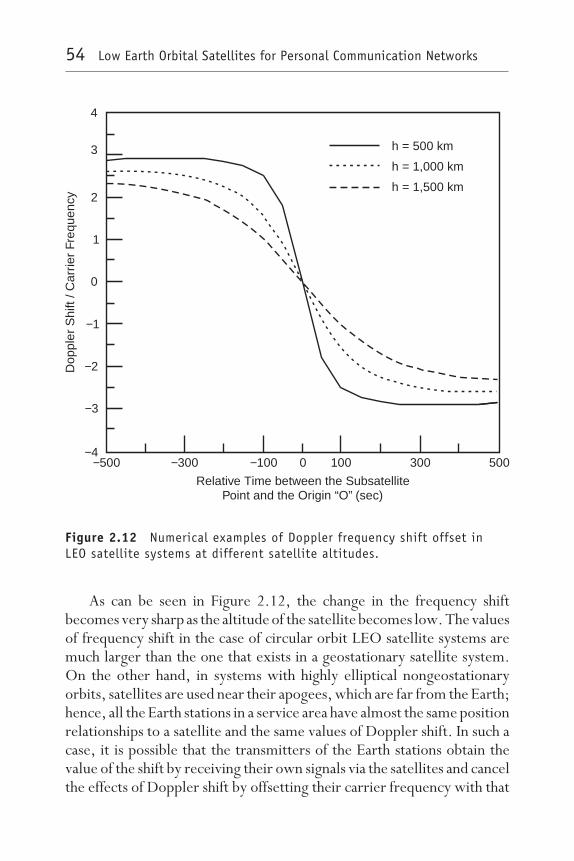
As can be seen in Figure 2.12, the change in the frequency shiftbecomes very sharp as the altitude of the satellite becomes low. The valuesof frequency shift in the case of circular orbit LEO satellite systems aremuch larger than the one that exists in a geostationary satellite system.On the other hand, in systems with highly elliptical nongeostationaryorbits, satellites are used near their apogees, which are far from the Earth;hence, all the Earth stations in a service area have almost the same positionrelationships to a satellite and the same values of Doppler shift. In such acase, it is possible that the transmitters of the Earth stations obtain thevalue of the shift by receiving their own signals via the satellites and cancelthe effects of Doppler shift by offsetting their carrier frequency with that
h = 500 km
h = 1,000 km
h = 1,500 km
Dop
pler
Shi
ft/ C
arrie
rFr
eque
ncy
Point and the Origin “O” (sec)Relative Time between the Subsatellite
−500 −300 −100 0 100 300 500
4
3
2
1
0
−1
−2
−3
−4
Figure 2.12 Numerical examples of Doppler frequency shift offset inLEO satellite systems at different satellite altitudes.
54 Low Earth Orbital Satellites for Personal Communication Networks

value. However, in LEO satellite systems, because the distance betweenthe Earth stations and the satellites is very small, some Earth stations sufferpositive and others negative Doppler shifts at the same time. In thatsituation, the carrier frequency offset compensation by transmitters isimpossible, and receiver-based techniques are required.
To solve the problem of Doppler shift for LEO satellite systems,several research studies have been done [9–11]. In those studies, it isshown that, for example, a receiver with phase locked loop (PLL) forwideband signal systems can be used to compensate the effects of Dopplershift. Also narrowband signals, another method in which the receiver usesthe carrier regeneration by a block demodulator, can be more effective.The discussions given here and in the references imply that the effect ofDoppler shift is a serious problem for the satellites on low Earth altitudes,but it can be solved by sophisticated design of transmitters and receivers.
2.2 Specific issues in LEO satellite systemsSome aspects of LEO satellite systems, such as calculations of the requirednumber of satellites and orbits and the dynamics for the motion ofsatellites, are involved in preliminary stages of the system design. Someof them, such as the problem of Doppler shift, should be consideredduring the entire design, development, and maintenance of the system.In each area, many researchers and scientists from both the academicsphere and industry have been involved in the performance of LEOsatellite systems, their constellation, their availability4, and so on, sincethe early 1990s, when these systems were first commercially proposed.The quantity of those research studies exhibits the attractiveness of LEOsatellite systems as strong candidates for future PCNs.
The main viewpoint of this book is the application of LEO satellitesin global personal communication systems, so we will focus on twoimportant issues in realizing such communications with LEO satellites.The first issue is the selection of a multiple-access scheme in a LEOsatellite system that can distribute efficiently the limited frequency spec-trum to the large number of users of a future personal communication
Communications with LEO Satellites 55
4. Availability in a communications system can be defined as the probability of attaining aspecified level of performance and maintaining that level for a scheduled period of time.
system. The second issue is the problem of nonuniform distribution ofthe traffic loads around the world that should be serviced by the LEOsatellite system. The second issue considered here is an original point ofview concerning the topic of LEO satellite systems.
This section introduces those two issues. Although nomination of aspecific scheme as the best multiple access in a system is a complicatedtask that requires consideration of many parameters and different trafficconditions, the author believes the schemes proposed here are appropri-ate candidates for such a nomination.
2.2.1 Selection of a multiple-access schemeThe selection of an efficient multiple-access scheme is an important issuein the design of any communications system that large numbers of userscan independently access through a common channel with a limitedfrequency spectrum. For satellite communication systems of any types oforbit (GEO, MEO, or LEO), multiple-access techniques are essential;the problem is much more serious when the systems are employed forpersonal communications. That might be evidenced by the followingfacts: (a) the users (including users with either direct access to satellitesby portable terminals or indirect access through gateways from publictelephony networks) of mobile satellite systems are characterized by hugenumbers; and (b) communications channels in mobile satellite systemssuffer many imperfections, such as thermal noise, interference, fading,shadowing, and signal deflection. Accompanying those facts is the evolu-tion of satellite access techniques from contentionless protocols to con-tention (random access) protocols and CDMA, which may be locatedbetween the other two protocols [12].
This section first reviews the issue of a multiple-access scheme andgives a classification for it. After that, it discusses multiple access forsatellite communication systems.
2.2.1.1 Classification of multiple-access schemesBefore introducing the multiple-access scheme that will be used in thisbook, let us review the topic of multiple access and its main alternatives.Multiple access refers to the transmission of information data, whichmight or might not be inserted into packets, by numerous users to or
56 Low Earth Orbital Satellites for Personal Communication Networks

through a common receiving point at the same time. A multiple-accessprotocol is a strategy to control such transmissions so that the probabilityof collision between them is maintained at a low enough level. The issueof multiple access with that definition can be applied not only to commu-nication systems but also to computer networks in which computerterminals access a common processor of a mainframe or workstation. Forthat reason, different protocols have been invented.
As a general categorization of multiple-access protocols, we candivide them into contentionless and contention protocols [12]. In acontentionless protocol, users’ transmissions are scheduled in either timeor frequency domain. Therefore, sometimes contentionless protocols arereferred to as scheduling protocols. By assigning a specific duration oftime or frequency band to each user, it is possible to avoid collisionbetween their signals. In that manner, fixed assignment schemes, such astime division multiple access (TDMA) and frequency division multiple access(FDMA), and demand assignment protocols have been proposed. In ademand assignment protocol, prior to the transmission, a user asks for achannel and after receiving the permission transmits a signal. In thefixed-assignment method, a user is allocated a part of channel capacity;in the demand-assignment method, the scheduling takes place only whenthe user has something to transmit, which can improve the spectrumefficiency of the system. In the latter method, no channel capacity iswasted on users who have nothing to transmit, which is unavoidable inthe fixed-assignment methods.
In a TDMA scenario, each user is apportioned the entire transmissionresource periodically for a fraction of time. Thus, for 10 users havingequal requirements, 1 ms in every 10-ms frame might be assigned to eachuser. Each user’s transmission, therefore, is intermittent, a condition thatcan be tolerated only by digital transmitters, which can store source bitsand then burst them out at the transmission speed at which they weregenerated. Therefore, TDMA is employed mostly in digital transmis-sions. On the other hand, in an FDMA system, the allocated frequencyspectrum is divided into subbands, and each user is apportioned a subbandin the whole time domain. Different form TDMA, FDMA can be usedwith analog transmission as well as digital. Simple configurations ofsignals in TDMA and FDMA schemes are shown in Figure 2.13. Notethat in either case it is necessary to insert some part of time or frequency
Communications with LEO Satellites 57

Time Frequency
Guard Times
T1
T2
T3
T4
FrequencyTime
Guard Bands
F1
F2
F3
F4
(a)
(b)
Figure 2.13 Frame structures in (a) FDMA and (b) TDMA schemes.
58 Low Earth Orbital Satellites for Personal Communication Networks
domain between adjacent channels in order to distinguish them from eachother. The need for guard time in TDMA and guard band in FDMAschemes results in waste of some part of the precious resource.
In the contention protocol, users can transmit packets almost when-ever they have something to transmit. This type of protocol sometimesis referred to as a random access protocol, because a user can randomlyaccess the channel. Obviously, with random access, users cannot be surethat their transmissions will not collide with others; however, in thisprotocol, the synchronization control process is much simpler than theone required, for example, in a TDMA system. The most noteworthy ofsuch protocols is the Aloha scheme, invented in 1970 [13], in which auser, without paying attention to the transmitting status of other users,can send packets completely randomly. Several protocols in the conten-tion protocols group have been proposed since then, to improve signifi-cantly the low performance of the Aloha scheme. The Aloha scheme andits modified version, the slotted-Aloha scheme, are included in therepeated random access protocols subgroup. In the methods in thatsubgroup, it is necessary to retransmit all packets that have collided witheach other. Another subgroup of random access protocols is those withreservation, in which a kind of reservation is necessary before the packetsare transmitted. (Chapter 4 discusses Aloha schemes in more detail.)
CDMA schemes can be considered as either contentionless or con-tention protocols, depending on the situation of the channel [12]. ACDMA scheme is a contentionless protocol if the number of simultaneoustransmissions on the channel or the level of multiple-access interferenceis under a given threshold in which all transmissions can be handledsuccessfully. It is a contention protocol if the level of interference is abovethe threshold that results in contention and loss of all simultaneouspackets.
In a CDMA system, users’ signals occupy all of the frequency spec-trum during the entire transmission period, but those signals are distin-guished from one another according to the specific code assigned to eachuser, as shown in Figure 2.14. At any given time, a subset of the users inthe system can transmit information simultaneously over the commonchannel to corresponding receivers. The transmitted signals in the com-mon spectrum can be distinguished from one another by the superimpos-ing of a different pseudo-random (or pseudo-noise, PN) pattern, called a
Communications with LEO Satellites 59

code, in each transmitted signal. Thus, a particular receiver can recoverthe transmitted information intended for it by knowing the pseudo-ran-dom pattern, that is, the sequence used by the corresponding transmitter.The most popular form of CDMA is direct sequence CDMA (DS/ CDMA),in which DS spread-spectrum signals occupy the same channel band-width, provided that each signal has its own distinct PN sequence [14,15].Because this form of CDMA spread-spectrum techniques and their per-formance enhancement through the processing gain are used for multi-ple-accessing purpose, it sometimes is referred to as spread-spectrummultiple access (SSMA).
The transmitter of each user in a DS/CDMA communication systemtypically has a structure like that shown in Figure 2.15. When severalusers transmit their packets to a common receiver with the structureshown in Figure 2.15, the difference in codes of the signals of each usermakes it possible for the receiver to distinguish those signals from oneanother and to extract the individual information. In a spread-spectrumsystem, the narrowband signal of each user is multiplied by its PNsequence to form a wideband signal. If we assume that the informationrate at the input to the encoder is Rb bps and that the modulation is BPSK,then the duration of a rectangular pulse corresponding to the transmissiontime of an information bit will be Tb= 1/Rb, and the bandwidth expansionfactor, or processing gain, of the spread-spectrum system will be
FrequencyTime
Code
PN1
PN2
PNi
Figure 2.14 CDMA signals distinguished by PN codes.
60 Low Earth Orbital Satellites for Personal Communication Networks
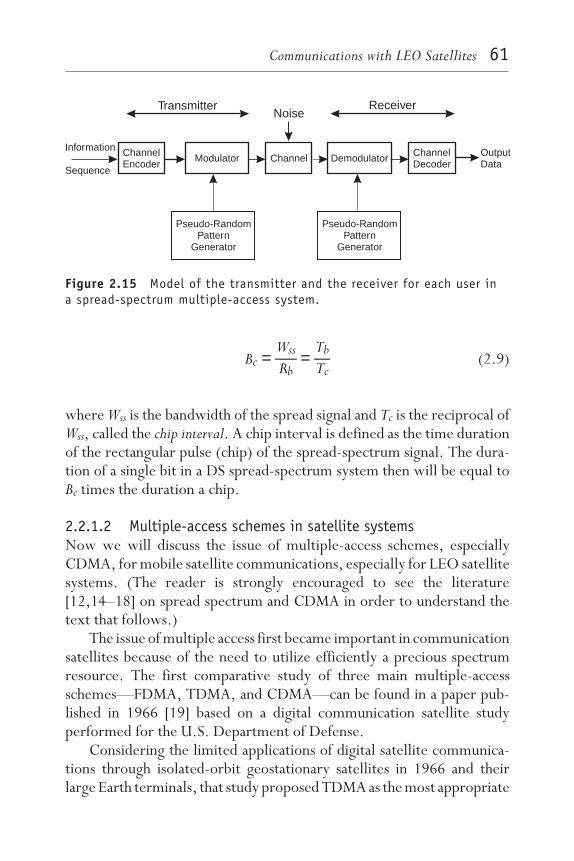
Bc =Wss
Rb=
Tb
Tc(2.9)
where Wss is the bandwidth of the spread signal and Tc is the reciprocal ofWss, called the chip interval. A chip interval is defined as the time durationof the rectangular pulse (chip) of the spread-spectrum signal. The dura-tion of a single bit in a DS spread-spectrum system then will be equal toBc times the duration a chip.
2.2.1.2 Multiple-access schemes in satellite systemsNow we will discuss the issue of multiple-access schemes, especiallyCDMA, for mobile satellite communications, especially for LEO satellitesystems. (The reader is strongly encouraged to see the literature[12,14–18] on spread spectrum and CDMA in order to understand thetext that follows.)
The issue of multiple access first became important in communicationsatellites because of the need to utilize efficiently a precious spectrumresource. The first comparative study of three main multiple-accessschemes—FDMA, TDMA, and CDMA—can be found in a paper pub-lished in 1966 [19] based on a digital communication satellite studyperformed for the U.S. Department of Defense.
Considering the limited applications of digital satellite communica-tions through isolated-orbit geostationary satellites in 1966 and theirlarge Earth terminals, that study proposed TDMA as the most appropriate
Information
Sequence
ChannelEncoder
Modulator Channel Demodulator ChannelDecoder
OutputData
Pseudo-RandomPattern
Generator
Pseudo-RandomPattern
Generator
TransmitterNoise
Receiver
Figure 2.15 Model of the transmitter and the receiver for each user ina spread-spectrum multiple-access system.
Communications with LEO Satellites 61

scheme. The study mentioned that for the then-current applications ofdigital satellite communications, the most valuable commodity is thetransmitted power of a satellite transponder since the satellite mass isproportional to payload power of the satellite. It is well known that toutilize the power of transmitters most efficiently, we must drive theminto saturation area, where the amplifier operates as a nonlinear device.In that situation, if users’ signals are being received simultaneously by thesatellite on the uplinks, the nonlinear amplifier generates undesiredintermodulation products, which both interfere with the desired signalsand rob them of downlink transmitted power. In TDMA, because thereis only one user accessing the satellite transponder at any given timeinterval, that problem can be avoided. However, a number of disadvan-tages offset that advantage. Perhaps the most important one is that theintermittent nature of the signal transmitted by the Earth stations requiresa high peak-to-average power ratio, proportional to the number of users,which reduces the efficiency of the Earth transmitters.
An acceptable tradeoff between the advantages and the disadvantageswould be large antennas and expensive high-power amplifiers on theground. Therefore, the large trunking communication satellites launchedsince the 1970s and operated by the U.S. Department of Defense,INTELSAT and other satellites that interconnected very few large Earthstations, each having very high bit-rate requirements, mostly employedTDMA.
After the arrival of digital communication satellites networking largenumbers of very small aperture terminals (VSATs) in the 1980s, however,the important consideration became the economics of the very manysmall Earth terminals, while satellite transponder costs could be amor-tized over a much larger terminal population. For those applications,TDMA was no longer employed, and most VSAT networks employedFDMA, with the more recent trends to employ CDMA [20–22].
Since the placing of satellites on lower orbit altitudes for commercialpurposes, CDMA has become one of the strongest candidates for estab-lishing multiple access in LEO satellite systems [23–25]. As mentionedin Chapter 1, many mobile satellite systems have been considered toemploy CDMA schemes. While there does not appear to be a singlemultiple-accessing technique that is superior to others in all situations,there are characteristics of spread-spectrum waveforms that give CDMA
62 Low Earth Orbital Satellites for Personal Communication Networks

certain distinct advantages. The two basic problems that face the mobileradio system designer are multipath fading of the radio link and interfer-ence from other systems. Spread-spectrum signals are effective in miti-gating multipath because their wide bandwidth introduces frequencydiversity. They also are useful in mitigating interference, again becauseof their widely spread bandwidth. The result of those effects is a highercapacity potential by employing voice activity and frequency reuse com-pared to that of nonspread access methods. Moreover, in CDMA, incontrast to FDMA and TDMA, integration of circuit-mode and packet-mode traffic requires no special protocol and makes an integratedvoice/data system easy to realize; a multimedia feature of the futurePCNs. In addition, in a packet radio environment, CDMA can offeruncoordinated random-access channel sharing with high throughput andlow delay, along with other well-known advantages of spread spectrum,such as immunity to external interference and jamming and low prob-ability of intercept.
Another alternative for the multiple-access scheme in LEO satellitesystems is spread Aloha. This scheme is a combination of two well-knownmultiple-access schemes, CDMA and Aloha, which is also called CDMAAloha [26] (see Chapter 4 for more details). Aloha by now is known asthe simplest random access method that can realize the share of commu-nications channels to a large number of users. In contrast to conventional(unspread) Aloha, in which the collision of the packets results in loss ofthe packets, if we spread the packets with pseudo-random sequencesbefore transmissions, simultaneous multiple packet transmission onlyincreases the level of multiple-access interference and does not alwaysmean the loss of the packets: As long as the level of the interference issmall enough compared to the strength of the power of the desiredpacket, the packet is accessible. In other words, in the spread Alohascheme, we can receive a packet successfully while the level of thesignal-to-interference ratio could be kept enough above a threshold value,thereby achieving a more improved throughput performance than un-spread Aloha.
A subsequent scheme, spread-slotted Aloha [27], is a combination ofCDMA and slotted Aloha that provides packet transmissions at specifiedtime instants, allows us to have further efficient systems, similar to therelationship between the conventional (unspread) slotted and unslotted
Communications with LEO Satellites 63
Aloha schemes. We believe that for the LEO satellite systems, CDMA orits combined forms with Aloha, either slotted or unslotted, are appropri-ate schemes that can be flexible enough with the coming needs of futurePCNs and their multimedia applications. Therefore, this book considersthe performance evaluation of the LEO satellite systems employingCDMA and spread-slotted Aloha schemes. Chapter 3 presents calculationof the signal-to-interference ratio in a CDMA LEO satellite system;Chapters 4 through 7 employ spread-slotted Aloha and evaluate itsperformance. Those chapters also provide a number of techniques forimproving the performance of the system.
2.2.2 Traffic considerations
Future global PCNs promise to be far more ambitious in terms of thenumber and the category of user terminals. Considering the currentinterests in personal communications services, it is expected that therewill be an increase on the order of millions of subscribers, as mobile andpersonal services are provided by satellites. The service to subscribersprovided by future satellite-based PCNs will not be limited to metropoli-tan areas and will be spread out around the world, including developingcountries and even unpopulated areas.
It might be clear at this point that for future global personal commu-nication systems, LEO satellites are the most promising candidates,because they can provide global coverage to small hand-held, low-powerterminals without the need for any existing terrestrial facilities. LEOsatellite systems, while having the most important features of conven-tional geostationary satellite communications systems, such as wide cov-erage area, direct radio path and flexibility of the network architecture,provide additional advantages for global communications networks, forexample, low propagation delay, low propagation loss, and high elevationangle at high latitudes. LEO satellite systems, which can be consideredan extension of cellular terrestrial systems, can provide all the necessitiesfor tomorrow’s PCNs. If we consider personal communications servicesto subscribers in unpopulated areas and in developing countries, ondeserts and on oceans, what can be better than LEO satellites?
The LEO satellite systems proposed for future PCNs are designed toestablish different kinds of services, such as voice, data, facsimile, and
64 Low Earth Orbital Satellites for Personal Communication Networks

paging, to their consumer subscribers in all parts of the globe, includingareas with relatively small numbers of users separately located in smallcities. As a promising group of subscribers to these systems, we also canconsider subscribers with dual-capability, hand-held PCN terminals ca-pable of direct access to the satellite system as well as their source-countrycellular system. The terminals of these users should have the capabilityof using the satellite system, because the people who carry such terminalscan travel around the world, and the requirements of terrestrial systemsin different countries are based on different standards. That dual capabil-ity will be one of the distinguishing features of future realistic PCNs.
As already mentioned, LEO satellite systems can be assumed to be anextension of existing terrestrial cellular systems, in which the cellular-type base stations are replaced by the satellites. Similar to cellularsystems, in which several base stations are required to cover a specifiedarea, for example, a country, tens of LEO satellites are necessary torealize global coverage. The reason is that the service area of a single LEOsatellite is much smaller than the service area of a geostationary satellite,although it is wider than the conventional service areas of terrestrialcellular systems.
The service area of a LEO satellite may cover a number of small citiesas well as urban areas; then the total traffic load of that satellite becomesmuch higher than that of its neighbor satellite, for example, one that isflying over an ocean. That traffic feature will be unique to LEO satellite-based PCNs. Generally speaking, that feature results in an importantunbalanced traffic problem for the LEO satellite systems, one that re-quires intensive traffic engineering research. We refer to this issue as theproblem of geographic traffic nonuniformity.
To manage global communications traffic, usually a model based onthe extent of the coverage areas of different systems is offered. In thismodel, it is presumed that there is an internetworking between satellitesin different altitude orbits and terrestrial systems. A sample of suchmanagement is shown in Figure 2.16. In this method, it is assumed thatlong-distance calls and communications between separately located areasare prepared via GEO satellites, whereas in more densely populated areascommunications may be provided by LEO satellites and terrestrial sys-tems. For personal communications in the next century, however, thismodel may not be any more useful, because users would communicate
Communications with LEO Satellites 65
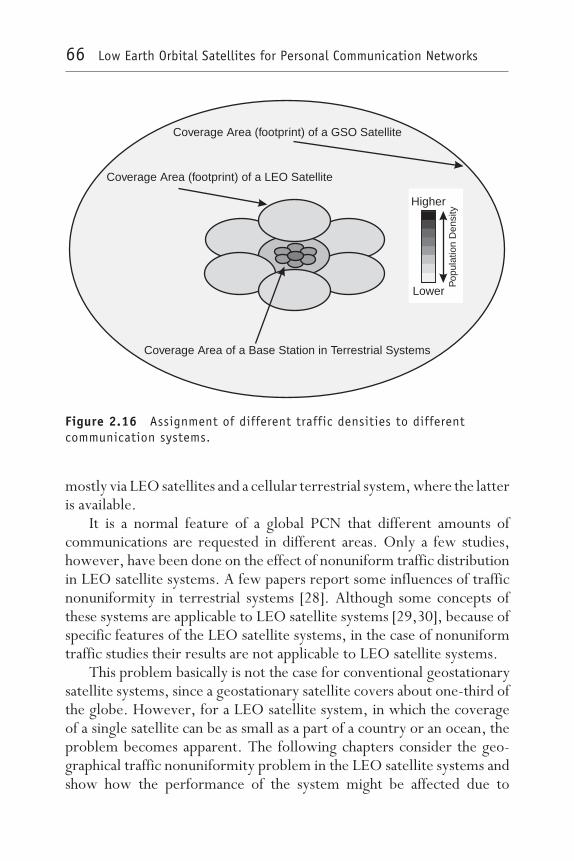
mostly via LEO satellites and a cellular terrestrial system, where the latteris available.
It is a normal feature of a global PCN that different amounts ofcommunications are requested in different areas. Only a few studies,however, have been done on the effect of nonuniform traffic distributionin LEO satellite systems. A few papers report some influences of trafficnonuniformity in terrestrial systems [28]. Although some concepts ofthese systems are applicable to LEO satellite systems [29,30], because ofspecific features of the LEO satellite systems, in the case of nonuniformtraffic studies their results are not applicable to LEO satellite systems.
This problem basically is not the case for conventional geostationarysatellite systems, since a geostationary satellite covers about one-third ofthe globe. However, for a LEO satellite system, in which the coverageof a single satellite can be as small as a part of a country or an ocean, theproblem becomes apparent. The following chapters consider the geo-graphical traffic nonuniformity problem in the LEO satellite systems andshow how the performance of the system might be affected due to
Coverage Area (footprint) of a GSO Satellite
Coverage Area (footprint) of a LEO Satellite
Coverage Area of a Base Station in Terrestrial Systems
Higher
Lower
Pop
ulat
ion
Den
sity
Figure 2.16 Assignment of different traffic densities to differentcommunication systems.
66 Low Earth Orbital Satellites for Personal Communication Networks

nonuniformity compared to a uniform traffic situation. We will considera personal communication system in which the communications areprovided only by LEO satellites, to exhibit the influence of geographictraffic nonuniformity on the performance of the system.
Before closing this introduction to the problem of traffic nonunifor-mity, it is interesting to consider the availability of the advantages ofspot-beam antennas in nonuniform traffic distribution. The reason is thatthe advantages of utilizing spot-beam antennas in LEO satellite systemsare very much effective in the traffic distribution of the system. Considera satellite system in which the number of spot beams in a satellite footprintand available frequency bands are Nc and Nf, respectively. Then, in anarrowband system and uniform traffic assumption, the required systembandwidth will be reduced approximately by the factor Nc/Nf (an advan-tage for spot-beam architecture). However, in the case of nonuniformtraffic distribution, we cannot expect the same advantageous effect.Especially if we assume the case in which all traffic channels are concen-trated in a single spot beam, the gain in bandwidth efficiency is completelylost. On the other hand, in the case of spread-spectrum systems, afterdividing the service area into multiple cells, the interference within theheavily loaded cell rises by a factor of Nc. Then, with respect to the factthat the spread-spectrum systems are interference limited, we shouldexpect a link degradation of 10 log Nc.
This discussion shows that in the case of nonuniform traffic distribu-tion, we cannot expect gain in bandwidth efficiency by partitioning theservice area into cells, although the advantage of the reduction in therequired transmitting powers of the satellites and users remains.
2.3 Modeling the LEO satellite systemsNow we will present a model for these systems that can be used in themathematical evaluation of their performance. An appropriate model isone that contains, as much as possible, the necessary information foranalyzing the performance of a LEO satellite system. The model shouldalso be as simple as possible from the viewpoint of mathematical tracta-bility. Moreover, the model should be competent with a realistic modelof the LEO satellite systems, which often is complicated.
Communications with LEO Satellites 67
From the examples of LEO satellite systems given in Section 1.3, itis clear that for global coverage it is necessary to configure a number ofLEO satellites on a multiorbit constellation, because of the small coverageof a LEO satellite compared to that of a conventional geostationary one.In such a multiorbit LEO satellite configuration, satellites exchangeinformation and control packets with each other through gateway Earthstations or intersatellite links.
Therefore, in analyzing the performance of a LEO satellite system,we would be concerned with a relatively complicated multiorbit, multi-satellite global communications network. Assume that the satellites areon low, circular Earth orbits of the altitude h. The number of orbits andthe number of satellites on each orbit are designed so that any area on theglobe can be covered by at least one satellite at any given time. Users’terminals have the capability of direct access with satellites in both uplinkand downlink directions. That assumption is realistic in the case of LEOsatellite systems, because the low altitude of the satellites, that is, the lowpropagation distance between users and satellites, allows low-power,hand-held personal terminals. As a preliminary assumption, we alsoassume that a user communicates with the satellite that requires thelowest transmitting power, to minimize the total interference power onthe channel. In a nonfading situation, that assumption means equal-sizeservice areas for all satellites.
To establish a connection between a user and a satellite, it is necessaryfor the user to have an elevation angle larger than a minimum value ofθmin to that satellite. That minimum elevation angle provides an upperbound on the service area of each satellite, which will be determined fora satellite system according to the constellation parameters, such asnumber of orbits, number of satellites, and their altitudes, as well as theaccess method utilized in the system. We refer to the upper band of theservice area to as the coverage area and to the actual one as the service area.With the assumption of equal-size service areas of satellites, the actualservice area of each satellite has a hexagonal shape. If we consider theperformance of a satellite system in which a type of spread-spectrumtechnique is employed for multiple accessing of users, the signal of anyuser located in the line of a satellite can reach that satellite and be addedto the level of multiple-access interference at the satellite. Therefore, for
68 Low Earth Orbital Satellites for Personal Communication Networks
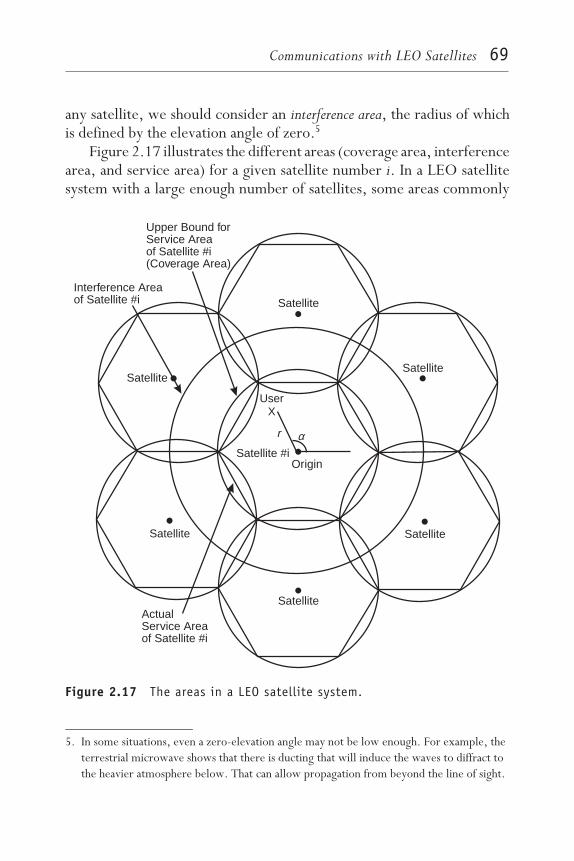
any satellite, we should consider an interference area, the radius of whichis defined by the elevation angle of zero.5
Figure 2.17 illustrates the different areas (coverage area, interferencearea, and service area) for a given satellite number i. In a LEO satellitesystem with a large enough number of satellites, some areas commonly
r
Interference Areaof Satellite #i
ActualService Areaof Satellite #i
Upper Bound forService Areaof Satellite #i(Coverage Area)
Origin
Satellite
Satellite Satellite
Satellite
Satellite
Satellite
Satellite #i
α
UserX
Figure 2.17 The areas in a LEO satellite system.
Communications with LEO Satellites 69
5. In some situations, even a zero-elevation angle may not be low enough. For example, theterrestrial microwave shows that there is ducting that will induce the waves to diffract tothe heavier atmosphere below. That can allow propagation from beyond the line of sight.
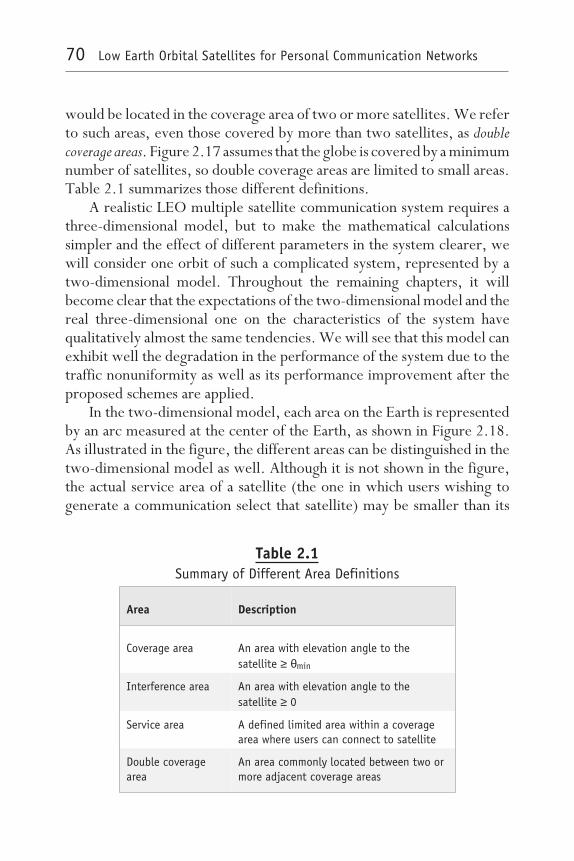
would be located in the coverage area of two or more satellites. We referto such areas, even those covered by more than two satellites, as doublecoverage areas. Figure 2.17 assumes that the globe is covered by a minimumnumber of satellites, so double coverage areas are limited to small areas.Table 2.1 summarizes those different definitions.
A realistic LEO multiple satellite communication system requires athree-dimensional model, but to make the mathematical calculationssimpler and the effect of different parameters in the system clearer, wewill consider one orbit of such a complicated system, represented by atwo-dimensional model. Throughout the remaining chapters, it willbecome clear that the expectations of the two-dimensional model and thereal three-dimensional one on the characteristics of the system havequalitatively almost the same tendencies. We will see that this model canexhibit well the degradation in the performance of the system due to thetraffic nonuniformity as well as its performance improvement after theproposed schemes are applied.
In the two-dimensional model, each area on the Earth is representedby an arc measured at the center of the Earth, as shown in Figure 2.18.As illustrated in the figure, the different areas can be distinguished in thetwo-dimensional model as well. Although it is not shown in the figure,the actual service area of a satellite (the one in which users wishing togenerate a communication select that satellite) may be smaller than its
Table 2.1Summary of Different Area Definitions
Area Description
Coverage area An area with elevation angle to thesatellite ≥ θmin
Interference area An area with elevation angle to thesatellite ≥ 0
Service area A defined limited area within a coveragearea where users can connect to satellite
Double coveragearea
An area commonly located between two ormore adjacent coverage areas
70 Low Earth Orbital Satellites for Personal Communication Networks

coverage area. One simple and natural example is the case in which allthe satellites are equally spaced on a circular orbit and dedicated with thesame-size service area. We refer to that method to as the natural methodand its corresponding service area to as the natural service area, where withNs satellites on each orbit, the size of the area measured by an angle at thecenter of the Earth is the same as the separation of the satellites, 2π/Ns.It is worth mentioning that Earth users in the interference area but out ofthe coverage area of a given satellite would not be allowed to connect tothat satellite, but their signals still can reach that satellite.
For most of the analyses in this book, we consider three succeedingsatellites in the same circular orbit. The relations between the definedareas for those three satellites are shown in Figure 2.19. In the figure, theobserved area is denoted as an area that is included in the interferenceareas of three succeeding satellites and will be considered in determiningthe performance of the LEO satellite system. We should note here that
SAT 1i −
θmin
Center of the Earth
Coverage Area
h
R
Interference Area
π/Ns
SAT i
SAT 1i +
Figure 2.18 A two-dimensional model of a LEO satellite system.
Communications with LEO Satellites 71

throughout the analyses the performance of three succeeding satellites asa part of a global LEO satellite communication network is considered.That does not mean ignorance of the effects of other satellites in the sameor adjacent orbits, for example, the ones shown in Figure 2.17. Becausethe interference area of each satellite is defined by the final line of sightof the satellite, the signal of any user in the interference area of thatsatellite can be reached at that satellite and adds to the level of its totalinterference at that satellite. We expect that partly examining the per-formance of the communication system can exhibit the performance ofthe whole system to some degree. In addition to the simplicity offered bythe partial evaluation of the performance of the system, the effects ofproposed schemes can be exhibited more clearly and their descriptionsbecome more understandable.
2.4 SummaryThis chapter introduced fundamental issues in the design of a LEOsatellite communications as well as specific issues that are the focus of this
IA
IA IA
CA
CA CA
SA SA SA
( 1)st Satellitei − i −th Satellite ( 1)st Satellitei +
Observed Area
CA: Coverage Area
SA: Service Area
IA: Interference Area
Figure 2.19 Illustration of the relations between service area,coverage area, and interference area.
72 Low Earth Orbital Satellites for Personal Communication Networks

book. The fundamental issues can be discussed in more detail fromdifferent viewpoints of engineering and not be limited to an electricalengineering perspective. The next chapter focuses the discussion on theperformance of LEO satellite systems from a communications engineer-ing viewpoint. The satellite system model introduced in Section 2.3 willbe explained in more detail, and a traffic model that can exhibit the effectof traffic nonuniformity in the case of LEO satellite systems will beintroduced. We will discuss the performance of the system when em-ploying the two forms of spread spectrum, the CDMA and the spread-slotted Aloha, mentioned in Section 2.2, as promising candidates for themultiple access of users in future LEO satellite systems. As alreadymentioned, to follow the discussion in this book, the reader is expectedto have some background in spread-spectrum systems, although somedetails are explained.
References[1] Jamalipour, A., et al., “A Performance Analysis on the Effects of Traffic
Nonuniformity in Low Earth-Orbit Satellite Communication Systems,” Proc.16th Symp. Inform. Theory, Applicat. (SITA ’93), Kanazawa, Japan, 1993,pp. 203–206.
[2] Jamalipour, A., et al., “Signal-to-Interference Ratio of CDMA in LowEarth-Orbital Satellite Communication Systems With Nonuniform TrafficDistribution,” Proc. IEEE GLOBECOM Conference, San Francisco, CA, 1994,pp. 1748–1752.
[3] Werner, M., et al., “Analysis of System Parameters for LEO/ICO-SatelliteCommunication Networks,” IEEE J. Select. Areas Commun., Vol. 13, No. 2,1995, pp. 371–381.
[4] Grubb, J. L., “The Traveler’s Dream Come True,” IEEE Commun. Magazine,No. 11, 1991, pp. 48–51.
[5] Chakraborty, D., “Survivable Communication Concept via Multiple LowEarth-Orbiting Satellites,” IEEE Trans. Aeroso. Electron. Syst., Vol. 25, No. 6,1989, pp. 879–889.
[6] Kaniyil, J., et al., “A Global Message Network Employing Low Earth-OrbitingSatellites,” IEEE J. Select. Areas Commun., Vol. 10, No. 2, 1992, pp. 418–427.
[7] Jamalipour, A., and A. Ogawa, “Traffic Characteristics of LEOS-Based GlobalPersonal Communications Networks,” IEEE Communication Mag., Vol. 35,No. 2, 1997, pp. 118–122.
Communications with LEO Satellites 73

[8] Pickholtz, R. L., “Communications by Means of Low Earth OrbitingSatellites,” Modern Radio Science 1996, J. Hamelin, ed., Oxford SciencePublications, U.R.S.I, pp. 133–149.
[9] Katayama, M., A. Ogawa, and N. Morinaga, “Satellite CommunicationSystems With Low-Earth Orbits and the Effects of Doppler Shift,” IEICETransactions, Vol. J76-B-II, No. 5, 1993, pp. 382–390.
[10] Katayama, M., A. Ogawa, and N. Morinaga, “Carrier Synchronization UnderDoppler Shift of the Nongeostationary Satellite Communication Systems,”Proc. Singapore ICCS/ISITA ‘92, Singapore, 1992, pp. 466–470.
[11] Katayama, M., and N. Morinaga, “A Study of the Communication SystemsUsing the Low-Altitude Nongeostationary Satellites,” Proc. IEEE Inter. Conf.System Engineering, Japan, 1992, pp. 452–456.
[12] Prasad, R., CDMA for Wireless Personal Communications, Norwood, MA: ArtechHouse, 1996.
[13] Abramson, N., “The ALOHA System—Another Alternative for ComputerCommunications,” Proc. 1970 Fall Joint Comp. Conf., 1970, pp. 281–285.
[14] Proakis, J. G., Digital Communications, 2nd ed., New York: McGraw-Hill, 1989.
[15] Viterbi, A. J., CDMA Principles of Spread Spectrum Communication, Reading, MA:Addison-Wesley, 1995.
[16] Gilhousen, K. S., et al., “Increased Capacity Using CDMA for Mobile SatelliteCommunication,” IEEE J. Select. Areas Commun., Vol. 8, No. 4, 1990,pp. 503–514.
[17] Gilhousen, K. S., et al., “On the Capacity of a Cellular CDMA System,” IEEETrans. Vehic. Technol., Vol. 40, No. 2, 1991, pp. 303–312.
[18] Kohno, R., R. Median, and L. B. Milstein, “Spread Spectrum Access Methodsfor Wireless Communications,” IEEE Commun. Mag., Vol. 33, No. 1, 1995,pp. 58–67.
[19] Schwartz, J. W., J. M. Aein, and J. Kaiser, “Modulation Techniques forMultiple-Access to a Hard Limiting Repeater,” Proc. IEEE, Vol. 54, 1966,pp. 763–777.
[20] Viterbi, A. J., “A Perspective on the Evaluation of Multiple Access SatelliteCommunication,” IEEE J. Select. Areas Commun., Vol. 10, No. 6, 1992,pp. 980–983.
[21] Viterbi, A. J., “The Evaluation of Digital Wireless Technology From SpaceExploration to Personal Communication Services,” IEEE Trans. Vehic. Technol.,Vol. 43, No. 3, 1994, pp. 638–644.
[22] Abramson, N., “Fundamentals of Packet Multiple Access for SatelliteNetworks,” IEEE J. Select. Areas Commun., Vol. 10, No. 2, 1992, pp. 309–316.
74 Low Earth Orbital Satellites for Personal Communication Networks
[23] Kahn, R. E., et al., “Advances in Packet Radio Technology,” Proc. IEEE,Vol. 66, 1978, pp. 1468–1496.
[24] Falk, G., et al., “Integration of Voice and Data in the Wideband PacketSatellite Networks,” IEEE J. Select. Areas Commun., Vol. SAC-1, No. 6, 1983,pp. 1076–1083.
[25] Wilson, N. D., et al., “Packet CDMA Versus Dynamic TDMA for MultipleAccess in an Integrated Voice/Data PCN,” IEEE J. Select. Areas Commun.,Vol. 11, No. 6, 1993, pp. 870–884.
[26] Sato, T., et al., “Throughput Analysis of DS/SSMA Unslotted Systems WithFixed Packet Length,” IEEE J. Select. Areas Commun., Vol. 14, No. 4, 1996,pp. 750–756.
[27] Makrakis, D., and K. M. Sundaru Murthy, “Spread Slotted ALOHATechniques for Mobile and Personal Satellite Communication Systems,”IEEE J. Select. Areas Commun., Vol. 10, No. 6, 1992, pp. 985–1002.
[28] Sato, S., et al., “A Performance Analysis on Non-Uniform Traffic in Micro CellSystems,” Proc. IEEE ICC’93, Switzerland, 1993, Vol. 3, pp. 1960–1964.
[29] Pullman, M. A., K. M. Peterson, and Y. Jan, “Meeting the Challenge ofApplying Cellular Concepts to LEO SATCOM Systems,” Proc. IEEE ICC ’92,Chicago, IL, 1992, Vol. 2, pp. 770–773.
[30] Chin, L., and J. Chang, “Using Low Earth Orbiting Satellites to Backup theSupport of the Existing Ground Mobile Communications,” Proc. IEEE ICC ’93,Switzerland, 1993, Vol. 3, pp. 1103–1107.
Selected bibliography“Code Division Multiple Access Networks I,” special issue of IEEE J. Select. AreasCommun., Vol. 12, No. 4, May 1994.
“Code Division Multiple Access Networks II,” special issue of IEEE J. Select. AreasCommun., Vol. 12, No. 5, June 1994.
“Digital Cellular Technologies,” special issue of IEEE Trans. Vehicular Tech., Vol. 40,No. 2, May 1991.
Glisic, S., and B. Vucetic, Spread Spectrum CDMA Systems for Wireless Communications,Norwood, MA: Artech House, 1997.
Miller, M. J., B. Vucetic, and L. Berry, eds., Satellite Communications: Mobile andFixed Services, Boston: Kluwer Academic Publishers, 1993.
Pratt, T., and C. W. Bostian, Satellite Communications, New York: Wiley, 1986.
Communications with LEO Satellites 75
Low Earth Orbital Satellites for Personal Communication Networks
3Application of CDMA in LEO
Satellite Systems
A , multiple-access schemes based on spread-spec-trum techniques, especially CDMA, are promising candidates forfuture LEO satellite communications systems. As already men-
tioned, the reason that the wide bandwidth of spread-spectrum wave-forms introduces frequency diversity, which can mitigate multipath andinterference [1–6]. In addition, with CDMA it is possible to use the samecarrier frequency in all service areas, so when a user leaves the servicearea of a satellite and enters the next area, switching the user’s connectionto a new satellite, a process referred to as hand-off, requires a simplerprocess than the parallel process in TDMA or FDMA. In this chapter,CDMA will be employed on the uplinks (i.e., users-to-satellites links) ofour LEO satellite system, and performance of that scheme in uniform andnonuniform traffic distributions will be evaluated. In some literature,uplink is referred to as reverse link; throughout this text, however, we
77
refer to it as uplink, because that name better indicates the physicaldirection of the link.
This chapter investigates the performance of a LEO satellite systemfor two types of traffic information scenarios. The first scenario is ageneral CDMA system designed to service analog-type terminals [7,8].After that, we discuss the performance of CDMA in a LEO satellitesystem when an integrated voice/data traffic scenario is involved [9].Examination of the first situation is made analytically, whereas the secondsystem is described by simulation. Future LEO satellite-based PCNs areexpected to support different types of information; hence, such anintegrated information analysis is necessary.
This chapter will show that in analog systems when CDMA is appliedon the uplinks, traffic nonuniformity causes large differences in the signalqualities at succeeding satellites; a satellite above a heavily loaded (dense)traffic area has a low signal-to-interference ratio (SIR), while its neighborsatellites over lightly loaded (sparse) traffic areas have a high level of SIR.As a result of that phenomenon, the performance of each user becomesa variable of location and the satellite with which the user is connected,not a proper feature in a communications system. To make the depend-ency weaker, a traffic assignment scheme, which makes the traffic loadof the satellite over the dense traffic area smaller, is proposed and itsperformance improvement is estimated.
In the integrated traffic scenario, according to the simulation results,traffic nonuniformity affects the performance of the system almost in thesame manner as for nonintegrated systems. It will be shown that the ratioof the population of data users to that of voice users has little effect onthe performance of system. By modeling the satellite system during themovement of the satellites, the change in signal quality during peak trafficload in their route is also determined, and the worst case from theviewpoint of performance is derived.
The chapter is organized as follows. Section 3.1 considers an analogscenario. The mathematical model for the traffic nonuniformity and thecalculations on SIR with a number of numerical examples are given inthat section. Through the examples, we find the situation in which thetraffic nonuniformity has the largest effect on the performance of thesystem and name it the worst case. At the end of the section, we proposea traffic assignment control method, which equalizes the traffic loads of
78 Low Earth Orbital Satellites for Personal Communication Networks
service areas to some degree, and investigate its capability with numericalexamples.
Section 3.2 continues the discussion of CDMA for an integratedvoice/data scenario. We first explain the integrated voice/data systemand the extension of the traffic model. The calculation of SIR andsimulation environment also are given in this section. The performanceof the system in both situations of the worst case and during the move-ment of the satellites is evaluated. The section finishes by proposing amodified power control scheme, very similar to the traffic assignmentcontrol scheme explained in Section 3.1.
3.1 Performance evaluation of analog systemsIn this section, a general direct-sequence CDMA scheme is employed onthe uplinks of the LEO satellite system, and its performance in uniformand nonuniform traffic distributions are discussed by the measure of SIR.Because in CDMA all users send their information with the same carrierfrequency, the dominant factor that affects the signal quality is theinterference from other users, rather than simple background (mostlythermal) noise, as in channel-assignment schemes such as TDMA orFDMA. Therefore, we use the expression “signal-to-interference” ratioinstead of the conventional “signal-to-noise” ratio, although the back-ground thermal noise is considered part of total interference.
We introduce the traffic model and then derive the SIR at individualsatellites. In considering the movement of the satellites, we discuss theeffect of relative locations of the satellites to the peak of the traffic loadon SIR. We also investigate the performance variation according to thedegree of the traffic nonuniformity.
3.1.1 Traffic modelingSection 2.2 explained the existence of the traffic-nonuniformity problemin LEO satellite systems. According to the conclusions given there, wecan expect the distribution of communications traffic loads on the globeto be a combination of heavily populated areas, lightly populated areas,and areas with very small population [10]. To model such geographictraffic nonuniformity mathematically, there might be different kinds of
Application of CDMA in LEO Satellite Systems 79
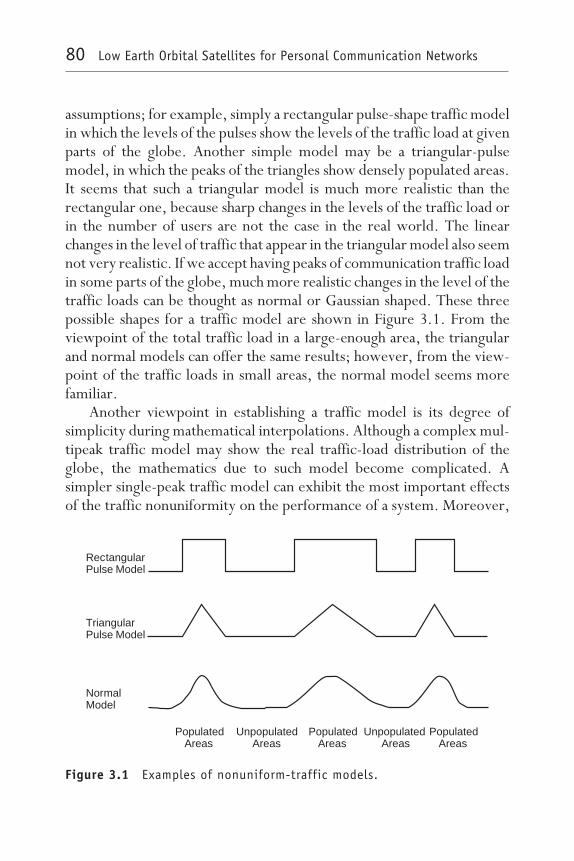
assumptions; for example, simply a rectangular pulse-shape traffic modelin which the levels of the pulses show the levels of the traffic load at givenparts of the globe. Another simple model may be a triangular-pulsemodel, in which the peaks of the triangles show densely populated areas.It seems that such a triangular model is much more realistic than therectangular one, because sharp changes in the levels of the traffic load orin the number of users are not the case in the real world. The linearchanges in the level of traffic that appear in the triangular model also seemnot very realistic. If we accept having peaks of communication traffic loadin some parts of the globe, much more realistic changes in the level of thetraffic loads can be thought as normal or Gaussian shaped. These threepossible shapes for a traffic model are shown in Figure 3.1. From theviewpoint of the total traffic load in a large-enough area, the triangularand normal models can offer the same results; however, from the view-point of the traffic loads in small areas, the normal model seems morefamiliar.
Another viewpoint in establishing a traffic model is its degree ofsimplicity during mathematical interpolations. Although a complex mul-tipeak traffic model may show the real traffic-load distribution of theglobe, the mathematics due to such model become complicated. Asimpler single-peak traffic model can exhibit the most important effectsof the traffic nonuniformity on the performance of a system. Moreover,
PopulatedAreas
PopulatedAreas
PopulatedAreas
UnpopulatedAreas
UnpopulatedAreas
RectangularPulse Model
TriangularPulse Model
NormalModel
Figure 3.1 Examples of nonuniform-traffic models.
80 Low Earth Orbital Satellites for Personal Communication Networks
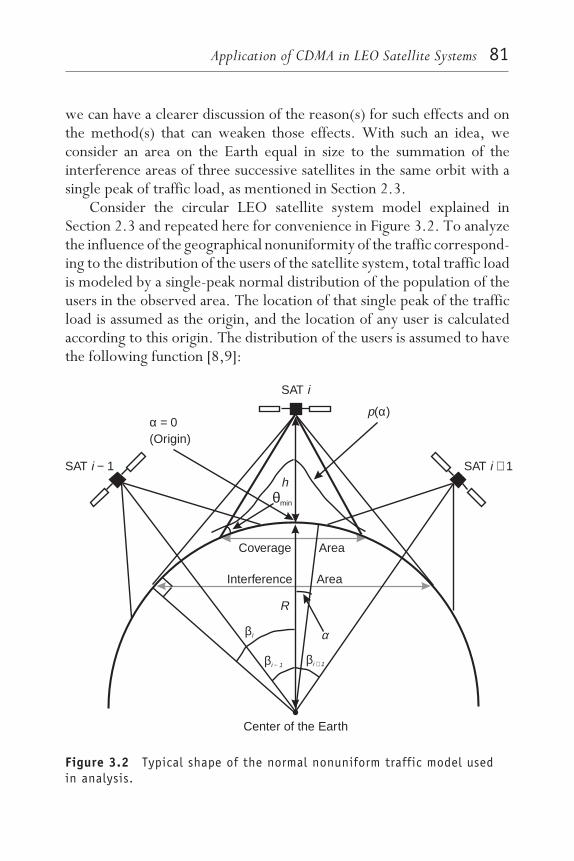
we can have a clearer discussion of the reason(s) for such effects and onthe method(s) that can weaken those effects. With such an idea, weconsider an area on the Earth equal in size to the summation of theinterference areas of three successive satellites in the same orbit with asingle peak of traffic load, as mentioned in Section 2.3.
Consider the circular LEO satellite system model explained inSection 2.3 and repeated here for convenience in Figure 3.2. To analyzethe influence of the geographical nonuniformity of the traffic correspond-ing to the distribution of the users of the satellite system, total traffic loadis modeled by a single-peak normal distribution of the population of theusers in the observed area. The location of that single peak of the trafficload is assumed as the origin, and the location of any user is calculatedaccording to this origin. The distribution of the users is assumed to havethe following function [8,9]:
SAT i
SAT 1i − SAT 1i +
Coverage Area
Interference Area
α
(Origin)α = 0
Center of the Earth
p( )α
R
h
βI
βi 1− βi 1+
θmin
Figure 3.2 Typical shape of the normal nonuniform traffic model usedin analysis.
Application of CDMA in LEO Satellite Systems 81

p(α) = A
ωexp(−α2⁄2ω2) |α|≤ π (3.1)
where α is the angular distance of any user from the origin measured bythe angle at the center of the Earth in radians, ω is a parameter repre-senting the degree of uniformity of traffic, and A is a factor related to thetotal traffic load (total number of users) in the observed area (this factorwill be explained later). With that definition, the traffic nonuniformityis expressed by ω; that is, larger values of ω expand the normal functionmore and an infinite value of ω realizes a uniform traffic distribution. Atypical shape of p(α) is shown in Figure 3.2.
To investigate the effect of traffic nonuniformity with this model, thetotal traffic load for the satellites under consideration should be kept fixedwhen ω or the number of satellites in each orbit, Ns, changes. For thatpurpose, we assume that the total traffic load of three natural serviceareas, when the peak of the traffic is located at the origin, is constant andequal to B and thus
A = B⁄ ∫−3π⁄Ns
+3π⁄Ns
exp(−α2⁄2ω2) ⁄ω
dα (3.2)
The ratio of the traffic loads of two adjacent natural service areas,when the peak of traffic is located at the origin, as shown in Figure 3.2,can be found from
traffic ratio = ∫−π⁄Ns
π⁄Ns
p(α)dα ⁄ ∫π⁄Ns
3π⁄Ns
p(α)dα (3.3)
The traffic ratio for different numbers of satellites in an orbit, Ns, is shownin Figure 3.3.
3.1.2 SIR: The measure of performance
3.1.2.1 CDMA as multiple-access method and SIR calculationsThis section evaluates the effects of traffic nonuniformity on the perform-ance of the uplinks of a LEO satellite system. Direct-sequence CDMA isutilized as the multiple-access scheme in this direction.
82 Low Earth Orbital Satellites for Personal Communication Networks

An important issue in multiple-accessing methods based on CDMAis the equalization of powers of receiving signals at each base station,referred to as reverse link power control [11–13]. With that control, thesignals of all users reach the base stations with the same power regardlessof their distances to the base stations. Without such control, the prob-ability of successful transmission for users near the base stations is muchhigher than the ones far from the base stations. This phenomenon isreferred to as the near-far problem, and it is said that power control is aneffective method to remedy the problem. Moreover, it is said that powercontrol can realize equal channel sharing and maximize the capacity ofthe CDMA.
N
N
N
s
s
s
===
11
15
19
1,000
100
10
1.1 1 10
Traf
ficR
atio
Measure of Uniformity in Traffic, ω
Figure 3.3 Ratio of traffic in the service area of two adjacent satellites(the first one is over the traffic peak) for different number of satellitesin one orbit.
Application of CDMA in LEO Satellite Systems 83
In a LEO satellite system, this requirement can be satisfied if eachEarth station has the knowledge of the required transmitting power levelsto all visible satellites, by measuring the power of pilot signals receivedfrom the satellites [11]. Therefore, we assume that each satellite continu-ously transmits a pilot signal whose power level is known by all users.Comparing the received power level of this pilot signal with the refer-enced one, users can calculate their distance to all visible satellites andalso can transmit their information with controlled power to allowreception at the connecting satellite with equal power to other usersconnecting to that satellite.
In the case of LEO satellite systems compared with terrestrial sys-tems, because of relatively small effects of shadowing and Rayleigh fading,it is reasonable to assume that the radio signal power is attenuatedin proportion to the second power of propagation distance [14,15].(Shadowing and Rayleigh fading problems in the case of LEO satellitesystems are discussed in Chapter 6.) Under that assumption, when thelocation of the Earth station (equipped with isotropic antenna) is α, therequired transmitting power level to the ith satellite equals
Pi(α) = κSi ⋅ li2 (α) i = 1, 2, …, Ns (3.4)
where Si is the designed receiving power level of the signals at the ithsatellite, and li(α) is the distance (measured in meters) between the ithsatellite and the Earth station at the angular offset α. κ is a constant withthe dimension of m2, but, as will be seen later, in final equations of SIRthe ratio of powers rather than their absolute values are involved. Thenκ can be assumed as unity, and hence we neglect it in the next equationfor simplicity. (Note that if the background noise level is negligiblecompared to the level of multiple-access interference, κ can be com-pletely neglected in the evaluation of SIR; however, if we consider thebackground noise as a part of total interference, κ cannot be neglected.)At the moment, we assume different power levels at satellites (e.g., Sifor the ith one) and derive a general form of SIR equations. However, byassuming Si = S for all i, an equal power scenario can be simply derived.
If the location of the ith satellite is βi, the distance li(α) becomes
84 Low Earth Orbital Satellites for Personal Communication Networks
li(α) = R + h − R cos(βi − α)
2 + R2 sin2(βi − α)
1⁄2
i = 1, 2, …, Ns(3.5)
where R is the average radius of the Earth, about 6,378 km, and h is thealtitude of the satellites. When two or more satellites are visible at thesame time for an Earth station, the user compares the required transmit-ting power to each of them and connects to the satellite that requireslower power. Note that, at the instant shown in Figure 3.2, βi is equal tozero, while the other two satellites have nonzero (positive and negative)values equal to the separation of the satellites.
When the uplink is designed to operate at an adequate power level,in CDMA systems, the effect of thermal noise generally is smaller thanthat of interference; hence, SIR is a proper measure of the systemperformance. Note that there is a simple relation between SIR and Eb/N0;the ratio of signal energy per bit to interference plus noise energy (whichsometimes is referred to as required SIR to achieve a specified error rateperformance) is as follows [15]:
SIR = Eb ⁄ N0
2Rb
Wss
(3.6)
where Rb is the data bit rate, and Wss is the spread-spectrum bandwidth.Then one can derive the error rate performance easily.
For a given user of the ith satellite, the transmitted signal arrives atthat satellite with the power Si, and signals of all other simultaneoustransmissions from the users located in the service area and interferencearea of that satellite appear as additive interference. Thus, the SIR at theith satellite becomes
SIRi = Si⁄Ii (3.7)
where Ii is the total power of the interference at the ith satellite, de-scribed as
Application of CDMA in LEO Satellite Systems 85

Ii = ∫p(α) ⋅ minPi(α)
⋅ li
−2 (α)dα, i = 1, 2, …, Ns (3.8)
where min[x] is the minimum value of x and describes the connection ofany user to the satellite that requires the lowest transmitting power. Theinterval of the integration in (3.8) should be determined for each areaseparately, as discussed next.
As a result of sphericity of the Earth, if the angular distance betweena satellite and a user is larger than βI, the transmitting signal of that userdoes not reach that satellite, where
βI = cos−1(R⁄R + h) (3.9)
is the interference limit angle. The interference limits are shown inFigure 3.2 for the ith satellite. Let all Ns satellites on an orbit request thesame required transmitting powers, and thus users connect to the nearestsatellite: natural service area configuration will be realized. In that case,from (3.8), the interference reached at the ith satellite at βi can bedetermined from
Ii = Si∫βi − π⁄Ns
βi + π⁄Ns
p(α)dα + Si − 1∫βi − βI
βi − π⁄Ns
p(α)li − 12 (α)li−2(α)dα
+ Si + 1 ∫βi + π⁄Ns
βi + βIp(α)li +1
2 (α)li−2(α)dα (3.10)
where Si, Si – 1, and Si + 1 are the designed receiving signal powers at theith and its adjacent satellites, which are now assumed to be the samevalues. The first term in (3.10) is the interference reached from the userslocated in the service area of the ith satellite; however, two other termsshow the interferences from the users of neighboring satellites in theinterference area of the ith satellite. If the designed receiving powerdiffers for each satellite, the service area and the interference area will be
86 Low Earth Orbital Satellites for Personal Communication Networks

different from those in (3.10). (The performance control that resultsfrom changing these powers is discussed in Section 3.1.3.)
3.1.2.2 The effect of satellite position on SIRBecause in a LEO satellite system the satellites are on nongeostationaryorbits, they are in continuous motion, with relatively high ground speed,which is determined according to the altitude of the satellites and whichwas shown in Section 1.2 [16]. Here we examine the changes in SIRcharacteristics according to the travel of satellites, assuming that a non-uniform traffic distribution as (3.1), with a predefined value of ω in aspecified area within the satellites’ path, exists. In this analysis, we assumethat the satellites are on circular orbits. The circular orbits usually areused in LEO satellite system constellations and simplify the control of thesystem considerably.
Figure 3.4 shows the changes in the SIR characteristics of two adjacentsatellites, the ith and the (i + 1)st ones, as a function of βi, that is, theangular position of the ith satellite, for typical constellation parametersof h = 800 km, Ns = 11 [17,18], and ω = 0.2, when Si= S for all satellites.According to Figure 3.3, in this case, the number of users of the ithsatellite is about twice those of its neighbor satellites, the (i − 1)st and the(i + 1)st ones. Assuming counterclockwise rotation of the satellites,βi = −2π/Ns is the instant when the ith satellite is far from the peak of thetraffic by equal angle as the separation of the satellites, 2π/Ns, and the(i + 1)st one is just over this peak. They rotate in their circular orbit witha constant angular velocity, until the ith satellite reaches a symmetricalposition to the traffic peak as the start point, that is, βi = 2π/Ns. At thehalfway point, when βi= 0, the ith satellite is located just above the trafficpeak. If we define the worst situation of system performance as the casewhen the signal quality at a satellite has the lowest value, from thiscalculation, this is the case where the peak of the traffic load lies just underone of the satellites, that is, βi = 0 and βi = −2π/Ns. Figure 3.4 shows thatat those points the satellite above traffic peak has low signal quality;however, its neighbor satellite has a large value of SIR.
An important point drawn from Figure 3.4 is that there are largevariations in signal quality at each satellite when a nonuniform distribu-tion of users exists. That phenomenon may be acceptable while the levelof SIR is higher than a threshold that ensures an acceptable error rate;
Application of CDMA in LEO Satellite Systems 87
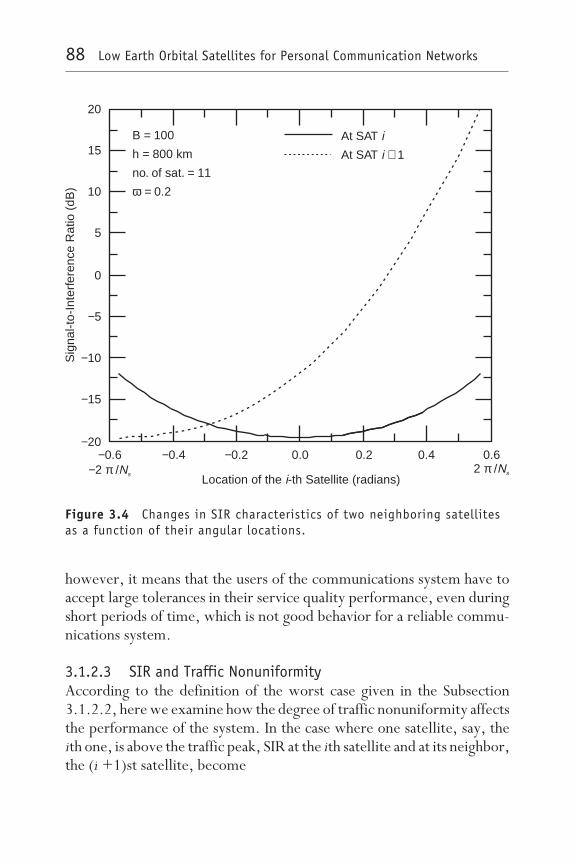
however, it means that the users of the communications system have toaccept large tolerances in their service quality performance, even duringshort periods of time, which is not good behavior for a reliable commu-nications system.
3.1.2.3 SIR and Traffic NonuniformityAccording to the definition of the worst case given in the Subsection3.1.2.2, here we examine how the degree of traffic nonuniformity affectsthe performance of the system. In the case where one satellite, say, theith one, is above the traffic peak, SIR at the ith satellite and at its neighbor,the (i +1)st satellite, become
B 100
h 800 km
no. of sat. 11
0.2
==
=ω =
At SAT
At SAT 1
i
i +
Sig
nal-t
o-In
terf
eren
ceR
atio
(dB
)
Location of the -th Satellite (radians)i
20
15
10
5
0
−5
−10
−15
−20
− π2 /Ns2 /π Ns
−0.6 0.0 0.2 0.4 0.6−0.4 −0.2
Figure 3.4 Changes in SIR characteristics of two neighboring satellitesas a function of their angular locations.
88 Low Earth Orbital Satellites for Personal Communication Networks
SIRi = 1⁄2∫
0
π⁄Ns
p(α)dα + ∫π⁄Ns
βIp(α) ⋅ li + 1
2 (α) ⋅ li−2(α)dα
(3.11)
SIRi + 1 = 1 ⁄∫
π⁄Ns
3π⁄Ns
p(α)dα + ∫2π⁄Ns − βI
π⁄Ns
p(α)li2(α)li + 1−2 (α)dαright]
+ ∫ p3π⁄Ns
2π⁄Ns + βI(α)li + 2
2 (α)li + 1−2 (α)dα
(3.12)
again with the assumption that the satellites have the same designedreceiving power levels, S. For the sake of simplicity, let us name the ithsatellite above the peak of the traffic with a large number of users as thedense traffic satellite (DTS) and its neighbors with smaller numbers of usersas sparse traffic satellites (STSs). Figure 3.5 shows the SIR characteristicsat the DTS and each STS as a function of traffic nonuniformity forh = 800 km and Ns = 11. As can be seen in the figure, in large trafficnonuniformity (i.e., small ω), there are large differences between thesignal qualities at the satellites, one above the dense traffic area andanother above the area with sparse traffic. Also, the result of the casewhen more satellites exist in each orbit is shown in Figure 3.6. When thenumber of satellites in each orbit is increased, the service area and hencethe number of users connecting to each satellite is decreased. It seemsthat the increase in the number of satellites can improve the performanceof satellites with high communications traffic; although such methodsincrease the total cost of the satellite system. However, from Figure 3.6,we can conclude that the increase in the number of satellites givesnegligible performance improvement for the DTS when the degree oftraffic nonuniformity is large. For the case in which the number ofsatellites is 11 but the satellites have a higher altitude (i.e., h = 1,500 km),almost the same result as Figure 3.6 can be achieved; thus, the same kindof conclusion on the effect of the altitude on SIR can be drawn.
Application of CDMA in LEO Satellite Systems 89
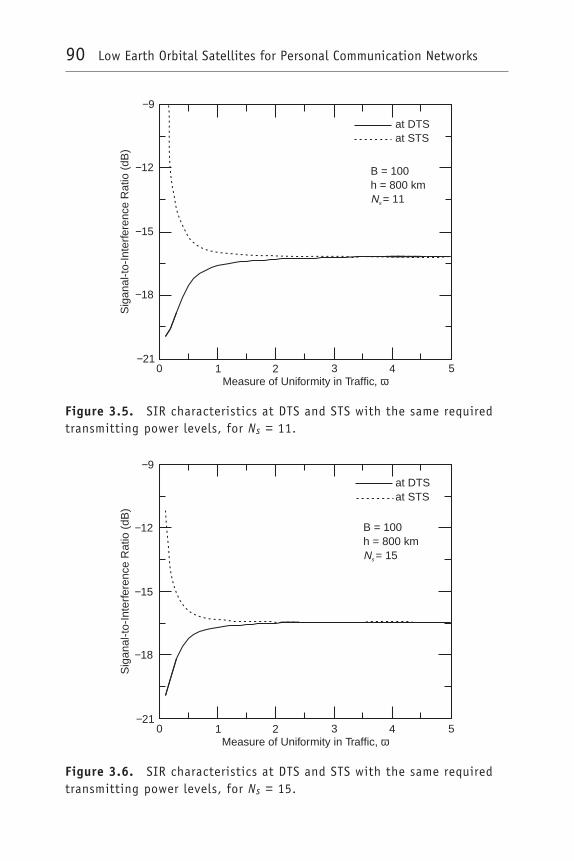
at DTSat STS
B = 100h = 800 km
= 11Ns
Sig
anal
-to-
Inte
rfer
ence
Rat
io(d
B)
−9
−12
−15
−18
−21
Measure of Uniformity in Traffic, ω0 1 2 3 4 5
Figure 3.5. SIR characteristics at DTS and STS with the same requiredtransmitting power levels, for Ns = 11.
B = 100h = 800 km
= 15Ns
at DTSat STS
Sig
anal
-to-
Inte
rfer
ence
Rat
io(d
B)
−9
−12
−15
−18
−21
Measure of Uniformity in Traffic, ω0 1 2 3 4 5
Figure 3.6. SIR characteristics at DTS and STS with the same requiredtransmitting power levels, for Ns = 15.
90 Low Earth Orbital Satellites for Personal Communication Networks

As mentioned in Chapter 2, in the LEO satellite systems, someregions are in the coverage area of two or more satellites at the same time.Those areas, conventionally referred to as double coverage areas, are theresult of the altitude and the number of satellites in each orbit. In a systemwith satellites higher in altitude or with a larger number of satellites ineach orbit, the portion of the users located in double coverage areasbecomes larger; hence, we observe some performance improvement.Note that a user in a double coverage area has the choice to connect toany the satellites that cover the area, if the protocol used in the systempermits such selection to its users. The existence of such double coverageareas in LEO satellite systems suggests that there should be some flexi-bility in the definition of a service area other than natural method. It alsosuggests the possibility of performance improvement with other methodsof assignment to users to satellites.
3.1.3 Traffic assignment control
3.1.3.1 Optimum controlSubsection 3.1.2 assumed that the required receiving powers of allsatellites are the same and, hence, that service areas of all satellites areequal in size, referred to as natural service area configuration. Thatconfiguration, although natural in the case of uniform traffic, no longerhas merit when the nonuniform distribution of users is involved. Thereneeds to be a method that can change the size of service areas accordingto the offered traffic loads. As an example of such a method, this sectionproposes a scheme in which the designed receiving powers of the satellitesare not equal. The proposed method would control the size of serviceareas according to their local traffic loads; that is, the service areas withlight traffic loads are expanded, and the ones with heavier traffic loads aredecreased. Obviously, in the case of uniform traffic, the size of serviceareas would be returned to the areas that appear in a natural service areaconfiguration.
In this manner, let us first assume that the peak of the traffic is locatedunder the ith satellite, that is, the DTS. Because the users communicatewith the satellite that needs the smallest transmitting power, by increasingthe required transmitting power of the DTS compared with its adjacentsatellites on both sides (the STSs), it is possible to increase the tendency
Application of CDMA in LEO Satellite Systems 91
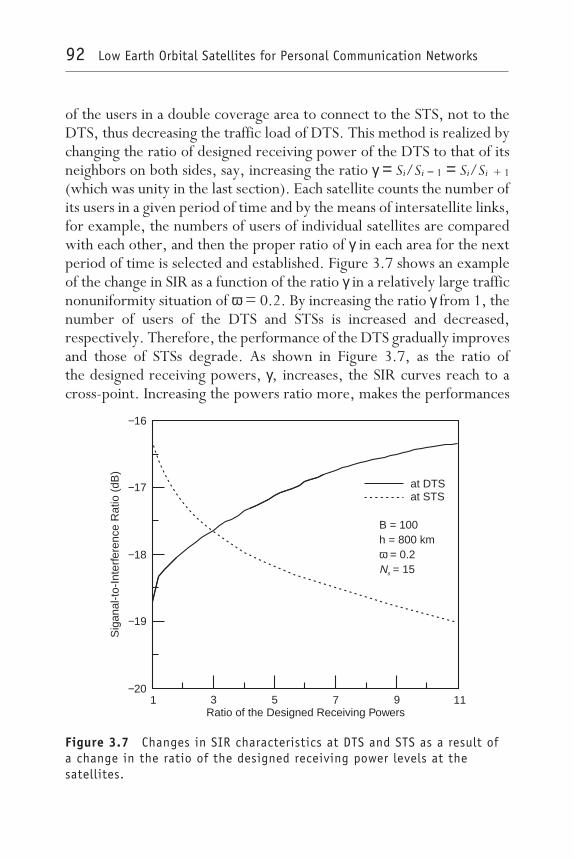
of the users in a double coverage area to connect to the STS, not to theDTS, thus decreasing the traffic load of DTS. This method is realized bychanging the ratio of designed receiving power of the DTS to that of itsneighbors on both sides, say, increasing the ratio γ = Si/Si − 1 = Si/Si + 1
(which was unity in the last section). Each satellite counts the number ofits users in a given period of time and by the means of intersatellite links,for example, the numbers of users of individual satellites are comparedwith each other, and then the proper ratio of γ in each area for the nextperiod of time is selected and established. Figure 3.7 shows an exampleof the change in SIR as a function of the ratio γ in a relatively large trafficnonuniformity situation of ω = 0.2. By increasing the ratio γ from 1, thenumber of users of the DTS and STSs is increased and decreased,respectively. Therefore, the performance of the DTS gradually improvesand those of STSs degrade. As shown in Figure 3.7, as the ratio ofthe designed receiving powers, γ, increases, the SIR curves reach to across-point. Increasing the powers ratio more, makes the performances
B = 100h = 800 km
= 0.2= 15
ωNs
at DTSat STS
Ratio of the Designed Receiving Powers1 3 5 7 9 11
Sig
anal
-to-
Inte
rfer
ence
Rat
io(d
B)
−16
−17
−18
−19
−20
Figure 3.7 Changes in SIR characteristics at DTS and STS as a result ofa change in the ratio of the designed receiving power levels at thesatellites.
92 Low Earth Orbital Satellites for Personal Communication Networks

of STSs worse than that of the DTS. From the viewpoint of service qualityfor a given user, it is desirable to establish the same signal qualities whenthe connecting satellite of a given user is changed. Therefore, if we definethe optimum control as one that makes all the satellites have the same SIRcharacteristics, the cross-point exhibits the optimum control.
3.1.3.2 Measuring the optimum capabilityTaking appropriate powers ratios that achieve the optimum control foreach traffic nonuniformity situation (i.e., for each ω) gives the SIRcharacteristics shown in Figure 3.8 and Figure 3.9 for Ns = 11 and Ns = 19,respectively. These figures show the changes in SIR characteristics at DTSand STS before and after applying the control scheme, where the solidlines show the SIR at both the DTS and the STS when optimum control
B = 100
h = 800 km
= 11Ns
Optimum control
at DTS, equal required powers
at STS, equal required powers
Sig
anal
-to-
Inte
rfer
ence
Rat
io (
dB)
−9
−12
−15
−18
−21
Measure of Uniformity in Traffic, ω0.1 0.6 1.1 1.6 2.1
Figure 3.8 Effect of controlling the required transmitting powers ofsatellites in its optimum case, for Ns = 11.
Application of CDMA in LEO Satellite Systems 93
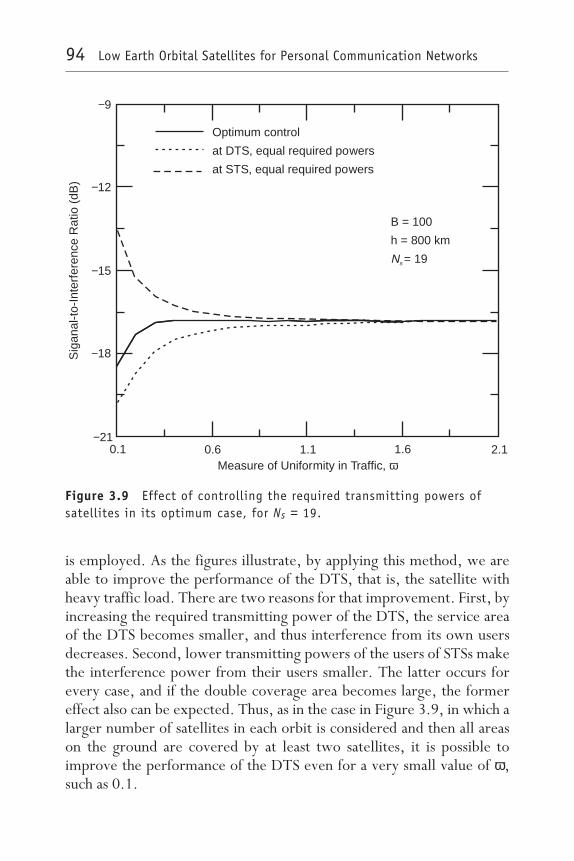
is employed. As the figures illustrate, by applying this method, we areable to improve the performance of the DTS, that is, the satellite withheavy traffic load. There are two reasons for that improvement. First, byincreasing the required transmitting power of the DTS, the service areaof the DTS becomes smaller, and thus interference from its own usersdecreases. Second, lower transmitting powers of the users of STSs makethe interference power from their users smaller. The latter occurs forevery case, and if the double coverage area becomes large, the formereffect also can be expected. Thus, as in the case in Figure 3.9, in which alarger number of satellites in each orbit is considered and then all areason the ground are covered by at least two satellites, it is possible toimprove the performance of the DTS even for a very small value of ω,such as 0.1.
B = 100
h = 800 km
= 19Ns
Optimum control
at DTS, equal required powers
at STS, equal required powers
Sig
anal
-to-
Inte
rfer
ence
Rat
io (
dB)
−9
−12
−15
−18
−21
Measure of Uniformity in Traffic, ω0.1 0.6 1.1 1.6 2.1
Figure 3.9 Effect of controlling the required transmitting powers ofsatellites in its optimum case, for Ns = 19.
94 Low Earth Orbital Satellites for Personal Communication Networks
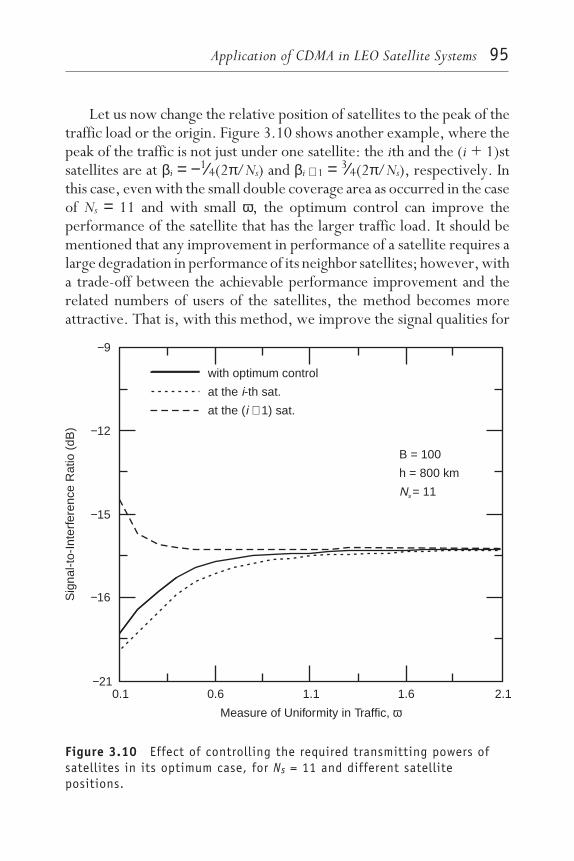
Let us now change the relative position of satellites to the peak of thetraffic load or the origin. Figure 3.10 shows another example, where thepeak of the traffic is not just under one satellite: the ith and the (i + 1)stsatellites are at βi = −1⁄4(2π/Ns) and βi + 1 = 3⁄4(2π/Ns), respectively. Inthis case, even with the small double coverage area as occurred in the caseof Ns = 11 and with small ω, the optimum control can improve theperformance of the satellite that has the larger traffic load. It should bementioned that any improvement in performance of a satellite requires alarge degradation in performance of its neighbor satellites; however, witha trade-off between the achievable performance improvement and therelated numbers of users of the satellites, the method becomes moreattractive. That is, with this method, we improve the signal qualities for
−9
−12
−15
−16
−210.1 0.6 1.1 1.6 2.1
Measure of Uniformity in Traffic, ω
Sig
nal-t
o-In
terf
eren
ceR
atio
(dB
)
B = 100
h = 800 km
= 11Ns
with optimum control
at the -th sat.
at the ( 1) sat.
i
i +
Figure 3.10 Effect of controlling the required transmitting powers ofsatellites in its optimum case, for Ns = 11 and different satellitepositions.
Application of CDMA in LEO Satellite Systems 95
a large population of users at the expense of degrading the performanceof a smaller population of users. The important point is that we canmaintain the performance for all users at an acceptable level; establishingthe same signal quality at all service areas is much easier.
3.2 Performance of integrated voice/data systemsIn Section 3.1, the effect of traffic nonuniformity on the signal qualityand performance of a LEO satellite communications system was deter-mined. That analysis made no distinctions on the information type. In thissection, we plan to examine the problem of traffic nonuniformity in anintegrated voice/data scenario, which is of much interest in futurePCNs [19,20].
To follow the calculations given in Section 3.1, in this section wedetermine the SIR characteristics at LEO satellites through simulation intwo steps [9]. First, the case in which the satellites are assumed to be fixedwith respect to the heavy traffic area in a short period of time is consid-ered, and the relation between their performances and the intensity oftraffic nonuniformity is estimated. After that, the investigation is gener-alized to the real case, that is, during the movement of satellites. Althoughthe main purpose here is the estimation of the performance of LEOsystems in nonuniform traffic situations, a modified power controlmethod with the aim of remedying the effects of traffic nonuniformityalso are discussed.
3.2.1 System considerationsConsider again the LEO satellite system model explained inSection 3.1.1. For such a system, we consider the effects of trafficnonuniformity on the performance of the system according to its uplinks.In this direction for multiple accessing by users to the satellite channel totransmit their packets, a packet CDMA scheme is used. We assume asimple CDMA protocol, in which all user information is transmitted inthe form of a sequence of fixed-length packets on the channel. Access tothe satellite channel is completely unconstrained (i.e., random access),so that any given users begin transmission whenever they are ready to
96 Low Earth Orbital Satellites for Personal Communication Networks
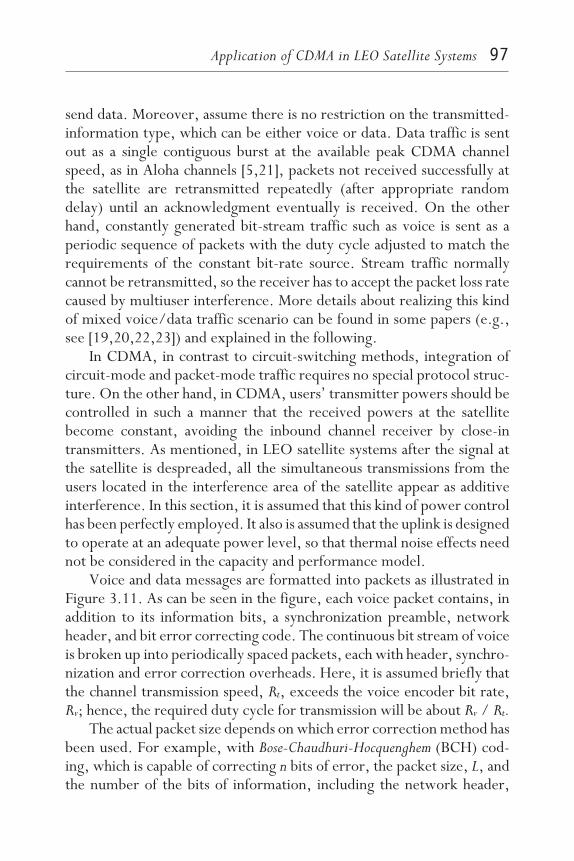
send data. Moreover, assume there is no restriction on the transmitted-information type, which can be either voice or data. Data traffic is sentout as a single contiguous burst at the available peak CDMA channelspeed, as in Aloha channels [5,21], packets not received successfully atthe satellite are retransmitted repeatedly (after appropriate randomdelay) until an acknowledgment eventually is received. On the otherhand, constantly generated bit-stream traffic such as voice is sent as aperiodic sequence of packets with the duty cycle adjusted to match therequirements of the constant bit-rate source. Stream traffic normallycannot be retransmitted, so the receiver has to accept the packet loss ratecaused by multiuser interference. More details about realizing this kindof mixed voice/data traffic scenario can be found in some papers (e.g.,see [19,20,22,23]) and explained in the following.
In CDMA, in contrast to circuit-switching methods, integration ofcircuit-mode and packet-mode traffic requires no special protocol struc-ture. On the other hand, in CDMA, users’ transmitter powers should becontrolled in such a manner that the received powers at the satellitebecome constant, avoiding the inbound channel receiver by close-intransmitters. As mentioned, in LEO satellite systems after the signal atthe satellite is despreaded, all the simultaneous transmissions from theusers located in the interference area of the satellite appear as additiveinterference. In this section, it is assumed that this kind of power controlhas been perfectly employed. It also is assumed that the uplink is designedto operate at an adequate power level, so that thermal noise effects neednot be considered in the capacity and performance model.
Voice and data messages are formatted into packets as illustrated inFigure 3.11. As can be seen in the figure, each voice packet contains, inaddition to its information bits, a synchronization preamble, networkheader, and bit error correcting code. The continuous bit stream of voiceis broken up into periodically spaced packets, each with header, synchro-nization and error correction overheads. Here, it is assumed briefly thatthe channel transmission speed, Rt, exceeds the voice encoder bit rate,Rv; hence, the required duty cycle for transmission will be about Rv / Rt.
The actual packet size depends on which error correction method hasbeen used. For example, with Bose-Chaudhuri-Hocquenghem (BCH) cod-ing, which is capable of correcting n bits of error, the packet size, L, andthe number of the bits of information, including the network header,
Application of CDMA in LEO Satellite Systems 97
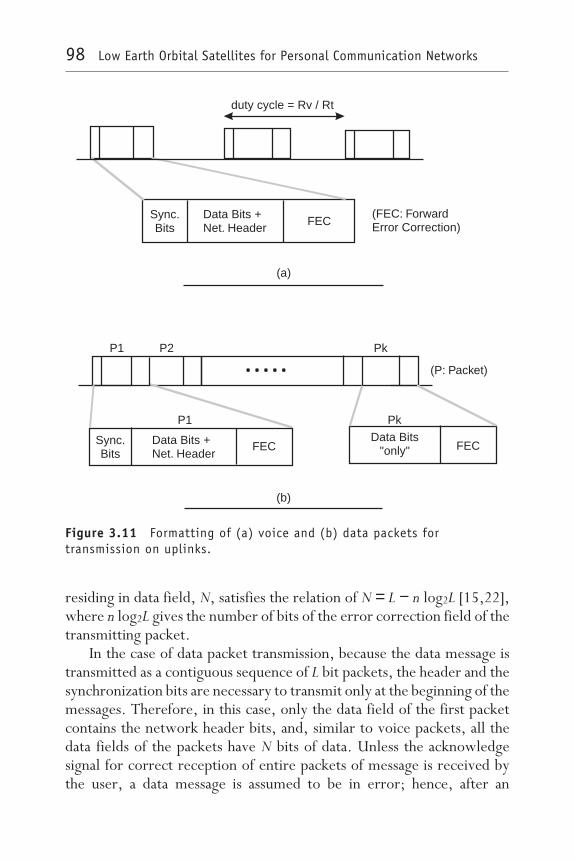
residing in data field, N, satisfies the relation of N = L − n log2L [15,22],where n log2L gives the number of bits of the error correction field of thetransmitting packet.
In the case of data packet transmission, because the data message istransmitted as a contiguous sequence of L bit packets, the header and thesynchronization bits are necessary to transmit only at the beginning of themessages. Therefore, in this case, only the data field of the first packetcontains the network header bits, and, similar to voice packets, all thedata fields of the packets have N bits of data. Unless the acknowledgesignal for correct reception of entire packets of message is received bythe user, a data message is assumed to be in error; hence, after an
. . . . .
FEC
duty cycle = Rv / Rt
Sync.Bits
Data Bits +Net. Header FEC
(FEC: ForwardError Correction)
(a)
(b)
Sync.Bits
Data Bits +Net. Header
FEC FECData Bits
"only"
(P: Packet)
P1 P2 Pk
PkP1
Figure 3.11 Formatting of (a) voice and (b) data packets fortransmission on uplinks.
98 Low Earth Orbital Satellites for Personal Communication Networks
appropriate time-out, an Aloha-type retransmission procedure is exe-cuted by the transmitter. This procedure executes until the message issuccessfully received and acknowledged by the connected satellite.
Because the connection to LEO satellites for any ground user istemporary due to the relative movement of satellites, if during thetransmission of packets or before receiving acknowledgment the user isforced to change connection to a new satellite, the information on thepast connection is forwarded to the new satellite. After that, the newsatellite should handle the process of transferring the user’s packet fromthe old satellite or the transmission of an acknowledgment packet to theuser. Such a mechanism should be prepared in the hand-off process. Inthe case of satellite systems with intersatellite links, the information canbe easily exchanged via those links. In systems without intersatellite links,the information might be exchanged via ground gateways.
3.2.2 Extension of the traffic model
To apply the calculations given in Section 3.1 to an integrated voice/datascenario, we extend the traffic model of the system, keeping the nonuni-form distribution of the users same as before. The population of the usersis divided into two sets: voice users, Nvi(t), and interactive data users,Ndi(t), where the subscript i denotes their relation to the ith satellite,measured at the time of process, t. Each user lies in only one of these twosets, not in both simultaneously. The call (message) generation rates ofthe users of the two sets are λv (calls/s/user) for voice users and λd(messages/s/user) for data users, both with exponential interarrival timeand independent of the satellite to which they connect. At any instant, auser is assumed to be in only one of two states, that is, busy or idle,according to the involvement in a call (data message) transfer. Newarrivals are generated only by the idle users, that is, the users that havecompleted their calls (i.e., have had their data messages acknowledged).A voice call is assumed to originate a continuous bit stream at a constantrate of Rv (Kbps), with an average holding time (exponential distribution)of Tc (s). A data user also is assumed to generate packets from anexponential message length distribution with average length of M kbit.The information is transmitted on a satellite channel with a transmissionspeed of Rt (Kbps).
Application of CDMA in LEO Satellite Systems 99

In the case of data transmission, packets that fail reception at thedestination or are received with uncorrectable errors are not acknow-ledged; hence, with a random delay, they are retransmitted. Retransmit-ted packets enter the channel at the rate of λr (messages/s). Because theprobability of successful transmission is a function of the packet length,the average length of retransmitted messages differs from M for generatedmessages and has the value of M′; however, its distribution can be assumedto be the same as generated messages, that is, exponential message length.Appropriate selection of retransmission delay in packet CDMA channelusing Aloha protocol is an important factor that ensures stability [24].The equilibrium value of λr, the retransmission packet rate, depends onthat delay and also on the rate of collision on the channel. At equilibrium,the total packet inflow and outflow rates should be equal. With that factand with a procedure similar to the one used in [25], the average lengthof the retransmitted message M′ and the retransmitted packet rate λr aresearched numerically throughout the simulation. Figure 3.12 summarizesthe traffic load offered to the channel at the time of process.
To apply the equilibrium condition, it first is necessary to find theprobability of packet success. At each satellite and in the absence ofthermal noise, the packet error is caused by the interference from all userslying in the interference area of that satellite. At the network analysis levelin many spread-spectrum schemes, it is possible to model the channelinterference by summing the interference powers and treating the sumas Gaussian noise [26].
Integrated Voice/DataPackets withDistribution ( )p1 α
Σ
New Voice PacketsExponential Interarrival Rateλv (call/s/user)Average Holding Time (exp.)Tc
New Data PacketsExponential Interarrival Rate
(mess/s/user)Average Lengthλd
M Successful Packets
UnacknowledgedData Packets
Retransmitted Packets(mess/s)
Average Lengthλr
M'
CDMA Channel
Retrans. RandomDelay, T0
R / R VoicePacketizer &Buffer
v t
Figure 3.12 Offered traffic load to CDMA channel.
100 Low Earth Orbital Satellites for Personal Communication Networks
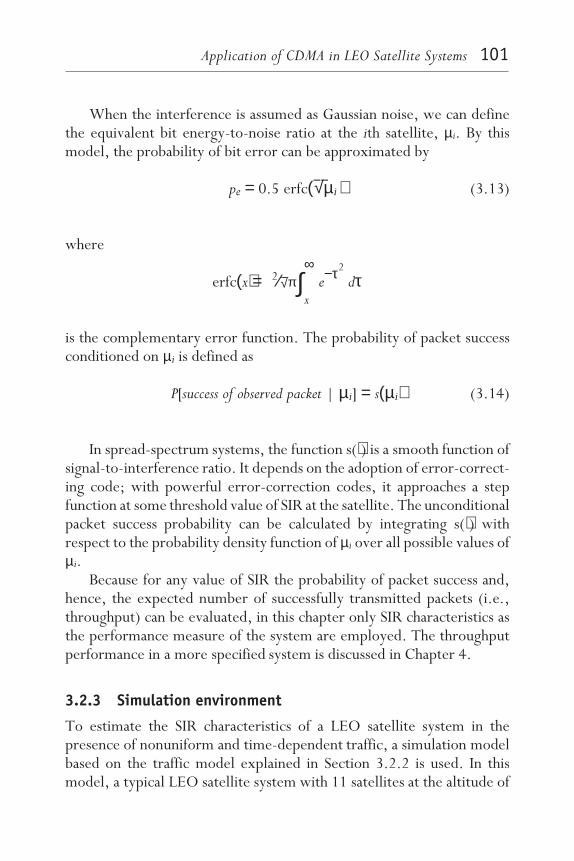
When the interference is assumed as Gaussian noise, we can definethe equivalent bit energy-to-noise ratio at the ith satellite, µi. By thismodel, the probability of bit error can be approximated by
pe = 0.5 erfc(õi ) (3.13)
where
erfc(x) = 2⁄√π∫x
∞e−τ2
dτ
is the complementary error function. The probability of packet successconditioned on µi is defined as
P[success of observed packet | µi] = s(µi) (3.14)
In spread-spectrum systems, the function s(⋅) is a smooth function ofsignal-to-interference ratio. It depends on the adoption of error-correct-ing code; with powerful error-correction codes, it approaches a stepfunction at some threshold value of SIR at the satellite. The unconditionalpacket success probability can be calculated by integrating s(⋅) withrespect to the probability density function of µi over all possible values ofµi.
Because for any value of SIR the probability of packet success and,hence, the expected number of successfully transmitted packets (i.e.,throughput) can be evaluated, in this chapter only SIR characteristics asthe performance measure of the system are employed. The throughputperformance in a more specified system is discussed in Chapter 4.
3.2.3 Simulation environment
To estimate the SIR characteristics of a LEO satellite system in thepresence of nonuniform and time-dependent traffic, a simulation modelbased on the traffic model explained in Section 3.2.2 is used. In thismodel, a typical LEO satellite system with 11 satellites at the altitude of
Application of CDMA in LEO Satellite Systems 101
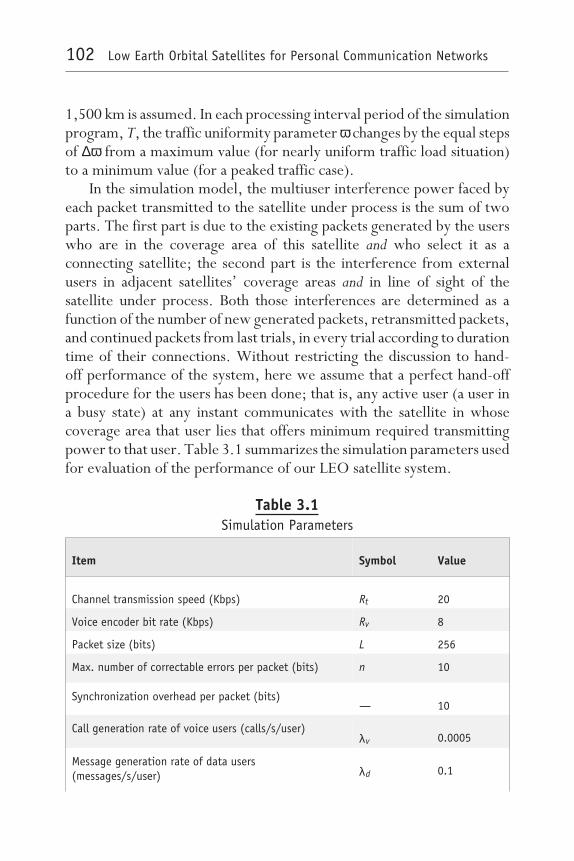
1,500 km is assumed. In each processing interval period of the simulationprogram, T, the traffic uniformity parameter ω changes by the equal stepsof ∆ω from a maximum value (for nearly uniform traffic load situation)to a minimum value (for a peaked traffic case).
In the simulation model, the multiuser interference power faced byeach packet transmitted to the satellite under process is the sum of twoparts. The first part is due to the existing packets generated by the userswho are in the coverage area of this satellite and who select it as aconnecting satellite; the second part is the interference from externalusers in adjacent satellites’ coverage areas and in line of sight of thesatellite under process. Both those interferences are determined as afunction of the number of new generated packets, retransmitted packets,and continued packets from last trials, in every trial according to durationtime of their connections. Without restricting the discussion to hand-off performance of the system, here we assume that a perfect hand-offprocedure for the users has been done; that is, any active user (a user ina busy state) at any instant communicates with the satellite in whosecoverage area that user lies that offers minimum required transmittingpower to that user. Table 3.1 summarizes the simulation parameters usedfor evaluation of the performance of our LEO satellite system.
Table 3.1Simulation Parameters
Item Symbol Value
Channel transmission speed (Kbps) Rt 20
Voice encoder bit rate (Kbps) Rv 8
Packet size (bits) L 256
Max. number of correctable errors per packet (bits) n 10
Synchronization overhead per packet (bits)— 10
Call generation rate of voice users (calls/s/user)λv 0.0005
Message generation rate of data users(messages/s/user) λd 0.1
102 Low Earth Orbital Satellites for Personal Communication Networks
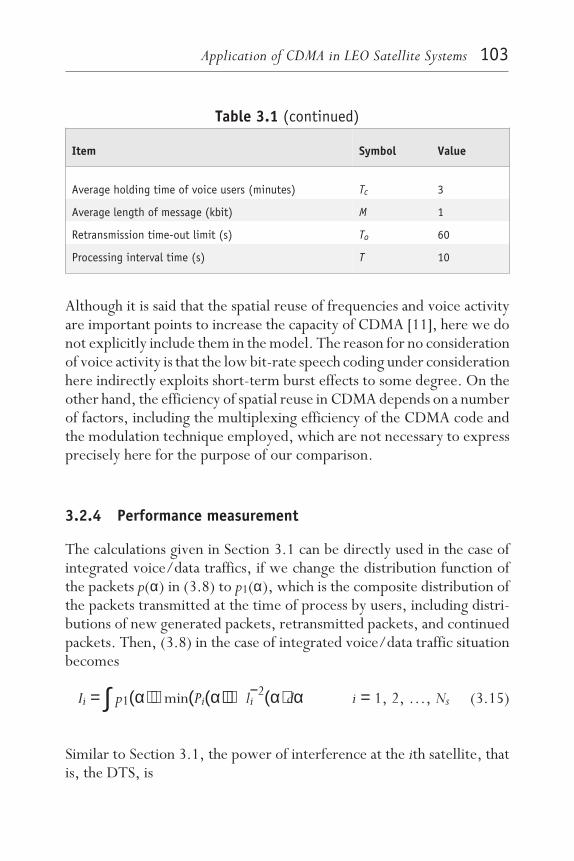
Table 3.1 (continued)
Item Symbol Value
Average holding time of voice users (minutes) Tc 3
Average length of message (kbit) M 1
Retransmission time-out limit (s) To 60
Processing interval time (s) T 10
Although it is said that the spatial reuse of frequencies and voice activityare important points to increase the capacity of CDMA [11], here we donot explicitly include them in the model. The reason for no considerationof voice activity is that the low bit-rate speech coding under considerationhere indirectly exploits short-term burst effects to some degree. On theother hand, the efficiency of spatial reuse in CDMA depends on a numberof factors, including the multiplexing efficiency of the CDMA code andthe modulation technique employed, which are not necessary to expressprecisely here for the purpose of our comparison.
3.2.4 Performance measurement
The calculations given in Section 3.1 can be directly used in the case ofintegrated voice/data traffics, if we change the distribution function ofthe packets p(α) in (3.8) to p1(α), which is the composite distribution ofthe packets transmitted at the time of process by users, including distri-butions of new generated packets, retransmitted packets, and continuedpackets. Then, (3.8) in the case of integrated voice/data traffic situationbecomes
Ii = ∫ p1(α) ⋅ min(Pi(α)) ⋅ li−2(α)dα i = 1, 2, …, Ns (3.15)
Similar to Section 3.1, the power of interference at the ith satellite, thatis, the DTS, is
Application of CDMA in LEO Satellite Systems 103

IDTS = Ii = 2Si∫
0
π⁄Ns
p1(α) ⋅ li2(α) ⋅ li
−2(α)dα
+ Si − 1∫π⁄Ns
βIp1(α) ⋅ li − 1
2 (α) ⋅ li−2(α)dα
(3.16)
where the first term inside the brackets denotes the (half) interferencefrom the users of the DTS, and the second is that from the users of theSTS. In (3.16) we have used the symmetry of the model, which resultsin the factor of 2 in the equation. Similarly, interference at the STS canbe found as
ISTS = Ii − 1 = Ii + 1
= Si + 1∫π⁄Ns
3π⁄Ns
p1(α)dα + Si∫2π⁄Ns − βI
π⁄Ns
p1(α)li2(α)li + 1−2 (α)dα
+ Si + 2 ∫3π⁄Ns
2π⁄Ns + βIp1(α)li + 2
2 (α)li + 1−2 (α)dα (3.17)
where the first term is the interference from its own users, and the secondand third terms are from the users of the satellites on both sides. It shouldbe noted here that since the effects of the other satellites are out of theinterference area of the satellite under process, only the first-orderneighboring satellites’ users are considered here.
To examine the change in performance of the satellites according tothe change in the level of traffic nonuniformity, we change the value ofω as a linear function of time during the simulation. According toFigure 3.3, for our traffic model a value of ω = 0.2 can show a highnonuniformity distribution and a value of ω > 5 can exhibit the uniformdistribution. Therefore, in the simulation we consider the change of ω insuch a margin. The time duration will be 21 minutes, which is derivedaccording to the following consideration.
104 Low Earth Orbital Satellites for Personal Communication Networks
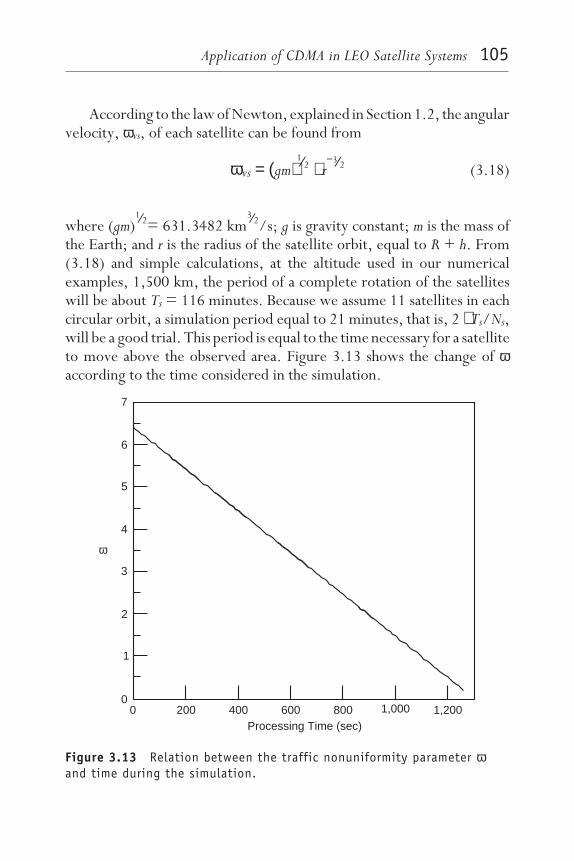
According to the law of Newton, explained in Section 1.2, the angularvelocity, ωvs, of each satellite can be found from
ωvs = (gm)1⁄2 ⋅ r
−3⁄2 (3.18)
where (gm)1⁄2= 631.3482 km
3⁄2/s; g is gravity constant; m is the mass ofthe Earth; and r is the radius of the satellite orbit, equal to R + h. From(3.18) and simple calculations, at the altitude used in our numericalexamples, 1,500 km, the period of a complete rotation of the satelliteswill be about Ts = 116 minutes. Because we assume 11 satellites in eachcircular orbit, a simulation period equal to 21 minutes, that is, 2 ⋅ Ts/Ns,will be a good trial. This period is equal to the time necessary for a satelliteto move above the observed area. Figure 3.13 shows the change of ωaccording to the time considered in the simulation.
7
6
5
4
3
2
1
0
ω
0 200 400 600 800 1,000 1,200Processing Time (sec)
Figure 3.13 Relation between the traffic nonuniformity parameter ωand time during the simulation.
Application of CDMA in LEO Satellite Systems 105

Let us assume that all satellites request the same power levels to theusers; thus, Si = S for i = 1, 2, …, Ns. Then the assumption of connectinga given Earth station to the lowest required power satellite results inconnection to the nearest satellite from that station. Figure 3.14 showsthe simulation result of SIR characteristics at both the DTS and the STSfor a minimum elevation angle of θ = 10°, h = 1,500 km, and Ns = 11 asa function-processing time, assuming equal populations of voice and datausers. In Figure 3.14, the simulation procedure starts at t = 0 with a largevalue for ω (ω > 5) as a relatively uniform traffic case and finishesat t = 1,260 s with a nonuniform peaked traffic (ω = 0.2). FromFigure 3.14, we can find large difference between the signal qualities ofthe DTS and the STS. At high traffic nonuniformity, the SIR of the DTSdegrades notably, while the STS marks superfluous quality. We concludethat the large traffic nonuniformity (e.g., ω = 0.2) decreases the systemefficiency, significantly. It should be noted that the traffic nonuniformity
Ns = 11h = 1,500 km
= 10 deg.θ
at DTSat STS
−19
−20
−21
−22
−23
−24
−25
−260 500 1,000
Sig
nal-t
o-In
terf
eren
ceR
atio
(dB
)
6.4 5.0 3.0 1.0 0.2
Processing Time (sec)
ω
Figure 3.14 SIR characteristics at DTS and STS as a function of trafficnonuniformity for equal populations of voice and data users.
106 Low Earth Orbital Satellites for Personal Communication Networks
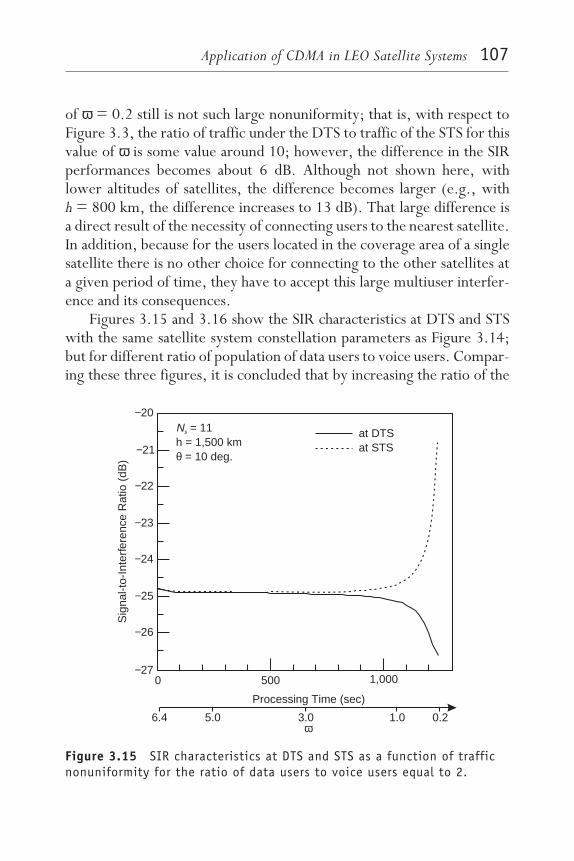
of ω = 0.2 still is not such large nonuniformity; that is, with respect toFigure 3.3, the ratio of traffic under the DTS to traffic of the STS for thisvalue of ω is some value around 10; however, the difference in the SIRperformances becomes about 6 dB. Although not shown here, withlower altitudes of satellites, the difference becomes larger (e.g., withh = 800 km, the difference increases to 13 dB). That large difference isa direct result of the necessity of connecting users to the nearest satellite.In addition, because for the users located in the coverage area of a singlesatellite there is no other choice for connecting to the other satellites ata given period of time, they have to accept this large multiuser interfer-ence and its consequences.
Figures 3.15 and 3.16 show the SIR characteristics at DTS and STSwith the same satellite system constellation parameters as Figure 3.14;but for different ratio of population of data users to voice users. Compar-ing these three figures, it is concluded that by increasing the ratio of the
0 500 1,000
ω5.0 3.0 1.0 0.2
Processing Time (sec)
6.4
−20
−21
−22
−23
−24
−25
−26
−27
Sig
nal-t
o-In
terf
eren
ceR
atio
(dB
)
Ns = 11h = 1,500 km
= 10 deg.θ
at DTSat STS
Figure 3.15 SIR characteristics at DTS and STS as a function of trafficnonuniformity for the ratio of data users to voice users equal to 2.
Application of CDMA in LEO Satellite Systems 107
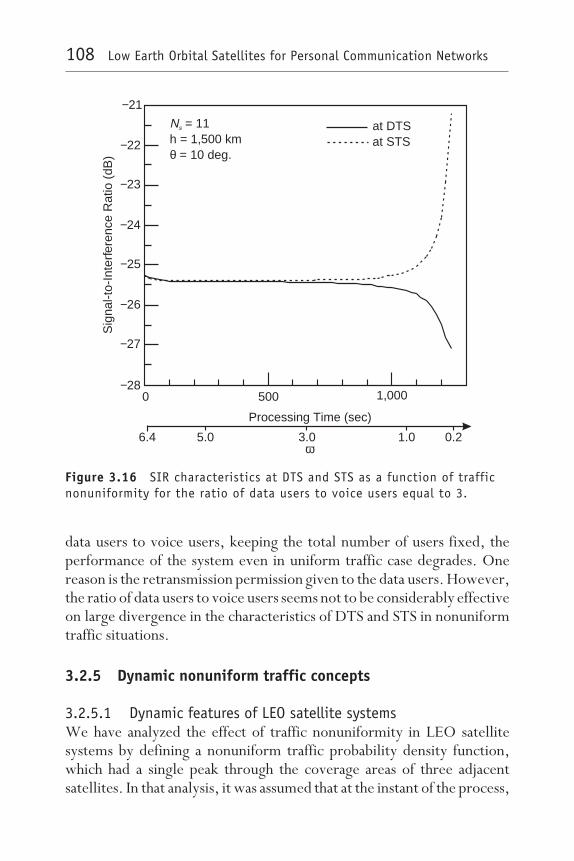
data users to voice users, keeping the total number of users fixed, theperformance of the system even in uniform traffic case degrades. Onereason is the retransmission permission given to the data users. However,the ratio of data users to voice users seems not to be considerably effectiveon large divergence in the characteristics of DTS and STS in nonuniformtraffic situations.
3.2.5 Dynamic nonuniform traffic concepts
3.2.5.1 Dynamic features of LEO satellite systemsWe have analyzed the effect of traffic nonuniformity in LEO satellitesystems by defining a nonuniform traffic probability density function,which had a single peak through the coverage areas of three adjacentsatellites. In that analysis, it was assumed that at the instant of the process,
Ns = 11h = 1,500 km
= 10 deg.θ
at DTSat STS
0 500 1,000
ω5.0 3.0 1.0 0.2
Processing Time (sec)
6.4
−21
−22
−23
−24
−25
−26
−27
−28
Sig
nal-t
o-In
terf
eren
ceR
atio
(dB
)
Figure 3.16 SIR characteristics at DTS and STS as a function of trafficnonuniformity for the ratio of data users to voice users equal to 3.
108 Low Earth Orbital Satellites for Personal Communication Networks
the single peak is just under one of the satellites, making its traffic loaddense. That assumption leads the analysis to an investigation of a specialsituation that may have a particular role at the design procedure time.Although LEO satellites are in continuous motion in their orbits andhence their network topology is highly dynamic, the assumption that thesystem constellation is static for a small period of time is reasonable; insome papers, this situation is referred to as a quasi-stationary arrangementof the LEO satellites [27,28].
More exactly speaking, we should note that the traffic loads incoverage areas of LEO satellites are not only nonuniform but also chang-ing as a function of time, as result of two phenomena. The first one is thenatural feature of telecommunications systems, that is, the changes in thetotal number of the users during different hours in a day at the same area,nonuniformity in call arrival and call arrival density, and so on. Thesecond phenomenon is a direct result of the moving property of LEOsatellites, from the viewpoint of a fixed object on the Earth. Speakingmore precisely, such an object should not be called fixed, when weremember the high speed of the LEO satellites (e.g., with a typical valueof h = 1,500 km, each LEO satellite has a linear ground speed of about7.1 km/s), not comparable to the speed of any known vehicles on theground or in the air. Therefore, any fixed or mobile stations can be viewedas fixed stations in LEO satellite system. Moreover, in the case of a LEOsatellite communication system, the latter phenomenon, that is thechange in traffic loads according to the movement of satellites, is rapid,compared with the change related to different hours in a day. Hence it isreasonable to consider that rapid change only in the calculations, madethe other constant during measurement. That way, we can apply the sameLEO satellite system model. Again, to make the effect of traffic nonuni-formity clearer and the calculations simpler, only one orbit of the LEOsatellite system is considered.
3.2.5.2 Simulation modelTo estimate the changes in characteristics of a LEO satellite communica-tions system employing CDMA when the satellites experience nonuni-form traffic distribution during their travels, a modified version of themodel in Section 3.2.2 is used. In this model, it is assumed that anonuniform traffic distribution as (3.1) with a predefined value of ω in a
Application of CDMA in LEO Satellite Systems 109
specified area within the satellites’ path exists. Assuming counterclock-wise movement of the satellites, two satellites, namely, the ith satelliteand its first neighbor satellite to the right, the (i + 1)st satellite, sub-sequently experience service to the users distributed according to thatdistribution function. The start point of simulation is when the ith and itsfirst neighbor satellite to the right are in α = 2π/Ns and α = 4π/Ns,respectively, far from the peak of the traffic distribution located at α = 0.They rotate in their circular orbit with the constant angular velocity untilthe ith and its first neighbor satellite to the right reach α = –2π/Ns andα = 0, respectively. During this period, the ith satellite experiences threespecific states of traffic of the STS, the DTS, the STS again, and, of course,their intermediate states, subsequently; however, the first right neigh-boring satellite before reaching the STS and DTS states starts from a verylow traffic state, even less than the STS’s state.
Except for the traffic nonuniformity measure, ω, which is fixed in thissimulation model, other parameters in Section 3.2.3, including the simu-lation period of 21 minutes, stand for this simulation too. Figure 3.17shows the changes of SIR characteristics at the ith satellite and its firstneighbor satellite to the right as a function of the processing time forω = 0.2, assuming equal populations of voice and data users. As the figureillustrates, even in the case of not-so-large traffic nonuniformity as muchas ω = 0.2 (compared with ω < 0.1), in not-so-short periods of time largedegradation in SIR at the satellites occurs. That is just when the neighborsatellites, whose facilities generally can be accessed by the users to somedegree, have large SIR values. If we again assume that the worst situationin system performance is the case in which the signal quality at a satellitehas the lowest value, from the figure this is the case where the peak of thetraffic load lies just under one of the satellites; that is, the result derivedin Section 3.1 is reconfirmed. Figure 3.14 suggests we apply the facilitiesof the low-traffic neighbor satellites more optimally.
3.2.5.3 Modified power control schemeThe results shown to this point were based on the assumption that allsatellites request the same receiving power levels and thus that usersconnect to the nearest satellite. That means that without paying attentionto the number of simultaneous transmissions and the current packet-loss
110 Low Earth Orbital Satellites for Personal Communication Networks
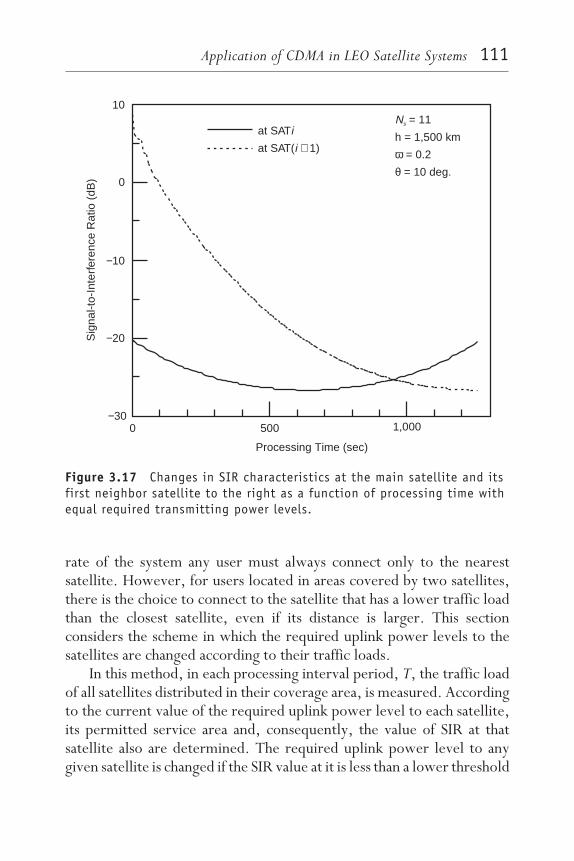
rate of the system any user must always connect only to the nearestsatellite. However, for users located in areas covered by two satellites,there is the choice to connect to the satellite that has a lower traffic loadthan the closest satellite, even if its distance is larger. This sectionconsiders the scheme in which the required uplink power levels to thesatellites are changed according to their traffic loads.
In this method, in each processing interval period, T, the traffic loadof all satellites distributed in their coverage area, is measured. Accordingto the current value of the required uplink power level to each satellite,its permitted service area and, consequently, the value of SIR at thatsatellite also are determined. The required uplink power level to anygiven satellite is changed if the SIR value at it is less than a lower threshold
Ns = 11
h = 1,500 km
= 0.2
= 10 deg.
ωθ
at SAT
at SAT( 1)
i
i +
Sig
nal-t
o-In
terf
eren
ceR
atio
(dB
)
−20
−10
10
0
−300 500 1,000
Processing Time (sec)
Figure 3.17 Changes in SIR characteristics at the main satellite and itsfirst neighbor satellite to the right as a function of processing time withequal required transmitting power levels.
Application of CDMA in LEO Satellite Systems 111

level and at its neighbor satellite is more than an upper threshold level,or vice versa. The change is performed according to the ratio of the trafficloads of that satellite and its neighbors adaptively and is reported to othersatellites through the intersatellite network, for example. Because theusers located in the coverage area of each satellite and out of its doublecoverage areas have to connect to that satellite only, the maximum changein required uplink power level to each satellite is limited to the pointwhere that change can affect to the decision of the users in doublecoverage areas. Any further changes in uplink power levels will onlydecrease the performance of both light and heavy traffic satellites.
By applying this method, the required uplink power levels to thesatellites with heavier traffic load become larger; on the other hand, therequired uplink power levels of light-traffic ones decrease. That resultsin a decrease in the service area of the satellite with the higher traffic load.With the same parameters as in Subsection 3.2.5.2, Figure 3.18 shows
Ns = 11h = 1,500 km
= 0.2= 10 deg.
ωθ
at SATat SAT( 1)
ii +
Sig
nal-t
o-In
terf
eren
ceR
atio
(dB
)
−20
−10
10
0
−300 500 1,000
Processing Time (sec)
Figure 3.18 Changes in SIR characteristics at the main satellite and itsfirst neighbor satellite to the right as a function of processing timeafter applying the modified power control scheme.
112 Low Earth Orbital Satellites for Personal Communication Networks
the simulation results the same as Figure 3.17, here after applying theabove explained modified power control method. For this case, it isassumed as an example that the upper and lower threshold levels are−23.0 and −24.5 dB, respectively.
Although the performance improvement due to the modified powercontrol is not well exhibited in Figure 3.18, the method can equalize thetraffic load offered to each satellite to some degree. If more satellites existin each orbit or if their height becomes higher, we can expect that themethod gives more performance improvement. Chapter 5 discusses thismethod in more detail and shows that the method can improve theperformance of LEO satellite systems that suffer from geographic trafficnonuniformity.
3.3 SummaryThis chapter modeled the situation of nonuniformity in traffic loads of aLEO satellite–based communications system and investigated the per-formance of the system with a CDMA scheme by the measure of signal-to-interference ratio (SIR). Both analog and integrated voice/data trafficscenarios were considered. With the same required uplink power levelsrequested by the satellites, it was shown that the performance of the LEOsatellite system, measured by the value of SIR at each satellite, degradesas a direct result of nonuniformity in distribution of users. It also wasshown that the worst case in the performance of the satellite systemhappens when the peak of the traffic load lies just under one of thesatellites.
To have better characteristics near to the case where the trafficdistribution is uniform, new traffic assignment and modified powercontrol schemes have been proposed for analog and integrated voice/datasystems, respectively, in which weights are given to the required receiv-ing powers of the satellites. By applying those schemes, it has been shownthat in nonuniform traffic situations it is possible to improve the perform-ance of the dense-traffic satellite at the expense of degrading the super-fluous performance of its neighboring satellites, which have lighter trafficloads. If either the number of satellites on each orbit or the altitude of thesatellites becomes higher, we can expect the schemes to exhibit betterperformances.
Application of CDMA in LEO Satellite Systems 113

References[1] Gilhousen, K. S., et al., “Increased Capacity Using CDMA for Mobile Satellite
Communication,” IEEE J. Select. Areas Commun., Vol. 8, No. 4, 1990,pp. 503–514.
[2] Kohno, R., R. Median, and L. B. Milstein, “Spread Spectrum Access Methodsfor Wireless Communications,” IEEE Commun. Mag., Vol. 33, No. 1, 1995,pp. 58–67.
[3] Viterbi, A. J., “A Perspective on the Evaluation of Multiple Access SatelliteCommunication,” IEEE J. Select. Areas Commun., Vol. 10, No. 6, 1992,pp. 980–983.
[4] Viterbi, A. J., “The Evaluation of Digital Wireless Technology From SpaceExploration to Personal Communication Services,” IEEE Trans. Vehic. Technol.,Vol. 43, No. 3, 1994, pp. 638–644.
[5] Abramson, N., “Fundamental of Packet Multiple Access for SatelliteNetworks,” IEEE J. Select. Areas Commun., Vol. 10, No. 2, 1992, pp. 309–316.
[6] Wu, W. W., et al., “Mobile Satellite Communications,” Proc. IEEE, Vol. 82,No. 9, 1994, pp. 1431–1448.
[7] Jamalipour, A., et al., “A Performance Analysis on the Effects of TrafficNonuniformity in Low Earth-Orbit Satellite Communication Systems,” Proc.16th Symp. Information Theory and Its Applications, (SITA’ 96), Japan, 1993,pp. 203–206.
[8] Jamalipour, A., et al., “Signal-to-Interference Ratio of CDMA in LowEarth-Orbital Satellite Communication Systems With Nonuniform TrafficDistribution,” in Proc. IEEE GLOBECOM ’94 Conference, San Francisco, CA,1994, pp. 1748–1752.
[9] Jamalipour, A., et al., “Performance of an Integrated Voice/Data System inNonuniform Traffic Low Earth-Orbit Satellite Communication Systems,”IEEE J. Select. Areas Commun., Vol. 13, No. 2, 1995, pp. 465–473.
[10] Jamalipour, A., and A. Ogawa, “Traffic Characteristics of LEOS-Based GlobalPersonal Communications Networks,” IEEE Commun. Mag., Vol. 35, No. 2,1997, pp. 118–122.
[11] Gilhousen, K. S., et al., “On the Capacity of a Cellular CDMA System,”IEEE Trans. Vehic. Technol., Vol. 40, No. 2, 1991, pp. 303–312.
[12] Vojcic, B. R., R. L. Pickholtz, and L. B. Milstein, “Performance of DS-CDMAWith Imperfect Power Control Operating Over a Low Earth Orbiting SatelliteLink,” IEEE J. Select. Areas Commun., Vol. 12, No. 4, 1994, pp. 560–567.
[13] Simpson, F., and J. Holtzman, “CDMA Power Control, Interleaving, andCoding,” Proc. 41th IEEE Vehic. Technol. Conf., St. Louis, 1991, pp. 362–367.
114 Low Earth Orbital Satellites for Personal Communication Networks

[14] Shinji, M., Mobile Communications, Japan: Maruzen, 1989.
[15] Proakis, J., Digital Communications, 2nd ed., New York: McGraw-Hill, 1989.
[16] Roddy, D., Satellite Communications, Englewood Cliffs, NJ: Prentice-Hall, 1989.
[17] Werner, M., et al., “Analysis of System Parameters for LEO/ICO-SatelliteCommunication Networks,” IEEE J. Select. Areas Commun., Vol. 13, No. 2,1995, pp. 371–381.
[18] Pritchard, W. L., H. G. Suyderhoud, and R. A. Nelson, Satellite CommunicationSystems Engineering, 2nd ed, Englewood Cliffs, NJ: Prentice-Hall, 1987.
[19] Falk, G., et al., “Integration of Voice and Data in the Wideband PacketSatellite Networks,” IEEE J. Select. Areas Commun., Vol. SAC-1, No. 6, 1983,pp. 1076–1083.
[20] Ganesh, R., et al., “Performance of Cellular Packet CDMA in an IntegratedVoice/Data Network,” Int. J. Wireless Infor. Networks, Vol. 1, No. 3, 1994,pp. 199–222.
[21] Bertsekas, D., and R. Gallager, Data Networks, Englewood Cliffs, NJ:Prentice-Hall, 1987.
[22] Wilson, N. D., et al., “Packet CDMA Versus Dynamic TDMA for MultipleAccess in an Integrated Voice/Data PCN,” IEEE J. Select. Areas Commun.,Vol. 11, No. 6, 1993, pp. 870–884.
[23] Zhang K., and K. Pahlavan, “An Integrated Voice/Data System for MobileIndoor Radio Networks,” IEEE Trans. Vehic. Technol., Vol. 39, No. 1, 1990,pp. 75–82.
[24] Joseph, K., and D. Raychaudhuri, “Stability Analysis of Asynchronous RandomAccess CDMA Systems,” Proc. IEEE GLOBECOM ’86, 1996, pp. 1740–1746.
[25] Joseph, K., and D. Raychaudhuri, “Throughput of Unslotted Direct-SequenceSpread Spectrum Multiple-Access Channels With Block FEC Coding,”IEEE Trans. Commun., Vol. 41, No. 9, 1993, pp. 1373–1378.
[26] Sousa, E. S., and J. A. Silvester, “Optimum Transmission Ranges in aDirect-Sequence Spread-Spectrum Multihop Packet Radio Network,”IEEE J. Select. Areas Commun., Vol. 8, No. 5, 1990, pp. 762–771.
[27] Chakraborty, D., “Survivable Communication Concept via Multiple LowEarth-Orbiting Satellites,” IEEE Trans. Aeroso. Electron. Syst., Vol. 25, No. 6,1989, pp. 879–889.
[28] Kaniyil, J., et al., “A Global Message Network Employing Low Earth-OrbitingSatellites,” IEEE J. Select. Areas Commun., Vol. 10, No. 2, 1992, pp. 418–427.
Application of CDMA in LEO Satellite Systems 115
Low Earth Orbital Satellites for Personal Communication Networks
4Spread-Slotted Aloha for LEO
Satellite Systems
I , CDMA was assumed as the multiple-access scheme onthe uplinks of a LEO satellite system, and the performance of thesystem under nonuniform traffic situations was examined. In this
chapter, we consider, as the second candidate for a multiple-accessscheme, a LEO satellite system employing a direct-sequence spread-slottedAloha (DS/SSA) technique and show how the traffic nonuniformity affectsthe performance of that system.
We start our discussion of employing the DS/SSA scheme in LEOsatellite communications networks with an overview of conventionalAloha multiple-access schemes and the idea of spreading Aloha packetsto improve the capacity of a system. We review the theory of the spreadspectrum and compare the signal forms in CDMA and spread Alohaschemes, to distinguish the two random-access methods. Then, we
117
employ the spread-slotted Aloha in our LEO satellite system and establisha mathematical model for evaluating the performance of the system undernonuniform geographical distribution of users. Finally, we examine theperformance of the system under those situations through numericalexamples and leave the problem of improving the performance for thefollowing chapters. In such a system, one appropriate measure of theperformance is throughput; hence, we use that measure in this chapter.The mathematics given in this chapter is the basic analysis for the follow-ing chapters.
For a LEO satellite communication system, spread spectrum is apromising candidate because with advantages such as immunity to inter-ference from adjacent service areas and satellites [1–7]. A packet radiocommunications system is another candidate, because it is suitable for asystem with a huge number of users and relatively small requirements fortransmission, as well as a system in which various types of traffic such asvoice and data are transmitted at the same time [8–10]. That is one reasonwhy we employ the DS/SSA method, which is a combination of spread-spectrum techniques and slotted Aloha [11–15], as the multiple-accessscheme. The discussion of the definition of a LEO satellite system andtraffic nonuniformity, however, is not limited to this multiple-accessmethod.
Section 4.2 establishes a new analytical model for a LEO satellitecommunications system with nonuniform traffic distribution. The modelis more useful than the one used in Chapter 3 when packet communica-tions and throughput analysis are involved. In the model presented in thischapter, it is assumed that the location of each user is a random variableand that the users have the same and independent traffic requirements.The results of many conventional studies on traffic analysis can be appliedeasily to this model. For example, in Section 4.3, the throughput per-formance of a DS/SSA multiple-access scheme for a LEO satellite systemis derived, and the numerical examples shown. It is shown that theperformance for each user varies according to the user’s location and thatthe larger possible number of simultaneous transmissions is necessarywhen nonuniformity of the geographical distribution of the traffic exists.It is also shown that the throughput of the system in a nonuniform trafficassumption is much lower than that of a uniform traffic distribution.
118 Low Earth Orbital Satellites for Personal Communication Networks

4.1 Spread-slotted AlohaFor more than two decades, the conventional Aloha multiple-accessscheme received the attention of not only computer network engineersbut also communications network researchers [1,16–22]. That wasmostly because of the simplicity offered by the scheme. The Alohaprotocol in a packet communications network provides users with noth-ing but the simplest and most natural feature: Transmit a packet wheneveryou have one and you want to transmit it. Although this kind of transmis-sion results in large numbers of collisions between simultaneously trans-mitted packets and low performance, its simplicity is strong enough thateven now we see some research on its basic idea. For LEO satellitesystems, such a popular scheme should also have promise, even thoughits basic idea may require some modifications.
4.1.1 The Aloha multiple-access schemeWe start our discussion of spread-slotted Aloha with an overview of thefundamentals of the conventional Aloha scheme. This scheme has a longhistory with computer and communications engineers.
In the 1970s, Norman Abramson and his colleagues at the Universityof Hawaii devised a new and elegant method to solve the channel-alloca-tion problem [16]. Since then, their work has been extended by manyresearchers. Although Abramson’s work, called the Aloha system, usedground-based radio broadcasting, its basic idea is applicable to any systemin which uncoordinated users are competing for the use of a single sharedchannel.
The basic idea of the Aloha protocol is simple: Transmit your datapacket whenever you have data to be sent. That simple protocol, ofcourse, results in collisions, and the colliding packets have to be de-stroyed. In this system, however, a user can always find out whether apacket was destroyed by monitoring the channel output. In a local areanetwork, that knowledge is immediate; in a geostationary satellite sys-tem, for example, it is provided after about a 270-ms delay. If the packetwas involved a collision and destroyed, the user waits for a random delayand then retransmits the packet. The latter delay time must be randomto avoid collisions of the same packets after retransmission.
Spread-Slotted Aloha for LEO Satellite Systems 119

Systems in which multiple users share a common channel in a waythat can lead to conflicts are widely known as contention systems. When acollision between two packets occurs, even if the collision is between thefirst bit of a new packet and the last bit of a packet almost finished, bothpackets are totally destroyed, and both have to be retransmitted later.Figure 4.1 illustrates examples of collisions between packets and thetransmission of a packet without any collision in an Aloha system. In thefigure, equal-length packets are considered.
Now we will look at the efficiency of an Aloha channel. The fractionof transmitted packets that, on average, can pass the channel successfullyis referred to as throughput. Assume that all packets have the equal lengthof τ seconds and that the start times of the packets make up a Poissonpoint process with the parameter λ packets/second [21,23]. With thoseassumptions, the normalized channel packet rate will be ξ = λτ. A valueof ξ = 1 corresponds to a channel with packets synchronized perfectly sothat the start of one packet always coincides with the end of the previouspacket; that is the reason for calling ξ a normalized channel packet rate.
In addition, assume that the start times of the packets plus packetretransmissions make up another Poisson point process. Then we can
Collided Packets Successful Packets
User 1
User 2
User 3
User 4
Time
Figure 4.1 Flow of packets on an Aloha channel.
120 Low Earth Orbital Satellites for Personal Communication Networks

define a quantity G, analogous to the normalized channel packet rate, thattakes into account the original packets plus the retransmission packets.The parameter G is called the normalized channel traffic rate, and ingeneral G ≥ ξ. At low traffic load (i.e., ξ ≈ 0), there are few collisions,hence few retransmissions, so G ≈ ξ. At high traffic load, there are manycollisions, so G > ξ. Under all traffic-load conditions, the throughput isjust the offered load, G, times the probability of a transmission beingsuccessful, that is, ξ = GP0, where P0 is the probability that a packet doesnot suffer a collision.
It easily can be shown that under the above conditions, the relationbetween the offered traffic load, or G, and the throughput of the Alohachannel is given by
ξ = G e−2G (4.1)
where e–2G is the probability of no other traffic during the transmissionof a given packet in a Poisson distribution scenario. That relationship isplotted in Figure 4.2. As shown in the figure, the maximum throughputoccurs at G = 0.5, which is about 1/2e, or 0.184. In other words, thebest utilization for an Aloha channel is only about 18%. Of course, thatresult is not very encouraging, but with users transmitting whenever theywant, we cannot expect a higher success rate.
The Aloha method just explained is referred to as pure Aloha orunslotted Aloha, because there is no synchronization in the start times ofpackets, so it requires no special control scheme. Just a few years afterproposal of the pure Aloha scheme, a simple approach for doubling thecapacity of the pure Aloha, called slotted Aloha, was proposed [24,25]. Inthe newer proposal, the time axis was divided into discrete intervals, eachcorresponding to one packet and called time slots. In a slotted Alohascheme, a terminal is not permitted to send whenever it has a packet.Instead, it is required to wait for the beginning of the next slot. Thatcontrol turns the continuous pure Aloha into a discrete one. Therefore,there is no other new traffic generated during a slot, which leads to higherthroughput as
ξ = Ge−G (4.2)
Spread-Slotted Aloha for LEO Satellite Systems 121
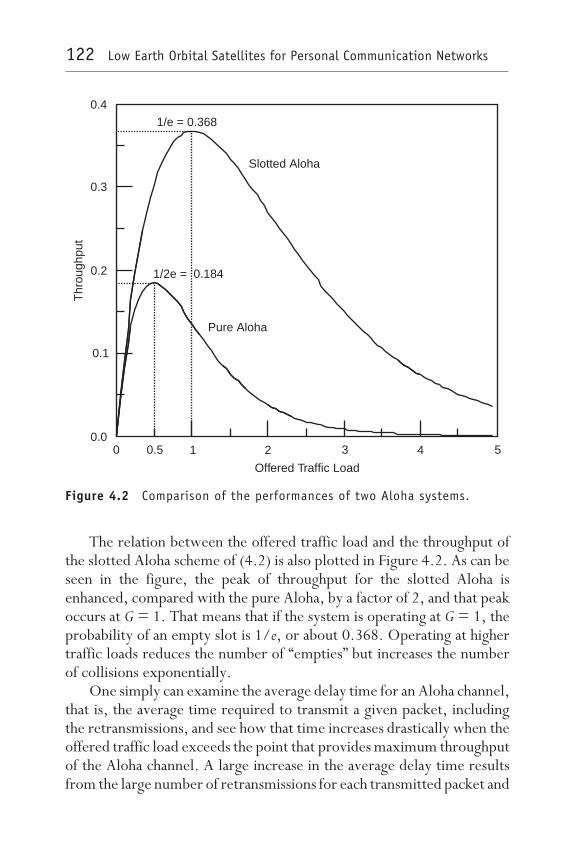
The relation between the offered traffic load and the throughput ofthe slotted Aloha scheme of (4.2) is also plotted in Figure 4.2. As can beseen in the figure, the peak of throughput for the slotted Aloha isenhanced, compared with the pure Aloha, by a factor of 2, and that peakoccurs at G = 1. That means that if the system is operating at G = 1, theprobability of an empty slot is 1/e, or about 0.368. Operating at highertraffic loads reduces the number of “empties” but increases the numberof collisions exponentially.
One simply can examine the average delay time for an Aloha channel,that is, the average time required to transmit a given packet, includingthe retransmissions, and see how that time increases drastically when theoffered traffic load exceeds the point that provides maximum throughputof the Aloha channel. A large increase in the average delay time resultsfrom the large number of retransmissions for each transmitted packet and
Slotted Aloha
Pure Aloha
1/2e = 0.184
1/e = 0.368
Offered Traffic Load
0 0.5 1 2 3 4 5
Thr
ough
put
0.4
0.3
0.2
0.1
0.0
Figure 4.2 Comparison of the performances of two Aloha systems.
122 Low Earth Orbital Satellites for Personal Communication Networks
the increase in traffic load of the channel. Because that increase affects thestability of system, it should be monitored carefully.
4.1.2 Spreading the Aloha packets
The simplicity offered by the Aloha schemes for a communicationsnetwork is so important that the method has had the attention of com-munications engineers for a long time. With the slotted Aloha, even if akind of condition on transmission of the users is enforced, the basicsimplicity of the Aloha scheme is not affected. In slotted Aloha, a usermust wait only until the starting point of the next time slot, which is onaverage half a packet length. However, with this simple approach, thecapacity of the channel is enhanced by a factor of 2, and the channel canhandle higher traffic loads. In short, with Aloha schemes, random accessto a common channel by multiple users is realizable.
The basic idea of an Aloha scheme, even with its low capacity feature,has been employed in some satellite systems [18], which is evidence thatthe Aloha schemes can match the special features of satellite systems.However, for future satellite systems, the capacity of the Aloha schemesshould be improved to handle large amounts of information data.
The problem with the Aloha scheme that limits its capacity is thecollisions of the packets. Any approach to enhance the capacity of theAloha schemes should consider either how the number of collisions canbe decreased or how the collisions can be managed so they have less effecton the capacity of the system. Dividing the time axis used in slotted Alohamethod limits the number of transmissions during each specific intervalor slot. If the number of users in a system is large, collisions are anunavoidable feature, although we may limit the number of collisions.Therefore, for a multiuser system, we should focus on the secondconsideration, that is, weakening the effect of collisions. (A variety ofprotocols have been developed to deal with the problem of packets lostdue to contention, see [20,21].)
In fact, conventional channel-assignment multiple-access schemessuch as TDMA and FDMA also follow the strategy of limiting the numberof collisions by preparing a single channel for each user at each time orfrequency interval. One also may consider a TDMA or an FDMA systemin which users can randomly access each TDMA or FDMA channel with
Spread-Slotted Aloha for LEO Satellite Systems 123

an Aloha-type attempt. That can be considered an application—but nota modification—of the Aloha scheme. By applying the Aloha in TDMAor FDMA, those systems can handle the transmission of users moreflexibly, at least, because in Aloha-type TDMA or FDMA systems, weare not limited to a fixed number of times, or frequency slots, and hencea fixed number of users.
In an Aloha system, the probability of packet success is one only whenone packet exists; it is zero when two or more packets are on a channelsimultaneously. One way to improve the performance of the Alohachannel is to have nonzero packet success probabilities when more thanone packet is on the channel. In other words, if we can have a smootherfunction for the probability of packet success when the number of packetson the channel increases than the simple step function of conventionalAloha, the effect of collisions can be removed. One method to achievesuch smooth function is to spread the packets and transmit the spreadpackets instead of original ones.
Two methods for spreading the packets result in two different modi-fications to the conventional Aloha scheme. One method is to spread thepackets in time, the other is to spread them in frequency. The inventorof Aloha, Norman Abramson, proposed the first method, which henamed the spread Aloha scheme. The other method is nothing more thanthe use of spread spectrum and CDMA techniques in conventional Aloha,which can be referred to as CDMA Aloha. Although the final mathematicalrepresentations for a spread Aloha packet and a CDMA Aloha packet aresomehow equivalent, there are some differences between these twoschemes, which is the subject of the following subsections. The mostsignificant difference is that in spread Aloha there is only one code, whileCDMA Aloha is more similar to conventional CDMA systems. Becausethe final stage of either scheme has high bandwidth (spread) packets, inmuch of the literature, CDMA Aloha is also referred to as spread Aloha.In this book, we also consider the CDMA Aloha, that is, a system thatuses several orthogonal codes, but we use the name spread Aloha toexhibit the spreading feature of the scheme.
Spread-spectrum multiple-access techniques and Aloha techniqueshave been studied extensively for satellite and other applications, andtheir relative merits are well known. Spread Aloha can be assumed to bea combination of the two schemes, in which well-known remarkable
124 Low Earth Orbital Satellites for Personal Communication Networks

features of both schemes are maintained. Moreover, as a particularapplication of spread spectrum, CDMA systems are being developed aspotential candidates for use in digital cellular and satellite mobile radiocommunications systems. The remainder of this chapter reviews thesignaling in the two schemes. Note that the analysis given here is only anintroduction to spread-spectrum schemes, necessary for following thestudies given in this text. The reader is referred to particular books andpapers on spread spectrum for a more complete understanding [26–28].
4.1.2.1 Direct-sequence CDMA signalsThis subsection briefly describes the waveforms in a direct-sequencespread-spectrum system, for example, the BPSK modulation. A simplespread-spectrum communication channel is shown in Figure 4.3. Asshown in the figure, the information-bearing signal a(t), which is a binarystream of digits, first is modulated by a carrier to produce the signal s(t)such that
s(t) = √2P a(t) cosω0t (4.3)
where P is the power of the signal. After that, the signal s(t) is multipliedby a pseudo-random noise or the spread-spectrum code sequence g(t),which is a binary sequence having the value ±1 to form the direct-se-quence spread-spectrum signal as
x(t) = s(t)g(t) = √2P a(t)g(t) cosω0t (4.4)
a t( )
g t( ) n t( )
x t( ) x t n t( ) ( )+
g* t( )
Transmitter Side Channel Receiver Side
SpreadingSequence
Noise Complex Conjugateof Spreading Code
InformationSignal
SpreadSignal
ReceivedSignal
Output
Integrator Samplerat Tb
2 cosP tω 0 2 cos ω 0t
Figure 4.3 An example of a spread-spectrum system.
Spread-Slotted Aloha for LEO Satellite Systems 125

Here we ignore the characteristics of the spreading code and assumethat it is a simple binary sequence. The spread signal is transmitted to thechannel and experiences the additive white Gaussian noise (AWGN). If thebit rate of the original signal is fb = 1/Tb, where Tb is the time durationof a bit, in a spread-spectrum system the bit rate of the spreading code fcis selected to be much greater than fb. Then the multiplication of s(t) byg(t) results in the bits of data being chopped into chips, which is why fc iscalled chip rate. The ratio Tb/Tc is referred to as the processing gain orsimply the gain of the spread-spectrum channel, which shows the band-width-expanding factor of the spread-spectrum system and in a practicalsystem has a large value. Because the powers transmitted by s(t) and x(t)are the same, in a spread-spectrum system the power spectral density isreduced by the factor fb /fc.
At the receiver side, the direct-sequence spread-spectrum signalis recovered by first multiplying the incoming signal by the complexconjugate of the spread-spectrum code signal and then the carrier√2 cosω0t. Assuming that the spread-spectrum code signal satisfies thecondition |g(t)|2 = 1, we have
[x(t) + n(t)]g∗(t) = s(t) + n(t)g∗(t) (4.5)
The resulting waveform is then integrated for the bit duration, and theoutput of the integrator is sampled at the intervals of Tb.
In a CDMA system, each user is given a unique code that is approxi-mately orthogonal (i.e., has low cross-correlation) with the codes ofother users. Therefore, the signals of different users can be distinguishedfrom one another with respect to the difference in their codes. Figure 4.4shows an example of the generating of a CDMA packet. In the figure,each packet contains n = 6 bits of information, which is spread by a codeof the length of six chips. As can be seen in Figure 4.4, each informationbit is replaced by r chips, and the sequence of the chips is according to thecode specified for a given user. In a practical situation, however, eachpacket contains many more bits, and the code length is very long.
After spreading the low-bandwidth information packets with the PNcodes, the spread signal has a wide bandwidth that requires r times thebandwidth compared with the original signal. Because each user uses a
126 Low Earth Orbital Satellites for Personal Communication Networks

different code, simultaneous transmissions from other users appear aspseudo-noise to a given user. The packet of a user is recoverable if thepower level of noise or multiple-access interference is lower than aspecific level. In these systems, different from the conventional Alohascheme, the probability of packet success is not a (digital) step function,but a smooth function the value of which decreases as the number ofsimultaneous transmissions increases.
In a CDMA Aloha system, the packets are transmitted to the channelrandomly, as in an Aloha system; however, each packet before transmis-sion is spread with a different PN code using CDMA techniques. There-fore, we still have the simplicity of the Aloha, but because the packets areno longer low bandwidth, their information can be recovered even aftermultiple collisions. Similar to the slotted Aloha system, we can think ofa CDMA slotted Aloha system as one in which the packets are transmittedonly at the beginning of specific periods of time or slots. That modificationrequires more complexity in the synchronization process, but it canimprove the performance of the system.
Original Low Bandwidth Packet: 100111 ( 6)n =
CDMAPacket
High Bandwidth Spreading Sequence: 111010 ( 6)r =
Tb
Tc
Figure 4.4 An example of generating a CDMA packet.
Spread-Slotted Aloha for LEO Satellite Systems 127

4.1.2.2 Spread Aloha signalsAbramson proposed a method to improve the performance of the con-ventional (unspread) Aloha systems [1]. In his method, the packets aregenerated directly at a high bandwidth and then are spread in time tomake stretched packets. The stretched packets then are multiplied by aspreading sequence, which results in an identical packet, as in the case ofCDMA Aloha systems. Figure 4.5 illustrates an example of generating aspread Aloha packet by the Abramson’s method.
Comparing the resulting packets in Figure 4.5 with those inFigure 4.4, we can observe that the CDMA packet formed from aspread-spectrum operation is identical to the spread Aloha packet. How-ever, the processes of generating those two packets are different: In thecase of CDMA, the packet is formed by multiplying the low-bandwidth
Original High Bandwidth Packet: 100111 ( = 6)n
Time SpreadPacket
Spread AlohaPacket
Spreading Sequence: 111010 ( = 6)r
T'b
Tb
Tc
Figure 4.5 An example of generating a spread Aloha packet.
128 Low Earth Orbital Satellites for Personal Communication Networks

packet by a high-bandwidth carrier, which results in spreading the packetin frequency spectrum. In the case of spread Aloha, however, the packetis generated directly at a high bandwidth, and the packet is then spreadin time, which results in an identical relation.
To generate a spread Aloha packet in Abramson’s method [1], a kindof transformation is done that can be described in two steps. In the firststep, the packets spread in time in a high-bandwidth Aloha channel. Theprocess can be viewed as the dual of the frequency-spreading approach ofspread-spectrum multiple access. In the second step, the spread packetspass through a linear filter to replace each information-bearing symbol tospread packets by the spread-spectrum coding sequence. For more detailson the mathematics of this method, the reader is referred to [1].
Abramson has explained some differences between the CDMA andhis spread Aloha methods [1]. He has mentioned that with his method theenergy per information symbol in the original high-bandwidth Alohapacket and that in the spread Aloha packet will be identical. But becausein the case of spread Aloha, the same energy is spread over an interval rtimes longer than in the original packet, the spread Aloha packet can betransmitted by a terminal operating at a much lower transmitter powerlevel. That lower power capability is very important for future personalcommunication systems with small hand-held terminals.
Abramson also has mentioned that the use of spread spectrum ordi-narily implies a nonlinear operation at the transmitter to implement thefrequency spreading. The packet in a spread Aloha transmitter, however,originates at the full bandwidth of the channel, and the spreading se-quence is integrated into the packet by means of a time-invariant linearoperation.
The brief discussion in this section emphasizes the fact that, for futurePCNs employing LEO satellites and with large numbers of users equippedwith small hand-held digital terminals, the spread Aloha schemes areconsiderable and promising methods. The selection of the slotted or theunslotted form of the spread Aloha is a synchronization problem in thesystem, but one that can be solved much easier than the similar oneexisting in TDMA, for example, when large propagation delays areinvolved. In the following sections of this chapter, we employ the slottedform of CDMA Aloha, formally referred to as spread-slotted Aloha, inwhich large enough numbers of codes are prepared to assign to users.
Spread-Slotted Aloha for LEO Satellite Systems 129
4.2 Employing spread-slotted Aloha in a LEOsatellite system
In this section, we employ the spread-slotted Aloha multiple-accessscheme in a LEO satellite communications system. As in Chapter 3, weare interested in evaluating the performance of the system in differenttraffic-load distributions. We are especially concerned with the effect oftraffic nonuniformity when such a LEO satellite system is utilized forrealizing a global PCN.
For multiuser packet communications systems, there generally aretwo important measures of performance. The first one is the averagenumber of packets from the total number of transmitted packets that aresuccessfully delivered to the receivers, referred to as throughput. Thethroughput performance of a packet communications system simplyshows how much success a transmitter can expect when sending a packetto a desired receiver. Throughput is very useful in calculating otherperformance measures of the system. A performance measure closelyrelated to throughput is the probability of packet success expected for apacket transmitting to the channel. Therefore, both the throughput andthe probability of packet success are used widely in packet communica-tions systems. In a slotted system, such as slotted Aloha, either in itsconventional form or in its spread form, the throughput also can bedefined as the expected number of successfully delivered packets in eachtime slot, with the dimension of packets per slot.
The second measure of performance in a packet communicationssystem is the average delay, defined as the average time elapsed from themoment a packet is generated by a user to the moment the entire packetis received successfully at a satellite. This measure shows, on average,how long a user should expect for delivery of a packet to the receiver.The average delay contains some unavoidable parts, such as the propaga-tion delay that exists physically in any communications systems, and someparts related to the protocol used in the system. Propagation delay in alocal area network, for example, is very short and, in general, can beneglected. For a satellite system, however, the length of the propagationdelay can be on the order of several packets and, hence, is not negligible.On the other hand, the delay times related to the protocol used in the
130 Low Earth Orbital Satellites for Personal Communication Networks

system should be maintained within acceptable bounds, as far as otherparts such as propagation delay, for example, are not avoidable. Gener-ally, no one likes to wait for a long time in a queue to transmit a packetof information.
In fact, in a system that uses retransmission of packets that were notsuccessfully transmitted, such as Aloha systems, long average delayperformance means the need for a long interval of time for transmittingeach packet. During such long periods, new traffic comes to the channel,and then even normal traffic gradually changes to a high and undeliverabletraffic for the network. As a result, the system goes down. This problemoften is discussed as a system stability problem. The graphs of throughputand average delay are the complete sets for evaluating the stability in apacket communications network.
Although the throughput and the average delay are two measures ofperformance in a packet communications system, they are not inde-pendent. In fact, they are completely dependent on each other. Onereason is that, in a low-throughput system with a large number of users,users expect low probability of success for any packets they transmit onthe channel. To be successful in any packet transmission, a user is requiredto transmit the same packet several times, which in a system with longpropagation delay or with long packets means a long average delay intransmission of packets. A system with low throughput performancenecessarily has long average delay performance and vice versa. As the firststep in the evaluation of the performance of a packet communicationssystem, the measure of throughput seems to be useful enough.
In this chapter, therefore, we consider only the throughput perform-ance of a LEO satellite system. However, because it is important to knowhow the stability of the system is affected by either an increase in offeredtraffic load or nonuniformity in traffic, Chapter 6 evaluates the averagedelay performance as well, after a number of methods that can improvethe throughput performance are discussed. It is important for a systemengineer to know whether a system fails rapidly or smoothly, and thatrequires delay performance analysis.
We first develop a mathematical model for distribution of users ofour LEO satellite system, which enables us to analyze the throughputperformance of this packet communications network. After that, thedefinitions and calculations on throughput and probability of packet
Spread-Slotted Aloha for LEO Satellite Systems 131

success are presented. The calculations are followed by some numericalexamples in Section 4.3.
4.2.1 Distribution of usersConsider a global communication network comprising a number of LEOsatellites and a large but finite number of users wanting to communicatewith each other through those satellites. In some proposals, the LEOsatellite systems are proposed in conjunction with the existing terrestrialsystems (e.g., see [29,30]). To analyze the performance of the LEOsatellite systems specifically, here we consider a pure LEO satellite systemand hence limit the communications of the users through only thosesatellites.
In this system, the uplink multiple access from users to satellite isestablished according to DS/SSA techniques. Users start the transmissionof their information in the form of the fixed-length packets at commonclock instances whenever they have information to send. Packet lengthand slot size are assumed to be equal. On the downlinks, from thesatellites to the users, the satellites can take care of all their transmissions;hence, any conventional multiple-access scheme, such as TDMA, can beapplied successfully, making the uplink the limiting direction.
Network topology of the LEO satellite system is highly dynamic;however, a constant topology during each slot interval (i.e., during thetransmission of a packet) [31,32] can be assumed; hence, the interferencelevel is assumed to be constant during each time slot. It also is assumedthat the interference level for each slot is independent of the other slots.The satellite system model is the same as the model considered in Section2.3. That is, we assume a multiorbit satellite system with Ns satellites ineach circular orbit and a minimum elevation angle of θmin.
As mentioned in the preceding discussions of the performance of theLEO satellite communication systems, it is necessary to consider theeffect of nonuniform geographical distribution on the requirements forcommunications [6,33]. For that reason, this section models the trafficnonuniformity according to a nonuniform probability of existence foreach user in a specific area, as described next.
To simplify matters and to show the effect of the traffic nonuniformityclearly, the discussion here focuses on a series of three satellites and their
132 Low Earth Orbital Satellites for Personal Communication Networks

users. Assume that a total number of users, Nu, are distributed randomlyin a given area, the size of which is equal to the service areas of threeadjacent satellites and their interference areas. For a LEO satellite systemin which the satellites have the altitude h (km), the (geometric) interfer-ence limit for each of them in a smooth spherical Earth assumption is givenby the angle βI = cos–1(R/R + h), where R is the average radius of theEarth, about 6,378 km. By this notation, we can say that Nu users aredistributed in an area whose size equals 4π/Ns + 2βI, which is the size ofthe interference areas of three succeeding satellites. In that area, it isassumed that the location of every user is a random variable with prob-ability density function p(α) as
p(α) =
A
ωexp(−α2⁄2ω2)
0
−2πNs
− βI ≤ α ≤ 2πNs
+ βI
elsewhere
(4.6)
where α is the relative location of a user, measured by the angle at thecenter of the Earth (see Figure 3.2); ω is the parameter representinguniformity in traffic; Ns, as already mentioned, is the number of satellitesin each orbit; and A is a factor that makes the total probability of theexistence of a user in the area fixed and equal to 1, when changing ω orNs, equal to
A = ω⁄ ∫−2π⁄Ns − βI
2π⁄Ns + βIexp(−α2⁄2ω2)dα (4.7)
Note from (4.6) that an infinite value of ω provides uniform trafficdistribution, and small values of that parameter establish nonuniformnormal-shape distribution of the traffic, similar to the model discussed inSection 3.1.
Finally, it is assumed that each user sends a packet, including newlygenerated and retransmitted packets, in each time slot with the prob-ability q. This assumption is often used in the literature, for example, in[34]. If we assume M users in the specific area under consideration, thedistribution of the number of packets that are sent simultaneously to thechannel becomes binomial with the parameters q and M [20], as
Spread-Slotted Aloha for LEO Satellite Systems 133

f(m; M) =
Mm
qm(1 − q)M − m
0
m ≤ Mm > M
(4.8)
where m is the number of transmitted packets.
4.2.2 Throughput analysis
In slotted Aloha systems, steady-state throughput can be defined simplyas the expected number of successfully transmitted packets per time slot.In the case of LEO satellite systems with nonuniform traffic distribution,the expected number of users and hence the composite packet arrival rateare different in each service area. Thus, we normalize the throughput foreach satellite by the expected number of users in its service area, ENi,namely, the normalized throughput for the ith satellite, as
ξi, norm =ξi
ENi
(packet/slot/user), i = 1, 2, …, Ns (4.9)
where ξi is the expected number of successfully transmitted packets ofthe ith satellite in a time slot.
Assume that ci is the number of successful transmissions for the ithsatellite among simultaneous ni packets transmitted from its service areawhen mi packets are sent at that time slot from its interference area. Inthat case,
P ci = c |ni = n, mi = m
=
nc
PC,ic (n, m)
1 − PC,i (n, m)
n − c
(4.10)
where P[B] denotes the occurrence probability of event B, and PC,i(n, m)is the probability of success for a packet in the presence of n and m packetsin the service area and in the interference area of the ith satellite,respectively. The throughput for this case, that is, the expected numberof successful transmissions to the ith satellite, is given by
ξi(ni, mi) = Eci | ni, mi
(4.11)
134 Low Earth Orbital Satellites for Personal Communication Networks

The expectation in (4.11) can be calculated by considering all possiblesituations of ni packets transmitted to the ith satellite with their prob-ability of a successful transmission, PC,i(ni, mi), and probability of anunsuccessful transmission (i.e., the probability of error), 1–PC,i(ni, mi),in the form of summation as
ξi(ni, mi) = ∑c = 0
ni
c
nic
PC,ic (ni, mi)
1 − PC,i (ni, mi )
ni − c
(4.12)
Because the summation equals ni ⋅ PC,i(n, m),
ξi(ni, mi) = ni ⋅ PC,i (ni, mi) (4.13)
Equation (4.13) gives the throughput for the case when ni packets aretransmitted simultaneously from the service area of the ith satellite, andmi packets are sent at the same time slot from its interference area. Tofind the total throughput of the ith satellite, we should average (4.13) forall possible values of ni and mi. To calculate that average value, we alsoshould consider the probability of ni and mi packets from a total of Nu
users. Hence, the throughput of the ith satellite, ξi, is the expected valueof ξi(ni, mi), that is,
ξi = Eξi(ni, mi)
= ∑M = 1
Nu
P Mi = M
∑m = 1
M
f(m;M) ∑n = 1
m
P ni = n | mi = m
n PC,i(n, m)
(4.14)
where Mi is the number of users in the interference area, and Nu, asdefined before, is the total number of users in the interference areas ofthe (i − 1)st, ith, and (i + 1)st satellites. To understand (4.14), note thatthe left summation considers the number of users, the middle summationis the simultaneous transmission distribution for each user, and the
Spread-Slotted Aloha for LEO Satellite Systems 135

rightmost summation involves the simultaneous packet throughput foreach transmission. From the theory of probability, the probability of Musers in the interference area of the ith satellite, for example, equals
P Mi = M
=
NuM
∫βi − βI
βi + βIp(α)dα
M1 − ∫
βi − βI
βi + βIp(α)dα
Nu − M
(4.15)
where βi is the angle between the ith satellite and the peak of theprobability density function, p(α). The conditional probability of n pack-ets in the service area of the ith satellite when there is information onexisting m packets in the interference area of that satellite also equals
P
ni = n | mi = m
=
mn
εn(1 − ε)m − n (4.16)
where ε is the probability of a single user in the service area when weknow that the user is in the interference area of the same satellite andequals
ε = P
ni = 1 | mi = 1
=∫βi − π⁄Ns
βi + π⁄Ns
p(α)dα
∫βi − βI
βi + βIp(α)dα (4.17)
The remaining problem is to find the probability of success PC,i(n, m).
4.2.3 Probability of packet successCalculating the probability of packet success in a spread-spectrum packetcommunications system is a serious problem that has occupied the atten-tion of researchers for a long time [35–48], both for slotted and unslottedsystems. In the case of unslotted systems, the problem is more compli-cated: The level of multiple-access interference over transmission of a
136 Low Earth Orbital Satellites for Personal Communication Networks

packet changes bit by bit because at any instant there is a probability fortransmission of a new packet on the channel. In those systems and to makethe analysis easier, some studies assumed a perfect capture in the analysis ofprobability of packet success, which means that the transmission of a packetwill be successful if merely the preamble of the packet (or sometimes itsfirst bit) is captured successfully. That assumption gives major simplifica-tion in mathematics, but the result is not very realistic. Therefore, severalstudies were carried out with the assumption of nonperfect capture.
In slotted systems, the number of interfering transmissions is constantthroughout the entire packet, and, hence, the calculation of probabilityof packet success is much easier than in unslotted systems. Nevertheless,several studies have been performed to approximate the level of multi-ple-access interference and to make the mathematics simpler. In thosestudies, the main effort was to evaluate the probability of data bit errorwithout accounting for the bit-to-bit dependence caused by the multiple-access interference. In [42], for example, the upper and lower bounds onthe probability of data bit error by constructing the actual density functionfor the multiple-access interference, given random signature sequencesfor all users, were derived. In [39], bounds on the bit error probabilityfor deterministic sequences were developed from the convex propertiesof the error probability function and the characteristic function of themultiple-access interference components.
Although each method has some advantages and disadvantages,Pursley [35] proposed an approximation to the multiple-access interfer-ence that has been used for spread-spectrum systems since then [47,48].In his method, the summation of multiple-access interference and thebackground Gaussian noise is approximated by a Gaussian noise. Morrowand Lehnert proposed an “improved Gaussian approximation” for theprobability of data bit error subsequent to Pursley’s method, which wascalled the “standard Gaussian approximation” [45]. However, accordingto their analysis, it has been shown that the standard Gaussian approxi-mation of Pursley is close enough to the bounds given by the improvedGaussian approximation when the number of users is large enough, saymore than 10. In our analysis, we also use the standard Gaussian approxi-mation, because in general the number of users is large enough.
In the following analysis is a primary assumption that the networkoperates under perfect power control so the signals from the users in the
Spread-Slotted Aloha for LEO Satellite Systems 137
service area of a given satellite (and connecting to it), say the ith satellite,reach the satellite by equal power level, Si. The signals from usersconnecting to adjacent satellites reach the ith satellite with power levelsrelated to their distances to the connected satellite and the ith satelliteand the propagation loss factor.
To calculate the packet success probability, we assume that the levelof interference is constant over the transmission of a packet. The noise atthe receiver is due to interference from other users and to a constantbackground noise with two-sided power spectral density, N0/2. Wedenote the equivalent symbol energy-to-noise ratio at the receiver byEb/N0eff, where N0eff/2 is an equivalent white-noise two-sided powerspectral density for the same signal-to-noise ratio at the receiver. If thereceived signal at the ith satellite has the power Si, and the interferershave a total power of Ii, the average symbol energy-to-noise ratio at thesatellite in the case of the direct-sequence scheme with BPSK (DS/BPSK) withrectangular chip pulse is then
µi =2Eb
N0eff=
2Ii3LSi
+ 1µ0
−1
(4.18)
where µ0 is the ratio of bit energy-to-power spectral density of thebackground noise equal to 2Eb/N0, and L is the bandwidth-expansionfactor (processing gain). The parameter µ0 also can be defined as thesignal-to-noise ratio in the absence of interferers. The equation also canbe derived from the results of Pursley [35].
By modeling the total interference over a packet as Gaussian noise ina spread-spectrum system, the probability of packet success becomes asmooth function of signal-to-interference ratio, defined as the conditionalprobability of packet success as
P success of observed packet | µi
= s(µi) (4.19)
The unconditional probability of packet success for a packet that istransmitted in the service area of the ith satellite can be determined from
138 Low Earth Orbital Satellites for Personal Communication Networks
PC,i(n, m) = ∫0
∞s(µ)fµi(µ)dµ
= ∫0
∞[1 − Fµi(µ)]s′(µ)dµ (4.20)
where fµi(µ) and Fµi(µ) are the probability density and the probabilitydistribution functions of the random variable µi, respectively; and s′(µ)is the derivative of s(µ). Note that the distribution of the interferencepower and thus µ depend on n and m. Also note that the second expressionin (4.20) is obtained after an integration by parts. This kind of change inintegral is not true in general, though it is true for the random variablesinvolved here.
To determine the probability of packet success in each service area,it is necessary to find the probability distribution of µi. However, thisnecessity can be changed to the determination of the probability distri-bution function of Ii, FIi(y) by using the relation in (4.18) as
Fµi(µ) = P [µi ≤ µ]
= P
2Ii3LSi
+ 1µ0
−1
≤ µ
=
1 − FIi
3LSi
2
1µ
− 1µ0
0
µ < µ0
µ > µ0
(4.21)
For the sake of simplicity, let us define
K(µ)3L2
1µ
− 1µ0
(4.22)
and rewrite (4.21) as
=
Spread-Slotted Aloha for LEO Satellite Systems 139
Fµi(µ) =
1 − FIi K(µ) ⋅ Si
0
µ > µ0
µ < µ0
(4.23)
The parameter K(µ) denotes the ratio of the power of the interference tothe power of the desired signal at each satellite. The importance of thisparameter is that it frees us from separate consideration of the threeparameters L, µ0, and µ. We will show later, in Section 4.3, that the valueof this parameter evaluated at some threshold level of the signal-to-noiseratio simply provides the number of simultaneous transmissions to eachsatellite; hence, we call it multiple-access capability [7].
In the case of satellite systems, because of the relatively small effectof shadowing and Rayleigh fading, it is reasonable to assume that the radiosignal power is attenuated in proportion to the second power of propa-gation distance [49]. Under that assumption, the required transmittingpower level to the ith satellite equals
Si, req(α) = C ⋅ Si ⋅ li2(βi − α) i = 1, 2, …, Ns
= C ⋅ Si ⋅ a − b cos(βi − α)
(4.24)
where α is the angle between the user and the peak of probability densityfunction p(α); li(βi –α) is the distance between the ith satellite and a userin angular position α; a = h2 + 2R2 + 2Rh; b = 2R(R + h); and C, a constantwith the dimension of the inverse of the squared distance, depends on thewavelength of the carrier.
For each satellite; say the ith satellite, let define three separate areas,as shown in Figure 4.6:
area 1: the intersection area between the service area of the (i – 1)stsatellite and the visible area of the ith satellite;
area 2: the service area of the ith satellite;
area 3: the intersection area between the service area of the(i + 1)st satellite and the interference area of the ith satellite.
140 Low Earth Orbital Satellites for Personal Communication Networks

As described in Section 4.2.2, let the number of packets transmittedfrom area 2 be n and the total number of packets from areas 1, 2, and 3(i.e., in the interference area) be m. Depending on the location of a givenuser, different interference power reaches the ith satellite during thetransmission of the packet transmitted by that user. If we denote theinterference power of each signal at the ith satellite by Ii, l, where l = 1,2, …, m, it is equal to
Ii,l =
CSi − 1 ⋅a − b cos(βi − 1 − α)
a − b cos(βi − α)CSi
CSi + 1 ⋅a − b cos(βi + 1 − α)
a − b cos(βi − α)0
(4.25)
For each value of interference, y, FIi (y) equals
IAi 1− IAi 1+
IAi
SAi - 1 SAi + 1SAi
area 1 area 2 area 3
IA: Interference Area
SA: Service Area
Figure 4.6 Explanation of area 1, area 2, and area 3 for the ithsatellite.
if transmitted from area 1
if transmitted from area 2
if transmitted from area 3
elswhere
Spread-Slotted Aloha for LEO Satellite Systems 141

FIi(y) = P[Ii ≤ y]
= P
∑area 1&2&3
Ii,l ≤ y
(4.26)
where the summation is over all m transmitting users in the interferencearea of the ith satellite. Because, according to (4.25), the interferencefrom n users in the service area does not depend on their location, we canrewrite (4.26) as
FIi (y) = P ∑
area2
Ii, l + ∑area 1 & 3
Ii, l ≤ y
=
P
∑area 1 & 3
li, l ≤ y − n CSi
0
(4.27)
The probability in (4.27) defines the probability of the event that the totalinterference from the transmitting users in areas 1 and 3 is less than somevalue at the ith satellite. However, the interferences from the users inthose two areas are not necessarily equal, as (4.25) shows. Therefore, tocalculate that probability, we can use the following equation:
P
∑area 1&3
Ii,l (y − n CSi)
= ∑k = 0
m − n
P[k packets from area 1 | (m − n) packets from areas 1&3]
⋅ P Ii(k, m − n) ≤ (y − nCSi)
(4.28)
where Ii(k, m − n) denotes the sum of interference from the areas 1 and3 at the ith satellite, when there are k packets from area 1 and m − n packets
if y ≥ n CSi
if y < n CSi
142 Low Earth Orbital Satellites for Personal Communication Networks
from areas 1 and 3. The probability of existing k packets from area 1 withthe condition that there are (m − n ) packets from areas 1 and 3 is
P
k packets from area 1 |(m − n) packets from areas 1&3
= m − n
k
νk(1 − ν)m − n − k
(4.29)
where ν denotes the probability of transmitting from area 1 for a packetequals
ν = ∫area 1
p(α)dα ⁄ ∫
area 1p(α)dα + ∫
area 3p(α)dα
(4.30)
To compute Ii(k, m − n) in (4.28), note that this interference poweris the sum of the powers of k independent interferences in area 1 andm − n − k independent interferences in area 3. Because these interferencepowers, Ii, l, have similar source distributions, for enough large values ofm − n the summation can be assumed to have a Gaussian distribution withthe mean η and the variance σ, expressed as
η = kCSi − 1∫
area 1
a − b cos(βi − 1 − α)a − b cos(βi − α)
p(α)dα ⁄ ∫area 1
p(α)dα
+ (m − n − k)
CSi − 1 ∫
area 3
a − b cos(βi + 1 − α)a − b cos(βi − α)
p(α)dα ⁄ ∫area 3
p(α)dα
(4.31)
σ2 = kC2Si − 12
∫
area 1
a − b ⋅ cos(βi − 1 − α)a − b ⋅ cos(βi − α)
2
p(α)dα
−
∫ a − b cos(βi − 1 − α)
a − b ⋅ cos(βi − α)area 1p(α)dα
2
⁄ ∫ parea 1
(α)dα
Spread-Slotted Aloha for LEO Satellite Systems 143
+ (m − n − k)C2Si + 12
∫
a − b ⋅ cos(βi + 1 − α)a − b ⋅ cos(βi − α)
2
p(α)dαarea 3
−∫ a − b ⋅ cos(βi + 1 − α)
a − b ⋅ cos(βi − α)area 3p(α)dα
2
⁄ ∫ parea 3
(α)dα
(4.32)
Then, the desired probability can be calculated from [50]
P Ii(k, m − n) ≤ (y − nCSi)
= 1⁄2 + erf
y − nCSi − ησ
(4.33)
where erf(⋅) is the error function, defined as
erf(x) =(1⁄√2π) ∫
0
xexp(−y
2⁄2)dy
Note that the constant C will be omitted in the evaluation of (4.33).
4.3 Numerical examples
From the discussion in the preceding section, the probability of successfor any given n and m, PC,i(n, m) can be determined if we have s(µ) definedin (4.19). As an example of determining the function s(µ), consider at-error-correcting block code of length n. For any given value of µ, theprobability of symbol error is given by [50]
pe = 12 erfc(õ) (4.34)
144 Low Earth Orbital Satellites for Personal Communication Networks
where
erfc(x) = 2⁄√π ∫x
∞e−τ2
dτ
is the complementary error function. Then, with the assumption ofindependent symbol errors, the conditional probability of packet successconditioned on the level of signal-to-noise ratio is given by
s(µ) = ∑k = 0
t
nk
12 erfc(õ)
k1 − 1
2erfc(õ)
n − k
(4.35)
The function s(µ) depends on the adoption of error-correcting code.With powerful error-correction codes, it is close to a step functionat some threshold value of signal-to-noise ratio at the satellite, such asµc, as
s(µ) =
10
µ ≥ µc
µ < µc
(4.36)
As an example, assume that a step function and substitute it into(4.20) with (4.23), we have
PC,i(n, m) =
FIi K(µc) ⋅ Si
0
µ > µc
µ < µc
(4.37)
Note that K(µc) + 1 denotes the possible number of simultaneous trans-missions, in the absence of the background noise and interference. Thus,we named K(µc) multiple-access capability. Applying that to the discussionin Section 4.2, we can have the throughput characteristics of the DS/SSAin LEO satellite communication systems.
Chapter 3 showed that the worst case in the performance of the LEOsatellite communication system with nonuniform traffic distribution oc-
Spread-Slotted Aloha for LEO Satellite Systems 145
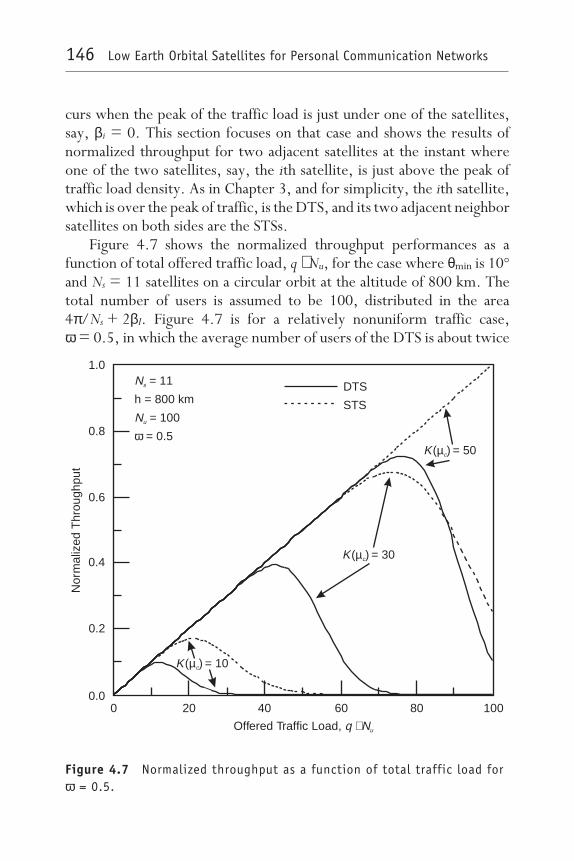
curs when the peak of the traffic load is just under one of the satellites,say, βi = 0. This section focuses on that case and shows the results ofnormalized throughput for two adjacent satellites at the instant whereone of the two satellites, say, the ith satellite, is just above the peak oftraffic load density. As in Chapter 3, and for simplicity, the ith satellite,which is over the peak of traffic, is the DTS, and its two adjacent neighborsatellites on both sides are the STSs.
Figure 4.7 shows the normalized throughput performances as afunction of total offered traffic load, q ⋅ Nu, for the case where θmin is 10°and Ns = 11 satellites on a circular orbit at the altitude of 800 km. Thetotal number of users is assumed to be 100, distributed in the area4π/Ns + 2βI. Figure 4.7 is for a relatively nonuniform traffic case,ω = 0.5, in which the average number of users of the DTS is about twice
N
N
s
u
= 11
h = 800 km
= 100
= 0.5ω
DTS
STS
Nor
mal
ized
Thr
ough
put
1.0
0.8
0.6
0.4
0.2
0.0
Offered Traffic Load, q Nu⋅0 20 40 60 80 100
K( ) = 50µc
K( ) = 30µc
K( ) = 10µc
Figure 4.7 Normalized throughput as a function of total traffic load forω = 0.5.
146 Low Earth Orbital Satellites for Personal Communication Networks
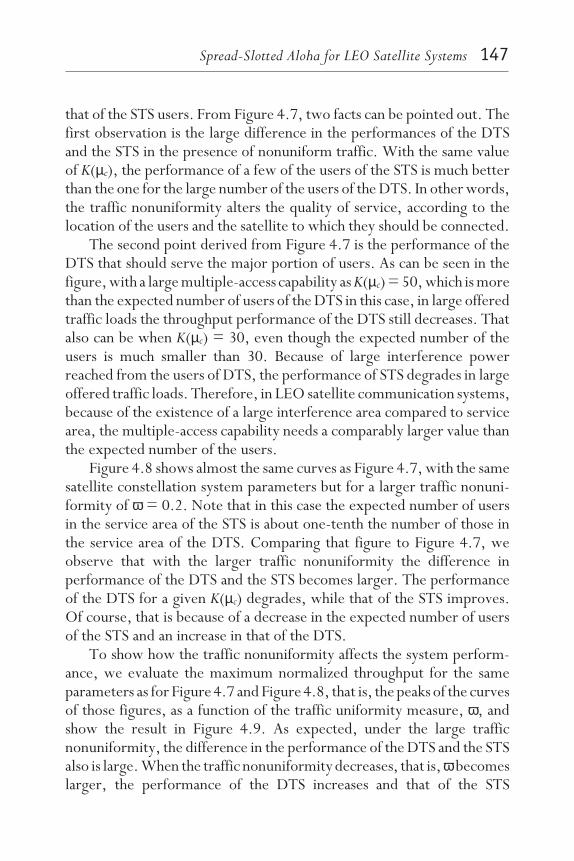
that of the STS users. From Figure 4.7, two facts can be pointed out. Thefirst observation is the large difference in the performances of the DTSand the STS in the presence of nonuniform traffic. With the same valueof K(µc), the performance of a few of the users of the STS is much betterthan the one for the large number of the users of the DTS. In other words,the traffic nonuniformity alters the quality of service, according to thelocation of the users and the satellite to which they should be connected.
The second point derived from Figure 4.7 is the performance of theDTS that should serve the major portion of users. As can be seen in thefigure, with a large multiple-access capability as K(µc) = 50, which is morethan the expected number of users of the DTS in this case, in large offeredtraffic loads the throughput performance of the DTS still decreases. Thatalso can be when K(µc) = 30, even though the expected number of theusers is much smaller than 30. Because of large interference powerreached from the users of DTS, the performance of STS degrades in largeoffered traffic loads. Therefore, in LEO satellite communication systems,because of the existence of a large interference area compared to servicearea, the multiple-access capability needs a comparably larger value thanthe expected number of the users.
Figure 4.8 shows almost the same curves as Figure 4.7, with the samesatellite constellation system parameters but for a larger traffic nonuni-formity of ω = 0.2. Note that in this case the expected number of usersin the service area of the STS is about one-tenth the number of those inthe service area of the DTS. Comparing that figure to Figure 4.7, weobserve that with the larger traffic nonuniformity the difference inperformance of the DTS and the STS becomes larger. The performanceof the DTS for a given K(µc) degrades, while that of the STS improves.Of course, that is because of a decrease in the expected number of usersof the STS and an increase in that of the DTS.
To show how the traffic nonuniformity affects the system perform-ance, we evaluate the maximum normalized throughput for the sameparameters as for Figure 4.7 and Figure 4.8, that is, the peaks of the curvesof those figures, as a function of the traffic uniformity measure, ω, andshow the result in Figure 4.9. As expected, under the large trafficnonuniformity, the difference in the performance of the DTS and the STSalso is large. When the traffic nonuniformity decreases, that is, ω becomeslarger, the performance of the DTS increases and that of the STS
Spread-Slotted Aloha for LEO Satellite Systems 147

N
N
s
u
= 11h = 800 km
= 100= 0.2ω
DTSSTS
Nor
mal
ized
Thr
ough
put
1.0
0.8
0.6
0.4
0.2
0.0
Offered Traffic Load, q Nu⋅0 20 40 60 80 100
K( ) = 50µc
K( ) = 30µc
K( ) = 10µc
Figure 4.8 Normalized throughput as a function of total traffic load forω = 0.2.
N
N
s
u
= 11h = 800 km
= 100= 10 degreesθ
DTSSTSK( ) = 50µc
K( ) = 30µc
K( ) = 10µc
Max
imum
Nor
mal
ized
Thr
ough
put
1.0
0.8
0.6
0.4
0.2
0.0
ω0.2 0.6 1.0 1.4 1.8 2.2 2.6 3.0
Figure 4.9 Maximum normalized throughput as a function ofnonuniformity in traffic for Ns = 11 and K(µc) = 10, 30, and 50.
148 Low Earth Orbital Satellites for Personal Communication Networks
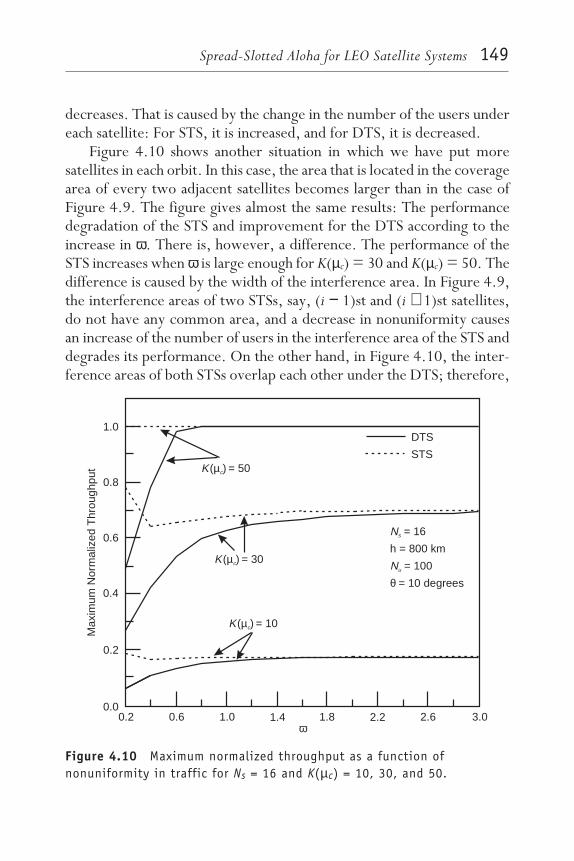
decreases. That is caused by the change in the number of the users undereach satellite: For STS, it is increased, and for DTS, it is decreased.
Figure 4.10 shows another situation in which we have put moresatellites in each orbit. In this case, the area that is located in the coveragearea of every two adjacent satellites becomes larger than in the case ofFigure 4.9. The figure gives almost the same results: The performancedegradation of the STS and improvement for the DTS according to theincrease in ω. There is, however, a difference. The performance of theSTS increases when ω is large enough for K(µc) = 30 and K(µc) = 50. Thedifference is caused by the width of the interference area. In Figure 4.9,the interference areas of two STSs, say, (i − 1)st and (i + 1)st satellites,do not have any common area, and a decrease in nonuniformity causesan increase of the number of users in the interference area of the STS anddegrades its performance. On the other hand, in Figure 4.10, the inter-ference areas of both STSs overlap each other under the DTS; therefore,
N
N
s
u
= 16
h = 800 km
= 100
= 10 degreesθ
DTS
STSK( ) = 50µc
K( ) = 30µc
K( ) = 10µc
Max
imum
Nor
mal
ized
Thr
ough
put
1.0
0.8
0.6
0.4
0.2
0.0
ω0.2 0.6 1.0 1.4 1.8 2.2 2.6 3.0
Figure 4.10 Maximum normalized throughput as a function ofnonuniformity in traffic for Ns = 16 and K(µc) = 10, 30, and 50.
Spread-Slotted Aloha for LEO Satellite Systems 149

the users around the peak of the traffic load located under the DTS affectboth STSs at the same time. Thus, the number of users in the overlappingarea becomes smaller by making ω larger; the total interference to theSTS can be expected to be smaller. Of course, when ω becomes larger,the number of users near the STS also increases and performance de-grades. As a result of those two opposite phenomena, as can be seen inFigure 4.10, a dip point appears in the performance of the STS withK(µc) = 30.
To show the effect of the traffic nonuniformity on the performanceof the system and not only on the performances of the individual satellites,let us define the normalized total throughput as the expected number ofsuccessfully transmitted packets in the area that includes the service areasof three succeeding satellites normalized by the total expected numberof users in that area, or, in the form of equations as
ξnorm =ξi − 1 + ξi + ξi + 1
ENi − 1
+ E
Ni
+ E
Ni + 1
(4.38)
Figures 4.11 and 4.12 compare the normalized total throughputcharacteristics at different degrees of the traffic nonuniformity, withK(µc) = 30 and K(µc) = 10, respectively. As the traffic nonuniformityincreases, the normalized total throughput becomes considerably lessthan that in the uniform traffic case. That is because of significantdegradation in the performance of the satellite above the most probablepoint, that is, the ith satellite, due to the large number of simultaneouslytransmitting packets.
It seems from Figure 4.12 that, in large offered traffic load q ⋅ Nu withrelatively small K(µc) (=10), the performance of a larger nonuniformtraffic system such as ω = 0.2 is better than that of a uniform traffic case.That, however, is due to service to a very small portion of users lying inthe service areas of the (i − 1)st and the (i + 1)st satellites with the expenseof large unused parts of their communications facilities. By increasing themultiple-access capability, that phenomenon disappears, that is, in alltraffic loads the performance of the uniform traffic case becomes betterthan that of the nonuniform traffic cases.
150 Low Earth Orbital Satellites for Personal Communication Networks
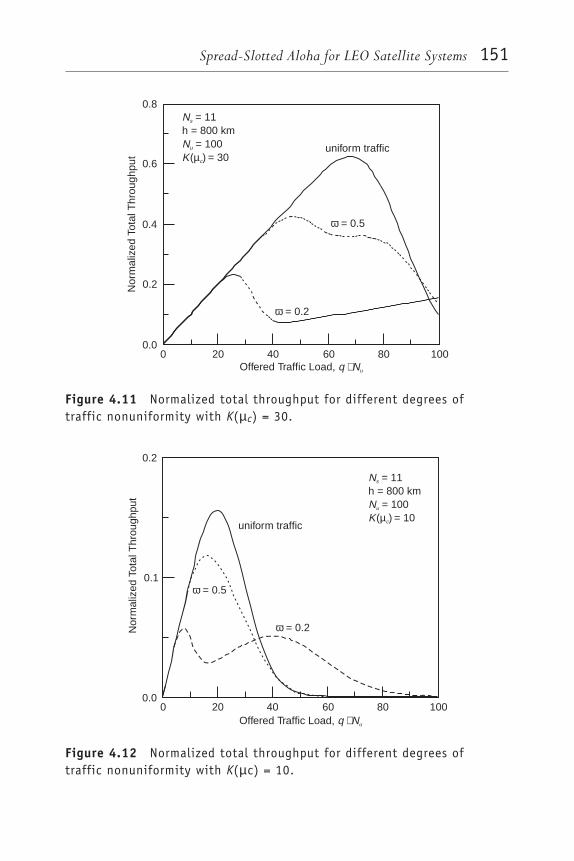
N
NK
s
u
c
= 11h = 800 km
= 100( ) = 30µ
Nor
mal
ized
Tota
l Thr
ough
put
0.8
0.6
0.4
0.2
0.00 20 40 60 80 100
Offered Traffic Load, q Nu⋅
uniform traffic
ω = 0.5
ω = 0.2
Figure 4.11 Normalized total throughput for different degrees oftraffic nonuniformity with K(µc) = 30.
N
NK
s
u
c
= 11h = 800 km
= 100( ) = 10µ
0 20 40 60 80 100Offered Traffic Load, q Nu⋅
uniform traffic
ω = 0.5
ω = 0.2Nor
mal
ized
Tota
l Thr
ough
put
0.2
0.1
0.0
Figure 4.12 Normalized total throughput for different degrees oftraffic nonuniformity with K(µc) = 10.
Spread-Slotted Aloha for LEO Satellite Systems 151

4.4 Summary
This chapter discussed the fundamentals of the random-access packetcommunications by the means of LEO satellites. Of importance, wediscussed conventional Aloha schemes and explained their simplicity aswell as their low capacity. We reviewed the theory of spreading the Alohapackets to reduce the effect of packet collisions and, hence, to improvethe performance of the system. We explained the shapes of signals in twomultiple-access schemes, the CDMA and the spread Aloha, and discussedthe differences between the two when practical specifications are consid-ered, which often are mistakenly considered equivalent schemes.
The second part of this chapter employed the random-access direct-sequence spread-slotted Aloha in a LEO satellite system. We presentedthe throughput performance calculations for the system, which are usedthroughout the succeeding chapters. To evaluate the throughput per-formance, we calculated the probability of packet success and, in thatway, introduced a Gaussian approximation for the level of multiple-ac-cess interference. The approach used in that calculation is only an exam-ple of several methods that were developed for about two decades; hence,the reader is referred to the other approaches used in [35–48]. However,the reader should note that any approach other than the one presentedhere can be used with the other calculations of throughput of this chapter,if it is replaced by the probability of packet success in the properequations. For example, in Chapter 6, we consider a fading satellitechannel and again calculate the probability of packet success as well as thethroughput.
The mathematics given in this chapter were general enough that theycan be used in packet communications systems other than the LEOsatellite system considered here. As an example of an application of thecalculations in this chapter, we evaluated the performance of a LEOsatellite system in uniform and nonuniform traffic situations. Accordingto the numerical examples presented in this chapter, it was shown thatthe traffic nonuniformity gives significant effects to the characteristics ofthe system and that the throughput of the system in nonuniform trafficsituation is much lower than that accessible in a uniform traffic situation,which often is assumed in the literature. Therefore, the analysis andevaluation based on the simplified assumption of uniform traffic distribu-
152 Low Earth Orbital Satellites for Personal Communication Networks

tion are not always correct. Moreover, it was revealed that the interfer-ence from users in the service areas of adjacent satellites is one of the mainfactors that limits the performance of the system. To improve theperformance of the systems studied here, multiple spot beams could beused as well as interference-cancellation techniques. The following chap-ters introduce some methods for remedying the effects of traffic nonuni-formity for LEO satellite systems and reducing the multiple-accessinterference, which can be applied in terrestrial systems too. The per-formance improvement due to spot-beam antenna on satellites, which isthe choice of current big-LEO constellation planners is briefly discussedin Chapter 7.
References[1] Abramson, N., “Fundamentals of Packet Multiple Access for Satellite
Networks,” IEEE J. Select. Areas Commun., Vol. 10, No. 2, 1992, pp. 309–316.
[2] Pickholtz, R. L., L. B. Milstein, and D. L. Schilling, “Spread Spectrum forMobile Communications,” IEEE Trans. Vehic. Technol., Vol. 40, No. 2, 1991,pp. 313–322.
[3] Gilhousen, K. S., et al., “Increased Capacity Using CDMA for Mobile SatelliteCommunication,” IEEE J. Select. Areas Commun., Vol. 8, No. 4, 1990,pp. 503–514.
[4] Gilhousen, K. S., et al., “On the Capacity of a Cellular CDMA System,”IEEE Trans. Vehic. Technol., Vol. 40, No. 2, 1991, pp. 303–312.
[5] Lee, W. C. Y., “Overview of Cellular CDMA,” IEEE Trans. Vehic. Technol.,Vol. 40, No. 2, 1991, pp. 291–302.
[6] Jamalipour, A., and A. Ogawa, “Traffic Characteristics of the LEOS-BasedGlobal Personal Communications Networks,” IEEE Commun. Mag., Vol. 35,No. 2, 1997, pp. 118–122.
[7] Weber, C. L., G. K. Huth, and B. H. Baston, “Performance Consideration ofCode Division Multiple-Access Systems,” IEEE Trans. Vehic. Technol.,Vol. VT-30, No. 1, 1981, pp. 3–10.
[8] Jacobs, I. M., R. Binder, and E. V. Hoversten, “General Purpose PacketSatellite Networks,” Proc. IEEE, Vol. 66, No. 11, 1978, pp. 1448–1467.
[9] Tobagi, F. A., “Multiaccess Protocols in Packet Communication Systems,”IEEE Trans. Commun., Vol. COM-28, No. 4, 1980, pp. 468–488.
[10] Kahn, R. E., et al., “Advances in Packet Radio Technology,” Proc. IEEE,Vol. 66, No. 11, 1978, pp. 1468–1496.
Spread-Slotted Aloha for LEO Satellite Systems 153

[11] Jamalipour, A., et al., “Throughput Analysis of Spread-Slotted Aloha in LEOSatellite Communication Systems With Nonuniform Traffic Distribution,”IEICE Trans. Commun., Vol. E78-B, No. 12, 1995, pp. 1657–1665.
[12] Makrakis, D., and K. M. Sundara Murthy, “Spread Slotted ALOHA Techniquesfor Mobile and Personal Satellite Communication Systems,” IEEE J. Select. AreasCommun., Vol. 10, No. 6, 1992, pp. 985–1002.
[13] Polydoros, A., and J. Silvester, “Slotted Random Access Spread-SpectrumNetworks: An Analytical Framework,” IEEE J. Select. Areas Commun., Vol. 5,No. 6, 1987, pp. 989–1002.
[14] Jamalipour, A., et al., “Spread-Slotted Aloha Throughput in NonuniformTraffic Situation for LEO Satellite Communication Systems,” Proc. Singapore Int.Conf. Communications Systems (ICCS ’94), Singapore, 1994, pp. 554–558.
[15] Jamalipour, A., et al., “LEO Satellite Communication Systems UnderNonuniform Traffic Distribution With Spread-Slotted Aloha,” Proc. Tech. ReportIEICE, SAT 94-57, Japan, 1994, pp. 15–21.
[16] Abramson, N., “The ALOHA System—Another Alternative for ComputerCommunications,” Proc. 1970 Fall Joint Comp. Conf., 1970, pp. 281–285.
[17] Abramson, N., “The ALOHA System,” Computer Communication Networks, N.Abramson and F. F. Kuo, ed. Englewood Cliffs, NJ: Prentice-Hall, 1973.
[18] Abramson, N., “Packet Switching With Satellites,” Proc. Natl. Computer Conf.,Vol. 42, 1973, pp. 695–702.
[19] Abramson, N., “The Throughput of Packet Broadcasting Channels,” IEEE Trans.Commun., Vol. COM-25, No. 1, 1977, pp. 233–244.
[20] Kleinrock, L., Queuing Systems, Vols. 1 and 2, New York: Wiley, 1975.
[21] Bertsekas, D., and R. Gallager, Data Networks, Englewood Cliffs, NJ:Prentice-Hall, 1987.
[22] Tanenbaum, A. S., Computer Networks, 2nd ed., Englewood Cliffs, NJ:Prentice-Hall, 1989.
[23] Papoulis, A., Probability, Random Variables, and Stochastic Processes, New York:McGraw-Hill, 1965.
[24] Metzner, J. J., “On Improving Utilization in ALOHA Network,” IEEE Trans.Commun., Vol. COM-24, No. 4, 1976, pp. 447–448.
[25] Crozier, S. N., “Sloppy-Slotted ALOHA,” Proc. 2nd Int. Mobile Satellite Conf.,Ottawa, 1990, pp. 357–362.
[26] Viterbi, A. J., “Spread Spectrum Communications—Myths and Realities,”IEEE Commun. Mag., Vol. 17, No. 3, 1979, pp. 219–226.
[27] Viterbi, A. J., “When Not to Spread Spectrum—A Sequel,” IEEE Commun.Mag., Vol. 23, No. 4, 1985, pp. 12–17.
154 Low Earth Orbital Satellites for Personal Communication Networks
[28] Viterbi, A. J., CDMA: Principles of Spread Spectrum Communication, Reading, MA:Addison-Wesley, 1995.
[29] Pullman, M. A., K. M. Peterson, and Y. Jan, “Meeting the Challenge ofApplying Cellular Concepts to LEO SATCOM Systems,” Proc. IEEE Int. Conf.Communications (ICC ’92), Chicago, IL, Vol. 2, 1992, pp. 770–773.
[30] Chin, L., and J. Chang, “Using Low Earth Orbiting Satellites to Backup theSupport of the Existing Ground Mobile Communications,” Proc. IEEE Int. Conf.Communications (ICC ’93), Switzerland, Vol. 3, 1993, pp. 1103–1107.
[31] Chakraborty, D., “Survivable Communication Concept via Multiple LowEarth-Orbiting Satellites,” IEEE Trans. Aeroso. Electron. Syst., Vol. 25, No. 6,1989, pp. 879–889.
[32] Kaniyil, J., et al., “A Global Message Network Employing Low Earth-OrbitingSatellites,” IEEE J. Select. Areas Commun., Vol. 10, No. 2, 1992, pp. 418–427.
[33] Jamalipour, A., et al., “Signal-to-Interference Ratio of CDMA in LowEarth-Orbital Satellite Communication Systems With Nonuniform TrafficDistribution,” Proc. IEEE GLOBECOM ’94 Conference, San Francisco, CA, 1994,pp. 1748–1752.
[34] Raychaudhuri, D., “Performance Analysis of Random Access Packet-SwitchedCode Division Multiple-Access Systems,” IEEE Trans. Commun., Vol. COM-29,No. 6, 1981, pp. 895–901.
[35] Pursley, M. B., “Performance Evaluation for Phase-Coded Spread-SpectrumMultiple Access Communication—Part I: System Analysis,” IEEE Trans.Commun., Vol. COM-25, No. 8, 1977, pp. 795–799.
[36] Yao, K., “Error Probability of Asynchronous Spread Spectrum Multiple-AccessCommunication Systems,” IEEE Trans. Commun., Vol. COM-25, No. 8, 1977,pp. 803–809.
[37] Borth, D. E., and M. B. Pursley, “Analysis of Direct-SequenceSpread-Spectrum Multiple-Access Communication Over Rician FadingChannels,” IEEE Trans. Commun., Vol. COM-27, No. 10, 1979, pp. 1566–1577.
[38] Geraniotis, E. A., and M. B. Pursley, “Error Probability for Direct-SequenceSpread-SpectrumMultiple-AccessCommunications—PartII: Approximations,”IEEETrans.Commun., Vol. COM-30, No. 5, 1982, pp. 985–995.
[39] Pursley, M. B., D. V. Sarwate, and W. E. Stark, “Error Probability for DirectSequence Spread-Spectrum Multiple-Access Communications—Part I: Upperand Lower Bounds,” IEEE Trans. Commun., Vol. COM-30, No. 5, 1982,pp. 975–984.
[40] Pursley, M. B., “Frequency-Hop Transmission for Satellite Packet Switchingand Terrestrial Packet Radio Networks,” IEEE Trans. Inform. Theory, Vol. IT-32,1986, pp. 652–667.
Spread-Slotted Aloha for LEO Satellite Systems 155

[41] Pursley, M. B., and D. Taipale, “Error Probabilities for Spread-SpectrumPacket Radio With Convolutional Codes and Viterbi Decoding,” IEEE Trans.Commun., Vol. COM-35, No. 1, 1987, pp. 1–12.
[42] Lehnert, J. S., and M. B. Pursley, “Error Probabilities for BinaryDirect-Sequence Spread-Spectrum Communications With Random SignatureSequences,” IEEE Trans. Commun., Vol. COM-35, No. 1, 1987, pp. 87–98.
[43] Abdelmonem, A. H., and T. N. Saadawi, “Performance Analysis of SpreadSpectrum Packet Radio Network With Channel Load Sensing,” IEEE J. Select.Areas Commun., Vol. 7, No. 1, 1989, pp. 161–166.
[44] Storey, J. S., and F. A. Tobagi, “Throughput Performance of an UnslottedDirect Sequence SSMA Packet Radio Network,” IEEE Trans. Commun., Vol. 37,No. 8, 1989, pp. 814–823.
[45] Morrow, R. K., and J. S. Lehnert, “Bit-to-Bit Error Dependence in SlottedDS/SSMA Packet Systems With Random Signature Sequences,” IEEE Trans.Commun., Vol. 37, No. 10, 1989, pp. 1052–1061.
[46] Yin, M., and V. O. K. Li, “Unslotted CDMA With Fixed Packet Lengths,”IEEE J. Select. Areas Commun., Vol. 8, No. 4, 1990, pp. 529–541.
[47] Sousa, E. S., and J. A. Silvester, “Optimum Transmission Ranges in aDirect-Sequence Spread-Spectrum Multihop Packet Radio Network,”IEEE J. Select. Areas Commun., Vol. 8, No. 5, 1990, pp. 762–771.
[48] Madhow, U., and M. B. Pursley, “Mathematical Modeling and PerformanceAnalysis for a Two-Stage Acquisition Scheme for Direct-SequenceSpread-Spectrum CDMA,” IEEE Trans. Commun., Vol. 43, No. 9, 1995,pp. 2511–2520.
[49] Shinji, M., Mobile Communications, Japan: Maruzen 1989.
[50] Proakis, J., Digital Communications,2nd ed., New York: McGraw-Hill, 1989.
Selected bibliography“Code Division Multiple Access Networks III,” special issue IEEE J. Select. AreasCommun., Vol. 14, No. 8, October 1996.
“Code Division Multiple Access Networks IV,” special issue IEEE J. Select. AreasCommun., Vol. 14, No. 9, December 1996.
Glisic, S., and B. Vucetic, Spread Spectrum CDMA Systems for Wireless Communications,Norwood, MA: Artech House, 1997.
Prasad, R., CDMA for Wireless Personal Communications, Norwood, MA: ArtechHouse, 1996.
156 Low Earth Orbital Satellites for Personal Communication Networks

Low Earth Orbital Satellites for Personal Communication Networks
5Modified Power Control in
Spread-Slotted Aloha
T explained the problem of nonuniformityin geographical distribution of the traffic load in LEO satellitecommunications systems, its effect on signal quality at the satellites
with the measures of the SIR, and the throughput characteristics of thesystem. It was concluded that traffic nonuniformity considerably affectsthe performance of the system and thus analysis and evaluation based onthe assumption of uniform traffic distribution are not always valid. It alsowas shown that the performance for each user of a satellite communica-tions system varies according to the user’s location. In addition, it wasrevealed that in LEO satellite systems the interference received from theusers in service areas of adjacent satellites is one of the main factors thatlimits system performance.
157
One method to decrease the level of interference is to divide thefootprints of the satellites into smaller cells, which can be done by the useof spot-beam antennas on satellites. If we consider sharp spots within thefootprints, it is possible to limit the interference into each spot area (cell).That would be one of the most serious issues in future big-LEO satellitesystems. This issue was explained briefly in Section 2.1 and will bediscussed more in Chapter 7. This chapter considers a single-beamsatellite system and describes a method to decrease the level of interfer-ence. Although the method discussed here is for a single-beam satellitesystem, it can be considered in a multispot beam system as well.
This chapter, by referring to the LEO satellite system model and thetraffic distribution assumptions established in preceding chapters, pro-poses a new method for remedying the effects of traffic nonuniformityand uses numerical examples to evaluate its performance. The methodcontains some modifications of the conventional power control schemeused in spread-spectrum systems; hence, we call it the modified powercontrol scheme.
The goal of the modified power control scheme is to improve themaximum achievable value of the throughput performance of the systemand to make the characteristics of the system as close as possible to theuniform traffic situation. In this scheme, the required uplink powers ofthe users to their connecting satellites, which are requested by thesatellites, are changed. This method has some similarities to the trafficassignment control method proposed in Section 3.1. That section con-cluded that any improvement in the signal quality at a satellite with heavyoffered traffic load (i.e., the DTS) requires large degradation in the signalquality at its neighboring satellites. This chapter shows that the newscheme can improve the throughput characteristics of the DTS whilemaintaining the level of the throughput of the neighbor satellites, becauseof the nature of receiving a packet successfully even in relatively lowvalues of signal-to-interference ratio.
Section 5.1 discusses the effect of interference from users located inthe service area of adjacent satellites and evaluates the worst case inthroughput performance of the LEO satellite systems. Section 5.2 re-views the principles of the conventional power control in spread-spec-trum systems and then introduces the concepts of the modified power
158 Low Earth Orbital Satellites for Personal Communication Networks
control scheme and illustrates its features by numerical examples. (Formore details on the power control issue, see Section 7.2.) Section 5.2finishes with some practical notes on the realization of the proposedscheme.
5.1 Worst case in throughput performanceAccording to the analysis in Chapter 3 of the SIR performance of the LEOsatellite systems, the worst case in the performance of the system occurswhen a major portion of users are accessing a single satellite simultane-ously. From the viewpoint of the nonuniform traffic model establishedin Chapter 3, that situation occurs when the peak of the traffic load islocated under just one of the satellites, because the signal qualities (i.e.,the SIR levels) at succeeding satellites have large differences. Chapter 4briefly assumed that situation as the worst case in performance of thesystem, analyzed the throughput characteristics, and showed numericalexamples. Although from the point of view of the signal-to-noise ratio,that situation is the worst case and although there is a close relationbetween the throughput and SIR characteristics, it is necessary to confirmthat for the throughput the situation is also the worst case.
Another conclusion in Chapters 3 and 4 was on the effects of inter-ferences located outside the service area of a given satellite. It was shownthat because all satellites use the same carrier frequency on their uplinks,the interference at any given satellite is the sum of all signal powers thatcan be reached at that satellite (i.e., the signals of the users in the line ofsight of that satellite), regardless of whether the originator of a signal is auser inside or outside the service area of the satellite. Especially in thecase where the number of interferers outside the service area of a givensatellite is very large, the total interference makes the performance ofthat satellite much lower than its designed level.
Before introducing the first method for improving the throughputcharacteristics of our LEO satellite system, this chapter reconfirms theabove two conclusions by numerical examples based on the mathematicsgiven in the previous chapter. We first compare the throughput perform-ance in two cases where the interference from outside the service area ofthe satellites is either considered or ignored. After that, we examine the
Modified Power Control in Spread-Slotted Aloha 159
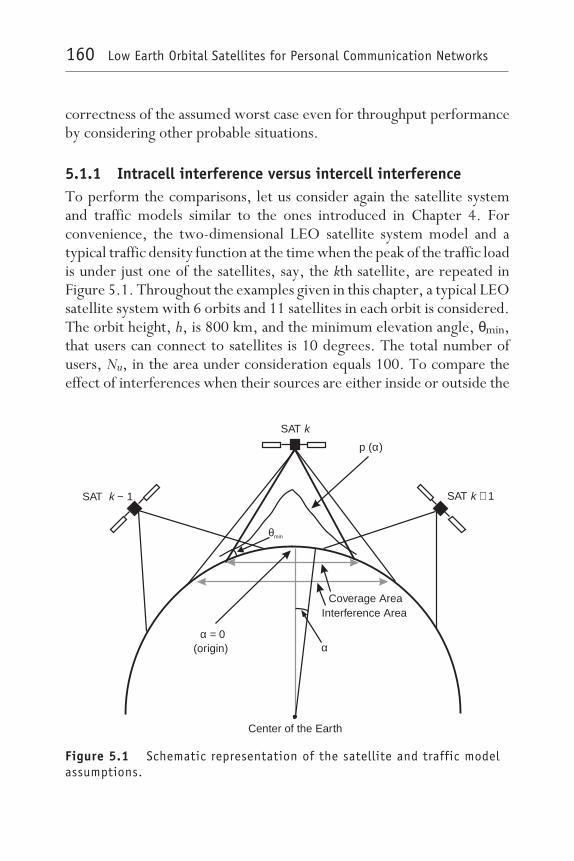
correctness of the assumed worst case even for throughput performanceby considering other probable situations.
5.1.1 Intracell interference versus intercell interferenceTo perform the comparisons, let us consider again the satellite systemand traffic models similar to the ones introduced in Chapter 4. Forconvenience, the two-dimensional LEO satellite system model and atypical traffic density function at the time when the peak of the traffic loadis under just one of the satellites, say, the kth satellite, are repeated inFigure 5.1. Throughout the examples given in this chapter, a typical LEOsatellite system with 6 orbits and 11 satellites in each orbit is considered.The orbit height, h, is 800 km, and the minimum elevation angle, θmin,that users can connect to satellites is 10 degrees. The total number ofusers, Nu, in the area under consideration equals 100. To compare theeffect of interferences when their sources are either inside or outside the
SAT k
SAT 1k − SAT 1k +
Coverage AreaInterference Area
αα = 0
(origin)
Center of the Earth
p ( )α
θmin
Figure 5.1 Schematic representation of the satellite and traffic modelassumptions.
160 Low Earth Orbital Satellites for Personal Communication Networks
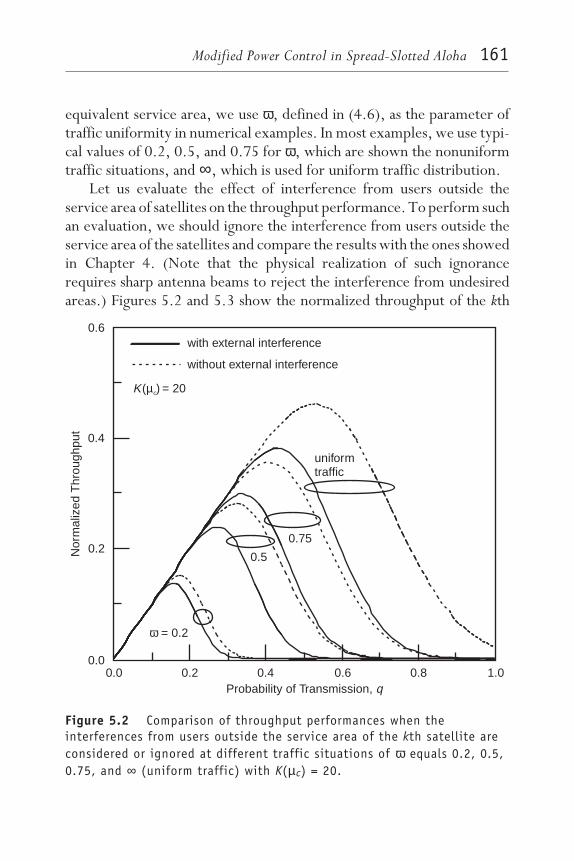
equivalent service area, we use ω, defined in (4.6), as the parameter oftraffic uniformity in numerical examples. In most examples, we use typi-cal values of 0.2, 0.5, and 0.75 for ω, which are shown the nonuniformtraffic situations, and ∞, which is used for uniform traffic distribution.
Let us evaluate the effect of interference from users outside theservice area of satellites on the throughput performance. To perform suchan evaluation, we should ignore the interference from users outside theservice area of the satellites and compare the results with the ones showedin Chapter 4. (Note that the physical realization of such ignorancerequires sharp antenna beams to reject the interference from undesiredareas.) Figures 5.2 and 5.3 show the normalized throughput of the kth
Nor
mal
ized
Thr
ough
put
0.6
0.4
0.2
0.0
K( ) = 20µc
with external interference
without external interference
uniformtraffic
0.75
0.5
ω = 0.2
0.0 0.2 0.4 0.6 0.8 1.0Probability of Transmission, q
Figure 5.2 Comparison of throughput performances when theinterferences from users outside the service area of the kth satellite areconsidered or ignored at different traffic situations of ω equals 0.2, 0.5,0.75, and ∞ (uniform traffic) with K(µc) = 20.
Modified Power Control in Spread-Slotted Aloha 161

satellite, that is, the satellite over the peak of the traffic load, as a functionof composite transmission probability, q; with ω as a parameter, formultiple-access capability; and K(µc) for each satellite equals 20 and 30,respectively. In the figures, the throughput characteristics are comparedfor the case in which interference from users outside the equivalentservice area is considered to the one in which the interference is ignored.
Let us first discuss the throughput performance of the consideredsatellite in a very high nonuniform traffic distribution, such as ω = 0.2.In that situation, on average about 90% of the users are in the service areaof the kth satellite; hence, the satellite is faced with a high level of
Nor
mal
ized
Thr
ough
put
0.8
0.6
0.4
0.2
0.0
with external interference
without external interference
K( ) = 30µc
0.0 0.2 0.4 0.6 0.8 1.0Probability of Transmission, q
uniformtraffic
0.75
0.5
ω = 0.2
Figure 5.3 Comparison of throughput performances when theinterferences from users outside the service area of the kth satellite areconsidered or ignored at different traffic situations of ω equals 0.2, 0.5,0.75, and ∞ (uniform traffic) with K(µc) = 30.
162 Low Earth Orbital Satellites for Personal Communication Networks

multiple-access interference from the users inside its service area. Evenin the situation in which the number of users in the line of sight of the kthsatellite but outside its service area is very low, there is considerabledifference between the throughput performances when there is and whenthere is not interference from users outside the service area. For simplic-ity in discussion, let us adopt the names intracell interference and intercellinterference from terrestrial cellular systems to call the interference fromusers inside the service area of a given satellite and the interferencefrom users outside the service area of that satellite, respectively. Usingthose labels, we can say that in high traffic nonuniformity distribution thedominant factor that determines the performance of the satellite with hightraffic loads is its intracell interference; however, the effect of intercellinterference on the maximum value of throughput also is not negligible.
As the level of nonuniformity in the distribution of users decreases,the effects of intercell interference become larger and larger. At theultimate, when the traffic distribution is uniform, there is a large-enoughdifference between the throughput performances in the two consideredsituations. Therefore, we can say that the effect of interferences fromsurrounding service areas, that is, the intercell interference, on thethroughput performance degradation increases as the traffic distributionof users becomes more uniform. In uniform traffic distribution, thenumber of users outside the service area reaches its maximum value, and,hence, the largest difference in throughput performances occurs. Thatmeans the interferences from users with large distances to their connect-ing satellites have a large effect on the throughput performance in LEOsatellite systems.
The other conclusion drawn from Figures 5.2 and 5.3 is the lowthroughput in the service area of the considered satellite in the nonuni-form traffic situation due to the high level of multiple-access interference.In that situation, most of the time, large numbers of packets are trans-mitted to a single satellite, and the probabilities of packet success decreasesignificantly. That result is the same as the one shown in Chapter 4 whenthe total throughput of the three satellites is considered. In fact, innonuniform traffic distributions, the dominant factor that determines thetotal throughout is the throughput of the satellite that services the largernumber of users, that is, the kth satellite in the examples given here. Weshow in Chapter 6 that the traffic nonuniformity not only degrades the
Modified Power Control in Spread-Slotted Aloha 163
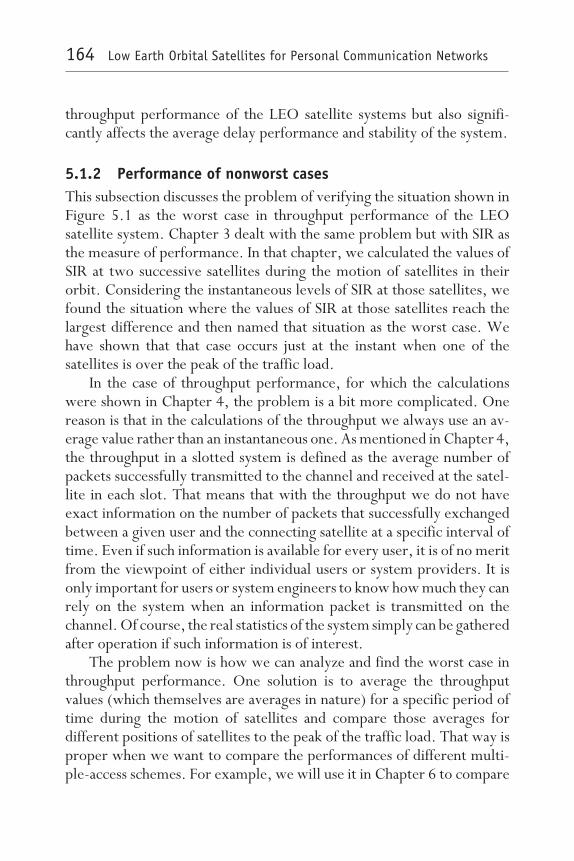
throughput performance of the LEO satellite systems but also signifi-cantly affects the average delay performance and stability of the system.
5.1.2 Performance of nonworst casesThis subsection discusses the problem of verifying the situation shown inFigure 5.1 as the worst case in throughput performance of the LEOsatellite system. Chapter 3 dealt with the same problem but with SIR asthe measure of performance. In that chapter, we calculated the values ofSIR at two successive satellites during the motion of satellites in theirorbit. Considering the instantaneous levels of SIR at those satellites, wefound the situation where the values of SIR at those satellites reach thelargest difference and then named that situation as the worst case. Wehave shown that that case occurs just at the instant when one of thesatellites is over the peak of the traffic load.
In the case of throughput performance, for which the calculationswere shown in Chapter 4, the problem is a bit more complicated. Onereason is that in the calculations of the throughput we always use an av-erage value rather than an instantaneous one. As mentioned in Chapter 4,the throughput in a slotted system is defined as the average number ofpackets successfully transmitted to the channel and received at the satel-lite in each slot. That means that with the throughput we do not haveexact information on the number of packets that successfully exchangedbetween a given user and the connecting satellite at a specific interval oftime. Even if such information is available for every user, it is of no meritfrom the viewpoint of either individual users or system providers. It isonly important for users or system engineers to know how much they canrely on the system when an information packet is transmitted on thechannel. Of course, the real statistics of the system simply can be gatheredafter operation if such information is of interest.
The problem now is how we can analyze and find the worst case inthroughput performance. One solution is to average the throughputvalues (which themselves are averages in nature) for a specific period oftime during the motion of satellites and compare those averages fordifferent positions of satellites to the peak of the traffic load. That way isproper when we want to compare the performances of different multi-ple-access schemes. For example, we will use it in Chapter 6 to compare
164 Low Earth Orbital Satellites for Personal Communication Networks
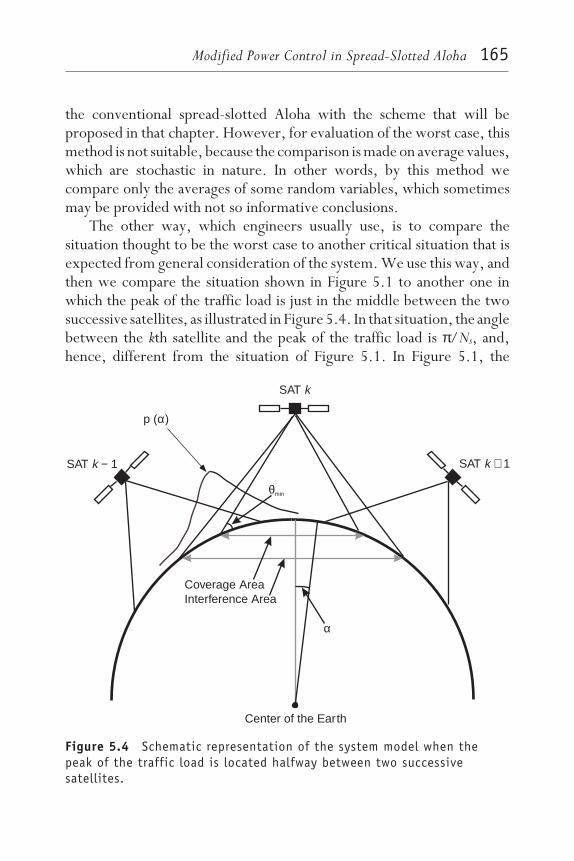
the conventional spread-slotted Aloha with the scheme that will beproposed in that chapter. However, for evaluation of the worst case, thismethod is not suitable, because the comparison is made on average values,which are stochastic in nature. In other words, by this method wecompare only the averages of some random variables, which sometimesmay be provided with not so informative conclusions.
The other way, which engineers usually use, is to compare thesituation thought to be the worst case to another critical situation that isexpected from general consideration of the system. We use this way, andthen we compare the situation shown in Figure 5.1 to another one inwhich the peak of the traffic load is just in the middle between the twosuccessive satellites, as illustrated in Figure 5.4. In that situation, the anglebetween the kth satellite and the peak of the traffic load is π/Ns, and,hence, different from the situation of Figure 5.1. In Figure 5.1, the
SAT k
SAT 1k − SAT 1k +
Coverage AreaInterference Area
α
Center of the Earth
p ( )α
θmin
Figure 5.4 Schematic representation of the system model when thepeak of the traffic load is located halfway between two successivesatellites.
Modified Power Control in Spread-Slotted Aloha 165

nonuniform traffic distribution of the major portion of users is in theservice area of the kth satellite; most users are located in the service areasof two satellites, the kth and the (k –1)st ones. The reason for consideringthis situation for comparison is that any other situation can fall betweenthe two marginal situations in Figure 5.1 and Figure 5.4. It is also worthconsidering the alternate situation because it happens as often as theFigure 5.1 case.
In the situation shown in Figure 5.1, the major portion of the usersshould be serviced by a single satellite; hence, the probability of packetsuccess for the packets transmitted in the service area of that satellite isvery low. Moreover, the interference caused by those packets to theneighbor satellites makes their performance worse than their designedvalues. On the other hand, the situation shown in Figure 5.4 is anotherextreme case, in which the peak of the traffic load is located in theintersection area of the service areas of two neighbor satellites. In thelatter situation, the major portion of users can be serviced by twosatellites. The comparison of the normalized total throughput, that is, thenormalized value of summation of the throughputs of the three satellites,is shown in Figure 5.5. The graph of the situation in Figure 5.1, alreadyreferred to as the worst case, is the same as the graph of ω = 0.5 shownin Figure 4.10.
Comparing the two graphs in Figure 5.5, we can see two majordifferences. First, as may be expected, the peak of the throughput curvefor the worst case is lower than that of the other case. In the latter case,the major portion of the users is serviced by two satellites and not onlyby a single satellite of the worst case. Second, at high offered traffic loads,the curve for the situation in Figure 5.4 has a positive slope. To under-stand the reason for the latter difference, remember that the totalthroughput is the sum of the throughputs of succeeding satellites, not justone satellite. Therefore, compared to the worst case, less interferencereaches the neighbor satellites, say, the (k − 2)nd and the (k + 1)st ones,because the distances between those satellites and the most probabletraffic point in the case of Figure 5.4 become longer than those of theworst case. That makes the neighbor satellites have good performanceseven at high offered traffic loads. The maximum value of the throughput,which usually is referred to as the capacity of the system, is an importantfigure of merit in any packet communications systems. Hence, we con-
166 Low Earth Orbital Satellites for Personal Communication Networks
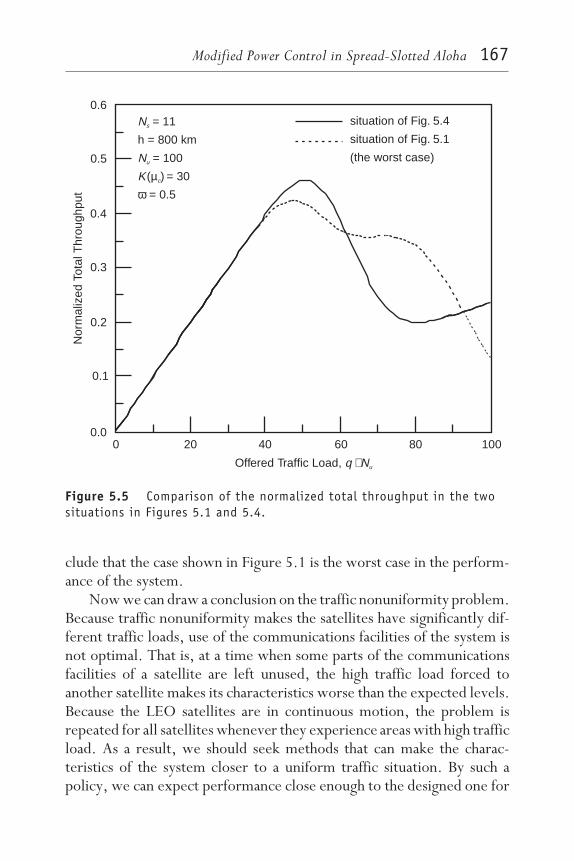
clude that the case shown in Figure 5.1 is the worst case in the perform-ance of the system.
Now we can draw a conclusion on the traffic nonuniformity problem.Because traffic nonuniformity makes the satellites have significantly dif-ferent traffic loads, use of the communications facilities of the system isnot optimal. That is, at a time when some parts of the communicationsfacilities of a satellite are left unused, the high traffic load forced toanother satellite makes its characteristics worse than the expected levels.Because the LEO satellites are in continuous motion, the problem isrepeated for all satellites whenever they experience areas with high trafficload. As a result, we should seek methods that can make the charac-teristics of the system closer to a uniform traffic situation. By such apolicy, we can expect performance close enough to the designed one for
Nor
mal
ized
Tota
l Thr
ough
put
0.6
0.5
0.4
0.3
0.2
0.1
0.0
N
N
K
s
u
c
= 11
h = 800 km
= 100
( ) = 30
= 0.5
µω
situation of Fig. 5.4
situation of Fig. 5.1
(the worst case)
0 20 40 60 80 100
Offered Traffic Load, q Nu⋅
Figure 5.5 Comparison of the normalized total throughput in the twosituations in Figures 5.1 and 5.4.
Modified Power Control in Spread-Slotted Aloha 167
each satellite. In the Section 5.2, such methods applicable in spread-slot-ted Aloha systems are proposed. Since for a system engineer the impor-tant problem is to improve the performance of the system at its worstcase, the discussion focuses on the worst case of Figure 5.1.
5.2 Modified power control schemeBefore we discuss the modified power control scheme, let us first review theconventional power control scheme employed in many multiuser systems,especially in spread-spectrum systems. Of interest are the direct-se-quence spread-spectrum systems, in which the transmitter of a desiredsignal may be located at a greater distance from the receiver and otherinterfering transmitters situated relatively closer to it. In that situation,the interfering signals could swamp the desired signal if all the transmit-ters are radiating with equal power. In that case, the signal-to-interfer-ence ratio at the receiver is severely degraded, and an increase in the errorprobability is observed. That phenomenon is known as the near-farproblem. Under certain circumstances, the near-far problem could be-come so severe that direct-sequence signaling cannot be used [1]. Toachieve an acceptable performance, it is arranged through implementa-tion of power control that all the signals arrive at the receiver with thesame average power [2,3]. With all the signals arriving at the receiverwith the same average power level, the near-far problem in direct-se-quence systems can be eliminated.
The above scenario is the conventional power control scheme, whichis realized in different ways, for example, in open loop or closed loop, inspread-spectrum systems [4–14]. In an open-loop scheme, each userestimates either the total received power from the connecting base station(in our case, the satellite) or the power of a pilot signal sent by that basestation. (By monitoring the total received power, rather than using ademodulated signal such as a pilot, measurement can be made rapidlywithout knowledge of timing, base station identification, or path condi-tions.) On the basis of on that measure and on a correction supplied bythe base station, the users’ transmitted powers are adjusted to match theestimated path loss, so as to arrive at the base station at a predetermined
168 Low Earth Orbital Satellites for Personal Communication Networks

level. All users use the same process and attempt to arrive with equalpower at the base stations.
In a closed-loop scheme, when uncorrelated differences in the for-ward and reverse channels cannot be estimated by the users, each usercorrects the transmit power with information supplied by the base stationon forward links. The base station derives the correction information bymonitoring the reverse channel of each user, compares the measurementto a threshold, and requests either an increase or a decrease, dependingon the result.
Although there are several parameters, such as channel imperfectionsand propagation delay, in selection between the two ways of powercontrol, for simplicity in discussion, we assume a perfect open-looppower control in our LEO satellite system and compare the performanceof the system utilizing the conventional scheme to the one proposed inSubsection 5.2.1. (The reader is referred to the detailed discussion ofpower control and system imperfections in a real LEO satellite systemgiven in Chapter 7.)
5.2.1 Purpose and structure of the schemeIn Chapters 3 and 4 and in the preceding section, it was assumed that alltransmitted signals from the users are controlled so that they reach theirdesignated satellites at the same level, referred to as perfect powercontrol. The power control is an important necessity in spread-spectrumsystems to ensure higher capacity and to avoid the near-far problem,and imperfections in power control result in serious problems in thesystems [15–18].
For our LEO satellite system, it was moreover assumed that all signalsare received at the same power at all satellites, which means that
Sk − 1 = Sk = Sk + 1 = S (5.1)
In addition, it was assumed that each user selects the satellite thatrequires the lowest transmitting power. Those assumptions realize theequal-size service areas for all the satellites. With the assumption of
Modified Power Control in Spread-Slotted Aloha 169
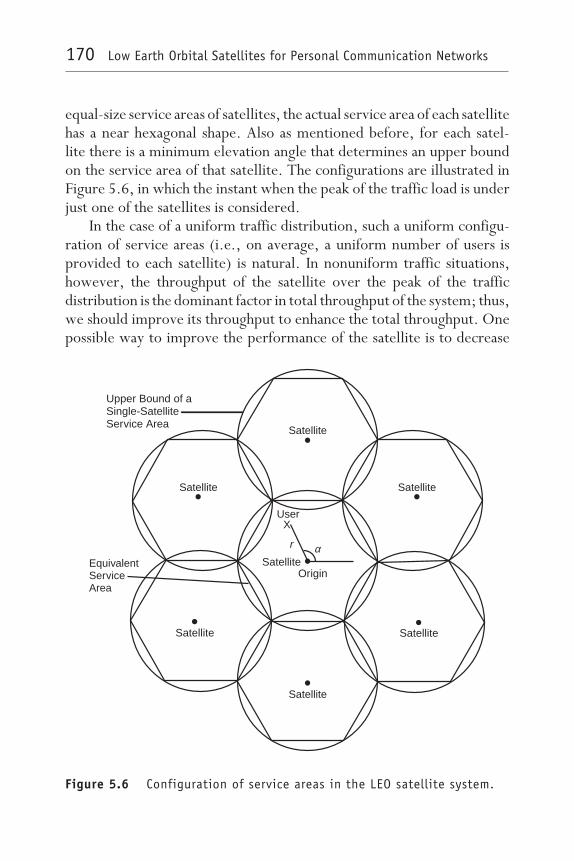
equal-size service areas of satellites, the actual service area of each satellitehas a near hexagonal shape. Also as mentioned before, for each satel-lite there is a minimum elevation angle that determines an upper boundon the service area of that satellite. The configurations are illustrated inFigure 5.6, in which the instant when the peak of the traffic load is underjust one of the satellites is considered.
In the case of a uniform traffic distribution, such a uniform configu-ration of service areas (i.e., on average, a uniform number of users isprovided to each satellite) is natural. In nonuniform traffic situations,however, the throughput of the satellite over the peak of the trafficdistribution is the dominant factor in total throughput of the system; thus,we should improve its throughput to enhance the total throughput. Onepossible way to improve the performance of the satellite is to decrease
X
r
EquivalentServiceArea
Upper Bound of aSingle-SatelliteService Area
Origin
Satellite
Satellite Satellite
Satellite
Satellite
Satellite
Satelliteα
User
Figure 5.6 Configuration of service areas in the LEO satellite system.
170 Low Earth Orbital Satellites for Personal Communication Networks

the number of users connecting to it, for example, by decreasing the sizeof its service area. In a satellite system with overlapping areas betweenthe coverage areas of the adjacent satellites, that decrease can be made byincreasing the service areas of the adjacent satellites, without any unde-sired discontinuity in communications. That means the size of the serviceareas of the satellites should be adapted according to their traffic loads,at most to the point that the continuity in communication service can bepreserved. This is the basic idea of the modified power control scheme,which proposes to make the numbers of the connected users to eachsatellite closer to the ones of uniform traffic case [19–21]. The methodhas some similarities with the traffic assignment control method proposedin Section 3.1, here with the measure of the throughput instead of thesignal-to-interference ratio.
In the conventional power control scheme, the assumption of con-necting users to the satellite that requires the lowest radiated power, withthe condition given in (5.1) requires equal-size service areas for allsatellites. One approach to realize the idea of the modified power control,that is, changing the size of the service area, is to adapt the condition in(5.1). Note that we still have the assumption of connecting every user tothe satellite that requires the lowest transmitting power.
Let us again consider the worst case, where the peak of the traffic loadlies under the kth satellite. In that situation, the traffic load of the kthsatellite is much higher than those of its adjacent satellites, the (k + 1)stand the (k − 1)st satellites. Therefore, we adapt the condition in (5.1) to
γSk − 1 = Sk = γSk + 1 (5.2)
where γ is the ratio of the required receiving powers of the kth satelliteto those of its adjacent satellites. In a conventional power control scheme,γ is equal to one; however, in the proposed modified power controlscheme, γ has a value larger than or equal to one. If we consider two users,one in the service area of the kth satellite and the other in the service areaof the (k + 1)st satellite, with equal distances from their connectingsatellites, the condition given in (5.2) dictates that the user in the servicearea of the kth satellite must radiate power higher than the user in theservice area of the (k + 1)st satellite by the factor γ. According to the
Modified Power Control in Spread-Slotted Aloha 171

value of γ, some users in the overlapping coverage area of two adjacentsatellites also find lower required transmitting power to the neighborsatellites; even their distances to the kth satellite are shorter. Withlarge-enough values of γ, it is possible to transfer the total traffic of theoverlapping areas to the neighbor satellites and decrease the size of theservice area of the kth satellite to the area that can be covered by the kthsatellite only. Because the increase in service area of a satellite is limitedat most to its upper bound, we should limit the ratio γ to the value wherethe service areas of the (k − 1)st and the (k + 1)st satellites are the sameas their coverage areas.
There are different ways to realize the condition given in (5.2). Oneway is to keep the required receiving powers at the (k + 1)st and the(k − 1)st satellites fixed and increase the power Sk by the factor γ. Anotherway is to keep the Sk constant and decrease the powers Sk − 1 and Sk + 1 byγ. Finally, we can consider an intermediate way: decreasing Sk−1 and Sk + 1
and increasing Sk so that (5.2) is achieved. Although from the viewpointof the analysis all three ways result in the same performance, considera-tion of practical factors, such as limited transmitting power of thehand-held terminals and limited power variations, makes one way moreattractive. For example, from the viewpoint of the limitation in the powersupply of the terminals, keeping Sk constant and decreasing Sk − 1 and Sk+1
would be the best. Figure 5.7 illustrates that situation. In the figure, theradiated powers of the users after application of the modified powercontrol scheme are compared with the ones in a conventional powercontrol scheme. As illustrated in Figure 5.7, after employment of themodified power control, the service areas of the (k − 1)st and (k + 1)stsatellites are expanded and that of the kth satellite is decreased. Theradiated power of the users newly included in the increased service areasof the (k − 1)st and (k + 1)st satellites also are decreased. That means thetotal level of the interference at the kth satellite decreases.
5.2.2 Numerical examples
This subsection uses numerical examples to evaluate the performance ofthe modified power control. The mathematics given in Chapter 4 are usedin the calculation involved in these examples with different requiredreceiving powers in (5.2). Also in these examples, a LEO satellite system
172 Low Earth Orbital Satellites for Personal Communication Networks
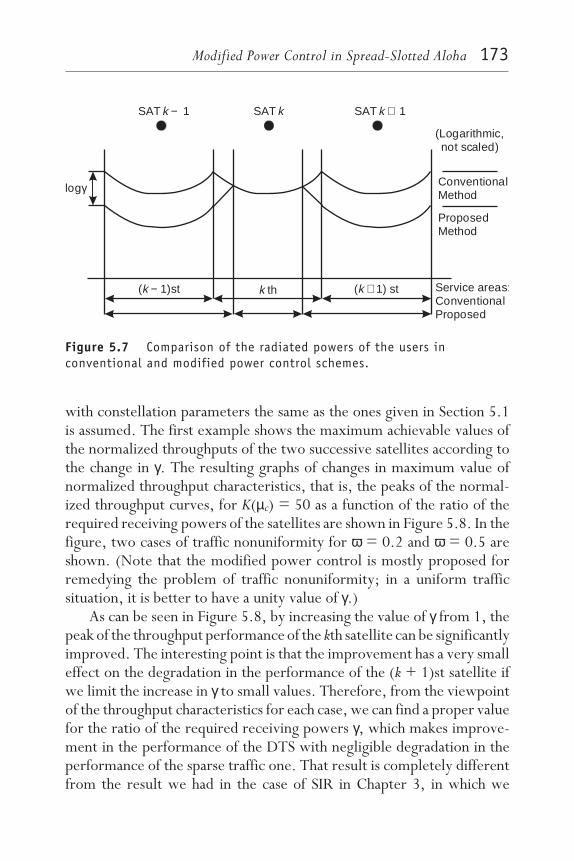
with constellation parameters the same as the ones given in Section 5.1is assumed. The first example shows the maximum achievable values ofthe normalized throughputs of the two successive satellites according tothe change in γ. The resulting graphs of changes in maximum value ofnormalized throughput characteristics, that is, the peaks of the normal-ized throughput curves, for K(µc) = 50 as a function of the ratio of therequired receiving powers of the satellites are shown in Figure 5.8. In thefigure, two cases of traffic nonuniformity for ω = 0.2 and ω = 0.5 areshown. (Note that the modified power control is mostly proposed forremedying the problem of traffic nonuniformity; in a uniform trafficsituation, it is better to have a unity value of γ.)
As can be seen in Figure 5.8, by increasing the value of γ from 1, thepeak of the throughput performance of the kth satellite can be significantlyimproved. The interesting point is that the improvement has a very smalleffect on the degradation in the performance of the (k + 1)st satellite ifwe limit the increase in γ to small values. Therefore, from the viewpointof the throughput characteristics for each case, we can find a proper valuefor the ratio of the required receiving powers γ, which makes improve-ment in the performance of the DTS with negligible degradation in theperformance of the sparse traffic one. That result is completely differentfrom the result we had in the case of SIR in Chapter 3, in which we
SAT 1k − SATk SAT 1k +
logγ ConventionalMethod
ProposedMethod
Service areas:ConventionalProposed
k th ( 1) stk +( 1)stk −
(Logarithmic,not scaled)
Figure 5.7 Comparison of the radiated powers of the users inconventional and modified power control schemes.
Modified Power Control in Spread-Slotted Aloha 173
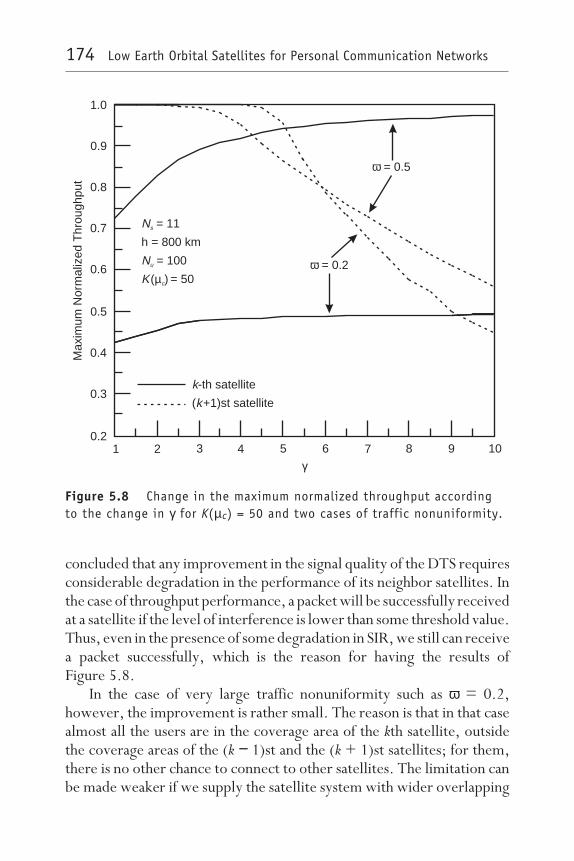
concluded that any improvement in the signal quality of the DTS requiresconsiderable degradation in the performance of its neighbor satellites. Inthe case of throughput performance, a packet will be successfully receivedat a satellite if the level of interference is lower than some threshold value.Thus, even in the presence of some degradation in SIR, we still can receivea packet successfully, which is the reason for having the results ofFigure 5.8.
In the case of very large traffic nonuniformity such as ω = 0.2,however, the improvement is rather small. The reason is that in that casealmost all the users are in the coverage area of the kth satellite, outsidethe coverage areas of the (k − 1)st and the (k + 1)st satellites; for them,there is no other chance to connect to other satellites. The limitation canbe made weaker if we supply the satellite system with wider overlapping
Max
imum
Nor
mal
ized
Thr
ough
put
1.0
0.8
0.9
0.7
0.5
0.3
0.6
0.4
0.2
N
N
K
s
u
c
= 11
h = 800 km
= 100
( ) = 50µω = 0.2
ω = 0.5
k
k
-th satellite
( +1)st satellite
γ1 2 3 4 5 6 7 8 9 10
Figure 5.8 Change in the maximum normalized throughput accordingto the change in γ for K(µc) = 50 and two cases of traffic nonuniformity.
174 Low Earth Orbital Satellites for Personal Communication Networks

coverage areas, for example, by having a larger number of the satellitesin each orbit or by increasing the altitude of satellites’ orbits, which ineither case increases the total cost of the system.
Let us now focus on the case of ω = 0.5 and evaluate the performanceof the modified power control with a different multiple-access capabilityof the communications system. Figure 5.9 shows the changes in maxi-mum normalized throughput as a function of the ratio of the requiredreceiving powers for ω = 0.5 and two cases of K(µc) = 30 and K(µc) = 50.As shown in the figure, with small multiple-access capability such asK(µc) = 30, as opposed to the case of K(µc) = 50, any improvement in theperformance of the satellite with heavy traffic load results in degradationin the performance of its neighbor satellites. We cannot find any value
N
N
s
u
= 11
h = 800 km
= 100
= 0.5ω
K( ) = 50µc
K( ) = 30µc
k
k
-th satellite
( +1)st satellite
Max
imum
Nor
mal
ized
Thr
ough
put
1.0
0.8
0.6
0.4
0.2
γ1 2 3 4 5 6 7 8 9 10
Figure 5.9 Change in the maximum normalized throughput accordingto the change in γ for ω = 0.5 and different levels of the multiple-access capability, K(µc) = 30 and 50.
Modified Power Control in Spread-Slotted Aloha 175
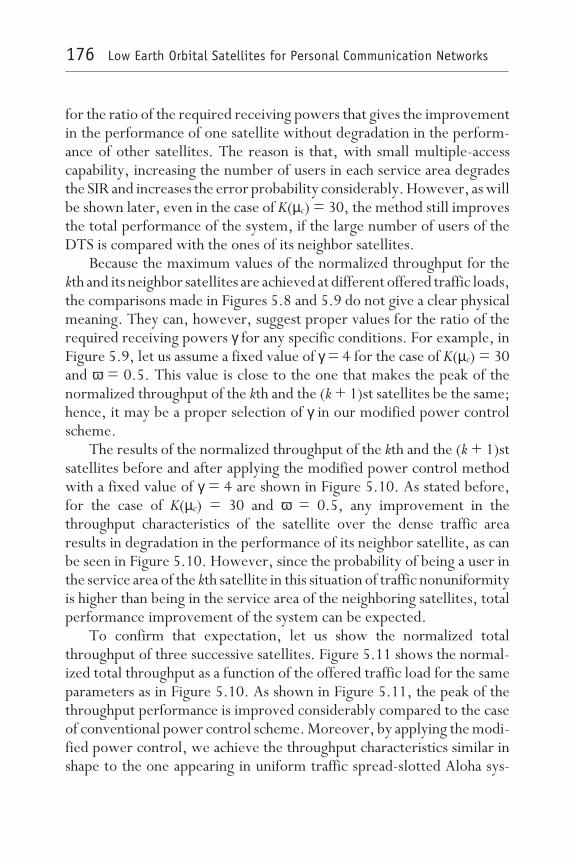
for the ratio of the required receiving powers that gives the improvementin the performance of one satellite without degradation in the perform-ance of other satellites. The reason is that, with small multiple-accesscapability, increasing the number of users in each service area degradesthe SIR and increases the error probability considerably. However, as willbe shown later, even in the case of K(µc) = 30, the method still improvesthe total performance of the system, if the large number of users of theDTS is compared with the ones of its neighbor satellites.
Because the maximum values of the normalized throughput for thekth and its neighbor satellites are achieved at different offered traffic loads,the comparisons made in Figures 5.8 and 5.9 do not give a clear physicalmeaning. They can, however, suggest proper values for the ratio of therequired receiving powers γ for any specific conditions. For example, inFigure 5.9, let us assume a fixed value of γ = 4 for the case of K(µc) = 30and ω = 0.5. This value is close to the one that makes the peak of thenormalized throughput of the kth and the (k + 1)st satellites be the same;hence, it may be a proper selection of γ in our modified power controlscheme.
The results of the normalized throughput of the kth and the (k + 1)stsatellites before and after applying the modified power control methodwith a fixed value of γ = 4 are shown in Figure 5.10. As stated before,for the case of K(µc) = 30 and ω = 0.5, any improvement in thethroughput characteristics of the satellite over the dense traffic arearesults in degradation in the performance of its neighbor satellite, as canbe seen in Figure 5.10. However, since the probability of being a user inthe service area of the kth satellite in this situation of traffic nonuniformityis higher than being in the service area of the neighboring satellites, totalperformance improvement of the system can be expected.
To confirm that expectation, let us show the normalized totalthroughput of three successive satellites. Figure 5.11 shows the normal-ized total throughput as a function of the offered traffic load for the sameparameters as in Figure 5.10. As shown in Figure 5.11, the peak of thethroughput performance is improved considerably compared to the caseof conventional power control scheme. Moreover, by applying the modi-fied power control, we achieve the throughput characteristics similar inshape to the one appearing in uniform traffic spread-slotted Aloha sys-
176 Low Earth Orbital Satellites for Personal Communication Networks
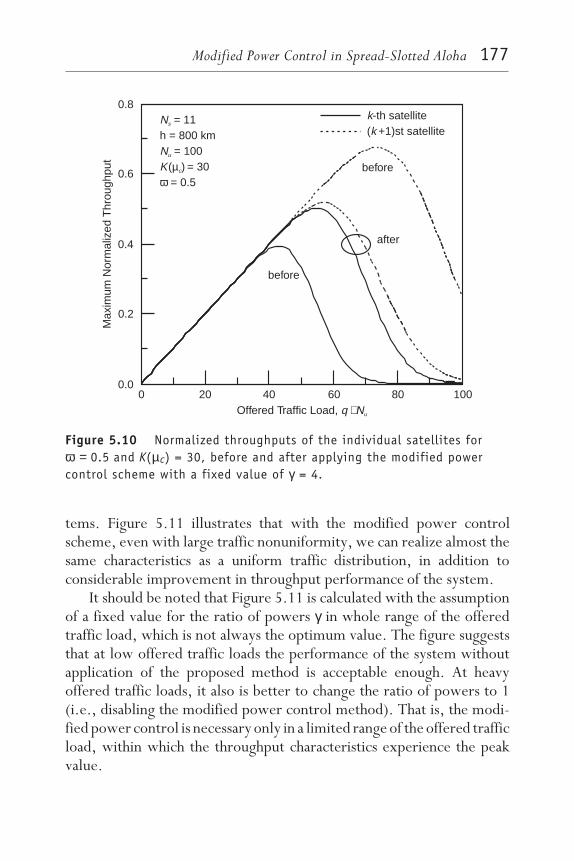
tems. Figure 5.11 illustrates that with the modified power controlscheme, even with large traffic nonuniformity, we can realize almost thesame characteristics as a uniform traffic distribution, in addition toconsiderable improvement in throughput performance of the system.
It should be noted that Figure 5.11 is calculated with the assumptionof a fixed value for the ratio of powers γ in whole range of the offeredtraffic load, which is not always the optimum value. The figure suggeststhat at low offered traffic loads the performance of the system withoutapplication of the proposed method is acceptable enough. At heavyoffered traffic loads, it also is better to change the ratio of powers to 1(i.e., disabling the modified power control method). That is, the modi-fied power control is necessary only in a limited range of the offered trafficload, within which the throughput characteristics experience the peakvalue.
N
NK
s
u
c
= 11h = 800 km
= 100( ) = 30= 0.5µ
ω
kk-th satellite
( +1)st satellite
before
before
after
Max
imum
Nor
mal
ized
Thr
ough
put
0.8
0.6
0.4
0.2
0.00 20 40 60 80 100
Offered Traffic Load, q Nu⋅
Figure 5.10 Normalized throughputs of the individual satellites forω = 0.5 and K(µc) = 30, before and after applying the modified powercontrol scheme with a fixed value of γ = 4.
Modified Power Control in Spread-Slotted Aloha 177

The performance of such a modified power control scheme withdifferent values of the ratio of powers γ is shown in Figure 5.12. Fromthe figure, we can conclude that, by selecting proper values for the ratioof powers dynamically according to the offered traffic load that gives thebest throughput performance for the system, we can expect to haveimprovement at the whole range of the traffic loads. It should be notedthat the method of changing the required receiving powers gives consid-erable improvement only when the traffic loads of two succeedingsatellites have a large-enough difference.
N
N
K
s
u
c
= 11
h = 800 km
= 100
( ) = 30
= 0.5
µω
with modified power control
conventional power control
0 20 40 60 80 100
Offered Traffic Load, q Nu⋅
Nor
mal
ized
Tota
l Thr
ough
put
0.6
0.4
0.2
0.0
Figure 5.11 Comparison of the normalized total throughputcharacteristics of the modified power control scheme and theconventional power control, for K(µc) = 30 and ω = 0.5, and with a fixedvalue of γ = 4.
178 Low Earth Orbital Satellites for Personal Communication Networks
5.2.3 Some practical notes on realization of the schemeThis subsection provides some practical considerations on realization ofthe modified power control scheme in LEO satellite systems. The firstpoint is the selection of the proper value of the ratio of the receivingpowers of the satellites, γ. That value can be calculated according to thestatistics of the packet transmissions to the satellite channels, for example,by individual satellites. In a LEO satellite network, to realize the modifiedpower control effectively, the satellites should have some communicationcontrol channels to each other, which can be provided by intersatellitelinks, proposed in some global LEO satellite systems. Each satellite can
N = 11s
h =80 0N =10 0u
= 30= 0. 5
K ( )µc
ω
0 20 40 60 80 100
Offered Traffic Load, q Nu⋅
Nor
mal
ized
Tota
l Thr
ough
put
0.6
0.4
0.5
0.3
0.1
0.2
0.0
γ = 4 γ = 1
Figure 5.12 Normalized total throughput characteristics by acombination of conventional and modified forms of power control, forK(µc) = 30 and ω = 0.5.
Modified Power Control in Spread-Slotted Aloha 179
inform other satellites of the statistics of its traffic load via the intersatel-lite links, then the calculation on γ can be performed either globally forall satellites in a central control station (in space or on the ground) orfor a group of satellites. After the calculation, the results on selection ofrelative values of γ are passed to all satellites, which then can manage thetransmitting powers of their users according to the selected value of γ .
Each satellite, according to the updated value of γ, changes thetransmitting power of, for example, its pilot signal and sends the controlsignal over the forward links to all users in its service area. This step iscompletely executed in the same manner as for the case of conventionalpower control scheme.
Another point in a realistic system is the range of the offered trafficload in which the system is operating or is designed to operate. Themodified power control scheme does not have good performance whenthe offered traffic load is very high. For that reason, we propose a systemin which the value of γ is reset to one to disable the modified powercontrol scheme at heavy offered traffic loads. Actually, in an Aloha or aspread Aloha system, the system is designed to operate at the offered trafficloads near the one that corresponds to the peak of the throughput curves.Operating the system above that point makes the stability of the system sen-sitive to the changes of the offered traffic load and, hence, lets the systemgo to unstable situations easily. Theoretically, therefore, there is no needfor trying to improve the performance of the system in those areas.
5.3 SummaryThis chapter discussed the performance of a LEO satellite communica-tions system in nonuniform traffic situations. By evaluating the perform-ance of one satellite when the effect of multiple-access interference isignored and comparing the results of that evaluation to the ones shownin Chapter 4, it was shown that the interference from the users in otherservice areas, referred to as intercell interference, is a dominant factor indegrading the performance of the system. It was also reconfirmed that innonuniform traffic LEO satellite systems the worst case of the signal-to-interference ratio is the same as the worst case when the throughputcharacteristics are considered.
180 Low Earth Orbital Satellites for Personal Communication Networks

According to the numerical examples, it was concluded that thecharacteristics of the communications system are affected by the presenceof traffic nonuniformity and are completely different from the resultswhen the uniform traffic model is considered. It was also concluded thatin the presence of the traffic nonuniformity an undesirable behavior ofcommunications system, the dependence of the quality of the service fora user to his location, occurs. To remedy those effects, a modified powercontrol scheme was proposed.
We started the proposal of the method with an overview of theconventional power control schemes used in a spread-spectrum systemand discussed different ways of realizing equal receiving powers at thereceivers. In the modified power control scheme, the service area of thesatellite over the area with heavy traffic load is reduced, and the serviceareas of its neighbor satellites are expanded. Those changes in the size ofthe service areas of the satellites are realized by changing the requiredtransmitting powers of the users in each service area, which are requestedby the satellites. By changing the power levels, the power of interferencealso is changed. The result of changing the number of connecting usersto each satellite and the total interference power reached at each satelliteis improvement of the peak of the total throughput performance of theLEO satellite system. It was also shown that to have better performanceover the whole range of the offered traffic loads, it is possible to changethe required transmitting powers dynamically. Compared to the resultsof the traffic-assignment control method, which was proposed inChapter 3, it was shown that this new method can improve the through-put performance of the LEO satellite system even though the signalqualities at the satellites are affected significantly.
The next chapter introduces other schemes for spread-slotted Alohathat can improve the throughput performance of any multiuser system inheavy traffic situations, including, but not limited to, the nonuniformtraffic scenario.
References[1] Pickholtz, R. L., D. L. Schilling, and L. B. Milstein, “Theory of
Spread-Spectrum Communications—A Tutorial,” IEEE Trans. Commun.,Vol. COM-30, No. 5, 1982, pp. 855–884.
Modified Power Control in Spread-Slotted Aloha 181
[2] Turin, G. L., “The Effects of Multipath and Fading in the Performance ofDirect-Sequence CDMA Systems,” IEEE J. Select. Areas Commun., Vol. SAC-2,No. 5, 1984, pp. 597–603.
[3] Kavehrad, M., and P. J. McLane, “Spread Spectrum for Indoor Digital Radio,”IEEE Commun. Mag., Vol. 25, No. 6, 1987, pp. 32–40.
[4] Simpson, F., and J. Holtzman, “CDMA Power Control, Interleaving, andCoding,” Proc. 41th IEEE Vehic. Technol. Conf., St. Louis, 1991, pp. 362–367.
[5] Gilhousen, K. S., et al., “Increased Capacity Using CDMA for Mobile SatelliteCommunication,” IEEE J. Select. Areas Commun., Vol. 8, No. 4, 1990,pp. 503–514,.
[6] Gilhousen, K. S., et al., “On the Capacity of a Cellular CDMA System,”IEEE Trans. Vehic. Technol., Vol. 40, No. 2, 1991, pp. 303–312.
[7] Chuang, J. C.-I., and N. R. Sollenberger, “Uplink Power Control for TDMAPortable Radio Channels,” IEEE Trans. Vehic. Technol., Vol. 43, No. 1, 1994,pp. 33–39.
[8] Hanly, S. V., “An Algorithm for Combined Cell-Site Selection and PowerControl To Maximize Cellular Spread Spectrum Capacity,” IEEE J. Select. AreasCommun., Vol. 13, No. 7, 1995, pp. 1332–1340.
[9] Wong, V., and C. Leung, “A Transmit Power Control Scheme for ImprovingPerformance in a Mobile Packet Radio System,” IEEE Trans. Vehic. Technol.,Vol. 43, No. 1, 1994, pp. 174–180.
[10] Lee, W. C. Y., “Overview of Cellular CDMA,” IEEE Trans. Vehic. Technol.,Vol. 40, No. 2, 1991, pp. 291–302.
[11] Pickholtz, R. L., L. B. Milstein, and D. L. Schilling, “Spread Spectrum forMobile Communications,” IEEE Trans. Vehic. Technol., Vol. 40, No. 2, 1991,pp. 313–322.
[12] Kchao, C., and G. L. Stuber, “Analysis of a Direct-Sequence Spread-SpectrumCellular Radio System,” IEEE Trans. Commun., Vol. 41, No. 10, 1993,pp. 1507–1516.
[13] Viterbi, A. M., and A. J. Viterbi, “Erlang Capacity of a Power ControlledCDMA System,” IEEE J. Select. Areas Commun., Vol. 11, No. 6, 1993,pp. 892–900.
[14] Sheikh, A., Y. Yao, and S. Cheng, “Throughput Enhancement ofDirect-Sequence Spread-Spectrum Packet Radio Networks by Adaptive PowerControl,” IEEE Trans. Commun., Vol. 42, No. 2/3/4, 1994, pp. 884–890.
[15] Monk, A. M., and L. B. Milstein, “Open-Loop Power Control Error in a LandMobile Satellite System,” IEEE J. Select. Areas Commun., Vol. 13, No. 2, 1995,pp. 205–212.
182 Low Earth Orbital Satellites for Personal Communication Networks

[16] Vojcic, B. R., R. L. Pickholtz, and L. B. Milstein, “Performance of DS-CDMAWith Imperfect Power Control Operating Over a Low Earth Orbiting SatelliteLink,” IEEE J. Select. Areas Commun., Vol. 12, No. 4, 1994, pp. 560–567.
[17] Newson, P., and M. R. Heath, “The Capacity of a Spread Spectrum CDMASystem for Cellular Mobile Radio With Consideration of SystemImperfections,” IEEE J. Select. Areas Commun., Vol. 12, No. 4, 1994,pp. 673–684.
[18] Cameron, R., and B. Woerner, “Performance Analysis of CDMA WithImperfect Power Control,” IEEE Trans. Commun., Vol. 44, No. 7, 1996,pp. 777–781.
[19] Jamalipour, A., et al., “A Modified Power Control Scheme for Remedying theEffects of Traffic Nonuniformity in LEO Satellite Communications Systems,”Int. J. Wireless Information Networks, Vol. 3, No. 1, 1996, pp. 29–39.
[20] Jamalipour, A., et al., “On Remedying the Traffic Nonuniformity Effects inLEO Satellite Communication Systems,” Proc. 45th IEEE Vehic. Technol. Conf.(VTC ‘95), Chicago, IL, 1995, pp. 986–990.
[21] Jamalipour, A., et al., “LEO Satellite Communication Systems UnderNonuniform Traffic Distribution With Spread-Slotted Aloha,” Proc. TechnicalReport IEICE, SAT 94-57, Japan, 1994, pp. 15–21.
Modified Power Control in Spread-Slotted Aloha 183
Low Earth Orbital Satellites for Personal Communication Networks
6Transmit Permission Control
Scheme for Spread-SlottedAloha
E - in conventional slotted-Aloha multiple-access scheme allows multiple, simultaneous packettransmissions over satellite-based land-mobile communication links
[1–3]. With such composite multiple-access schemes, collision of thepackets does not result in loss of the information of the packets as long asthe SIR level can be kept above some threshold value. In addition, thiskind of combination maintains the advantages of both schemes [4–8].
To improve the performance of a communications system employingsuch a multiple-access scheme, it is necessary to keep the level ofmultiple-access interference as low as possible. Specifically, if we cankeep the level of the multiple-access interference close to the level that
185

the system can support, we can expect to achieve the best throughputperformance. One method is to require users to transmit only at thespecific situations in which, for example, their distance to the hub stationis below a predefined value. In a multicell system with a single hub percell, this method results in decreasing both the multiple-access interfer-ence levels from users inside the cell and from adjacent cells; and hence,improves the performance of the system. That is the basic idea of thetransmit permission control (TPC) method [9]. Employing such a scheme incellular systems results in reducing the size of the cells; then, in a fixedcommunications system, that control results in denial of permission tosome portion of the users at all times. Therefore, the TPC method isattractive and practical only in mobile communications systems, wherethe distance (or, in a fading channel, the propagation loss) between anyuser and the hub station changes.
This chapter introduces the concept of the TPC scheme and proposestwo new adaptive forms of it. In the adaptive schemes, by considerationof the level of the offered traffic loads, permission for the transmission isoffered to users more intelligently; therefore, better performance isachieved. This chapter examines, as an example of mobile communica-tions systems, the proposed methods in a LEO satellite communicationssystem.
In this chapter, we first use the throughput analysis of Chapter 4 toevaluate the performance of the new scheme. Moreover, we introducethe mathematics for calculating the average delay performance in LEOsatellite systems. The mathematics are used in two steps. First, we showhow the average delay performance of the system is affected when a newdelay time due to the TPC scheme is added in the system. Next, weconsider the effects of nonuniformity in traffic distribution on the averagedelay or stability of the system. We also modify the throughput analysisfor fading channels and discuss the performance of the conventionalspread-slotted Aloha and the TPC schemes in the fading channel.
This chapter is organized as follows. Section 6.1 introduces the TPCscheme in nonfading satellite communications channels and evaluates itsperformance. A performance analysis of the average delay performancealso is given in this section. Section 6.2 introduces the fading model andconsiders the performance of the TPC scheme under this situation.Section 6.3 proposes the concepts of two new adaptive forms of the TPC
186 Low Earth Orbital Satellites for Personal Communication Networks

scheme and compares the performance of those schemes to that of anonadaptive scheme.
6.1 Transmit permission control scheme:Nonfading channelThis section, like Chapters 4 and 5, is concerned with the performanceof a global LEO satellite communications network with the assumptionof nonfading or ideal satellite links. Until now, discussion has concen-trated on the throughput performance of this packet communicationsnetwork, which, of course, has a considerable role in any packet commu-nications systems. However, from the viewpoint of stability of the systemit is necessary to compute the average delay performance, which has aclose relation with the throughput performance. The problem of consid-ering the average delay performance becomes especially important forsystems with considerably long propagation delay, such as satellite sys-tems. Even for systems with small propagation delay, such as local areanetworks (LANs), computation of the average delay time is important,because sometimes the number of retransmissions of a packet untilsuccessful reception at the receiver becomes very large, and the averagedelay time reaches unacceptably large values.
In our packet LEO satellite system, both the long propagation delayand retransmission of failed packets exist; hence, calculation of theaverage delay performance has high-enough importance. It is necessaryto remember here that one of advantages of the LEO satellite systems istheir low propagation delay compared to geostationary satellite systems;however, compared to the propagation delay in a LAN or terrestrialsystem, it is long enough to be considered.
Another reason for the importance of average delay performanceanalysis is to observe how the stability of a system is affected whenadditional delay times due to the specific protocol utilized in the systemare involved. One example of such a case is the protocol that introducedin this chapter, the TPC scheme. In the TPC scheme, to improve theprobability of packet success and the throughput performance at somespecific intervals, the permission for transmission is partly restrainedfrom users; thus, each user experiences, on average, additional delay. If
Transmit Permission Control Scheme for Spread-Slotted Aloha 187

we show only the throughput performance improvement of such ascheme without discussing its effects on the average delay performance,it will not be a fair comparison with conventional schemes.
6.1.1 Basic considerations
Before starting the main discussion of this section, that is, introducing theTPC scheme, let us do an overview of the basic considerations used inanalyses of the throughput and average delay performances of our packetLEO satellite communications network. Therefore, this subsectionbriefly explains the satellite system model and then provides a newviewpoint on the traffic model to be utilized later.
Consider a global communications network comprising LEO satel-lites in a multiple-orbit satellite constellation. The total number of orbitsand the number of the satellites in each orbit are designed so that at anytime any area on the Earth is covered by, at least, one satellite. It ispossible for each user of this communications network to communicatewith the visible satellite(s), directly.
Because of the relative motion of the LEO satellites, the connectionof a user to a satellite is a temporary connection, and a continuouscommunication must be realized by means of hand-off schemes, men-tioned in Section 2.1.2. In this chapter, without delving into the perform-ance of hand-off schemes, we analyze the performance of the system onan average basis during a short period of time in which the mobility of thesatellites can be neglected.
The goal of the protocol we propose here is to improve the perform-ance of the communications system on its uplinks, that is, the users-to-satellites direction. On the downlinks, from satellites to users, thesatellite, like the base station in a cellular terrestrial system, can take careof all the transmissions in its cell, and any conventional multiple-accessscheme such as TDMA can be applied.
To be more specific, assume there are Ns equally spaced satellites oneach circular orbit. Each satellite continuously sends out a signal at aconstant predefined power level, S. A user, say the jth one, receives atleast one attenuated form of this signal, for example from the ith satellite,where i = 1, 2, …, Ns, with the power
188 Low Earth Orbital Satellites for Personal Communication Networks
Ri, j = κ S di, j−β (6.1)
where κ is a constant with the dimension m−2; di,j is the distance of thejth user to the ith satellite; and β is the power-loss factor equal to 2 for asatellite link.
The predefined signal is used for three purposes. First, by monitoringthis signal, every user can determine the distance to all visible satellitesand thus select the nearest one, that is, the satellite that requires thelowest uplink power in a nonfading channel. With the assumption ofconnecting users to their nearest satellites, equal-size circular serviceareas for all satellites can be realized. The remaining two purposes arerelated to the realizations of the power control and the TPC schemes andare described in Subsection 6.1.2.
The remaining problem in describing the system model is definingthe spatial distribution of the users. The geographical location of usersmakes the distribution of the communications traffic loads have differentlevels of high traffic load peaks over densely populated areas and flat-, orlow-, traffic load over unpopulated areas. For a conventional geostation-ary satellite system, in which every satellite covers about one-third thesurface of the globe, the unbalanced traffic load can be managed carefullyby each satellite. However, for LEO satellite systems, in which a satellitemay cover a limited area of the globe, this problem results in nonoptimalusage of the communication facilities (see Chapters 3 and 4). Althoughthe purpose of this chapter is to introduce a multiple-access method thatimproves the performance of the system in high traffic situations, not todiscuss the traffic nonuniformity problem directly, a spatial distributionmodel that includes traffic nonuniformity is assumed here. It will beshown that the method can improve the performance of the system innonuniform traffic distributions as well as in uniform traffic situations.
To make the discussion of performance of the proposed method clear,this chapter considers the performance of one part of the communicationssystem that includes the area covered by three succeeding satellites onthe same orbit. It is assumed that the locations of different users arestatistically independent. The spatial density of population of the users inthis area forms a bell-shaped density function centered at the second
Transmit Permission Control Scheme for Spread-Slotted Aloha 189

satellite. The projection of this bell-shaped density function on the planethat includes the three satellites determines the density of population ofusers used in the analysis. Note that because of small difference betweendistances of different users in the same service area to the satellite, thistwo-dimensional traffic model results in a good approximation withmathematical tractability. Also note that this description is only anotherviewpoint for the traffic distribution model we have used in the precedingchapters. The total population of users in this area is assumed to be finiteand equal to Nu. The location of any user on this plane is assumed to bea random variable with the probability density function
p(x) = A
ωexp(−x
2⁄2ω2) (6.2)
where x is the relative distance of users from the origin, which is assumedto be under the central satellite; ω is the traffic uniformity parameter;and A is a factor that makes the total probability of existence of a user inthis area equal to 1. With this model, we can evaluate the performanceimprovement achieved by the modification in the multiple-access methodin both uniform and nonuniform traffic distributions. That is, a smallvalue of ω realizes a situation in which users are concentrated in theservice area of one satellite, which means a high traffic situation for thatsatellite; enabling us to see the characteristics of the scheme in this case.
6.1.2 Transmit permission control
As stated in Subsection 6.1.1, the performance of the uplinks is ofinterest. The basic multiple-access scheme assumed in this direction is thedirect-sequence spread-slotted Aloha (DS/SSA) scheme, which allows multi-ple transmissions simultaneously and is known as a scheme that increasesthe capacity of the mobile satellite systems. In conventional DS/SSAsystems (those used in Chapters 4 and 5), users transmit information inthe form of packets, whenever they have a packet, at the beginning of thenext slot, regardless of the status of the channel and the behavior of otherusers. The purpose of the TPC method is to modify the DS/SSA schemein such a way that permissions for transmissions are given only to the users
190 Low Earth Orbital Satellites for Personal Communication Networks

whose interference have little effect on the capture (success) probabilityof other packets.
In multiple-access methods based on spread-spectrum techniques,including the DS/SSA scheme, the equalization of the received powersfrom users is an important issue [10,11]. In LEO satellite systems, anyuser can, for example, by monitoring the predefined signal received fromthe nearest satellite, send a packet with proper power level. (Note thatin a real communications system, the predefined or pilot signal on thedownlink experiences different fading variations to that of the transmit-ting signal from a user on the uplink. Moreover, the fading on the uplinkusually is uncorrelated with that on the downlink, since the uplink anddownlink frequency bands usually are separated by more than the coher-ence bandwidth of the channel. These factors should be considered inpower control and are discussed in Section 7.3.) Therefore, it is assumedthat all received signals at any given satellite, say, the ith one, from theusers in its service area arrive at the satellite at the same power level, S.(This is the second usage of the predefined signal mentioned in Subsection6.1.1.) Therefore, according to (6.1), the transmitted power level of thejth user, where j = 1, 2, …, Nu, to the ith satellite will be
Ti, j = κ−1 S di, jβ (6.3)
Hence, it is assumed that the network operates under perfect powercontrol. It should be noted that, from the viewpoint of a given packet,all other signals transmitted from users either in the same service area orin different ones act as interference. The packets of users in the sameservice area have the same power, S; however, the ones from differentservice areas have different power levels, depending on their distances.
In such a system, the probability of packet success or capture prob-ability for a given packet decreases as the number of simultaneoustransmitted packets increases. For example, assume a given user is inservice area of the ith satellite. As shown in Section 5.1, for a packettransmitted by this user—the tagged packet—the interference fromother simultaneously transmitted packets in the same service area and alsofrom transmitted packets in marginal areas of the adjacent service area
Transmit Permission Control Scheme for Spread-Slotted Aloha 191
(because of the relatively long distances of the users in marginal areas totheir connecting satellites) are the dominant factors that decrease itscapture probability. To improve the capture probability of this typicalpacket transmitted in the service area of the ith satellite, which results inenhancing the throughput of the system, one possible method is to limitthe transmission of the packets from users far from their connectingsatellites.
This method can be considered an interference-cancellation method;however, it has a fundamental difference with conventional interference-cancellation schemes used in spread-spectrum systems. In conventionalschemes, the existence of a certain level of multiple-access interferenceis assumed, and the hardware of the receivers as well as the transmittersare redesigned so that the multiple-access interference can be canceled asmuch as possible. However, in our control of the transmission of packets,we want to decrease the certain level of multiple-access interferencewhile keeping the hardware the same as before by adding some proce-dures in the processors of the transmitters only. These procedures areaccomplished with the existing information at the terminals withoutadditional necessary information.
The idea of the proposed TPC is nothing more than the followingsimple instruction: Users can send packets if they are located at a distanceless than a certain value. Without specifying what determines that dis-tance value at the moment, we can conclude that this method reduces thenumber of simultaneous transmissions; that is, the level of multiple-ac-cess interference, especially by avoidance of the transmissions by users inmarginal service areas.
Realization of the method can be performed by the mean of thepredefined signal sent by the satellites mentioned in Subsection 6.1.1, asits third usage. Because the powers of the signals are known by all users,any user can determine the propagation loss from a given location to thevisible satellites. Then the transmit permission protocol states that a userwho has propagation loss larger than a predefined value, such as lmax, isnot allowed to transmit packets. That means that the users in marginalbelts of service areas are prohibited from transmitting their packets.
This scheme may seem unfair to users with relatively large values ofpropagation loss to their nearest satellites. However, if we allow all usersto transmit at all times, the large interference reduces the capture
192 Low Earth Orbital Satellites for Personal Communication Networks

probability and consequently degrades the total throughput of the system.Larger success probabilities for permitted users result in higher totalthroughput than low success probabilities for all users, which of coursedepend on proper design of the predefined value of propagation loss, lmax.On the other hand, because satellites in LEO satellite systems are in acontinuous motion, nonpermitted users are allowed to transmit after ashort period, as will be shown later.
Let us have a physical representation of the TPC method. Assume afixed and same value for the maximum allowable propagation loss, lmax,in the service area of all satellites. After applying the method, the radiusof service area of each satellite, r0, is multiplied by some factor ρ, where0 ≤ ρ ≤ 1, resulting in a reduction of 1 − ρ in the radius of service areas.The parameter ρ depends on and has the same information as lmax withsimpler tractable meaning, that is, large values of lmax make the decrementof service area of satellites small, which means a nearly unity value of ρand vice versa. Figure 6.1 illustrates the change in service areas of thesatellites before and after application of the TPC scheme. In the figure,it is assumed that minimum numbers of satellites and orbits are consid-ered for global coverage.
In each circular service area of the satellites in Figure 6.1, assume thelargest hexagon that can be inscribed in it. The area of such a hexagonwas calculated in Chapter 2, considering the spherical shape of the Earth.For the sake of simplicity, ignore the spherical effect and calculate theapproximate area of the hexagon inscribed in the circular service areawith the radius r0 (Figure 6.2) as
Ahex ≈ 6r02 sin30° cos30°
= 3√32
r02 (6.4)
Assuming nonoverlapping service areas after application of the TPCmethod, the ratio of a service area after application of the method to theservice area before application is
ATPC
Ahex=
π(r0ρ)2
3√3 r02 ⁄2
= 2πρ2
3√3(6.5)
Transmit Permission Control Scheme for Spread-Slotted Aloha 193
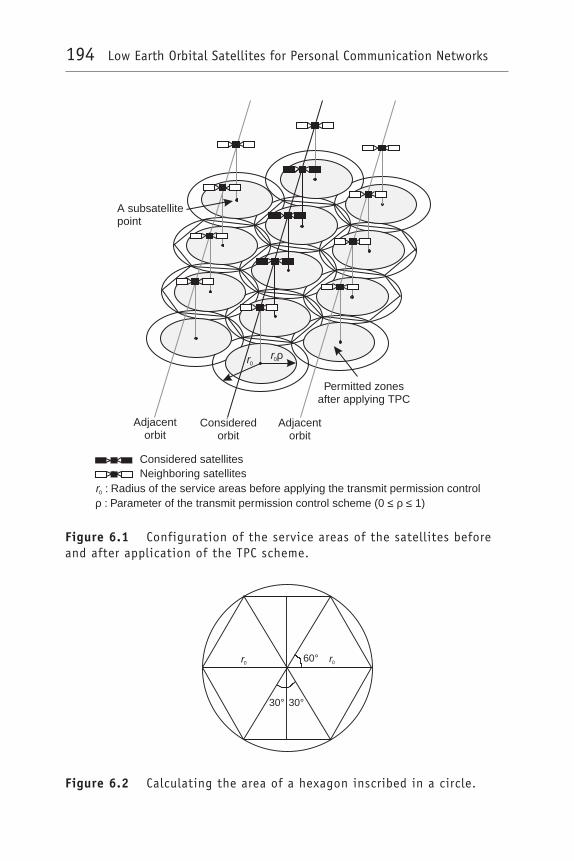
A subsatellitepoint
Permitted zonesafter applying TPC
Adjacentorbit
Adjacentorbit
Consideredorbit
Considered satellitesNeighboring satellites
r0 : Radius of the service areas before applying the transmit permission controlρ ≤ ρ ≤: Parameter of the transmit permission control scheme (0 1)
r0r0ρ
Figure 6.1 Configuration of the service areas of the satellites beforeand after application of the TPC scheme.
60°
30° 30°
r0 r0
Figure 6.2 Calculating the area of a hexagon inscribed in a circle.
194 Low Earth Orbital Satellites for Personal Communication Networks
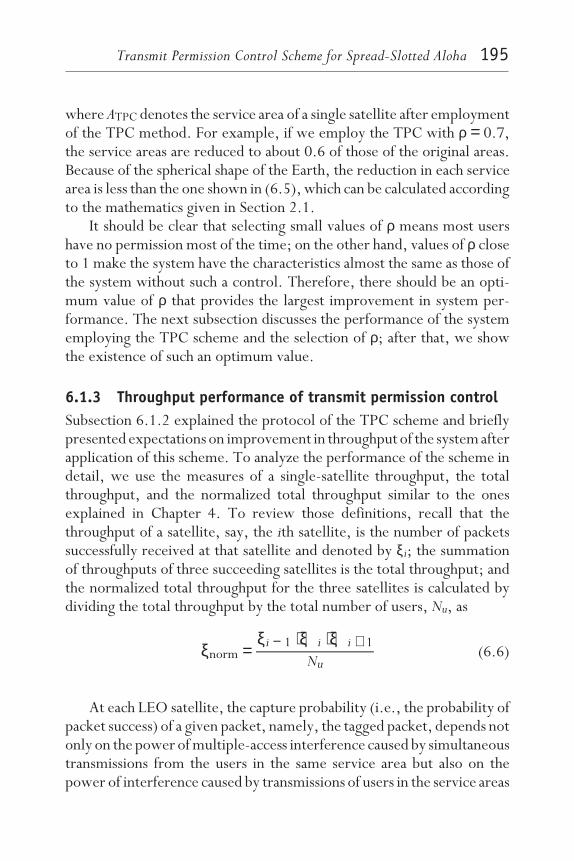
where ATPC denotes the service area of a single satellite after employmentof the TPC method. For example, if we employ the TPC with ρ = 0.7,the service areas are reduced to about 0.6 of those of the original areas.Because of the spherical shape of the Earth, the reduction in each servicearea is less than the one shown in (6.5), which can be calculated accordingto the mathematics given in Section 2.1.
It should be clear that selecting small values of ρ means most usershave no permission most of the time; on the other hand, values of ρ closeto 1 make the system have the characteristics almost the same as those ofthe system without such a control. Therefore, there should be an opti-mum value of ρ that provides the largest improvement in system per-formance. The next subsection discusses the performance of the systememploying the TPC scheme and the selection of ρ; after that, we showthe existence of such an optimum value.
6.1.3 Throughput performance of transmit permission controlSubsection 6.1.2 explained the protocol of the TPC scheme and brieflypresented expectations on improvement in throughput of the system afterapplication of this scheme. To analyze the performance of the scheme indetail, we use the measures of a single-satellite throughput, the totalthroughput, and the normalized total throughput similar to the onesexplained in Chapter 4. To review those definitions, recall that thethroughput of a satellite, say, the ith satellite, is the number of packetssuccessfully received at that satellite and denoted by ξi; the summationof throughputs of three succeeding satellites is the total throughput; andthe normalized total throughput for the three satellites is calculated bydividing the total throughput by the total number of users, Nu, as
ξnorm =ξi − 1 + ξi + ξi + 1
Nu(6.6)
At each LEO satellite, the capture probability (i.e., the probability ofpacket success) of a given packet, namely, the tagged packet, depends notonly on the power of multiple-access interference caused by simultaneoustransmissions from the users in the same service area but also on thepower of interference caused by transmissions of users in the service areas
Transmit Permission Control Scheme for Spread-Slotted Aloha 195
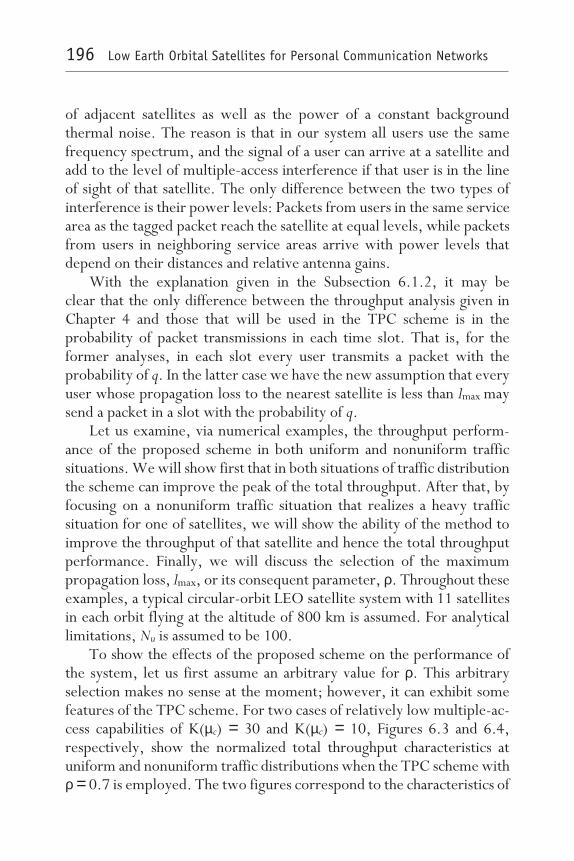
of adjacent satellites as well as the power of a constant backgroundthermal noise. The reason is that in our system all users use the samefrequency spectrum, and the signal of a user can arrive at a satellite andadd to the level of multiple-access interference if that user is in the lineof sight of that satellite. The only difference between the two types ofinterference is their power levels: Packets from users in the same servicearea as the tagged packet reach the satellite at equal levels, while packetsfrom users in neighboring service areas arrive with power levels thatdepend on their distances and relative antenna gains.
With the explanation given in the Subsection 6.1.2, it may beclear that the only difference between the throughput analysis given inChapter 4 and those that will be used in the TPC scheme is in theprobability of packet transmissions in each time slot. That is, for theformer analyses, in each slot every user transmits a packet with theprobability of q. In the latter case we have the new assumption that everyuser whose propagation loss to the nearest satellite is less than lmax maysend a packet in a slot with the probability of q.
Let us examine, via numerical examples, the throughput perform-ance of the proposed scheme in both uniform and nonuniform trafficsituations. We will show first that in both situations of traffic distributionthe scheme can improve the peak of the total throughput. After that, byfocusing on a nonuniform traffic situation that realizes a heavy trafficsituation for one of satellites, we will show the ability of the method toimprove the throughput of that satellite and hence the total throughputperformance. Finally, we will discuss the selection of the maximumpropagation loss, lmax, or its consequent parameter, ρ. Throughout theseexamples, a typical circular-orbit LEO satellite system with 11 satellitesin each orbit flying at the altitude of 800 km is assumed. For analyticallimitations, Nu is assumed to be 100.
To show the effects of the proposed scheme on the performance ofthe system, let us first assume an arbitrary value for ρ. This arbitraryselection makes no sense at the moment; however, it can exhibit somefeatures of the TPC scheme. For two cases of relatively low multiple-ac-cess capabilities of K(µc) = 30 and K(µc) = 10, Figures 6.3 and 6.4,respectively, show the normalized total throughput characteristics atuniform and nonuniform traffic distributions when the TPC scheme withρ = 0.7 is employed. The two figures correspond to the characteristics of
196 Low Earth Orbital Satellites for Personal Communication Networks
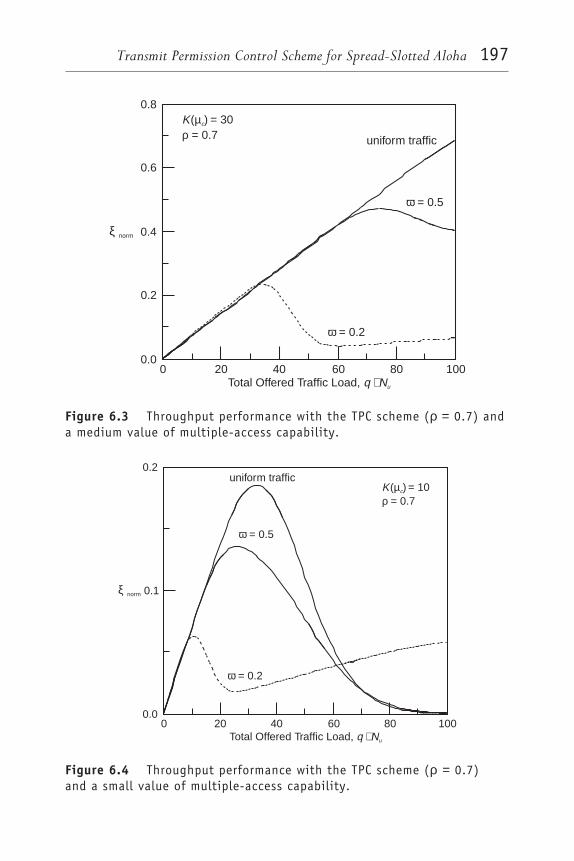
K( ) = 30= 0.7µ
ρc
ω = 0.5
ω = 0.2
uniform traffic
ξ norm
0.8
0.6
0.4
0.2
0.00 20 40 60 80 100
Total Offered Traffic Load, q Nu⋅
Figure 6.3 Throughput performance with the TPC scheme (ρ = 0.7) anda medium value of multiple-access capability.
K( ) = 10= 0.7µ
ρc
ω = 0.5
ω = 0.2
uniform traffic
ξ norm
0.0
0.1
0.2
0 20 40 60 80 100Total Offered Traffic Load, q Nu⋅
Figure 6.4 Throughput performance with the TPC scheme (ρ = 0.7)and a small value of multiple-access capability.
Transmit Permission Control Scheme for Spread-Slotted Aloha 197

the conventional spread-slotted Aloha shown in Figures 4.11 and 4.12after application of the TPC scheme. Comparing Figures 6.3 and 6.4 tothe figures in Chapter 4, we can say that although each service area isreduced to about 60% of its original, applying the proposed schemeexhibits higher peak throughputs in both uniform and nonuniform trafficcases. In either case, the scheme shows improvement not only in enhanc-ing the peak of the throughput curves but also in expanding the curves onthe offered traffic load axis. Although we do not present any analysis onthe stability characteristics of the system, by similarity of the multiple-access scheme with conventional slotted Aloha, we can expect that theexpansion of the throughput curves on the offered traffic load axis,achieved by the proposed method, makes the system exhibit improvedstability as well [12].
The improvements achieved by the scheme are due to differentreasons. The prohibition from transmission of a portion of the users inthe service area of each satellite is the main factor, since the power ofinterference of those users is the same as the power of the signal, S. Theomission of interference from a portion of users of adjacent satellites isthe second reason. The powers of interference of the latter users dependon the power loss factor β and their distances to the satellites.
As mentioned, the selection of ρ in the previous examples wasarbitrary. An optimum selection of ρ, however, can be made by atrade-off between the level of traffic load and the degree of performanceimprovement. A decrease in the value of ρ results in a decrease in thenumber of users permitted to transmit in each service area. That meansthe number of simultaneous transmitting packets decreases, which is notnecessary in light traffic loads. On the other hand, in heavy traffic loadsrestricting some portion of users from transmission improves the prob-ability of packet success and thus the total throughput. Since in calculationof the total normalized throughput the total number of users, includingboth permitted and nonpermitted users, is considered, it is possible tofind a proper value of ρ.
To show the effect of the selection of ρ on the performance of thesystem, let us focus the evaluation on a special case of K(µc) = 30 andω = 0.5, which is a heavy traffic situation and hence a low-captureprobability for one of the satellites.
198 Low Earth Orbital Satellites for Personal Communication Networks

Figure 6.5 shows the effect of changing the parameter of the TPCmethod ρ on the normalized total throughput of the system. As shown inthe figure, decreasing the value of ρ from 1 (i.e., no transmit denials) toabout 0.5 shows improvement in the maximum value of throughputcurves. For traffic loads less than about 50, however, the system withoutthe proposed method shows better characteristics. The reason is that inlight traffic loads all the transmissions can be serviced with high prob-ability of success, and prohibiting some users from transmission does notimprove the probability of packet success of the others and only decreasesthe total number of the packets on air and hence the total throughput.On the other hand, for traffic loads higher than 50, the probability ofpacket success is relatively low, and this prohibition increases the prob-ability of packet success for the permitted users, so that larger throughputis achievable. Small values of ρ can give improvement only in heavyoffered traffic loads.
0 20 40 60 80 100Total Offered Traffic Load, q Nu⋅
ξ norm
0.0
0.2
0.6
0.4
K( ) = 30= 0.5µ
ωc
ρ = 1.0
0.40.5
0.90.8 0.7 0.6
Figure 6.5 Effect of selection of ρ on normalized total throughputperformance.
Transmit Permission Control Scheme for Spread-Slotted Aloha 199

To exhibit the relation between the selection of ρ and the offeredtraffic load more clearly, we have examined the changes in normalizedtotal throughput at different offered traffic loads when the parameter ofthe TPC scheme, ρ, is changed. Figure 6.6 compares the normalized totalthroughput for different values of offered traffic load q ⋅ Nu as a functionof ρ. The point illustrated by Figure 6.6 is that for each traffic load thereis an optimum value for ρ that results in maximum improvement of thethroughput performance. That means there is a close relation betweenthe selection of ρ and the offered traffic load region in which the systemworks: A system working at heavy traffic load requires smaller values ofρ, while for a system in which a light offered traffic region is designed,the values of ρ near 1 is enough. The figure also illustrates that using small
K( ) = 30
= 0.5
µω
c
Offered trafficload = 90
7560
50
ξ norm
0.0
0.2
0.6
0.4
ρ0.2 0.4 0.6 0.8 1.0
Figure 6.6 Effect of selection of ρ on normalized total throughputperformance in different offered traffic loads.
200 Low Earth Orbital Satellites for Personal Communication Networks

values of ρ at high offered traffic situations significantly improves theperformance of the system.
As mentioned before, in LEO satellite systems, the satellites are in acontinuous motion. Thus, it is necessary to consider dynamic perform-ance of the system while it is experiencing high traffic load areas in thesatellites’ paths. To do that, let us evaluate the dynamic performance ofthe system by a new measure, namely, the average normalized totalthroughput. The average normalized total throughput is defined as theaverage value of the normalized total throughput of the three succeedingsatellites covering a particular area on the Earth during a specific periodof time. If we denote, as before, the total number of the satellites in oneorbit by Ns, the averaging procedure is done in the 2π/Ns fraction of theorbit in which the density function of the users is centered. During thatperiod, the satellites experience different traffic-load situations. The caseof one satellite with high traffic load and the two others with light trafficloads described until now is one of these situations.
Figure 6.7 shows the average normalized total throughput with thesame parameters as in Figure 6.5, as a function of total offered traffic loadand for different values of ρ. Comparing the two figures, we can seealmost the same behavior in improvement of the peak value of thethroughput by employing the TPC scheme as the previously consideredinstantaneous throughputs. However, interesting differences at high of-fered traffic loads between the curves of the two figures also are recog-nizable. That is, at high offered traffic loads, the values of the averagetotal throughput are much higher than the instantaneous values inFigure 6.5. The reason is that in Figure 6.5 a heavily populated area isserviced by a single satellite, that is, only the worst case is considered.However, after averaging the instantaneous throughputs, other situ-ations, for example, the case when the peak of the traffic is between twosatellites, also are considered.
6.1.4 Average delay performance of transmitpermission control
Another important measure of performance in a packet communicationssystem is the average delay performance, which shows on average the
Transmit Permission Control Scheme for Spread-Slotted Aloha 201

required time for successful delivery of a packet in the system. If thespread-slotted Aloha scheme is employed in a communication systemwith a negligible value of propagation delay, such as in microcellularsystems or in a LAN, the average delay is due mainly to the number ofretransmissions of collided packets because of a high level of interferenceexperienced by those packets. After a packet is involved in a collision,the sender of that packet should retransmit the same packet repeatedlyafter a randomly selected period until an acknowledgment eventually isreceived. The random retransmission delay hopefully avoids the collisionof the same packets in future retransmissions. In a low-throughputsituation, the number of such collisions and, hence, the number ofretransmissions increase, and then average delay becomes longer.
K( ) = 30
= 0.5
µω
c
0.0
0.2
0.6
0.4
Ave
rage
Nor
mal
ized
Tota
l Thr
ough
put
ρ = 1.0
without TPC
method
0.90.8 0.7 0.6
0.5
0 20 40 60 80 100
Total Offered Traffic Load, q Nu⋅
Figure 6.7 Effect of the TPC method on the average normalized totalthroughput.
202 Low Earth Orbital Satellites for Personal Communication Networks
In LEO satellite systems, although the propagation delay betweenusers and satellites is much smaller than that in a geostationary satellitesystem, if the number of retransmitted packets increases, the total propa-gation delay becomes on the order of the packet length and thus isnot negligible. If we improve the probability of packet success, or thethroughput, the number of collisions decreases, and we can expect animproved average delay performance of the system as well. The proposedTPC scheme, as shown before, improves the throughput characteristics;therefore, it may improve the delay performance, too. However, becauseapplication of this method may cause another delay time, that is, a delaydue to the waiting time to get the permission for transmission for aportion of users, we should consider the average delay performance inthe evaluation of the method in addition to the throughput performance.A trade-off between the average delay and the throughput performancemay determine the optimum degree of the TPC scheme.
Average delay is defined, in general, as the average time elapsed fromthe moment a packet is generated by a user to the moment the entirepacket is received successfully at a satellite [13–16]. Here, we considertwo kinds of average delay. The first one is the average delay of the packetsgenerated by the users in the service area of each satellite, say, the ithsatellite, and which is denoted by ∆i. Because the expected number ofusers and the throughput in the service areas of satellites in nonuniformtraffic distribution are different, the average delay in different serviceareas also is different. Therefore, we define the normalized average delay,∆norm, as the average delay of the packets generated in any service area.For example, considering three satellites, we have
∆__
norm =∆__
i − 1 ENi − 1
+ ∆
__i E
Ni
+ ∆
__i + 1 E
Ni + 1
Nu(6.7)
where ENi is the expected number of users in the service area of theith satellite. Obviously, in uniform traffic distribution, ∆norm will beequal to the average delay in each of the service areas.
In this subsection, we evaluate the average delay performance of theTPC scheme. That analysis also can be used in the case of a conventional
Transmit Permission Control Scheme for Spread-Slotted Aloha 203

spread-slotted Aloha scheme with the assumption of an infinity value forlmax. In Subsection 6.1.3, it was assumed that any user with a propagationloss less than lmax to the nearest satellite transmits a packet in each timeslot with the probability q. That assumption leads to a binomial compositearrival distribution, including both the new originated packets and theretransmitted ones. In other words, it is assumed that the new originatedpackets and the retransmitted packets have the same packet generationstatistics. Although in general, for practical implementation, the prob-ability of transmitting a new originated packet, po, is smaller than that ofa retransmitted packet, pr, it has been shown that the assumption ofpo = pr = q gives major simplifications and exact-enough results [14]. Theneed for retransmission is due to the loss of the packet because of anexcessive interference level.
Any user wishing to transmit a packet first should check the permis-sion for transmission according to the protocol of the TPC scheme. Auser in a nonpermitted zone should wait until a satellite comes closeenough so that the propagation loss to that satellite becomes less than lmax.The probability of being a user in nonpermitted zones of each service areais related to the percentage of the permitted zones in that service area andalso to the probability density function of the location of users and for theith satellite, denoted by pnpi. Note that without employment of the TPCmethod, pnpi = 0 in all service areas. The waiting time for obtainingpermission is denoted by τwp and can have any value between 0 and2r0(1 − ρ)/ν, where r0 is the radius of the service areas and ν is the groundspeed of the satellites; when ρ is enough large, it is assumed that theaverage value of τwp is τwp = r0(1 − ρ)/ν. Therefore, the average waitingtime related to the TPC in the service area of the ith satellite is τwpPnpi.
A user waits for an acknowledgment from the destination satellitebefore clearing the packet. Because a slotted case is considered, the packetcan be generated at any point during a slot, yet the user has to wait untilthe beginning of the next slot before attempting a transmission. The timebetween packet generation and the start of the next slot is representedby τpg and can have any value between 0 and τp, the packet duration, withequal probability. Hence, the average time from the generation of thepacket until the entire packet enters the channel equals τwppnpi+ τp/2 + τp
= τwppnpi + 3/2τp. For the purpose of comparing the average delayperformance in the conventional DS/SSA system with a system that
204 Low Earth Orbital Satellites for Personal Communication Networks

employs the TPC scheme and for the sake of simplicity in calculations,zero-guard time is assumed here.
The packet travels through the uplink satellite channel and is sub-jected to the one-hop satellite delay, Td. Although Td differs according tothe location of the transmitting user in a service area, for a satellite systemits variance is small so that an average value of Td is used in numericalexamples. In the case of successful reception of the packet by the satellite,on average τd = τwpPnpi + 3/2τp + Td seconds elapse between generationof the packet and its full acceptance by the satellite. In this case, thesatellite sends an acknowledgment packet with a duration of τack, and theuser receives that packet after Td + τack + τprocess seconds, where τprocess isthe required satellite processing time. Here we assume that τack and τprocess
are negligible compared to other time durations. From the moment ofsending a packet, the user waits for another Td seconds, expecting toreceive the acknowledgment packet. If the attempt is successful, the userclears the packet. If an acknowledgment packet is not received, the userconsiders the packet lost and starts the process of reattempting transmis-sion. It is reasonable to assume that the probability of loss of the acknow-ledgment packet is very small. If the packet is lost, the user waits τw
seconds, a random retransmission delay time with an average of τw. Theretransmission procedure is repeated until the user receives an ack-nowledgment. In any steps of the retransmission, the user may findthe unpermitted condition and then should wait until permission isobtained.
For the scenario described here, the average delay of the packet in theservice area of the ith satellite can be expressed as
∆__
i = τd psuci + (τd + τ_
tw)(1 − psuci)psuci + (τd + 2τ_
tw)(1 − psuci)2psuci + …
= ∑(k = 0
∞
τd + k τ_
tw)(1 − psuci)k psuci
(6.8)
where τtw is the average time elapsed between the end of the firsttransmitted packet and the end of the first retransmitted packet orbetween the ends of any two successive retransmitted packets, at the
Transmit Permission Control Scheme for Spread-Slotted Aloha 205
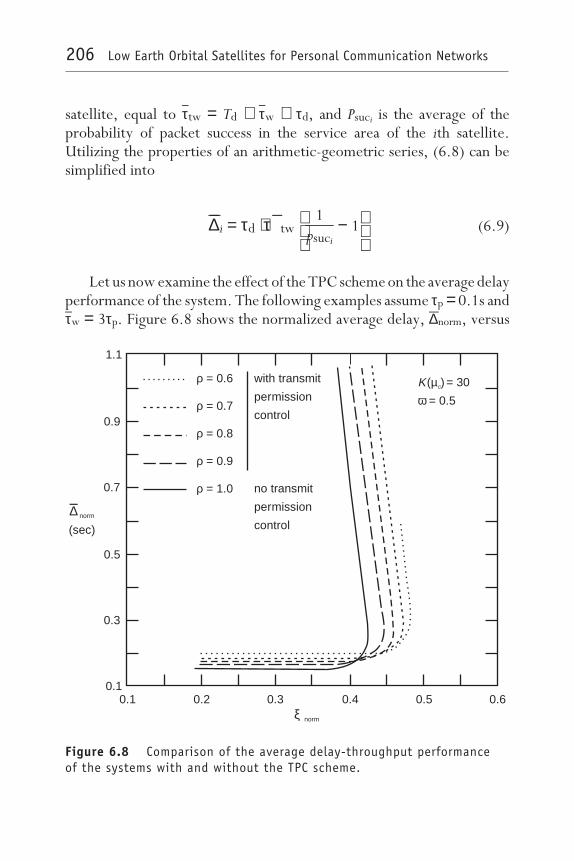
satellite, equal to τtw = Td + τw + τd, and Psuci is the average of theprobability of packet success in the service area of the ith satellite.Utilizing the properties of an arithmetic-geometric series, (6.8) can besimplified into
∆__
i = τd + τ_
tw
1psuci
− 1
(6.9)
Let us now examine the effect of the TPC scheme on the average delayperformance of the system. The following examples assume τp = 0.1s andτw = 3τp. Figure 6.8 shows the normalized average delay, ∆norm, versus
K( ) = 30
= 0.5
µω
cρ
ρ
ρ
ρ
ρ
= 0.6
= 0.7
= 0.8
= 0.9
= 1.0
with transmit
permission
control
no transmit
permission
control∆ norm
(sec)
1.1
0.9
0.7
0.5
0.3
0.1
ξ norm
0.1 0.2 0.3 0.4 0.5 0.6
Figure 6.8 Comparison of the average delay-throughput performanceof the systems with and without the TPC scheme.
206 Low Earth Orbital Satellites for Personal Communication Networks

the normalized total throughput under the same conditions as inFigure 6.5, again with ρ as a parameter. At initial low throughput regions,which correspond to light offered traffic loads, employing TPC seems toenlarge the average delay, similar to the discussion of the throughputperformance in Figure 6.5, because of the prohibition from transmissionof a fraction of the users that can be serviced successfully. At higherthroughput, however, the average delay performance of the systememploying the TPC becomes superior to that of the system without thisscheme. In the higher throughput, employing the proposed scheme de-creases the large number of retransmissions and hence shortens theaverage delay. Figure 6.8 suggests that an adaptive selection of ρ can offerimproved average delay, similar to the suggestion given for the through-put performance according to Figure 6.5, in a wide range of change inoffered traffic load. Note that employing the TPC with a fixed value ofρ = 0.7 enlarges the average delay at most on the order of half a packetlength. The half-packet-length delay is an expected value even in conven-tional (unspread) slotted Aloha systems.
Having analyzed the average delay, it now is simple for us to considerthe effect of nonuniformity in traffic distribution on the average delayperformance of the LEO satellite systems. The average delay perform-ance can show the stability of the packet communication system easily.Figure 6.9 shows the average delay-throughput performance of a LEOsatellite system in different traffic distributions. In the figure, a conven-tional spread-slotted Aloha system with a relatively low value of multi-ple-access capability is considered.
Comparing the performance in a uniform traffic situation with thatin a nonuniform traffic distribution, Figure 6.9 illustrates that in auniform traffic situation the system exhibits much more stability than innonuniform traffic situations. That is, in a uniform traffic situation whenthe level of offered traffic load to the system increases, the relativeincrease in average delay time occurs much more smoothly than in thecase of nonuniform traffic distributions. That is in addition to the highertotal throughput that the system can handle in uniform traffic conditionscompared to nonuniform situations. The reason for having a more stablesystem in uniform traffic is that at nonuniform traffic situations theexpected number of users in the service area of one of the satellites is very
Transmit Permission Control Scheme for Spread-Slotted Aloha 207
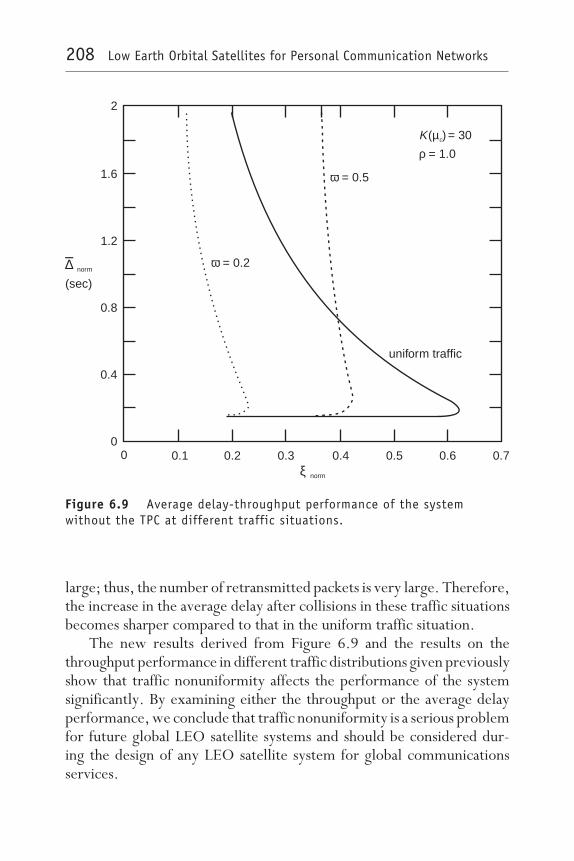
large; thus, the number of retransmitted packets is very large. Therefore,the increase in the average delay after collisions in these traffic situationsbecomes sharper compared to that in the uniform traffic situation.
The new results derived from Figure 6.9 and the results on thethroughput performance in different traffic distributions given previouslyshow that traffic nonuniformity affects the performance of the systemsignificantly. By examining either the throughput or the average delayperformance, we conclude that traffic nonuniformity is a serious problemfor future global LEO satellite systems and should be considered dur-ing the design of any LEO satellite system for global communicationsservices.
K( ) = 30
= 1.0
µρ
c
ω = 0.5
ω = 0.2
uniform traffic
∆ norm
(sec)
2
1.6
1.2
0.8
0.4
00
ξ norm
0.1 0.2 0.3 0.4 0.5 0.70.6
Figure 6.9 Average delay-throughput performance of the systemwithout the TPC at different traffic situations.
208 Low Earth Orbital Satellites for Personal Communication Networks
6.2 Transmit permission control scheme:Fading channelUntil now, a nonfading or ideal land-mobile satellite channel was as-sumed. That assumption is a proper simplification, especially for satellitesystems with relatively high elevation angles. In the case of LEO satellitesystems, however, low elevation angles on the order of 10 degrees oftenare considered. In this section, we consider the fading problem in ourLEO satellite system and evaluate the differences in performance of thesystem compared with considered nonfading channel assumption. More-over, we analyze the performance of the TPC scheme in a channel thatsuffers from variations of the received signal power due to the fading.
We will start the discussion of the fading problem in satellite channelswith an overview of the factors that affect the power of the signals insatellite systems [17–25]. Satellite communications with land-mobileterminals suffer from strong variations of the received signal power dueto signal shadowing and multipath fading. Shadowing of the satellite signalby obstacles in the propagation path, such as buildings, bridges, and trees,results in attenuation over the total signal bandwidth. The attenuationincreases with carrier frequency; that is, it is more marked at L-band thanat ultra high frequency (UHF). For low satellite elevation, the shadowedareas are larger than for higher elevations. Multipath fading occursbecause the satellite signal is received not only via the direct path but alsoafter being reflected from objects in the surroundings. Due to theirdifferent propagation distances, multipath signals can add destructively,resulting in a deep fade.
Subsection 6.2.1 models those two kinds of variations in signalpowers and shows how the variations affect the results obtained up to thispoint. Because TPC schemes prohibit transmissions from users with lowelevation angles, we will show that the TPC scheme can solve the problemof fading in LEO satellite systems to some degree.
6.2.1 Fading channel model and analysisA number of models have been proposed for satellite mobile fadingchannels. Loo has proposed a model suitable for rural areas, whichassumes that the received signal consists of a shadowed direct component
Transmit Permission Control Scheme for Spread-Slotted Aloha 209
and a scattered diffuse component [19]. The direct component is affectedby log-normal shadowing, while the diffuse scattered component under-goes Rayleigh nonselective fading. Lutz et al. introduced a two-statemodel that is Rice in open areas and Rayleigh-log-normal otherwise [21].Vucetic and Du presented a Markov M-state channel model, where aMarkov chain is used to model long-term state transitions [25]. Also,Vucetic et al. presented a Markov channel model with M-states forintermediate circular orbit (ICO) satellite systems, where each state is alinear combination of log-normally distributed direct and ground-re-flected signals and a Rayleigh-distributed scattered signal [18].
Although all these models, as well as many others, have some speci-fications on the satellite system, here we use the model proposed by Lutzet al., which includes statistical results for different satellite elevationsand different environments and seems to be useful in LEO satellitesystems [21]. This model is described by the time-share of shadowing B;the fraction of time that the signal is shadowed. During the shadowedinterval, the channel is modeled as log-normal frequency nonselectiveRayleigh fading. In the unshadowed period of time-share 1 − B, thechannel is modeled as frequency nonselective Rician. The resultingprobability density function of the received signal power normalized tothe power of the signal in the absence of either fading or shadowing isthen given by the mixture density
fV(V) = 2(1 − B) √V ce−c(V + 1) I0(2c√V ) + 2B√V ce−cV (6.10)
where c is the direct-to-multipath signal power ratio (Rice-factor) andI0(⋅) is the modified Bessel function of the first kind and zeroth order. Theparameter V can be thought as the factor that shows the effects of fading:In a nonfading channel, it is a unity constant value; in a fading channel, itis a random variable with the probability density function given in (6.10).Note that the expected value of the normalized received power in theabsence of either fading or shadowing is unity.
Although this channel model can be used for both directions, uplinkand downlink, to make the effect of fading on the uplink clear, here weassume nonfading downlink channels. That way, users will have the exact
210 Low Earth Orbital Satellites for Personal Communication Networks
information on their distances to the satellites and transmit with theproper power level given in (6.3). Lutz et al. offer a complete discussionof the parameters c and B for different satellite elevations and differentenvironments [21]. This section considers c = 10 as a typical value forLEO satellite channels and B = 0.3 as a compromised value between largevalues (for an urban area) and small values (for a suburban or rural area),as used in [22,23].
According to (6.3), a user, namely the jth one, in the service area ofthe ith satellite and in the distance di,j from it, transmits a packet by thepower Ti,j to ensure the received power level S at that satellite in theabsence of fading. However, because of the fading, the level of thereceived signal from that user at the ith satellite may be different fromthe level S according to the level of fading. In this case, the signal of thejth user reaches the ith satellite with the level
Si, j = Ti, j κdi, j−β Vi, j (6.11)
where Vi, j is a random variable with the probability density function givenin (6.10). The signals of the users in the service areas of the neighboringsatellites in the line of sight of the ith satellite arrive at the ith satellitewith power levels related to the distances of each user from the twosatellites and also the level of fading. Without lack of generality, assumethat the kth user in the service area of the (i + 1)st satellite is one of thoseusers and has the distance di, k to the ith satellite and the distance di + 1, kto the (i + 1)st satellite. The user transmits packets by the power Ti+1,kto ensure the received power level S at the (i + 1)st satellite in the absenceof fading. Because of fading channel, the signal reaches the ith satellitewith the power
Si, k = Ti + 1, k κdi, j−β Vi, k (6.12)
where, again, Vi,k is a random variable with the probability densityfunction given in (6.10).
As mentioned in Chapter 4, to calculate the throughput, it is neces-sary to find the probability of packet success in the service area of each
Transmit Permission Control Scheme for Spread-Slotted Aloha 211

satellite. This probability was derived in Section 4.2.3 for nonfadingsatellite links. With the fading uplink channels defined in (6.10), now weshould find the probability of packet success, PC, i for the fading environ-ment. In the nonfading environment discussed in Chapter 4, the powerlevel of the target packet is the fixed value S, which appears in (4.18),(4.21), and (4.37). On the contrary, in the fading environment, it is arandom variable according to the random variable Vi, j, as described by(6.11). On the other hand, the total power of the interfering packets, Ii,is a random variable even without fading, as are the locations and thus thepowers at the satellite of m − n users of the neighbor satellites. Whenfading is considered, the total power of the m − n users are still randomvariables, but not only by the locations of the users but also because offading, as is denoted in (6.12). In addition to the m − n users outside theservice area, the level of the interference from each of the remaininginterfering users inside the service area also is not constant, but randombecause of the fading, as in (6.11). Considering those differences in thefading environment, we derive numerically the packet success prob-ability, PC,i, and find the throughput characteristics with (4.14). Notethat in the calculation, with the assumption of performing the analysisduring a short period of time and a reasonably high bit rate, we assumethat the fading varies slowly compared to the bit rate; hence, the receivedsignal power is considered constant during one symbol interval.
6.2.2 Numerical examples of the performance of the systemWith the mathematics given in Subsection 6.2.1, we now can evaluatethe performance of our LEO satellite system in a fading channel. For thesame parameters as in Figure 6.5, Figure 6.10 shows the normalized totalthroughput before and after application of the TPC scheme now in thefading channel with c = 10 and B = 0.3. For the TPC case, the two valuesof ρ = 0.7 and ρ = 0.6 are shown.
First we compare the performance of the conventional systems (i.e.,without the TPC scheme) in fading and nonfading satellite channels.Comparing the results of the case ρ = 1 shown in Figures 6.5 and 6.10,we can observe some throughput enhancements at heavy traffic loads inthe fading channel. One reason is that at heavy traffic loads the effect offading acts positively to improve the probability of the packet success by
212 Low Earth Orbital Satellites for Personal Communication Networks

decreasing the power of interference and thus to improve the throughput.On the other hand, at light traffic loads, fading decreases the totalthroughput slightly. At light offered traffic loads, the effect of fading onthe desired signal dominates over the level of interference, because in thiscase the number of interferers is small.
For the case utilizing the TPC scheme, as seen in Figure 6.10, in thefading channel the performance of the system at heavy traffic loads stillcan be improved. However, after application of the TPC scheme, becausethe number of transmitting users decreases, the achievable enhancementdue to fading in the TPC case becomes less than in the case without TPC.
0 20 40 60 80 100
Total Offered Traffic Load, q Nu⋅
ξ norm
0.0
0.2
0.6
0.4 ρ = 1.0
0.70.6
K( ) = 30
= 0.5
µω
c
Figure 6.10 Throughput performance with and without the TPC schemein fading channel.
Transmit Permission Control Scheme for Spread-Slotted Aloha 213

Moreover, with the TPC, the permitted users are mostly the ones withhigh elevation angles for which the effect of shadowing on attenuation ofthe power of the received signals is less. According to the results shownin both fading and nonfading channels, we can conclude that assuming afixed value of ρ at all offered traffic loads is not a good idea and that anadaptive selection of the maximum allowable propagation loss lmax mayresult in an optimum improvement at all traffic loads. Section 6.3proposes two schemes to adjust the value of ρ in an adaptive mannerand show their performance improvement in the case of LEO satellitesystems.
6.3 Adaptive transmit permissioncontrol schemesThe results shown in Figures 6.5 through 6.8 and Figure 6.10 illustratethe dependency of the effectiveness of the TPC method on the level ofthe offered traffic load: Higher offered traffic loads need smaller valuesof ρ to have better performance, and lighter traffic loads require largervalues of ρ. That fact implies that an adaptive selection of ρ according tothe total offered traffic load can improve the throughput performance ofthe system. In addition, in the case of nonuniform traffic distribution, ifwe see the throughput characteristics of individual satellites, for example,the satellite over the dense traffic area and its neighbor satellites over thesparse traffic areas, we can expect to find better performance by adaptiveselection of ρ for each satellite according to its level of the offered trafficload. For example, the throughput performances of a satellite with heavytraffic load and a satellite with light traffic load in an assumed nonfadingchannel are shown in Figures 6.11 and 6.12, respectively.
According to Figure 6.12, it is clear that for a satellite with light trafficloads and a given value of multiple-access capability it is not a good ideato select small values of ρ, such as ρ < 0.8, because in light traffic situationsall the transmissions can be received successfully at the satellite with highprobability of success, and prohibition from transmission to such asatellite only reduces the number of packets on air without any consid-erable improvement in packet success probability, thus degrading the
214 Low Earth Orbital Satellites for Personal Communication Networks

total throughput of that satellite. On the other hand, according toFigure 6.11, for a satellite with heavy traffic loads, it is better to selectsmaller values of ρ, which means limiting its service area more. For sucha satellite, selecting even very small values, such as ρ < 0.6, still improvesthe peak of the throughput performance.
The idea given from these two typical examples, that is, the selectionof ρ according to the traffic loads of individual satellites, in addition tothe idea in Figure 6.6, that is, the selection of ρ according to the totaloffered traffic load, induce the two possible adaptive methods on theselection of ρ. We refer to those methods as adaptive TPC (ATPC)methods [26,27].
6.3.1 ATPC method 1The first method considers the selection of ρ according to the change ofthe total offered traffic load of the three satellites. Similar to the basic
0 20 40 60 80 100Offered Traffic
K( ) = 30= 0.5µ
ωc
Thr
ough
put ρ = 1.0
without TPCmethod
30
20
10
0
0.90.8 0.7 0.6 0.5
0.4
Figure 6.11 Effect of the TPC on the throughput performance of thesatellite over the dense traffic area.
Transmit Permission Control Scheme for Spread-Slotted Aloha 215
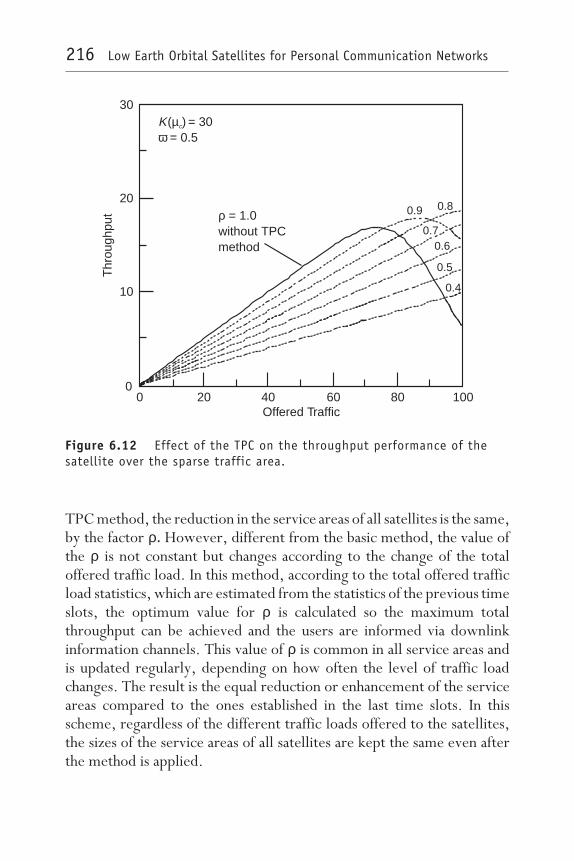
TPC method, the reduction in the service areas of all satellites is the same,by the factor ρ. However, different from the basic method, the value ofthe ρ is not constant but changes according to the change of the totaloffered traffic load. In this method, according to the total offered trafficload statistics, which are estimated from the statistics of the previous timeslots, the optimum value for ρ is calculated so the maximum totalthroughput can be achieved and the users are informed via downlinkinformation channels. This value of ρ is common in all service areas andis updated regularly, depending on how often the level of traffic loadchanges. The result is the equal reduction or enhancement of the serviceareas compared to the ones established in the last time slots. In thisscheme, regardless of the different traffic loads offered to the satellites,the sizes of the service areas of all satellites are kept the same even afterthe method is applied.
K( ) = 30= 0.5µ
ωc
ρ = 1.0without TPCmethod
0 20 40 60 80 100Offered Traffic
Thr
ough
put
30
20
10
0
0.9 0.8
0.70.6
0.5
0.4
Figure 6.12 Effect of the TPC on the throughput performance of thesatellite over the sparse traffic area.
216 Low Earth Orbital Satellites for Personal Communication Networks

6.3.2 ATPC method 2The second method considers the selection of ρ according to the changein the offered traffic load of individual satellites. Similar to the firstmethod, the statistics of the traffic load are used for determining theoptimum value for ρ. However, different from the first method, thedecision is not common for all satellites and is performed by each one andis valid only for that satellite. The optimum value for ρ in this method isthe value that makes the throughput of each satellite maximum. Thatmakes the satellite with lighter traffic loads select larger values for ρ. Thismethod is especially effective for the case of nonuniform traffic situations,in which different satellites have different total traffic loads. Obviously,in a uniform traffic scenario, the performance of this method agrees withthe performance of the first method, and the realization technical parame-ters select the best method. After this method is applied, the service areaof the satellite with the higher traffic load becomes smaller than that ofthe satellite with the lighter traffic load.
6.3.3 Performance of ATPC methodsLet us compare the performance of the system without the TPC methodwith the ones employing ATPC methods 1 and 2. Figure 6.13 shows theperformance of the system under the same conditions as Figure 6.5.Employing the first adaptive method maintains good performance at lightoffered traffic load by disabling the TPC (i.e., selecting ρ = 1) andimproves the throughput at higher offered traffic loads by graduallydecreasing the value of the ρ. As the offered traffic load increases, thevalue of ρ decreases equally for all three satellites. However, as shownin Figures 6.11 and 6.12, a decrease in ρ according to the total traffic loadis proper mostly for the satellite with high traffic load; a large decreasein the value of ρ is not suitable for the light traffic satellites. Contrarily,by employment of the second method, the value of ρ can be determinedfor each satellite independently; hence, the performance of the systemby the measure of the normalized total throughput improves morecompared with the first adaptive method. In the latter method weimprove the throughput of each satellite separately; hence, the methodexhibits better total throughput at the whole range of the offered traffic
Transmit Permission Control Scheme for Spread-Slotted Aloha 217

load. In other words, in the ATPC method 2, we assign a traffic load toeach satellite near to the traffic level that can be serviced by that satellite.This is the reason for its better performance.
Although the improved characteristics of the second adaptive methodare much more attractive than the first method, the implementation ofthe second method requires much more complexity. In the first method,the decision on the optimum value of ρ is based on the offered traffic loadin the area serviced by a group of satellites, for example, in the model ofthree satellites, which changes slowly; hence, the change in ρ also shouldperform slowly. However, for the second method, especially in a nonuni-form traffic situation, the offered traffic load to each satellite changesrapidly; then ρ must be changed often. A trade-off between such com-
0 20 40 60 80 100
Total Offered Traffic Load, q Nu⋅
Nor
mal
ized
Tota
l Thr
ough
put
0.6
0.4
0.2
0.0
K( ) = 30
= 0.5
µω
c
with ATPC-Method 2
with ATPC-Method 1
without TPC method
Figure 6.13 Comparison of the performance of the systems withoutthe TPC method, with ATPC-Method 1 and with ATPC-Method 2.
218 Low Earth Orbital Satellites for Personal Communication Networks
plexities and the differences in their performance improvement maydetermine the best method to be utilized in a real system.
6.4 SummaryFor the LEO mobile satellite systems in which the relative location of eachuser to the satellites changes rapidly, in this chapter we proposed a TPCscheme in which at given intervals of time the permission for transmissionis prohibited from a fraction of users. In this method, the permissioncondition of transmission for each user is determined according to itspropagation loss to its observable satellite(s). The TPC scheme is appli-cable in direct-sequence spread-slotted Aloha multiple-access systems,and it can be considered as a means of reducing the power of multiple-access interference and hence improving the throughput performance ofthe system. It was shown that with a proper selection of the maximumpropagation loss, beyond which a user is not allowed to transmit, themethod can improve significantly the throughput performance of theLEO satellite communication system, in both uniform and nonuniformtraffic situations. Moreover, the method is suitable for systems in whichthe satellites are faced with heavy traffic loads.
By calculating the average delay throughput performance in additionto the throughput performance, it was shown that although the methodseems to enlarge the delay time for transmission of a given packet, becauseof the high ground speed of the satellites in a typical low-Earth orbit, theincrease in the average delay time is only on the order of half of a packetlength, similar to conventional slotted Aloha systems.
By introducing a fading satellite channel model, which considers bothshadowing and multipath fading, and modifying the mathematics ofChapter 4, it was shown that at heavy traffic loads the fading decreasesthe power of interference received at each satellite and thus enhances thethroughput characteristics. Moreover, it was shown that the improve-ment in the throughput performance of the TPC scheme is kept evenunder assumptions of a fading channel. Because in the TPC scheme userswith relatively low elevation angles are prohibited from transmission, themethod is interesting in fading channels.
Transmit Permission Control Scheme for Spread-Slotted Aloha 219
In addition, this chapter proposed two new adaptive TPC schemesfor direct-sequence spread-slotted Aloha multiple-access systems. Themethods were applied on the uplinks of a LEO satellite communicationssystem, again with the assumption of a nonuniform traffic distribution. Itwas shown that the methods significantly improve the throughput char-acteristics of the system compared to the conventional spread-slottedAloha method and nonadaptive form of the TPC scheme and that theimproved characteristics can be maintained in a wide range of the offeredtraffic load. The proposed methods are proper mostly for packet datacommunications, in which the discontinuity in the communication canbe acceptable. If the number of satellites increases, the discontinuityperiods become shorter and the method becomes applicable even in voicesystems.
Although the mobility feature of LEO satellites makes the methodpractical here, the method can be applied in, for example, terrestrialcellular mobile communication systems, in which the base stations arefixed but the mobiles move around.
References[1] Makrakis, D., and K. M. Sundaru Murthy, “Spread Slotted ALOHA
Techniques for Mobile and Personal Satellite Communication Systems,”IEEE J. Select. Areas Commun., Vol. 10, No. 6, 1992, pp. 985–1002.
[2] Jamalipour, A., et al., “Transmit Permission Control Scheme forSpread-Slotted Aloha in LEO Satellite Communication Systems,” Proc. 2ndAsia-Pacific Conf. Commun. (APCC ’95), Osaka, Japan, 1995, pp. 848–852.
[3] Jamalipour, A., et al., “Adaptive Transmit Permission Control Scheme forSpread-Slotted Aloha Mobile Satellite Communication Systems,” Proc. 18thSymp. Inform. Theory Appl. (SITA ’95), Hanamaki, Japan, 1996, pp. 777–780.
[4] Gilhousen, K. S., et al., “Increased Capacity Using CDMA for Mobile SatelliteCommunication,” IEEE J. Select. Areas Commun., Vol. 8, No. 4, 1990,pp. 503–514.
[5] Viterbi, A. J., “A Perspective on the Evaluation Of Multiple Access SatelliteCommunication,” IEEE J. Select. Areas Commun., Vol. 10, No. 6, 1992,pp. 980–983.
[6] Kohno, R., R. Median, and L. B. Milstein, “Spread Spectrum Access Methodsfor Wireless Communications,” IEEE Commun. Mag., Vol. 33, No. 1, 1995,pp. 58–67.
220 Low Earth Orbital Satellites for Personal Communication Networks
[7] Jamalipour, A., et al., “Throughput Analysis of Spread-Slotted Aloha in LEOSatellite Communication Systems With Nonuniform Traffic Distribution,”IEICE Trans. Commun., Vol. E78-B, No. 12, 1995, pp. 1657–1665.
[8] Viterbi, A. J., “The Evaluation of Digital Wireless Technology From SpaceExploration to Personal Communication Services,” IEEE Trans. Vehic. Technol.,Vol. 43, No. 3, 1994, pp. 638–644.
[9] Jamalipour, A., et al., “Transmit Permission Control on Spread Aloha Packetsin LEO Satellite Systems,” IEEE J. Select. Areas Commun., Vol. 14, No. 9, 1996,pp. 1748–1757.
[10] Gilhousen, K. S., et al., “On the Capacity of a Cellular CDMA System,”IEEE Trans. Vehic. Technol., Vol. 40, No. 2, 1991, pp. 303–312.
[11] Simpson, F., and J. Holtzman, “CDMA Power Control, Interleaving, andCoding,” Proc. 41th IEEE Vehic. Technol. Conf., St. Louis, 1991, pp. 362–367.
[12] Joseph, K., and D. Raychaudhuri, “Stability Analysis of Asynchronous RandomAccess CDMA Systems,” Proc. IEEE GLOBECOM ’86, 1996, pp. 1740–1746.
[13] Joseph, K., and D. Raychaudhuri, “Throughput of Unslotted Direct-SequenceSpread Spectrum Multiple-Access Channels With Block FEC Coding,”IEEE Trans. Commun., Vol. 41, No. 9, 1993, pp. 1373–1378.
[14] Raychaudhuri, D., “Performance Analysis of Random Access Packet-SwitchedCode Division Multiple Access Systems,” IEEE Trans. Commun., Vol. COM-29,No. 6, 1981, pp. 895–901.
[15] Ganesh, R., et al., “Performance of Cellular Packet CDMA in an IntegratedVoice/Data Network,” Int. J. Wireless Infor. Networks, Vol. 1, No. 3, 1994,pp. 199–222.
[16] Abdelmonem, A. H., and T. N. Saadawi, “Performance Analysis of SpreadSpectrum Packet Radio Network With Channel Load Sensing,” IEEE J. Select.Areas Commun., Vol. 7, No. 1, 1989, pp. 161–166.
[17] Proakis, J., Digital Communications, 2nd ed., New York: McGraw-Hill, 1989.
[18] Vucetic, B., L. Zhang, and I. Oppermann, “Modeling and Simulation of ICOSatellite Communication Channels,” Proc. Int. Symp. Inform. Theory, Appl.(ISITA ’94), Sydney, Australia, 1994, pp. 493–497.
[19] Loo, C., “Measurements and Models of a Land Mobile Satellite Channel andTheir Applications to MSK Signals,” IEEE Trans. Vehic. Technol., Vol. VT-35,No. 3, 1987, pp. 114–121.
[20] Vogel, W. J., and E. K. Smith, “Theory and Measurements of Propagation forSatellite to Land Mobile Communication at UHF,” Proc. 35th IEEE Vehic.Technol. Conf. (VTC ’85), Boulder, CO, 1985, pp. 218–223.
Transmit Permission Control Scheme for Spread-Slotted Aloha 221
[21] Lutz, E., et al., “The Land Mobile Satellite CommunicationChannel—Recording, Statistics and Channel Model,” IEEE Trans. Vehic.Technol., Vol. 40, No. 2, 1991, pp. 375–386.
[22] Monk, A. M., and L. B. Milstein, “Open-Loop Power Control Error in a LandMobile Satellite System,” IEEE J. Select. Areas Commun., Vol. 13, No. 2, 1995,pp. 205–212.
[23] Vojcic, B. R., R. L. Pickholtz, and L. B. Milstein, “Performance of DS-CDMAwith Imperfect Power Control Operating Over a Low Earth Orbiting SatelliteLink,” IEEE J. Select. Areas Commun., Vol. 12, No. 4, 1994, pp. 560–567.
[24] Corazza, G. E., and F. Vatalaro, “A Statistical Model for Land Mobile SatelliteChannels and Its Application to Nongeostationary Orbit Systems,” IEEE Trans.Vehic. Technol., Vol. 43, No. 3, 1994, pp. 738–742.
[25] Vojcic, B. R., and J. Du, “Channel Modeling and Simulation in Satellite MobileCommunication Systems,” IEEE J. Select. Areas Commun., Vol. 10, No. 8, 1992,pp. 1209–1218.
[26] Jamalipour, A., et al., “Adaptive Transmit Permission Control onSpread-Slotted Aloha Packets Applicable in LEOS Systems,” IEICE Trans.Commun., Vol. E79-B, No. 3, 1996, pp. 257–265.
[27] Jamalipour, A., et al., “Throughput Performance Improvement ofSpread-Slotted Aloha in Mobile Satellite Communications,” Proc. IEEE Int. Conf.Commun. (ICC ’96), Dallas, TX, 1996, pp. 1740–1744.
222 Low Earth Orbital Satellites for Personal Communication Networks

Low Earth Orbital Satellites for Personal Communication Networks
7Further Considerations in LEO
Satellite Systems
T of this chapter proposes another method forimproving the throughput performance of a LEO satellite systememploying spread-spectrum techniques. We start the analysis in
Section 7.1 by discussing the effects of multiple-access interference onthroughput performance of a direct-sequence spread-spectrum LEOsatellite communications network. To recognize the effects of interfer-ences when their sources are either inside or outside the service area of asatellite, we develop a stochastic model for the location of users. Weshow that the effect of interference on the performance degradation fromthe users with large propagation distance to their connecting satellites isa dominant factor; hence, to improve the performance of the system, wepropose a method in which the transmissions of packets are controlledaccording to their distances to connecting satellites as well as trafficdistribution.
223

From Section 7.2 to the end of the chapter, we discuss different issuesin a LEO satellite system that have not been considered in detail in thepreceding chapters. Those issues include the power control, its imple-mentation, and the effects of its imperfections in a LEO satellite system;the design of LEO satellite systems with spot-beam antennas and theexpression for antenna gain; and the new issue of adaptive array antennasin LEO satellite systems.
For the issue of power control, in Section 7.2, we explain that becauseof large propagation delay in a LEO satellite system, the closed-looppower control is much less effective than the one employed in digitalterrestrial cellular systems. Moreover, the implementation of an accu-rate-enough power control in a LEO satellite system requires many moreconsiderations than in a terrestrial system.
Section 7.3 explains the LEO satellite systems with multibeam anten-nas. The method is an important feature for a system with high capacitybecause it reuses the limited frequency spectrum and decreases multiple-access interference. In a LEO satellite system, however, design of effec-tive spot beams requires many more considerations than terrestrialsystems, especially the one that is the focus of this book, that is geographi-cal nonuniformity in traffic distribution.
Section 7.5 introduces the issue of designing receivers with adaptivearray antennas, which has been recently proposed for LEO satellitesystems. This method can reduce the interference from undesired signals;however, in LEO satellite systems employed in the future PCNs withsmall hand-held terminals and wideband spread-spectrum signals, therewould be some problems, which also are discussed in this section.
7.1 Packet admission control schemeThe preceding chapters introduced several methods for improving theperformance of LEO satellite systems, both in uniform and nonuniformtraffic situations. Chapter 6 proposed the family of TPC schemes, inwhich permissions for transmission of packets are controlled accordingto the propagation distance between users and their nearest satellites.This section proposes another method for improving the throughputperformance of these systems, packet admission control (PAC), which has
224 Low Earth Orbital Satellites for Personal Communication Networks
some similarities with the TPC scheme. In the PAC method, transmis-sions of packets are controlled according to the traffic distribution inaddition to the distance of users to their connecting satellites. In thissection, we modify our traffic model to a three-dimensional one anddiscuss the performance of the satellite system under heavy traffic situ-ations and the effect of multiple-access interference on its throughputperformance. Although there are some similarities between the systemand the traffic models in this section and the ones used in previouschapters, we will explain the models briefly to highlight the differences.
7.1.1 System and traffic modelsWe are concerned with a multiorbit, multisatellite global communica-tions network in which satellites are on LEOs of the altitude h. Thenumber of orbits and the number of satellites on each orbit are designedso that any area on the globe is covered by at least one satellite at anygiven time. Users’ terminals have the capability of direct access withsatellites in both uplink and downlink directions. That assumption isrealistic in the case of LEO satellite systems, because the low altitude ofthe satellites (i.e., the low propagation distances between users andsatellites) allows low-power, hand-held personal terminals. We alsomake the preliminary assumption that any user communicates with thesatellite that requires the lowest transmitting power, to minimize thetotal power of interference on the channel. Note that in a nonfadingsituation, that assumption means equal-size service areas for all satellites.
To establish a connection between a user and a satellite, it is necessaryfor the user to have an elevation angle larger than a minimum value θmin
to that satellite. The minimum elevation angle provides an upper boundon the service area of each satellite, which will be determined for asatellite system according to the constellation parameters, such as thenumber of orbits, the number of satellites, and their altitudes, as well asthe access method utilized in the system.
We consider the performance of the LEO satellite system on itsuplinks, that is, from users to satellites, in heavy traffic situations. In thisdirection, the management of multiple access of a large number of userstransmitting packets to a single satellite directly affects the performanceof the system. On the other hand, on the downlinks, any satellite can
Further Considerations in LEO Satellite Systems 225
manage the flow of messages to users carefully in any traffic situations,by some conventional scheme such as TDMA or FDMA. If we considerthe performance of uplinks in such a satellite system in which spreadspectrum is employed for multiple accessing of users, the signal of anyuser located in the view of a satellite can be reached at that satellite andadded to level of multiple-access interference at that satellite. Therefore,for any satellite, we should consider an interference area, the radius ofwhich is defined by the elevation angle of zero.
We assume that our LEO satellite communications system operatesunder heavy traffic conditions and that a perfect power control mecha-nism is employed on uplinks. The system is slotted, and the packet lengthsare assumed to be equal to the size of the slots. It also is assumed that theslot duration is sufficiently large to allow a preamble for spreading codeand carrier synchronization. In each time slot, each user transmits apacket with a composite probability of q; that is, the probability oftransmitting new packets and retransmitting failed packets from pastslots. We are interested in calculating the performance of the system overmany different changing topologies rather than for a specific terminalconfiguration. We especially are interested in examining the effect ofinterference from the terminals located inside the service area of a givensatellite and the ones located outside that service area. As a result, weobtain statistical performance values over a set of topologies. To do that,we model the location of any user by a two-dimensional random variablethat has a polar angle uniformly distributed between [0, 2π) and theprobability density of its distance to the origin has a normal-shape functionof
fR(ru) = A
ωexp
−ru2 ⁄2ω2
(7.1)
where ru is the distance of a user from the point that has the highestprobability for the existence of users, which we refer to as the origin; ωis a parameter that shows how dense the terminals are distributed aroundthe origin; and A is a parameter that makes the total probability of theexistence of a user in the area under consideration equal to 1. The areaunder consideration here is a circle centered at the origin whose size isequal to the size of the interference area of a single satellite. With the
226 Low Earth Orbital Satellites for Personal Communication Networks

assumption of equal-size service areas of satellites, the actual service areaof each satellite has a near-hexagonal shape. Therefore, we define theequivalent service area as a hexagon with the center of the origin and thesize of service area of a single satellite. We will evaluate the performanceof the satellite system by counting the average number of packets success-fully received at the satellite(s) covering the equivalent service area duringa given period of time and refer to that measure as throughput.
Figure 7.1 shows the configuration of the service areas of the satellitesat the instant when the service area of a satellite completely covers theequivalent service area. Note that since LEO satellites are in continuousmotions, the situation shown in the figure is only an instantaneousconfiguration. Also note that because of the spherical shape of the globe,
Xru
ConsideredArea Aroundthe Origin
EquivalentServiceArea
Upper Bound of aSingle-SatelliteService Area
Origin
Satellite
Satellite Satellite
Satellite
Satellite
Satellite
Satelliteα
User
Figure 7.1 Configuration of service areas in the LEO satellite system.
Further Considerations in LEO Satellite Systems 227

to calculate the interference power from the terminals located outsidethe service area of a given satellite, it is enough to consider some portionsof users located in the service areas of immediate neighbors. For example,at the instant shown in Figure 7.1, it is necessary to consider only thepower of interference from users in the area indicated as “considered areaaround the origin.” That area is equal in size to the interference of a sin-gle satellite. Then, for the satellite constellation parameters used inSubsection 7.1.2, for example, the size of this area will about 1.7 timesthe service area of a single satellite.
With this model, we can compare the effects of interference of theusers when they are either inside or outside the equivalent service areaon the throughput performance. After that comparison, we propose ourmethod for improving the throughput performance.
7.1.2 Evaluation of heavy-traffic performanceThis section shows the effect of multiple-access interference on thethroughput performance of our satellite system. Throughout the follow-ing examples, a typical LEO satellite system with 6 orbits and 11 satelliteson each orbit is considered. The orbit height, h, is 800 km, and theminimum elevation angle, θmin, that users can connect to the satellites is10. The total number of users, Nu, in the area under consideration is 100.Because we are interested in comparing the effect of interferences whentheir sources are inside or outside the equivalent service area, we use ω,defined in (7.1), as a parameter in the numerical examples. In mostexamples, we use typical values of 0.2, 0.5, and 0.75, which denotenonuniform high traffic situations; and ∞, which shows a uniform trafficsituation.
Figures 7.2 and 7.3 show the normalized throughput, ξnorm, which isthe normalized value of the throughput by the expected number of usersin the equivalent service area, of an unfaded channel as a function ofcomposite transmission probability1, q with ω as a parameter, for twovalues of the multiple-access capability K(µc) = 20 and 30 (see Chapter 4for more details on the throughput calculations). In the figures, thethroughput characteristics are shown for two cases that the interferences
228 Low Earth Orbital Satellites for Personal Communication Networks
1. Note that the composite packet transmission probability q can be translated as thefraction of the total number of users transmitting simultaneously.
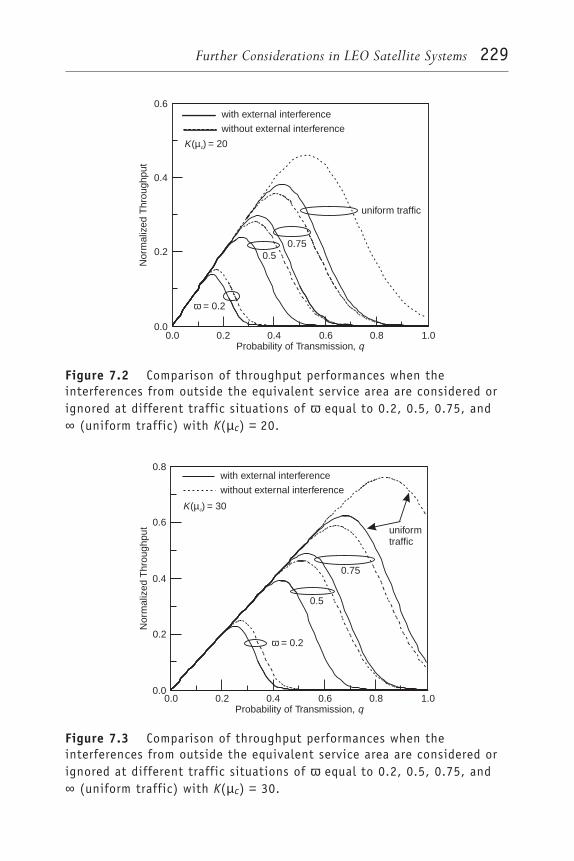
Nor
mal
ized
Thr
ough
put
0.6
0.4
0.2
0.0
K( ) = 20µc
with external interference
without external interference
0.0 0.2 0.4 0.6 0.8 1.0Probability of Transmission, q
uniform traffic
0.750.5
ω = 0.2
Figure 7.2 Comparison of throughput performances when theinterferences from outside the equivalent service area are considered orignored at different traffic situations of ω equal to 0.2, 0.5, 0.75, and∞ (uniform traffic) with K(µc) = 20.
with external interference
without external interference
K( ) = 30µc
0.0 0.2 0.4 0.6 0.8 1.0Probability of Transmission, q
Nor
mal
ized
Thr
ough
put 0.6
0.8
0.4
0.2
0.0
uniformtraffic
0.75
0.5
ω = 0.2
Figure 7.3 Comparison of throughput performances when theinterferences from outside the equivalent service area are considered orignored at different traffic situations of ω equal to 0.2, 0.5, 0.75, and∞ (uniform traffic) with K(µc) = 30.
Further Considerations in LEO Satellite Systems 229

from users outside the equivalent service area are either considered orignored. Comparing the results of those two cases, we can see that theeffect of interferences from surrounding service areas on the throughputperformance degradation increases as the traffic distribution of usersbecomes more uniform. We can see that the largest difference in theperformance of the system occurs in the uniform traffic distribution inwhich the number of users outside the equivalent service area reaches itsmaximum value.
In uniform traffic distribution, any user may be at any point inside thearea under consideration with equal probability. However, in nonuni-form traffic distributions, users mostly are located around the origin withhigh probabilities. Considering the evaluation period assumed in ouranalysis, that means that in nonuniform traffic distribution, we can expecta larger number of users with short propagation distances to their con-necting satellites than in the uniform traffic situation. According to thisdiscussion along with other numerical comparisons not shown here, wehave confirmed that the interferences from users large distances fromtheir connecting satellites have the dominant effect on the throughputperformance in LEO satellite systems.
The other fact drawn from the two figures is the low throughput inthe equivalent service area in the nonuniform traffic situation due to highmultiple-access interferences. In that situation, most of the time, largenumbers of packets are transmitted to a single satellite; hence, theirprobabilities of success decrease significantly.
For a LEO satellite system in which the effect of shadowing is alsoconsidered, different and interesting results can be derived. Shadowingof signals from users to satellites, caused by obstacles in paths betweenusers and satellites, reduces the power of the received signal over the totalsignal bandwidth and its effects become larger as the elevation angledecreases. Because the reduction in power occurs not only for the taggedpacket but also for interferers, in the case of a large number of interfererswith low elevation angles, shadowing may decrease the power of inter-ference and hence improve the throughput performance. To examine theeffects of shadowing, we apply the fading model of [1], which wasintroduced in Section 6.2 with c = 10 as a typical value for LEO satellitechannels and B = 0.3 as a compromised value between large values (foran urban area) and small values (for a suburban or rural area). Figure 7.4
230 Low Earth Orbital Satellites for Personal Communication Networks

compares the performance of a system in a nonfading channel to that ina faded channel for different traffic situations. As shown in the figure, thethroughput performance in a fading channel is better than that of thenonfading one. The difference becomes larger when the traffic is moreuniform. In a uniform traffic situation, the number of interferers withlow elevation angles is larger than the number of those with nonuniformtraffic distribution, which means lower power of interference and higherthroughput. Because shadowing significantly reduces the power of inter-ferences from users with low elevation angles, we can expect closethroughput performances in the cases of shadowing assumption andignore the external interference, as seen in Figures 7.3 and 7.4.
Nor
mal
ized
Thr
ough
put
0.6
0.8
0.4
0.2
0.00.0 0.2 0.4 0.6 0.8 1.0
Probability of Transmission, q
fading with B = 0.3 and c = 10
non-fading
K( ) = 30µc
uniform
traffic
0.5
ω = 0.2
Figure 7.4 Comparison of throughput performances of fading andnonfading satellite channels at different traffic situations of ω equal to0.2, 0.5, and ∞ (uniform traffic) with K(µc) = 30.
Further Considerations in LEO Satellite Systems 231
7.1.3 Concepts of the schemeIt has been shown that the power of the interference from users out-side the equivalent service area has significant effect on degradation ofthe throughput performance of the system. Therefore, to improve thethroughput performance of the system, we should reduce the interfer-ence effects. In Chapter 6, we proposed a TPC scheme in which thenumber of users with large propagation distances to their connectingsatellites is decreased by prohibiting their transmissions until their propa-gation losses to connecting satellites fall under some threshold value.With the TPC, users of a satellite communication system at any instantare divided into two groups: permitted and unpermitted. With thatmethod, we showed that the throughput performance of the system canbe improved significantly. The TPC scheme makes use of the mobilitynature of LEO satellites, which means the change of the permissioncondition for each user according to time.
This section proposes another scheme, PAC [2,3], in which, unlikethe TPC, there is no prespecified unpermitted area, but the followingtwo constraints are applied:
Users with shorter propagation distances to their connecting satel-lites are honored with higher probability for transmission.
The degree of priority for transmission of closer users over distantusers is moreover controlled according to the traffic distribution ofusers in the area under consideration.
The first constraint aims to provide a higher probability of transmissionto the users who require low-power transmitting signals, to decrease thetotal power of interference at each satellite. On the other hand, thesecond constraint is necessary to control the degree of priority given tothe closer users by the first constraint. In the absence of the secondconstraint, even with a small number of users with short propagationdistances, their priorities for transmissions are high. The second con-straint biases those priorities to ensure more transmission from areas withmore users in the case of nonuniform distribution of users.
232 Low Earth Orbital Satellites for Personal Communication Networks

There should be several approaches consistent with those two con-straints. For an example of the PAC method that provides those twoconstraints, assume that in each slot each user may transmit a packet withprobability qε instead of the simple probability of transmission, q, con-sidered before. The parameter ε is a random variable between [0, 1] withthe probability density function fE(ε), which calculates by each user at thetime of transmitting a packet according to traffic information providedby satellites on downlinks. A simple form of the random variable ε thatsupports the two constraints of the PAC is a linear function of the locationof users, ru, which is itself a random variable, such as
ε(ru) = 1 −rur0
(7.2)
where r0 is the radius of the equivalent service area and ru ≤ r0. From(7.2), the probability distribution function of ε can be determined fromthat of the random variable ru, in the form of
FE(ε) = P[E ≤ ε] = FR[r0(1 − ε)] (7.3)
The linear relation of ε to ru in (7.2) provides a higher probability oftransmission for closer users in uniform traffic situations (i.e., the firstconstraint) because of capture of the traffic by the close satellite. More-over, in nonuniform traffic distribution, larger values of ε are given tousers located in the dense traffic areas.
7.1.4 Performance of the scheme
Let us now evaluate the throughput performance with the random packettransmission of the PAC method defined in Subsection 7.1.3 by numericalexamples. In these examples, we assume the same parameters as thoseused in the examples in Subsection 7.1.2. Figures 7.5 and 7.6 show thenormalized throughput as a function of the composite packet transmis-
Further Considerations in LEO Satellite Systems 233
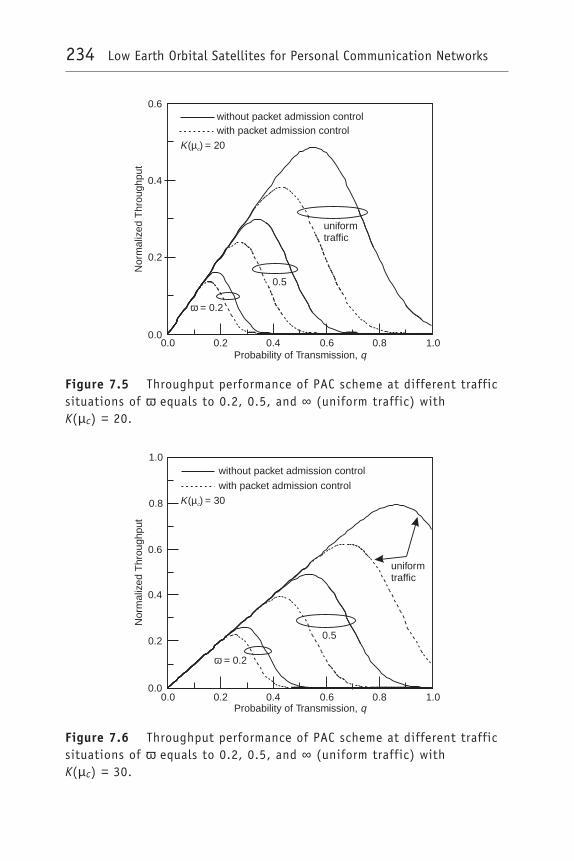
0.0 0.2 0.4 0.6 0.8 1.0Probability of Transmission, q
Nor
mal
ized
Thr
ough
put
0.6
0.4
0.2
0.0
without packet admission controlwith packet admission control
K( ) = 20µc
uniformtraffic
0.5
ω = 0.2
Figure 7.5 Throughput performance of PAC scheme at different trafficsituations of ω equals to 0.2, 0.5, and ∞ (uniform traffic) withK(µc) = 20.
without packet admission control
with packet admission control
K( ) = 30µc
Nor
mal
ized
Thr
ough
put
0.6
0.8
1.0
0.4
0.2
0.00.0 0.2 0.4 0.6 0.8 1.0
Probability of Transmission, q
uniformtraffic
0.5
ω = 0.2
Figure 7.6 Throughput performance of PAC scheme at different trafficsituations of ω equals to 0.2, 0.5, and ∞ (uniform traffic) withK(µc) = 30.
234 Low Earth Orbital Satellites for Personal Communication Networks
sion, q, with ω as a parameter, for K(µc) = 20 and 30, respectively, in anunfading channel assumption. As shown in the figures, assignment ofhigher packet admission probabilities to users with short propagationdistances significantly improves the throughput characteristics in all traf-fic situations. In the case of ω = 0.2, however, the performance improve-ment is rather small, since in that highly nonuniform traffic situation, thenumber of users with almost the same propagation distances to theirconnecting satellites at any time is large. It is interesting to note that byemploying the PAC method, the throughput performances approach theones found by the assumption in Section 7.1.2 of no interference fromusers outside the equivalent service area. Realization of such an assump-tion requires sharp antenna beams to reject interference from undesiredareas, but with the PAC method, we can realize the same situation by softrejection of interferences.
One may be interested in a comparison between the performance ofthe TPC and PAC schemes or in the performance of the PAC schemeunder fading situation. For the former one, we should note that the TPCaims to improve the performance of the system, not of individual satel-lites, in nonuniform traffic situations. With the PAC, however, we canimprove or maintain the performance of each satellite in different trafficdistributions. Therefore, an exact comparison between the two schemesis a complicated task that requires further analyses. Regarding the per-formance of the PAC under fading conditions, for the LEO satellitechannels it requires a more specific model than the one presented here.However, as the PAC decreases the number of users with low elevationangles, it will exhibit better performance under fading situation.
Considering the high ground speed of LEO satellites, the highertransmission priorities given to users with short propagation distances totheir connecting satellites in the PAC method would not significantlyaffect the delay performance of the system. That is because of the higherprobability of packet success realized with the PAC, which decreases theaverage number of retransmissions for each user. Moreover, because weare considered a slotted system, any increase in delay due to the PACmethod may be included in the waiting time until the start point of thenext slot, similar to the results shown in Chapter 6 for the case of TPCmethods.
Further Considerations in LEO Satellite Systems 235
7.2 Power control
7.2.1 The near-far problemIn digital terrestrial cellular systems employing CDMA, the most seriousdifficulty that directly affects the total capacity of the system, is thenear-far problem. In such a multiuser CDMA system, all users arecontending for the same bandwidth at the same time, and then usersinterfere with each other, which is referred to as the multiple-accessinterference effect. In a wireless communication system, the propagationloss law implies that the received power decreases as the distance betweentransmitter and receiver increases, which can be described by the follow-ing relation:
Pr ≈ d−β Pt (7.4)
where Pr and Pt are the received and the transmitted powers, respectively;d is the distance between receiver and transmitter; and β is the propaga-tion loss factor. In a system with almost direct line of sight, such as asatellite system, the value of β is about 2; however, in terrestrial cellularsystems, the value of β is in the range of 2 to 5. In the latter case, the radiowaves are reflected or partially absorbed by obstacles between receiverand transmitter as well as the surface of the Earth; hence, larger valuesfor β result.
Due to the propagation loss law, if two users, one close to the basestation and the other far from the base station, transmit with equal powerlevels, the received power at the base station from the closer user willalways be much stronger than that of the more distant user. Therefore,signals from the more distant user are masked by interference from thecloser user. This problem is referred to as the near-far problem and is themost important problem facing CDMA systems. To maximize the capac-ity of such systems, system resources should be shared equitably amongusers, which means we should provide an appropriate solution for thenear-far problem.
There are a number of methods to solve the near-far problem inCDMA systems, perhaps chief among them the well-known power
236 Low Earth Orbital Satellites for Personal Communication Networks

control method [4–15]. The power control on reverse links, which weused as a basic assumption in preceding chapters, is a method with whichwe can equalize the received power from all transmitters at the basestation. The most serious problem facing power control is the realizationof a perfect power control that can result in equal-level power from alltransmitters at the receiver in all situations (e.g., fading channels) isdifficult, even impossible. As we show soon, imperfections in powercontrol in a CDMA system significantly decrease the capacity of thesystem.
Because the near-far problem occurs mostly in CDMA systems,which employ correlation receivers to solve the problem, designs ofreceivers other than the correlation receiver have been proposed [16–22].Those methods consider different interference cancellation algorithms,such as parallel or successive, and receivers with decorrelators. We donot discuss these methods in this book and suggest the reader see thereferences for more details. The following subsections focus the discus-sion on the power control method and the effects of imperfections in thatmethod.
7.2.2 Implementation of power control
Power control is the most well-known method for alleviating the near-farproblem in CDMA systems with correlation receivers. Generally, powercontrol should be designed in both uplinks and downlinks in such systemsto avoid the near-far problem. In general, there are two methods ofpower control: the open loop and the closed loop. Considering the powercontrol on uplinks from users to base stations, in the open loop each useradjusts the transmit power based on the level of received power from thebase station. In the closed loop, the base station commands users to eitherincrease or decrease their power, which is based on the level of the signalreceived from each user.
One method of implementation of power control that has beenreported in terrestrial cellular systems is the use of pilot signals transmit-ted by base stations [8]. In those systems, the base station sends a pilotsignal with a nominal level, and each user monitors the power of thatsignal. According to that power level, the user transmits a signal at aninitial power level corresponding to the nominal level of the pilot signal
Further Considerations in LEO Satellite Systems 237

and the received level. In a cellular system with relatively large cells, itis reported that a user should be capable of controlling transmitting poweras much as 80 dB in some situations [8].
There are two significant difficulties in the implementation of thatsimple method. The first one, which is common in both terrestrial andsatellite systems, is that the condition of channels in downlinks anduplinks may not be the same. That is, the pilot signal on the downlinkexperiences different fading variations than that of the transmitting signalfrom the user on uplinks. Moreover, the fading on the uplink usually isuncorrelated with that on the downlink, since the uplink and downlinkfrequency bands usually are separated by more than the coherencebandwidth of the channel. The second problem, which is more critical inthe case of satellite systems, is the duration of the power control process.The variations due to Rayleigh fading usually are too rapid to be trackedby the closed-loop power control. That is particularly almost impossiblewhen we consider LEO satellite systems with a round trip much largerthan that in a terrestrial system, on the order of 10 ms for a 780-kmaltitude to 60 ms for a 1,500-km altitude at lower elevation angles. Thevariations in relative path losses and shadowing effects, however, gener-ally are slow enough to be controlled when they are modeled as anattenuation with log-normal distribution. Therefore, for LEO satellitesystems, closed-loop power control is much less effective than it is on aterrestrial channel. When closed-loop power control is not possible fora LEO satellite system, achieving an acceptable accuracy level of powercontrol based on an open-loop approach requires much more work.
Another significant difference between a terrestrial channel and aLEO satellite is that the multipath delay spread in a LEO satellite channelis more than that of a terrestrial channel, on the order of 100 ns.Therefore, the coherence bandwidth of the satellite multipath channel isat least 10 MHz, which means that, in a CDMA design, mitigating themultipath spreading by an amount greater than 10 MHz is required in thecase of LEO satellite systems [30].
7.2.3 Effects of imperfections in power control
Imperfection in power control and its effect on the capacity of a systemhave been widely studied in CDMA-based terrestrial systems [5,23–29].
238 Low Earth Orbital Satellites for Personal Communication Networks
In the case of LEO satellite systems, there are several reports in theliterature [30,31]. In practice, the power control exhibits some imper-fections that result in different received powers from users at the basestation. The imperfections in power control can be measured by thelogarithmic standard deviation of the received power, Pr, σ, which in thecase of perfect power control is equal to zero. Usually the received poweris described by a log-normal distributed random variable in the formof [25,26]
f(Pr) = 1√2π σPr
exp−
ln(Pr)2σ2
(7.5)
In [26], it is reported that for the reverse link of a slotted directsequence CDMA cellular system with a processing gain of 255 and 200users per cell, the maximum value of throughput2 of each cell, defined asthe average number of successfully received packets per time slot, is about28 for a perfect power control system but decreases to 18 and 13 due toimperfection in power control of σ = 2 dB and σ = 4 dB, respectively.Moreover, it is shown that the delay performance of a cellular systemdegrades significantly as the power control error increases.
In the case of LEO satellite systems, usually a time-shared mixturedensity function is used to model the multipath fading and shadowingchannel. That model has been proposed in [1] and was explained inChapter 6. In the model, it is assumed that in the shadowed fraction oftime, B, the channel is log-normal Rayleigh fading, whereas in theunshadowed period, 1− B, it is Rician. Then, for a land-mobile satellitechannel, the probability density function of the received amplitude canbe described by
fR(R) = 2BRce−cR2
+ 2(1 − B)Rce−c(R2 + 1) I0(2Rc) (7.6)
where c = As/2σs2, As is the amplitude of the specular component of the
Rician part of the density, 2σs2 is the average power in the scatter
Further Considerations in LEO Satellite Systems 239
2. Maximum value of throughput in a packet communication system is usually called thecapacity of the system.
component of the fade, and I0(⋅) is the modified Bessel function of thefirst kind and zeroth order. Borrowing the notations used in [30], if wedenote the nominal received power in the absence of either fading orshadowing by Snom, then in the absence of shadowing but in the presenceof Rician fade, the average received power is
Savns = Snorm1 + 1
c
(7.7)
If the user is shadowed, the received power is
Savs = Snorm
1c
(7.8)
Usually the power control cannot track the power variations due tomultipath fading, but it can track the variations due to the shadowing.Then, during the shadowing period, each user multiplies transmittedpower by
p =Savns
Savs= 1 + c (7.9)
Vojcic et al. have given a complete analysis for the bit error rate fora direct sequence CDMA in a LEO satellite system in which the footprintof each satellite is partitioned by spot beams considering both uncodedand convolutional coded CDMA system [30]. In their paper, they re-ported that with a processing gain of 150 of an uncoded CDMA andtypical values of c = 10 and B = 0.3, even with relatively small powercontrol error on the order of 0.5-dB standard deviation, there is a largedifference between the number of users that can simultaneously be activein each spot beam in shadowed and unshadowed conditions. Even withthat small power control error, users of the satellite system cannotachieve the bit error rate of 10−3 in Eb/N0 = 30 dB. It is also shown thatthe performance of unshadowed users is more sensitive to variations of
240 Low Earth Orbital Satellites for Personal Communication Networks
power control error, because the performance of shadowed users isdominated by the effect of fading.
In the case of a CDMA system with a convolutional code of the rate1/3 and constraint length 8 with maximum likelihood decoding in thereceiver, it is shown in [30] that with a single satellite visible to users atany time, only 10 users can be supported with a bit error rate of 10−3 in2-dB standard deviation of power control error. If under the sameconditions more accurate power control is employed so that a standarddeviation of 0.5 is available, then about 35 users can be supported in eachspot beam. This shows that the capacity of the LEO satellite systems, thatis, the number of simultaneous users, is very much affected by the degreeof imperfection in power control. Vojcic et al. concluded that thedirect-sequence CDMA will be a viable multiple-access technique in LEOsatellite systems if sufficient interleaving, relatively good power controlmethods that provide a standard deviation in power control error lessthan 2 dB, and dual diversity that is visible to more than one satellite peruser at all times can be employed.
We should mention that in the case of LEO satellite systems muchmore care should be taken during the implementation of power controlthan is required in terrestrial cellular systems. The satellite channel hasmore fading variations than that of a terrestrial system, and the accuracyin power control significantly affects the capacity of the system. If aperfect power control is too expensive or too difficult to implement inCDMA-based LEO satellite systems, then the design of receivers basedon other methods than the correlation receiver would be a better choice.
7.3 Multibeam LEO satellitesAs introduced in Chapter 2, many proposals for the LEO satellite systemconsider multiple spot beams, which partition the footprints of satellitesinto smaller cells. On the other hand, all the analyses presented in thisbook consider single-beam antennas. The question is how the partitioningof the footprints into smaller cells affects the results. This section presentsa brief discussion of the issue of antenna gain; after that, we examinedifferent aspects of multibeam satellite systems.
Further Considerations in LEO Satellite Systems 241
7.3.1 General expression for antenna gainEvaluating the change in the performance of a satellite system due topartitioning the footprints of satellites by spot beams directly requiresknowledge of antenna theory. Although the aim of this book is not todiscuss the issue of antenna design, we present it here briefly.
The gain of an antenna is defined as the ratio of the power per unitsolid angle radiated in a given direction from the antenna to the powerper unit solid angle radiated from an isotropic antenna supplied with thesame power [32]. The isotropic antenna is a hypothetical antenna thatradiates radio waves of a constant strength in every direction, or in 4πsteradians. Such an antenna is used as the reference for microwaveantenna gain; it cannot, however, be realized physically because it couldnot create transverse polarized electromagnetic waves. Assume the radi-ated field in the direction (α, φ ) (α is the angle between the considereddirection and the one in which maximum power is radiated, often calledthe boresight; φ is the phase) as F (α, φ), then the gain of the antenna at theangle α ,G (α, φ), is given by
G(α, φ) =F(α, φ)
P0⁄4π(7.10)
where P0 is the total power radiated by the test antenna. If the totalradiated power of a transmitting source is Pt, then
D(α, φ) = F(α, φ)Pt⁄4π
(7.11)
expresses the directivity, and
G(α, φ)D(α, φ)
=Pt
P0= η (7.12)
expresses the aperture efficiency.In general, the value G(α0, φ0) in (7.10) in the direction (α0, φ0) where
a maximum radiation occurs is simply called the gain. Although there maybe more than one direction in which the maximum radiation occurs,usually the gain of an antenna is defined in the direction of the boresight
242 Low Earth Orbital Satellites for Personal Communication Networks

of the antenna, that is, the value of G at angle α = 0 [33]. The gain of anantenna having the physical aperture area of A is expressed by
G = 4πλ2 Aη (7.13)
where λ is the wavelength. The coefficient η is the aperture efficiency;therefore, Aη represents the effective aperture area. If the aperture is adisk of diameter D, then (7.13) can be written as
G =
πD
λ
2
η (7.14)
The gain is normally expressed by a value in decibels in reference tothe isotropic antenna, that is,
G = 10log10η
πD
λ
2
(7.15)
The coefficient 4π/λ2 in (7.13) is called the universal constant [34],which universally lies between the gain and the effective area of all kindsof antennas. If G = 1 and η = 1, (7.13) becomes A0 = λ2/4π. Therefore,A0 can be interpreted as the effective area of the isotropic antenna; thenit is called the isotropic area. The product of PtGt, where Gt is the gain of alossless antenna, often is called the effective isotropically radiated power(EIRP) and describes the combination of the transmitter and the antennain terms of an equivalent isotropic source with power PtGt, in watts,radiating uniformly in all directions.
7.3.2 Spot-beam antenna gain
This subsection discusses the antenna gain in a LEO satellite system withspot-beam antennas. Assume that the total number of satellites in a LEOconstellation, that is, the multiplication of the total number of satellitesin each orbit and the number of orbits, is Nts and the footprint of eachsatellite is partitioned into Nc cells. Then, any specified cell on the Earthcan be identified by the couple (j, k), where j = 1, …, Ncand k = 1, …, Nts.
Further Considerations in LEO Satellite Systems 243

Each cell is covered by the main lobe of a spot beam whose gain, Gj(α),is related to the normalized far-field radiation pattern, Fj(α), by [35]
Gj(α) = GMj Fj2(α) (7.16)
where α is the angle between the main (central) beam direction orboresight (see Figure 7.7) and GMj is the maximum gain of the jth spot.Each spot beam may have different patterns to compensate for thedifferent angles of incidence and free-space losses. By modeling theradiation patterns through suitable masks enveloping the maxima of thegeneric tapered-aperture antenna radiation pattern, Fj(α) would be [35]
Satellite
Main direction ofthe central spot beam(boresight)
A sample spot beamat its 3dB limits
i-th user
αi
Figure 7.7 Illustration of different definitions in spot beamconfiguration.
244 Low Earth Orbital Satellites for Personal Communication Networks

Fj(α) = F(uj) = (p + 1)(1 − T)(p + 1)(1 − T) + T
⋅
2J1(uj)uj
+ 2p + 1p!T
1 − T
Jp + 1(uj)
ujp + 1
(7.17)
where uj = πdaj sin θ/λ, Jp(u) is the Bessel function of the first kind andorder p, T is the aperture edge taper, daj is the effective aperture diameterof the jth spot, and λ is the wavelength.
If da1 denotes the effective aperture diameter for the spot coveringthe subsatellite point, daj can be evaluated as [35]
daj
da1= 1 + c
1 +
rjrmin
ε
(7.18)
where rj is the distance between the jth spot boresight intersection onEarth and the subsatellite point; rmin is the minimum value for rj; c is aconstant equal to 0.05; and ε is an empirical function of the satellitealtitude h; and the elevation angle, θ, in degrees defined as
ε = ε(h, θ) = 3.39 − 0.0385θ − 0.748log10(h⁄h0), ε ≥ 1 (7.19)
with h0 = 1,000 km. Figure 7.8 is an example of the spot-beam radiationdiagram, F(u), for T = 20 and p = 2 [35]. The presence of sidelobes seenin the radiation diagram results in cochannel interference between adja-cent cells and implies nonideal angular selectivity of the spot beams. In[35], there are also some mathematical analyses on the level of carrier-to-interference ratio in the case of spot-beam antennas.
7.3.3 Performance of spot-beam antennasLet us now discuss the effect of spot-beam antennas on the performanceof the system. The idea of having multiple cells within the footprint of asatellite in a CDMA-based system is to increase the total capacity of thesystem by limiting the number of interfering users to those inside eachcell. In that manner, the approach of spot-beam antennas can be assumedas an interference cancellation method, which is studied widely in theliterature [35–46]. Generally, we can assume two kinds of frequencyallocation in a multicell CDMA system. The first one is to assign the same
Further Considerations in LEO Satellite Systems 245

frequency band in all cells and different sets of orthogonal codes indifferent cells. In that method, the available number of orthogonal codeswill be divided by the number of cells; hence, we have to maintain thenumber of simultaneous users in each cell within the number of codes.Obviously with this method, the hand-off process would be simpler,because the users do not have to change their frequency when leaving acell and entering an adjacent cell, and soft hand-off becomes possible.
The second possibility is to divide the available frequency band intoa number of subbands with some guard bands between each pair ofadjacent subbands. The number is determined according to how muchthe cells with the same frequency bands should be separated to reuse thefrequency band. For example, if a seven-frequency reuse pattern is usedwhereby the central cell is surrounded by six cells, we should divide the
Main Lobe
Transition Region
Side Lobes
F(u
), d
B
0
−10
−20
−30
−40
−50
−600 5 10 15 20
u
^
Figure 7.8 Normalized far-field radiation pattern F(u) of a typical spotbeam for T = 20 dB and p = 2.
246 Low Earth Orbital Satellites for Personal Communication Networks
total frequency band by seven. With this method, it is possible to reusethe same code in adjacent cells, and then the total number of availablecodes can be used in each cell. Thus, larger number of users can accessthe CDMA channel simultaneously. Here, users have to change theirfrequency when changing their host cell.
Because the first method has a wider bandwidth and a smaller numberof codes, and the second method has a narrower bandwidth and a largernumber of codes, it should be possible to make a trade-off between thetwo methods. Usually a seven-frequency reuse pattern is used, althoughsometimes a three-frequency pattern is employed. In practical systems,it is assumed that signals of users are perfectly orthogonal within a beam,but signals of different beams are not orthogonal. Therefore, signals ofother beams appear as pseudo-noise in the frequency reused beams, whichtheir summation can be assumed as a Guassian noise.
Frequency reuse in a satellite channel depends critically on thespacecraft antenna, which is the primary source of isolation between userswith the same frequency band. In particular, it depends on the numberof spot beams and their size. In that manner, perhaps one spot beam foreach user would be the ideal case, although it is impractical. Actually, astudy presented in [41] has shown that in either a narrowband or awideband satellite system increasing the number of spot beams to morethan 37 in a three-frequency reuse pattern only slightly changes theinterference distribution. Therefore, in a real situation, there is anasymptotic gain due to having spot-beam antennas.
In the case of GEO satellite systems that employ spot-beam antennas,perhaps the simplest configuration is the one in which spot beams arepointed permanently in a given direction. However, Reudink et al. haveshown that, in certain situations, scanning spot beams can make optimaluse of satellite power [39]. In particular, in areas where there is low trafficdensity, dedicated spot beams would be underutilized and thus representuneconomical satellite design. In such cases, scanning spot beams couldbe used to advantage. A side benefit would be the reduction of interfer-ence because at any time there would be fewer beams than service areas.A similar conclusion would be true for satellite systems in low Earthorbits.
From the preceding discussions along with the explanations given inChapter 2, we conclude that the issue of multibeam antennas for the LEO
Further Considerations in LEO Satellite Systems 247
satellite system is a serious requirement for future PCNs, to increase theirtotal capacity. However, their implementation in LEO satellite systemsrequires many considerations, more than the ones usually considered inGEO satellite systems. Perhaps the most important consideration is thetraffic distribution of users in the system. An effective LEO satellitesystem may be the one that has intelligent-enough on-board satelliteprocessors that can manage the system resources, that is, the availablebandwidth and codes, in such a manner that more resources are given tothe areas with higher traffic loads without wasting them in areas with lowtraffic. The bounds of the intelligence of the system would be wide.Examples of an effective LEO satellite system would be a system with theability to change the number of beams per satellite; a system in which thesize of every spot beam can be changed according to the traffic load of thearea in which it is projected; a system with the capability of assigning adifferent number of codes in different spot beams; a system that canchange the number of frequency reuse patterns between spot beams; asystem that can assign different frequency bandwidths within the availablespectrum to different cells according to the requirements of the qualityof service in those cells.
7.4 Concept of adaptive array antennasIt should be clear by now that in a LEO satellite system, the satellites havea high relative ground speed, and the position of any satellite relative toa user on the ground changes rapidly even during a short transmission. Asimilar situation can be seen in terrestrial mobile communication system,but with much lower speed. Moreover, there is a necessity to control thelevel of interference from users in the service area of other satellites orin a spot-beam constellation from users in other cells to achieve anacceptable level of signal-to-noise ratio.
One solution to those issues is the employment of adaptive arrayantennas at the users’ terminals3, which has been proposed for terrestrialcellular systems [47–54] and for LEO satellite systems [55]. An adaptivearray antenna is an array of antenna elements whose overall directivitypattern is controlled automatically so the reception is made under the
248 Low Earth Orbital Satellites for Personal Communication Networks
3. Having adaptive array antennas at the base stations also has been proposed.
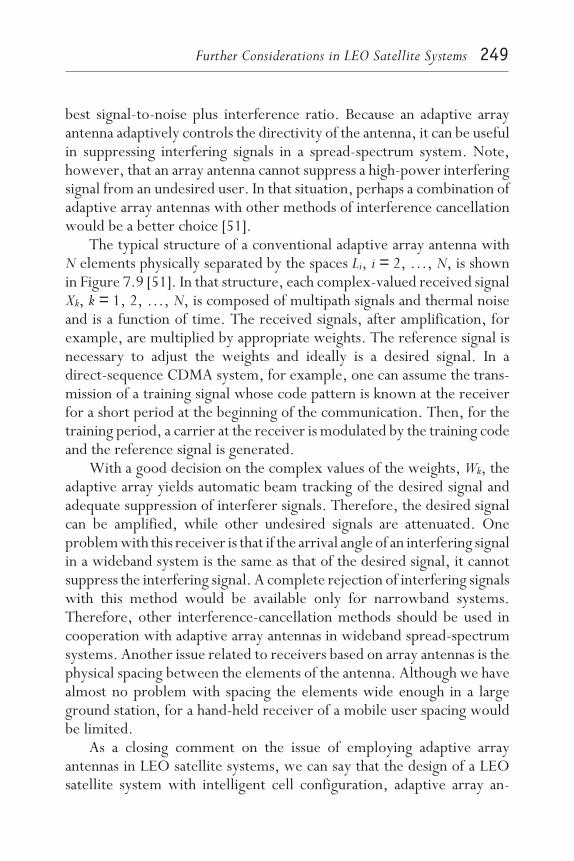
best signal-to-noise plus interference ratio. Because an adaptive arrayantenna adaptively controls the directivity of the antenna, it can be usefulin suppressing interfering signals in a spread-spectrum system. Note,however, that an array antenna cannot suppress a high-power interferingsignal from an undesired user. In that situation, perhaps a combination ofadaptive array antennas with other methods of interference cancellationwould be a better choice [51].
The typical structure of a conventional adaptive array antenna withN elements physically separated by the spaces Li, i = 2, …, N, is shownin Figure 7.9 [51]. In that structure, each complex-valued received signalXk, k = 1, 2, …, N, is composed of multipath signals and thermal noiseand is a function of time. The received signals, after amplification, forexample, are multiplied by appropriate weights. The reference signal isnecessary to adjust the weights and ideally is a desired signal. In adirect-sequence CDMA system, for example, one can assume the trans-mission of a training signal whose code pattern is known at the receiverfor a short period at the beginning of the communication. Then, for thetraining period, a carrier at the receiver is modulated by the training codeand the reference signal is generated.
With a good decision on the complex values of the weights, Wk, theadaptive array yields automatic beam tracking of the desired signal andadequate suppression of interferer signals. Therefore, the desired signalcan be amplified, while other undesired signals are attenuated. Oneproblem with this receiver is that if the arrival angle of an interfering signalin a wideband system is the same as that of the desired signal, it cannotsuppress the interfering signal. A complete rejection of interfering signalswith this method would be available only for narrowband systems.Therefore, other interference-cancellation methods should be used incooperation with adaptive array antennas in wideband spread-spectrumsystems. Another issue related to receivers based on array antennas is thephysical spacing between the elements of the antenna. Although we havealmost no problem with spacing the elements wide enough in a largeground station, for a hand-held receiver of a mobile user spacing wouldbe limited.
As a closing comment on the issue of employing adaptive arrayantennas in LEO satellite systems, we can say that the design of a LEOsatellite system with intelligent cell configuration, adaptive array an-
Further Considerations in LEO Satellite Systems 249
tenna-based receivers, and multiple diversity, that is, the visibility ofmore than one satellite (or being in more than one spot beam) for a givenuser at any time, can reduce the level of multiple-access interference andhence improve the capacity of the system significantly. Of course, imple-mentation of all these items requires higher total cost of the system, whichneeds an appropriate trade-off in the system design.
Σ
α
Desired SignalUndesired Signals(Interference)
Reference Signal
*
X2 X1XN
W1W2WN
Output
. ...
...
LN
L2
Detector*: Complex Conjugate
Array Output
Figure 7.9 A conventional adaptive array antenna with N elements.
250 Low Earth Orbital Satellites for Personal Communication Networks

7.5 SummaryThis chapter introduced a method for improving the performance of LEOsatellite systems in the case of spread-spectrum utilization, namely, thePAC scheme. Although this method has some similarities to the TPCmethod introduced in Chapter 6, the relative control of transmissionsaccording to the traffic load in each area in the PAC method achievesmuch more interesting performance than the TPC method. That isbecause in the PAC method the probabilities of packet transmission aremanaged according to propagation distances of the originator of eachpacket as well as the traffic distribution. We have shown that such controlimproves the throughput characteristics of the satellite system in differenttraffic situations significantly.
We also discussed issues concerning a LEO satellite system that werenot discussed in detail in previous chapters, such as power control, itsimplementation methods, and the effect of imperfections in power con-trol; antenna gain; and multiple-spot-beam satellite systems. In addition,we introduced the issue of design of receivers with adaptive array anten-nas as a method for reducing the effect of interference, which has beenrecently considered in LEO satellite systems. We concluded that theaccuracy in power control is a requirement for LEO satellite systemsemploying CDMA techniques and that it is difficult to design a perfectpower control because of the relatively large propagation delay in asatellite system. Large delay makes it impossible to employ closed-looppower control in a LEO satellite system.
The discussion of LEO satellite systems using spot-beam antennasconcluded that the issue of multibeam antennas for LEO satellite systemsis a serious requirement in future PCNs to reuse the limited frequencyspectrum and hence increase their total capacity. However, implemen-tation of spot beams in LEO satellite systems requires considerationsother than those usually considered in GEO satellite systems because oftraffic distribution of users in the system. Perhaps a LEO satellite systemwith intelligent beam configuration, so the interference from other cellscould be reduced to its minimum value, would be a final goal in designof LEO satellite systems.
For the issue of adaptive array antenna in LEO satellite systems, weconcluded that although the design of receivers with array antenna is a
Further Considerations in LEO Satellite Systems 251

good method for reducing interference and improving capacity, in awideband system other interference-cancellation methods may be re-quired as well. Moreover, physical spacing between the elements of theantenna in such a configuration might be a problem for the systems withsmall hand-held user terminals to be employed in the global PCNs of thenext century.
References[1] Lutz, E., et al., “The Land Mobile Satellite Communication
Channel—Recording, Statistics and Channel Model,” IEEE Trans. Vehic.Technol., Vol. 40, No. 2, 1991, pp. 375–386.
[2] Jamalipour, A., and A. Ogawa, “Packet Admission Control in aDirect-Sequence Spread Spectrum LEO Satellite Communication Network,”IEEE J. Select. Areas Commun., Vol. 15, No. 8, 1997.
[3] Jamalipour, A., and A. Ogawa, “Packet Admission Control for NonuniformTraffic Direct-Sequence Spread-Spectrum LEO Satellite CommunicationsNetworks,” Proc. Int. Conf. Telecommunications (ICT ‘97), Melbourne, Australia,1997, pp. 1243–1248.
[4] Viterbi, A. J., CDMA Principles of Spread Spectrum Communication, Reading, MA:Addison-Wesley, 1995.
[5] Prasad, R., CDMA for Wireless Personal Communications, Norwood, MA: ArtechHouse, 1996.
[6] Gilhousen, K. S., et al., “Increased Capacity Using CDMA for Mobile SatelliteCommunication,” IEEE J. Select. Areas Commun., Vol. 8, No. 4, 1990,pp. 503–514.
[7] Lee, W. C. Y., “Overview of Cellular CDMA,” IEEE Trans. Vehic. Technol.,Vol. 40, No. 2, 1991, pp. 291–302.
[8] Gilhousen, K. S., et al., “On the Capacity of a Cellular CDMA System,”IEEE Trans. Vehic. Technol., Vol. 40, No. 2, 1991, pp. 303–312.
[9] Pickholtz, R., L. B. Milstein, and D. L. Schilling, “Spread Spectrum for MobileCommunications,” IEEE Trans. Vehic. Technol., Vol. 40, No. 2, 1991,pp. 313–322.
[10] Simpson, F., and J. Holtzman, “CDMA Power Control, Interleaving, andCoding,” Proc. 41th IEEE Vehic. Technol. Conf., St. Louis, 1991, pp. 362–367.
[11] Viterbi, A. J., A. M. Viterbi, and E. Zehavi, “Performance ofPower-Controlled Wideband Terrestrial Digital Communication,” IEEE Trans.Commun., Vol. 41, No. 4, 1993, pp. 559–569.
252 Low Earth Orbital Satellites for Personal Communication Networks
[12] Viterbi, A. M., and A. J. Viterbi, “Erlang Capacity of a Power ControlledCDMA System,” IEEE J. Select. Areas Commun., Vol. 11, No. 6, 1993,pp. 892–900.
[13] Kchao, C., and G. L. Stuber, “Analysis of a Direct-Sequence Spread-SpectrumCellular Radio System,” IEEE Trans. Commun., Vol. 41, No. 10, 1993,pp. 1507–1516.
[14] Viterbi, A. J., et al., “Soft Handoff Extends CDMA Cell Coverage andIncreases Reverse Link Capacity,” IEEE J. Select. Areas Commun., Vol. 12,No. 8, 1994, pp. 1281–1288.
[15] Sheikh, A., Y. Yao, and S. Cheng, “Throughput Enhancement ofDirect-Sequence Spread-Spectrum Packet Radio Networks by Adaptive PowerControl,” IEEE Trans. Commun., Vol. 42, No. 2/3/4, 1994, pp. 884–890.
[16] Lupas, R., and S. Verdu, “Linear Multiuser Detectors for SynchronousCode-Division Multiple Access Channels,” IEEE Trans. Inform. Theory, Vol. 35,No. 1, 1989, pp. 123–136.
[17] Lupas, R., and S. Verdu, “Near-Far Resistance of Multiuser Detectors inAsynchronous Channels,” IEEE Trans. Commun., Vol. 38, No. 4, 1990,pp. 496–508.
[18] Varanasi, M. K., and B. Aazhang, “Multistage Detection in AsynchronousCode-Division Multiple Access Communications,” IEEE Trans. Commun.,Vol. 38, No. 4, 1990, pp. 509–519.
[19] Patel, P., and J. Holtzman, “Analysis of a Simple Successive InterferenceCancellation Scheme in a DS/CDMA System,” IEEE J. Select. Areas Commun.,Vol. 12, No. 5, 1994, pp. 796–807.
[20] Kohno, R., et al., “An Adaptive Canceller of Co-Channel Interference forSpread Spectrum Multiple Access Communication Networks in a Power Line,”IEEE J. Select. Areas Commun., Vol. 8, No. 4, 1990, pp. 691–699.
[21] Rush, L. A., and H. V. Poor, “Narrowband Interference Suppression in CDMASpread Spectrum Communications,” IEEE Trans. Commun., Vol. 42, No. 4,1994, pp. 1969–1979.
[22] Yoon, Y. C., R. Kohno, and H. Imai “A Spread-Spectrum Multi-Access SystemWith Co-Channel Interference Cancellation Over Multipath Fading Channels,”IEEE J. Select. Areas Commun., Vol. 11, No. 7, 1993, pp. 1067–1075.
[23] Kudoh, E., and T. Matsumoto, “Effects of Power Control Error on the SystemUser Capacity of DS/CDMA Cellular Mobile Radios,” IEICE Trans. Commun.,Vol. E75-B, No. 6, 1992, pp. 524–529.
[24] Kudoh, E., “On the Capacity of DS/CDMA Cellular Mobile Radios UnderImperfect Transmitter Power Control,” IEICE Trans. Commun., Vol. E76-B,No. 8, 1993, pp. 886–893.
Further Considerations in LEO Satellite Systems 253

[25] Prasad, R., M. G. Jansen, and A. Kegel, “Capacity Analysis of a Cellular DirectSequence Code Division Multiple Access System With Imperfect PowerControl,” IEICE Trans. Commun., Vol. E76-B, No. 8, 1993, pp. 894–905.
[26] Jansen, M. G., and R. Prasad, “Throughput and Delay Analysis of a CellularSlotted DS CDMA System With Imperfect Power Control and Sectorization,”Proc. IEEE International Symposium on Spread Spectrum and Its Applications (ISSSTA‘94), Oulu, Finland, 1994, pp. 420–425.
[27] Newson, P., and M. R. Heath, “The Capacity of a Spread Spectrum CDMASystem for Cellular Mobile Radio With Consideration of SystemImperfections,” IEEE J. Select. Areas Commun., Vol. 12, No. 4, 1994,pp. 673–684.
[28] Cameron, R., and B. Woerner, “Performance Analysis of CDMA WithImperfect Power Control,” IEEE Trans. Commun., Vol. 44, No. 7, 1996,pp. 777–781.
[29] Jacobsmeyer, J. M., “Congestion Relief on Power-Controlled CDMANetworks,” IEEE J. Select. Areas Commun., Vol. 14, No. 9, 1996,pp. 1758–1761.
[30] Vojcic, B. R., R. L. Pickholtz, and L. B. Milstein, “Performance of DS-CDMAWith Imperfect Power Control Operating Over a Low Earth Orbiting SatelliteLink,” IEEE J. Select. Areas Commun., Vol. 12, No. 4, 1994, pp. 560–567.
[31] Monk, A. M., and L. B. Milstein, “Open-Loop Power Control Error in a LandMobile Satellite System,” IEEE J. Select. Areas Commun., Vol. 13, No. 2, 1995,pp. 205–212.
[32] Silver, S., Antenna Theory and Design, New York: McGraw-Hill, 1949.
[33] Pratt, T., and C. W. Bostian, Satellite Communications, New York: Wiley &Sons, 1986.
[34] Slater, J. C., Microwave Transmission, New York: McGraw-Hill, 1942.
[35] Vatalaro, F., et al., “Analysis of LEO, MEO, and GEO Global Mobile SatelliteSystems in the Presence of Interference and Fading,” IEEE J. Select. AreasCommun., Vol. 13, No. 3, 1995, pp. 291–300.
[36] Roddy, D., Satellite Communications, Englewood Cliffs, NJ: Prentice-Hall, 1989.
[37] Williamson, M., The Communications Satellite, Bristol and New York: AdamHilger, 1990.
[38] Jansky, D. M., and M. C. Jeruchim, Communication Satellites in the GeostationaryOrbit, Norwood, MA: Artech House, 1987.
[39] Reudink, D. O., A. S. Acampora, and Y. S. Yeh, “The Transmission Capacityof Multibeam Communication Satellites,” Proc. IEEE, Vol. 69, No. 2, 1981,pp. 209–225.
254 Low Earth Orbital Satellites for Personal Communication Networks
[40] Gaaudenzi, R., et al., “How Can Interference-Rejection Receivers Increase theCapacity of CDMA Multi-Beam Satellite Communication Systems?,” in Mobileand Personal Satellite Communications 2, F. Vatalaro and F. Ananasso, eds,London: Springer, 1996, pp. 349–365.
[41] Moher, M., et al., “Interference Statistics for Multibeam Satellites,” in Mobileand Personal Satellite Communications 2, F. Vatalaro and F. Ananasso, eds,London: Springer, 1996, pp. 366–384.
[42] Ananasso, F., and F. D. Priscoli, “The Role of Satellites in PersonalCommunication Services,” IEEE J. Select. Areas Commun., Vol. 13, No. 2, 1995,pp. 180–195.
[43] Vojcic, B. R., L. B. Milstein, and R. L. Pickholtz, “Total Capacity in a SharedCDMA LEOS Environment,” IEEE J. Select. Areas Commun., Vol. 13, No. 2,1995, pp. 232–244.
[44] Kim, J. Y., and J. H. Lee, “Acquisition Performance of a DS/CDMA System ina Mobile Satellite Environment,” IEICE Trans. Commun., Vol. E80-B, No. 1,1997, pp. 40–48.
[45] Restrepo, J., and G. Maral, “Providing Appropriate Service Quality to Fixedand Mobile Users in a Non-GEO Satellite-Fixed Cell System,” in Mobile andPersonal Satellite Communications 2, F. Vatalaro and F. Ananasso, eds, London:Springer, 1996, pp. 79–96.
[46] Ramesh, R., “Availability Calculations for Mobile Satellite CommunicationSystems,” Proc. 46th IEEE Vehic. Technol. Conf., Atlanta, 1996, pp. 1033–1037.
[47] Widrow, B., et al., “Adaptive Antenna Systems,” Proc. IEEE, Vol. 55, 1967,pp. 21–43.
[48] Compton, R. T., Jr., “An Adaptive Array in a Spread-SpectrumCommunication System,” Proc. IEEE, Vol. 66, 1978, pp. 289–298.
[49] Swales, S. C., et al., “The Performance Enhancement of Multibeam AdaptiveBase Station Antennas for Cellular Land Mobile Radio Systems,” IEEE Trans.Vehic. Technol., Vol. 39, No. 1, 1990, pp. 56–67.
[50] Anderson, S., et al., “An Adaptive Array for Mobile Communication Systems,”IEEE Trans. Vehic. Technol., Vol. 40, No. 1, 1991, pp. 230–236.
[51] Kohno, R., H. Imai, and S. Pasupathy, “Combination of an Adaptive AntennaArray and a Canceller of Interference for Direct-Sequence Spread-SpectrumMultiple-Access System,” IEEE J. Select. Areas Commun., Vol. 8, No. 4, 1990,pp. 675–682.
[52] Ogawa, Y., Y. Nagashima, and K. Itoh, “An Adaptive Antenna System for HighSpeed Digital Mobile Communications,” IEICE Trans. Commun., Vol. E75-B,No. 5, 1992, pp. 413–421.
Further Considerations in LEO Satellite Systems 255

[53] Kuroiwa, N., R. Kohno, and H. Imai, “Design of a Diversity Receiver Using anAdaptive Array Antenna,” IEICE Trans., Vol. J73-B-II, No. 11, 1990,pp. 755–763.
[54] Naguib, A. F., A. Paulraj, and T. Kailath, “Capacity Improvement WithBase-Station Antenna Arrays in Cellular CDMA,” IEEE Trans. Vehic. Technol.,Vol. 43, No. 3, 1994, pp. 691–698.
[55] Sumino, H., et al., “The Receiver With an Adaptive Array Antenna andSatellite Diversity for Low Earth Orbital Multiple Satellite CommunicationSystems,” in Mobile and Personal Satellite Communications 2, F. Vatalaro andF. Ananasso, eds, London: Springer, 1996, pp. 180–194.
Selected bibliographyLitva, J., T. K-Y. Lo, Digital Beam Forming in Wireless Communications, Norwood,MA: Artech House, 1996.
256 Low Earth Orbital Satellites for Personal Communication Networks
Low Earth Orbital Satellites for Personal Communication Networks
List of Acronyms
ACTS Advanced Communication Technology Studies (inEurope; formerly RACE)
AGC automatic gain controlAM amplitude modulationAMPS American Mobile Phone SystemAMSC American Mobile Satellite CorporationAOR Atlantic Ocean regionAPR automatic position reportingARTEMIS Advanced Research and Technology MissionATDMA advanced TDMA mobile accessATPC adaptive transmit permission controlAWGN additive white Gaussian noiseBCH Bose-Chaudhuri-Hocquenghem (coding)BPSK binary phase shift keyingBS broadcasting satellite (also base station)
257

CCIR International Radio Consultative Committee(now ITU-R)
CDMA code division multiple accessCOMSAT Communications Satellite CorporationCS control stationDAB digital audio broadcastingDAMA demand assignment multiple accessDBS direct broadcasting satelliteDCA dynamic channel allocationDS/SSA direct-sequence spread-slotted AlohaDECT Digital European Cordless TelecommunicationsDL downlink (also forward link)DS direct sequenceDTS dense-traffic satelliteEIRP equivalent isotropically radiated powerEMS European mobile satelliteESA European Space AgencyETSI European Telecommunication Standards InstituteEUTELSAT European Telecommunication Satellite organizationFCA fixed channel allocationFCC Federal Communications CommissionFDD frequency division duplexingFDM frequency division multiplexingFDMA frequency division multiple accessFES fixed Earth stationFM frequency modulationFPLMTS Future Public Land Mobile Telecommunication
SystemsFSK frequency shift keyingGEO geostationary Earth orbit (also GSO: geostationary
satellite orbit)GPS global positioning systemGSM global system for mobile communicationsHEO highly elliptic orbitHIO highly inclined orbitICO intermediate circular orbitIF intermediate frequency
258 Low Earth Orbital Satellites for Personal Communication Networks
IN intelligent networkINMARSAT International Maritime telecommunication
Satellite organizationINTELSAT International Telecommunication Satellite
organizationISDN Integrated Services Digital NetworkISL intersatellite linkITU International Telecommunication UnionITU-R Radio communication sector of ITU (formerly CCIR)JMPS Japanese Mobile Phone SystemLAN local area networkLEO low Earth orbitLLM L -band land mobileMA multiple accessMAI multiple access interferenceMEO medium Earth orbitMIO multistationary inclined orbitsMONET Mobile NetworkMS mobile satellite (also mobile station)MSC mobile services switching centerMSS mobile satellite servicesNASA National Aeronautics and Space Administration (U.S.)NASDA National Space Development Agency (Japan)NCS network control stationORBCOMM Orbital Communications CorporationPABX private automatic branch exchangerPAC packet admission controlPBS Public Broadcasting ServicePBX private branch exchangePCM pulse code modulationPCN personal communication networkPCS personal communication servicesPHS personal handy phone system (formerly PHP)PLL phase locked loopPN pseudo-noisePRMA packet reservation multiple accessPSK phase shift keying
List of Acronyms 259
PSTN public switched telephone networkPTT post, telephone, and telegraphQPSK quadrature phase shift keyingRACE Research and Development in Advanced Communica-
tions technologies in Europe (now ACTS)RDSS radio determination satellite servicesRF radio frequencyRFI radio frequency interferenceSDMA space division multiple accessSHF super high frequencySIR signal-to-interference ratioSNR signal-to-noise ratioSS spread spectrumSSA spread-slotted AlohaSSMA spread spectrum multiple accessSTS sparse-traffic satelliteSYNCOM synchronous orbit communications satelliteTDD time division duplexingTDM time division multiplexingTDMA time division multiple accessTMI Telsat Mobile IncorporatedTPC transmit permission controlUHF ultra high frequencyUL uplink (also reverse link)UMTS universal mobile telecommunication systemsUPT universal personal telecommunicationsVHF very high frequencyVITA Volunteers in Technical AssistanceVSAT very small aperture terminalWAN wide area networkWARC World Administrative Radio ConferenceWATS wide area telecommunication service
260 Low Earth Orbital Satellites for Personal Communication Networks

Low Earth Orbital Satellites for Personal Communication Networks
About the Author
A received his Ph.D. in electrical engineering fromNagoya University, Japan, where he is now an assistant professorin the Department of Information Electronics. During his educa-
tion, he engaged in different fields of computer and communicationsengineering; his current interests are in digital wireless communications,satellite communications, mobile communications, computer communi-cation networks, spread-spectrum communications, and traffic andcongestion control. He is a member of IEEE and a member of IEEECommunications Society technical committees on Satellite and SpaceCommunications, Personal Communications, and CommunicationsSwitching. He is also a member of the International Union of RadioScience, the IEICE, and SITA of Japan.
Mr. Jamalipour received the URSI Young Scientists Award at the 25thGeneral Assembly of the URSI, held in Lille, France, in 1996. He alsoreceived the 13th Inoue Research Award for Young Scientists from theInoue Foundation for Science of Japan in 1996 for his outstanding
261

researches on LEO satellite systems. In 1997, he received the annualTelecommunications Technology Paper Award for his paper published inthe February 1995 issue of the IEEE Journal on Selected Areas in Communi-cations entitled “Performance of an Integrated Voice/Data System inNonuniform Traffic Low Earth-Orbit Satellite Communication Systems”from the Telecommunications Advancement Foundation of Japan. Hisname has been selected for inclusion in the 15th edition of the MarquisWho’s Who in the World for his outstanding contributions to internationalscientific activities.
262 Low Earth Orbital Satellites for Personal Communication Networks
Low Earth Orbital Satellites forPersonal Communication Networks
Index
Abramson, Norman, 119, 124, 129Adaptive array antennas, 248–50
defined, 248–49employing, 249–50illustrated, 250structure of, 249uses, 249See also Antennas
Adaptive TPC (ATPC), 186–87, 214–19defined, 215method 1, 215–16method 2, 217–18performance of, 217–18See also Transmit permission control
(TPC)Additive white Gaussian noise
(AWGN), 126Aloha, 100
capacity, 123
CDMA, 63, 124, 125–27channel packet rate, 120–21channel throughput, 120–21collisions, 123creation of, 119defined, 59, 119in FDMA, 124multiple-access scheme, 119–23offered traffic loads and, 180packet collisions, 123packet flow, 120packets, spreading, 123–29pure, 121slotted, 63, 121spread, 124, 128–29spread-slotted, xv, 34, 63, 117–53system comparison, 122in TDMA, 124unslotted, 63–64, 121
263
AltitudesKepler’s third law and, 11minimum number of orbits and, 40satellite system comparison by, 16
American Mobile Satellite Corporation(AMSC), 21
Analog systems, 79–96SIR, 82–91traffic assignment control, 91–96traffic modeling, 79See also CDMA
Antennasadaptive array, 248–50boresight, 242, 243gain, 242–45IRIDIUM, 23isotropic, 243ODYSSEY, 26spot-beam, 47, 67
Aperture efficiency, 243Average delay, 186
calculating, 219comparing, 204–5defined, 130, 201effect on TPC scheme, 206expressing, 205graphs of, 131increase in, 219normalized, 203, 206performance, 207performance analysis, 187performance of TPC scheme, 203throughput and, 131, 203, 208throughput performance
comparison, 206TPC performance, 201–8use of, 130
Average normalized totalthroughput, 201–2
defined, 201TPC effect on, 201, 202
Bent-pipe network architecture, 25, 26
defined, 25illustrated, 26
Big-LEO, 22–27ARIES, 26–27defined, 19GLOBALSTAR, 25IRIDIUM, 22–25ODYSSEY, 25–26proposed systems, 22–27services, 22See also LEO satellite systems
Binary phase shift keying (BPSK)direct-sequence (DS/BPSK), 138modulation, 53
Bit error probability, 137Boresight, 242, 243Bose-Chaudhuri-Hocquenghem (BCH), 97
Capacity, system, 166Capture probability, 191, 195
improving, 192interference and, 192–93low, 198
CDMA, xv, 48advantages, xiv, 62–63application of, 77–113carrier frequency use, 77circuit-mode traffic, 63, 97code multiplexing efficiency, 103defined, 59direct sequence
(DS/CDMA), 60, 79, 82direct-sequence signals, 125–28frequency reuse, 50GLOBALSTAR and, 25LEO satellite systems, 64on uplinks, 78packet-mode traffic, 63, 97peak channel speed, 97performance evaluation, 79–82schemes, 59, 62, 96signals, 59SIR and, 82–91
264 Low Earth Orbital Satellites for Personal Communication Networks
spatial reuse in, 103See also Multiple-access schemes
CDMA Aloha, 63, 124packets in, 127slotted, 127See also Aloha
Cellscluster of, 50defined, 47inserted within footprints, 48
Chip interval, 61Closed-loop power control, 169, 224, 238
defined, 169effectiveness, 224See also Power control
Code division multiple access. See CDMACollisions, 123, 202
avoiding, of same packets, 202weakening effect of, 123
Communicationswith LEO satellites, 33–73methods, 3–5
Communications satellites, 2–7activities, 5coverage, 6defined, 4features, 6history of, 5–7preliminary issues, 2–5
Contention systems, 120Conventional power control, 168–69
closed-loop, 169open-loop, 168–69radiated power, 173user connection, 171See also Modified power control; Power
controlCoverage area, 70
defined, 68double, 70service area/interference area,
relationship with, 72
Data packet transmission, 98Delay performance
average, 201improving, 203See also Average delay
Dense traffic satellite (DTS), 89, 104nonuniform traffic and, 147performance, 147–49performance, improving, 94service area, 94service area users, 147signal quality improvement of, 174SIR characteristic changes, 92SIR characteristics, 90SIR characteristics as function of traffic
nonuniformity, 106, 107, 108transmitting power, increasing, 94See also Sparse traffic satellite (STS)
Density function, 189–90Directivity, 242Direct sequence CDMA
(DS/CDMA), 60, 79, 82Direct-sequence-spread-slotted Aloha
(DS/SSA), 117, 190capacity and, 190conventional, 190modifying, 190–91See also Spread-slotted Aloha
Direct-to-multipath signal power ratio, 210Distribution of users, 132–34Doppler shift effect, 51–55
canceling, 54–55cause of, 51defined, 51frequency shift from, 53illustrated, 52in LEO satellite systems, 34normalized, 53numerical examples, 54schematic diagram, 53
Double coverage area, 70Dynamic nonuniform traffic, 108–13
Index 265
Dynamic nonuniform traffic (continued)modified power control
scheme, 110–13simulation model, 109–10See also Traffic nonuniformity
Effective aperture area, 243Effective isotropically radiated power
(EIRP), 243ELLIPSO, 27Error-correcting code, 145Error function, 144, 145European mobile satellite (EMS), 21
Fadingabsence of, 210, 211, 240effect of, 213, 241level of, 211model, 186, 230multipath, 209on uplink, 191, 238Rayleigh, 84, 140, 210, 238variation compared to bit rate, 212
Fading channels, 209–14model, 209–12throughput analysis, 186throughput performance, 213throughput performance
comparison, 231uplink, 212See also Transmit permission
control (TPC)FDMA
Aloha in, 124defined, 57frame structure, 58guard band, 59use of, 57VSATs and, 62See also Multiple-access schemes
Federal Communications Commission(FCC), 21
Fiber-optic cable, 18–19
Footprints, 37, 38, 46cells inserted within, 48GLOBALSTAR satellite, 51IRIDIUM satellite, 51partitioning, 47, 48
Frequency division duplexing (FDD), 27Frequency division multiple access.
See DMAFrequency division multiplexing (FDM), 48Frequency reuse, 247
CDMA, 50seven-frequency pattern, 247TDMA, 50three-frequency pattern, 247
Future public land mobiletelecommunication system(FPLMTS), 1
Gaindefined, 242general expression, 242–43processing, 60spot-beam antenna, 243–45See also Antennas
Gaussian noise, 100–101Geographic traffic nonuniformity, 34, 65GEO satellites, 6
comparison, 14–15, 17coverage requirement, 16example, 10–11frequency spectrum, 11lack of coverage, 13–14launch cost of, 14mobile communications with, 19problems with, 12–14propagation delay, 12propagation loss, 12–13
Geostationary Earth orbit satellites.See GEOs
Global communications network, 188GLOBALSTAR, 25
downlink/uplink frame structures, 49satellite footprint, 51
266 Low Earth Orbital Satellites for Personal Communication Networks
satellite requirements, 38
Hand-offs, 41–43average number of, 42defined, 42LEO satellite systems, 42–43mechanism, 43
Highly elliptical orbits (HEO), 16
Improved Gaussian approximation, 137INMARSAT
defined, 20INMARSAT A, 20INMARSAT B, 20INMARSAT C, 20mini-M, 21standards, 20terminals, 20
Integrated voice/data systems, 96–113dynamic nonuniform traffic
concepts, 108–13packet formatting, 98performance measurement, 103–8simulation environment, 101–3system considerations, 96–99traffic model extension, 99–101
Intercell interference, 160–64, 180Interference
cancellation methods, 249capture probability and, 192–93decreasing level of, 158effects, 223, 228intercell, 163–64, 180intracell, 163–64multiple-access, 163, 185, 195,
230, 250power, 181, 198reducing, 232shadowing and, 231simultaneously transmitted packets, 191from users outside service area, 161
Interference area, 70, 136defined, 69
illustrated, 69radius, 226service area/coverage area, relationship
with, 72Intermediate circular orbit (ICO), 27, 210International Maritime Telecommunication
Satellite Organization. SeeINMARSAT
International Telecommunications SatelliteOrganization (INTELSAT), 7
Intersatellite links (ISL), 43–46defined, 43Earth gateway stations and, 44GEO satellites and, 43inter-orbit, 45intra-orbit, 45IRIDIUM, 46LEO, 44–46types of, 45use proposals, 44
Intracell interference, 160–64IRIDIUM, 22–25, 34
antennas, 23coverage requirement, 16, 23, 38defined, 22–23features, 23ISLs, 46orbit constellation, 24processing facilities, 24satellite footprint, 51satellite mass, 23TDMA frame structure, 49transceivers, 23
Isotropic area, 243
Kepler’s first law, 8Kepler’s second law, 8, 11Kepler’s third law, 8–10, 11
LEO satellite systems, xiii, 14big-LEO, 19, 22–27CDMA, 64communications with, 33–73
Index 267

LEO satellite systems (continued)comparison, 17cost of, 17Doppler shift effects, 34dynamic features of, 108–9effective, 248future personal mobile communication
systems, 18geometrical considerations, 36hand-off, 41–43implementation of, 34intersatellite links, 43–46issues in, 55–67little-LEO, 19, 21–22mobile communication with, 19modeling, 34–35, 67–72multibeam, 241–48multicell, 51multiple-access scheme selection, 56–64network topology, 132orbits, 35–41performance, 132performance, analyzing, 68preliminary issues in, 35–55propagation delay, 17, 187propagation loss, 17satellite requirements, 35–41service areas, xiv, 65services, 64–65spot beams, 46–51traffic considerations, 64–67
Little-LEO, 21–22defined, 19frequency spectrum, 22licenses, 21See also LEO satellite systems
Local area networks (LANs), 187Log-normal distributed random
variable, 239Low Earth orbital satellites. See LEO
satellite systems
Markov M-state channel model, 210
Medium Earth orbit satellites(MEO), 14, 17
Microcellular systems, 41Mixture density, 21Mobile satellite systems, 12–27
big-LEO, 19, 22–27GEO, 19LEO, 19little-LEO, 19, 21–22in operation, 20–21orbital dynamics of, 7–11orbit selection, 12–18satellite requirements in, 40
Modeling, 67–72during satellite movement, 78three-dimensional, 70traffic, 79–82two-dimensional, 70–71
Modified power control, 110–13defined, 158goal of, 158numerical examples, 172–79performance evaluation, 172, 175radiated power, 173realization of, 179–80service areas and, 172in spread-slotted Aloha, 157–81throughput characteristics and, 176use of, 173user connection, 171See also Conventional power control;
Power controlMultibeam LEO satellites, 241–48Multipath fading
defined, 209modeling, 239power variations, 240See also Fading
Multiple-access capability, 140medium value of, 197small value of, 197
Multiple-access schemesclassification of, 56–61
268 Low Earth Orbital Satellites for Personal Communication Networks

comparative study, 61defined, 56–57in satellite systems, 61–64selection of, 56–64spread-spectrum, 60–61See also CDMA; FDMA; TDMA
Natural service area, 71Near-far problem, 83, 236–37
defined, 168in direct-sequence systems, 168severe, 168solving, 236–37See also Power control
Nonfading channel, 187–208throughput performance
comparison, 231See also Transmit permission control
(TPC)Nonuniformity distribution, 104Nonuniform traffic models, 79–82
examples, 80shapes, 80SIR and, 88–91typical shape of, 81See also Traffic nonuniformity
Normalized average delay, 203defined, 203normalized total throughput vs., 206–7
Normalized far-field radiation pattern, 244Normalized throughput, 134, 146, 148
average, 201calculation of, 198as function of composite packet
transmission, 233–35of individual satellites, 177maximized, 148, 149, 175maximized values, 176normalized average delay vs., 206–7results, 176total, 150, 151
characteristics, 179comparison, 166, 167, 178
effect on TPC, 201See also Throughput
Normal-shape function, 226NSTAR, 21
ODYSSEY, 25–26antennas, 26defined, 25–26orbit inclination, 26satellite requirements, 38
Open-loop power control, 168–69, 238defined, 168perfect, 169See also Power control
Optimum control, 91–93OPTUS, 21Orbits
altitudes, 40circular, 15comparison of, 14–18elliptical, 15LEO, 35–41minimum number of, 40, 41polar, 40selection of, 12–18
Organization, this book, xv–xviiOribital Communications Corporation
(ORBCOMM), 21Overlapping area, 150
Packet admission control (PAC), 224–35concepts, 232–33constraints, 232–33defined, 224–25heavy-traffic performance, 228–31packet success probability, 235performance, 233–35system and traffic models, 225–28TPC performance vs., 235
Packetsacknowledgment, 205Aloha, spreading, 123–29capture probability, 191
Index 269

Packets (continued)CDMA Aloha, 124CDMA generation example, 127collisions, 123, 202flow in Aloha channel, 120lost, 205retransmission of, 131, 202simultaneous throughput, 136spread Aloha, 124spread Aloha generation example, 128tagged, 191, 195, 196transmission in PAC method, 225
Packet success probability, 101, 136–44calculating, 136–44conditional, 138, 145improving, 203low, 199nonperfect capture, 137nonzero, 124numerical examples, 144–51PAC, 235perfect capture, 137in service areas, 139slotted/unslotted, 137in TPC scheme, 187unconditional, 138–39use of, 130
Perigee, 8Personal communication networks(PCNs), xiii, xivPersonal communications services (PCS), 1Personal handy phone system (PHS), 2Phase locked loop (PLL), 55Picocellular systems, 41, 42Power control, 83, 224, 236–41
closed-loop, 224, 238conventional, 168–69imperfections in, 238–41implementation, 224, 237–38importance of, 169modified scheme, 110–13, 157–81near-far problem and, 236–37on reverse links, 237
open-loop, 238selection parameters, 169
Predefined signals, 189Probability density function, 233Probability distribution function, 233Processing gain, 60Propagation delay
in average delay, 130elevation angle relationship with, 13GEO, 12–13LEO, 17, 187performance, improving, 203total, 203
Propagation loss, 192GEO, 12–13LEO, 17maximum, 196
Pure Aloha, 121
Quadrature phase shift keying (QPSK), 48
Radiated powers comparison, 173Radiation patterns
far-field, 244modeling, 244normalized far-field, 246spot-beam, 245
Radio determination satellite services(RDSS), 22
Rayleigh fading, 84, 140selective, 210variations due to, 238See also Fading
Reflection method, 3Retransmissions
delay, 202, 205increasing number of, 202–3packet, 131, 202
Satellitesaltitude of, 11angular velocity of, 9footprints, 37, 38, 46
270 Low Earth Orbital Satellites for Personal Communication Networks
rotating path of, 8Service areas, 70
circular, hexagon, 193configuration of, 227coverage area/interference area
relationship with, 72defined, 68of DTS, 94equal-size, 171as hexagons, 227modified power control and, 172natural, 71nonoverlapping, 193packet success probabilities in, 139reduction in, 195size of, changing, 171TPC method application and, 193–94traffic ratio in, 83uniform configuration of, 170upper bound for, 69
Shadowing, 84, 140absence of, 210, 240defined, 209effect of, 230interference power and, 231modeling, 239time-share of, 210
Signal-to-interference ratio(SIR), 78, 82–91
calculation of, 79CDMA and, 82–87changes at main satellite, 111, 112characteristics, changes at DTS/STS, 92characteristics, changes in, 88at DTS/STS, 90instantaneous levels of, 164measurement, 85required, 85satellite position and, 87–88in spread-spectrum systems, 101traffic nonuniformity and, 88–91
Simulationenvironment, 101–3
model, 101–2, 109–10parameters, 102–3start point of, 110
Slotted Aloha, 63, 121packet success probability
calculation, 137throughput, 122, 130See also Aloha
Sparse traffic satellite (STS), 89, 104nonuniform traffic and, 147performance, 147–49service area users, 147SIR characteristic changes, 92SIR characteristics, 90See also Dense traffic satellite (DTS)
Spot-beam antennas, 47, 67configuration, 244gain, 243–45performance of, 245–48See also Antennas
Spread Aloha, 124, 128–29offered traffic loads and, 180packet generation example, 128packets, 128slotted/unslotted, 129See also Aloha
Spread-slotted Aloha systems,xv, 34, 117–53
defined, 63direct-sequence (DS/SSA), 117, 190employing, 118, 130–44modified power control in, 157–81transmit permission control
for, 185–220See also Aloha
Spread spectrum, 63, 73multiple access (SSMA), 60–61network-analysis level, 100signal-to-interference ratio and, 101system example, 125
STARNET, 21Step function, 145Stochastic model, 223
Index 271
System capacity, 166
Tagged packets, 191, 195, 196TDMA, 24
advantages of, 61–62Aloha in, 124defined, 57frames, 25, 48frame structure, 49, 58guard time, 59seven-frequency reuse pattern, 50use of, 57See also Multiple-access schemes
Throughputanalysis, 131, 134–36average delay and, 131, 203, 208average value, 135comparisons, 229defined, 120in fading channel, 213fading/nonfading channel
comparison, 231graphs, 131instantaneous, averaging, 201low, 230maximized normalized, 148, 149, 175maximum value, 166nonworst case performance, 164–68normalized, 134, 146, 148normalized total, 150, 151, 166, 167,
178, 179PAC, 233–35performance comparison, 159–62performance worst case, 159–64simultaneous packet, 136single-satellite, 195slotted Aloha, 122, 130total, 195, 196TPC performance, 195–202use of, 130
Time division multiple access. See TDMATime division multiplexing (TDM), 24Traffic, 64–67
circuit-mode, 63, 97densities assignment, 66geographic nonuniformity, 34, 65integrated voice/data, 96–113model extension, 99–101modeling, 79–82packet-mode, 63, 97ratio in service area, 83uniform, 91uniform distribution, 82, 163See also Nonuniform traffic model;
Traffic nonuniformityTraffic assignment control, 91–96
optimum, 91–93optimum capability
measurement, 93–96Traffic loads
heavy offered, 177, 180, 199high, 167high offered, 201light offered, 213low offered, 177offered, 180offered to CDMA channel, 100peak of, 170, 171
Traffic nonuniformity, 181distribution, 109, 230DTS/STS and, 147dynamic, 108–13large, 174level change, 104measure, 110models, 79–82parameter relationship, 105SIR characteristics at DTS/STS as
function of, 106, 107, 108system performance and, 147, 150TPC scheme and, 208traffic loads and, 167
Transmit permission control(TPC), 185–220
adaptive, 186–87, 214–19application of, 213
272 Low Earth Orbital Satellites for Personal Communication Networks
average normalized total throughputeffect on, 201
average waiting time, 204defined, 186effect on average delay, 206fading channel, 209–14improvements achieved by, 198instruction, 192low elevation angles and, 209nonfading channel, 187–208numerical examples, 212–14packet success probability, 187PAC performance vs., 235physical representation of, 193realization of, 192throughput performance, 195–202throughput performance effect over
dense traffic area, 215
uses, 186
Uniform traffic, 91distribution, 82, 163, 230service area size and, 91
Universal mobile telecommunicationservices (UMTS), 1
Universal personal telecommunications(UPT), 1
Unslotted Aloha, 63–64, 121, 137
Van Allen radiation belts, 14, 15Very small aperture terminals (VSATs), 62Volunteers in Technical Assistance
(VITASAT), 21
Worst case performance, 159–64
Index 273