low carbon emission development strategies for jambi ... · low carbon emission development...
TRANSCRIPT

ORIGINAL ARTICLE
Low carbon emission development strategies for Jambi,Indonesia: simulation and trade-off analysis usingthe FALLOW model
Rachmat Mulia & Atiek Widayati & Suyanto &
Putra Agung & Muhammad Thoha Zulkarnain
Received: 22 February 2013 /Accepted: 21 June 2013 /Published online: 5 September 2013# The Author(s) 2013. This article is published with open access at Springerlink.com
Abstract Economic growth in rural areas has to align with preservation of land uses that optimiseenvironmental services. This means that trade-offs between economic and ecological priorities needto be understood, quantified andmanaged.We aimed to estimate the trade-off in the Tanjung JabungBarat district of Jambi province Indonesia, where traditional agroforestry systems on both peat andmineral soils and logged-over forests give way to monocultural plantations of pulpwood and oilpalm (Elaeis guineensis). Simulations of a 30-year time period of four scenarios using the FALLOW(Forests, Agroforests, Low-value-Landscape, Or, Wastelands) model show that a business-as-usualscenario of economic growth unhindered by the application of conservation scenarios will lead tohigh carbon dioxide CO2 emissions. The forest and agroforest protection scenario, with moderateassumptions for peat-based emissions, had opportunity costs of 3–100 USD/t CO2e. This occurredespecially when the establishment of oil palm plantations, which are currently the most profitableland use option in the area, is directed solely to under utilizedmineral soils. The high trade-off valuesare difficult to reconcile when relying only on C trading mechanism to offset economic opportunitycosts of not converting forests and/or agroforests to plantations. We conclude that law-basedprotection of existing forests, investment in intermediate intensity agroforestry options that utilizelocally adapted trees and do not require drainage of peatlands, and re-introduction of tappingJelutung (Dyera sp) latex as non-timber peat forest product, are needed in the Tanjabar district toprovide options that are sustainable from both ecological and economic perspectives.
Keywords Agroforest .Cemission .FALLOWmodel .Landusescenario .Oilpalm.Trade-off
1 Introduction
If the primary focus of efforts to Reduce Emissions from Deforestation and Forest Degradation(REDD) is on protecting ‘forests’ from deforestation or degradation, there is a great risk ofemission displacement and leakage to high carbon (C) stock areas outside the recognized forest
Mitig Adapt Strateg Glob Change (2014) 19:773–788DOI 10.1007/s11027-013-9485-8
R. Mulia (*) :A. Widayati : Suyanto : P. Agung :M. T. ZulkarnainWorld Agroforestry Centre, SEA Regional Office (ICRAF), Jl. CIFOR,Sindang Barang, Bogor, PO Box 161, Bogor 16001, Indonesiae-mail: [email protected]

(Ekadinata et al. 2010). Even where REDD implementation efforts at project scale within theforest boundary might appear to be successful, scrutiny of a larger area in the landscape mayreveal that net C emissions due to land use prevail (van Noordwijk and Minang 2009).Empirical data have shown that a wide range of leakage levels, from the negligible to the moresubstantial, can occur, depending on the ongoing conservation program in various regions(Murray et al. 2004). The rural landscape beyond institutional forest boundaries may consist ofhigh-biomass land uses such as complex agroforests that may not be classified as ‘forest’ assuch; whereas monoculture plantations, such as timber or oil palm (Elaeis guineensis), may fitthe definition of ‘forest’ and have lower terrestrial biomass. A larger accounting and account-ability area and a broadening of the definition of ‘forest’ may offer a solution to the challengesfacing REDD implementation, and maintaining or developing C stock at the landscape level.The REDD++ scheme or REALU (Reducing Emissions from All Land Uses) includes aspectssuch as emissions in areas outside forests and in peat lands that were not integrated into theearlier REDD schemes (namely, RED (Reducing Emissions from Deforestation), REDD, andREDD+ (Reducing Emissions from Deforestation and Forest Degradation)) (van Noordwijk etal. 2009). In this scheme, four pillars for the success of reducing emissions at the landscape levelare identified. These include REDD, REPeat (Reducing Emissions from peat areas), REStock(increasing the stock of trees in the landscape), and REGG (Reducing Emissions fromGreenhouse Gas due to agricultural activities) (van Noordwijk et al. 2009).
The landscape mosaic in the district of Tanjung Jabung Barat (Tanjabar), in the IndonesianJambi province of Sumatra is complex, and involves both peat and non-peat lands. Threats tothe viability of forest and high-biomass land uses arise from land conversion into plantations oragricultural crops. There are several existent types of tree-based systems in place, usuallyinvolving rubber (Hevea brasiliensis), coconut (Cocos nucifera), betel nut (Areca catechu) orcoffee (Coffea liberica) as a predominant or secondary product. Oil palm has been flourishingin mineral soil area since 1980s in line with the plantations established by government, privatecompanies and ‘people’s plantations’with Nucleus Estate Smallholders (NES). In the peat area,oil palm started to be planted around early 2000s as smallholder practice. Although new to thelocal people, it has quickly gained popularity due to its high economic return when compared toother livelihood options (Sofiyuddin et al. 2012). Conservation programs to protect forest orhigh-density land use on the one side and the need for economic profit on the other produce atrade-off between economic and ecological gains, which is as yet revealing few opportunitiesfor a win-win solution. Converting high-biomass land uses into monoculture plantations ormining projects offers a higher economic return but reduce environmental integrity, whileconserving existing forests reduces income opportunities. Despite its high profitability, mono-culture practice in oil palm plantations reduces biodiversity like fauna (Posa et al. 2011;Campbell-Smith et al. 2011) and the kinds of product diversification found in agroforestrypractices. During the last decade, however, an increase in the potential uses of oil palm, highand stable global demand, and weak legal implementation of forest or high-biomass land usepreservation and conservation programs, have contributed to a massive conversion of agricul-tural crops and local agroforestry sites in Indonesia into oil palm plantations (Bhagwat andWillis 2008). This takes place in both small and larger scale practices, as managed bysmallholders and large agribusiness estates, respectively. The double production target pro-posed by central government for 2020 seems to implicitly support this massive conversion, andshows no clear consideration for other priorities such as national food security, biodiversityprotection and C conservation (Koh and Ghazoul 2010).
A land use dynamics model that integrates the various components of the rural landscapeand their interrelationships can be used to measure the impact of land use strategies on theeconomic and ecological prosperity of the local people living in the landscape. Among the
774 Mitig Adapt Strateg Glob Change (2014) 19:773–788

various landscape dynamics models available (as reviewed by Lee et al. 2003; Messina andWalsh 2001; and Soares Filho et al. 2008, for example), we consider the FALLOW (Forests,Agroforests, Low-value-Landscape, Or, Wastelands) model (van Noordwijk 2002; vanNoordwijk et al. 2008; Suyamto et al. 2009) to be the most comprehensive because itexplicitly considers both the biophysical and socio-economic aspects and, to some extent,simulates the knowledge of agents as both a constraint and a dynamic property in learninglandscapes. Model simulations with a spatially explicit approach can produce useful mapsthat depict what occurs in the landscape both spatially and temporally. The outputs can serveas a basis for discussion of the impact of different development strategies or how to adapt tofuture changes. The use of simulation models is thus a type of projection method, though itdoes not provide exact predictions of future situations. It does, however, provide assistancein designing appropriate development and implementation strategies.
We aimed to use the FALLOWmodel to estimate economic and ecologic impacts arising fromthe implementation of land use development scenarios that will determine the future of rurallandscape in the Tanjabar district. Scenarios considered include the purely profit-oriented (such asallowing the establishment of new oil palm plantations across the landscape, including in peatareas replacing existing forests), and those that aim to maintain biodiversity and product diver-sification by supporting the viability of the remaining forest and native agroforestry practices.
2 Materials and methods
2.1 Site description
The district of Tanjabar is part of Jambi Province (Fig. 1a), which is situated in the eastern part ofSumatra, Indonesia. This is a coastal area with the geographic location of 7.35S–102.64E and1.45S–103.58E. The district consists of approximately 500,000 ha of rural land, with a population ofabout 270,000 people, 77 % of whom were farmers in 2009. The annual population growth rate is1.9%, and per capita income is 1000–1300USD. The landscape is decoratedwith peat lands, whichconstitute about 40 % of the total area of the district, and are located mostly in its northern part(Fig. 1b). The depth of peat varies across the peatland of Tanjabar, with the deepest found indisturbed peat swamp forest area of approximately 290 cm (Rahayu et al. 2011). The peat lands havemostly been converted to tree-based systems, except for a small peat forest known asHutanLindungGambut (HLG), which is currently designated as a protection forest for ecological and hydrologicalreasons through the decree ofMinister of Forestry in 2009. The remaining forests are locatedmainlyin the southwest of the district, which includes the Bukit TigapuluhNational Park (BTNP) and a partof the former management unit of production forest known as the Kesatuan Pengelolaan HutanProduksi (ex-KPHP) (Fig. 1b), which is categorised partly as limited production forest and partly asproduction forest. Ex-KPHP is not assigned for industrial plantation or any other specific use.Industrial forest plantations with acacia trees, Acacia mangium on mineral soils and Acaciacrassicarpa on peat, known as Hutan Tanaman Industri (HTI), dominate the production forest areaof the district and covers 35 % of the landscape. Oil palm (Elaeis guineensis) exists as large scaleplantations in mineral soil area and as smallholder in non-peat soil area.
2.2 Tree and crop-based systems in the district
For agricultural crops, smallholders cultivate maize and rice for staple foods as well as soybeans, cassava, groundnut, and other vegetables. Different types of tree-based systems alsoexist and consist mainly of rubber agroforests: either in simple form with a small number of
Mitig Adapt Strateg Glob Change (2014) 19:773–788 775

non-rubber species, or in more complex form with 5–20 non-rubber species also growing ina rubber garden (Khususiyah et al. 2011). Other important tree-based systems include‘excelsa’ coffee and coconut agroforests, and oil palm plantations as the new commodity
Fig. 1 Location of Tanjabar district in Jambi province, Sumatra, Indonesia (a) and area boundaries within thelandscape (b)
776 Mitig Adapt Strateg Glob Change (2014) 19:773–788

introduced into the landscape. Smallholder rubber production system (Hevea brasiliensis) arestill traditionally managed and farmers tend to use low quality seedlings with or withoutfertilizers and weed-killing applications. In the more complex forms of rubber agroforestry,farmers usually cultivate rubber together with fruit or timber trees such as pulai (Alstonia sp.)and tutup (Macaranga hypoleuca). This product diversification can help to maintain the incomeof smallholder farmers when they are faced with a harvesting or marketing problem in relationto one specific commodity. Coconut and betel nut (Areca catechu) are common multipurposetree species that are often introduced into the system, either as important products or as a livefence or marker of land tenure. The main product of the coconut system is copra, which was animportant commodity in Tanjabar during 1980s to 1990s (Khususiyah et al. 2011). Off-farmjobs include labour on the large-scale oil palm or acacia plantations.
2.3 FALLOW model
The FALLOW model was designed to simulate land cover change at the landscape level,driven by stakeholder decisions on labour and land allocation (van Noordwijk 2002;Suyamto et al. 2009). Initially constructed for the simulation of a simple 10×10 celllandscape, the model can now handle input maps obtained from Landsat satellite images.The default plot size is 1 ha with possible modification depending on the objective of thestudy and adjustments to input parameters. The current version of the model is coded in PC-Raster simulation language (http://pcraster.geo.uu.nl/). The model considers various externaldrivers that can influence stakeholders to make decisions in relation to the available land useoptions. These include both biophysical and social economic aspects, such as: i) marketmechanisms and relevant regulation interventions, articulated through commodity prices,costs, and harvesting labour productivities; ii) development programs, articulated throughcounselling, subsidies, infrastructures (settlements, road, market, processing factories), andland-use productivities; and iii) conservation programs, articulated through forest reserves aszones prohibiting local agricultural activities. Stakeholders consider all these factors whenmaking decisions on labour and land allocation. Decisions can also be influenced byexperience of the past and current year’s profits, suggestions from others, as well ascultural/traditional values (for example, a family tradition of cultivating a certain land useoption regardless of economic conditions).
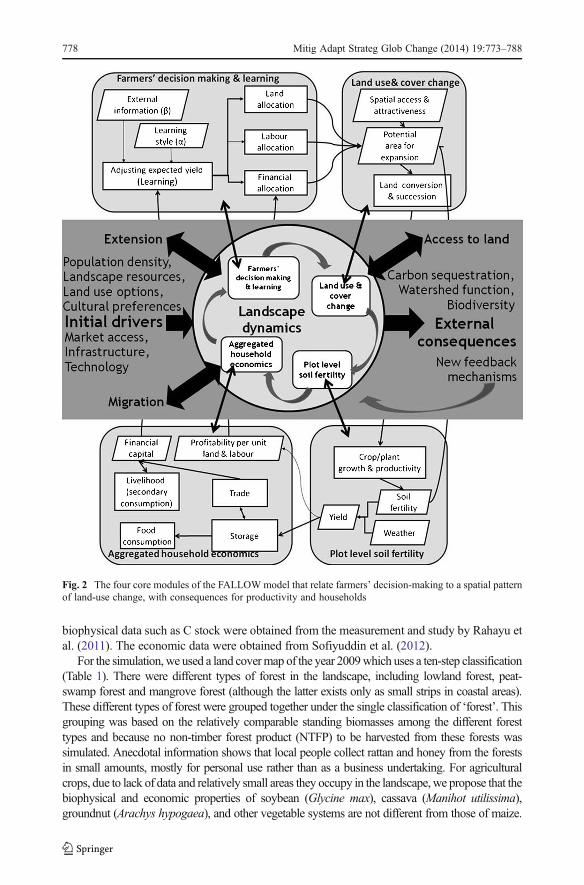
With the FALLOW model, the impacts of land use strategy on the economic andecological levels are represented by smallholder per capita income and standing C stock,respectively. Income does not include funds obtained by agribusiness estates in the land-scape or from off-farm jobs. There are four core modules of the FALLOW model with theirinteractions (Lusiana et al. 2012) (Fig. 2). These basically describe the relation betweenstakeholder decision-making and a spatial pattern of land use change, with the consequencesfor productivity and households. A more detailed description of the model is given in vanNoordwijk (2002) and Suyamto et al. (2009).
2.4 Input maps and parameter values
The FALLOW model needs inputs in map format and parameter values. At least ten mapsshould be provided prior to simulation. These include land cover map and those describingbiophysical conditions of the simulated landscape such as soil fertility and plantation suitabilitymap (Suyamto et al. 2009). Parameter values include those related to economic, biophysical anddemographic aspects. For this study, the land cover map was produced from Landsat satelliteimagery following hierarchical object-based classification methods (Widayati et al. 2011). The
Mitig Adapt Strateg Glob Change (2014) 19:773–788 777
biophysical data such as C stock were obtained from the measurement and study by Rahayu etal. (2011). The economic data were obtained from Sofiyuddin et al. (2012).
For the simulation,we used a land covermap of the year 2009which uses a ten-step classification(Table 1). There were different types of forest in the landscape, including lowland forest, peat-swamp forest and mangrove forest (although the latter exists only as small strips in coastal areas).These different types of forest were grouped together under the single classification of ‘forest’. Thisgrouping was based on the relatively comparable standing biomasses among the different foresttypes and because no non-timber forest product (NTFP) to be harvested from these forests wassimulated. Anecdotal information shows that local people collect rattan and honey from the forestsin small amounts, mostly for personal use rather than as a business undertaking. For agriculturalcrops, due to lack of data and relatively small areas they occupy in the landscape,we propose that thebiophysical and economic properties of soybean (Glycine max), cassava (Manihot utilissima),groundnut (Arachys hypogaea), and other vegetable systems are not different from those of maize.
Fig. 2 The four core modules of the FALLOWmodel that relate farmers’ decision-making to a spatial patternof land-use change, with consequences for productivity and households
778 Mitig Adapt Strateg Glob Change (2014) 19:773–788

We therefore classified them under the single category: crops. Six different tree-based systems weresimulated (Table 2), with some being differentiated according to their growing conditions in peat ornon-peat soils, and others undifferentiated. The differentiation of oil palm in peat and in non-peat soilwas made because of the significant difference in their economic values, while this is not the casewith rubber production system (Hevea brasiliensis). Coffee gardens exist exclusively in peatlandarea in Tanjabar and the most popular variety planted isCoffea liberica var. dewevrei, also known asExcelsa. Excelsa coffee growswell in mature peat and is characterized by bigger beans compared torobusta (Khususiyah et al. 2011). Each type of tree-based system was divided into 4 productionstages: 1) the pioneer stage, between the planting period and the end of the vegetative cycle; 2) theearly stage, at the start of the generative cycle; 3) the mature stage, when the production is relativelystable; and 4) the post production stage, when production is declining.
As state forest lands are usually considered to be an open access area by the localcommunity, the central government applies a Kesatuan Pengelolaan Hutan (KPH, ForestManagement Unit) mechanism that classifies the state forest lands into management areas,according to their basic function and the designated use of the forests (Kartodihardjo et al.2011). An example of KPH types is KPHP (Kesatuan Pengelolaan Hutan Produksi –Production Forest Management Unit) that is designated for production. KPH is expectedto provide a better forest management system for Indonesia’s forests and applies forestmanagement at the subnational level. In Tanjabar, the scheme is expected to graduallychange the perception of open access for the large parts of the state forest land. Despitethe central government efforts to protect and rehabilitate the remaining state forest lands, thelegality and legitimacy of forest ownership itself remains a contentious issue. The centralgovernment has sought to strengthen the legal position of the forests through the finalizationof the forest gazettement process, but its legitimacy is still being challenged by the localgovernment and communities. We simulated the case when the ex-KPHP is not legallyprotected and may be converted into plantation by the local smallholders or it is legallyprotected with a strict regulation implementation (Table 3).
Table 1 Land cover classification in the FALLOWmodel for Tanjung Jabung Barat. Two types of agricultureand six types of tree-based systems are were simulated
Class Land cover Remarks
1 Settlement
2 Forest The forest category groups together forests in non-peat andpeat soils, as well as swamp and mangrove forests
Agricultural crops
3 Rice (Oryza sativa) The crops category groups together all crops other than rice
4 Crops
Tree-based systems
5 Rubber agroforest This category groups rubber agroforest in peat or non-peat,both simple and more complex forms
6 Oil palm peat Oil palm plantations in peat
7 Oil palm non-peat Oil palm plantations in non-peat
8 Coffee agroforest Usually mixed with a few betel nut trees
9 Coconut agroforest This system groups together coconut agroforest (usually with betel nut)and monoculture, as well as home gardens that usually consistsof coconut and betel nut
10 Acacia Only in industrial plantation (HTI) areas
Mitig Adapt Strateg Glob Change (2014) 19:773–788 779

C stock in the rubber production system (Hevea brasiliensis) is higher than that measuredin other tree-based systems (Table 2). From the economic aspect, oil palm cultivation wasthe most profitable agricultural option, followed by coffee, rubber and coconut systems. Ingeneral, tree-based systems offer higher profits than annual crops (Table 2).
2.5 Developed scenarios and model simulations
Table 3 summarises four land use scenarios. The FALLOWmodel simulations show the effectsof likely changes to current conditions informed by the planning standpoints of differentstakeholders in the Tanjabar district that include local departments such as forest and agricul-tural department: 1) The ‘Business as Usual’ (BAU) scenario reflects the current trend, with thepossibility that the remaining peat forest (HLG) will be opened for conversion into smallholderplots. The only protected forest is the BTNP. The rest of the forest on non-peat soils in thesouthern area (ex-KPHP) is not legally protected; 2) The ‘Protected Peat Forest’ scenarioprotects the HLG from conversion to other land use types; 3) The ‘REALU’ scenario reducesemissions from all land uses by protecting existing forests (HLG, BTNP, and ex-KPHP), andrubber and coffee agroforestry systems from conversion to other land use types. REALU alsoaims to support product diversification bymaintaining local agroforestry practices, but excludescoconut agroforestry due to its much lower profit return relative to other livelihood options; and4) The ‘Green REALU’ scenario is similar to the REALU scenario, though it restricts new oilpalm plantations to non-productive non-peat soils such as grass or shrub lands only.
The simulated area was the Tanjabar district with a map resolution of 1 ha and a 5 km-wide buffer area around the district boundaries. The model simulations run for a duration of30 years in order to show a complete cycle of an oil palm plantation, included as one of themain tree-based systems simulated in the landscape. The initial land cover and other input
Table 2 Observed time-average C stock and yield of each land use type in Tanjung Jabung Barat. As thescenarios studied did not involve change in areas allocated to the industrial timber plantations (HTI); no yield,labour and income estimates were considered
Category Land covertype
Time-averagedC stock(ton ha−1)
Return tolabour(USD pd−1)
Return toland(USD ha−1)
Yield(ton ha−1)
Yield price(USD ton−1)
Income(USD ha−1)
Forest Pioneer forest 17 – – – – –
Youngsecondaryforest
96 – – – – –
Old secondaryforest
162 – – – – –
Primary forest 202 – – – – –
Crop Rice 1 6.35 404 1.33 667 887.11
Crops 10 6.96 595 1.00 222 222
Tree-based Rubber 58 7.51 1731 0.54 1778 960.12
Oil palm peat 39 16.06 5866 13.51 133 1796.83
Oil palmnon-peat
40 17.29 7615 18.87 156 2943.72
Coffee 26 8.91 5722 0.68 1833 1246.44
Coconut 32 8.34 2002 1.22 422 514.84
780 Mitig Adapt Strateg Glob Change (2014) 19:773–788

maps were taken from 2009. During simulations, no new concession of industrial timber oroil palm plantation or mining, and no change in road and settlement distribution over thelandscape were simulated. The current version of FALLOW model does not simulatesettlement development. A dynamic settlement, road or new plantation concession forexample, needs an additional input map that describes its distribution in the future. Marketprice was assumed to be stable for all products across the years. The impacts of each scenarioimplementation on the ecological and economic levels are measured based on the observedstanding C stock and profitability values, respectively (Table 2). In the simulations, small-holders will allocate more land and labour to those livelihood options that yield higherprofits. Labour allocation to HTI and large scale oil palm plantation were not simulated dueto lack of input data about labour requirement and income obtained from these off-farm jobs.
3 Results
3.1 Land cover output maps
In 2009, the peat areas in the Northeastern part of the landscape were dominated bycoffee and coconut agroforests (Fig. 3a). Forests were still relatively abundant especially
Table 3 Four land use scenarios for FALLOW model simulation that determine the current and future of therural landscape in Tanjung Jabung Barat, Jambi province
No Scenario Description Remarks
1 Businessas Usual(BAU)
• No protection for trees outside theBukit Tigapuluh National Park (BTNP);for conversion into smallholder plots
• No new concession for oil, coaland natural gas exploration isassumed for 30-year simulation
• Illegal conversion of protected peat forest(Hutan Lindung Gambut or HLG) intosmallholder plots
• No change in road and settlementdistribution and market price isassumed during 30-year simulation
• Six types of tree-based system and 2 typesof agricultural crops (Table 1) simulatedas livelihood options for local people
2 ProtectedPeatForest
• Protection of the HLG • Other conditions are the same as BAU
• No protection for trees outside the legallyprotected forests (HLG and BTNP); forconversion into smallholder plots
3 REALU • Protection of rubber and coffee systems:no conversion is allowed to other livelihoodoptions. Post-production rubber and coffeesystems are rejuvenated
• Supporting low C emissiondevelopment and productdiversification
• Protection for trees inside HLG, BTNP andex-KPHP
• Other conditions are the same as BAU
4 GreenREALU
Similar to REALU scenario, PLUS: • Oil palm is introduced in shrub or grasslands to increase profitability and Cstock in the lands
• New oil palm plantations can only beestablished in non-productive non-peat soils(i.e. shrub or grass lands in non-peat soils)
• Post-production rubber production system(Hevea brasiliensis) are not rejuvenated, butare instead allowed to naturally develop intosecondary forest
• Other conditions are the same as BAU
Mitig Adapt Strateg Glob Change (2014) 19:773–788 781

in the southwestern part, including the area of BTNP. The number of oil palm plots innon-peat soils was already significant and distributed among the young rubberagroforests. The large area of industrial plantation was, for the most part, not yetconverted into acacia plantation. We assumed that a thorough conversion takes place inthe fifth year of the simulation. The areas of rice and other annual crops were notsignificant and were scattered over the landscape.
In the BAU scenario, in the simulated land cover map of the year 2039, most of the coffeeand coconut agroforests in the peat areas are replaced by new oil palm plantations (Fig. 3b).In non-peat soils, oil palm competes with rubber production system (Hevea brasiliensis) todominate the landscape. The remaining peat forests (HLG) was thoroughly converted intonew smallholder oil palm or coffee plantations.
In the Protected Peat Forest scenario, forests still exist, due to the protected status of peatforest in the upper part of the landscape, and in the national park in the lower part (Fig. 3c).Difficult topography also constrained forest conversions outside the national park, althoughthe park maintains a relatively significant forest area in the southern part of the landscape.The final land use distribution in the BAU scenario is thus relatively similar to the protectedpeat forest scenario, except in the remaining peat forest area, where unprotected peat forestswere converted to smallholder plantations.
In the REALU scenario, preventing the conversion of both existing and new coffee andrubber production system (Hevea brasiliensis) to other land use types produces significantarea dominated by these two systems in the landscape (Fig. 3d). Coffee agroforests weremaintained and developed in peat areas, while rubber agroforests mainly occurred in non-peat soils. In the Green REALU scenario, the areas of oil palm are not significant due to thelimited area of shrub or grass lands available in the landscape (Fig. 3e). Consequently,rubber agroforests develop well in the non-peat soils.
3.2 Trade-off and compensation
The ecological and economic impacts of the simulated implementation of each scenarioare represented relative to the BAU scenario (Fig. 4). All the scenarios result in lower percapita income relative to BAU. The negative trend in income from the BAU to GreenREALU scenarios correlates with the percentage of oil palm area in the landscape(Table 4), thus indicating that income from oil palm plantations significantly affectsincome at the district level. On the other hand, higher C stocks were obtained, mainlythrough the conservation of larger forest areas (i.e. HLG, BTNP, and/or ex-KPHP asBTNP’s buffer zone).
Great potential income loss was produced as an impact of preserving forests andagroforestry plots in the landscape (Table 5). A higher trade-off value was obtained whenprotecting rubber and coffee agroforestry systems and/or restricting new oil palm plan-tations in areas other than unproductive non-peat soils. This is because of the highpotential loss in income from oil palm plantations. At the same time, C stocks inagroforestry systems are not higher than in oil palm plantations, except in comparisonwith the old rubber production system (Hevea brasiliensis). The higher C stock in theREALU and Green REALU scenarios mainly occurs because larger areas of forest areprotected and there is no rejuvenation of old rubber production system (Heveabrasiliensis). As the scenarios studied did not involve change in areas allocated to theindustrial timber plantations (HTI) and large scale oil palm plantation, ignoring incomefrom these two options will not affect the trade-off calculation that measures relativeincome percapita between other scenarios and BAU.
782 Mitig Adapt Strateg Glob Change (2014) 19:773–788

4 Discussion
The implementation of land use scenarios that give priority to forest conservation orrestoration usually produces trade-off that is negative in economic terms and positive onthe ecological level when compared to scenarios that do not include conservation(Sunderland et al. 2008). In the Tanjabar district, the difference in C stock and income percapita between scenarios is mainly determined by how large forest areas are protected andwhich land use strategies are applied in peat areas. Restrictions on the establishment of newoil palm plantations and the preservation of local agroforestry practices are the key factors inproducing the strong negative economic trends in the two REALU scenarios, relative to theBAU. In the Green REALU, the availability of non-productive non-peat soils, such asgrasslands, for conversion into new oil palm plantations is too limited and cannot preventsignificant loss in income. The calculation of the trade-off value here, however, does not takeinto account the prevention of belowground C stock emissions that prevail in all thescenarios other than the BAU. If these were taken into account, the calculated trade-offvalues are smaller than the presented values above. Based on the peat emission data fromAgus et al. (2013), protecting the HLG from conversion into oil palm plantation will avoid
Fig. 3 Land cover map of 2009 (initial) according to the FALLOW model classification and output mapsbased on different scenarios at simulation year 30
Mitig Adapt Strateg Glob Change (2014) 19:773–788 783

peat emission of around 0.23×10⁶ ton CO2 eq. year− 1 if land conversion will not involve
slash and burn practice; and as much as 1.76×10⁶ ton CO2 eq. year− 1 with land clearance
burning on peat soils. Including this peat emission in the calculation of trade-off value yields5.4 USD ton− 1 CO2 eq. if the conversion did not involve slash and burn practice, and 2.9USD ton− 1 CO2 eq. with that practice. The latter is much lower compared to the trade-offvalue that takes into account aboveground C stock only, i.e. 6.2 USD ton− 1 CO2 eq.(Table 5). For the two other interventions, the avoided peat emission because of agroforestprotection and restriction of new oil palm plantation into underutilized mineral soils only are0.058×106 ton− 1 CO2 eq. and 0.092×10⁶ ton− 1 CO2 eq. respectively, as they would notaffect the remaining peat forest. The new trade-off value for the two interventions are 86.41USD ton−1 CO2 eq. for agroforest protection and 14.53 USD ton−1 CO2 eq. for oil palm
Fig. 4 Impact of each scenario application relative to the BAU scenario. Ecological impact is represented bystanding C stock in the landscape (106 ton CO2 eq.) and economic impact by income (USD per capita year−1)measured as the average over the 30 year simulation
Table 4 Area of tree-based systems in the landscape of Tanjabar district, Jambi province, Sumatra Indonesia.Initial condition was measured in 2009. For the scenarios, the values represent an average over the 30 yearsimulation period with the FALLOW model
Total area in the landscape (%)
Tree-based system Initial BAU Protected Peat Forest REALU Green REALU
Rubber agroforest 10.86 6.11 6.01 8.77 10.37
Coffee agroforest 7.55 6.80 6.46 9.89 14.02
Coconut agroforest 11.12 4.56 4.78 4.39 0.05
Total agroforest 29.53 17.47 17.25 23.05 24.44
Oil palm in peat 1.39 8.45 7.32 4.06 0.28
Oil palm in non-peat 19.45 20.06 19.34 16.82 14.42
Total oil palm 20.84 28.51 26.66 20.88 14.7
784 Mitig Adapt Strateg Glob Change (2014) 19:773–788

restriction. These are relatively close to those considering aboveground emission only(Table 5).
Similarly, the trade-off values could be much smaller if the FALLOW model took theeconomic valuation of other ecosystem services such as the richness of biodiversity, soilfertility, and/or watershed functions into account. Furthermore, product diversificationthrough maintaining native agricultural practices can to some extent ensure the viability ofsmallholder incomes should the oil palm market weakens in the future.
A possible way to reduce potential income loss that results from the conservationprograms is to receive compensation from potential donors. This relates to thecompensatory system of rewarding the achievement of high levels of C storage andavoidance of C emissions, based on either an output or input approach (Tacconi2009). The first option refers only to the C stock level, whereas the second relatesto the efforts made to achieve that level. The high trade-off values in the two REALUscenarios, however, may preclude the possibility of obtaining full compensation fromthe C trading mechanism. Indeed, the application of any C compensation scheme isitself facing many challenges, such as the ongoing discussion regarding the mostreliable methods of C stock measurement, payment mechanisms and related institu-tions, accountability, and accessing potential donors. Application of the fairness andequity principle among the multiple stakeholders involved at both the national andinternational levels is also important (Okereke and Dooley 2010). It is also crucial totake into consideration the value and provision of other environmental services, suchas biodiversity levels or maintenance of water quality through the payment forenvironmental services mechanism. Despite facing implementation challenges thatare similar to those of the C trading mechanism, recent studies by Jackson et al.(2010) and Lopa et al. (2012) indicate that the use of a solid framework that increasesawareness and links multiple, mutually-benefiting partners is essential for successfuland sustainable cooperation.
One intriguing possibility for Tanjabar is the effort to bring back the traditional practice oftapping Jelutung (Dyera polyphylla) in the district. This has potential to provide anothersignificant source of income for local people, while still conserving and maintaining peatforest at the ecological level (RE-Peat). The latex serves as a non-timber peat forest productand the wood of old Jelutung trees can be used for various derivative products, such asplywood. The local district government is currently experimenting with the introduction ofJelutung intercropped between young oil palm trees in the plantations in peat areas. Thisexperimental area may later serve as a demo-plot for the local people. Based on a rapidsurvey conducted in several villages in the district, around 20 % of local people expressed an
Table 5 Potential loss in annual income per ton C sequestration as an impact of scenario implementation inTanjabar district, calculated by the FALLOW model
No Intervention Area(103 ha)
Δ population income(106 USD year−1)
Δ C stock in thelandscape (106 t year−1)
Trade-off (USDton−1 CO2 eq.)
1 Protection of peat forest 15 −10.17 1.65 −6.172 Protection of rubber and
coffee agroforestry123 −41.35 0.42 −98.32
3 Oil palm restricted tounproductive non-peatsoils
38 −18.21 1.16 −15.67
4 Total (1+2+3) 176 −69.73 3.23 −21.58
Mitig Adapt Strateg Glob Change (2014) 19:773–788 785

interest in converting their old oil palm plantations into monoculture Jelutung plantations(data not published). However, Sofiyuddin et al. (2012) estimated that Jelutung monocultureplantation in Tanjabar district might not be an efficient system. This is related to a positivecash flow obtained until after 10 years of management. A better management practice shouldbe invented or Jelutung trees are kept as part of peat forest with its latex serves as a non-timber peat forest product.
From the ecological perspective, BAU represents a baseline or negative scenario, whereasthe other options represent positive scenarios. The simulation results thus describe the rangeof possibilities that could occur and be encountered in the future by the relevant stakeholdersin the district. Rather than waiting until one of the possible scenarios actually occurs, anappropriate response to the results of scenario analysis is to use the model outcomes todesign the most sensible development strategy for implementation, which may includefurther exercises in emission reduction strategies and related activities. As with all othermodels, these model outcomes are sensitive to parameter values and assumptions and shouldnot, therefore, be used as definite predictions. The scenarios studied here can be comparedwith those that emerge in land use planning tools for the area (Lusiana et al. 2013). Byincluding more feedbacks and associated emission displacement (van Noordwijk et al.2008), the dynamic model can refine initial estimates of the tradeoffs that derive from asimple comparison of land use systems and options (Tata et al. this issue).
The current version of FALLOW simply considers standing C stock as a representation ofthe ecological level and smallholder per capita income at the economic level. The nextversion has to take into account other environmental services such as biodiversity levels orwater quality, and if possible translate these services into economic value. This couldpotentially result in a smaller discrepancy between conservation scenarios and profit-oriented scenarios at the economic level. Recently, the InVEST (Integrated Valuation ofEnvironmental Services and Tradeoffs) model (Tallis et al. 2013) was developed to quantifyand to map the values of environmental services. This model can be a good reference todesign the next version of the FALLOW model.
5 Conclusions
It is very important to maintain forest and agroforests in the Tanjabar district not only forenvironmental functions but also for product diversification. The simulation with theFALLOW model suggests, however, that allowing condition as business as usual to prevailwithout a strict legal protection cannot hinder the conversion of the forests and agroforests toplantations. Relying on C compensation scheme is not a solution because of the highpotential economic loss as an impact of implementation of conservation programs andrestriction of new oil palm plantations. The seemingly feasible conservation strategy is toprotect the remaining 15,000 ha peat forest which entails an opportunity cost of 6.2 USDton−1 CO2 eq. if the trade-off calculation involved aboveground emission only and 2.9 USDton−1 CO2 eq. if it included peat emission. The value will be lower if belowgroundsequestration of the peat forest is considered in the calculation. We conclude that the waysto provide options for maintaining the landscape of Tanjabar which sustain ecological andeconomic functions are through implementation of law-based protection of existing forestsand/or agroforests, investment in intermediate intensity agroforestry options that utilizelocally adapted trees and do not require drainage of peatlands, and efforts to bring backthe traditional practice of tapping Jelutung latex as non-timber peat forest product.
786 Mitig Adapt Strateg Glob Change (2014) 19:773–788

Acknowledgments This scenario simulation using the FALLOW model was part of the REALU II projectfunded by NORAD (The Norwegian Agency for Development Cooperation). Input data for the model werecollected by many colleagues working on this project whom the authors thank greatly. Constructive commentsand feedbacks from two anonymous reviewers are highly appreciated.
Open Access This article is distributed under the terms of the Creative Commons Attribution License whichpermits any use, distribution, and reproduction in any medium, provided the original author(s) and the sourceare credited.
References
Agus F, Henson IE, Sahardjo BH, Harris N, van Noordwijk M, Killeen TJ (2013) Review of emission factorsfor assessment of CO2 emission from land use change to oil palm in Southeast Asia. In: Killeen TJ, GoonJ (eds) Reports from the Science Panel of the Second RSPO GHG Working Group, Roundtable forSustainable Palm Oil—RSPO, Kuala Lumpur, Malaysia
Bhagwat SA, Willis KJ (2008) Agroforestry as a solution to the oil-palm debate. Conserv Biol 22(6):1368–1370Campbell-Smith G, Campbell-Smith M, Singleton I, Linkie M (2011) Apes in space: saving an imperilled
orangutan population in Sumatra. PLoS One 6(2):e17210. doi:10.1371/journal.pone.0017210Ekadinata A, van Noordwijk M, Dewi S, Minang PA (2010) Reducing emissions from deforestation, inside
and outside the ‘forest’. ASB Brief 16. World Agroforestry Centre, NairobiJackson L, van Noordwijk M, Bengtsson J, Foster W, Lipper L, Pulleman M, Said M, Snaddon J, Vodouh R
(2010) Biodiversity and agricultural sustainability: from assessment to adaptive management. Curr OpinEnviron Sustain 1:1–8
Kartodihardjo H, Nugroho B, Putro HR (2011) Forest Management Unit (FMU): Concept, legislation andimplementation. Ministry of Forestry, Jakarta
Khususiyah N, Janudianto, Mulyoutami E, Buana Y, Suyanto, Widayati A (2011) Livelihood options, povertyand equity in the peat and mineral lands of Jambi: case study in Tanjung Jabung Barat. In: Suyanto, vanNoordwijk M (eds) REALU project report for Tanjung Jabung Barat (Tanjabar), Jambi, Indonesia. WorldAgroforestry Centre, Bogor
Koh LP, Ghazoul J (2010) Spatially explicit scenario analysis for reconciling agricultural expansion, forestprotection, and carbon conservation in Indonesia. PNAS 107(24):11140–11144
Lee B, Meneghin B, Turner M, Hoekstra T (2003) An evaluation of landscape dynamic simulation models.USDA Forest Service, Washington
Lopa D, Mwanyoka I, Jambiya J, Massoud T, Harrison P, Ellis-Jones M, Blomley T, Leimona B, vanNoordwijk M, Burgess ND (2012) Towards operational payments for water ecosystem services inTanzania: a case study from the Uluguru Mountains. Fauna Flora Int Oryx 46(1):34–44
Lusiana B, van Noordwijk M, Cadisch G (2012) Land sparing or sharing? Exploring livestock fodder optionsin combination with land use zoning and consequences for livelihoods and net carbon stocks using theFALLOW model. Agric Ecosyst Environ 159:145–160
Lusiana B, van Noordwijk M, Johana F, Galudra G, Suyanto, Cadisch G (2013) Implication of uncertainty andscale in carbon emission estimates on locally appropriate designs to reduce emissions from deforestationand degradation (REDD+). Mitig Adapt Strateg Glob Change. doi:10.1007/s11027-013-9501-z
Messina JP, Walsh SJ (2001) Simulating land use and land cover dynamics in the Ecuadorian Amazon throughcellular automata approaches and an integrated GIS. Open Meeting of the Human Dimensions of GlobalEnvironmental Change Research Community, Rio de Janeiro
Murray BC, McCarl BA, Lee HC (2004) Estimating leakage from forest carbon sequestration programs. LandEcon 80(1):109–124
Okereke C, Dooley K (2010) Principles of justice in proposals and policy approaches to avoided deforestation:towards a post-Kyoto climate agreement. Glob Environ Chang 20:82–95
Posa MRC, Wijedasa LS, Corlett RT (2011) Biodiversity and conservation of tropical peat swamp forests.BioScience 61(1):49–57
Rahayu S, Khasanah N, Asmawan T (2011) Above and belowground carbon stock. In: Widayati A, Suyanto,van Noordwijk M (eds) REALU project report for Tanjung Jabung Barat (Tanjabar), Jambi, Indonesia.World Agroforestry Centre, Bogor
Soares Filho BS, Rodrigues HO, Falieri A, Costa WL (2008) DINAMICA Ego Tutorial. Centro deSensoriamento Remoto/Universidade Federal de Minas Gerais, Belo HorizonteBrazil
Mitig Adapt Strateg Glob Change (2014) 19:773–788 787

Sofiyuddin M, Rahmanulloh A, Suyanto (2012) Assessment of profitability of land use systems in TanjungJabung Barat district, Jambi province, Indonesia. Open J For 2(4):252–256
Sunderland TCH, Ehringhaus C, Campbell BM (2008) Conservation and development in tropical forestlandscapes: a time to face the trade-offs? Environ Conserv 34(4):276–279
Suyamto DA, Mulia R, van Noordwijk M, Lusiana B (2009) FALLOW 2.0. Manual and Software. WorldAgroforestry Centre, Bogor
Tacconi L (2009) Compensated successful efforts for avoided deforestation vs. compensated reductions. EcolEcon 68:2469–2472
Tallis HT, Ricketts T, Guerry AD, Wood SA, Sharp R, Nelson E, Ennaanay D, Wolny S, Olwero N, VigerstolK, Pennington D, Mendoza G, Aukema J, Foster J, Forrest J, Cameron D, Arkema K, Lonsdorf E,Kennedy C, Verutes G, Kim CK, Guannel G, Papenfus M, Toft J, Marsik M, Bernhardt J, Griffin R (2013)InVEST 2.5.3 User’s Guide. The Natural Capital Project, Stanford
van Noordwijk M (2002) Scaling trade-offs between crop productivity, carbon stocks and biodiversity inshifting cultivation landscape mosaics: the FALLOW model. Ecol Model 149:113–126
van Noordwijk M, Minang PA (2009) If we cannot define it, we cannot save it. ASB Policy Brief 15. WorldAgroforestry Centre, Nairobi, Kenya
van Noordwijk M, Suyamto DA, Lusiana B, Ekadinata A, Hairiah K (2008) Facilitating agroforestation oflandscapes for sustainable benefits: tradeoffs between carbon stocks and local development benefits inIndonesia according to the FALLOW model. Agric Ecosyst Environ 126:98–112
van Noordwijk M, Minang PA, Dewi S, Hall J, Rantala S (2009) Reducing Emission from All Land Uses(REALU): The case for a whole landscape approach. ASB Policy Brief 13. World Agroforestry Centre,Nairobi, Kenya
Widayati A, Johana F, Zulkarnain MT (2011) Drivers of forest conversion and land use changes in thepeatland of Jambi: historical analyses towards intervention for emission reduction. In: Widayati A,Suyanto, van Noordwijk M (eds) REALU project report for Tanjung Jabung Barat (Tanjabar), Jambi,Indonesia. World Agroforestry Centre, Bogor
788 Mitig Adapt Strateg Glob Change (2014) 19:773–788