lost-worktime injuries and illnesses: characteristics … · in goods-producing industries such as...
TRANSCRIPT

NewsUnited StatesDepartmentof Labor
Bureau of Labor Statistics W ashington, D.C. 20212 Technical Information: (202) 691-6170 USDL 05-521 Media information: (202) 691-5902 For release: 10:00 A.M. EST Internet address: http://www.bls.gov/iif/home.htm Wednesday, March 30, 2005
LOST-WORKTIME INJURIES AND ILLNESSES: CHARACTERISTICS AND RESULTING DAYS AWAY FROM WORK, 2003
A total of 1.3 million injuries and illnesses in private industry required recuperation away from work beyond the day of the incident in 2003, according to the Bureau of Labor Statistics, U.S. Department of Labor. The three occupations with the greatest number of such injuries and illnesses – laborers and material movers; heavy and tractor-trailer truck drivers; and nursing aides, orderlies, and attendants – offer examples of the characteristics of these cases. Of the 89,510 injured laborers and material movers, 83 percent were men. Similarly, of the 71,900 injured heavy truck drivers, 95 percent were men. More than 4 out of 10 of both occupations’ injuries were sprains or strains, often to the trunk or lower extremities, stemming from overexertion or contacts with objects or equipment. Heavy truck drivers also suffered a large portion of their injuries due to transportation accidents and falls. In contrast, 91 percent of the 56,820 injured nursing aides and related workers were women. They predominantly suffered sprains and strains to their trunk (typically their back), due to overexertion related to lifting or moving patients.
Changes in Injuries and Illnesses with Days Away From Work Statistics Beginning with the 2003 reference year, two new classification systems and a redesigned confidentiality method were implemented. The 2002 North American Industry Classification System (NAICS) and the 2000 Standard Occupational Classification (SOC) Manual are now used to classify industry and occupation, respectively. Prior to 2003, the survey used the Standard Industrial Classification (SIC) system and the Bureau of the Census occupational coding system. Substantial differences between these systems resultin breaks in series for both industry and occupation data. Users are advised againstmaking comparisons between the 2003 industry and occupation categories and the results from previous years. Also new in this release, the data are shown in hundreds instead of thousands. This resulted as part of the change to a new confidentiality system.

In goods-producing industries such as construction and manufacturing, which make up about 21 percent of private industry employment but account for 31 percent of the injuries and illnesses requiring days away from work, contact with objects and equipment – such as being struck by an object – was the most prevalent event. This is in contrast to service providing industries, which make up 79 percent of private industry employment and account for 69 percent of the most severe injuries and illnesses. In major industry sectors that comprise service providing industries, the leading causes of injuries and illnesses with days away from work were overexertion – especially overexertion by lifting, falls on the same level, and contact with objects and equipment (chart 1).
This is the third of three annual releases reporting on 2003 data from the BLS
safety and health statistical series. The first release, in September 2004, covered work-related fatalities from the 2003 National Census of Fatal Occupational Injuries. In December 2004, a release based on the Survey of Occupational Injuries and Illnesses presented the number and frequency (incidence rates) of nonfatal occupational injuries and illnesses by industry and type of case. All three releases used NAICS for the first time.
Injuries and illnesses with days away from work, job transfer, or restriction are
comprised of two types: • those requiring at least one day away from work, with or without job transfer or
restricted work activity and • those requiring only job transfer or restricted work activity.
In 2003, there were 1.3 million cases requiring at least one day away from work and those cases are the focus of this release. There were over 980,000 cases of injuries and illnesses reported in 2003 with only job transfer or restricted work activity.
Of the major occupational groups, transportation and material moving
occupations suffered the most days away from work injuries and illnesses (Table 3). Twelve individual occupations had more than 20,000 days away from work injuries and illnesses and accounted for over 36 percent of the cases with days away from work (Table 4 and Chart 2). Three of these occupations, laborers and material movers, heavy and tractor-trailer truck drivers, and light or delivery service truck drivers, are classified in the major occupational group, transportation and material moving occupations. Due to the change in the occupational classification structure, the occupations with the greatest number of injuries and illnesses requiring days away from work are different than those identified in previous years.
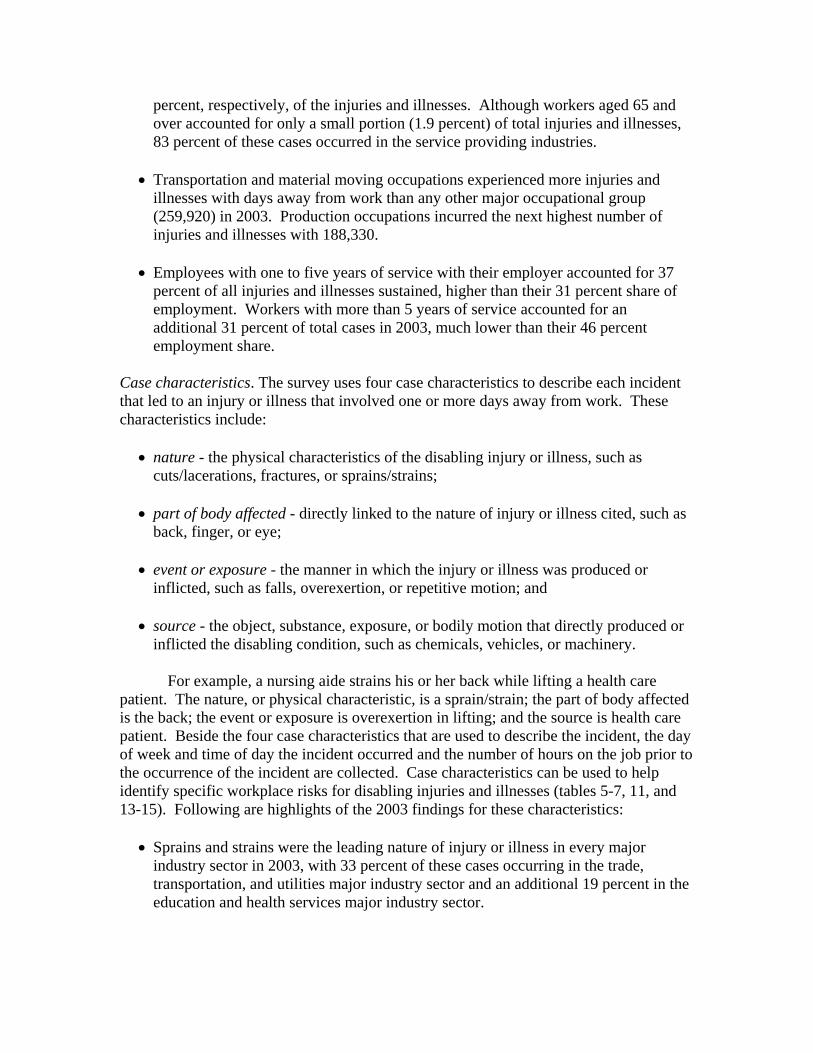
Sprains and strains, most often involving the back, accounted for 43 percent of
injuries and illnesses resulting in days away from work in 2003. When sprains and strains, bruises and contusions, cuts and lacerations, and fractures are combined, they accounted for nearly two-thirds of the cases with days away from work (chart 3).
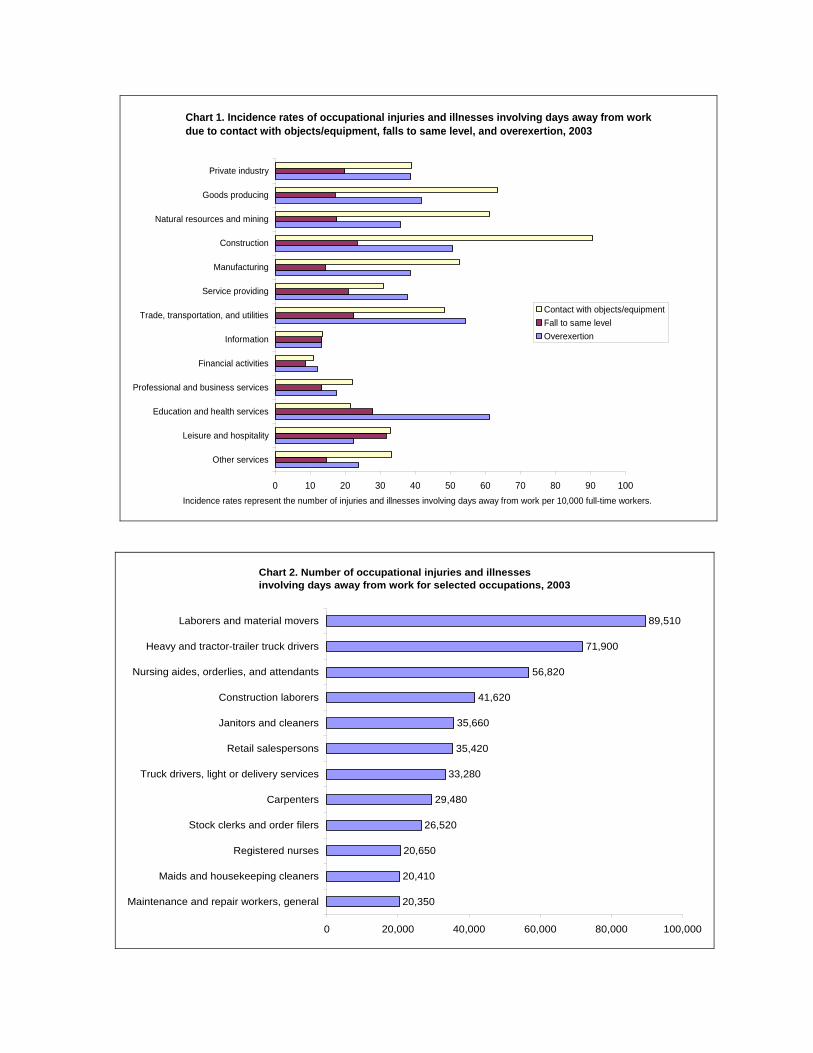
Chart 1. Incidence rates of occupational injuries and illnesses involving days away from work due to contact with objects/equipment, falls to same level, and overexertion, 2003
0 10 20 30 40 50 60 70 80 90 100
Other services
Leisure and hospitality
Education and health services
Professional and business services
Financial activities
Information
Trade, transportation, and utilities
Service providing
Manufacturing
Construction
Natural resources and mining
Goods producing
Private industry
Contact with objects/equipmentFall to same levelOverexertion
Incidence rates represent the number of injuries and illnesses involving days away from work per 10,000 full-time workers.
Chart 2. Number of occupational injuries and illnessesinvolving days away from work for selected occupations, 2003
20,350
20,410
20,650
26,520
29,480
33,280
35,420
35,660
41,620
56,820
71,900
89,510
0 20,000 40,000 60,000 80,000 100,000
Maintenance and repair workers, general
Maids and housekeeping cleaners
Registered nurses
Stock clerks and order filers
Carpenters
Truck drivers, light or delivery services
Retail salespersons
Janitors and cleaners
Construction laborers
Nursing aides, orderlies, and attendants
Heavy and tractor-trailer truck drivers
Laborers and material movers
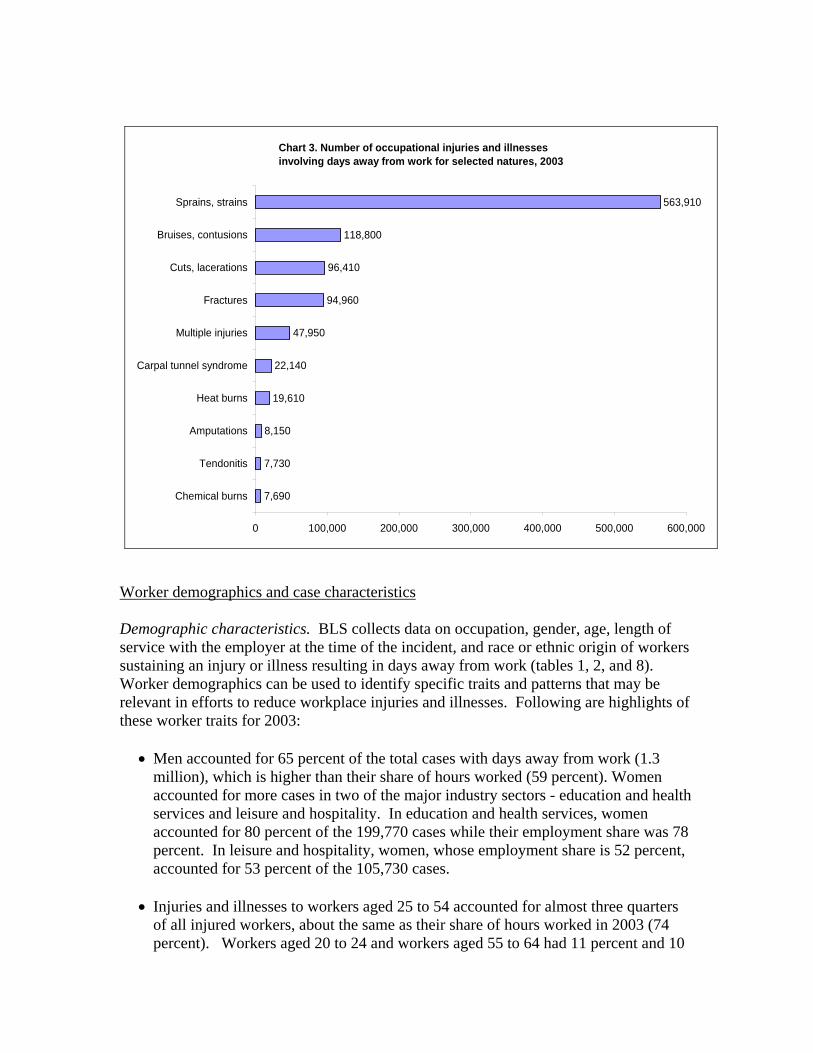
Chart 3. Number of occupational injuries and illnesses involving days away from work for selected natures, 2003
7,690
7,730
8,150
19,610
22,140
47,950
94,960
96,410
118,800
563,910
0 100,000 200,000 300,000 400,000 500,000 600,000
Chemical burns
Tendonitis
Amputations
Heat burns
Carpal tunnel syndrome
Multiple injuries
Fractures
Cuts, lacerations
Bruises, contusions
Sprains, strains
Worker demographics and case characteristics
Demographic characteristics. BLS collects data on occupation, gender, age, length of service with the employer at the time of the incident, and race or ethnic origin of workers sustaining an injury or illness resulting in days away from work (tables 1, 2, and 8). Worker demographics can be used to identify specific traits and patterns that may be relevant in efforts to reduce workplace injuries and illnesses. Following are highlights of these worker traits for 2003:
• Men accounted for 65 percent of the total cases with days away from work (1.3
million), which is higher than their share of hours worked (59 percent). Women accounted for more cases in two of the major industry sectors - education and health services and leisure and hospitality. In education and health services, women accounted for 80 percent of the 199,770 cases while their employment share was 78 percent. In leisure and hospitality, women, whose employment share is 52 percent, accounted for 53 percent of the 105,730 cases.
• Injuries and illnesses to workers aged 25 to 54 accounted for almost three quarters
of all injured workers, about the same as their share of hours worked in 2003 (74 percent). Workers aged 20 to 24 and workers aged 55 to 64 had 11 percent and 10
percent, respectively, of the injuries and illnesses. Although workers aged 65 and over accounted for only a small portion (1.9 percent) of total injuries and illnesses, 83 percent of these cases occurred in the service providing industries.
• Transportation and material moving occupations experienced more injuries and
illnesses with days away from work than any other major occupational group (259,920) in 2003. Production occupations incurred the next highest number of injuries and illnesses with 188,330.
• Employees with one to five years of service with their employer accounted for 37
percent of all injuries and illnesses sustained, higher than their 31 percent share of employment. Workers with more than 5 years of service accounted for an additional 31 percent of total cases in 2003, much lower than their 46 percent employment share.
Case characteristics. The survey uses four case characteristics to describe each incident that led to an injury or illness that involved one or more days away from work. These characteristics include:
• nature - the physical characteristics of the disabling injury or illness, such as cuts/lacerations, fractures, or sprains/strains;
• part of body affected - directly linked to the nature of injury or illness cited, such as
back, finger, or eye;
• event or exposure - the manner in which the injury or illness was produced or inflicted, such as falls, overexertion, or repetitive motion; and
• source - the object, substance, exposure, or bodily motion that directly produced or
inflicted the disabling condition, such as chemicals, vehicles, or machinery. For example, a nursing aide strains his or her back while lifting a health care
patient. The nature, or physical characteristic, is a sprain/strain; the part of body affected is the back; the event or exposure is overexertion in lifting; and the source is health care patient. Beside the four case characteristics that are used to describe the incident, the day of week and time of day the incident occurred and the number of hours on the job prior to the occurrence of the incident are collected. Case characteristics can be used to help identify specific workplace risks for disabling injuries and illnesses (tables 5-7, 11, and 13-15). Following are highlights of the 2003 findings for these characteristics:
• Sprains and strains were the leading nature of injury or illness in every major
industry sector in 2003, with 33 percent of these cases occurring in the trade, transportation, and utilities major industry sector and an additional 19 percent in the education and health services major industry sector.

• The trunk, which includes shoulder and back, was the part of body most affected by work incidents, accounting for 36 percent of all cases. In the education and health services major industry sector, 44 percent of all cases were to the trunk.
• Overexertion and contact with objects and equipment accounted for more than half
of all events or exposures that resulted in a disabling condition. Seventy-three percent of all overexertion cases were reported in the service providing industries. In the education and health services major industry sector, overexertion injuries accounted for almost 38 percent of all injuries and illnesses with days away from work.
• Floors, walkways, and ground surfaces; worker motion or position; containers; and
parts and materials accounted for 57 percent of reported cases in private industry and were the leading sources of injury and illness in 2003.
• The four hours from 8:00 A.M. to Noon accounted for 30 percent of all injuries and
illnesses with days away from work. The four hours from Noon to 4:00 P.M. accounted for an additional 23 percent of the cases. Time of event was not reported for 18 percent of the cases.
• Employees on the job from two to four hours incurred almost 22 percent of all
injuries and illnesses with days away from work. Employees on the job from four to six hours accounted for 16 percent and employees who had worked between six and eight hours accounted for an additional 15 percent. Even though small as a percentage of total injuries and illnesses (0.4 percent), 5,160 injuries and illnesses occurred before employees began their workshifts. Hours on the job before the injury occurred could not be computed for 19 percent of the cases.
• Injuries and illnesses with days away from work were fairly evenly distributed
between Monday and Friday. This pattern was consistent in all the major industry sectors except leisure and hospitality, where injuries and illnesses were distributed evenly from Monday to Saturday, with 12 percent of incidents occurring on Sunday.
Musculoskeletal disorders
The U.S. Department of Labor defines a musculoskeletal disorder (MSD) as an injury or disorder of the muscles, nerves, tendons, joints, cartilage, or spinal discs. MSDs do not include disorders caused by slips, trips, falls, motor vehicle accidents, or similar accidents. In 2003, MSDs accounted for 435,180, or 33 percent, of the injuries and illnesses with days away from work. Table A presents the number of MSDs by major industry sector, and table B presents the occupations with the most musculoskeletal disorders in 2003.
• The service providing industries reported the most musculoskeletal disorders,
accounting for 71 percent of all cases of this type. Within these industries, the
health care and social assistance industry sector reported the most cases of this type, 83,100, or 19 percent of all MSD cases.
• Goods producing industries reported 29 percent of all MSD cases, led by the
manufacturing industry sector with 19 percent.
• The three occupations with the most musculoskeletal disorders in 2003 were nursing aides, orderlies, and attendants (33,710), laborers and material movers (33,090) and heavy and tractor-trailer truck drivers.
Injury and illness severity
Besides identifying high risk situations, the survey also focuses on the length of
the absences resulting from these injuries and illnesses (tables 8-12 and 15). Median days away from work – the key survey measure of severity – designates the point at which half the cases involved more days and half involved fewer days.
The median days away from work for all cases was 8 days in 2003, up from 7 in
2002, with over one-fourth of the cases resulting in 31 days or more away from work. The median days away from work for goods producing industries was 10 days, compared to 7 days for service providing industries. The survey also found the following patterns:
• Among major disabling injuries and illnesses, median days away from work were
highest for carpal tunnel syndrome (32 days), fractures (30 days), and amputations (30 days).
• Among the most frequent events or exposures, repetitive motion, such as grasping
tools, scanning groceries, and typing, resulted in the longest absences from work – a median of 22 days. Falls to lower level resulted in the next longest absences from work with a median of 15 days followed by transportation accidents with a median of 14 days.
• Of the occupations with 0.5 percent or more of the total days away from work cases,
heavy and tractor-trailer truck drivers had the highest median days away from work with 14 days. Industrial machinery mechanics had the second highest median with 12 days. Light or delivery service truck drivers and industrial truck and tractor operators each had a median of 11 days.
• Injuries to the shoulder resulted in the longest absences from work – a median of 18
days, followed by injuries to the wrist – a median of 17 days, and injuries to the knee – a median of 14 days.

Table A. Number (hundreds) of work-related musculoskeletal disorders involving days away from work and median days away from work by major industry sector, 2003
Number
(hundreds) Median days
away from work
Total musculoskeletal disorders 4,351.8 10
Goods producing 1,254.0 13 Natural resources and mining 60.4 15 Agriculture forestry fishing and hunting 33.6 7 Mining 26.9 28 Construction 371.9 12 Manufacturing 821.6 13 Service providing 3,097.9 9 Trade transportation and utilities 1,414.4 11 Wholesale trade 276.8 7 Retail trade 641.6 9 Transportation and warehousing 472.8 17 Utilities 23.2 12 Information 66.4 13 Financial activities 131.2 15 Finance and insurance 51.8 15 Real estate and rental and leasing 79.4 18 Professional and business services 285.8 10 Professional and technical services 74.4 8 Management of companies and enterprises 51.5 11 Administrative and waste services 159.9 10 Educational and health services 858.9 7 Educational services 27.9 8 Health care and social assistance 831.0 7 Leisure and hospitality 249.0 8 Arts entertainment and recreation 45.1 7 Accommodation and food services 203.9 8 Other services except public administration 92.1 10

Technical note
The Bureau of Labor Statistics has reported annually on the number of days- away-from-work injuries and illnesses in private industry and the rate of such incidents since the early 1970s. The 2003 national survey marks the twelfth year that BLS has collected additional detailed information on such cases in the form of worker and case characteristics data, including lost worktime.
Data in this release are classified by industry based on the 2002 North American
Industry Classification System (NAICS) Manual, as defined by the Office of Management and Budget. NAICS recognizes hundreds of new businesses in the United States economy, most of which are in the service providing sector. NAICS classifies establishments into a detailed industry based on the production processes and provided services. Prior to the release of 2003 survey data, industries were classified using the Standard Industrial Classification system. As a result of the conversion to NAICS, the estimates by industry from the 2003 survey are not comparable with those from prior years.
Data in this release also mark the first time that occupations are classified by the
2000 Standard Occupational Classification Manual, as defined by the Office of Management and Budget. SOC is a hierarchical system that classifies occupations based on work performed and on required skills, education, training, and credentials. Apprentices and trainees are classified with the occupations for which they are being trained, while helpers are classified separately. Many occupations have been subdivided
Table B. Number (hundreds) of work-related musculoskeletal disorders involving days away from work and median days away from work by selected occupation, 2003
Number
(hundreds)
Median days away from work
Total musculoskeletal disorders 4,351.8 10 Nursing aides, orderlies, and attendants 337.1 6 Laborers and material movers 330.9 9 Heavy and tractor-trailer truck drivers 205.8 17 Janitors and cleaners, except maids and housekeeping cleaners 127.8 10 Light or delivery service truck drivers 126.5 13 Retail salespersons 112.9 7 Stock clerks and order fillers 109.4 8 Registered nurses 100.5 6 Construction laborers 96.1 10 Maids and housekeeping cleaners 76.9 9 Carpenters 65.7 9 First-line supervisors/managers of retail sales workers 64.1 7 Cashiers 63.1 8 Maintenance and repair workers, general 59.4 13 Automotive service technicians and mechanics 52.9 12
to more precise classifications. An example of this is truck drivers. Prior to this year, the Bureau of the Census classification system had two distinct categories for truck divers and drivers, sales workers. SOC now divides truck drivers into two distinct classifications – heavy and tractor-trailer truck drivers and light or delivery service truck drivers. These two truck driver classifications, along with driver, sales workers, make up a higher level aggregate. As a result of the conversion to SOC, the estimates by occupation from the 2003 survey are not comparable with those from prior years.
The classification of workers by race and ethnicity was revised in 2003 to
conform to other government data. One result of this revision is that individuals may be categorized in more than one race or ethnic group. Race and ethnicity is the only data element whose reporting is not mandatory in this survey. This resulted in 30 percent of the cases not reporting race and ethnicity in 2003.
The number and frequency (incidence rates) of days away from work cases are
based on logs and other records kept by private industry employers throughout the year. These records reflect not only the year’s injury and illness experience but also the employer’s understanding of which cases are work related under recordkeeping rules revised by the Occupational Safety and Health Administration (OSHA), U.S. Department of Labor and made effective on January 1, 2002. The number of injuries and illnesses reported in a given year also can be influenced by changes in the level of economic activity, working conditions and work practices, worker experience and training, and the number of hours worked.
The number of hours worked used for industry and case characteristics incidence
rates are collected in the Survey of Occupational Injuries and Illnesses. Because this survey does not collect hours worked or employment by demographic characteristics, the hours and employment used for these data come from the Current Population Survey, which is conducted by the Bureau of the Census for the Bureau of Labor Statistics. The nature, part of body, source, and event or exposure used to describe lost-worktime injuries and illnesses are based on definitions and rules of selection stipulated in the 1992 BLS Occupational Injury and Illness Classification System.
Work-related musculoskeletal disorders (MSD) include cases where the nature of
the injury or illness is sprains, strains, tears; back pain, hurt back; soreness, pain, hurt, except the back; carpal tunnel syndrome; hernia; or musculoskeletal system and connective tissue diseases and disorders, when the event or exposure leading to the injury or illness is bodily reaction/bending, climbing, crawling, reaching, twisting; overexertion; or repetition. Cases of Raynaud’s phenomenon, tarsal tunnel syndrome, and herniated spinal discs are not included. Although these cases may be considered MSDs, the survey classifies these cases in categories that also include non-MSD cases.
The survey is a Federal/State program in which employer reports are collected
from about 183,700 private industry establishments and processed by state agencies cooperating with the Bureau of Labor Statistics. Occupational injury and illness data for coal, metal, and nonmetal mining and for railroad activities were provided by the

Department of Labor’s Mine Safety and Health Administration and the Department of Transportation’s Federal Railroad Administration, respectively. Neither of these agencies adopted the revised OSHA recordkeeping requirements for 2003. Therefore, estimates for these industries for 2003 are not comparable with estimates for other industries. The survey excludes all fatalities at work and work-related nonfatal injuries and illnesses to the self-employed; workers on farms with fewer than 11 employees; private household workers; Federal government employees; and, for national estimates, employees in State and local government agencies.
The survey estimates of the characteristics of cases with days away from work are
based on a scientifically selected probability sample, rather than a census of the entire population. Two levels of sampling were used. First, establishments were selected to represent themselves and, in many instances, other establishments of like industry and workforce size that were not selected that survey year. Then, sampled establishments projected to have a large number of days away from work cases were instructed before the survey began on how to sample those cases to minimize the burden of their response.
Because the data are based on a sample survey, the injury and illness estimates
probably differ from the figures that would be obtained from all units covered by the survey. To determine the precision of each estimate, a standard error is calculated. The standard error defines a range (confidence interval) around the estimate. The approximate 95-percent confidence interval is the estimate plus or minus twice the standard error. The standard error also can be expressed as a percent of the estimate, or the relative standard error. For example, the 95-percent confidence interval for the 2003 incidence rate for occupational injuries and illnesses with days away from work of 150 per 10,000 full-time workers with the relative standard error of 0.7 percent would be 150 plus or minus 1.4 percent (2 times 0.7 percent) or 147.9 to 152.1. One can be 95 percent confident that the "true" incidence rate falls within the confidence interval. A relative standard error was calculated for each estimate from the survey and will be available in a future report. All findings in this release have been tested and found to be statistically significant using the 95-percent confidence interval.
The data also are subject to nonsampling error. The inability to obtain detailed
information about all cases in the sample, mistakes in recording or coding the data, and definitional difficulties are general examples of nonsampling error in the survey. Although not measured, nonsampling errors will always occur when statistics are gathered. However, BLS has implemented quality assurance procedures to reduce nonsampling error in the survey, including a rigorous training program for coders and a continuing effort to encourage survey participants to respond fully and accurately to all survey elements.
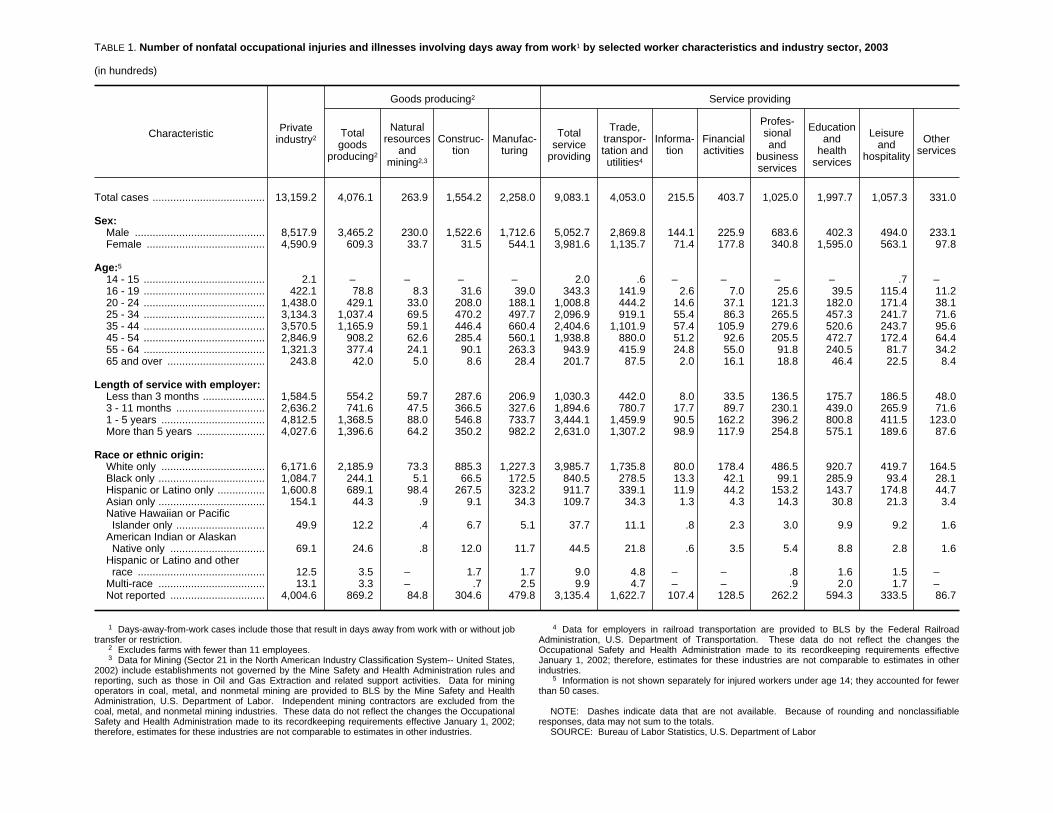
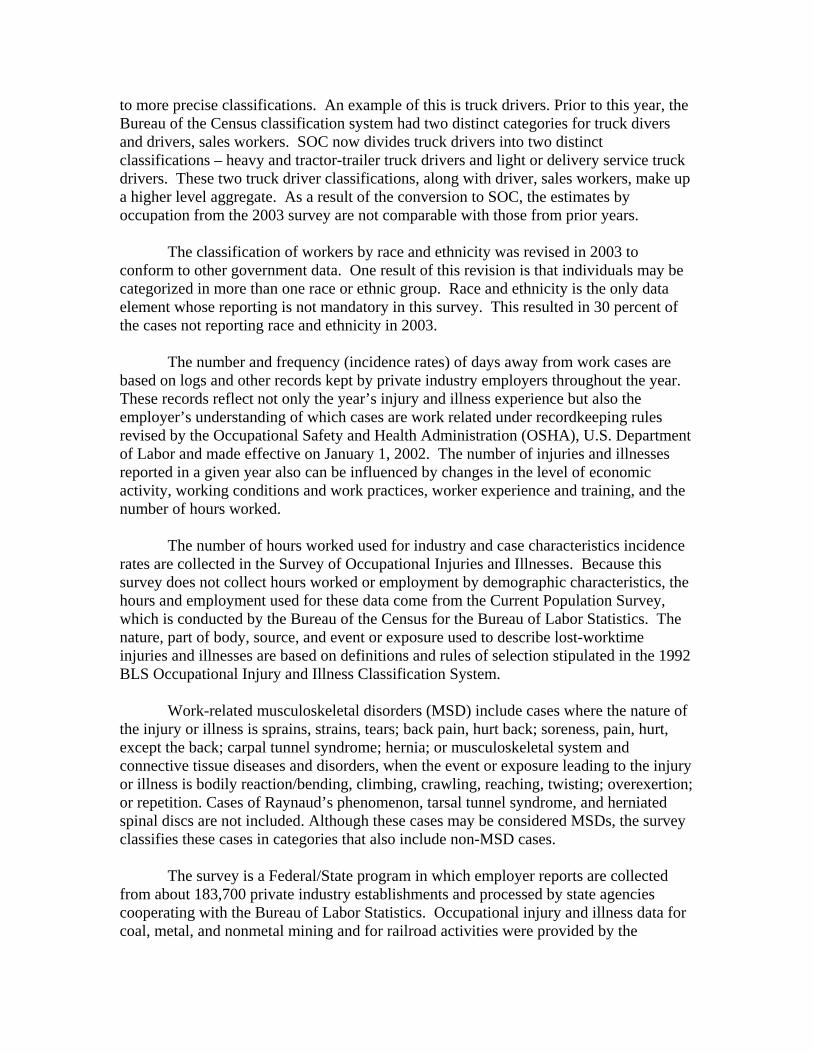
TABLE 1. Number of nonfatal occupational injuries and illnesses involving days away from work1 by selected worker characteristics and industry sector, 2003
(in hundreds)
Characteristic Privateindustry2
Goods producing2 Service providing
Totalgoods
producing2
Naturalresources
andmining2,3
Construc-tion
Manufac-turing
Totalservice
providing
Trade,transpor-tation andutilities4
Informa-tion
Financialactivities
Profes-sionaland
businessservices
Educationand
healthservices
Leisureand
hospitality
Otherservices
Total cases ...................................... 13,159.2 4,076.1 263.9 1,554.2 2,258.0 9,083.1 4,053.0 215.5 403.7 1,025.0 1,997.7 1,057.3 331.0
Sex:Male ............................................ 8,517.9 3,465.2 230.0 1,522.6 1,712.6 5,052.7 2,869.8 144.1 225.9 683.6 402.3 494.0 233.1Female ........................................ 4,590.9 609.3 33.7 31.5 544.1 3,981.6 1,135.7 71.4 177.8 340.8 1,595.0 563.1 97.8
Age:5
14 - 15 ......................................... 2.1 – – – – 2.0 .6 – – – – .7 –16 - 19 ......................................... 422.1 78.8 8.3 31.6 39.0 343.3 141.9 2.6 7.0 25.6 39.5 115.4 11.220 - 24 ......................................... 1,438.0 429.1 33.0 208.0 188.1 1,008.8 444.2 14.6 37.1 121.3 182.0 171.4 38.125 - 34 ......................................... 3,134.3 1,037.4 69.5 470.2 497.7 2,096.9 919.1 55.4 86.3 265.5 457.3 241.7 71.635 - 44 ......................................... 3,570.5 1,165.9 59.1 446.4 660.4 2,404.6 1,101.9 57.4 105.9 279.6 520.6 243.7 95.645 - 54 ......................................... 2,846.9 908.2 62.6 285.4 560.1 1,938.8 880.0 51.2 92.6 205.5 472.7 172.4 64.455 - 64 ......................................... 1,321.3 377.4 24.1 90.1 263.3 943.9 415.9 24.8 55.0 91.8 240.5 81.7 34.265 and over ................................. 243.8 42.0 5.0 8.6 28.4 201.7 87.5 2.0 16.1 18.8 46.4 22.5 8.4
Length of service with employer:Less than 3 months ..................... 1,584.5 554.2 59.7 287.6 206.9 1,030.3 442.0 8.0 33.5 136.5 175.7 186.5 48.03 - 11 months .............................. 2,636.2 741.6 47.5 366.5 327.6 1,894.6 780.7 17.7 89.7 230.1 439.0 265.9 71.61 - 5 years ................................... 4,812.5 1,368.5 88.0 546.8 733.7 3,444.1 1,459.9 90.5 162.2 396.2 800.8 411.5 123.0More than 5 years ....................... 4,027.6 1,396.6 64.2 350.2 982.2 2,631.0 1,307.2 98.9 117.9 254.8 575.1 189.6 87.6
Race or ethnic origin:White only ................................... 6,171.6 2,185.9 73.3 885.3 1,227.3 3,985.7 1,735.8 80.0 178.4 486.5 920.7 419.7 164.5Black only .................................... 1,084.7 244.1 5.1 66.5 172.5 840.5 278.5 13.3 42.1 99.1 285.9 93.4 28.1Hispanic or Latino only ................ 1,600.8 689.1 98.4 267.5 323.2 911.7 339.1 11.9 44.2 153.2 143.7 174.8 44.7Asian only .................................... 154.1 44.3 .9 9.1 34.3 109.7 34.3 1.3 4.3 14.3 30.8 21.3 3.4Native Hawaiian or PacificIslander only .............................. 49.9 12.2 .4 6.7 5.1 37.7 11.1 .8 2.3 3.0 9.9 9.2 1.6
American Indian or AlaskanNative only ................................ 69.1 24.6 .8 12.0 11.7 44.5 21.8 .6 3.5 5.4 8.8 2.8 1.6
Hispanic or Latino and otherrace ........................................... 12.5 3.5 – 1.7 1.7 9.0 4.8 – – .8 1.6 1.5 –
Multi-race .................................... 13.1 3.3 – .7 2.5 9.9 4.7 – – .9 2.0 1.7 –Not reported ................................ 4,004.6 869.2 84.8 304.6 479.8 3,135.4 1,622.7 107.4 128.5 262.2 594.3 333.5 86.7
1 Days-away-from-work cases include those that result in days away from work with or without jobtransfer or restriction.
2 Excludes farms with fewer than 11 employees.3 Data for Mining (Sector 21 in the North American Industry Classification System-- United States,
2002) include establishments not governed by the Mine Safety and Health Administration rules andreporting, such as those in Oil and Gas Extraction and related support activities. Data for miningoperators in coal, metal, and nonmetal mining are provided to BLS by the Mine Safety and HealthAdministration, U.S. Department of Labor. Independent mining contractors are excluded from thecoal, metal, and nonmetal mining industries. These data do not reflect the changes the OccupationalSafety and Health Administration made to its recordkeeping requirements effective January 1, 2002;therefore, estimates for these industries are not comparable to estimates in other industries.
4 Data for employers in railroad transportation are provided to BLS by the Federal RailroadAdministration, U.S. Department of Transportation. These data do not reflect the changes theOccupational Safety and Health Administration made to its recordkeeping requirements effectiveJanuary 1, 2002; therefore, estimates for these industries are not comparable to estimates in otherindustries.
5 Information is not shown separately for injured workers under age 14; they accounted for fewerthan 50 cases.
NOTE: Dashes indicate data that are not available. Because of rounding and nonclassifiableresponses, data may not sum to the totals.
SOURCE: Bureau of Labor Statistics, U.S. Department of Labor
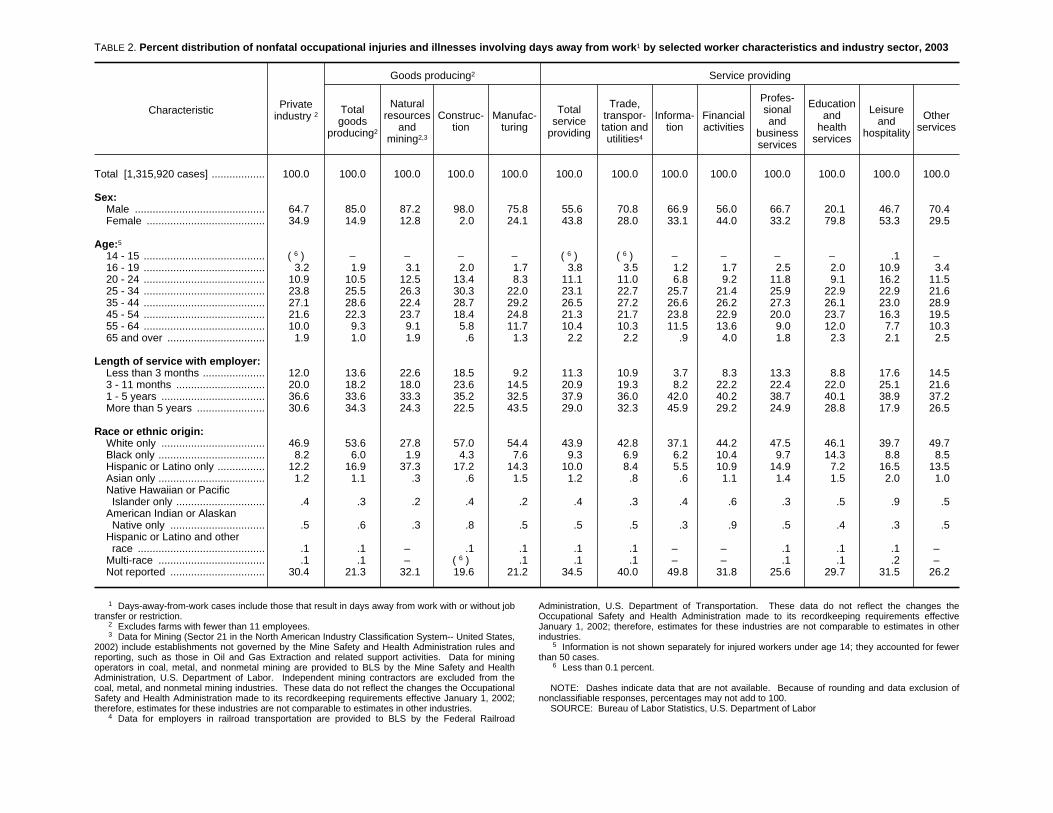
TABLE 2. Percent distribution of nonfatal occupational injuries and illnesses involving days away from work1 by selected worker characteristics and industry sector, 2003
Characteristic Privateindustry 2
Goods producing2 Service providing
Totalgoods
producing2
Naturalresources
andmining2,3
Construc-tion
Manufac-turing
Totalservice
providing
Trade,transpor-tation andutilities4
Informa-tion
Financialactivities
Profes-sionaland
businessservices
Educationand
healthservices
Leisureand
hospitality
Otherservices
Total [1,315,920 cases] .................. 100.0 100.0 100.0 100.0 100.0 100.0 100.0 100.0 100.0 100.0 100.0 100.0 100.0
Sex:Male ............................................ 64.7 85.0 87.2 98.0 75.8 55.6 70.8 66.9 56.0 66.7 20.1 46.7 70.4Female ........................................ 34.9 14.9 12.8 2.0 24.1 43.8 28.0 33.1 44.0 33.2 79.8 53.3 29.5
Age:5
14 - 15 ......................................... 6( ) – – – – 6( ) 6( ) – – – – .1 –16 - 19 ......................................... 3.2 1.9 3.1 2.0 1.7 3.8 3.5 1.2 1.7 2.5 2.0 10.9 3.420 - 24 ......................................... 10.9 10.5 12.5 13.4 8.3 11.1 11.0 6.8 9.2 11.8 9.1 16.2 11.525 - 34 ......................................... 23.8 25.5 26.3 30.3 22.0 23.1 22.7 25.7 21.4 25.9 22.9 22.9 21.635 - 44 ......................................... 27.1 28.6 22.4 28.7 29.2 26.5 27.2 26.6 26.2 27.3 26.1 23.0 28.945 - 54 ......................................... 21.6 22.3 23.7 18.4 24.8 21.3 21.7 23.8 22.9 20.0 23.7 16.3 19.555 - 64 ......................................... 10.0 9.3 9.1 5.8 11.7 10.4 10.3 11.5 13.6 9.0 12.0 7.7 10.365 and over ................................. 1.9 1.0 1.9 .6 1.3 2.2 2.2 .9 4.0 1.8 2.3 2.1 2.5
Length of service with employer:Less than 3 months ..................... 12.0 13.6 22.6 18.5 9.2 11.3 10.9 3.7 8.3 13.3 8.8 17.6 14.53 - 11 months .............................. 20.0 18.2 18.0 23.6 14.5 20.9 19.3 8.2 22.2 22.4 22.0 25.1 21.61 - 5 years ................................... 36.6 33.6 33.3 35.2 32.5 37.9 36.0 42.0 40.2 38.7 40.1 38.9 37.2More than 5 years ....................... 30.6 34.3 24.3 22.5 43.5 29.0 32.3 45.9 29.2 24.9 28.8 17.9 26.5
Race or ethnic origin:White only ................................... 46.9 53.6 27.8 57.0 54.4 43.9 42.8 37.1 44.2 47.5 46.1 39.7 49.7Black only .................................... 8.2 6.0 1.9 4.3 7.6 9.3 6.9 6.2 10.4 9.7 14.3 8.8 8.5Hispanic or Latino only ................ 12.2 16.9 37.3 17.2 14.3 10.0 8.4 5.5 10.9 14.9 7.2 16.5 13.5Asian only .................................... 1.2 1.1 .3 .6 1.5 1.2 .8 .6 1.1 1.4 1.5 2.0 1.0Native Hawaiian or PacificIslander only .............................. .4 .3 .2 .4 .2 .4 .3 .4 .6 .3 .5 .9 .5
American Indian or AlaskanNative only ................................ .5 .6 .3 .8 .5 .5 .5 .3 .9 .5 .4 .3 .5
Hispanic or Latino and otherrace ........................................... .1 .1 – .1 .1 .1 .1 – – .1 .1 .1 –
Multi-race .................................... .1 .1 – 6( ) .1 .1 .1 – – .1 .1 .2 –Not reported ................................ 30.4 21.3 32.1 19.6 21.2 34.5 40.0 49.8 31.8 25.6 29.7 31.5 26.2
1 Days-away-from-work cases include those that result in days away from work with or without jobtransfer or restriction.
2 Excludes farms with fewer than 11 employees.3 Data for Mining (Sector 21 in the North American Industry Classification System-- United States,
2002) include establishments not governed by the Mine Safety and Health Administration rules andreporting, such as those in Oil and Gas Extraction and related support activities. Data for miningoperators in coal, metal, and nonmetal mining are provided to BLS by the Mine Safety and HealthAdministration, U.S. Department of Labor. Independent mining contractors are excluded from thecoal, metal, and nonmetal mining industries. These data do not reflect the changes the OccupationalSafety and Health Administration made to its recordkeeping requirements effective January 1, 2002;therefore, estimates for these industries are not comparable to estimates in other industries.
4 Data for employers in railroad transportation are provided to BLS by the Federal Railroad
Administration, U.S. Department of Transportation. These data do not reflect the changes theOccupational Safety and Health Administration made to its recordkeeping requirements effectiveJanuary 1, 2002; therefore, estimates for these industries are not comparable to estimates in otherindustries.
5 Information is not shown separately for injured workers under age 14; they accounted for fewerthan 50 cases.
6 Less than 0.1 percent.
NOTE: Dashes indicate data that are not available. Because of rounding and data exclusion ofnonclassifiable responses, percentages may not add to 100.
SOURCE: Bureau of Labor Statistics, U.S. Department of Labor

TABLE 3. Number of nonfatal occupational injuries and illnesses involving days away from work1 by major occupational group and industry sector, 2003
(in hundreds)
Occupation Privateindustry2
Goods producing2 Service providing
Totalgoods
producing2
Naturalresources
andmining2,3
Construc-tion
Manufac-turing
Totalservice
providing
Trade,transpor-tation andutilities4
Informa-tion
Financialactivities
Profes-sionaland
businessservices
Educationand
healthservices
Leisureand
hospitality
Otherservices
Total cases ................................................... 13,159.2 4,076.1 263.9 1,554.2 2,258.0 9,083.1 4,053.0 215.5 403.7 1,025.0 1,997.7 1,057.3 331.0
Management occupations .......................... 198.3 43.9 4.1 19.2 20.7 154.3 35.3 5.3 27.3 24.2 31.8 19.0 11.4Business and financial operations
occupations .............................................. 67.8 6.3 – 1.0 5.2 61.5 13.2 2.9 24.5 7.1 8.6 1.3 3.9Computer and mathematical occupations .. 36.8 3.9 – – 3.8 32.9 5.2 5.3 5.4 12.9 2.8 – .8Architecture and engineering
occupations .............................................. 59.4 20.9 .6 4.3 15.9 38.5 5.6 3.8 .7 26.7 .8 – .5Life, physical, and social science
occupations .............................................. 24.7 9.9 1.9 – 7.6 14.8 1.4 .5 .6 8.4 3.5 – –Community and social services
occupations .............................................. 88.5 – – – – 88.4 .4 – – 2.5 76.2 .8 8.2Legal occupations ...................................... 11.1 – – – – 11.1 – – .9 8.8 1.0 – .2Education, training, and library
occupations .............................................. 83.4 .5 – – .5 82.9 – 2.9 – .8 72.1 1.6 5.3Arts, design, entertainment, sports, and
media occupations ................................... 65.9 3.1 – .6 2.5 62.8 11.5 10.4 .7 8.5 2.4 28.0 1.3Healthcare practitioners and technical
occupations .............................................. 496.3 1.3 .7 – .6 495.0 8.2 – 6.2 16.0 462.1 .8 1.6Healthcare support occupations ................ 805.7 .4 – – .3 805.3 7.3 – 3.2 27.8 763.3 1.1 2.7Protective service occupations .................. 113.0 3.3 .4 .7 2.3 109.6 11.6 .3 6.2 60.0 14.7 14.2 2.7Food preparation and serving related
occupations .............................................. 859.2 4.5 .3 1.0 3.3 854.7 124.8 1.4 4.8 12.0 80.2 624.8 6.7Building and grounds cleaning and
maintenance occupations ........................ 781.5 54.9 3.3 10.6 41.0 726.6 48.0 3.2 82.6 235.7 159.3 174.3 23.6Personal care and service occupations ..... 244.7 .7 – – .2 244.0 82.9 .9 3.5 11.3 78.1 43.1 24.2Sales and related occupations ................... 864.9 20.2 .3 2.4 17.5 844.7 721.4 9.7 27.8 30.2 4.8 37.2 13.7Office and administrative support
occupations .............................................. 1,068.7 99.5 1.5 7.2 90.7 969.2 523.0 49.3 102.4 127.6 125.5 20.5 21.0Farming, fishing, and forestry
occupations .............................................. 161.3 143.8 135.5 – 8.1 17.5 9.3 – – 6.8 – 1.2 –Construction and extraction occupations ... 1,511.3 1,362.5 43.1 1,247.9 71.6 148.8 60.2 1.8 12.0 47.5 11.9 4.8 10.6Installation, maintenance, and repair
occupations .............................................. 1,097.8 319.2 20.7 142.9 155.6 778.7 430.3 77.2 47.0 77.4 28.2 26.0 92.6Production occupations .............................. 1,883.3 1,468.9 17.6 52.8 1,398.5 414.4 229.9 16.7 5.0 77.2 25.2 21.5 38.9Transportation and material moving
occupations .............................................. 2,599.2 496.0 33.3 58.0 404.7 2,103.2 1,713.6 21.5 38.2 194.3 41.7 34.6 59.3
1 Days-away-from-work cases include those that result in days away from work with or without jobtransfer or restriction.
2 Excludes farms with fewer than 11 employees.3 Data for Mining (Sector 21 in the North American Industry Classification System-- United States,
2002) include establishments not governed by the Mine Safety and Health Administration rules andreporting, such as those in Oil and Gas Extraction and related support activities. Data for mining operatorsin coal, metal, and nonmetal mining are provided to BLS by the Mine Safety and Health Administration,U.S. Department of Labor. Independent mining contractors are excluded from the coal, metal, andnonmetal mining industries. These data do not reflect the changes the Occupational Safety and HealthAdministration made to its recordkeeping requirements effective January 1, 2002; therefore, estimates for
these industries are not comparable to estimates in other industries. 4 Data for employers in railroad transportation are provided to BLS by the Federal Railroad
Administration, U.S. Department of Transportation. These data do not reflect the changes theOccupational Safety and Health Administration made to its recordkeeping requirements effective January1, 2002; therefore, estimates for these industries are not comparable to estimates in other industries.
NOTE: Dashes indicate data that are not available. Because of rounding and nonclassifiableresponses, data may not sum to the totals.
SOURCE: Bureau of Labor Statistics, U.S. Department of Labor
TABLE 4. Number of nonfatal occupational injuries and illnesses involving days away from work1 by selected worker occupation and industry sector, 2003
(in hundreds)
Occupation Privateindustry2
Goods producing2 Service providing
Totalgoods
producing2
Naturalresources
andmining2,3
Construc-tion
Manufac-turing
Totalservice
providing
Trade,transpor-tation andutilities4
Informa-tion
Financialactivities
Profes-sionaland
businessservices
Educationand
healthservices
Leisureand
hospitality
Otherservices
Total cases ................................................... 13,159.2 4,076.1 263.9 1,554.2 2,258.0 9,083.1 4,053.0 215.5 403.7 1,025.0 1,997.7 1,057.3 331.0
Labor and freight, stock, and materialmovers, hand ............................................. 895.1 201.0 2.0 2.3 196.7 694.0 579.1 9.6 10.5 59.6 14.8 9.4 11.0
Truck drivers, heavy and tractor-trailer ........ 719.0 111.6 11.2 35.8 64.6 607.4 518.6 1.4 2.7 70.3 4.7 1.0 8.6Nursing aides, orderlies, and attendants ..... 568.2 – – – – 568.2 – – 2.4 6.6 558.0 – .7Construction laborers ................................... 416.2 389.7 1.7 376.6 11.4 26.5 14.0 .5 1.5 8.5 .6 – 1.1Janitors and cleaners, except maids andhousekeeping cleaners .............................. 356.6 44.0 1.6 5.0 37.4 312.5 37.9 2.7 55.9 93.3 64.6 47.8 10.4
Retail salespersons ...................................... 354.2 2.6 – .7 1.8 351.6 342.4 .7 1.7 2.4 .9 2.5 .9Truck drivers, light or delivery services ........ 332.8 32.9 2.4 6.6 23.9 299.9 255.5 3.4 8.2 18.0 3.6 4.2 7.0Carpenters ................................................... 294.8 259.4 .5 246.1 12.8 35.4 12.6 .4 5.5 9.6 3.7 1.6 2.0Stock clerks and order fillers ........................ 265.2 22.6 – 2.1 20.4 242.6 217.6 1.2 .7 14.0 6.1 1.9 1.1Registered nurses ........................................ 206.5 – – – – 206.4 – – .4 2.9 202.7 – –Maids and housekeeping cleaners .............. 204.1 .9 – – .6 203.2 1.6 – 8.4 21.1 75.9 94.0 2.0Maintenance and repair workers, general .... 203.5 40.8 1.8 6.7 32.3 162.7 57.4 3.7 18.6 39.7 18.1 16.8 8.4Automotive service technicians andmechanics .................................................. 172.4 11.2 2.8 2.8 5.6 161.1 111.8 – 4.9 9.0 .6 .7 34.1
Cashiers ....................................................... 169.9 – – – .2 169.7 139.2 .3 – 5.7 1.9 19.9 2.4First line supervisors/managers of retailsales workers ............................................. 169.0 .7 – – .6 168.3 153.6 – 5.2 .7 .7 6.4 1.6
Combined food preparation and servingworkers, including fast food ....................... 159.7 – – – – 159.6 72.3 – .4 2.4 1.3 83.2 –
Customer service representatives ............... 129.3 5.5 – .6 4.9 123.8 61.3 17.2 22.8 17.3 2.5 .6 2.1Waiters and waitresses ................................ 119.3 .3 – – .3 119.0 1.4 – .9 1.1 .8 114.0 .7Cooks, restaurant ......................................... 119.2 – – – – 119.1 .9 – – – .4 115.9 1.9Landscaping and groundskeepingworkers ...................................................... 118.9 5.5 1.1 3.0 1.4 113.4 5.9 – 12.3 53.6 8.6 23.1 9.7
Welders, cutters, solderers, and brazers ..... 116.8 99.9 1.6 10.0 88.4 16.9 6.3 – 1.2 1.7 – – 7.4Industrial machinery mechanics ................... 107.3 76.5 7.7 5.4 63.4 30.8 20.2 .7 3.0 3.0 .4 – 3.3Shipping, receiving, and traffic clerks .......... 106.6 32.9 .5 – 31.9 73.6 63.9 1.5 .5 4.5 1.2 .7 1.4Electricians ................................................... 106.5 95.9 2.1 84.8 9.0 10.6 4.1 .5 .4 2.0 2.1 – 1.1Plumbers, pipefitters, and steamfitters ......... 105.7 89.9 .2 83.2 6.6 15.8 3.6 – .9 7.4 2.6 – 1.0
1 Days-away-from-work cases include those that result in days away from work with or without jobtransfer or restriction.
2 Excludes farms with fewer than 11 employees.3 Data for Mining (Sector 21 in the North American Industry Classification System-- United States,
2002) include establishments not governed by the Mine Safety and Health Administration rules andreporting, such as those in Oil and Gas Extraction and related support activities. Data for mining operatorsin coal, metal, and nonmetal mining are provided to BLS by the Mine Safety and Health Administration,U.S. Department of Labor. Independent mining contractors are excluded from the coal, metal, andnonmetal mining industries. These data do not reflect the changes the Occupational Safety and HealthAdministration made to its recordkeeping requirements effective January 1, 2002; therefore, estimates for
these industries are not comparable to estimates in other industries. 4 Data for employers in railroad transportation are provided to BLS by the Federal Railroad
Administration, U.S. Department of Transportation. These data do not reflect the changes theOccupational Safety and Health Administration made to its recordkeeping requirements effective January1, 2002; therefore, estimates for these industries are not comparable to estimates in other industries.
NOTE: Dashes indicate data that are not available. Because of rounding and nonclassifiableresponses, data may not sum to the totals.
SOURCE: Bureau of Labor Statistics, U.S. Department of Labor

TABLE 5. Number of nonfatal occupational injuries and illnesses involving days away from work1 by selected injury or illness characteristics and industry sector, 2003
(in hundreds)
Characteristic Privateindustry2
Goods producing2 Service providing
Totalgoods
producing2
Naturalresources
andmining2,3
Construc-tion
Manufac-turing
Totalservice
providing
Trade,transpor-tation andutilities4
Informa-tion
Financialactivities
Profes-sionaland
businessservices
Educationand
healthservices
Leisureand
hospitality
Otherservices
Total cases ...................................... 13,159.2 4,076.1 263.9 1,554.2 2,258.0 9,083.1 4,053.0 215.5 403.7 1,025.0 1,997.7 1,057.3 331.0
Nature of injury or illness:Sprains, strains ........................... 5,639.1 1,494.1 94.9 557.1 842.1 4,145.0 1,872.8 93.8 161.3 429.8 1,077.2 389.4 120.7Bruises, contusions ..................... 1,188.0 309.0 26.4 101.8 180.9 879.0 399.1 22.9 32.6 99.5 180.1 121.6 23.2Cuts, lacerations ......................... 964.1 382.0 16.0 177.8 188.1 582.2 266.1 8.2 23.3 79.2 49.5 124.3 31.6Fractures ..................................... 949.6 375.4 27.0 182.5 165.9 574.1 268.7 16.1 26.3 71.5 106.0 63.9 21.6Heat burns ................................... 196.1 59.3 5.1 15.5 38.7 136.7 28.0 .7 2.9 6.3 17.8 73.1 7.9Carpal tunnel syndrome .............. 221.4 88.6 1.0 8.5 79.1 132.8 46.6 5.8 21.8 23.9 19.2 8.8 6.8Tendonitis .................................... 77.3 31.8 1.0 4.9 25.8 45.5 20.8 1.6 3.5 4.8 8.8 4.2 1.9Chemical burns ........................... 76.9 32.4 3.4 7.7 21.3 44.5 19.5 .7 3.3 4.3 6.9 7.6 2.2Amputations ................................ 81.5 51.8 3.5 10.8 37.5 29.7 16.2 .4 .8 5.7 1.7 3.3 1.7Multiple traumatic injuries ............ 479.5 146.9 11.2 61.4 74.3 332.6 142.1 7.8 20.0 40.7 71.3 37.3 13.5
Part of body affected by theinjury or illness:
Head ............................................ 847.4 301.7 20.2 118.6 162.8 545.8 254.6 10.7 25.1 71.0 92.4 62.9 29.2Eye ............................................ 369.4 177.4 10.4 64.4 102.7 192.0 91.7 4.1 10.7 23.6 25.5 22.1 14.2
Neck ............................................ 212.2 49.3 3.2 18.8 27.3 162.9 74.4 2.9 5.5 22.2 41.9 11.8 4.4Trunk ........................................... 4,725.1 1,350.2 85.5 496.2 768.6 3,374.9 1,550.4 65.3 128.9 325.7 872.1 328.0 104.5Shoulder .................................... 845.2 255.4 17.4 77.9 160.1 589.8 290.7 13.2 24.5 53.5 139.9 52.0 16.0Back .......................................... 3,037.5 806.3 48.9 315.6 441.9 2,231.2 981.0 41.1 86.0 223.9 620.9 210.1 68.2
Upper extremities ........................ 2,985.3 1,133.1 55.2 367.7 710.2 1,852.2 798.4 45.4 88.7 224.1 309.2 300.7 85.7Wrist .......................................... 652.8 228.0 8.3 61.1 158.6 424.8 174.2 14.6 33.9 49.4 85.1 49.3 18.5Hand, except finger ................... 511.2 190.9 11.5 75.1 104.3 320.2 132.2 7.0 12.5 37.8 48.2 67.2 15.3Finger ........................................ 1,063.7 457.2 19.6 145.8 291.8 606.6 270.1 11.6 20.6 85.9 77.5 112.6 28.4
Lower extremities ........................ 2,795.7 846.5 70.1 385.7 390.7 1,949.2 918.9 59.8 84.7 235.1 362.2 224.4 64.1Knee .......................................... 1,058.6 305.5 23.8 133.3 148.5 753.0 346.0 27.7 29.6 87.4 153.5 84.1 24.7Foot, except toe ........................ 439.0 150.6 8.3 71.7 70.6 288.3 151.4 10.5 9.1 31.6 47.2 27.7 10.8Toe ............................................ 124.7 39.5 3.0 17.9 18.6 85.2 49.3 1.5 2.4 10.6 12.0 7.2 2.2
Body systems .............................. 184.9 42.2 2.6 16.5 23.1 142.7 48.1 2.4 10.2 22.7 38.9 15.7 4.8Multiple parts ............................... 1,304.1 318.6 24.9 137.3 156.3 985.5 378.5 27.5 55.8 113.1 272.5 103.2 34.9
See footnotes at end of table.
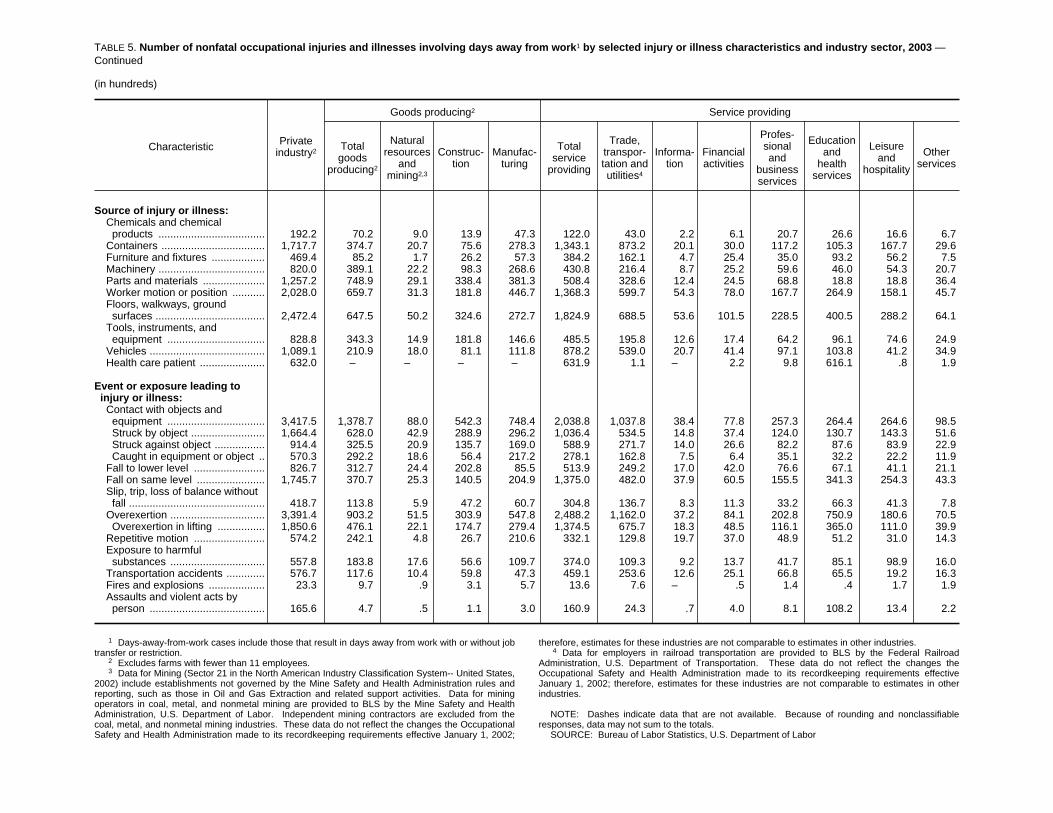
TABLE 5. Number of nonfatal occupational injuries and illnesses involving days away from work1 by selected injury or illness characteristics and industry sector, 2003 —Continued
(in hundreds)
Characteristic Privateindustry2
Goods producing2 Service providing
Totalgoods
producing2
Naturalresources
andmining2,3
Construc-tion
Manufac-turing
Totalservice
providing
Trade,transpor-tation andutilities4
Informa-tion
Financialactivities
Profes-sionaland
businessservices
Educationand
healthservices
Leisureand
hospitality
Otherservices
Source of injury or illness:Chemicals and chemicalproducts .................................... 192.2 70.2 9.0 13.9 47.3 122.0 43.0 2.2 6.1 20.7 26.6 16.6 6.7
Containers ................................... 1,717.7 374.7 20.7 75.6 278.3 1,343.1 873.2 20.1 30.0 117.2 105.3 167.7 29.6Furniture and fixtures .................. 469.4 85.2 1.7 26.2 57.3 384.2 162.1 4.7 25.4 35.0 93.2 56.2 7.5Machinery .................................... 820.0 389.1 22.2 98.3 268.6 430.8 216.4 8.7 25.2 59.6 46.0 54.3 20.7Parts and materials ..................... 1,257.2 748.9 29.1 338.4 381.3 508.4 328.6 12.4 24.5 68.8 18.8 18.8 36.4Worker motion or position ........... 2,028.0 659.7 31.3 181.8 446.7 1,368.3 599.7 54.3 78.0 167.7 264.9 158.1 45.7Floors, walkways, groundsurfaces ..................................... 2,472.4 647.5 50.2 324.6 272.7 1,824.9 688.5 53.6 101.5 228.5 400.5 288.2 64.1
Tools, instruments, andequipment ................................. 828.8 343.3 14.9 181.8 146.6 485.5 195.8 12.6 17.4 64.2 96.1 74.6 24.9
Vehicles ....................................... 1,089.1 210.9 18.0 81.1 111.8 878.2 539.0 20.7 41.4 97.1 103.8 41.2 34.9Health care patient ...................... 632.0 – – – – 631.9 1.1 – 2.2 9.8 616.1 .8 1.9
Event or exposure leading toinjury or illness:
Contact with objects andequipment ................................. 3,417.5 1,378.7 88.0 542.3 748.4 2,038.8 1,037.8 38.4 77.8 257.3 264.4 264.6 98.5Struck by object ......................... 1,664.4 628.0 42.9 288.9 296.2 1,036.4 534.5 14.8 37.4 124.0 130.7 143.3 51.6Struck against object ................. 914.4 325.5 20.9 135.7 169.0 588.9 271.7 14.0 26.6 82.2 87.6 83.9 22.9Caught in equipment or object .. 570.3 292.2 18.6 56.4 217.2 278.1 162.8 7.5 6.4 35.1 32.2 22.2 11.9
Fall to lower level ........................ 826.7 312.7 24.4 202.8 85.5 513.9 249.2 17.0 42.0 76.6 67.1 41.1 21.1Fall on same level ....................... 1,745.7 370.7 25.3 140.5 204.9 1,375.0 482.0 37.9 60.5 155.5 341.3 254.3 43.3Slip, trip, loss of balance withoutfall .............................................. 418.7 113.8 5.9 47.2 60.7 304.8 136.7 8.3 11.3 33.2 66.3 41.3 7.8
Overexertion ................................ 3,391.4 903.2 51.5 303.9 547.8 2,488.2 1,162.0 37.2 84.1 202.8 750.9 180.6 70.5Overexertion in lifting ................ 1,850.6 476.1 22.1 174.7 279.4 1,374.5 675.7 18.3 48.5 116.1 365.0 111.0 39.9
Repetitive motion ........................ 574.2 242.1 4.8 26.7 210.6 332.1 129.8 19.7 37.0 48.9 51.2 31.0 14.3Exposure to harmfulsubstances ................................ 557.8 183.8 17.6 56.6 109.7 374.0 109.3 9.2 13.7 41.7 85.1 98.9 16.0
Transportation accidents ............. 576.7 117.6 10.4 59.8 47.3 459.1 253.6 12.6 25.1 66.8 65.5 19.2 16.3Fires and explosions ................... 23.3 9.7 .9 3.1 5.7 13.6 7.6 – .5 1.4 .4 1.7 1.9Assaults and violent acts byperson ....................................... 165.6 4.7 .5 1.1 3.0 160.9 24.3 .7 4.0 8.1 108.2 13.4 2.2
1 Days-away-from-work cases include those that result in days away from work with or without jobtransfer or restriction.
2 Excludes farms with fewer than 11 employees.3 Data for Mining (Sector 21 in the North American Industry Classification System-- United States,
2002) include establishments not governed by the Mine Safety and Health Administration rules andreporting, such as those in Oil and Gas Extraction and related support activities. Data for miningoperators in coal, metal, and nonmetal mining are provided to BLS by the Mine Safety and HealthAdministration, U.S. Department of Labor. Independent mining contractors are excluded from thecoal, metal, and nonmetal mining industries. These data do not reflect the changes the OccupationalSafety and Health Administration made to its recordkeeping requirements effective January 1, 2002;
therefore, estimates for these industries are not comparable to estimates in other industries. 4 Data for employers in railroad transportation are provided to BLS by the Federal Railroad
Administration, U.S. Department of Transportation. These data do not reflect the changes theOccupational Safety and Health Administration made to its recordkeeping requirements effectiveJanuary 1, 2002; therefore, estimates for these industries are not comparable to estimates in otherindustries.
NOTE: Dashes indicate data that are not available. Because of rounding and nonclassifiableresponses, data may not sum to the totals.
SOURCE: Bureau of Labor Statistics, U.S. Department of Labor

TABLE 6. Percent distribution of nonfatal occupational injuries and illnesses involving days away from work1 by selected injury or illness characteristics and industrysector, 2003
Characteristic Privateindustry 2
Goods producing2 Service providing
Totalgoods
producing2
Naturalresources
andmining2,3
Construc-tion
Manufac-turing
Totalservice
providing
Trade,transpor-tation andutilities4
Informa-tion
Financialactivities
Profes-sionaland
businessservices
Educationand
healthservices
Leisureand
hospitality
Otherservices
Total [1,315,920 cases] ................... 100.0 100.0 100.0 100.0 100.0 100.0 100.0 100.0 100.0 100.0 100.0 100.0 100.0
Nature of injury or illness:Sprains, strains ........................... 42.9 36.7 36.0 35.8 37.3 45.6 46.2 43.5 40.0 41.9 53.9 36.8 36.5Bruises, contusions ..................... 9.0 7.6 10.0 6.5 8.0 9.7 9.8 10.6 8.1 9.7 9.0 11.5 7.0Cuts, lacerations ......................... 7.3 9.4 6.1 11.4 8.3 6.4 6.6 3.8 5.8 7.7 2.5 11.8 9.5Fractures ..................................... 7.2 9.2 10.2 11.7 7.3 6.3 6.6 7.5 6.5 7.0 5.3 6.0 6.5Heat burns ................................... 1.5 1.5 1.9 1.0 1.7 1.5 .7 .3 .7 .6 .9 6.9 2.4Carpal tunnel syndrome .............. 1.7 2.2 .4 .5 3.5 1.5 1.1 2.7 5.4 2.3 1.0 .8 2.1Tendonitis .................................... .6 .8 .4 .3 1.1 .5 .5 .7 .9 .5 .4 .4 .6Chemical burns ........................... .6 .8 1.3 .5 .9 .5 .5 .3 .8 .4 .3 .7 .7Amputations ................................ .6 1.3 1.3 .7 1.7 .3 .4 .2 .2 .6 .1 .3 .5Multiple traumatic injuries ............ 3.6 3.6 4.2 4.0 3.3 3.7 3.5 3.6 5.0 4.0 3.6 3.5 4.1
Part of body affected by theinjury or illness:
Head ............................................ 6.4 7.4 7.7 7.6 7.2 6.0 6.3 5.0 6.2 6.9 4.6 5.9 8.8Eye ............................................ 2.8 4.4 3.9 4.1 4.5 2.1 2.3 1.9 2.7 2.3 1.3 2.1 4.3
Neck ............................................ 1.6 1.2 1.2 1.2 1.2 1.8 1.8 1.3 1.4 2.2 2.1 1.1 1.3Trunk ........................................... 35.9 33.1 32.4 31.9 34.0 37.2 38.3 30.3 31.9 31.8 43.7 31.0 31.6Shoulder .................................... 6.4 6.3 6.6 5.0 7.1 6.5 7.2 6.1 6.1 5.2 7.0 4.9 4.8Back .......................................... 23.1 19.8 18.5 20.3 19.6 24.6 24.2 19.1 21.3 21.8 31.1 19.9 20.6
Upper extremities ........................ 22.7 27.8 20.9 23.7 31.5 20.4 19.7 21.1 22.0 21.9 15.5 28.4 25.9Wrist .......................................... 5.0 5.6 3.1 3.9 7.0 4.7 4.3 6.8 8.4 4.8 4.3 4.7 5.6Hand, except finger ................... 3.9 4.7 4.4 4.8 4.6 3.5 3.3 3.2 3.1 3.7 2.4 6.4 4.6Finger ........................................ 8.1 11.2 7.4 9.4 12.9 6.7 6.7 5.4 5.1 8.4 3.9 10.6 8.6
Lower extremities ........................ 21.2 20.8 26.6 24.8 17.3 21.5 22.7 27.7 21.0 22.9 18.1 21.2 19.4Knee .......................................... 8.0 7.5 9.0 8.6 6.6 8.3 8.5 12.9 7.3 8.5 7.7 8.0 7.5Foot, except toe ........................ 3.3 3.7 3.1 4.6 3.1 3.2 3.7 4.9 2.3 3.1 2.4 2.6 3.3Toe ............................................ .9 1.0 1.1 1.2 .8 .9 1.2 .7 .6 1.0 .6 .7 .7
Body systems .............................. 1.4 1.0 1.0 1.1 1.0 1.6 1.2 1.1 2.5 2.2 1.9 1.5 1.5Multiple parts ............................... 9.9 7.8 9.4 8.8 6.9 10.8 9.3 12.8 13.8 11.0 13.6 9.8 10.5
See footnotes at end of table.
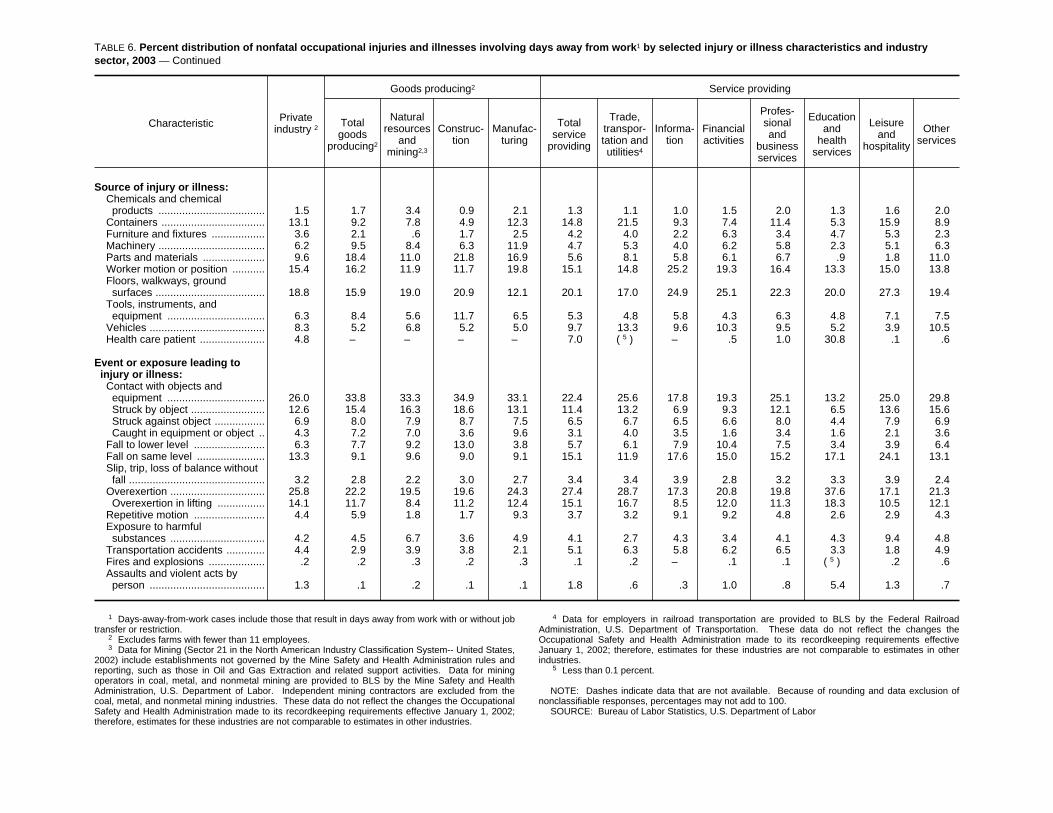
TABLE 6. Percent distribution of nonfatal occupational injuries and illnesses involving days away from work1 by selected injury or illness characteristics and industrysector, 2003 — Continued
Characteristic Privateindustry 2
Goods producing2 Service providing
Totalgoods
producing2
Naturalresources
andmining2,3
Construc-tion
Manufac-turing
Totalservice
providing
Trade,transpor-tation andutilities4
Informa-tion
Financialactivities
Profes-sionaland
businessservices
Educationand
healthservices
Leisureand
hospitality
Otherservices
Source of injury or illness:Chemicals and chemicalproducts .................................... 1.5 1.7 3.4 0.9 2.1 1.3 1.1 1.0 1.5 2.0 1.3 1.6 2.0
Containers ................................... 13.1 9.2 7.8 4.9 12.3 14.8 21.5 9.3 7.4 11.4 5.3 15.9 8.9Furniture and fixtures .................. 3.6 2.1 .6 1.7 2.5 4.2 4.0 2.2 6.3 3.4 4.7 5.3 2.3Machinery .................................... 6.2 9.5 8.4 6.3 11.9 4.7 5.3 4.0 6.2 5.8 2.3 5.1 6.3Parts and materials ..................... 9.6 18.4 11.0 21.8 16.9 5.6 8.1 5.8 6.1 6.7 .9 1.8 11.0Worker motion or position ........... 15.4 16.2 11.9 11.7 19.8 15.1 14.8 25.2 19.3 16.4 13.3 15.0 13.8Floors, walkways, groundsurfaces ..................................... 18.8 15.9 19.0 20.9 12.1 20.1 17.0 24.9 25.1 22.3 20.0 27.3 19.4
Tools, instruments, andequipment ................................. 6.3 8.4 5.6 11.7 6.5 5.3 4.8 5.8 4.3 6.3 4.8 7.1 7.5
Vehicles ....................................... 8.3 5.2 6.8 5.2 5.0 9.7 13.3 9.6 10.3 9.5 5.2 3.9 10.5Health care patient ...................... 4.8 – – – – 7.0 5( ) – .5 1.0 30.8 .1 .6
Event or exposure leading toinjury or illness:
Contact with objects andequipment ................................. 26.0 33.8 33.3 34.9 33.1 22.4 25.6 17.8 19.3 25.1 13.2 25.0 29.8Struck by object ......................... 12.6 15.4 16.3 18.6 13.1 11.4 13.2 6.9 9.3 12.1 6.5 13.6 15.6Struck against object ................. 6.9 8.0 7.9 8.7 7.5 6.5 6.7 6.5 6.6 8.0 4.4 7.9 6.9Caught in equipment or object .. 4.3 7.2 7.0 3.6 9.6 3.1 4.0 3.5 1.6 3.4 1.6 2.1 3.6
Fall to lower level ........................ 6.3 7.7 9.2 13.0 3.8 5.7 6.1 7.9 10.4 7.5 3.4 3.9 6.4Fall on same level ....................... 13.3 9.1 9.6 9.0 9.1 15.1 11.9 17.6 15.0 15.2 17.1 24.1 13.1Slip, trip, loss of balance withoutfall .............................................. 3.2 2.8 2.2 3.0 2.7 3.4 3.4 3.9 2.8 3.2 3.3 3.9 2.4
Overexertion ................................ 25.8 22.2 19.5 19.6 24.3 27.4 28.7 17.3 20.8 19.8 37.6 17.1 21.3Overexertion in lifting ................ 14.1 11.7 8.4 11.2 12.4 15.1 16.7 8.5 12.0 11.3 18.3 10.5 12.1
Repetitive motion ........................ 4.4 5.9 1.8 1.7 9.3 3.7 3.2 9.1 9.2 4.8 2.6 2.9 4.3Exposure to harmfulsubstances ................................ 4.2 4.5 6.7 3.6 4.9 4.1 2.7 4.3 3.4 4.1 4.3 9.4 4.8
Transportation accidents ............. 4.4 2.9 3.9 3.8 2.1 5.1 6.3 5.8 6.2 6.5 3.3 1.8 4.9Fires and explosions ................... .2 .2 .3 .2 .3 .1 .2 – .1 .1 5( ) .2 .6Assaults and violent acts byperson ....................................... 1.3 .1 .2 .1 .1 1.8 .6 .3 1.0 .8 5.4 1.3 .7
1 Days-away-from-work cases include those that result in days away from work with or without jobtransfer or restriction.
2 Excludes farms with fewer than 11 employees.3 Data for Mining (Sector 21 in the North American Industry Classification System-- United States,
2002) include establishments not governed by the Mine Safety and Health Administration rules andreporting, such as those in Oil and Gas Extraction and related support activities. Data for miningoperators in coal, metal, and nonmetal mining are provided to BLS by the Mine Safety and HealthAdministration, U.S. Department of Labor. Independent mining contractors are excluded from thecoal, metal, and nonmetal mining industries. These data do not reflect the changes the OccupationalSafety and Health Administration made to its recordkeeping requirements effective January 1, 2002;therefore, estimates for these industries are not comparable to estimates in other industries.
4 Data for employers in railroad transportation are provided to BLS by the Federal RailroadAdministration, U.S. Department of Transportation. These data do not reflect the changes theOccupational Safety and Health Administration made to its recordkeeping requirements effectiveJanuary 1, 2002; therefore, estimates for these industries are not comparable to estimates in otherindustries.
5 Less than 0.1 percent.
NOTE: Dashes indicate data that are not available. Because of rounding and data exclusion ofnonclassifiable responses, percentages may not add to 100.
SOURCE: Bureau of Labor Statistics, U.S. Department of Labor

TABLE 7. Incidence rates1 for nonfatal occupational injuries and illnesses involving days away from work2 per 10,000 full-time workers for selected characteristics andindustry sector, 2003
Characteristic Privateindustry3
Goods producing3 Service providing
Totalgoods
producing3
Naturalresources
andmining3,4
Construc-tion
Manufac-turing
Totalservice
providing
Trade,transpor-tation andutilities5
Informa-tion
Financialactivities
Profes-sionaland
businessservices
Educationand
healthservices
Leisureand
hospitality
Otherservices
Total [1,315,920 cases] .................. 150.0 188.1 183.1 259.4 158.6 137.5 189.2 76.4 57.5 88.5 163.2 131.7 112.0
Nature of injury or illness:Sprains, strains ........................... 64.3 69.0 65.8 93.0 59.2 62.7 87.4 33.2 23.0 37.1 88.0 48.5 40.8Bruises, contusions ..................... 13.5 14.3 18.3 17.0 12.7 13.3 18.6 8.1 4.6 8.6 14.7 15.1 7.8Cuts, lacerations ......................... 11.0 17.6 11.1 29.7 13.2 8.8 12.4 2.9 3.3 6.8 4.0 15.5 10.7Fractures ..................................... 10.8 17.3 18.7 30.5 11.7 8.7 12.5 5.7 3.7 6.2 8.7 8.0 7.3Heat burns ................................... 2.2 2.7 3.5 2.6 2.7 2.1 1.3 .2 .4 .5 1.5 9.1 2.7Carpal tunnel syndrome .............. 2.5 4.1 .7 1.4 5.6 2.0 2.2 2.1 3.1 2.1 1.6 1.1 2.3Tendonitis .................................... .9 1.5 .7 .8 1.8 .7 1.0 .6 .5 .4 .7 .5 .6Chemical burns ........................... .9 1.5 2.4 1.3 1.5 .7 .9 .2 .5 .4 .6 .9 .7Amputations ................................ .9 2.4 2.4 1.8 2.6 .4 .8 .1 .1 .5 .1 .4 .6Multiple traumatic injuries ............ 5.5 6.8 7.8 10.2 5.2 5.0 6.6 2.8 2.8 3.5 5.8 4.6 4.6
Part of body affected by theinjury or illness:
Head ............................................ 9.7 13.9 14.0 19.8 11.4 8.3 11.9 3.8 3.6 6.1 7.5 7.8 9.9Eye ............................................ 4.2 8.2 7.2 10.7 7.2 2.9 4.3 1.5 1.5 2.0 2.1 2.8 4.8
Neck ............................................ 2.4 2.3 2.2 3.1 1.9 2.5 3.5 1.0 .8 1.9 3.4 1.5 1.5Trunk ........................................... 53.9 62.3 59.3 82.8 54.0 51.1 72.4 23.1 18.4 28.1 71.2 40.9 35.3Shoulder .................................... 9.6 11.8 12.1 13.0 11.2 8.9 13.6 4.7 3.5 4.6 11.4 6.5 5.4Back .......................................... 34.6 37.2 33.9 52.7 31.0 33.8 45.8 14.6 12.2 19.3 50.7 26.2 23.1
Upper extremities ........................ 34.0 52.3 38.3 61.4 49.9 28.0 37.3 16.1 12.6 19.4 25.3 37.5 29.0Wrist .......................................... 7.4 10.5 5.8 10.2 11.1 6.4 8.1 5.2 4.8 4.3 7.0 6.1 6.3Hand, except finger ................... 5.8 8.8 8.0 12.5 7.3 4.8 6.2 2.5 1.8 3.3 3.9 8.4 5.2Finger ........................................ 12.1 21.1 13.6 24.3 20.5 9.2 12.6 4.1 2.9 7.4 6.3 14.0 9.6
Lower extremities ........................ 31.9 39.1 48.6 64.4 27.4 29.5 42.9 21.2 12.1 20.3 29.6 27.9 21.7Knee .......................................... 12.1 14.1 16.5 22.2 10.4 11.4 16.2 9.8 4.2 7.5 12.5 10.5 8.4Foot, except toe ........................ 5.0 7.0 5.8 12.0 5.0 4.4 7.1 3.7 1.3 2.7 3.9 3.4 3.7Toe ............................................ 1.4 1.8 2.1 3.0 1.3 1.3 2.3 .5 .3 .9 1.0 .9 .7
Body systems .............................. 2.1 1.9 1.8 2.8 1.6 2.2 2.2 .9 1.5 2.0 3.2 2.0 1.6Multiple parts ............................... 14.9 14.7 17.3 22.9 11.0 14.9 17.7 9.7 7.9 9.8 22.3 12.9 11.8
See footnotes at end of table.

TABLE 7. Incidence rates1 for nonfatal occupational injuries and illnesses involving days away from work2 per 10,000 full-time workers for selected characteristics andindustry sector, 2003 — Continued
Characteristic Privateindustry3
Goods producing3 Service providing
Totalgoods
producing3
Naturalresources
andmining3,4
Construc-tion
Manufac-turing
Totalservice
providing
Trade,transpor-tation andutilities5
Informa-tion
Financialactivities
Profes-sionaland
businessservices
Educationand
healthservices
Leisureand
hospitality
Otherservices
Source of injury or illness:Chemicals and chemicalproducts .................................... 2.2 3.2 6.2 2.3 3.3 1.8 2.0 0.8 0.9 1.8 2.2 2.1 2.3
Containers ................................... 19.6 17.3 14.4 12.6 19.6 20.3 40.8 7.1 4.3 10.1 8.6 20.9 10.0Furniture and fixtures .................. 5.4 3.9 1.2 4.4 4.0 5.8 7.6 1.7 3.6 3.0 7.6 7.0 2.5Machinery .................................... 9.3 18.0 15.4 16.4 18.9 6.5 10.1 3.1 3.6 5.1 3.8 6.8 7.0Parts and materials ..................... 14.3 34.6 20.2 56.5 26.8 7.7 15.3 4.4 3.5 5.9 1.5 2.3 12.3Worker motion or position ........... 23.1 30.4 21.7 30.3 31.4 20.7 28.0 19.2 11.1 14.5 21.6 19.7 15.5Floors, walkways, groundsurfaces ..................................... 28.2 29.9 34.8 54.2 19.2 27.6 32.1 19.0 14.5 19.7 32.7 35.9 21.7
Tools, instruments, andequipment ................................. 9.4 15.8 10.3 30.3 10.3 7.3 9.1 4.5 2.5 5.5 7.8 9.3 8.4
Vehicles ....................................... 12.4 9.7 12.5 13.5 7.9 13.3 25.2 7.3 5.9 8.4 8.5 5.1 11.8Health care patient ...................... 7.2 – – – – 9.6 .1 – .3 .8 50.3 .1 .6
Event or exposure leading toinjury or illness:
Contact with objects andequipment ................................. 39.0 63.6 61.1 90.5 52.6 30.9 48.5 13.6 11.1 22.2 21.6 33.0 33.3Struck by object ......................... 19.0 29.0 29.8 48.2 20.8 15.7 25.0 5.2 5.3 10.7 10.7 17.8 17.5Struck against object ................. 10.4 15.0 14.5 22.6 11.9 8.9 12.7 5.0 3.8 7.1 7.2 10.4 7.7Caught in equipment or object .. 6.5 13.5 12.9 9.4 15.3 4.2 7.6 2.7 .9 3.0 2.6 2.8 4.0
Fall to lower level ........................ 9.4 14.4 16.9 33.8 6.0 7.8 11.6 6.0 6.0 6.6 5.5 5.1 7.1Fall on same level ....................... 19.9 17.1 17.6 23.4 14.4 20.8 22.5 13.4 8.6 13.4 27.9 31.7 14.6Slip, trip, loss of balance withoutfall .............................................. 4.8 5.3 4.1 7.9 4.3 4.6 6.4 2.9 1.6 2.9 5.4 5.1 2.6
Overexertion ................................ 38.7 41.7 35.7 50.7 38.5 37.7 54.3 13.2 12.0 17.5 61.3 22.5 23.8Overexertion in lifting ................ 21.1 22.0 15.3 29.2 19.6 20.8 31.5 6.5 6.9 10.0 29.8 13.8 13.5
Repetitive motion ........................ 6.5 11.2 3.3 4.5 14.8 5.0 6.1 7.0 5.3 4.2 4.2 3.9 4.8Exposure to harmfulsubstances ................................ 6.4 8.5 12.2 9.4 7.7 5.7 5.1 3.3 2.0 3.6 7.0 12.3 5.4
Transportation accidents ............. 6.6 5.4 7.2 10.0 3.3 6.9 11.8 4.5 3.6 5.8 5.4 2.4 5.5Fires and explosions ................... .3 .4 .6 .5 .4 .2 .4 – .1 .1 6( ) .2 .6Assaults and violent acts byperson ....................................... 1.9 .2 .3 .2 .2 2.4 1.1 .2 .6 .7 8.8 1.7 .7
1 Incidence rates represent the number of injuries and illnesses per 10,000 full-time workers andwere calculated as: (N/EH) x 20,000,000 where
N = number of injuries and illnesses EH = total hours worked by all employees
during the calendar year 20,000,000 = base for 10,000 equivalent full-time workers
(working 40 hours per week, 50 weeks per year)
2 Days-away-from-work cases include those that result in days away from work with or without jobtransfer or restriction.
3 Excludes farms with fewer than 11 employees.4 Data for Mining (Sector 21 in the North American Industry Classification System-- United States,
2002) include establishments not governed by the Mine Safety and Health Administration rules andreporting, such as those in Oil and Gas Extraction and related support activities. Data for mining
operators in coal, metal, and nonmetal mining are provided to BLS by the Mine Safety and HealthAdministration, U.S. Department of Labor. Independent mining contractors are excluded from thecoal, metal, and nonmetal mining industries. These data do not reflect the changes the OccupationalSafety and Health Administration made to its recordkeeping requirements effective January 1, 2002;therefore, estimates for these industries are not comparable to estimates in other industries.
5 Data for employers in railroad transportation are provided to BLS by the Federal RailroadAdministration, U.S. Department of Transportation. These data do not reflect the changes theOccupational Safety and Health Administration made to its recordkeeping requirements effectiveJanuary 1, 2002; therefore, estimates for these industries are not comparable to estimates in otherindustries.
6 Less than 1.0 case per 10,000 full-time workers.
NOTE: Dashes indicate data that are not available. SOURCE: Bureau of Labor Statistics, U.S. Department of Labor
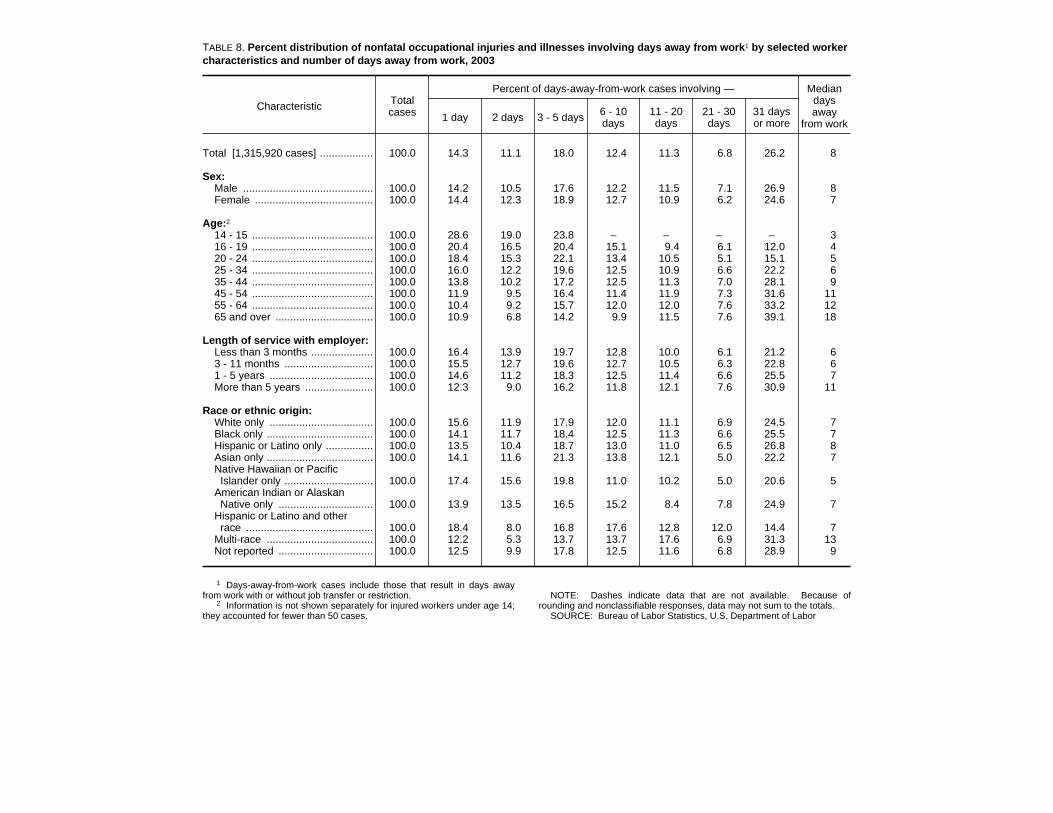
TABLE 8. Percent distribution of nonfatal occupational injuries and illnesses involving days away from work1 by selected workercharacteristics and number of days away from work, 2003
Characteristic Totalcases
Percent of days-away-from-work cases involving — Mediandaysaway
from work1 day 2 days 3 - 5 days 6 - 10
days11 - 20days
21 - 30days
31 daysor more
Total [1,315,920 cases] .................. 100.0 14.3 11.1 18.0 12.4 11.3 6.8 26.2 8
Sex:Male ............................................ 100.0 14.2 10.5 17.6 12.2 11.5 7.1 26.9 8Female ........................................ 100.0 14.4 12.3 18.9 12.7 10.9 6.2 24.6 7
Age:2
14 - 15 ......................................... 100.0 28.6 19.0 23.8 – – – – 316 - 19 ......................................... 100.0 20.4 16.5 20.4 15.1 9.4 6.1 12.0 420 - 24 ......................................... 100.0 18.4 15.3 22.1 13.4 10.5 5.1 15.1 525 - 34 ......................................... 100.0 16.0 12.2 19.6 12.5 10.9 6.6 22.2 635 - 44 ......................................... 100.0 13.8 10.2 17.2 12.5 11.3 7.0 28.1 945 - 54 ......................................... 100.0 11.9 9.5 16.4 11.4 11.9 7.3 31.6 1155 - 64 ......................................... 100.0 10.4 9.2 15.7 12.0 12.0 7.6 33.2 1265 and over ................................. 100.0 10.9 6.8 14.2 9.9 11.5 7.6 39.1 18
Length of service with employer:Less than 3 months ..................... 100.0 16.4 13.9 19.7 12.8 10.0 6.1 21.2 63 - 11 months .............................. 100.0 15.5 12.7 19.6 12.7 10.5 6.3 22.8 61 - 5 years ................................... 100.0 14.6 11.2 18.3 12.5 11.4 6.6 25.5 7More than 5 years ....................... 100.0 12.3 9.0 16.2 11.8 12.1 7.6 30.9 11
Race or ethnic origin:White only ................................... 100.0 15.6 11.9 17.9 12.0 11.1 6.9 24.5 7Black only .................................... 100.0 14.1 11.7 18.4 12.5 11.3 6.6 25.5 7Hispanic or Latino only ................ 100.0 13.5 10.4 18.7 13.0 11.0 6.5 26.8 8Asian only .................................... 100.0 14.1 11.6 21.3 13.8 12.1 5.0 22.2 7Native Hawaiian or Pacific
Islander only .............................. 100.0 17.4 15.6 19.8 11.0 10.2 5.0 20.6 5American Indian or Alaskan
Native only ................................ 100.0 13.9 13.5 16.5 15.2 8.4 7.8 24.9 7Hispanic or Latino and other
race ........................................... 100.0 18.4 8.0 16.8 17.6 12.8 12.0 14.4 7Multi-race .................................... 100.0 12.2 5.3 13.7 13.7 17.6 6.9 31.3 13Not reported ................................ 100.0 12.5 9.9 17.8 12.5 11.6 6.8 28.9 9
1 Days-away-from-work cases include those that result in days awayfrom work with or without job transfer or restriction.
2 Information is not shown separately for injured workers under age 14;they accounted for fewer than 50 cases.
NOTE: Dashes indicate data that are not available. Because ofrounding and nonclassifiable responses, data may not sum to the totals.
SOURCE: Bureau of Labor Statistics, U.S. Department of Labor

TABLE 9. Percent distribution of nonfatal occupational injuries and illnesses involving days away from work1 by major occupationalgroup and number of days away from work, 2003
Occupation Totalcases
Percent of days-away-from-work cases involving — Mediandaysaway
from work1 day 2 days 3 - 5
days6 - 10days
11 - 20days
21 - 30days
31 daysor more
Total [1,315,920 cases] ............................... 100.0 14.3 11.1 18.0 12.4 11.3 6.8 26.2 8
Management occupations .......................... 100.0 16.6 10.7 17.8 11.2 12.1 6.0 25.6 7Business and financial operationsoccupations .............................................. 100.0 14.6 7.8 23.6 12.8 11.9 4.4 24.8 7
Computer and mathematical occupations .. 100.0 20.1 16.0 22.6 10.6 13.3 2.4 14.9 5Architecture and engineeringoccupations .............................................. 100.0 18.5 14.1 20.7 10.1 10.9 7.4 18.2 5
Life, physical, and social scienceoccupations .............................................. 100.0 17.8 13.0 18.6 10.5 15.4 6.9 17.8 6
Community and social servicesoccupations .............................................. 100.0 19.5 11.6 24.2 12.7 10.8 4.1 16.9 5
Legal occupations ...................................... 100.0 13.5 27.0 13.5 – 13.5 – 28.8 4Education, training, and libraryoccupations .............................................. 100.0 14.1 10.8 22.7 10.1 14.9 7.2 20.4 6
Arts, design, entertainment, sports, andmedia occupations ................................... 100.0 15.3 9.4 17.1 10.9 15.9 7.4 23.7 8
Healthcare practitioners and technicaloccupations .............................................. 100.0 15.6 13.0 18.9 14.0 11.3 6.4 20.8 6
Healthcare support occupations ................ 100.0 14.6 14.9 20.3 15.2 10.9 5.0 19.1 6Protective service occupations .................. 100.0 12.4 16.5 18.1 14.3 10.5 4.7 23.5 6Food preparation and serving relatedoccupations .............................................. 100.0 17.1 13.6 20.9 13.2 9.5 6.2 19.5 5
Building and grounds cleaning andmaintenance occupations ........................ 100.0 13.4 11.2 19.9 12.6 10.7 8.2 24.0 7
Personal care and service occupations ..... 100.0 14.2 11.9 16.3 13.1 12.4 6.3 25.8 8Sales and related occupations ................... 100.0 13.7 13.1 19.5 12.7 10.6 6.2 24.2 7Office and administrative supportoccupations .............................................. 100.0 15.8 10.8 18.5 12.2 11.7 6.5 24.6 7
Farming, fishing, and forestryoccupations .............................................. 100.0 12.2 9.7 20.9 14.6 11.5 5.3 25.7 7
Construction and extraction occupations ... 100.0 13.3 10.3 16.2 11.1 10.7 7.1 31.4 10Installation, maintenance, and repairoccupations .............................................. 100.0 15.1 9.9 17.2 11.6 11.6 6.8 27.9 9
Production occupations .............................. 100.0 15.4 10.6 16.6 11.9 11.4 7.0 27.2 8Transportation and material movingoccupations .............................................. 100.0 11.8 9.3 17.0 12.3 11.9 7.6 30.1 10
1 Days-away-from-work cases include those that result in days away fromwork with or without job transfer or restriction.
NOTE: Dashes indicate data that are not available. Because of roundingand nonclassifiable responses, data may not sum to the totals.
SOURCE: Bureau of Labor Statistics, U.S. Department of Labor

TABLE 10. Percent distribution of nonfatal occupational injuries and illnesses involving days away from work1 by selected occupationand number of days away from work, 2003
Occupation Totalcases
Percent of days-away-from-work cases involving — Mediandaysaway
from work1 day 2 days 3 - 5
days6 - 10days
11 - 20days
21 - 30days
31 daysor more
Total [1,315,920 cases] ............................... 100.0 14.3 11.1 18.0 12.4 11.3 6.8 26.2 8
Labor and freight, stock, and materialmovers, hand ............................................. 100.0 13.8 11.2 17.7 13.3 10.9 7.2 25.9 8
Truck drivers, heavy and tractor-trailer ........ 100.0 8.6 8.3 17.3 11.0 12.1 8.7 34.1 14Nursing aides, orderlies, and attendants ..... 100.0 14.9 15.2 21.2 14.9 11.0 5.1 17.7 5Construction laborers ................................... 100.0 12.5 11.3 17.4 11.1 10.5 7.9 29.5 9Janitors and cleaners, except maids andhousekeeping cleaners .............................. 100.0 15.0 11.4 19.3 11.2 10.5 7.5 25.0 7
Retail salespersons ...................................... 100.0 14.2 11.4 21.4 13.0 10.2 5.7 24.1 7Truck drivers, light or delivery services ........ 100.0 11.1 7.9 15.5 13.1 13.9 7.2 31.3 11Carpenters ................................................... 100.0 13.1 11.0 18.5 11.7 8.5 6.1 31.1 8Stock clerks and order fillers ........................ 100.0 15.5 11.1 20.7 12.3 12.6 6.6 21.3 7Registered nurses ........................................ 100.0 15.0 12.5 20.1 14.7 10.8 6.7 20.1 6Maids and housekeeping cleaners .............. 100.0 11.4 13.5 19.9 14.1 9.8 8.2 23.2 7Maintenance and repair workers, general .... 100.0 14.8 10.0 18.3 11.8 11.0 5.9 28.1 8Automotive service technicians andmechanics .................................................. 100.0 17.9 9.8 18.2 10.4 11.8 8.7 23.1 7
Cashiers ....................................................... 100.0 12.0 15.4 16.7 11.9 13.1 8.8 22.2 7First line supervisors/managers of retailsales workers ............................................. 100.0 13.2 14.4 18.6 14.5 8.5 5.0 25.8 6
Combined food preparation and servingworkers, including fast food ....................... 100.0 20.7 12.0 20.8 15.3 7.1 5.4 18.7 5
Customer service representatives ............... 100.0 14.0 10.4 18.1 13.7 13.0 5.6 25.2 8Waiters and waitresses ................................ 100.0 14.8 9.1 20.3 12.5 8.1 6.8 28.5 7Cooks, restaurant ......................................... 100.0 15.9 15.9 19.0 12.4 13.9 5.1 17.8 5Landscaping and groundskeepingworkers ...................................................... 100.0 13.6 8.8 22.2 14.6 13.0 6.6 21.1 7
Welders, cutters, solderers, and brazers ..... 100.0 21.5 11.1 15.3 12.5 10.2 5.1 24.2 6Industrial machinery mechanics ................... 100.0 12.1 9.2 15.4 10.7 14.0 8.7 29.7 12Shipping, receiving, and traffic clerks .......... 100.0 15.9 12.2 16.7 10.6 13.7 7.7 23.3 7Electricians ................................................... 100.0 15.3 11.9 15.5 9.8 13.2 7.0 27.2 10Plumbers, pipefitters, and steamfitters ......... 100.0 19.1 6.5 17.4 9.8 10.3 8.2 28.6 8
1 Days-away-from-work cases include those that result in days away fromwork with or without job transfer or restriction.
NOTE: Dashes indicate data that are not available. Because of roundingand nonclassifiable responses, data may not sum to the totals.
SOURCE: Bureau of Labor Statistics, U.S. Department of Labor
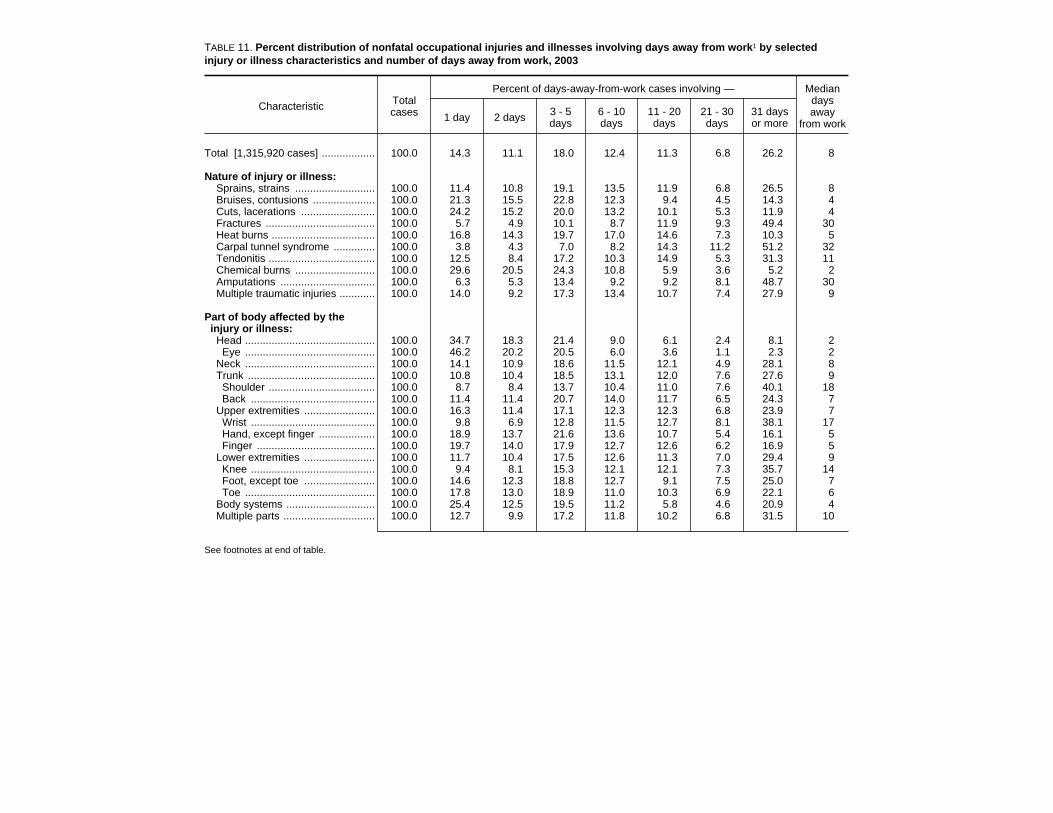
TABLE 11. Percent distribution of nonfatal occupational injuries and illnesses involving days away from work1 by selectedinjury or illness characteristics and number of days away from work, 2003
Characteristic Totalcases
Percent of days-away-from-work cases involving — Mediandaysaway
from work1 day 2 days 3 - 5
days6 - 10days
11 - 20days
21 - 30days
31 daysor more
Total [1,315,920 cases] .................. 100.0 14.3 11.1 18.0 12.4 11.3 6.8 26.2 8
Nature of injury or illness:Sprains, strains ........................... 100.0 11.4 10.8 19.1 13.5 11.9 6.8 26.5 8Bruises, contusions ..................... 100.0 21.3 15.5 22.8 12.3 9.4 4.5 14.3 4Cuts, lacerations ......................... 100.0 24.2 15.2 20.0 13.2 10.1 5.3 11.9 4Fractures ..................................... 100.0 5.7 4.9 10.1 8.7 11.9 9.3 49.4 30Heat burns ................................... 100.0 16.8 14.3 19.7 17.0 14.6 7.3 10.3 5Carpal tunnel syndrome .............. 100.0 3.8 4.3 7.0 8.2 14.3 11.2 51.2 32Tendonitis .................................... 100.0 12.5 8.4 17.2 10.3 14.9 5.3 31.3 11Chemical burns ........................... 100.0 29.6 20.5 24.3 10.8 5.9 3.6 5.2 2Amputations ................................ 100.0 6.3 5.3 13.4 9.2 9.2 8.1 48.7 30Multiple traumatic injuries ............ 100.0 14.0 9.2 17.3 13.4 10.7 7.4 27.9 9
Part of body affected by theinjury or illness:Head ............................................ 100.0 34.7 18.3 21.4 9.0 6.1 2.4 8.1 2
Eye ............................................ 100.0 46.2 20.2 20.5 6.0 3.6 1.1 2.3 2Neck ............................................ 100.0 14.1 10.9 18.6 11.5 12.1 4.9 28.1 8Trunk ........................................... 100.0 10.8 10.4 18.5 13.1 12.0 7.6 27.6 9
Shoulder .................................... 100.0 8.7 8.4 13.7 10.4 11.0 7.6 40.1 18Back .......................................... 100.0 11.4 11.4 20.7 14.0 11.7 6.5 24.3 7
Upper extremities ........................ 100.0 16.3 11.4 17.1 12.3 12.3 6.8 23.9 7Wrist .......................................... 100.0 9.8 6.9 12.8 11.5 12.7 8.1 38.1 17Hand, except finger ................... 100.0 18.9 13.7 21.6 13.6 10.7 5.4 16.1 5Finger ........................................ 100.0 19.7 14.0 17.9 12.7 12.6 6.2 16.9 5
Lower extremities ........................ 100.0 11.7 10.4 17.5 12.6 11.3 7.0 29.4 9Knee .......................................... 100.0 9.4 8.1 15.3 12.1 12.1 7.3 35.7 14Foot, except toe ........................ 100.0 14.6 12.3 18.8 12.7 9.1 7.5 25.0 7Toe ............................................ 100.0 17.8 13.0 18.9 11.0 10.3 6.9 22.1 6
Body systems .............................. 100.0 25.4 12.5 19.5 11.2 5.8 4.6 20.9 4Multiple parts ............................... 100.0 12.7 9.9 17.2 11.8 10.2 6.8 31.5 10
See footnotes at end of table.

TABLE 11. Percent distribution of nonfatal occupational injuries and illnesses involving days away from work1 by selectedinjury or illness characteristics and number of days away from work, 2003 — Continued
Characteristic Totalcases
Percent of days-away-from-work cases involving — Mediandaysaway
from work1 day 2 days 3 - 5
days6 - 10days
11 - 20days
21 - 30days
31 daysor more
Source of injury or illness:Chemicals and chemical
products .................................... 100.0 28.8 19.1 22.7 10.9 6.6 4.4 7.4 3Containers ................................... 100.0 12.2 10.4 18.4 13.0 12.6 7.1 26.3 9Furniture and fixtures .................. 100.0 15.6 13.6 21.7 12.2 10.5 6.3 20.3 5Machinery .................................... 100.0 15.6 11.5 16.8 13.0 11.8 7.3 24.0 7Parts and materials ..................... 100.0 15.0 11.7 18.0 12.3 11.3 7.0 24.6 7Worker motion or position ........... 100.0 10.4 8.7 16.6 12.6 12.5 7.2 31.9 12Floors, walkways, ground
surfaces ..................................... 100.0 11.7 9.5 16.8 12.1 10.2 7.0 32.7 10Tools, instruments, and
equipment ................................. 100.0 20.5 14.6 19.1 11.1 10.3 5.8 18.5 5Vehicles ....................................... 100.0 11.0 9.4 16.9 12.0 12.1 7.5 31.1 11Health care patient ...................... 100.0 13.5 14.5 21.4 15.3 11.6 5.2 18.4 6
Event or exposure leading toinjury or illness:Contact with objects and
equipment ................................. 100.0 21.0 13.9 18.7 11.8 10.0 5.9 18.7 5Struck by object ......................... 100.0 20.8 14.1 19.7 11.9 9.6 5.8 18.1 5Struck against object ................. 100.0 20.7 14.5 19.4 11.9 10.0 5.5 18.1 5Caught in equipment or object .. 100.0 14.9 10.8 16.7 13.1 12.7 7.3 24.4 8
Fall to lower level ........................ 100.0 10.4 8.9 14.3 11.7 9.1 7.4 38.4 15Fall on same level ....................... 100.0 12.8 10.1 18.1 12.2 10.6 6.9 29.4 9Slip, trip, loss of balance without
fall .............................................. 100.0 12.3 10.7 18.2 13.4 12.8 6.1 26.5 8Overexertion ................................ 100.0 10.5 10.2 18.8 13.2 12.8 7.6 27.0 10
Overexertion in lifting ................ 100.0 10.3 10.2 18.6 13.4 13.8 7.4 26.3 9Repetitive motion ........................ 100.0 6.9 5.5 11.7 10.1 14.1 9.3 42.5 22Exposure to harmful
substances ................................ 100.0 26.2 16.5 21.9 13.2 9.1 4.8 8.3 3Transportation accidents ............. 100.0 9.8 8.8 15.5 11.3 12.2 6.9 35.5 14Fires and explosions ................... 100.0 11.2 11.2 15.0 13.7 13.3 14.2 20.6 10Assaults and violent acts by
person ....................................... 100.0 16.2 15.0 21.6 11.9 14.8 3.1 17.4 5
1 Days-away-from-work cases include those that result in days awayfrom work with or without job transfer or restriction.
NOTE: Dashes indicate data that are not available. Because ofrounding and nonclassifiable responses, data may not sum to the totals.
SOURCE: Bureau of Labor Statistics, U.S. Department of Labor
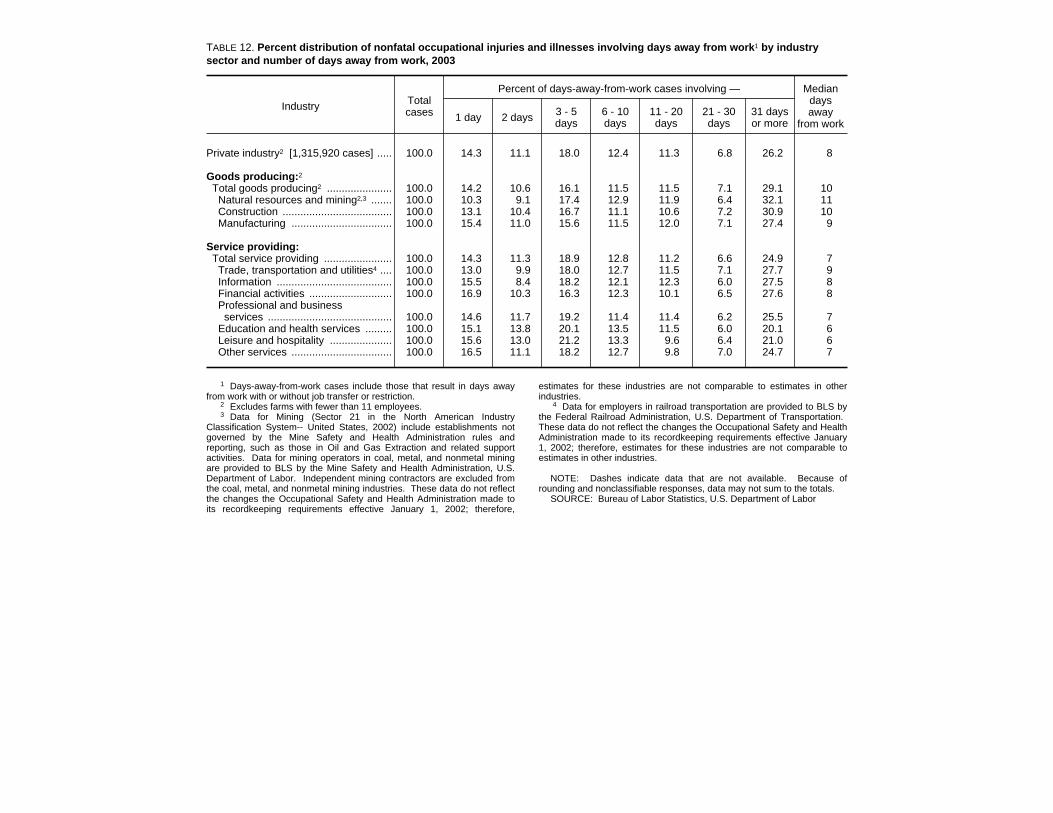
TABLE 12. Percent distribution of nonfatal occupational injuries and illnesses involving days away from work1 by industrysector and number of days away from work, 2003
Industry Totalcases
Percent of days-away-from-work cases involving — Mediandaysaway
from work1 day 2 days 3 - 5
days6 - 10days
11 - 20days
21 - 30days
31 daysor more
Private industry2 [1,315,920 cases] ..... 100.0 14.3 11.1 18.0 12.4 11.3 6.8 26.2 8
Goods producing:2
Total goods producing2 ...................... 100.0 14.2 10.6 16.1 11.5 11.5 7.1 29.1 10Natural resources and mining2,3 ....... 100.0 10.3 9.1 17.4 12.9 11.9 6.4 32.1 11Construction ..................................... 100.0 13.1 10.4 16.7 11.1 10.6 7.2 30.9 10Manufacturing .................................. 100.0 15.4 11.0 15.6 11.5 12.0 7.1 27.4 9
Service providing:Total service providing ....................... 100.0 14.3 11.3 18.9 12.8 11.2 6.6 24.9 7
Trade, transportation and utilities4 .... 100.0 13.0 9.9 18.0 12.7 11.5 7.1 27.7 9Information ....................................... 100.0 15.5 8.4 18.2 12.1 12.3 6.0 27.5 8Financial activities ............................ 100.0 16.9 10.3 16.3 12.3 10.1 6.5 27.6 8Professional and businessservices .......................................... 100.0 14.6 11.7 19.2 11.4 11.4 6.2 25.5 7
Education and health services ......... 100.0 15.1 13.8 20.1 13.5 11.5 6.0 20.1 6Leisure and hospitality ..................... 100.0 15.6 13.0 21.2 13.3 9.6 6.4 21.0 6Other services .................................. 100.0 16.5 11.1 18.2 12.7 9.8 7.0 24.7 7
1 Days-away-from-work cases include those that result in days awayfrom work with or without job transfer or restriction.
2 Excludes farms with fewer than 11 employees.3 Data for Mining (Sector 21 in the North American Industry
Classification System-- United States, 2002) include establishments notgoverned by the Mine Safety and Health Administration rules andreporting, such as those in Oil and Gas Extraction and related supportactivities. Data for mining operators in coal, metal, and nonmetal miningare provided to BLS by the Mine Safety and Health Administration, U.S.Department of Labor. Independent mining contractors are excluded fromthe coal, metal, and nonmetal mining industries. These data do not reflectthe changes the Occupational Safety and Health Administration made toits recordkeeping requirements effective January 1, 2002; therefore,
estimates for these industries are not comparable to estimates in otherindustries.
4 Data for employers in railroad transportation are provided to BLS bythe Federal Railroad Administration, U.S. Department of Transportation. These data do not reflect the changes the Occupational Safety and HealthAdministration made to its recordkeeping requirements effective January1, 2002; therefore, estimates for these industries are not comparable toestimates in other industries.
NOTE: Dashes indicate data that are not available. Because ofrounding and nonclassifiable responses, data may not sum to the totals.
SOURCE: Bureau of Labor Statistics, U.S. Department of Labor

TABLE 13. Number of nonfatal occupational injuries and illnesses involving days away from work1 by time, hours on the job, and weekday and industry sector, 2003
(in hundreds)
Characteristic Privateindustry2
Goods producing2 Service providing
Totalgoods
producing2
Naturalresources
andmining2,3
Construc-tion
Manufac-turing
Totalservice
providing
Trade,transpor-tation andutilities4
Informa-tion
Financialactivities
Profes-sionaland
businessservices
Educationand
healthservices
Leisureand
hospitality
Otherservices
Total ................................................ 13,159.2 4,076.1 263.9 1,554.2 2,258.0 9,083.1 4,053.0 215.5 403.7 1,025.0 1,997.7 1,057.3 331.0
Time of event:12:01 A.M. to 4:00 A.M. .............. 428.6 112.7 3.1 5.2 104.4 315.9 170.2 8.8 2.9 31.6 75.3 23.6 3.54:01 A.M. to 8:00 A.M. ................ 1,309.7 436.1 24.4 127.0 284.6 873.7 421.8 17.8 23.4 86.2 224.0 78.4 22.18:01 A.M. to 12:00 noon .............. 3,916.0 1,302.3 72.3 622.9 607.1 2,613.7 1,161.8 68.1 122.1 325.4 546.8 272.1 117.412:01 P.M. to 4:00 P.M. .............. 3,002.8 943.6 61.7 428.7 453.1 2,059.2 924.1 55.7 98.9 247.2 431.0 215.2 86.94:01 P.M. to 8:00 P.M. ................ 1,393.7 289.4 15.2 55.0 219.2 1,104.3 489.1 19.0 40.7 98.8 265.3 167.4 24.08:01 P.M. to 12:00 midnight ........ 768.8 165.0 4.1 5.1 155.8 603.8 254.2 8.5 9.2 50.8 148.6 124.5 8.0Not reported ................................ 2,339.7 827.1 83.0 310.2 433.8 1,512.6 631.8 37.6 106.4 184.9 306.8 176.0 69.1
Hours on the job before eventoccured:
Before shift began ....................... 51.6 10.8 – .8 9.9 40.7 10.6 1.4 3.9 4.7 16.6 3.0 .5Less than 1 hour ......................... 1,136.8 307.5 15.1 101.1 191.3 829.3 358.6 14.7 35.2 83.8 195.6 114.7 26.71 hour to less than 2 hours .......... 1,296.9 355.5 18.1 128.6 208.8 941.4 434.1 21.0 33.3 85.5 209.5 120.5 37.52 hours to less than 4 hours ........ 2,832.9 868.9 41.5 350.3 477.1 1,964.0 878.7 41.9 71.9 234.2 413.8 257.0 66.64 hours to less than 6 hours ........ 2,105.5 626.0 38.6 236.3 351.1 1,479.5 624.3 44.7 49.4 155.5 359.6 196.7 49.26 hours to less than 8 hours ........ 1,933.4 638.0 34.2 265.3 338.5 1,295.4 572.7 28.6 55.6 164.4 300.2 124.7 49.18 hours to less than 10 hours ...... 930.6 316.6 20.3 124.2 172.0 614.0 295.0 16.5 35.7 82.8 116.2 44.7 23.210 hours to less than 12 hours .... 234.6 79.0 8.4 27.0 43.6 155.7 81.2 4.3 8.1 15.2 38.8 5.1 3.112 hours to less than 16 hours .... 94.5 23.6 4.1 5.5 14.0 70.8 37.2 1.5 1.4 5.9 17.0 6.1 1.8More than 16 hours ..................... 7.9 1.0 – – 1.0 6.9 4.6 .2 – – 1.9 – –Not reported ................................ 2,534.5 849.2 83.6 315.0 450.7 1,685.2 755.9 40.7 109.2 192.7 328.6 184.8 73.2
Day of week:Sunday ........................................ 746.1 111.3 11.9 29.3 70.0 634.8 253.0 8.4 18.9 49.0 169.4 125.7 10.4Monday ....................................... 2,512.6 833.5 52.0 324.9 456.6 1,679.1 779.4 44.9 77.1 193.1 343.6 173.8 67.2Tuesday ...................................... 2,390.9 800.7 49.2 318.5 433.0 1,590.2 699.9 41.3 80.7 195.2 362.0 154.6 56.5Wednesday ................................. 2,330.4 791.5 45.3 320.9 425.3 1,538.9 705.7 37.6 73.3 188.1 335.9 137.4 60.9Thursday ..................................... 2,167.5 717.7 41.3 266.2 410.2 1,449.8 647.3 40.8 66.8 173.2 318.6 145.7 57.4Friday .......................................... 2,013.4 624.4 41.4 232.3 350.7 1,389.0 628.1 29.3 66.6 168.7 282.8 156.6 56.8Saturday ...................................... 998.2 196.9 22.8 62.0 112.2 801.3 339.5 13.2 20.2 57.7 185.5 163.5 21.8
1 Days-away-from-work cases include those that result in days away from work with or without jobtransfer or restriction.
2 Excludes farms with fewer than 11 employees.3 Data for Mining (Sector 21 in the North American Industry Classification System-- United States,
2002) include establishments not governed by the Mine Safety and Health Administration rules andreporting, such as those in Oil and Gas Extraction and related support activities. Data for miningoperators in coal, metal, and nonmetal mining are provided to BLS by the Mine Safety and HealthAdministration, U.S. Department of Labor. Independent mining contractors are excluded from thecoal, metal, and nonmetal mining industries. These data do not reflect the changes the OccupationalSafety and Health Administration made to its recordkeeping requirements effective January 1, 2002;
therefore, estimates for these industries are not comparable to estimates in other industries. 4 Data for employers in railroad transportation are provided to BLS by the Federal Railroad
Administration, U.S. Department of Transportation. These data do not reflect the changes theOccupational Safety and Health Administration made to its recordkeeping requirements effectiveJanuary 1, 2002; therefore, estimates for these industries are not comparable to estimates in otherindustries.
NOTE: Dashes indicate data that are not available. Because of rounding and nonclassifiableresponses, data may not sum to the totals.
SOURCE: Bureau of Labor Statistics, U.S. Department of Labor

TABLE 14. Percent distribution of nonfatal occupational injuries and illnesses involving days away from work1 by time, hours on the job, and weekday and industry sector,2003
Characteristic Totalcases
Goods producing2 Service providing
Totalgoods
producing2
Naturalresources
andmining2,3
Construc-tion
Manufac-turing
Totalservice
providing
Trade,transpor-tation andutilities4
Informa-tion
Financialactivities
Profes-sionaland
businessservices
Educationand
healthservices
Leisureand
hospitality
Otherservices
Total [1,315,920 cases] .................. 100.0 100.0 100.0 100.0 100.0 100.0 100.0 100.0 100.0 100.0 100.0 100.0 100.0
Time of event:12:01 A.M. to 4:00 A.M. .............. 3.3 2.8 1.2 .3 4.6 3.5 4.2 4.1 .7 3.1 3.8 2.2 1.14:01 A.M. to 8:00 A.M. ................ 10.0 10.7 9.2 8.2 12.6 9.6 10.4 8.3 5.8 8.4 11.2 7.4 6.78:01 A.M. to 12:00 noon .............. 29.8 31.9 27.4 40.1 26.9 28.8 28.7 31.6 30.2 31.7 27.4 25.7 35.512:01 P.M. to 4:00 P.M. .............. 22.8 23.1 23.4 27.6 20.1 22.7 22.8 25.8 24.5 24.1 21.6 20.4 26.34:01 P.M. to 8:00 P.M. ................ 10.6 7.1 5.8 3.5 9.7 12.2 12.1 8.8 10.1 9.6 13.3 15.8 7.38:01 P.M. to 12:00 midnight ........ 5.8 4.0 1.6 .3 6.9 6.6 6.3 3.9 2.3 5.0 7.4 11.8 2.4Not reported ................................ 17.8 20.3 31.5 20.0 19.2 16.7 15.6 17.4 26.4 18.0 15.4 16.6 20.9
Hours on the job before eventoccured:
Before shift began ....................... .4 .3 – .1 .4 .4 .3 .6 1.0 .5 .8 .3 .2Less than 1 hour ......................... 8.6 7.5 5.7 6.5 8.5 9.1 8.8 6.8 8.7 8.2 9.8 10.8 8.11 hour to less than 2 hours .......... 9.9 8.7 6.9 8.3 9.2 10.4 10.7 9.7 8.2 8.3 10.5 11.4 11.32 hours to less than 4 hours ........ 21.5 21.3 15.7 22.5 21.1 21.6 21.7 19.4 17.8 22.8 20.7 24.3 20.14 hours to less than 6 hours ........ 16.0 15.4 14.6 15.2 15.5 16.3 15.4 20.7 12.2 15.2 18.0 18.6 14.96 hours to less than 8 hours ........ 14.7 15.7 13.0 17.1 15.0 14.3 14.1 13.3 13.8 16.0 15.0 11.8 14.88 hours to less than 10 hours ...... 7.1 7.8 7.7 8.0 7.6 6.8 7.3 7.7 8.8 8.1 5.8 4.2 7.010 hours to less than 12 hours .... 1.8 1.9 3.2 1.7 1.9 1.7 2.0 2.0 2.0 1.5 1.9 .5 .912 hours to less than 16 hours .... .7 .6 1.6 .4 .6 .8 .9 .7 .3 .6 .9 .6 .5More than 16 hours ..................... .1 .0 – – .0 .1 .1 .1 – – .1 – –Not reported ................................ 19.3 20.8 31.7 20.3 20.0 18.6 18.7 18.9 27.0 18.8 16.4 17.5 22.1
Day of week:Sunday ........................................ 5.7 2.7 4.5 1.9 3.1 7.0 6.2 3.9 4.7 4.8 8.5 11.9 3.1Monday ....................................... 19.1 20.4 19.7 20.9 20.2 18.5 19.2 20.8 19.1 18.8 17.2 16.4 20.3Tuesday ...................................... 18.2 19.6 18.6 20.5 19.2 17.5 17.3 19.2 20.0 19.0 18.1 14.6 17.1Wednesday ................................. 17.7 19.4 17.2 20.6 18.8 16.9 17.4 17.4 18.2 18.4 16.8 13.0 18.4Thursday ..................................... 16.5 17.6 15.6 17.1 18.2 16.0 16.0 18.9 16.5 16.9 15.9 13.8 17.3Friday .......................................... 15.3 15.3 15.7 14.9 15.5 15.3 15.5 13.6 16.5 16.5 14.2 14.8 17.2Saturday ...................................... 7.6 4.8 8.6 4.0 5.0 8.8 8.4 6.1 5.0 5.6 9.3 15.5 6.6
1 Days-away-from-work cases include those that result in days away from work with or without jobtransfer or restriction.
2 Excludes farms with fewer than 11 employees.3 Data for Mining (Sector 21 in the North American Industry Classification System-- United States,
2002) include establishments not governed by the Mine Safety and Health Administration rules andreporting, such as those in Oil and Gas Extraction and related support activities. Data for miningoperators in coal, metal, and nonmetal mining are provided to BLS by the Mine Safety and HealthAdministration, U.S. Department of Labor. Independent mining contractors are excluded from thecoal, metal, and nonmetal mining industries. These data do not reflect the changes the OccupationalSafety and Health Administration made to its recordkeeping requirements effective January 1, 2002;
therefore, estimates for these industries are not comparable to estimates in other industries. 4 Data for employers in railroad transportation are provided to BLS by the Federal Railroad
Administration, U.S. Department of Transportation. These data do not reflect the changes theOccupational Safety and Health Administration made to its recordkeeping requirements effectiveJanuary 1, 2002; therefore, estimates for these industries are not comparable to estimates in otherindustries.
NOTE: Dashes indicate data that are not available. Because of rounding and nonclassifiableresponses, data may not sum to the totals.
SOURCE: Bureau of Labor Statistics, U.S. Department of Labor

TABLE 15. Percent distribution of nonfatal occupational injuries and illnesses involving days away from work1 by time, hourson the job, and weekday and number of days away from work, 2003
Characteristic Totalcases
Percent of days-away-from-work cases involving — Mediandaysaway
from work1 day 2 days 3 - 5
days6 - 10days
11 - 20days
21 - 30days
31 daysor more
Total [1,315,920 cases] ....................... 100.0 14.3 11.1 18.0 12.4 11.3 6.8 26.2 8
Time of event:12:01 A.M. to 4:00 A.M. ................... 100.0 13.5 11.0 17.7 12.5 10.8 6.3 28.3 84:01 A.M. to 8:00 A.M. ..................... 100.0 13.5 11.4 18.4 12.1 11.3 6.9 26.4 88:01 A.M. to 12:00 noon ................... 100.0 14.4 11.1 18.8 12.2 11.3 6.7 25.5 712:01 P.M. to 4:00 P.M. ................... 100.0 15.2 11.2 17.4 12.4 11.0 6.6 26.2 74:01 P.M. to 8:00 P.M. ..................... 100.0 15.4 12.7 18.4 13.6 10.7 6.1 23.1 68:01 P.M. to 12:00 midnight ............. 100.0 13.2 11.5 20.5 13.3 11.9 7.0 22.7 7Not reported ..................................... 100.0 13.1 9.9 16.5 11.6 11.7 7.5 29.6 10
Hours on the job before eventoccured:
Before shift began ............................ 100.0 14.7 9.3 19.8 13.8 12.0 7.6 22.7 7Less than 1 hour .............................. 100.0 13.4 11.1 18.6 12.4 12.0 6.3 26.3 71 hour to less than 2 hours ............... 100.0 14.4 11.5 18.5 12.2 11.6 7.0 24.8 72 hours to less than 4 hours ............. 100.0 14.5 11.7 19.3 12.5 10.9 6.8 24.4 74 hours to less than 6 hours ............. 100.0 14.7 11.9 18.2 12.6 11.0 6.4 25.2 76 hours to less than 8 hours ............. 100.0 15.1 11.1 18.1 12.3 11.1 6.6 25.6 78 hours to less than 10 hours ........... 100.0 15.6 10.7 16.7 13.2 10.7 6.7 26.3 710 hours to less than 12 hours ......... 100.0 13.5 11.3 16.9 14.9 9.9 6.3 27.2 812 hours to less than 16 hours ......... 100.0 10.6 13.3 14.1 12.0 15.6 6.0 28.5 11More than 16 hours .......................... 100.0 6.3 – 20.3 12.7 22.8 6.3 29.1 13Not reported ..................................... 100.0 13.0 9.8 16.7 11.5 11.7 7.4 29.8 10
Day of week:Sunday ............................................. 100.0 14.1 11.9 18.8 12.2 11.6 6.8 24.6 7Monday ............................................ 100.0 13.6 11.4 17.3 13.6 11.0 6.9 26.1 7Tuesday ........................................... 100.0 14.4 11.6 17.8 11.6 11.4 7.5 25.7 8Wednesday ...................................... 100.0 14.8 11.9 17.6 11.2 11.3 7.1 26.1 7Thursday .......................................... 100.0 16.4 8.9 18.6 11.7 11.2 6.1 27.1 8Friday ............................................... 100.0 12.1 10.4 19.0 13.2 11.8 6.5 27.0 9Saturday ........................................... 100.0 13.8 13.1 17.6 13.8 10.3 6.1 25.2 7
1 Days-away-from-work cases include those that result in days awayfrom work with or without job transfer or restriction.
NOTE: Dashes indicate data that are not available. Because ofrounding and nonclassifiable responses, data may not sum to the totals.
SOURCE: Bureau of Labor Statistics, U.S. Department of Labor