lost in transition? how civil war violence can impair the ... · !1! lost in transition? how civil...
TRANSCRIPT

1
Lost in Transition? How Civil War Violence Can Impair the
Foundations for Market Development - The Case of Tajikistan
By Alessandra Cassar*, Pauline Grosjean* and Sam Whitt�†
May 19, 2011
Abstract
We carried out experiments and survey in Tajikistan on 426 randomly selected subjects 13 years after the end of the 1992-1997 civil war to investigate the effects of conflict-related violence on social and economic preferences. Our results indicate that exposure to warfare violence is strongly associated with the disruption of those kinds of social norms that are at the very foundation of market development. Conflict exposure destroys local trust and fairness, decreases the willingness to engage in impersonal exchange and reinforces kinship-based norms of morality. At the same time, we find evidence that trust, generosity and egalitarianism are at the highest among the mostly affected individuals when matched with a distant partner, in accordance with a growing body of literature showing surprisingly positive outcomes for social behavior in the aftermath of very traumatic events. The robustness of the results to the use of pre-war controls, village fixed effects and alternative samples suggests that selection into victimization is unlikely to be the factor driving the results.
Key Words: Civil war, trust game, dictator game, market institution, experimental
methods
JEL Classification: C93, D03, P30, O53
* Department of Economics, University of San Francisco, 2130 Fulton St., San Francisco, CA 94117. Emails: [email protected], [email protected]. † Fulbright Scholar, University of Pristina, Kosovo. [email protected]. We would like to thank Alexandra Ghosh, Lexi Russel and Azicha Tirandozov for outstanding assistance in carrying out the experimental work and data collection. We are grateful for their comments to Eli Berman, Stefano DellaVigna, Dan Friedman, Craig McIntosh, Ted Miguel, Bruce Wydick and participants at PacDev 2011 and Bay Area Experimentalists workshop 2011. We would like to especially recognize the University of San Francisco and the U.S. State Department Title VIII Program – University of Delaware for their very generous financial support.

2
1. Introduction
This project investigates the effects that civil war related violence might exert on
behavioral preferences for trust, reciprocity, fairness, egalitarianism and on the support
for market institutions and democracy. The vast majority of economic research on war
focuses on macroeconomic outcomes and finds conflicting results. A significant body of
literature puts civil war as a forefront underdevelopment trap (Collier et al., 2003; Collier
and Hoeffler 2004) and highlights the economic, social and political disintegration that
has followed many conflicts, particularly in the developing world. At the same time, a
long tradition in economic and political history has characterized international wars and
inter-group competition as preconditions for state formation, nation building (mostly
based on the example of Western Europe as in Tilly and Ardant, 1975; Tilly, 1985) and
market development (Greif 2006). More recently, a small number of papers have been
focusing on the microeconomic and behavioral outcomes and points to surprising results:
International and even intra-national conflicts (civil wars) have been found carriers of
positive prosocial elements among the victims (Bauer et al., 2011; Bellows and Miguel,
2009; Blattman, 2009; Voors et al., 2011). Our work contributes to this literature by
showing that such prosocial elements are indeed heighten among the individuals from
victimized households, but such result should not be taken as a positive element for
market development and growth. On the contrary our data show the emergence of a very
different picture when the survey results are combined with the experimental evidence.
The increase in collective action that we (and the cited other works) find is actually
associated with erosion of local trust, stronger kinship-based norms of conflict resolution
mechanisms as opposed to reliance on formal rule of law. This result emerges when
comparing victims to non-victims in a post-war setting, so it cannot be directly
interpreted as a civil war effect. But if one allows that certain civil wars bring about
violence (in different degrees) on a vast number of civilians, and that the effect of such
violence on the individuals are of the kind we observe in Tajikistan, then one can
conclude that ferocious civil wars can unleash behavioral elements which are potential
hinderers of market development and growth.
More in particular, we report here the results of a series of experiments designed to
investigate whether the 1992-1997 Tajikistan civil war has left any effect on social and

3
economic preferences more than 10 years after the Peace Agreement. We focus on
preferences and social norms that are thought to sustain the development of impersonal
exchange and state building, namely trust and norms of fairness. We utilize a simplified
version of the trust game and the dictator game under two treatment conditions: Same
Village, in which the anonymous second player is someone who lives in the same village
as the first player, and Distant Village, in which the second player might come from
anywhere in Tajikistan, therefore naturally a more abstract concept. We carried out our
study in 17 randomly selected villages of the four regions of Tajikistan (Dushanbe,
Khatlon, Gharm and Pamir) and, within village, our subjects came from household
randomly selected via the random route technique, resulting in a sample of 426
individuals.
What makes the Tajik civil conflict both complex and interesting is the inability to apply
basic cues such as ethnicity or language to make shorthand predictions about who was on
what side. It was often difficult to confirm who was committing violence against whom
in the midst of the confusion of the inter-mixed regions in the conflict zone. In many
cases, factions of the same regional groups were even fighting among themselves
(Kilavuz, 2009). Our findings unequivocally point to negative and persistent effects of
such violence on the norms that support impersonal exchange, in particular on trust
within a village. Victimization during the civil war is associated with a roughly 40%
decrease in trust (the amount sent by the first mover in the trust game) when respondents
are matched to another individual from the same village. We corroborate our
experimental evidence with survey data on actual behavior and stated preferences.
Consistently with the decrease in local trust in the experimental games, former victims
are both less likely and less willing to participate in local markets, in particular when they
do not have a personal connection with the trader they are dealing with.
What we find particularly interesting is that our data confirm previous findings that
victimization is associated with more active participation in groups (e.g. Bellows and
Miguel, 2009; Blattman, 2009) and, in particular, in religious groups. Our results
nevertheless suggest that such collective action cannot be taken as a form of inclusive
social capital. Indeed, for those who have experienced violent conflict directly,
participation in local groups is associated with further erosion of local trust. Our results

4
also indicate that experiences of victimization are associated with a resurgence of
kinship-based norms of morality and behavior and a weakening of the rule of formal law.
In contrast with the negative implications of our results for local social cohesion and local
market development, we find evidence consistent with an increasing body of evidence on
the so-called “post-traumatic growth” and communitarian behavior in post-disaster
environments (Tedeschi and Calhoun, 2004; Solnit, 2009). While being affected by
violence consistently reduces pro-social preferences towards fellow villagers, victims
display more trust (by about 20%), generosity (by nearly 35%) and egalitarianism
towards an abstract distant other, someone who may not have hurt them directly like
someone from the same village.
Because of the regional nature of the conflict, all specifications include regional fixed
effects. Yet, victims of violence may be different from non-victims in observable and
unobservable ways and so any comparison of victims and non-victims will conflate the
impacts of war with preexisting differences that led some people to be victimized. This is
especially problematic if the characteristics associated with victimization are also those
associated with the outcomes that we want to observe. As a Soviet creation, Tajikistan
had no experience with a market economy and democratic self-governance as a civil
society prior to the onset of violence. This helps alleviate the (statistical) problem that
such characteristics may predict selection into war victimization. Still, some concerns
remain for the identification of causal effects of victimization and we employ several
strategies to deal with the potential selection bias. First, we use a selection on observable
strategy by investigating the determinants of victimization and controlling for such
characteristics in the analysis. Second, we check that all results are robust to the inclusion
of village fixed effects. Village fixed effects enable us to isolate the variation in violence
experienced across neighbors within the same village. Third, in order to address the
concern that selection into victimization was based upon unobservable characteristics, we
follow Altonji, Elder and Taber (2005) and gauge how much the importance of
unobservable variables would need to be, relative to observable factors, in order to
explain away all the effects of war violence on post-war outcomes. Our last strategy to
deal with potential selection bias is to focus our analysis on different sub-samples. We
restrict our attention to individuals who were too young to be systematically targeted –

5
those who were 12 or younger at the beginning of the conflict. We also consider the sub-
sample of people who have never moved in order to rule out that our results are due to
selective migration. Taking all the evidence together, our analysis indicates that selection
into victimization is unlikely to have been the factor driving our results.
The next section reviews the relevant literature. Section 3 discusses our main hypotheses.
Section 4 presents the experimental protocol and the data. Section 5 describes the
empirical strategy and the results. Section 6 concludes. More information on the Tajik
civil war and additional results can be found in the supplementary appendix.
2. Relevant Literature
This paper contributes to two main strands of the literature. First, it contributes to the
literature on the origins of prosocial preferences and on the formation of political
attitudes. Understanding the origins of prosocial preferences and the factors affecting
them is becoming increasingly important in several fields of economics. For
development, in particular, societal trust and preferences for fairness have been positively
associated with growth and the level of market development (e.g. Knack and Keefer,
1997; Knack and Zack, 1999; Henrich et al., 2010). Second, we contribute to the
literature on the social and institutional legacy of conflict. While the long term impact of
international wars and civil wars has been studied in terms of economic activity,
industrial recovery, physical and human capital, the impact of conflicts through their
impact on preferences has only recently started to be experimentally studied (e.g. Bauer,
Cassar, Chytilova and Henrich, 2011; Voors et al., 2011) and it is the object of this paper.
The origin of individual preferences is a fascinating research question. For a long time
contemporary economists have assumed individual preferences to be exogenously
determined and fixed (Stigler and Becker, 1977) or, at the very least, a topic to be studied
by other social scientists. As a stark departure, in the past couple of decades experimental
and behavioral economists have started to identify a number of predictable determinants
of preferences and sources of preference change (Loewenstein and Angner, 2003). The
question is important for many fields of economics and for development in particular for
which one of the hypotheses advanced to explain poverty is that certain people have a set

6
of preferences that are not conducive to those activities that bring prosperity. For
example, individuals that do not trust anonymous others might forgo important profitable
opportunities, same for those who do not play fair with money. So far, the empirical
evidence in support of the hypothesis that such preferences would be born with the
individual is quite weak while, at the same time, important correlations have been found
between trust and reciprocity and important economic indicators like the growth rate,
fraction of population in poverty, rate of unemployment and Gini coefficient (for a survey
see Cardenas and Carpenter, 2008). Quite interestingly, a significant set of experimental
results show that there are fundamental behavioral differences in fairness and cooperation
between people who are WEIRD (Western, educated, industrialized, rich and living in
democracies) and people who are not (Henrich, Heine, and Norenzayan, 2010). In
particular, greater level of fairness and punishment have been found to positively
covariate with market integration and community size, providing significant evidence
that preferences would not be uniquely exogenously determined, but might have been
evolved over the course of human history jointly with norms and institutions (Friedman,
2008).
Given this evidence of different behavioral preferences across groups, what we want to
address in our research is the issue of whether current conditions and past experiences
can affect preferences in a persistent and systematic way. Some related evidence in this
regard is presented by Cassar et al. (2011) who find that Thai subjects affected by the
2004 tsunami are, four and a half year after the event, significantly more trusting (as well
as more risk averse, and, modestly, more trustworthy and impatient). In this paper we
focus on prosocial preferences such as trust and fairness, because they have been found
vital to solve cooperation and coordination problems in modern societies and therefore
crucial for economic and social development. Individual preferences towards others (such
as trust, reciprocity, altruism, egalitarianism, parochialism, fairness, etc…) are key
component of many economic decisions and are often associated to social capital and
considered necessary for growth and development. While a lot more work still needs to
be done to learn which outcomes do different social preferences correlate with, recent
studies have already show how other-regarding preferences are decisive for the human
ability to cooperate in large groups (Bowles, 2004; Boyd and Richerson, 2005), to

7
participate in public life and politics (Bowles and Gintis, 2006) and how they amplify
reputational incentives in strategic interactions (Rockenbach and Milinski, 2006).
Generosity, egalitarianism and a sense of fairness, instead of spitefulness, may help
sustain trade, cooperation and development especially in countries when institutional
contracts enforcement is weak by letting individual engage in profitable trades that are
beneficial to self and others and by preventing the violation of contracts. Even in
countries with well functioning institutions, a sense of fairness and trust may support
trade, given the necessarily incomplete nature of contracts. Inside societies in which
generosity and fairness are anticipated, more individuals may be willing to participate in
impersonal trade, while the opposite definitely may work as a trade deterrent (Fehr et al.,
2008).
If circumstances and experiences can affect prosocial preferences, can they be shaped in a
predictable manner by wars and civil conflicts? Due to data availability, empirical
evidence so far has mainly focused on economic activity and industrial recovery and has
found no long-term effect of international wars in countries such as Germany, Japan or
Vietnam (Davis and Weinstein, 2002; Miguel and Roland, 2011). More recent evidence
however has found bleaker results concerning the long-term effects of war on human
capital, education and health (Blattman and Miguel, 2010).
An important channel through which conflicts can affect development and growth is the
effects the may exert on impersonal societal trust. A prerequisite for the successful
development of market economies is to depart from closed group interactions and to
enlarge exchanges to anonymous others (Fafchamps, 2006; Algan and Cahuc, 2010). In
this regard, generalized trust appears as a keystone for successful market development
and it is often included in the various definitions of “social capital” as one of its main
elements. Understanding the effect of social capital on economic decision-making has
been the subject of a broad literature too. This literature has pointed to the positive
effects of social capital on economic growth (Knack and Keefer 1997), reducing
corruption (LaPorta et. al. 1997), community governance (Bowles and Gintis 2002),
preventing crime (Case and Katz 1991), curtailing moral hazard in the workplace (Ichino
and Maggi 2000), and financial development (Guiso, Sapienza and Zingales 2004). Yet it

8
is often the case that social capital variables are endogenous to outcome variables,
presenting a challenge to causal inferences.1
The interplay of trust with violence is particularly interesting since it has been shown that
violence and a history of violence, even going as far back as the slave trade in Africa,
impact contemporaneous trust negatively and strongly (Nunn and Wantchekon, forth).
Their hypothesis is that the negative legacy of slave trade on general trust is mainly due
to the destruction of social ties through inter-ethnic slave raiding. This hypothesis
suggests that civil wars, among the different types of conflicts, should have the most
detrimental effect on general trust.
In conclusion, the interest in the economic legacies of violence and civil war is growing
and the surveyed literature points to an important question whose answer is still very
much elusive. The long-term impact of violence and civil war on the economy through
their impact on prosocial preferences has only recently started to gather attention and it is
the object of this study.
3. Research Hypothesis
We consider our research question in the context of a devastating civil war in the former
Soviet republic of Tajikistan. When the Soviet Union collapsed, Tajikistan collapsed with
it. In 1992, regional rivalries, many of which were explicitly developed and exploited
during the Soviet era, gave way to a brutal power struggle for control of the central
government. A negotiated settlement brought a tenuous peace to Tajikistan in 1997. We
will test whether over a decade later (or nearly two decades from the start of the conflict)
some of the effects of violence are enduring or not (see Appendix A for detailed
background information on Tajikistan and the civil conflict). One possibility, the null
hypothesis, is that pro-social and pro-market economic preferences are not systematically
different between individuals that were heavily affected and those who were less so
(since everyone is presumably affected, by varying degrees, by a civil conflict that lasts
1 Some rigorous studies on the economic effects of social capital have used instrumental variables to address problems of correlated unobservable (e.g. Knack and Keefer, 1997) or exploited differences in regional social capital within a country to identify its effects (Putnam, 1993; Ichino and Maggi, 2000).

9
years). An alternative hypothesis is whether, at the individual level, the more direct and
personal the experience of violence, the more dramatic the effects in lowering trust and
sense of fairness. As stressed by Fafchamps (2006) and Algan and Cahuc (2010), for
market institutions to thrive individuals should move beyond personalized trust towards
indiscriminate trust, from clan based norms of morality towards a more impersonal sense
of fairness.
From a theoretical perspective, an important foundation for our work comes from the
culture/gene evolutionary approaches to understanding human cooperation. A fascinating
hypothesis since Darwin is that frequent lethal inter-groups conflicts are at the very origin
of human altruism and prosocial behavior (Darwin, 1873). Such violent conflicts would
select as winners groups abounding of altruistic and prosocial types, providing a solution
to the evolutionary puzzle of the sustainability of altruism and prosociality in large
groups of genetically unrelated strangers (Bowles, 2006; 2008; 2009; Choi and Bowles,
2007; Boyd, Gintis, Bowles and Richerson, 2003). In facts, wars and evolutionary
pressures would open a gap between insiders and outsiders, and this gap (known as
parochialism) would favor cooperative institutions among insiders. To test whether inter-
group conflicts increase prosocial behavior within the members of one’s own group,
Bauer, Cassar, Chytilová and Henrich (2011) conducted experiments with over 600
children in Georgia six months after the August 2008 armed conflict with Russia. The
subjects were children age 4-11 years from locations that were hit by the conflict to
various degrees. The results show that experiencing an inter-group conflict does lead to a
stronger application of norms of parochial altruism and egalitarianism.
It is not clear, a priori, whether a preferential treatment towards members of one’s own
group is beneficial for trade and development since, on one hand, markets require
impartiality, but, on the other, they require trust and fairness. In sum, if a market has to be
developed within the boundaries of one’s group, then it is reasonable to expect
parochialism to increase local trust and fairness and therefore to be positive for market
development and growth. But while it is a reasonable hypothesis for inter-group conflicts,
it is not immediately evident what the predictions would be in case of a civil war. We
hypothesize that the final effect would depend on the type of civil war. If the civil
conflict would involve village against village or the people in the country against a

10
dictator, the results for the inter-group conflicts might still hold. But if, on the contrary,
the civil war would be one that turns neighbors against neighbors we would expect the
opposite: less trust and fairness between individuals living in the same village.
We think that the case of Tajikistan should follow in this second category. What makes
the Tajik conflict both complex and extremely problematic was the inability to apply
basic cues such as ethnicity or language to make shorthand predictions about who was on
what side. The various warring factions were not readily identifiable. Among combatants,
the Russians and Uzbeks are the only ones who really faced the problem of being readily
identifiable by physical appearance and language. Eastern Pamiris (Gorno-Badakhshan)
were better capable of blending in and transitioning between Tajik and their Pamiri
dialect. There are many examples of the “not readily identifiable” aspect of the conflict. It
was widely reported that government soldiers in Dushanbe and elsewhere would stop
people at random demanding identity papers, where those with Pamiri names or born in
the Gharm region were arrested and later executed (Jawad and Tadjbaksh, 1995; Hiro,
1995). The opposition applied similar tactics in the capital and when dealing with
southern Kulyabis in the Kurgan Teppe region. There were also instances of regionally
mixed villages, ethnic/regional inter-marriages, and intra-regional violence that further
complicated identification (Kilavuz, 2009). It was often difficult to confirm who was
committing violence against whom amidst the confusion of the inter-mixed regions of the
conflict zone, where in many cases factions of the same regional groups were fighting
amongst themselves (Kilavuz, 2009).
In conclusion, we argue that the inability to distinguish friend from foe in conflict may
have profound effects on social norms, especially at the local level, by creating long-term
concerns about trusting people close by. Normally, local communities are considered to
be safe havens for trust, even in times of violence as long as enemies are readily
identifiable and front lines can be drawn. In the Tajik civil war, this was not the case. The
local environment was extremely dangerous and unpredictable. In contrast to the usual
logic of trust (declining as the network of people expands to include more distant
strangers) here trust is conditioned by the probability of others taking advantage of you or
doing you harm. In this case, people in the village are in the most likely position to take
advantage or harm others. The conflict provides a framework for “common knowledge”

11
about the uncertainty of others close by. Because local environments provide many of the
foundations for political and economic communities, we argue that the depletion of
prosocial norms in those conflict-ridden communities will have profound effects on the
ability to develop reliable and credible institutions, decreasing the support for market and
democratic reforms.
4. Experimental Design and Survey Instrument
4.1. Experimental Protocol
To elicit individual preferences we had subjects participate in three games: the dictator
game, the ultimatum game and the trust game. We always run them in this order (given
the natural increase of complexity) without disclosing to the first player the decision
taken by the second player until the very end (and only for the game randomly selected
for payment) to prevent dependency between games. For economy of space, in this paper
we do not discuss the results for the ultimatum game since the data are qualitatively
similar to the dictator game results but without any significance2. For comparison
purposes, our instructions were based on the ones used for the The Roots of Human
Sociality.3 The original protocol was modified to include our in-group out-group
treatments, to preserve anonymity and to adapt it to the Tajikistan environment. In each
session the second movers in the games were randomly assigned to be someone either
from the same village as the subject or from somewhere else in Tajikistan (see the
treatment description below).
The dictator game is a 2-player game in which Person 1 has to decide how to allocate a
certain sum of money between self and an anonymous other. In our adaptation, subjects
had to choose how to allocate 40 Somoni in increments of 10 Somoni (1USD = 4.43
Somoni so approximately $9 in increments of $2.25). Subjects were not given real
2 Interested readers can find the ultimatum game analysis in the supplementary materials. 3 An Ethno-Experimental Exploration of the Foundations of Economic Norms in 16 Small-Scale Scoties. Principal investigators: Jean Ensminger, Joseph Heinrich. Instructions and other information available at: http://www.hss.caltech.edu/~jensming/roots-of-sociality

12
money, but instead made their allocation decisions by checking a box on a form.4 To
ensure anonymity, each subject was given a big cardboard box to do their writing in.
Person 1 was then asked to decide how to divide these 40 Somoni (0, 10, 20, 30 40)
between him or herself and an anonymous Person 2. In the first part of this game we had
every subject participate as Person 1. When subjects played as Person 2 they had nothing
to do, still we didn’t reveal any Person 1 choices to them until the very end and only if
this was the game selected for payment (see the treatment description below).
The trust game was based on the classic Berg, Dickaut and McCabe (1995) protocol. A
first mover has to decide how much of an initial amount I to send to a second mover. The
amount sent (X, with 0≤X≤I) is then multiplied by 3 before reaching the second mover.
The second mover receives 3X and has to decide how much of that sum (Y, with
0≤Y≤3X) he/she wants to return to the first mover. X can then be interpreted as an
indication of trust while Y as a measure of trustworthiness. In our adaptation, we gave
each first mover 20 Somoni (again, only on a form) and there were only 5 options for
dividing the money (0, 5, 10, 15, 20)—this was to simplify the game and to have the
same focal points as other studies. In the first part of the game, we had all of our subjects
play as first mover, in the second part all played as second mover, using the strategy
methods and without revealing what the first mover had actually sent to them.
To avoid issues of correlations across games, we paid subjects only according to one of
these game/roles. We announced at the very beginning that at the very end we would ask
one of the subjects to throw a 6-faced die and the number this would determine the
game/role according to which they would be paid. It is important for our protocol that no
information was revealed to Player 2 in the various games until the very end and only if
the game/role was selected for payment. To not undermine dominance and introduce
other motivations (like simply having fun while participating), we never called these
activities games or refer to it as play, we used more neutral terms like task, decision
making, make a choice etc…
4 The advantage of using forms is that it was easier for subjects to conceal their decisions in a group setting compared to using real money.

13
In addition to their earnings, all participates received a “show-up” fee of approximately
$3 in local currency. Total earnings ranged from 0 to 60 Somoni (0-13.50 USD) with an
average of 24 Somoni with a standard deviation of 10.9 (approximately $5.40, SD =
$2.46) excluding the show-up fee. Field work started on June 1 and sessions run from
July 1 to July 24, 2010. In total, 426 subjects completed the study. Additional sample
characteristics are listed in the analysis below.
4.2. Treatments
In order to test our hypothesis we implemented 2 treatments: “Same Village” (SV) and
“Distant Village” (DV). In the SV treatments we explained to the subjects that for each
game the second mover was selected among people from the same village, while under
DV we explained that the second mover was selected from people from a distant village.
We described “Same” and “Distant” villages by showing the subjects a map of their
country and pointing to where their village was (“Yeah, that's right, that's your village”).
If the session was a SV treatment, we explain that if we were to pay according to player 1
decisions, we would send the money anonymously to another person that lived in the
same village and who would participate in a future session. If we were to pay according
to player 2 decisions, player 1 offers came from an anonymous other who participated in
a previous session in the same village.
For the DV treatment, we draw on the map a large circle around their village and we
explained that the distant village could be anywhere in or around that circle (“Yeah, that's
right, that's your village, and those are all different villages very distant from here”),
otherwise we explained the payoffs for first players and second players in a similar
manner to the SV sessions. For the DV sessions we used the offers from the first movers
from previous locations in which we did DV (using pilot data for the very first one).
4.3. Subject recruitment and sampling frame
The subjects were selected using a multi-stage sampling method. 426 individuals were
surveyed and administered the games in 17 villages in 4 regions: Dushanbe, Khatlon,

14
Gharm and Pamir. In Dushanbe, Pamir and Gharm selection of villages (the first
sampling stage) was made at random based on census data with probability of selection
proportional to population size. Villages in Gharm were chosen at random within the sub
region of the Rasht Valley, where fighting was most intense during the civil war. Within
each village, respondents were selected randomly. On arriving at the sampling point, each
enumerator was randomly assigned a starting point within the town or village. For the
selection of households, each enumerator followed the standard “random route”
technique, starting with 5th numbered apartment building or house selecting every 5th
entrance. Individual respondents (1 per household) were chosen using a random selection
key (a 12-face die) where every adult member of the household had an equal probability
of being selected. For each sampling point, all recruitment of subjects and data collection
was conducted on the same day using a team of enumerators and administrators to
conduct the survey and to run the experiments. In Dushanbe, Gharm, and Khatlon, the
team consisted of the same group of five ethnic Tajik enumerators and one ethnic Uzbek
enumerator. In Pamir, we used a different team of four ethnic Pamiri enumerators and a
Pamiri administrator. The local teams were trained by two graduate students and by one
of the authors of this paper who was always on site to supervise data collection.
To address issues of framing either the experiment or the survey, we conducted some
sessions in which experiment came before the survey and others in which the order was
reversed. For the survey, most of the subjects were interviewed in their home one-on-one
by local enumerators. In cases where the home environment was not sufficiently private
or accommodating, subjects were interviewed outdoors or at another location. Once
subjects completed the survey, they were taken by their enumerator to a common location
in the town or village to participate in the experiments. Most experiments were conducted
in school rooms, where each person had their own desk and chair to work on. In villages
without schools, experiments were conducted in the largest common space, typically a
mosque or a meeting hall. The sessions were conducted in groups of 10-20 subjects
depending on the size of the room available. Subjects were not allowed to talk with one
another during the sessions and this rule was generally well abided. There were no
significant disturbances or interruptions that occurred during the experimental sessions.
Each experimental session was conducted by an administrator and an assistant. The

15
administrator read instructions from a standard script. All survey and experimental
instructions, forms, and materials were translated into Tajik, Russian, and Pamiri and
back-translated into English for accuracy.
4.4. Survey
War victimization is captured through survey questions. The survey asks about injury,
loss of life of any household member, loss of property and forced displacement as a result
of a conflict. Respondents were also asked whether witnessed or took any direct
participation in fighting not only during the conflict but also since the 1997 Peace
Agreement.
The survey probes about economic, social and political attitudes. Several attitudes are of
noteworthy interest. First, our aim is to provide, through survey questions, a validation of
our experimental measures of preferences. We are particularly interested in the
implications of the trust game behavior with regards to impersonal exchange. The survey
therefore investigates stated preferences towards participating in impersonal exchange
and towards market liberalization. In order to measure respondents’ actual participation
in markets, we follow Heinrich et al. (2010) and ask respondents to report the share of
their weekly consumption of food purchased through markets as opposed to self-
produced, bartered or exchanged as gifts. Second, we aim at capturing norms of
generalized morality and respect for the rule of law as opposed to kinship-based morality.
The contribution of generalized norms of morality in solving problems of cooperation
and conflict and the contribution of the latter to the development of impersonal exchange
and markets has been noted in the literature before, namely by Greif (2006). The survey
inquires about procedures of conflict resolution, particularly related to conflicts emerging
during market exchange. Last, the survey includes several measures of participation in
groups, collective action and political participation. The purpose of these questions is to
test whether previous findings of the positive effects of conflict on group membership
and local collective action are replicated in the Tajik context.

16
In order to increase the external validity of our results, the wording of many questions not
only on political and social attitudes but also on war exposure replicates the Life in
Transition Survey, the second round of which was implemented in late Summer 2010.
6. Empirical Strategy and Results
6.1. Empirical Strategy
We investigate how war experience affects individual preferences, values and beliefs.
The analysis compares individuals who suffered from different degrees of violence
during the conflict. The general form of the estimation equation is as follows:
!
Yij = "0 + "1Wij + "2Xij + "3C j +# ij (1)
where our outcome variable Yij includes different measures of elicited social preferences,
market orientation and economic and political preferences of respondent i in region or
village j; Wij is a measure of the intensity of individual exposure to civil war violence, Xij
is a set of individual and household controls, and Cj is a set of region or village fixed
effects. We use two measures of individual exposure to civil war violence. The first
(injured or killed) is a dummy variable taking value 1 if either the respondent was injured
or one of his or her household member was injured or killed during the civil war. The
second (injured and killed) is a dummy variable taking value 1 if the respondent reports
both injury and loss of life during the civil war. This second measure thus indicates
higher degree of severity of exposure to conflict. In all regressions using experimental
data we additionally include controls for the different experimental treatments. Standard
errors are clustered at the village level in all specifications.
Because of the regional nature of the conflict, all specifications include regional fixed
effects. This removes difference between regions, and therefore biases us against finding
any effect of victimization. With regional fixed effects, identification of causal effects of
conflict requires victimization within a region to be –close to- random. Such an
assumption might be too strong. Victims of violence may be different from non-victims
in observable and unobservable ways and so any comparison of victims and non-victims
will conflate the impacts of war with preexisting differences that led some people to be

17
victimized. This is especially problematic if the characteristics associated with
victimization are also those associated with the outcomes that we want to observe. If, for
example, more pro-social or more market oriented individuals, or villages with higher
proportion of such individuals, were systematically targeted, this would result in an
estimation bias of any effect of the civil war on social preferences and market orientation.
The specific situation of Tajikistan somewhat helps us deal with this issue. As a Soviet
creation, Tajikistan had no experience with a market economy and democratic self-
governance as a civil society prior to the onset of violence. This helps alleviate the –
statistical- problem that such characteristics may predict selection into war victimization.
Still, some concerns remain for the identification of causal effects of victimization and
we employ several strategies to deal with the potential selection bias.
First, we employ a selection on observables strategy and check that our results are robust
to the inclusion of a large number of individual and household controls. Of particular
concern are variables that may be related both to post-war outcomes and to victimization.
We focus on pre-1992 characteristics, since such characteristics cannot have been
affected by victimization. We also empirically investigate what characteristics are
associated with victimization and include them as controls in the rest of our analysis.
Second, we check that all results are robust to the inclusion of village fixed effects.
Different villages may have been targeted as a function of many characteristics that are
not observable to the econometrician, for example the support that local clan leaders gave
to different fighting factions. The use of village fixed effects implies that identification
now only requires that violence is -close to- random within villages, conditional on
household and individual characteristics.
Third, in order to address the concern that selection into victimization was based upon
unobservable characteristics, we follow Altonji, Elder and Taber (2005) and gauge how
much the importance of unobservable variables would need to be, relative to observable
factors, in order to explain away all the effects of war violence on post-war outcomes.
Obtained statistics (see Section 6.3.3.) make it unlikely that the omitted variable bias
could account for the full effect of civil war on social norms, market orientation or
economic and political preferences.

18
Our last strategy to deal with potential selection bias is to focus our analysis on different
subsamples. We first restrict our attention to individuals who were too young to be
systematically targeted – those who were 12 or younger at the beginning of the conflict,
or at most 31 years old today. This is about a third of our sample. There is another
rationale behind focusing on this subsample. The psychology literature stresses that
traumatic events have a stronger impact on younger individuals, particularly in their late
childhood or early teenage years. The effects of victimization are thus expected to be of a
larger magnitude on this subsample of the population, who were at most 18 at the end of
the conflict. A remaining issue is that the results could be driven by selective migration
of individuals who experienced violence. Our results would be biased if, for example,
war victims systematically migrated to areas where formal institutions are weak and
markets are poorly developed. In order to deal with this issue, we re-run the analysis on
the subsample of people who have never moved and still live in the same village where
they were born.
6.2. Determinants of Victimization
As can be seen in Table 1, the incidence of war victimization in our sample is very high.
On average, 21% of respondents declare that they have been personally injured or that a
member of their household has been injured or killed as a result of the conflict. 13% of
respondents report both injury and loss of life as a result of the conflict. There is a lot of
regional variation (see Figure 1 and Table A2 in Supplementary Appendix).
Victimization is particularly high in Gharm, one of the regions most affected by civil war
violence. We purposefully surveyed respondents in the Rasht Valley, where fighting was
particularly intense. 40% of respondents in this region report loss of life in their
household.
Table 2 displays the results of regressions where our victimization indicators are
regressed on a number of individual characteristics, controlling for regional and village
fixed effects. The results do not support fears that selection into victimization is a major
concern. The region where the respondent lived in 1992 is the strongest and most robust
predictor of violence. Ethnicity is also found to be a strong predictor of victimization.

19
Members of –easily identifiable- minority groups, Uzbeks and Kyrgyz, are less likely to
have been victims of violence. As expected, victimization is positively associated with
age, although the relationship is statistically weak. Education is also positively and
significantly associated with victimization. In order to explore in more details the
relationship between education and victimization, we restrict the sample to the subset of
individuals who were or 25 and older in 1992 (Columns 2, 4, 6 and 8), as their education
levels were then predetermined and could not have been affected by the conflict. Results
on this subsample confirm that higher levels of education are positively associated with
victimization. Individuals who completed compulsory or secondary education are more
likely to have suffered from civil war violence than those who have no education. The
effect of higher education is positive but not significant. This result could be explained by
“guns or butter” models of conflict as a choice between production and appropriation,
which suggest that the probability of victimization is linked to the resources of potential
victims (Haavelmo 1954, Grossman and King 1995). If more educated people had more
resources to be expropriated or, more generally, were the object of envy, they might have
been targeted during the conflict. In contradiction with this explanation however, the
relationship between income and victimization is no robust and if anything, is negative.
Another explanation for the relationship between education and victimization has to do
with theories of political participation. Higher levels of education generate expectations,
which, if unmet, can induce participation in demonstrations. These ideas have been
popularized as the J-Curve theory (Davies 1974, Miller et al. 1977). In the context of the
Tajik civil war, more educated people were probably more likely to join (or be suspected
of joining) the protests that ignited clashes and retaliation by government forces. This
positive relationship between education and victimization might lead to an upward
endogeneity bias in our results. If more pro-market individuals were systematically
targeted, this will bias upward the relationship between victimization and pro-market
behavior and preferences. However, our main results point to a negative relationship
between market orientation and victimization. Absent such correlation between education
and victimization, one may thus expect the main relationship discussed in this paper to be
even stronger. Other covariates that may have been expected to be correlated with
victimization, such as having a family member that was member of the communist party,

20
or having been displaced by the communist regime are positive but not significant
predictors of violence. In all regressions, education and communist party membership of
household members are controlled for. We also control for all characteristics that are
unlikely to have changed as a result of the war, such as age, ethnicity, gender and the
region where the respondent lived at the onset of conflict.
6.3. Experimental Results: Trust and Dictator Games
6.3.1. Trust Game
The main hypothesis we want to test in this paper is that civil war related violence
hampers trust and, in particular, opens a gap between individual trust towards different
groups. It is already apparent from the descriptive statistics displayed in Figure 2 that,
although war victimization does not lower in a significant manner the overall amount sent
in the trust game, it has a strong differential effect across the two treatments.
Victimization sharply reduces the amount sent to someone in the same village, while the
effect is mostly insignificant (positive if anything) towards someone living in a different
village. Regression results controlling for regional differences and individual
characteristics confirm this. Panel (a) of Table 3 displays the results for those who report
injury or loss of life as a result of the conflict, panel (b) for those who report both injury
and loss of life. Specifications control alternatively for region and village dummies.
Columns 1 and 2 investigate the main effect of victimization on trust game donations.
Columns 3 to 5 include an interaction term between victimization and the same village
treatment in order to test for differential effects of victimization on trust within and across
villages. Columns 6 to 8 report results of regressions performed on the different treatment
subsamples. Columns 10 and 11 report results of regressions performed only on the
subsample of those how were 12 or younger at the onset of the conflict, a group for which
we are less likely to suspect self-selection into victimization.
The picture emerging from the regressions is clear: war victimization destroys local trust.
The coefficient on the interaction between the same village treatment and whether the
respondent reports injury and/or loss of life is always negative and significant at the 5%
to 10% level. This is confirmed in Columns 8 and 9 of Table 3b: war victims give

21
substantially less when they play in the same village treatment, and the effect is
significant at the 5% level. These effects are robust to the inclusion of village fixed
effects. The effect of victimization on local trust is not only statistically but also
economically significant. Injury or loss of life during the civil war is associated with
between 2.8 and 3.3 Somoni average decrease in donations in the trust game to people of
the same village. The average donation being 9.74, this represents a decrease within the
same village by around 30%. The effect is even stronger for those who suffered to an
even greater degree during the war. People who report both injury and loss of life give
about 46% less to people from the same village. The effects are robust when village fixed
effects are included and actually become larger. The effect of victimization on local trust
far outweighs the influence of any other individual characteristics such as age, gender,
ethnicity, education or communist party membership, none of which has a robust effect,
either on its own or interacted with the same village treatment. Additional results
available upon request (not included for space economy) show that the effect is robust to
controlling for additional individual characteristics such as income, working status,
marital status, and family size and composition. The effect is also robust to ordinal logit
or probit specifications.
By contrast, war victims tend to give more when they play with an anonymous partner
from a different village (Columns 6 and 7 and main effect in Columns 4 and 5).
Victimization is associated with a roughly 20% increase in trust to an anonymous partner
from a distant village.
This increase in basic trust associated with victimization that we find once we control for
the treatment and include the interaction term in Columns 4 and 5 is especially
meaningful for us. We will see this outcome returning in the young sub-sample analysis
and in the various specifications of the dictator game results. This tells us that being more
or less directly affected by war-related violence reduces the trust we have in our fellow
villagers, but, ultimately, towards a distant other that has not hurt us directly, we are
willing to give a chance. This is related to that large body of psychological literature on
post traumatic growth we surveyed above (Tedeschi and Calhoun, 2004; Solnit, 2009).
This positive effect of trauma might help explain the findings of Bellows and Miguel
(2009) and Blattman (2009) and has also been found in other post-war societies such as
22
Georgia (Bauer, Cassar, Chytilova and Henrich, 2011) and Sierra Leone (Bauer, Cassar
and Chytilova, 2011).
The effect of war victimization on sending in the trust game remains robust and actually
acquires more significant both statistically and economically when we focus our attention
to the subsamples of non movers (Supplementary Appendix table A3) and those younger
than 12 at the onset of conflict (Columns 10 and 11 of Tables 3a and 3b). In both sub-
samples, either proxy of victimization is associated with a statistically significant
decrease in sending in the same village treatment and a statistically significant increase in
the different village treatment, albeit by a smaller amount. The sample of youth is the
most interesting sample in order to test additional predictions from the psychological
literature concerning the malleability of preferences at different ages. Indeed, in this
sample, either proxy of war victimization is associated with a roughly 50% decrease in
amount sent by the first mover to a partner from the same village and an average 40%
increase in amount sent towards anonymous partners from a different village. This
corroborates the idea that traumatic events leave a larger imprint on preferences if
experienced during late childhood or teenage years.
6.3.2. Fairness and Generosity
In addition to trust, we are interested in whether civil war related violence exerts a lasting
impact on norms of fairness. We have two measures of fairness: generosity, which is
measured by contributions in the dictator game and egalitarianism, which is measured by
offering an equal split. We proceed in the same way as before by first exploring the main
effect of conflict victimization and then interacting the victimization variable with the
same village treatment to test for differential effects of victimization towards different
groups. All regressions control for the full set of controls discussed in 6.1.
Table 5 reports regression results where the dependent variable consists of contributions
sent by the first mover in the dictator game. Having been a victim of conflict is associated
with an overall increase in generosity. The effect is substantial. Injury or loss of a
household member during the conflict is associated with a 25% (within village, Column
3) to 30% (within region, Column 2) increase in dictator game giving. However,

23
mirroring the results of the trust game, this is mainly due to an increase in generosity
towards a distant other. Again, the effect is much larger for those who experienced such
traumatic events in their childhood or early teens. Columns 9 and 10 report the results for
the sub-sample of those 18 or younger at the end of the war. Injury or loss of life is
associated with a 55% increase in generosity towards an anonymous partner from a
different village but a 80% average decrease in giving to someone from the same village
(column 10, Table 5a)! The effect is even more dramatic for those who suffered even
more during the civil war. Those who report both injury and loss of life give 66% more to
an anonymous partner but 90% less to someone from the same village (column 10, Table
5b)! Such effects nevertheless fall short of significance when village fixed effects are
included.
A similar picture is obtained for preferences for egalitarianism. Regression results are
reported in Table 7 and 8. Preferences for an egalitarian split increase by about 20%
towards respondents from a different village but decrease by a superior amount (around
30% on average) towards someone from the same village. The results are robust to the
inclusion of village fixed effects and to using alternative subsamples of non-movers (see
Table A4 in Supplementary Appendix) as well as different specifications (logit and
probit). In the subsample of those who were 18 or younger at the end of the conflict,
again, the results are of the same sign and larger in magnitude, although they fall short of
significance when victimization is proxied by injured.
6.3.3. Additional Robustness to Selection on Unobservables
Following Altonji, Elder, and Taber (2005) and Nunn and Wantchekon (forth.), ratios are
computed that reflect how much greater the influence of unobservable factors would need
to be, relative to observable factors, to explain away the full positive relationship between
war victimization and individual behaviors in game. This test is based on the ratio of
coefficients of regressions including full or restricted sets of control variables. The first
coefficient
!
ˆ " R is obtained when only the victimization variables are controlled for. The
second,
!
ˆ " F is obtained when the full set of observable characteristics are controlled for.

24
The ratio is calculated as:
!
ˆ " F ˆ " R # ˆ " F( ) . The intuition behind this formula is that the
smaller is the difference between the two coefficients, the less the estimate is affected by
selection on observables so that the larger the selection on unobservables needs to be,
relative to observables, in order to explain away the entire effect of
!
ˆ " F . Table 9 reports
the ratio of coefficients of regressions including full or restricted sets of coefficients.
Obtained ratios make it unlikely that unobserved heterogeneity could explain away the
relationship between victimization and trust game behavior in the same village treatment.
The ratios obtained for the dictator game and egalitarian split results yield similar
conclusions.
6.3.4. Discussion
Our results suggest that the Tajik civil war has destroyed local trust and norms of fairness
towards those in the same village, while it has modestly increased them towards others
living far away. We argue that such effect may constitute an important impediment to
market and economic development. It has been stressed in the literature that in many
developing countries, the weakness of contract enforcement institutions constitutes an
obstacle to market and economic development (North, ). It has been shown that in this
context, social preferences characterized by norms of fairness and trust can play a key
role in substituting for formal institutions and solving for the cooperation and
coordination problems implied by interpersonal exchange (Fafchamps 2004, Fehr, Hoff
and Kshetramade 2008). The evidence above, which points to the destruction of such
norms of fairness and trust implies that solving such problems will be more difficult and
will impede market development– at least at the local level. A frequent objection to
experimental evidence however is that behavior in games may poorly reflect actual
behavior. We therefore turn in the next subsection to more direct survey evidence on
respondents’ stated preferences and actual behavior. Such evidence largely corroborates
the conclusions drawn from our experimental evidence.
6.4. Survey Results: Market Integration, Economic and Political Preferences
25
We first investigate directly respondents’ stated and revealed preferences on participation
in impersonal exchange. Second, we investigate the strength of formal institutions vs.
kinship-based informal institutions, particularly in what relates to conflict adjudication.
An important literature and in particular Greif (2000) has stressed the importance of
conflict adjudication mechanisms in enforcing economic exchange. Historically, the
evolution of such institutions from a kinship and interpersonal basis to an open and
impersonal basis has been associated with the “birth of impersonal exchange” (Greif
2006). Third, we investigate the determinants of a form of social capital: collective
action. The importance of social capital for growth and market development has been the
object of an ever-growing literature (for a recent review, see Guiso, Sapienza and
Zingales 2010). Group membership and civic participation have been widely used in the
literature as measures of social capital. Recent studies of the effect of civil war have
found that individual experiences of civil war violence, either as victims or perpetrators,
were associated with more active local political participation and group membership
(Bellows and Miguel 2008, Blattman 2009). However, this acceptation of social capital
also has negative connotation, if it leads to the exclusion of outsiders (Portes, 1998). To
what extent participation in local groups reflects inclusive and impersonal social capital
of the kind that has been associated with market development and growth or a fold back
on clannishness is investigated in what follows.
6.4.1. Market integration and participation
Table 10 presents regression results where we use several dependent variables in order to
measure willingness to participate in impersonal exchange and preferences for free
markets through survey questions. Consistently with the observed decrease in the offers
in the trust game, victims of civil war violence have a significantly lower willingness to
engage in anonymous exchange. We measure such willingness by the following survey
question: “When you go to the market, how important is it to buy from a seller that you
know personally?”, with a 4 points scale answer from “not important at all” to
“essential”. The effect of conflict is positive and significant at the 1% level and is robust

26
to the inclusion of village fixed effects, signaling a decreased willingness to participate in
exchange with an anonymous trader.
We also measure people’s actual participation in markets by asking questions about the
proportion of different food items purchased through market exchange, versus self
produced or procured through donations. Civil war victims are less integrated into
markets according to this measure, although the effect falls short of significance when
village fixed effects are included (see Table A5 in Supplementary Appendix).
War victimization is also associated with a significant decrease in preferences for a free
market and for market liberalization, which we measure through two survey questions
described in Table 1. Preferences for a democratic system are also significantly lower
among civil war victims. Support for free markets and democracy is roughly 20% lower
among victims of civil war compared to other individuals from the same village.
6.4.2. Kinship vs. rule of law
Table 11 present regressions results where the dependent variables consist of answers to
different questions aimed at capturing the strength of clannishness and kinship ties. We
included a question that measures to what extent, when facing a conflict situation,
respondents turn to legal and formal institutions – the police or village leader - or to their
kin in order to solve the conflict. We are particularly interested in conflicts that may be
associated with market transactions, and we probe about recourses in three potential
conflict situations: (i) the respondent “lent money to someone who does not repay”, (ii)
he/she “sold a good to someone who refuses to pay, or (iii) “someone knowingly sold
him/her a defective good”. We build an index that reflects the number of times the
respondent would turn to his/her relatives, as opposed to the police or village leader, in
order to solve such a conflict. We then regress this index on war experiences. Results are
displayed in Columns 1 and 2 of Table 11. Our first measure of victimization, injured or
killed, is positively and significantly associated with a reinforcement of kinship ties.
Accordingly, civil war victims are also less likely to support the statement that “If
someone has information that may help justice be done, generally he or she should report
it to the police” (Columns 3 and 4).

27
The third variable that we use to measure the strength of kinship ties is opinions about the
freedom to marry. As stressed by Greif (2006), restricted and consanguineous marriages
have historically provided one means of creating and maintaining kinship groups. We ask
in the survey whether the respondent supports freedom to marry or rather thinks best for
parents to choose a spouse for their children. We regress a dummy variable taking value 1
if respondents support the freedom to marry on war experiences. Results are displayed in
Columns 13 and 14 of Table 11. War experience is markedly associated with a decrease
in the support for free marriage, even hen we control for whether the respondent herself
married freely.
6.4.3. Participation in groups
Several survey questions aim at capturing participation in groups and association. First,
we asked respondents whether they participated in any community meetings during the
week preceding our team’s visit. Second, we build an index variable that sums the
number of groups and associations the respondents belongs to. We ask about a variety of
groups, such as mosque and religious organization, NGOs, neighborhood groups, labor
unions, fraternal groups and youth associations. This index takes values from 0 to 5.
Group participation is low on average in our sample, which is consistent with the
literature documenting evidence of low levels of civil society development in post Soviet
Republics, particularly in Central Asia (REFERENCES). The mean of the group
participation index is 0.79. 40% of respondents do not participate in any group. However,
civil war experience is significantly and positively associated with group participation.
Regression results are displayed in Columns 3 to 8 of Table 12. War victims are also
more likely to have attended community meetings (Columns 1 and 2 of Table 12). This
mirrors the result found by an emerging literature that finds a link between civil war and
local collective action, namely by Bellows and Miguel (2008) in the case of Sierra Leone.
The interpretation that prevailed in the literature so far was a positive one: that civil war
may be ‘good’ for civil society development. Our results highlight something different.
Such participation among war victims is actually associated with a decrease in trust as
measured by the trust game. Results are displayed in Table 13. The first variable of
28
interest is an interaction between the same village treatment and a dummy that reflects
whether people participate in groups or association. The positive and statistically
significant coefficient on this variable reflects the usual result of the literature that group
participation is correlated with higher levels of trust. The second variable of interest is an
interaction between the same village treatment, a dummy that indicates group
participation and one of our victimization proxy (injured and killed). The coefficient of
this interaction term is negative and statistically significant, indicating that those who
participate in groups but are victims of the civil war send less to their fellow villagers in
the trust game. The effect holds whether we control for region or village fixed effects.
Such evidence is consistent with our previous results that civil war victimization is
associated with a reinforcement of clannishness and kinship ties. Participation in groups
in this case may not be taken as an indication of inclusive social capital but rather as a
sign of victims folding back towards exclusive groups.
We also investigate which particular group and association war victims are more likely to
join. It is mainly religious groups and, to a lesser extent, labor unions that receive a boost
in membership among war victims. The effect is not significant for any other group. In
Tajikistan, participation in religious groups may be perceived as a form of opposition to
the government. As a matter of fact, both war veterans and, more worryingly, those who
participated in fighting since the Peace Agreement are also significantly more likely to be
members of a Mosque and religious groups (see Table A6 for full results).
7. Concluding Remarks Specific to the Case of Tajikistan
This paper reports the results of a study combining experimental evidence with survey
data to investigate the effects of civil war violence. We collected data on prosocial and
economic preferences for 426 randomly selected subjects coming from different regions
of Tajikistan. Our results indicate that over 10 years after the end of the civil war those
individuals that have been affected the most behave significantly different when
interacting with others from the same village. With respect to trust, those that have been
more affected in terms of being injured or having a relative killed trust significantly less
those in the same village than distant people elsewhere in Tajikistan. With respect to
29
fairness and egalitarianism, we observe a similar result within village: those that have
been affected are willing to give much less to others from the same village, but much
more to abstract distant others.
In conclusion, our study indicates that violence has undermined social trust at the village
level, which has eroded support for market liberalization and democratic reform based on
individual rights. Many scholars have pointed out a general trust deficit in post-Soviet
societies, but we argue that the experience of violence has further complicated the ability
of Tajikistan to build on an already poor foundation for trust (See Appendix for more
detailed discussion). This manuscript thus raises questions about the enduring effects of
Tajikistan’s civil war on prospects for economic and political institution building. We
argue that civil conflict increases the likelihood that Tajikistan will remain “lost in
transition”, failing to make significant progress either on democratization or market
economic development, which in turn increases the likelihood of recurrent conflict.
Institution building is one way in which Tajikistan could possible escape the “conflict
trap” – the cycles of poverty and violence well documented in Africa. However, our
research indicates that the Tajik civil war has created long-term challenges to institution
building. Our concerns are based on what we observe to be the erosion of basic social
norms vital to functional political institutions, market economies, and civil societies,
especially within local communities.
Much of the institutional literature on trust and social capital more broadly claims that
social norms are essential for well functioning institutions. Cooperative pro-social norms
like trust, fairness, and reciprocity provide a mechanism for smoothing transactions in
complex societies. Institutions provide the enforcement mechanisms to ensure
cooperative norms are well-abided. Though norms can persist in the absence of
institutions, social cooperation is considered to be significantly less stable. Hence, while
there is disagreement about the causal relationship between institutions and social norms,
most scholars agree that norms and institutions are at least reflective qualitatively of one
another. Strong credible institutions go hand in hand with enduring cooperative norms
within society.

30
War, civil conflict, and violence are potentially devastating because they undermine both
the institutional framework of the state as well as the social fabric for cooperation.
Violence dramatically increases the risks and uncertainties of social exchange and breaks
down the institutions that normally protect people against entrepreneurism. Normally this
leads people to turn inward, trusting and relying only on those networks of people who
they consider “safe”. Typically, this includes family, kinship, and then friendship
networks at the local level. As the circle broadens, the likelihood of trust and cooperation
declines from family, friends, neighbors, and people in the community. Beyond the local
community, people have to rely on social heuristics such as region, religion, ethnic-
nationalist, or clan-based identities to determine who is friend or foe. Failure to make
these types of distinctions can have deadly consequences in an environment of war and
violence.
Appendix A. Background on the Tajik civil war and post conflict
The Tajik civil war (1992-1997) has received far less attention than most other conflicts
of the 1990s, to the extent that some have described it as a “forgotten civil war” (Jawad
and Tadjbaksh, 1995). The historical record of the conflict has been described by scholars
as “scattered”, “contested and obscured”, “heavily biased in favour of one faction or the
other” (Chatterjee 2002; Heathershaw 2009; Akiner 2001 respectively). A variety of
interpretations of the conflict can be found in the literature based on regionalism,
ideology, elite instrumentalism, and conflicts over resources . From a regional
perspective, the war is often described as a struggle between a pro-government alliance of
northern and southern factions against eastern opposition groups, out of which the
southern faction emerged as dominant. Ideologically, the conflict is often characterized as
former communists against a highly fractionalized group of challengers comprised of
Islamic revivalists, ethnic nationalists, and pro-democratic reformers . Most of the
conflict took place in central and southern low-lying areas where these population groups
were inter-mixed. Mountainous geographic divisions prevented the fighting from
extending into the far north and eastern regions.

31
Heathershaw (2009, p. 25) writes that Tajik civil war may be best understood as a
“complex crisis of decolonization” resulting from the collapse of the Soviet Union and
unfolding in several stages. The period from the beginning of following glasnost and
perestroika in the late 1980s through 1991 saw the rise of opposition groups and protests
against the old guard regime. Following Tajikistan’s independence in 1992, protests
between government and opposition groups became more violent and an internal power-
struggle escalated within the pro-government alliance, in which the dominant northern
leadership was overthrown by southern factions. From 1992 onward, the southern-
dominated government forces battled eastern opposition groups until a peace agreement
was reached in 1997. Fighting was especially fierce in the southern province and around
the capital . With military intervention from Russia and Uzbekistan, government forces
ultimately regained control by pushing eastern opposition out of the south, the central
regions, and the capital back to their homelands in the east or abroad . In 1997 the United
Nations brokered a peace agreement between government and opposition forces. Russian
troops would remain in Tajikistan after the war, especially along the Tajik-Afghan
border, as part of a peacekeeping operation together with other countries from the
Commonwealth of Independent States. In the period between 1992 and 1997 estimates of
war casualties vary between 50,000 and 100,000 dead and over 1 million people
displaced internally and abroad .
Many aid organizations have catalogued the devastating consequences of the civil war on
Tajikistan’s economic and political development. Economically, Tajikistan is still making
up for losses incurred during the war. The World Bank estimates that Tajikistan’s GDP
fell by over 60% during the war and despite modest recovery over the past decade,
remains below pre-war levels . According to the latest National Development Report by
the UNDP, Tajikistan is not projected to regain its 1990 HDI levels until 2015 . The
strongest component of Tajikistan’s current HDI ranking is adult literacy (99.6%), while
per capita GDP remains the weakest, indicating a highly educated but impoverished
society. Although poverty rates have fallen from highs of over 80% in the past decade,
the UNDP estimates that over half the population still lives under the poverty line and
real unemployment remains at 35-40%. Although the able-bodied population has grown
by over 1.6 million since the end of the war, the UNDP estimates that total economy

32
productivity within the workforce population has decreased by 18%. The absence of
employment opportunity has led anywhere from 400,000 to 1.5 million Tajiks to migrate
abroad for work. In 2008 remittances from abroad accounted for $2.6 billion or 52% of
Tajikistan’s GDP.
Politically, Tajikistan has also failed to make progress on democratization since the war
based on a range of indicators. Using Polity IV data, the Center for Systemic Peace
classifies Tajikistan as reflecting “an inherent quality of instability or ineffectiveness”
and “especially vulnerable to the onset of new political instability events, such as
outbreaks of armed conflict, unexpected changes in leadership, or adverse regime
changes” (Marshall and Cole 2009, p. 9) . Freedom House consistently ranks Tajikistan
as “not free” in provision of political and civil rights . Transparency International also
ranks Tajikistan high on its corruption perception index . The 2009 Failed State Index
considers Tajikistan “in danger” of state failure . Tajikistan is similarly ranked according
to the State Fragility index as “serious” by the Center for Systemic Peace. Finally,
Tajikistan has not experienced a single transition in presidential power or parliamentary
control since 1992 and neither appears likely in the foreseeable future. Although the
government of Emomalii Rahmon has generally succeeded in keeping the peace, political
and economic institutions have shown weaknesses in dealing with domestic and external
threats to Tajikistan’s long term stability (Akiner 2001, Johnson 2006, Heathershaw
2009). A destabilizing political or economic shock could usher in the collapse of
Emomalii Rahmon’s regime and a return to civil conflict or possibly international conflict
with its neighbors.
REFERENCES
Algan, Y. and Cahuc. P. 2010. “Inherited Trust and Growth,” American Economic Review 100(5): 2060–92.
Altonji, J., Elder T., and Taber, C. 2005. “Selection on Observed and Unobserved Variables: Assessing the Effectiveness of Catholic Schools,” Journal of Political Economy 113(1), pages 151-184.
Akiner, S. 2001. Tajikistan: Disintegration or Reconciliation? London: Royal Institute of International Affairs.

33
Michal, B., Cassar, A., Chytilová, J. and Henrich, J. 2011. Warfare during Ontogeny Increases Egalitarian and Parochial Motivations. Working paper.
Bellows J., Miguel E. 2009. “War and Collective Action in Sierra Leone.” Journal of Public Economics 93(11-12), 1144-1157.
Blattman, C. 2009. “From Violence to Voting: War and Political Participation in Uganda.” The American Political Science Review 103, 231.
Bowles, S. 2006. “Group competition, reproductive leveling, and the evolution of human altruism.” Science 314, 1569.
Bowles, S. 2008. “Conflict: Altruism's Midwife.” Nature 456, 326-327. Bowles, S. 2009. “Did warfare among ancestral hunter-gatherers affect the evolution of
human social behaviors?” Science 324, 1293. Bowles, S. and Gintis, H. 2006. “Social Preferences, Homo Economicus and Zoon
Politikon.” In The Oxford Handbook of Work of Contextual Political Analysis, Eds. Robert E. Good in and Charles Tilly. New York: Oxford University Press.
Boyd, R. and Richerson, P. J. 2005. “Solving the Puzzle of Human Cooperation,” In: Evolution and Culture, S. Levinson ed. MIT Press, Cambridge MA, pp 105–132.
Cardenas, J.C., and Carpenter, J. (2008). “Behavioural Development Economics: Lessons from Field Labs in the Developing World,” Journal of Development Studies 44(3): 337-364.
Case, A. and Katz L. 1991. “The Company You Keep: The Effects of Family and Neighborhood on Disadvantaged Youths.” National Bureau of Economic Research Cambridge, Mass., USA.
Cassar, A., Healy, A. and von Kessler, C. 2011. “Trust, Risk, and Time Preferences After a Natural Disaster: Experimental Evidence from Thailand,” Working Paper.
Choi, J. and Bowles, S. 2007. The Coevolution of Parochial Altruism and War. Science 318, 636-640.
Chatterjee, S. 2002. Society and Politics in Tajikistan: In the Aftermath of the Civil War. London: Greenwich Millenium Press.
Collier, P., Elliott, V., Hegre, H., Hoeffler, A., Reynal-Querol, M., Sambanis, N. 2003. “Breaking the Conflict Trap: Civil War and Development Policy”, Volume 1, A WorldBank policy research report.
Collier, P. and Hoeffler, A. 2004. “Greed and Grievance in Civil War,” Oxford Economic Papers 56 (4): 563-595.
Darwin, C. The Descent of Man. (Appleton: New York, 1873).
Davies, J. 1974. “The J-Curve and Power Struggle Theories of Collective Violence,” American Sociological Review, 39(4).
Davis, D. R., and Weinstein, D. E. 2002. “Bones, bombs, and break points: the geography of economic activity,” American Economic Review 92:1269-1289.

34
Engvall, J. 2006. “The State Under Seige: The Drug Trade and Organized Crime in Tajikistan”. Europe-Asia Studies 58(6): 827-854.
Fafchamps, M. 2006. “Development and Social Capital,” Journal of Development Studies.
Fehr, E., Hoff, K. and Kshetramade, M. 2008. “Spite and Development,” American Economic Review: Papers & Proceedings, Vol. 98(2): pp. 494-499.
Frey, L. and Frey, M. 2004. The French Revolution. Friedman, D. 2008. Morals and Markets – An Evolutionary Account of the Modern
World. Palgrave. Greif, A. 2000. “The Fundamental Problem of Exchange: A Research Agenda in
Historical Institutional Analysis.” European Review of Economic History 4: 251-284. Greif, A. 2006. “Family Structure, Institutions, and Growth: The Origins and
Implications of Western Corporations.” American Economic Review, Papers and Proceedings, 96(2): 308-312.
Gretsky, S. 1995. “Civil War in Tajikistan: Causes, Developments, and Prospects for Peace” In Central Asia: Conflict, Resolution, and Change. Eds. Roald Z. Sagdeev and Susan Eisenhower. Maryland: CPSS Press, pp. 217-247.
Grossman, H. and Kim. M. 1995. “Swords or Plowshares? A Theory of Security of Claims to Property,” Journal of Political Economy 103(6).
Guiso, L., Sapienza, P. and Zingales, L. 2004. “Cultural Biases in Economic Exchange,” NBER Working Papers 11005, National Bureau of Economic Research, Inc.
Guiso, L., Sapienza, P. and Zingales, L. 2010. “Civic Capital as the Missing Link,” NBER Working Papers 15845, National Bureau of Economic Research, Inc.
Haavelmo, T. 1954. A Study in the Theory of Economic Evolution. Heathershaw, J. 2009. Post-Conflict Tajikistan: The Politics of Peacebuilding and the
Emergence of Legitimate Order. London: Routledge. Henrich, J., Heine, S. J., & Norenzayan, A. 2010. “Most people are not WEIRD.” Nature,
466, 29.
Henrich, J., Ensimger, J., McElreath, R., Barr, A., Barrett, C., Bolyanatz, A., Cardenas, J. C., Gurven, M., Gwako, E., Henrich, N., Lesorogol, C., Marlowe, F., Tracer, D., Ziker, J. 2010. “Markets, Religion, Community Size, and the Evolution of Fairness and Punishment.” Science, 327, 1480-1484.
Hiro, Dilip (1995). Between Marx and Muhammad: The Changing Face of Central Asia. London: Harper Collins Publishers.
Ichino, A. and Maggi, G. 2000. “Work Environment And Individual Background: Explaining Regional Shirking Differentials In A Large Italian Firm,” The Quarterly Journal of Economics 115(3): 1057-1090.
Jawad, N. and Tadjbakhsh, S. 1995. Tajikistan: A Forgotten Civil War. London: Minority Rights Group. January.

35
Johnson, R. 2007. Oil, Islam, and Conflict. Chicago: University of Chicago Press. Jonson, L. 2006. Tajikistan in the New Central Asia: Geopolitics, Great Power Rivalry,
and Radical Islam. London: I.B. Taurus. Kilavuz, İ. T. 2009. “The Role of Networks in Tajikistan’s Civil War: Network
Activation and Violence Specialists”. Nationalities Papers 37(5): 693-725. Knack, S. and Keefer, P. 1997. “Does Social Capital Have an Economic Payoff? A
Cross-Country Investigation,” Quarterly Journal of Economics 112(4): 1251-1288. Knack. S. and Zack, P. 2001. “Trust and Growth”, Economic Journal, 111: 295–321.
La Porta, R., Lopez-de-Silanes, F., Shleifer, A and Vishny, R. 1997. “Legal Determinants of External Finance,” Journal of Finance 52, 1131-1150.
Loewenstein, G. and Angner, E. 2003. “Predicting and Indulging Changing Preferences,” in G. Loewenstein, D. Read, and R. Baumeister. (Eds.). Time and Decision: Economic and Psychological Perspectives on Intertemporal Choice (pp. 351-391). New York: Russell Sage Foundation Press.
Marshall, M. and Cole, B. 2009. “Global Report 2009: Conflict, Governance, and State Fragility”. Center for Systemic Peace.
Miguel, E. and Roland, G. 2011. Miguel, Edward, Roland Gerard. “Long Run Impact of Bombing in Vietnam,” Journal of Development Economics. Forthcoming.
Miller, A., Bolce, L., and Halligan, M. 1977. “The J-curve theory and black urban riots - an empirical test of progressive relative deprivation theory,” American Political Science Review, 71(3).
Niyazi, A. 1999. “Islam and Tajikistan’s Human and Ecological Crisis.” In Civil Society in Central Asia. Eds. M. Holt Ruffin and Daniel C. Waugh. Seattle: University of Washington Press.
Nunn N, Wantchekon L. forth. “The Slave Trade and The Origins of Mistrust in Africa.” American Economic Review, Forthcoming.
Rockenbach, B. and Milinski, M. 2006. “The Efficient Interaction of Indirect Reciprocity and Costly Punishment.” Nature 444, 718-723.
Solnit, R. 2009. A Paradise Built in Hell: The Extraordinary Communities that Arise in Disaster. Viking Books.
Stigler. G., and Becker. G. 1977. “De Gustibus Non Est Disputandum,” American Economic Review 67(2): 76-90.
Tedeschi, R. G. and Calhoun, L. G. 2004. “Post-traumatic Growth: Conceptual Foundations and Empirical Evidence.” Psychological Inquiry 15(1): 1–18.
Tilly, C. & Ardant, G. 1975. The formation of national states in Western Europe. Princeton University Press.
Tilly, C. 1985. “War Making and State Making as Organized Crime” in Bringing the State Back, edited by Peter Evans, Dietrich Rueschemeyer, and Theda Skocpol. Cambridge: Cambridge University Press.

36
UNDP (2010). Employment in the Context of Human Development. National Human Development Report 2008-2009: Dushanbe: United Nations Press.
Voors, M., Nillesen, E., Verwimp, P., Bulte, E., Lensink, R., and Van Soest, D. 2011.“Does Conflict affect Preferences? Results from Field Experiments in Burundi.” American Economic Review, Forthcoming.

37
Table 1: Summary StatisticsVariables Description Obs Mean S.d. Min MaxVictimizationInjured or Killed Respondent or household member injured during war 426 0.21 0.41 0 1
Injured & Killed Household member killed during war 426 0.13 0.34 0 1
Experimental data:Offer Trust Game Amount sent trust game (0, 5, 10, 15, 20) 426 9.74 6.97 0 20
Offer Dictator Game Amount sent dictator game (0, 10, 20, 30, 40) 426 10.26 9.69 0 40Egalitarian split 1 if offer=20 in dictator game 426 0.23 0.42 0 1Same village same village treatment 426 0.46 0.5 0 1Survey data: Importance knowing trader personally
Scale: not important at all (0) to very important/essential (4)
424 1.82 1.03 1 4
Freedom in economy 1 if agree or strongly agree to: "We are more likely to have a healthy economy if the government allows more freedom for individuals to do as they wish"
407 0.55 0.5 0 1
Favor market economy 1 if "market economy is preferable to any other form of economic system"
421 0.55 0.5 0 1
Favor democracy 1 if "democracy is preferable to any other form of political system"
419 0.6 0.49 0 1
Attended community meeting
1 if attended community meetings last month 412 0.37 0.48 0 1
Part. groups and assoc. Sum of dummies=1 if respondent member of: mosque/religious group, NGO, neighborhood group, fraternal group and youth association
410 0.79 0.92 0 5
Member mosque 1 if member mosque/religious group 344 0.33 0.47 0 1Turn to relatives if cheated in markets
1 if turn to relatives first in either situation: not repaid for loan, sold a good and was not paid, was sold a defective good
426 0.14 0.39 0 2
Should report info to police 1 if agree or strongly agree to: "If someone has information that may help justice be done, generally he or she should report it to the police"
404 0.47 0.5 0 1
Support freedom to marry 1 if favors personal freedom to marry rather than parents choosing spouse for their children
399 0.81 0.39 0 1
ControlsAge 419 39.84 13.47 17 77Gender 1 if male 422 0.29 0.46 0 1Any CP 1 if either respondent, her mother, father or other HH
member member of Communist party426 0.09 0.29 0 1
Comp. education Highest education level: compulsory education 422 0.68 0.47 0 1Second education Highest education level: secondary education 422 0.12 0.32 0 1Higher education Highest education level: higher education 422 0.14 0.35 0 1Pamiri 426 0.04 0.2 0 1Uzbek 426 0.05 0.21 0 1Kyrgyz 426 0.02 0.14 0 1Region lived in 1992:Dushanbe 426 0.22 0.42 0 1Gharm 426 0.2 0.4 0 1Khatlon 426 0.38 0.49 0 1Varzob 426 0.01 0.12 0 1

38
Table 2: Determinants of VictimizationOLS regression
1 2 3 4 5 6 7 8Dep variableSample:
Age 0.002 0.001 0.008 0.007 0.001 0 0.007 0.005[0.228] [0.392] [0.107] [0.158] [0.392] [0.728] [0.161] [0.271]
Gender 0.005 0 -0.067 -0.062 0.067 0.067 -0.012 -0.021[0.923] [0.997] [0.288] [0.421] [0.286] [0.320] [0.821] [0.706]
Pamiri -0.11 -0.101 -0.099 -0.14 -0.003 0.012 0.011 0.018[0.006] [0.109] [0.427] [0.309] [0.904] [0.749] [0.895] [0.819]
Uzbek -0.145 -0.123 -0.096 -0.026 -0.097 -0.113 -0.091 -0.06[0.024] [0.000] [0.268] [0.507] [0.049] [0.003] [0.088] [0.107]
Kyrgyz -0.109 -0.131 -0.144 -0.086 0.005 -0.012 0.035 0.02[0.002] [0.000] [0.252] [0.319] [0.832] [0.538] [0.537] [0.488]
Dushanbe 0.851 0.867 0.843 0.772 -0.012 0.028 -0.03 -0.003[0.000] [0.000] [0.000] [0.000] [0.815] [0.671] [0.621] [0.970]
Gharn 1.232 1.25 1.218 1.257 0.204 0.324 0.204 0.499[0.000] [0.000] [0.000] [0.000] [0.050] [0.000] [0.135] [0.000]
Khatlon 0.033 0.852 0.062 0.478 0.077 -0.041 0.09 -0.256[0.608] [0.000] [0.614] [0.016] [0.139] [0.675] [0.204] [0.016]
Varzob 0.69 0.67 0.651 0.513 -0.111 -0.058 -0.124 -0.004[0.000] [0.000] [0.000] [0.005] [0.012] [0.319] [0.160] [0.964]0.001 -0.006 0.251 0.251 -0.033 -0.032 -0.05 -0.027
[0.983] [0.933] [0.095] [0.122] [0.376] [0.368] [0.125] [0.391]0.134 0.164 0.157 0.146 0.089 0.098 0.01 -0.027
[0.350] [0.302] [0.135] [0.166] [0.460] [0.475] [0.895] [0.727]Urban -0.04 0.033 -0.177 -0.181 0.041 0.058 0.055 -0.06
[0.321] [0.573] [0.005] [0.001] [0.328] [0.256] [0.274] [0.036]Comp edu 0.16 0.24 0.298 0.36 0.066 0.124 0.21 0.236
[0.139] [0.050] [0.033] [0.046] [0.459] [0.203] [0.047] [0.020]Second edu 0.244 0.291 0.419 0.465 0.074 0.094 0.299 0.323
[0.026] [0.017] [0.029] [0.033] [0.305] [0.262] [0.061] [0.051]Higher edu 0.094 0.179 0.249 0.306 0.021 0.081 0.1 0.125
[0.475] [0.202] [0.090] [0.092] [0.866] [0.538] [0.333] [0.254]Mid income -0.032 -0.043 -0.029 -0.041 -0.028 -0.037 -0.046 -0.105
[0.526] [0.373] [0.640] [0.484] [0.540] [0.407] [0.554] [0.081]Rich -0.042 -0.036 -0.102 -0.061 -0.053 -0.04 -0.051 -0.05
[0.344] [0.480] [0.148] [0.279] [0.271] [0.423] [0.521] [0.353]FE region psu region psu region psu region psu
Observations 377 377 141 141 377 377 141 141R-squared 0.17 0.24 0.25 0.39 0.15 0.25 0.21 0.39Notes: Robust standard errors clustered at the village level. All regressions with a constant. P-values in brackets. For a description of the variables, see Table 1. Columns 4 and 8: sample restricted to respondents 25 or older in 1992 (43 and older today). Excluded ethnicity is Tajik, excluded 1992 region is Gorno-Badakhshan, excluded education is:compulsory education not completed, excluded income is poor (lower third of the income distribution).
Any member CP
Displaced Comm. Reg.
Injured or Killed Injured & Killed Whole Sample
Mean dep. var.: 0.21 Older than 25 at
conflict onset Mean dep. var.: 0.20
Whole Sample Mean of dep. var.:
0.13
Older than 25 at conflict onset
Mean dep. var.: 0.12

39
Table 3: Trust Regression ResultsOLS regression Dependent variable: Amount sent by first mover in the trust game
(1) (2) (3) (4) (5) (6) (7) (8) (9) (10) (11)
Injured or Killed 0.677 0.677 0.936 1.871 2.045 1.935 1.524 -1.276 -1.314 3.482 4.124[0.344] [0.388] [0.378] [0.046] [0.036] [0.043] [0.101] [0.323] [0.359] [0.084] [0.086]
Same Village 1.281 1.364 2.022 1.866 2.171 2.880 3.193[0.272] [0.392] [0.008] [0.157] [0.217] [0.171] [0.233]
Same Vill. * Inj. or Kill. -2.494 -2.782 -3.289 -4.790 -4.920[0.139] [0.085] [0.057] [0.046] [0.053]
Age 0.012 0.016 0.013 0.016 0.016 0.020 0.021 0.016 0.057 0.101[0.675] [0.606] [0.674] [0.597] [0.670] [0.556] [0.742] [0.800] [0.713] [0.584]
Gender -0.395 -0.677 -0.296 -0.609 -2.619 -2.851 1.619 1.244 0.093 -0.129[0.445] [0.258] [0.553] [0.313] [0.003] [0.003] [0.123] [0.317] [0.942] [0.929]
Former comunist in HH 1.111 1.618 1.206 1.731 0.753 2.097 1.280 1.207 0.629 0.192[0.189] [0.135] [0.126] [0.088] [0.373] [0.112] [0.443] [0.520] [0.791] [0.953]
Comp. edu -1.775 -1.227 -1.840 -1.211 -0.801 0.851 -1.752 -1.773 -4.337 -2.689[0.236] [0.330] [0.215] [0.346] [0.643] [0.663] [0.312] [0.102] [0.009] [0.076]
Second edu -2.595 -1.730 -2.743 -1.806 -1.526 -0.191 -2.536 -1.967 -3.376 -1.543[0.182] [0.318] [0.148] [0.287] [0.587] [0.949] [0.105] [0.060] [0.168] [0.443]
Higher edu -0.118 0.852 -0.134 0.947 2.067 3.281 -0.867 -0.008 -2.704 -1.513[0.935] [0.491] [0.925] [0.459] [0.284] [0.143] [0.633] [0.995] [0.072] [0.225]
Pamiri -0.991 -0.065 -0.922 0.042 -0.382 0.304 -0.522 0.424 2.852 4.165[0.387] [0.965] [0.388] [0.977] [0.816] [0.882] [0.764] [0.648] [0.346] [0.453]
Uzbek 0.324 -0.939 0.484 -0.883 3.895 2.144 -6.455 -3.877 2.232 -0.673[0.850] [0.688] [0.791] [0.722] [0.000] [0.000] [0.050] [0.125] [0.579] [0.947]
Kyrgyz -0.136 -2.042 -0.246 -2.184 -2.025 -4.542 0.858 -0.358 3.641 3.069[0.854] [0.000] [0.736] [0.000] [0.003] [0.000] [0.354] [0.450] [0.000] [0.000]
Region lived in 1992 yes yes yes yes yes yes yes yes yes yesFE region psu region psu region psu region psu region psuConstant 12.244 -3.060 8.801 12.001 -2.572 11.423 -0.819 13.395 6.671 12.564 8.305
[0.000] [0.186] [0.000] [0.000] [0.248] [0.000] [0.766] [0.000] [0.030] [0.002] [0.170]
Observations 416 416 426 416 416 224 224 192 192 131 131R-squared 0.062 0.116 0.017 0.068 0.124 0.119 0.187 0.079 0.225 0.152 0.269Mean dep. var.Notes: P-values in brakets (robust standard errors clustered by sampling village).
Distant Village Same Village 12 or Younger in WarSub-sample Sub-sample Sub-sample
9.742 9.035 10.556 10.076

40
Table 4: Trust Regression ResultsOLS regression Dependent variable: Amount sent by first mover in the trust game
(1) (2) (3) (4) (5) (6) (7) (8) (9) (10) (11)
Injured & Killed -0.334 -0.008 0.616 1.426 1.878 1.696 1.517 -3.384 -3.473 3.695 4.589[0.726] [0.993] [0.632] [0.205] [0.070] [0.153] [0.167] [0.031] [0.048] [0.096] [0.080]
Same Village 1.244 1.333 1.994 1.793 2.146 2.520 2.712[0.297] [0.409] [0.006] [0.165] [0.229] [0.229] [0.322]
Same Vill. * Inj. & Kill. -4.053 -4.240 -4.797 -5.242 -5.285[0.046] [0.037] [0.037] [0.048] [0.094]
Age 0.014 0.017 0.010 0.013 0.013 0.017 0.018 0.011 0.067 0.103[0.624] [0.578] [0.726] [0.674] [0.729] [0.617] [0.764] [0.856] [0.664] [0.570]
Gender -0.383 -0.687 -0.274 -0.626 -2.730 -2.958 1.840 1.349 0.011 -0.372[0.454] [0.238] [0.586] [0.297] [0.002] [0.002] [0.088] [0.296] [0.993] [0.806]
Former comunist in HH 1.093 1.600 1.128 1.633 0.672 2.078 1.155 1.120 0.191 -0.218[0.189] [0.136] [0.162] [0.121] [0.458] [0.136] [0.481] [0.551] [0.934] [0.944]
Comp. edu -1.648 -1.065 -1.788 -1.099 -0.500 1.060 -1.852 -1.668 -4.276 -2.577[0.286] [0.423] [0.241] [0.424] [0.777] [0.587] [0.283] [0.161] [0.014] [0.095]
Second edu -2.381 -1.516 -2.570 -1.597 -1.048 0.169 -2.570 -1.878 -2.343 -0.255[0.228] [0.390] [0.180] [0.359] [0.710] [0.955] [0.126] [0.136] [0.370] [0.901]
Higher edu -0.039 0.987 -0.217 0.910 2.230 3.376 -1.168 -0.108 -2.737 -1.644[0.979] [0.445] [0.882] [0.506] [0.255] [0.135] [0.525] [0.942] [0.073] [0.185]
Pamiri -1.058 -0.130 -1.000 -0.028 -0.599 0.114 -0.228 0.706 2.779 4.112[0.366] [0.931] [0.377] [0.985] [0.722] [0.956] [0.892] [0.418] [0.354] [0.455]
Uzbek 0.173 -1.020 0.335 -0.876 3.841 2.174 -6.364 -3.773 2.033 -0.453[0.920] [0.664] [0.854] [0.725] [0.000] [0.000] [0.055] [0.142] [0.604] [0.964]
Kyrgyz -0.197 -2.107 -0.342 -2.210 -2.319 -4.777 1.041 -0.180 3.557 2.991[0.791] [0.000] [0.633] [0.000] [0.002] [0.000] [0.284] [0.668] [0.000] [0.000]
Region lived in 1992 yes yes yes yes yes yes yes yes yes yesFE region psu region psu region psu region psu region psuConstant 12.127 -3.733 8.943 12.177 -4.299 11.531 -2.092 13.423 6.770 12.533 8.533
[0.000] [0.071] [0.000] [0.000] [0.047] [0.000] [0.361] [0.000] [0.021] [0.002] [0.158]
Observations 416 416 426 416 416 224 224 192 192 131 131R-squared 0.061 0.114 0.024 0.071 0.127 0.115 0.186 0.094 0.237 0.149 0.266Mean dep. var.Notes: P-values in brakets (robust standard errors clustered by sampling village).
Sub-sample Sub-sample Sub-sampleDistant Village Same Village 18 or Younger in War
10.556 10.0769.742 9.035

41
Table 5: Trustworthyness Regression ResultsOLS regression Dependent variable: Mean amount returned by second mover in the trust game
(1) (2) (3) (4) (5) (6) (7) (8) (9) (10) (11)
Injured or Killed 0.687 -0.286 -0.110 1.365 0.486 0.235 -0.383 0.521 -0.629 0.636 -0.016[0.645] [0.846] [0.934] [0.467] [0.795] [0.900] [0.846] [0.812] [0.771] [0.787] [0.995]
Same Village 0.028 -0.811 0.470 0.360 -0.355 -0.058 0.580[0.977] [0.529] [0.618] [0.710] [0.775] [0.973] [0.778]
Same Vill. * Inj. or Kill. -1.422 -1.579 -1.858 -0.042 -0.614[0.497] [0.515] [0.489] [0.989] [0.858]
Age -0.035 -0.045 -0.035 -0.045 -0.055 -0.062 -0.024 -0.044 -0.111 -0.084[0.341] [0.232] [0.340] [0.234] [0.281] [0.266] [0.645] [0.390] [0.510] [0.678]
Gender 0.696 0.849 0.752 0.887 0.707 1.002 1.531 0.682 0.991 0.403[0.444] [0.388] [0.437] [0.381] [0.593] [0.498] [0.275] [0.645] [0.582] [0.857]
Former comunist in HH 3.790 3.335 3.843 3.399 3.054 3.016 4.596 4.696 -0.786 -2.256[0.023] [0.035] [0.019] [0.030] [0.019] [0.080] [0.151] [0.141] [0.822] [0.614]
Comp. edu -1.967 -0.276 -2.004 -0.266 0.673 3.171 -2.616 -1.571 0.979 1.934[0.420] [0.901] [0.409] [0.903] [0.886] [0.460] [0.361] [0.556] [0.536] [0.175]
Second edu -2.500 -0.850 -2.584 -0.893 -0.066 1.875 -3.016 -1.803 2.439 5.486[0.339] [0.724] [0.319] [0.706] [0.990] [0.710] [0.384] [0.551] [0.323] [0.132]
Higher edu 0.255 1.922 0.246 1.975 4.124 6.417 -2.318 -0.952 2.493 3.278[0.924] [0.431] [0.926] [0.410] [0.459] [0.223] [0.280] [0.588] [0.215] [0.192]
Pamiri 1.039 0.359 1.078 0.419 -0.639 -1.481 6.065 4.647 -0.132 2.084[0.721] [0.901] [0.706] [0.883] [0.756] [0.556] [0.001] [0.007] [0.961] [0.581]
Uzbek -2.819 0.354 -2.728 0.385 -2.741 -0.147 0.231 2.058 -2.524 1.835[0.018] [0.719] [0.016] [0.679] [0.130] [0.822] [0.884] [0.090] [0.073] [0.455]
Kyrgyz -2.150 -2.024 -2.212 -2.104 -2.320 -3.495 -2.517 -1.410 0.956 1.655[0.040] [0.005] [0.029] [0.003] [0.025] [0.002] [0.041] [0.222] [0.297] [0.007]
Region lived in 1992 yes yes yes yes yes yes yes yes yes yesFE region psu region psu region psu region psu region psuConstant 19.022 -1.865 13.414 18.883 -1.590 16.528 -4.681 20.250 14.711 17.192 13.017
[0.000] [0.622] [0.000] [0.000] [0.668] [0.001] [0.262] [0.000] [0.004] [0.001] [0.019]
Observations 416 416 426 416 416 224 224 192 192 131 131R-squared 0.111 0.178 0.002 0.113 0.180 0.118 0.204 0.155 0.253 0.150 0.276Mean dep. var.Notes: P-values in brakets (robust standard errors clustered by sampling village).
Sub-sample Sub-sample Sub-sampleDistant Village Same Village 12 or Younger in War
13.496 13.386 13.621 13.358

42
Table 6: Trustworthyness Regression ResultsOLS regression Dependent variable: Mean amount returned by second mover in the trust game
(2) (3) (1) (4) (5) (6) (7) (8) (9) (10) (11)
Injured & Killed 1.353 0.226 0.427 2.675 1.824 1.668 1.177 0.144 -1.754 -0.772 -1.383[0.283] [0.818] [0.790] [0.174] [0.316] [0.355] [0.501] [0.939] [0.124] [0.773] [0.649]
Same Village 0.033 -0.794 0.567 0.445 -0.105 -0.287 0.401[0.974] [0.541] [0.528] [0.620] [0.923] [0.868] [0.842]
Same Vill. * Inj. & Kill. -2.839 -3.186 -4.065 1.056 0.303[0.261] [0.244] [0.170] [0.719] [0.933]
Age -0.036 -0.045 -0.039 -0.049 -0.059 -0.064 -0.022 -0.047 -0.111 -0.085[0.323] [0.221] [0.279] [0.183] [0.243] [0.253] [0.657] [0.362] [0.513] [0.675]
Gender 0.631 0.843 0.713 0.894 0.650 0.979 1.547 0.735 1.066 0.517[0.480] [0.387] [0.458] [0.383] [0.618] [0.500] [0.276] [0.625] [0.552] [0.818]
Former comunist in HH 3.812 3.353 3.838 3.380 3.084 3.096 4.614 4.653 -1.003 -2.352[0.022] [0.034] [0.020] [0.034] [0.021] [0.080] [0.150] [0.147] [0.774] [0.602]
Comp. edu -1.963 -0.375 -2.069 -0.404 0.373 2.691 -2.585 -1.511 1.060 1.951[0.427] [0.868] [0.396] [0.854] [0.939] [0.543] [0.359] [0.567] [0.507] [0.172]
Second edu -2.469 -0.969 -2.612 -1.037 -0.370 1.392 -2.943 -1.750 2.662 5.431[0.352] [0.699] [0.313] [0.667] [0.944] [0.787] [0.387] [0.563] [0.302] [0.130]
Higher edu 0.290 1.844 0.157 1.779 3.867 6.039 -2.285 -0.995 2.525 3.294[0.914] [0.458] [0.952] [0.464] [0.498] [0.262] [0.269] [0.588] [0.203] [0.188]
Pamiri 0.968 0.386 1.011 0.472 -0.650 -1.410 6.018 4.786 -0.253 1.988[0.737] [0.893] [0.721] [0.871] [0.745] [0.564] [0.001] [0.007] [0.925] [0.589]
Uzbek -2.785 0.413 -2.663 0.535 -2.618 0.050 0.180 2.109 -2.704 1.802[0.017] [0.663] [0.016] [0.541] [0.140] [0.938] [0.910] [0.101] [0.077] [0.456]
Kyrgyz -2.240 -2.000 -2.349 -2.087 -2.349 -3.443 -2.560 -1.324 0.989 1.690[0.026] [0.003] [0.013] [0.001] [0.014] [0.000] [0.037] [0.242] [0.271] [0.004]
Region lived in 1992 yes yes yes yes yes yes yes yes yes yesFE region psu region psu region psu region psu region psuConstant 19.114 -1.572 13.323 19.151 -2.052 17.004 -4.245 20.193 14.745 17.261 13.024
[0.000] [0.666] [0.000] [0.000] [0.566] [0.001] [0.293] [0.000] [0.003] [0.001] [0.017]
Observations 416 416 426 416 416 224 224 192 192 131 131R-squared 0.113 0.178 0.004 0.117 0.184 0.122 0.205 0.155 0.255 0.150 0.277Mean dep. var.Notes: P-values in brakets (robust standard errors clustered by sampling village).
Sub-sample Sub-sample Sub-sampleDistant Village Same Village 18 or Younger in War
13.621 13.35813.496 13.386
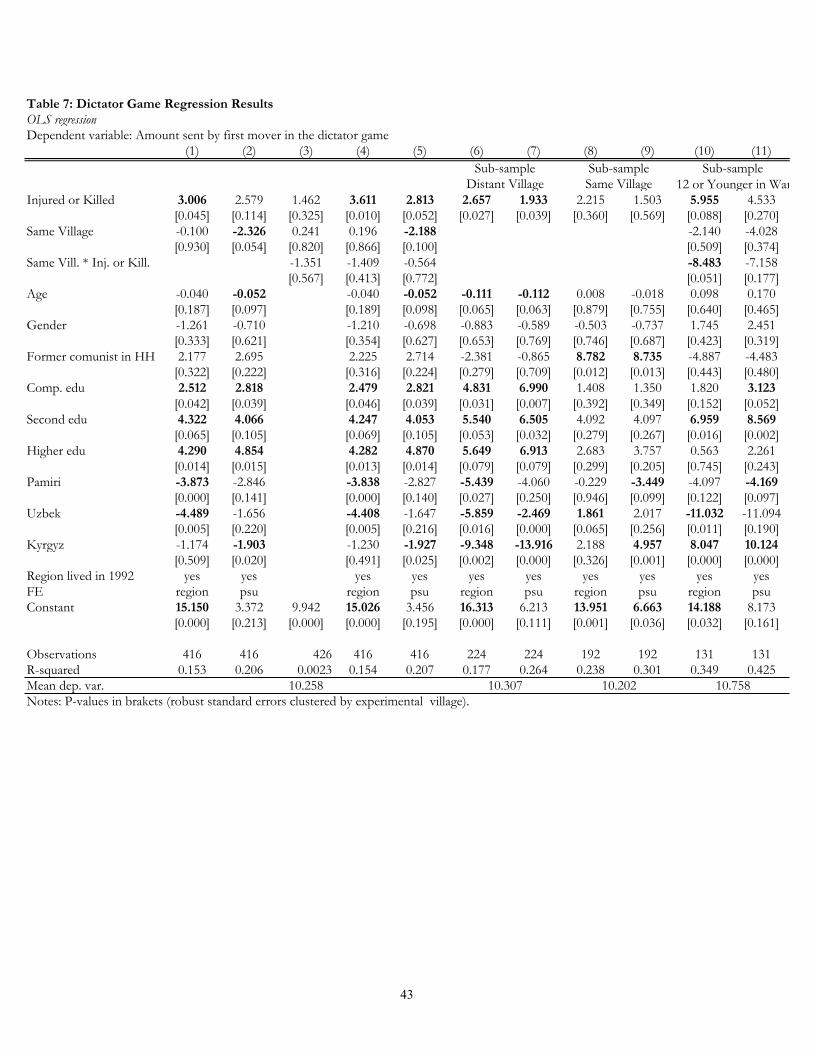
43
Table 7: Dictator Game Regression ResultsOLS regression Dependent variable: Amount sent by first mover in the dictator game
(1) (2) (3) (4) (5) (6) (7) (8) (9) (10) (11)
Injured or Killed 3.006 2.579 1.462 3.611 2.813 2.657 1.933 2.215 1.503 5.955 4.533[0.045] [0.114] [0.325] [0.010] [0.052] [0.027] [0.039] [0.360] [0.569] [0.088] [0.270]
Same Village -0.100 -2.326 0.241 0.196 -2.188 -2.140 -4.028[0.930] [0.054] [0.820] [0.866] [0.100] [0.509] [0.374]
Same Vill. * Inj. or Kill. -1.351 -1.409 -0.564 -8.483 -7.158[0.567] [0.413] [0.772] [0.051] [0.177]
Age -0.040 -0.052 -0.040 -0.052 -0.111 -0.112 0.008 -0.018 0.098 0.170[0.187] [0.097] [0.189] [0.098] [0.065] [0.063] [0.879] [0.755] [0.640] [0.465]
Gender -1.261 -0.710 -1.210 -0.698 -0.883 -0.589 -0.503 -0.737 1.745 2.451[0.333] [0.621] [0.354] [0.627] [0.653] [0.769] [0.746] [0.687] [0.423] [0.319]
Former comunist in HH 2.177 2.695 2.225 2.714 -2.381 -0.865 8.782 8.735 -4.887 -4.483[0.322] [0.222] [0.316] [0.224] [0.279] [0.709] [0.012] [0.013] [0.443] [0.480]
Comp. edu 2.512 2.818 2.479 2.821 4.831 6.990 1.408 1.350 1.820 3.123[0.042] [0.039] [0.046] [0.039] [0.031] [0.007] [0.392] [0.349] [0.152] [0.052]
Second edu 4.322 4.066 4.247 4.053 5.540 6.505 4.092 4.097 6.959 8.569[0.065] [0.105] [0.069] [0.105] [0.053] [0.032] [0.279] [0.267] [0.016] [0.002]
Higher edu 4.290 4.854 4.282 4.870 5.649 6.913 2.683 3.757 0.563 2.261[0.014] [0.015] [0.013] [0.014] [0.079] [0.079] [0.299] [0.205] [0.745] [0.243]
Pamiri -3.873 -2.846 -3.838 -2.827 -5.439 -4.060 -0.229 -3.449 -4.097 -4.169[0.000] [0.141] [0.000] [0.140] [0.027] [0.250] [0.946] [0.099] [0.122] [0.097]
Uzbek -4.489 -1.656 -4.408 -1.647 -5.859 -2.469 1.861 2.017 -11.032 -11.094[0.005] [0.220] [0.005] [0.216] [0.016] [0.000] [0.065] [0.256] [0.011] [0.190]
Kyrgyz -1.174 -1.903 -1.230 -1.927 -9.348 -13.916 2.188 4.957 8.047 10.124[0.509] [0.020] [0.491] [0.025] [0.002] [0.000] [0.326] [0.001] [0.000] [0.000]
Region lived in 1992 yes yes yes yes yes yes yes yes yes yesFE region psu region psu region psu region psu region psuConstant 15.150 3.372 9.942 15.026 3.456 16.313 6.213 13.951 6.663 14.188 8.173
[0.000] [0.213] [0.000] [0.000] [0.195] [0.000] [0.111] [0.001] [0.036] [0.032] [0.161]
Observations 416 416 426 416 416 224 224 192 192 131 131R-squared 0.153 0.206 0.0023 0.154 0.207 0.177 0.264 0.238 0.301 0.349 0.425Mean dep. var.Notes: P-values in brakets (robust standard errors clustered by experimental village).
Sub-sample Sub-sample Sub-sampleDistant Village Same Village 12 or Younger in War
10.258 10.307 10.202 10.758

44
Table 8: Dictator Game Regression ResultsOLS regression Dependent variable: Amount sent by first mover in the dictator game
(1) (2) (2) (3) (4) (5) (6) (7) (8) (9) (10)
Injured & Killed 3.068 2.521 1.367 4.275 3.250 3.630 2.823 1.666 0.598 7.096 5.441[0.018] [0.069] [0.449] [0.001] [0.003] [0.013] [0.070] [0.547] [0.833] [0.018] [0.130]
Same Village -0.149 -2.403 0.295 0.227 -2.089 -2.680 -4.618[0.899] [0.053] [0.771] [0.853] [0.115] [0.354] [0.254]
Same Vill. * Inj. & Kill. -3.129 -2.908 -1.855 -9.750 -7.377[0.271] [0.221] [0.424] [0.013] [0.135]
Age -0.038 -0.050 -0.041 -0.052 -0.117 -0.117 0.015 -0.014 0.115 0.169[0.225] [0.116] [0.201] [0.114] [0.053] [0.054] [0.788] [0.805] [0.568] [0.464]
Gender -1.413 -0.860 -1.339 -0.837 -1.074 -0.752 -0.527 -0.773 1.540 2.135[0.293] [0.558] [0.323] [0.571] [0.596] [0.716] [0.749] [0.676] [0.475] [0.378]
Former comunist in HH 2.208 2.738 2.231 2.751 -2.456 -0.845 8.884 8.794 -5.566 -4.888[0.301] [0.202] [0.298] [0.203] [0.241] [0.710] [0.011] [0.012] [0.358] [0.425]
Comp. edu 2.739 3.079 2.643 3.066 4.945 7.010 1.549 1.565 1.913 3.264[0.031] [0.020] [0.040] [0.022] [0.030] [0.008] [0.356] [0.260] [0.160] [0.047]
Second edu 4.773 4.545 4.643 4.514 5.874 6.736 4.351 4.389 8.736 10.051[0.043] [0.067] [0.052] [0.071] [0.042] [0.030] [0.258] [0.242] [0.000] [0.000]
Higher edu 4.519 5.129 4.397 5.099 5.627 6.830 2.901 4.025 0.505 2.130[0.009] [0.008] [0.009] [0.008] [0.076] [0.076] [0.241] [0.156] [0.772] [0.287]
Pamiri -4.180 -3.098 -4.140 -3.059 -5.724 -4.288 -0.491 -3.584 -4.162 -4.217[0.000] [0.115] [0.000] [0.116] [0.023] [0.234] [0.882] [0.080] [0.109] [0.076]
Uzbek -4.655 -1.688 -4.544 -1.632 -5.818 -2.314 1.657 1.952 -11.285 -10.831[0.004] [0.194] [0.004] [0.185] [0.019] [0.000] [0.108] [0.282] [0.010] [0.198]
Kyrgyz -1.522 -2.181 -1.621 -2.221 -9.745 -14.220 1.978 4.790 7.877 10.029[0.394] [0.010] [0.349] [0.008] [0.001] [0.000] [0.373] [0.001] [0.000] [0.000]
Region lived in 1992 yes yes yes yes yes yes yes yes yes yesFE region psu region psu region psu region psu region psuConstant 15.198 0.909 10.103 15.232 0.690 16.873 4.665 13.746 6.042 14.076 8.506
[0.000] [0.669] [0.000] [0.000] [0.744] [0.000] [0.177] [0.001] [0.028] [0.031] [0.141]
Observations 416 416 426 416 416 224 224 192 192 131 131R-squared 0.150 0.204 0.0029 0.152 0.205 0.181 0.267 0.234 0.299 0.35 0.424Mean dep. var.Notes: P-values in brakets (robust standard errors clustered by experimental village).
Sub-sample Sub-sample Sub-sampleDistant Village Same Village 18 or Younger in War
10.202 10.75810.258 10.307

45
Table 9: Egalitarian Regression ResultsOLS regression Dependent variable: 1 if first mover in the dictator game divides equally the endowment
(1) (2) (3) (4) (5) (6) (7) (8) (9) (10) (11)
Injured or Killed 0.083 0.082 0.105 0.183 0.170 0.148 0.132 -0.038 -0.016 0.207 0.114[0.176] [0.201] [0.101] [0.046] [0.056] [0.126] [0.167] [0.692] [0.882] [0.340] [0.648]
Same Village 0.030 -0.036 0.063 0.079 0.015 -0.072 -0.076[0.523] [0.512] [0.169] [0.063] [0.750] [0.479] [0.524]
Same Vill. * Inj. or Kill. -0.214 -0.233 -0.210 -0.352 -0.421[0.036] [0.074] [0.122] [0.147] [0.121]
Age -0.001 -0.002 -0.001 -0.002 -0.002 -0.002 0.001 -0.001 -0.001 0.001[0.585] [0.235] [0.599] [0.249] [0.285] [0.271] [0.733] [0.764] [0.943] [0.915]
Gender -0.036 -0.016 -0.028 -0.012 -0.063 -0.061 0.066 0.063 -0.019 0.007[0.332] [0.721] [0.435] [0.792] [0.323] [0.354] [0.195] [0.284] [0.849] [0.945]
Former comunist in HH 0.003 0.004 0.011 0.012 -0.041 -0.039 0.045 0.053 -0.271 -0.264[0.960] [0.950] [0.868] [0.876] [0.590] [0.702] [0.709] [0.675] [0.072] [0.098]
Comp. edu 0.105 0.111 0.100 0.112 0.150 0.233 0.090 0.056 0.024 0.077[0.101] [0.091] [0.113] [0.086] [0.005] [0.002] [0.289] [0.500] [0.809] [0.548]
Second edu 0.075 0.084 0.062 0.079 0.066 0.112 0.138 0.149 0.025 0.094[0.312] [0.267] [0.371] [0.274] [0.288] [0.104] [0.444] [0.432] [0.941] [0.800]
Higher edu 0.201 0.213 0.199 0.219 0.252 0.312 0.143 0.148 0.052 0.127[0.012] [0.015] [0.010] [0.011] [0.065] [0.045] [0.072] [0.160] [0.709] [0.443]
Pamiri -0.144 -0.196 -0.138 -0.189 -0.196 -0.229 0.080 -0.070 -0.188 -0.100[0.054] [0.006] [0.036] [0.005] [0.002] [0.010] [0.492] [0.379] [0.232] [0.724]
Uzbek -0.085 -0.002 -0.071 0.002 -0.109 -0.072 0.135 0.209 -0.392 -0.667[0.184] [0.986] [0.229] [0.989] [0.045] [0.000] [0.510] [0.357] [0.008] [0.034]
Kyrgyz -0.192 -0.099 -0.201 -0.108 -0.332 -0.300 -0.145 0.016 -0.227 -0.105[0.011] [0.004] [0.007] [0.004] [0.000] [0.005] [0.254] [0.538] [0.010] [0.013]
Region lived in 1992 yes yes yes yes yes yes yes yes yes yesFE region psu region psu region psu region psu region psuConstant 0.345 -0.410 0.193 0.325 -0.379 0.325 -0.276 0.382 0.059 0.587 0.272
[0.000] [0.000] [0.000] [0.000] [0.001] [0.001] [0.053] [0.012] [0.592] [0.017] [0.390]
Observations 416 416 426 416 416 224 224 192 192 131 131R-squared 0.081 0.126 0.011 0.093 0.135 0.105 0.153 0.133 0.196 0.182 0.266Mean dep. var.Notes: P-values in brakets (robust standard errors clustered by experimental village).
Sub-sample Sub-sample Sub-sample
0.228 0.219 0.237 0.273
Distant Village Same Village 12 or Younger in War
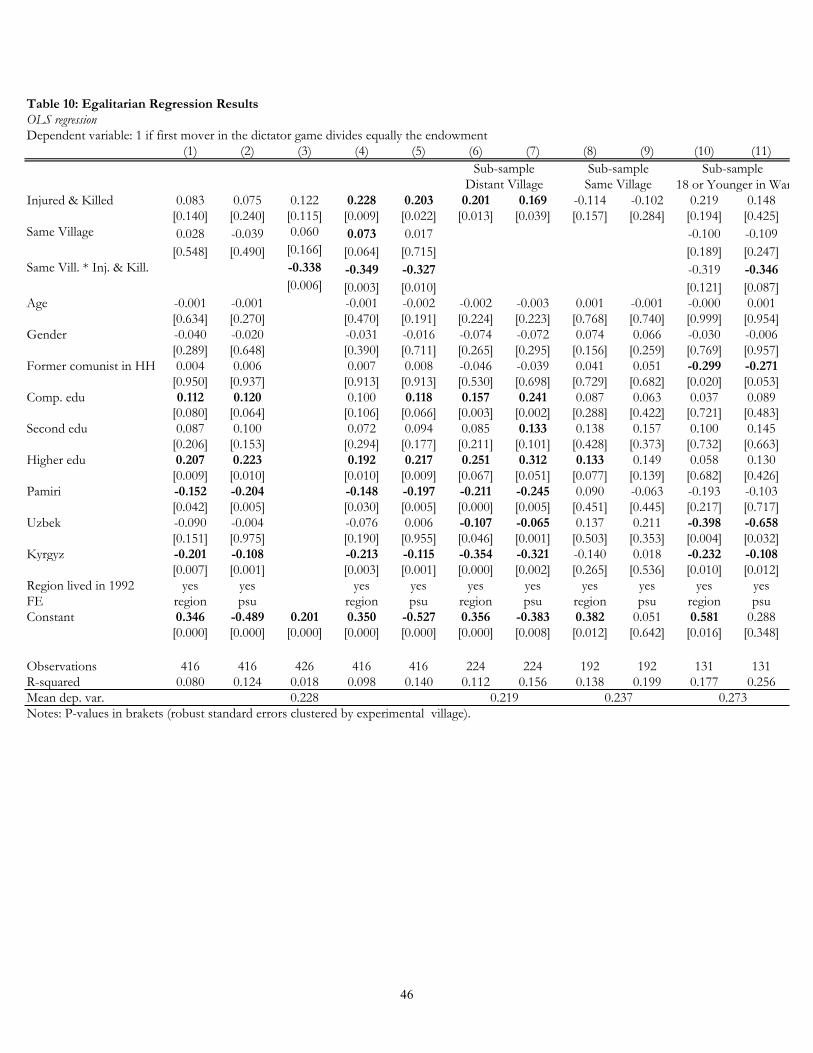
46
Table 10: Egalitarian Regression ResultsOLS regression Dependent variable: 1 if first mover in the dictator game divides equally the endowment
(1) (2) (3) (4) (5) (6) (7) (8) (9) (10) (11)
Injured & Killed 0.083 0.075 0.122 0.228 0.203 0.201 0.169 -0.114 -0.102 0.219 0.148[0.140] [0.240] [0.115] [0.009] [0.022] [0.013] [0.039] [0.157] [0.284] [0.194] [0.425]
Same Village 0.028 -0.039 0.060 0.073 0.017 -0.100 -0.109[0.548] [0.490] [0.166] [0.064] [0.715] [0.189] [0.247]
Same Vill. * Inj. & Kill. -0.338 -0.349 -0.327 -0.319 -0.346[0.006] [0.003] [0.010] [0.121] [0.087]
Age -0.001 -0.001 -0.001 -0.002 -0.002 -0.003 0.001 -0.001 -0.000 0.001[0.634] [0.270] [0.470] [0.191] [0.224] [0.223] [0.768] [0.740] [0.999] [0.954]
Gender -0.040 -0.020 -0.031 -0.016 -0.074 -0.072 0.074 0.066 -0.030 -0.006[0.289] [0.648] [0.390] [0.711] [0.265] [0.295] [0.156] [0.259] [0.769] [0.957]
Former comunist in HH 0.004 0.006 0.007 0.008 -0.046 -0.039 0.041 0.051 -0.299 -0.271[0.950] [0.937] [0.913] [0.913] [0.530] [0.698] [0.729] [0.682] [0.020] [0.053]
Comp. edu 0.112 0.120 0.100 0.118 0.157 0.241 0.087 0.063 0.037 0.089[0.080] [0.064] [0.106] [0.066] [0.003] [0.002] [0.288] [0.422] [0.721] [0.483]
Second edu 0.087 0.100 0.072 0.094 0.085 0.133 0.138 0.157 0.100 0.145[0.206] [0.153] [0.294] [0.177] [0.211] [0.101] [0.428] [0.373] [0.732] [0.663]
Higher edu 0.207 0.223 0.192 0.217 0.251 0.312 0.133 0.149 0.058 0.130[0.009] [0.010] [0.010] [0.009] [0.067] [0.051] [0.077] [0.139] [0.682] [0.426]
Pamiri -0.152 -0.204 -0.148 -0.197 -0.211 -0.245 0.090 -0.063 -0.193 -0.103[0.042] [0.005] [0.030] [0.005] [0.000] [0.005] [0.451] [0.445] [0.217] [0.717]
Uzbek -0.090 -0.004 -0.076 0.006 -0.107 -0.065 0.137 0.211 -0.398 -0.658[0.151] [0.975] [0.190] [0.955] [0.046] [0.001] [0.503] [0.353] [0.004] [0.032]
Kyrgyz -0.201 -0.108 -0.213 -0.115 -0.354 -0.321 -0.140 0.018 -0.232 -0.108[0.007] [0.001] [0.003] [0.001] [0.000] [0.002] [0.265] [0.536] [0.010] [0.012]
Region lived in 1992 yes yes yes yes yes yes yes yes yes yesFE region psu region psu region psu region psu region psuConstant 0.346 -0.489 0.201 0.350 -0.527 0.356 -0.383 0.382 0.051 0.581 0.288
[0.000] [0.000] [0.000] [0.000] [0.000] [0.000] [0.008] [0.012] [0.642] [0.016] [0.348]
Observations 416 416 426 416 416 224 224 192 192 131 131R-squared 0.080 0.124 0.018 0.098 0.140 0.112 0.156 0.138 0.199 0.177 0.256Mean dep. var.Notes: P-values in brakets (robust standard errors clustered by experimental village).
0.228 0.273
Sub-sample Sub-sampleDistant Village Same Village 18 or Younger in War
Sub-sample
0.219 0.237

47
Tab
le 9
: Ass
essi
ng th
e B
ias
due
to S
elec
tion
on
Uno
bser
vabl
es
regi
on F
Eps
u FE
regi
on F
Eps
u FE
regi
on F
Eps
u FE
regi
on F
Eps
u FE
Con
trol
s, fu
ll se
tno
ne-1
.55
-1.8
9-9
.27
-8.2
30.
920.
02-3
2.62
-60.
00E
xten
ded
set o
f co
ntro
lsR
estr
icte
d se
t (ag
e,
gend
er, r
egio
n liv
ed
in 9
2, e
thni
city
)
-2.3
4-2
.83
-8.4
2-1
3.16
1.43
0.04
-35.
3353
.33
Res
tric
ted
set (
age,
ge
nder
, reg
ion
lived
in
92,
eth
nici
ty)
none
-2.6
0-3
.67
81.6
7-2
0.27
4.31
1.53
-412
.00
-28.
76
regi
on F
Eps
u FE
regi
on F
Eps
u FE
regi
on F
Eps
u FE
regi
on F
Eps
u FE
Con
trol
s, fu
ll se
tno
ne-3
01.0
0-2
58.0
03.
71-5
.60
-19.
19-7
.64
4.69
-61.
67E
xten
ded
set o
f co
ntro
lsR
estr
icte
d se
t (ag
e,
gend
er, r
egio
n liv
ed
in 9
2, e
thni
city
)
13.6
810
.32
-20.
14-2
.07
51.1
712
6.00
11.1
912
.33
Res
tric
ted
set (
age,
ge
nder
, reg
ion
lived
in
92,
eth
nici
ty)
none
-14.
04-1
0.88
2.98
1.71
-14.
23-7
.26
8.81
-11.
11
regi
on F
Eps
u FE
regi
on F
Eps
u FE
regi
on F
Eps
u FE
regi
on F
Eps
u FE
Con
trol
s, fu
ll se
tno
ne4.
004.
0023
.00
-21.
008.
00na
35.0
0-3
3.00
Ext
ende
d se
t of
cont
rols
Res
tric
ted
set (
age,
ge
nder
, reg
ion
lived
in
92,
eth
nici
ty)
na8.
00-2
3.00
-10.
50na
nana
na
Res
tric
ted
set (
age,
ge
nder
, reg
ion
lived
in
92,
eth
nici
ty)
none
4.00
9.00
11.0
019
.00
8.00
na35
.00
-33.
00
Ega
litar
ian
split
Inju
red
or K
illed
Inj.
or K
ill*S
ameV
illag
eIn
jure
d &
Kill
edIn
j. &
Kill
*Sam
eVill
age
Inj.
& K
ill*S
ameV
illag
e
Tru
st g
ame
Inju
red
or K
illed
Inj.
or K
ill*S
ameV
illag
eIn
jure
d &
Kill
edIn
j. &
Kill
*Sam
eVill
age
Dic
tato
r gam
eIn
jure
d or
Kill
edIn
j. or
Kill
*Sam
eVill
age
Inju
red
& K
illed

48
Table 10: Market participation and Economic and Political PreferencesOLS regression
(1) (2) (3) (4) (5) (6) (7) (8)Dependent Variable:
Injured or Killed 0.6 -0.246 -0.193 -0.17[0.001] [0.017] [0.009] [0.008]
Injured and Killed 0.437 -0.309 -0.092 -0.175
[0.040] [0.002] [0.136] [0.012]Extended controls yes yes yes yes yes yes yes yes
Village FE yes yes yes yes yes yes psu psu
Observations 416 416 400 400 414 414 412 412R-squared 0.184 0.158 0.259 0.263 0.203 0.188 0.303 0.299Mean dep. var.
Table 11: Conflict resolution and kinshipOLS regression
(1) (2) (3) (4) (5) (6)Dependent Variable:
Injured or Killed 0.118 -0.378 -0.094[0.088] [0.001] [0.030]
Injured and Killed 0.058 -0.345 -0.066
[0.355] [0.001] [0.226]Extended controls yes yes yes yes yes yes
Village FE yes yes yes yes yes yes
Observations 416 416 397 397 344 344R-squared 0.084 0.072 0.122 0.094 0.555 0.551Mean dep. var. 0.13 0.46 0.81
turn to relatives if cheated in markets
Should report information to police
Support freedom to marry
Importance of knowing trader personally
Freedom in economy Favor market economy Favor democracy
1.80 0.55 0.55 0.60

49
Table 12: Participation in groupsOLS regression
(1) (2) (3) (4) (5) (6)Dependent Variable:
Injured or Killed 0.323 0.542 0.468[0.004] [0.000] [0.000]
Injured and Killed 0.219 0.408 0.401
[0.030] [0.000] [0.002]Extended controls yes yes yes yes yes yes
Village FE yes yes yes yes yes yes
Observations 405 405 402 402 337 337R-squared 0.227 0.191 0.294 0.268 0.302 0.237Mean dep. var.
Table 13: Participation in Groups, War Experience and TrustOLS regression Dependent variable: Amount sent by first mover in the trust game
(1) (2) (3) (4) (5) (6)
Same Village 1.134 1.081 0.841 1.11 1.45 1.247[0.296] [0.405] [0.514] [0.443] [0.370] [0.437]
Participation in groups and assoc.-0.164 -0.415 -0.559 -0.193 -0.431 -0.565[0.655] [0.254] [0.119] [0.593] [0.294] [0.165]
Injured and Killed -0.214 1.51 -7.478 0.111 1.99 -5.327[0.824] [0.184] [0.000] [0.906] [0.048] [0.000]
Same Vill. *Part. Groups 0.822 1.131 0.791 1.066[0.165] [0.042] [0.268] [0.108]
Same Vill. * Inj. and Kill. -4.243 9.111 -4.834 5.607[0.032] [0.073] [0.033] [0.260]
Part. Groups * Inj. and Kill. 9.816 7.973[0.000] [0.000]
Same Vill. * Part. Groups * Inj. and Kill. -15.287 -11.919[0.009] [0.045]
Extended Controls yes yes yes yes yes yesFE region psu region psu region psu
Observations 399 399 399 399 399 399R-squared 0.063 0.077 0.094 0.114 0.13 0.14
attended community meetings past month
Participation in groups and associations
Member Mosque or religious group
0.38 0.79 0.33
Notes to Tables 10 to 13: robust standard errors clustered at the village level. All regressions with a constant. Extended individual controls are: age, gender, education, any household member of former communist party, ethnicity, region where lived in 1992 In columns 5 and 6 of Table 11, a control also for whether respondent were free him/herself to marry freely is also included.
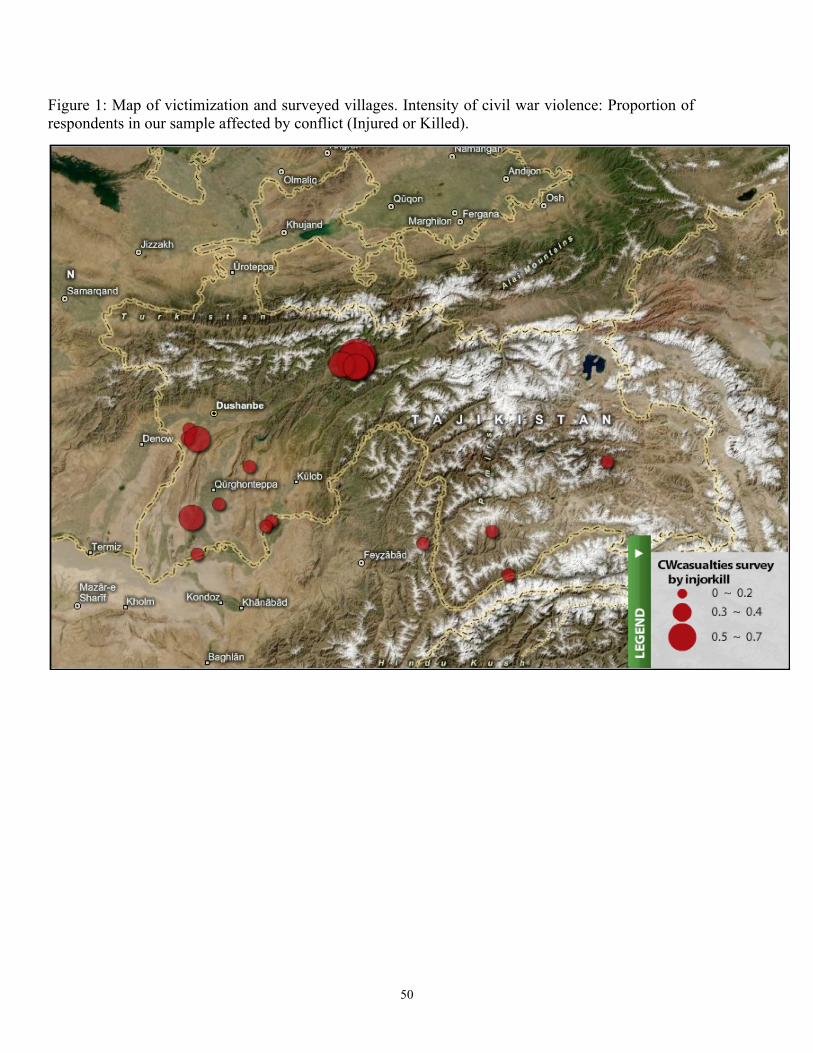
50
Figure 1: Map of victimization and surveyed villages. Intensity of civil war violence: Proportion of respondents in our sample affected by conflict (Injured or Killed).
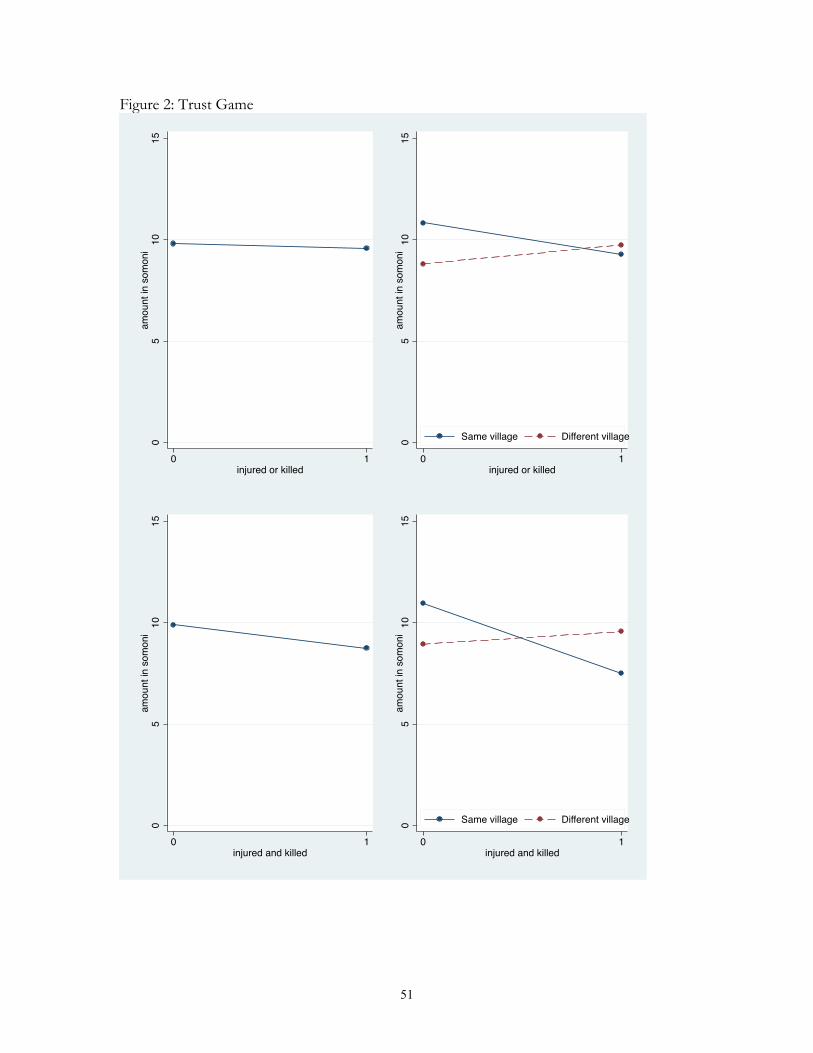
51
Figure 2: Trust Game
05
1015
amou
nt in
som
oni
0 1injured or killed
05
1015
amou
nt in
som
oni
0 1injured or killed
Same village Different village
05
1015
amou
nt in
som
oni
0 1injured and killed
05
1015
amou
nt in
som
oni
0 1injured and killed
Same village Different village

52
Figure 3: Dictator Game
05
1015
amou
nt in
som
oni
0 1injured or killed
05
1015
amou
nt in
som
oni
0 1injured or killed
Same village Different village
05
1015
amou
nt in
som
oni
0 1injured and killed
05
1015
amou
nt in
som
oni
0 1injured and killed
Same village Different village

53
Figure 4: Egalitarianism
0.1
.2.3
.4.5
prop
ortio
n eg
alita
rian
0 1injured or killed
0.1
.2.3
.4.5
prop
ortio
n eg
alita
rian
0 1injured or killed
Same village Different village
0.1
.2.3
.4.5
prop
ortio
n eg
alita
rian
0 1injured and killed
0.1
.2.3
.4.5
prop
ortio
n eg
alita
rian
0 1injured and killed
Same village Different village

54
Figure 5: Trustworthiness
05
1015
20am
ount
in s
omon
i
0 1injured or killed
05
1015
20am
ount
in s
omon
i
0 1injured or killed
Same village Different village
05
1015
20am
ount
in s
omon
i
0 1injured and killed
05
1015
20am
ount
in s
omon
i
0 1injured and killed
Same village Different village