loss of the arabidopsis thaliana p4-atpases ala6 and ala7 ... ala6_7 mcdowell accepted.pdf · 104...
TRANSCRIPT

Loss of the Arabidopsis thaliana P4-ATPases ALA6 and ALA7 Impairs Pollen
Fitness and Alters the Pollen Tube Plasma Membrane
Stephen C McDowell, Rosa L López-Marqués, Taylor Cohen, Elizabeth Brown, Alexa Rosenberg, Michael G Palmgren and
Jeffrey F Harper
Journal Name: Frontiers in Plant Science
ISSN: 1664-462X
Article type: Original Research Article
First received on: 07 Jan 2015
Revised on: 11 Mar 2015
Frontiers website link: www.frontiersin.org
Plant Evolution and Development
1
Loss of the Arabidopsis thaliana P4-ATPases ALA6 and ALA7 1
Impairs Pollen Fitness and Alters the Pollen Tube Plasma 2
Membrane 3
4
5
Stephen C. McDowell1, Rosa L. López-Marqués2, Taylor Cohen1, Elizabeth Brown1, Alexa 6
Rosenberg1, Michael G. Palmgren2, Jeffrey F. Harper1* 7
8
9
10
11
12 1 Department of Biochemistry and Molecular Biology, University of Nevada, Reno, 1664 N. 13
Virginia St - MS330, Reno, NV 89557, USA 14
15 2 Department of Plant and Environmental Sciences, Centre for Membrane Pumps in Cells and 16
Disease (PUMPKIN), University of Copenhagen, Danish National Research Foundation, 17
Frederiksberg, Denmark 18
19
20 *Correspondence: 21
Dr. Jeffrey F. Harper 22
Department of Biochemistry and Molecular Biology 23
University of Nevada, Reno 24
1664 N. Virginia St - MS330 25
Reno, NV 89557, USA 26
Phone: (775) 784-1349 27
Fax: (775) 784-1419 28
Email: [email protected] 29
30
31
Running Title: PM altered in ala6/7 pollen 32
33
34

2
Abstract 35
Members of the P4 subfamily of P-type ATPases are thought to create and maintain lipid 36
asymmetry in biological membranes by flipping specific lipids between membrane leaflets. In 37
Arabidopsis, 7 of the 12 Aminophospholipid ATPase (ALA) family members are expressed in 38
pollen. Here we show that double knockout of ALA6 and ALA7 (ala6/7) results in siliques with 39
a ~2-fold reduction in seed set with a high frequency of empty seed positions near the bottom. 40
Seed set was reduced to near zero when plants were grown under a hot/cold temperature stress. 41
Reciprocal crosses indicate that the ala6/7 reproductive deficiencies are due to a defect related to 42
pollen transmission. In-vitro growth assays provide evidence that that ala6/7 pollen tubes are 43
short and slow, with ~2-fold reductions in both maximal growth rate and overall length relative 44
to wild-type. Outcrosses show that when ala6/7 pollen are in competition with wild-type pollen, 45
they have a near 0% success rate in fertilizing ovules near the bottom of the pistil, consistent 46
with ala6/7 pollen having short and slow growth defects. The ala6/7 phenotypes were rescued 47
by the expression of either an ALA6-YFP or GFP-ALA6 fusion protein, which showed 48
localization to both the plasma membrane and highly-mobile endomembrane structures. A mass 49
spectrometry analysis of mature pollen grains revealed significant differences between ala6/7 50
and wild-type, both in the relative abundance of lipid classes and in the average number of 51
double bonds present in acyl side chains. A change in the properties of the ala6/7 plasma 52
membrane was also indicated by a ~10-fold reduction of labeling by lipophilic FM-dyes relative 53
to wild-type. Together, these results indicate that ALA6 and ALA7 provide redundant activities 54
that function to directly or indirectly change the distribution and abundance lipids in pollen, and 55
support a model in which ALA6 and ALA7 are critical for pollen fitness under normal and 56
temperature-stress conditions. 57
58
59
Keywords: Pollen, Temperature Stress Tolerance, Lipid Flippases, Phosphatidic Acid, 60
Phosphatidylinositol 61
62
63

3
Introduction 64
Biological membranes are highly organized structures and often have a non-random distribution 65
of lipid species between their constituent leaflets (van Meer, 2011). Members of the P4 66
subfamily of P-type ATPases (P4 -ATPases) have been shown to catalyze the flipping of 67
phospholipids across biological membranes (Coleman et al., 2009; Zhou and Graham, 2009) and 68
are thought to help create and maintain lipid asymmetry between membrane leaflets (Coleman et 69
al., 2013; Sharom, 2011; Tanaka et al., 2011; Paulusma and Elferink, 2010; López-Marqués et 70
al., 2014; Hankins et al., 2015). Lipid asymmetry between membrane leaflets, and its 71
dissipation, have been linked to a wide variety of cellular processes including: cell-to-cell 72
signaling, regulation of membrane permeability, vesicular trafficking, enzyme regulation, and 73
apoptosis (Fernandis and Wenk, 2007; Sebastian et al., 2012; Muthusamy et al., 2009; Verhoven 74
et al., 1995; Paulusma et al., 2009; Tannert et al., 2003; Xu et al., 2013). Studies in yeast and 75
plants have implicated P4-ATPases in vesicular trafficking and tolerance to varied temperature 76
(Chen et al., 1999; Hua et al., 2002; Gall et al., 2002; Pomorski et al., 2003; Ripmaster et al., 77
1993; Poulsen et al., 2008; McDowell et al., 2013; Gomès et al., 2000). However, the 78
mechanistic relationship between these functions and flippase activity has not been determined. 79
80
Evidence indicates that P4-ATPases have different substrate preferences. For example, in yeast, 81
Drs2p transports PS (phosphatidylserine) and PE (phosphatidylethanolamine) (Zhou and 82
Graham, 2009; Natarajan et al., 2004), whereas Dnf1p transports both PC (phosphatidylcholine) 83
and PE (Pomorski et al., 2003; Kato et al., 2002). Although, many P4-ATPases require 84
interaction with a CDC50-family protein for ER export and flippase activity, evidence from 85
Arabidopsis shows that subcellular localization and substrate specificity are determined by the 86
P4-ATPase (López-Marqués et al., 2010). Recently, studies of yeast and mammalian P4-87
ATPases have identified residues that contribute to their substrate specificities (Baldridge and 88
Graham, 2012; Vestergaard et al., 2014; Baldridge and Graham, 2013). 89
90
The P4-ATPase family in Arabidopsis thaliana consists of 12 proteins: ALA 1 to ALA12 91
(Axelsen and Palmgren, 2001; Pedersen et al., 2012; Baxter et al., 2003). Flippase activity has 92
been reported for ALA2 and ALA3 when co-expressed with a beta-subunit in a yeast mutant 93
deficient for its endogenous plasma membrane (PM) localized P4-ATPases (GQI�ûGQI�û) 94
(Poulsen et al., 2008; López-Marqués et al., 2010). ALA2 specifically transports PS, whereas 95
ALA3 transports PE, PC, and PS (Poulsen et al., 2008; López-Marqués et al., 2010). 96
Additionally, ALA1 has been shown to localize to the PM (López-Marqués et al., 2012), ALA2 97
to the PVC (López-Marqués et al., 2010) and ALA3 to the trans-Golgi network (Poulsen et al., 98
2008). Of the twelve ALA isoforms, knockout phenotypes have only been reported for ala3 99
mutants (Poulsen et al., 2008; McDowell et al., 2013; Zhang and Oppenheimer, 2009). Loss of 100
ALA3 results in pleiotropic phenotypes affecting root, shoot, and reproductive development. 101
Additionally, ala3 mutants are highly sensitive to growth conditions such as temperature and 102
soil. A cold-sensitive reduction in plant size has also been observed for plants expressing an 103
RNAi construct against ALA1 (Gomès et al., 2000). 104
105
Here, we present evidence that the Arabidopsis P4-ATPases ALA6 and ALA7 are important for 106
rapid, sustained pollen tube growth and are essential for temperature stress tolerance. Genetic 107
evidence indicates that the activities of ALA6 and ALA7 are highly redundant. Pollen defects 108
could be rescued by the expression of fluorescently-tagged ALA6 fusion proteins, which 109

4
localized simultaneously to both the plasma membrane and highly mobile endomembrane 110
vesicles. Mass spectrometry analysis of mature pollen grains revealed significant differences in 111
lipid composition between ala6-1/7-2 and wild-type. We also show that the ability of lipophilic 112
FM dyes to stain ala6-1/7-2 pollen tubes is reduced by ~10-fold relative to wild-type, indicating 113
altered properties associated with the plasma membrane. Together, these results suggest a model 114
in which ALA6 and ALA7 directly or indirectly change the distribution and concentration of 115
lipids in pollen, and that these flippases are critical for pollen fitness under normal and 116
temperature-stress conditions. 117
118
119
Materials and Methods 120
T-DNA Insertion Mutants 121
Two T-DNA insertional mutants were used in this study: ala6-1 (SALK_150173, 122
ss757) and ala7-2 (SALK_125598, ss733) (Alonso et al., 2003). Mutants were obtained from 123
the Arabidopsis Biological Resource Facility at Ohio State University (http://abrc.osu.edu/) and 124
were identified using PCR-based screening techniques. Both mutants are in the Col-0 125
background. The locations of the T-DNA insertions and PCR primers are indicated in Figure 1. 126
Sequences for the PCR primers can be found in File S2. The individual mutant lines were 127
crossed to create the double mutant ala6-1/7-2 (ss1351). 128
129
Plant Growth Conditions 130
Seeds were sown on 0.5x Murashige and Skoog medium (pH 5.7) containing 1% agar and 0.05% 131
MES. Following 48 h of stratification (4qC, dark), seedlings were grown at room temperature 132
(~23qC) under 24 h light for 7-10 d before being transplanted to soil. The soil used was 133
Sunshine SMB-238 (SunGro Horticulture, Agawam, MA) supplemented with 10-10-10 fertilizer 134
and Marathon pesticide following the manufacturer's instructions. Plants were grown until 135
maturity in a growth chamber (Percival Scientific, Perry, IA) under a long-day photoperiod (16 h 136
light at 20qC/8 h dark at 18qC, 70% humidity, and ~125 µmol m-2 s-1 light intensity). 137
138
Plasmid Construction 139
For expression in plants, two ALA6 genomic DNA fragments were PCR amplified from BAC 140
clone F20D21 using the primer pairs 1035a+br (C-terminal tag) and 1035a+brs (N-terminal tag) 141
and Phusion High-Fidelity DNA Polymerase (New England Biolabs, Ipswich, MA). An ALA1 142
genomic DNA fragment was amplified from Arabidopsis genomic DNA (Col-0 ecotype) using 143
the primer pair 1030a+br (C-terminal tag) and Pfu-Turbo DNA Polymerase (Agilent, Santa 144
Clara, CA). PCR primer sequences can be found in File S2. Poly-A tails were added to the PCR 145
products using ExTaq (Takara, Mountain View, CA) and the resultant DNA fragments were T/A 146
cloned into the pGEM-T Easy vector (Ampr in bacteria) using the pGEM-T Easy Vector System 147
kit (Ampr in bacteria) (Promega, Madison , WI). All PCR-derived fragments were sequence 148
verified to be error free in the pGEM-T Easy vector. The ALA6 and ALA1 fragments were 149
subcloned from the pGEM vector into a derivative of the pGreenII plant vector (kanr in bacteria, 150
hygr in plants) (Hellens et al., 2000). Junction sites were sequence verified to be error free. All 151
fusion proteins expressed in this study were under the control of the Arabidopsis thaliana ACA9 152
promoter, which drives a moderate expression preferentially in pollen (Schiøtt et al., 2004). 153
Internal stock numbers for each plasmid are: ps1730, ACA9p-NTAP2(G)-ALA6; ps1728, 154
ACA9p-i-ALA6-TAP2(Y); ps1729, ACA9p-i-ALA1-TAP2(Y); and ps779, ACA9p-i-TAP2(Y). 155

5
Sequence information for each plasmid can be found in File S3. 156
157
For expression in yeast, two ALA6 cDNA fragments were amplified using the primer pairs 158
oli4300+oli4301 (untagged ALA6) and oli4299+oli4301 (RGSH10-ALA6). PCR primer 159
sequences can be found in File S2. The ALA6 cDNA template was created from total RNA 160
extracted from Col-0 pollen. The PCR fragments were cloned into the yeast plasmids pRS423-161
GAL (untagged) (Burgers, 1999) and pMP4062 (His tag, RGSH10) (López-Marqués et al., 2012) 162
using homologous recombination. PCR fragments and corresponding plasmids were 163
transformed into the S. cerevisiae strain ZHY709 (0$7.�KLV��OHX��XUD��PHW���GQI1û�GQI�û�164
drs2::LEU2) (Hua et al., 2002) using the lithium acetate method (Gietz and Woods, 2002). 165
Positive transformants were identified after 4 d of growth at 28qC using synthetic complete 166
media (SCD) plates without histidine (0.7% Yeast Nitrogen base, 2% glucose, 1x drop out media 167
supplement) (Rose and Broach, 1990). All PCR-derived fragments were sequence verified to be 168
error free. 169
170
Plant Transformation 171
Plants were transformed with Agrobacterium tumefaciens strain GV3101 carrying the pSOUP 172
helper plasmid using the floral dip method (Hellens et al., 2000; Clough and Bent, 1998). T1 173
seedlings were grown on 0.5x Murashige and Skoog (MS) medium (pH 5.7) containing 1% agar, 174
������0(6��DQG�����J�PO�K\JURP\FLQ�WR�LGHQWLI\�VXFFHVVIXO�WUDQVIRUPDQWV��� 175
176
In-vitro Pollen Tube Growth 177
The pollen tube growth medium was based on the method described by Boavida and 178
McCormick, and contained: 5 mM CaCl2, 0.01% H3BO3, 5 mM KCl, 10% sucrose, 1 mM 179
MgSO4, pH 7.5-7.8, and 1.5% low melting agarose (Boavida and McCormick, 2007). Pollen 180
from stage 13-14 flowers was placed on pistils, either from the corresponding genotype or from 181
surrogate ms-1 plants, and the pistils were then placed on ~400µL of pollen tube growth medium 182
layered over a microscope slide. The slides were incubated at room temperature (~23°C) in a 183
square petri dish containing water-soaked paper towels to maintain high humidity. Pollen tubes 184
were grown for 2-6 h prior to analysis, unless being used for a time course. For the time course 185
analysis of pollen tube length, pollen tubes were photographed with a Hamamatsu Orca ER 186
camera attached to a Leica DM-IRE2 microscope (JH Technologies, Fremont, CA). Length 187
measurements were done using the Fiji software package (Schindelin et al., 2012). 188
189
Confocal Microscopy 190
Images were collected using an Olympus IX81 FV1000 confocal microscope run by the 191
Olympus FluoView 1.07.03.00 software package (Olympus, Center Valley, PA). A 60x 192
objective (numerical aperture 1.42) was used throughout. Excitation at wavelengths of 488nm 193
(GFP, FM4-64, and FM1-43) and 515nm (YFP) was provided with an Argon-Ion laser. A 194
spectral emission range of 500-600 nm was used for GFP, 545-595 nm for YFP, 670-726 nm for 195
FM-4-64 and 575-605 nm for FM1-43. 196
197
FM Dye Staining 198
Pollen tubes were stained with the lipophilic dyes FM4-64 and FM1-43 (Invitrogen - Molecular 199
Probes, Eugene, OR). For both dyes, 10µM staining solutions were prepared by dissolving the 200
individual dye in liquid pollen tube growth medium. When needed, sodium azide (NaAz) was 201

6
added to the staining solution to a final concentration of 0.05%. Staining solution was directly 202
applied to pollen tubes growing on solid medium layered over a microscope slide (see above 203
section: In-vitro Pollen Tube Growth). Images were captured 1-45m after the addition of the 204
staining solution, as described in the Confocal Microscopy section. Fluorescence was quantified 205
in terms of average pixel intensity using the Fiji software package (Schindelin et al., 2012). 206
207
Lipid Profiling 208
Pollen for lipid analysis was collected from independent, parallel-grown groups of ~75 plants. 209
Total lipid extracts were obtained from pollen using chloroform/methanol extraction, described 210
below. To deactivate phospholipases prior to lipid extraction, pollen samples were immersed for 211
15 m in 3 mL of 75qC isopropanol + 0.01% butylated hydroxytoluene (BHT). The first 212
extraction step was done by adding 1.5 mL chloroform and 0.6 mL of water to the 213
pollen/isopropanol mixture. Four subsequent extraction steps were done using 214
chloroform/methanol (2:1) + 0.01% BHT. Each extraction was done for 1 h; except for the last 215
extraction, which was done overnight (~12 h). The five extracts for each sample were combined 216
and washed twice: first with 1 mL of 1M KCl and second with 2 mL of water. 217
218
Lipid samples were then evaporated to 1 mL and sent to the Kansas Lipidomics Research Center 219
(http://www.k-state.edu/lipid/lipidomics) for routine plant polar lipid analysis by tandem mass 220
spectrometry. The two mass spectrometers used were an Applied Biosystems API 4000 and an 221
Applied Biosystems Q-TRAP, separated by a collision cell. Samples were introduced by 222
electrospray ionization, with no pre-analysis separation. Analysis was done using both precursor 223
and neutral loss scans. 224
225
Lipid Translocation Assays 226
Lipid translocation was assayed as previously described (López-Marqués et al., 2010). ALA6-227
containing yeast (see Plasmid Construction) was transformed with the yeast plasmid pRS426-228
GAL (Burgers, 1999); either empty, or containing the putative beta-subunits ALA interacting 229
subunit 1 (ALIS1), ALIS3, or ALIS5 (Poulsen et al., 2008). As controls, the wild type BY4741 230
(0$7.�KLV��OHX��XUD��PHW��; EUROSCARF) (positive control) and the mutant ZHY709 231
(negative control) were transformed with empty plasmids pRS423-GAL and pRS426-GAL. 232
Flow cytometry was performed on a FACSCalibur cell analyzer (BD Biosciences, San Jose, CA) 233
equipped with an argon laser using Cell Quest software. Thirty thousand cells were analyzed 234
without gating during the acquisition, and live cells were selected based on forward/side-scatter 235
gating and propidium iodide exclusion. A histogram of the green (NBD) fluorescence of living 236
cells was used to calculate the mean fluorescence intensity of total cells. 237
238
Yeast Membrane Fractionation and Immunolabeling 239
Fractionation of yeast membranes in sucrose gradients, quantification of protein contents and 240
Western blot analysis were carried out as described in (López-Marqués et al., 2012). Fractions 241
enriched in ER (30% sucrose) and PM (48% sucrose) were collected by sucrose density gradient 242
fractionation and used for Western blot analysis. Immunodetection of RGSH6- and RGSH10-243
tagged proteins was performed using a commercial BSA-free RGS-+LV��DQWLERG\�SURGXFHG�LQ�244
mouse (Qiagen, Valencia, CA). We used a monoclonal anti-dolichol phosphate mannose 245
synthase (Dpm1p) antibody (Molecular Probes, Eugene, OR) as a marker for the endoplasmic 246
reticulum and a polyclonal antibody against the C-terminal end of the yeast proton ATPase 247

7
(Pma1p) (Monk et al., 1991) as a marker for the plasma membrane. Golgi fractions were 248
detected with an affinity purified anti-Sed5p polyclonal antibody (Sapperstein et al., 1996). 249
250
251
Results 252
Among the seven ALAs that are most highly expressed in A. thaliana pollen, ALA6 (At1g54280) 253
and ALA7 (AT3g13900) are two of the most closely related (89% amino acid identity) and 254
account for approximately 56% of the ALA subfamily mRNA in pollen grains or growing tubes 255
(Loraine et al., 2013) (Figure S1a). To determine if these genes have redundant functions in 256
pollen development, we isolated the ala6-1 and ala7-2 T-DNA gene disruption lines from the 257
SALK collection (Alonso et al., 2003) and crossed them to make the double knockout ala6-1/7-2 258
(Figure 1). The T-DNA insertions for both ala6-1 and ala7-2 are in the first exon and are 259
predicted to disrupt the production of functional proteins. 260
261
ALA6 and ALA7 Are Important for Pollen Fitness 262
A pollen transmission defect was observed for double knockout combinations of ala6-1 and 263
ala7-2 in which only one allele was segregating (e.g., ala6-1(-/-)/ala7-2(+/-) or ala6-1(+/-264
)/ala7-2(-/-)) (Table I). In plants allowed to self-fertilize, double-homozygous progeny were 265
observed at frequencies of 5.3% - 8.3%, representing a ~4-fold decrease from the expected 25%. 266
In pollen outcrosses, transmission of the ala6-1/7-2 allele was reduced to 2.9% - 3.7%, 267
representing a ~15-fold decrease from the expected 50%. Transmission of ala6-1/7-2 through 268
the female gametophyte appeared normal, indicating that the observed segregation distortion was 269
the result of a pollen-autonomous defect. 270
271
Plants heterozygous for ala6-1(+/-) or ala7-2(+/-) individually showed no evidence of a 272
segregation distortion when allowed to self-fertilize (Table I). However, manual pollen 273
outcrosses showed a ~2-fold decrease in ala6-1 transmission, indicating the loss of ALA6 alone 274
can result in a detectable phenotype. A similar deficiency was not seen for ala7-2. 275
276
Evidence that the pollen transmission defects were caused by loss of ALA6 and ALA6/7 was 277
corroborated by rescuing mutant pollen with transgenes encoding either ALA6-YFP, or GFP-278
ALA6 (Table II). Both transgenes were expressed under the control of the ACA9 promoter, 279
which drives a moderate level of expression preferentially in pollen (Schiøtt et al., 2004). The 280
transgenes were stably expressed in either an ala6-1 or an ala6-1/7-2 mutant background, and 281
reciprocal crosses were done to test for an increase in the transmission efficiency of gametes 282
harboring a transgene. Both transgenes showed an expected 50% transmission through the 283
female, confirming that only one copy the transgene was present in the plants used in the 284
reciprocal crosses. In contrast, pollen transmission of the transgenes was increased to 78-83% in 285
the ala6-1 background and 98-99% in the ala6-1/7-2 background. Neither transgene showed an 286
increased pollen transmission in wild-type control plants, indicating that the improved 287
transmission in mutants was the result of rescuing the pollen defects associated with ala6-1 and 288
ala6-1/7-2 knockouts. Additional controls showed that ala6-1/7-2 pollen was not rescued by an 289
empty vector or a more distantly related ALA isoform, ALA1. Since the transmission defect 290
associated with the double mutant was more pronounced, subsequent studies were done using 291
ala6-1/7-2. 292
293

8
Seed Set in ala6-1/7-2 Is Reduced and Hypersensitive to Temperature Stress 294
In homozygous ala6-1/7-2 mutants, seed set within each silique was decreased to ~55% that of 295
wild-type (Figure 2). Furthermore, seed was unevenly distributed within ala6-1/7-2 siliques, 296
with a high frequency of empty seed positions at the bottom of the silique. Seed set was restored 297
to wild-type levels in ala6-1/7-2 plants expressing a GFP-ALA6 or an ALA6-YFP construct, but 298
not an empty vector control, indicating that the phenotype was caused by loss of ALA6 and 299
ALA7. A seed set phenotype was not observed when ala6-1/7-2 pistils were manually fertilized 300
with wild-type pollen (Figure S2), indicating that pollen defects alone account for the mutant 301
phenotype. 302
303
To determine if the reduction in ala6-1/7-2 seed set is dependent upon growth conditions, plants 304
were allowed to self-fertilize under a temperature stress that cycled between hot days (40°C 305
peak) and cold-nights (-1°C low)(Figure S3). The temperature stress caused seed set in wild-306
type siliques to be reduced to ~38% that of unstressed, whereas ala6-1/7-2 mutants were sterile 307
(Figure 3). Seed set was restored to wild-type levels in ala6-1/7-2 plants expressing a GFP-308
ALA6 or an ALA6-YFP construct, but not an empty vector control, confirming that the 309
sensitivity to temperature stress was caused by loss of ALA6 and ALA7. 310
311
ala6-1/7-2 Pollen Tubes Are Short and Slow 312
To quantify growth defects associated with ala6-1/7-2 pollen, in-vitro growth assays were done 313
over a 24 h time course (Figure 4). After the 24 h growth period, the overall length of ala6-1/7-2 314
pollen tubes was ~35% that of wild-type. The maximal growth rate of ala6-1/7-2 pollen tubes 315
was also reduced to ~45% that of wild-type. Expression of two different ALA6 transgenes 316
(ALA6-YFP and GFP-ALA6) restored the growth rate and overall length of ala6-1/7-2 pollen 317
tubes to nearly that of wild-type. 318
319
To evaluate the in-vivo relevance of ala6-1/7-2 pollen tube growth defects, pollen from ala6-1(-320
/-)/7-2(+/-) plants was used to fertilize wild-type pistils, and the resulting mature siliques were 321
divided into three sectors of equal length (top, middle and bottom). Without growth defects, the 322
ala6-1/7-2 allele would be expected to transmit to all three sectors equally, with 33% of the total 323
transmission in each sector. However 72.7% of the ala6-1/7-2 pollen transmission was observed 324
in the top sector, whereas no transmission of ala6-1/7-2 was observed in the bottom sector 325
(Table III). These results indicate that the competitive fitness of ala-16/7-2 pollen relative to 326
wild-type decreases in the distal region of the pistil, consistent with in-vitro growth assays 327
showing ala6-1/7-2 pollen tubes to be slow and short (Figure 4). 328
329
The Subcellular Localization of ALA6 Includes the Plasma Membrane and 330
Endomembrane Structures 331
The potential subcellular localization of ALA6 was investigated using confocal microscopy to 332
image GFP-ALA6 and YFP-ALA6 fusion proteins in the pollen tubes of stable ala6-1/7-2 333
transgenic plants (Figure 5). The transgenes encoding both fusion proteins were shown to rescue 334
ala6-1/7-2 pollen defects (Figures 2-3, Table II). In pollen tubes treated with 0.05% NaAz, both 335
ALA6 fusion proteins showed a localization pattern consistent with a plasma membrane 336
association, although some association with endomembrane structures was also observed (Figure 337
5c, Movie S1). In growing pollen tubes not treated with NaAz, the relative amount of 338
endomembrane-associated ALA6 fusion protein was higher, with the ALA6-labeled structures 339

9
engaged in cytoplasmic streaming (Figure 5d, Movie S2). These localization patterns were 340
observed for 11 of 11 independent transgenic lines (7 GFP-ALA6, 4 ALA6-YFP), regardless of 341
whether expression levels were high or at the lower limits of detection, providing evidence that 342
the patterns were not associated with an over-expression artifact. 343
344
Lipid Composition Is Altered in ala6-1/7-2 Pollen Grains 345
To determine if loss of ALA6/7 is correlated with a change the lipid composition, tandem mass 346
spectrometry (MS/MS) was done on lipids extracted from ala6-1/7-2 and wild-type pollen grains 347
(Figure 6, File S1). The MS/MS analysis detected polar lipids from 11 head-groups 348
(monogalactosyldiacylglycerol, MGDG; phosphatidylcholine, PC; phosphatidylethanolamine, 349
PE; phosphatidylinositol, PI; phosphatidic acid, PA; digalactosyldiacylglycerol, DGDG; 350
phosphatidylglycerol, PG; lysophosphatidylglycerol, LPG; lysophosphatidylcholine, LPC; 351
lysophosphatidylethanolamine, LPE; and phosphatidylserine, PS) and quantified the double 352
bonds within the corresponding acyl side chain(s). In total, the abundances of 144 distinct lipids 353
were measured. We chose to examine pollen grains instead of growing tubes because pollen 354
grains could be more easily harvested in sufficient quantities, with the majority of cells in the 355
same developmental and physiological state. Expression profiling data suggests that both ALA6 356
and ALA7 are expressed at similar levels in mature pollen grains and growing pollen tubes 357
(Figure S1b). Significant differences between ala6-1/7-2 and wild-type were observed, both in 358
the concentrations of lipid head-groups (Figure 6a) and the average number of double bonds (i.e. 359
unsaturation) within acyl side chains (Figure 6b). For example, we observed a ~2-fold decrease 360
in PI concentration and a ~2-fold increase in PA concentration in ala6-1/7-2 pollen relative to 361
wild-type. 362
363
FM-Dye Staining Is Reduced in the ala6-1/7-2 Pollen Tube Plasma Membrane 364
In an attempt to measure rates of endocytosis, wild-type and ala6-1/7-2 pollen tubes were stained 365
with the lipophilic dyes FM4-64 and FM1-43 (Figure 7). For wild-type tubes only, both FM 366
dyes showed strong PM staining after less than 2 m, and increasing internal staining over a 45 m 367
time period. In contrast, ala6-1/7-2 pollen tubes failed to show any significant PM or internal 368
staining, even after 45 m. However, both wild-type and ala6-1/7-2 pollen tubes showed similar 369
staining when exposed to the sterol-dye Filipin (Boutté et al., 2011) (Figure S4a), indicating that 370
the change in the ala6-1/7-2 plasma membrane that limits FM-dye staining does not affect all 371
dyes. Additionally, the FM dyes were able to stain membranes throughout ala6-1/7-2 pollen 372
tubes that had been killed by prolonged NaAz exposure (Supplemental Figure 4.3b), indicating 373
that loss of ALA6 and ALA7 does not affect all membranes equally. 374
375
376
Discussion 377
ALA6 and ALA7 Are Critical for Rapid, Sustained Pollen Tube Growth 378
In this study, we present genetic evidence that the simultaneous loss of ALA6 and ALA7 result 379
in a male-autonomous reproductive defect (Table I and Table II). In-vitro growth assays indicate 380
that, relative to wild-type, ala6-1/7-2 pollen tubes have more than 2-fold reductions in both 381
maximal growth rate and overall length (Figure 4). These defects are corroborated in-vivo by 382
both the high frequency of empty seed positions in the bottom of ala6-1/7-2 siliques (Figure 2) 383
and the 0% success rate of ala6-1/7-2 pollen in competition with wild-type to fertilize ovules in 384
the bottom third of a pistil (Table III). Only a weak reproductive defect was observed for ala6-1 385

10
pollen, indicating that ALA6 and ALA7 provide a significant level of redundancy (Table I). The 386
observation of a pollen-specific defect for ala6-1/7-2 is consistent with mRNA expression 387
profiling data, which indicate that both isoforms are expressed primarily in pollen (Figure S1b). 388
389
The Subcellular Localization of ALA6 Includes the Plasma Membrane and 390
Endomembrane Structures 391
GFP-ALA6 and ALA6-YFP fusion proteins were observed both at the perimeter of pollen tubes, 392
consistent with plasma membrane localization, and on highly mobile endomembrane structures 393
(Figure 5, Movie S1, and Movie S2). While we cannot completely rule out the possibility of 394
artifacts arising from over-expression or the fluorescent tags, identical localization patterns were 395
observed at both high and low levels of protein expression, and for both N- and C-terminal tags. 396
In addition, because GFP-ALA6 and ALA6-YFP fusion proteins rescued the ala6-1/7-2 pollen 397
defect, we conclude that at least a subset of the observed fusion proteins were in functional 398
locations. This supports a working hypothesis that ALA6 and ALA7 might function in multiple 399
membrane locations, including the plasma membrane. 400
401
Lipid Composition is Altered in ala6-1/7-2 Pollen 402
Tandem mass spectroscopy revealed a ~2-fold increase in PA concentration and a ~2-fold 403
decrease in PI concentration in ala6-1/7-2 pollen grains relative to wild-type (Figure 6, File S1). 404
While the yeast P4-ATPase mutants ûGUV� and ûGUV�ûGQI�ûGQI� have been linked to altered 405
concentrations of PE, PS, PC, and PI (Pomorski et al., 2003), the lipid changes in ala6-1/7-2 are 406
distinct in two important ways. First, no change in PA concentration was observed for either 407
yeast mutant, whereas a ~2-fold increase was observed for ala6-1/7-2 pollen. Second, increased 408
PI concentration was observed for the yeast mutant ûGUV�ûGQI�ûGQI�, whereas a ~2-fold 409
decrease was observed for ala6-1/7-2 pollen. A parallel lipid profiling analysis was not done on 410
growing pollen tubes because of the difficulties in obtaining sufficient sample material. 411
Therefore, we cannot exclude the possibility that the lipid profile of ala6/7 pollen changes during 412
tube growth. It is also possible that the observed differences between Col-0 and ala6/7 pollen 413
are the result of limited changes in lipid composition at a specific subcellular location. 414
415
While the mechanisms causing altered lipid concentrations in ala6/7 pollen are currently 416
unknown, the correlation between an increase in PA concentration and a decrease in PI 417
concentration could be explained by changes in either the biosynthesis or degradation of PI. For 418
example, loss of ALA6/7 might alter the properties of one or more membrane systems, and 419
thereby indirectly inhibit the activities of enzymes involved in PI biosynthesis, such as ER-420
associated PI synthase (PIS) proteins (Collin et al., 1999; Justin et al., 2002; Löfke et al., 2008). 421
An alternate and non-exclusive possibility is that loss of ALA6/7 might result in increased 422
degradation of PI into PA through the activities of phospholipase C (PLC) and diacylglycerol 423
kinase (DGK) (Testerink and Munnik, 2011). PA has a well-established role in stress signaling 424
(Testerink and Munnik, 2005, 2011), and it is possible that PA production is increased in mutant 425
pollen as a result of a ³physiological stress condition´ associated with the loss of ALA6/7. It is 426
also possible that loss of ALA6/7 might disrupt a feedback mechanism that adjusts the levels of 427
PI metabolites, which have been shown to regulate the activity of the yeast P4-ATPase Drs2p 428
(Azouaoui et al., 2014). 429
430
Loss of ALA6 and ALA7 Disrupts FM Dye Staining of the Pollen Tube Plasma Membrane 431

11
A ~10-fold decrease in FM dye staining was observed for live ala6-1/7-2 pollen tubes relative to 432
wild-type (Figure 7). FM dyes selectively label membranes and are commonly used as tools for 433
studying endocytosis and other vesicular trafficking processes (Bolte et al., 2004; Betz et al., 434
1996; Hoopmann et al., 2012). When a cell is exposed to an FM dye, the plasma membrane is 435
stained immediately, followed by a time-dependent internalization into endomembrane structures 436
(Bolte et al., 2004). While it is not clear how the loss of ALA6/7 reduces the ability of an FM 437
dye to stain the PM, possible explanations include changes in the 30¶V�VXUIDFH�FKDUJH�RU�438
fluidity. However, it is unclear whether WKH�30¶V�charge and fluidity could be altered enough to 439
block FM dye staining without compromising the ability the membrane to carry out basic 440
biological functions. Alternate explanations include quenching or sequestration of FM dyes by 441
an unknown molecule(s) in the extracellular matrix or plasma membrane of mutant pollen tubes. 442
443
Lipid Transport Activity of ALA6 444
In an attempt to determine the lipid transport activity of ALA6, the enzyme was expressed in the 445
yeast triple mutant ûGUV�ûGQI�ûGQI� (Hua et al., 2002). This yeast mutant is deficient in 446
phospholipid transport across the plasma membrane and has been successfully used to quantify 447
the lipid transport activities of ALA2 and ALA3 (Poulsen et al., 2008; López-Marqués et al., 448
2010). However, ALA6 failed to show any lipid translocation activity for NBD-labeled 449
fluorescent analogues of PS, PE, PC, and PA (Figure S5a). While controls corroborated that 450
ALA6 was expressed at the yeast plasma membrane (Figure S5b), it remains unclear if ALA6 451
has a very different substrate specificity compared to other characterized flippases, or if the 452
heterologous system was lacking a component that is uniquely required for ALA6 activity. 453
454
Specialization of P4-ATPases 455
The P4-ATPase protein family in plants can be divided into five subfamilies (Baxter et al., 456
2003), each containing at least one pollen-expressed ALA isoform (Figure S1a). Of the seven 457
pollen expressed ALA isoforms, three have been linked to pollen fertility: ALA3, subfamily 4 458
(Zhang and Oppenheimer, 2009; McDowell et al., 2013) and ALA6/7, subfamily 3 (this report). 459
While decreased pollen fertility was observed for both ala3 and ala6/7 mutants, the underlying 460
defects were distinct. For example, disorganized cytoplasmic streaming was observed in ala3 461
pollen tubes (McDowell et al., 2013) but not ala6/7 (Figure S6). Also, a change in lipid 462
composition was observed in ala6/7 pollen grains (Figure 6, File S1), but not ala3 (McDowell et 463
al., 2013). The differences between the ala3 and ala6/7 knockout phenotypes suggest that ALA3 464
and ALA6/7 have different cellular functions. Furthermore, the inability of the other four pollen-465
expressed ALA isoforms to compensate for the loss of ALA3 or ALA6/7 suggests that each 466
ALA subfamily might have unique biological functions. The biological functions of the four 467
other pollen-expressed ALA isoforms are currently unknown. 468
469
Role of P4-ATPases in Temperature Stress Tolerance 470
One of the most dramatic defects associated with ala6-1/7-2 was hypersensitivity to temperature 471
stress. While seed set was reduced to ~55% of wild-type under unstressed conditions (Figure 2), 472
ala6-1/7-2 plants were completely sterile under hot day/cold-night temperature stress (Figure 3). 473
In comparison, the seed set reduction in wild type plants was ~2-fold. Interestingly, temperature 474
hypersensitivity has also been reported for ala3 knockouts (McDowell et al., 2013) and a 475
knockdown of ALA1 (Gomès et al., 2000). In addition, the yeast P4-ATPase Drs2p is required 476
for cell growth at or below 23qC (Ripmaster et al., 1993; Siegmund et al., 1998). It is not clear if 477

12
these hypersensitivities are caused by defects in stress signaling, or biophysical differences 478
resulting from changes in lipid composition or secretory pathway functions. 479
480
Models for ALA6 and ALA7 in Pollen Tube Growth 481
From the evidence presented in this study, we propose that ALA6 and ALA7 function to directly 482
or indirectly change the distributions and concentrations of PA and PI. PA and the 483
phosphorylated derivatives of PI (phosphatidylinositol phosphates, PIPs), have well-established 484
roles as signaling molecules in plants, animals and yeast (Michell, 2008; Wang, 2004; Stace and 485
Ktistakis, 2006; Raghu et al., 2009; Ischebeck et al., 2010; Potocký et al., 2014). In plants, PA 486
and PIPs are known to function as membrane-localization signals by binding specific protein 487
targets, and can also regulate protein activity by inducing conformational changes (Xue et al., 488
2009; Munnik and Nielsen, 2011; Testerink and Munnik, 2011; Munnik and Testerink, 2009; 489
Wang et al., 2006). Both PA and PIPs also have well-established roles in vesicular trafficking 490
and pollen development (Fu, 2010; Thole and Nielsen, 2008; Testerink and Munnik, 2011; 491
Ischebeck et al., 2010). For example, PA has been shown to affect the actin cytoskeleton of 492
Arabidopsis pollen tubes via direct interaction with the actin capping protein AtCP (Huang et al., 493
2006). Altered PA levels result in disruptions to the pollen tube actin cytoskeleton and reduced 494
tip growth (Potocký et al., 2003; Monteiro et al., 2005; Pleskot et al., 2013). Similarly, transient 495
NQRFNGRZQ�VWXGLHV�RI�1W3/'����D�3$-producing enzyme in tobacco, revealed a reduction in 496
pollen tube growth that could be rescued by the addition of exogenous PA (Pleskot et al., 2010). 497
498
While it is not yet clear how the loss of ALA6 and ALA7 results in pollen tube growth defects, 499
two non-exclusive models warrant consideration. First, the loss of ALA6 and ALA7 might result 500
in the defective regulation of plasma membrane lipid asymmetry, which could compromise 501
membrane-associated functions such as protein recruitment, localized membrane curvature, 502
signaling, or membrane fluidity. For example, a reduced ability to flip PA or PI to the inner 503
leaflet of the pollen tube plasma membrane might alter the ability of the PM to recruit proteins 504
involved in exocytosis and polar cell growth. In a second model, loss of ALA6 and ALA7 might 505
impair membrane curvature during the formation of endomembrane vesicles, thereby causing a 506
general disruption of the secretory and endocytosis pathways. These pathways are of general 507
importance for all cells, especially pollen tubes, which display one of the most rapid polar 508
growth rates of any plant cell. 509
510
Regardless of mechanism, we show here that the P4-ATPases ALA6 and ALA7 are critical for 511
rapid, sustained pollen tube growth as well as tolerance to a temperature stress. Together, these 512
results support a model in which ALA6 and ALA7 have distinct activities from the five other 513
pollen-expressed ALA proteins and directly or indirectly change membrane features important 514
for pollen fitness. 515
516
517
Acknowledgements 518
We thank Nick Saini and Caitlin Gallagher for technical assistance. The lipid analyses described 519
in this work were performed at the Kansas Lipidomics Research Center Analytical Laboratory. 520
521
This work was supported by grants to JFH from the National Science Foundation 522
(http://www.nsf.gov, NSF DBI-0420033) for stress-dependent phenotype screens, from the 523

13
National Institutes of Health (http://www.nih.gov, NIH 1RO1 GM070813-01) for studies on 524
forming pollen tube tip growth, and from the US Department of Energy (http://www.energy.gov, 525
DE-FG03-94ER20152) for studies on membrane biogenesis and genetic analyses of ALAs. 526
Bioinformatics was made possible by the INBRE Program of the National Center for Research 527
Resources (http://www.nih.gov, NIH grant P20 RR-016464). Confocal microscopy was made 528
possible by support from by the COBRE program of the National Institutes of Health 529
(http://www.nih.gov, NIH COBRE grant RR024210). The lipid transport assays were funded by 530
grants from the Danish National Research Foundation (DNRF85) and the Danish Council for 531
Independent Research, Natural Sciences (FNU project number 10-083406). The Kansas 532
Lipidomics Research Center was supported by the National Science Foundation's EPSCoR 533
program (http://www.nsf.gov, EPS-0236913) with matching support from the State of Kansas 534
through Kansas Technology Enterprise Corporation and Kansas State University. The funders 535
had no role in study design, data collection and analysis, decision to publish, or preparation of 536
the manuscript. 537
538
539

14
References 540
Alonso, J. M., Stepanova, A. N., Leisse, T. J., Kim, C. J., Chen, H., Shinn, P., Stevenson, D. K., 541
Zimmerman, J., Barajas, P., Cheuk, R., et al. (2003). Genome-wide insertional mutagenesis 542
of Arabidopsis thaliana. Science (80-. ). 301, 653±7. doi:10.1126/science.1086391. 543
Axelsen, K. B., and Palmgren, M. G. (2001). Inventory of the superfamily of P-Type ion pumps 544
in Arabidopsis. Plant Physiol. 126, 696±706. Available at: 545
http://www.pubmedcentral.nih.gov/articlerender.fcgi?artid=111160&tool=pmcentrez&rend546
ertype=abstract [Accessed May 30, 2012]. 547
Azouaoui, H., Montigny, C., Ash, M.-R., Fijalkowski, F., Jacquot, A., Grønberg, C., López-548
Marqués, R. L., Palmgren, M. G., Garrigos, M., le Maire, M., et al. (2014). A high-yield co-549
expression system for the purification of an intact Drs2p-Cdc50p lipid flippase complex, 550
critically dependent on and stabilized by phosphatidylinositol-4-phosphate. PLoS One 9, 551
e112176. doi:10.1371/journal.pone.0112176. 552
Baldridge, R. D., and Graham, T. R. (2012). Identification of residues defining phospholipid 553
flippase substrate specificity of type IV P-type ATPases. Proc. Natl. Acad. Sci. U. S. A. 109, 554
E290±8. doi:10.1073/pnas.1115725109. 555
Baldridge, R. D., and Graham, T. R. (2013). Two-gate mechanism for phospholipid selection and 556
transport by type IV P-type ATPases. Proc. Natl. Acad. Sci. U. S. A. 110, E358±67. 557
doi:10.1073/pnas.1216948110. 558
Baxter, I., Tchieu, J., Sussman, M. R., Boutry, M., Palmgren, M. G., Gribskov, M., Harper, J. F., 559
and Axelsen, K. B. (2003). Genomic comparison of P-Type ATPase ion pumps in 560
Arabidopsis and Rice. Plant Physiol. 132, 618±28. doi:10.1104/pp.103.021923. 561
Betz, W. J., Mao, F., and Smith, C. B. (1996). Imaging exocytosis and endocytosis. Curr. Opin. 562
Neurobiol. 6, 365±71. Available at: http://www.ncbi.nlm.nih.gov/pubmed/8794083 563
[Accessed December 18, 2012]. 564
Boavida, L. C., and McCormick, S. (2007). Temperature as a determinant factor for increased 565
and reproducible in vitro pollen germination in Arabidopsis thaliana. Plant J. 52, 570±82. 566
doi:10.1111/j.1365-313X.2007.03248.x. 567
Bolte, S., Talbot, C., Boutte, Y., Catrice, O., Read, N. D., and Satiat-Jeunemaitre, B. (2004). FM-568
dyes as experimental probes for dissecting vesicle trafficking in living plant cells. J. 569
Microsc. 214, 159±173. doi:10.1111/j.0022-2720.2004.01348.x. 570
Boutté, Y., Men, S., and Grebe, M. (2011). Fluorescent in situ visualization of sterols in 571
Arabidopsis roots. Nat. Protoc. 6, 446±56. doi:10.1038/nprot.2011.323. 572
Burgers, P. M. (1999). Overexpression of multisubunit replication factors in yeast. Methods 18, 573
349±55. doi:10.1006/meth.1999.0796. 574
15
Chen, C. Y., Ingram, M. F., Rosal, P. H., and Graham, T. R. (1999). Role for Drs2p, a P-Type 575
ATPase and potential aminophospholipid translocase, in Yeast late Golgi function. J. Cell 576
Biol. 147, 1223±36. Available at: 577
http://www.pubmedcentral.nih.gov/articlerender.fcgi?artid=2168089&tool=pmcentrez&ren578
dertype=abstract [Accessed March 29, 2012]. 579
Clough, S. J., and Bent, A. F. (1998). Floral dip: a simplified method for Agrobacterium-580
mediated transformation of Arabidopsis thaliana. Plant J. 16, 735±43. Available at: 581
http://www.ncbi.nlm.nih.gov/pubmed/10069079 [Accessed March 19, 2012]. 582
Coleman, J. A., Kwok, M. C. M., and Molday, R. S. (2009). Localization, purification, and 583
functional reconstitution of the P4-ATPase Atp8a2, a phosphatidylserine flippase in 584
photoreceptor disc membranes. J. Biol. Chem. 284, 32670±9. 585
doi:10.1074/jbc.M109.047415. 586
Coleman, J. A., Quazi, F., and Molday, R. S. (2013). Mammalian P(4)-ATPases and ABC 587
transporters and their role in phospholipid transport. Biochim. Biophys. Acta 1831, 555±74. 588
doi:10.1016/j.bbalip.2012.10.006. 589
Collin, S., Justin, A. M., Cantrel, C., Arondel, V., and Kader, J. C. (1999). Identification of 590
AtPIS, a phosphatidylinositol synthase from Arabidopsis. Eur. J. Biochem. 262, 652±8. 591
Available at: http://www.ncbi.nlm.nih.gov/pubmed/10411624 [Accessed March 6, 2015]. 592
Fernandis, A. Z., and Wenk, M. R. (2007). Membrane lipids as signaling molecules. Curr. Opin. 593
Lipidol. 18, 121±8. doi:10.1097/MOL.0b013e328082e4d5. 594
Fu, Y. (2010). The actin cytoskeleton and signaling network during pollen tube tip growth. J. 595
Integr. Plant Biol. 52, 131±7. doi:10.1111/j.1744-7909.2010.00922.x. 596
Gall, W. E., Geething, N. C., Hua, Z., Ingram, M. F., Liu, K., Chen, S. I., and Graham, T. R. 597
(2002). Drs2p-dependent formation of exocytic clathrin-coated vesicles in vivo. Curr. Biol. 598
12, 1623±7. Available at: http://www.ncbi.nlm.nih.gov/pubmed/12372257 [Accessed June 599
15, 2012]. 600
Gietz, R. D., and Woods, R. A. (2002). Transformation of yeast by lithium acetate/single-601
stranded carrier DNA/polyethylene glycol method. Methods Enzymol. 350, 87±96. 602
Available at: http://www.ncbi.nlm.nih.gov/pubmed/12073338 [Accessed December 19, 603
2014]. 604
Gomès, E., Jakobsen, M. K., Axelsen, K. B., Geisler, M., and Palmgren, M. G. (2000). Chilling 605
tolerance in Arabidopsis involves ALA1, a member of a new family of putative 606
aminophospholipid translocases. Plant Cell 12, 2441±2454. Available at: 607
http://www.pubmedcentral.nih.gov/articlerender.fcgi?artid=102229&tool=pmcentrez&rend608
ertype=abstract [Accessed June 15, 2012]. 609
Hankins, H. M., Baldridge, R. D., Xu, P., and Graham, T. R. (2015). Role of flippases, 610

16
scramblases and transfer proteins in phosphatidylserine subcellular distribution. Traffic 16, 611
35±47. doi:10.1111/tra.12233. 612
Hellens, R. P., Edwards, E. A., Leyland, N. R., Bean, S., and Mullineaux, P. M. (2000). pGreen: 613
a versatile and flexible binary Ti vector for Agrobacterium-mediated plant transformation. 614
Plant Mol. Biol. 42, 819±32. Available at: http://www.ncbi.nlm.nih.gov/pubmed/10890530. 615
Honys, D., and Twell, D. (2004). Transcriptome analysis of haploid male gametophyte 616
development in Arabidopsis. Genome Biol. 5, R85. doi:10.1186/gb-2004-5-11-r85. 617
Hoopmann, P., Rizzoli, S. O., and Betz, W. J. (2012). Imaging synaptic vesicle recycling by 618
staining and destaining vesicles with FM dyes. Cold Spring Harb. Protoc. 2012, 77±83. 619
doi:10.1101/pdb.prot067603. 620
Hua, Z., Fatheddin, P., and Graham, T. R. (2002). An essential subfamily of Drs2p-related P-621
type ATPases is required for protein trafficking between Golgi complex and 622
endosomal/vacuolar system. Mol. Biol. Cell 13, 3162±77. doi:10.1091/mbc.E02-03-0172. 623
Huang, S., Gao, L., Blanchoin, L., and Staiger, C. J. (2006). Heterodimeric capping protein from 624
Arabidopsis is regulated by phosphatidic acid. Mol. Biol. Cell 17, 1946±58. 625
doi:10.1091/mbc.E05-09-0840. 626
Ischebeck, T., Seiler, S., and Heilmann, I. (2010). At the poles across kingdoms: 627
phosphoinositides and polar tip growth. Protoplasma 240, 13±31. doi:10.1007/s00709-009-628
0093-0. 629
Justin, A.-M., Kader, J.-C., and Collin, S. (2002). Phosphatidylinositol synthesis and exchange of 630
the inositol head are catalysed by the single phosphatidylinositol synthase 1 from 631
Arabidopsis. Eur. J. Biochem. 269, 2347±52. Available at: 632
http://www.ncbi.nlm.nih.gov/pubmed/11985617 [Accessed March 6, 2015]. 633
Kato, U., Emoto, K., Fredriksson, C., Nakamura, H., Ohta, A., Kobayashi, T., Murakami-634
Murofushi, K., Kobayashi, T., and Umeda, M. (2002). A novel membrane protein, Ros3p, is 635
required for phospholipid translocation across the plasma membrane in Saccharomyces 636
cerevisiae. J. Biol. Chem. 277, 37855±62. doi:10.1074/jbc.M205564200. 637
Löfke, C., Ischebeck, T., König, S., Freitag, S., and Heilmann, I. (2008). Alternative metabolic 638
fates of phosphatidylinositol produced by phosphatidylinositol synthase isoforms in 639
Arabidopsis thaliana. Biochem. J. 413, 115±24. doi:10.1042/BJ20071371. 640
López-Marqués, R. L., Poulsen, L. R., Bailly, A., Geisler, M., Pomorski, T. G., and Palmgren, 641
M. G. (2014). Structure and mechanism of ATP-dependent phospholipid transporters. 642
Biochim. Biophys. Acta. doi:10.1016/j.bbagen.2014.04.008. 643
López-Marqués, R. L., Poulsen, L. R., Hanisch, S., Meffert, K., Buch-Pedersen, M. J., Jakobsen, 644
M. K., Pomorski, T. G., and Palmgren, M. G. (2010). Intracellular targeting signals and 645
17
lipid specificity determinants of the ALA/ALIS P4-ATPase complex reside in the catalytic 646
ALA alpha-subunit. Mol. Biol. Cell 21, 791±801. doi:10.1091/mbc.E09-08-0656. 647
López-Marqués, R. L., Poulsen, L. R., and Palmgren, M. G. (2012). A putative plant 648
aminophospholipid flippase, the Arabidopsis P4 ATPase ALA1, localizes to the plasma 649
PHPEUDQH�IROORZLQJ�DVVRFLDWLRQ�ZLWK�D��-subunit. PLoS One 7, e33042. 650
doi:10.1371/journal.pone.0033042. 651
Loraine, A. E., McCormick, S., Estrada, A., Patel, K., and Qin, P. (2013). RNA-seq of 652
Arabidopsis pollen uncovers novel transcription and alternative splicing. Plant Physiol. 162, 653
1092±109. doi:10.1104/pp.112.211441. 654
McDowell, S. C., López-Marqués, R. L., Poulsen, L. R., Palmgren, M. G., and Harper, J. F. 655
(2013). Loss of the Arabidopsis thaliana P4-ATPase ALA3 Reduces Adaptability to 656
Temperature Stresses and Impairs Vegetative, Pollen, and Ovule Development. PLoS One 657
8, e62577. doi:10.1371/journal.pone.0062577. 658
Van Meer, G. (2011). Dynamic transbilayer lipid asymmetry. Cold Spring Harb. Perspect. Biol. 659
doi:10.1101/cshperspect.a004671. 660
Michell, R. H. (2008). Inositol derivatives: evolution and functions. Nat. Rev. Mol. Cell Biol. 9, 661
151±61. doi:10.1038/nrm2334. 662
Monk, B. C., Montesinos, C., Ferguson, C., Leonard, K., and Serrano, R. (1991). Immunological 663
approaches to the transmembrane topology and conformational changes of the carboxyl-664
terminal regulatory domain of yeast plasma membrane H(+)-ATPase. J. Biol. Chem. 266, 665
18097±103. Available at: http://www.ncbi.nlm.nih.gov/pubmed/1833392 [Accessed 666
December 20, 2014]. 667
Monteiro, D., Liu, Q., Lisboa, S., Scherer, G. E. F., Quader, H., and Malhó, R. (2005). 668
Phosphoinositides and phosphatidic acid regulate pollen tube growth and reorientation 669
through modulation of [Ca2+]c and membrane secretion. J. Exp. Bot. 56, 1665±74. 670
doi:10.1093/jxb/eri163. 671
Munnik, T., and Nielsen, E. (2011). Green light for polyphosphoinositide signals in plants. Curr. 672
Opin. Plant Biol. 14, 489±97. doi:10.1016/j.pbi.2011.06.007. 673
0XQQLN��7���DQG�7HVWHULQN��&����������3ODQW�SKRVSKROLSLG�VLJQDOLQJ��³LQ�D�QXWVKHOO´��J. Lipid Res. 674
50 Suppl, S260±5. doi:10.1194/jlr.R800098-JLR200. 675
Muthusamy, B.-P., Natarajan, P., Zhou, X., and Graham, T. R. (2009). Linking phospholipid 676
flippases to vesicle-mediated protein transport. Biochim. Biophys. Acta 1791, 612±9. 677
doi:10.1016/j.bbalip.2009.03.004. 678
Myers, C., Romanowsky, S. M., Barron, Y. D., Garg, S., Azuse, C. L., Curran, A., Davis, R. M., 679
Hatton, J., Harmon, A. C., and Harper, J. F. (2009). Calcium-dependent protein kinases 680

18
regulate polarized tip growth in pollen tubes. Plant J. Cell Mol. Biol. doi:10.1111/j.1365-681
313X.2009.03894.x. 682
Natarajan, P., Wang, J., Hua, Z., and Graham, T. R. (2004). Drs2p-coupled aminophospholipid 683
translocase activity in yeast Golgi membranes and relationship to in vivo function. Proc. 684
Natl. Acad. Sci. U. S. A. 101, 10614±10619. doi:10.1073/pnas.0404146101. 685
Paulusma, C. C., and Elferink, R. P. J. O. (2010). P4 ATPases - The physiological relevance of 686
lipid flipping transporters. FEBS Lett. 584, 2708±16. doi:10.1016/j.febslet.2010.04.071. 687
Paulusma, C. C., de Waart, D. R., Kunne, C., Mok, K. S., and Elferink, R. P. J. O. (2009). 688
Activity of the bile salt export pump (ABCB11) is critically dependent on canalicular 689
membrane cholesterol content. J. Biol. Chem. 284, 9947±54. doi:10.1074/jbc.M808667200. 690
Pedersen, C. N. S., Axelsen, K. B., Harper, J. F., and Palmgren, M. G. (2012). Evolution of plant 691
P-Type ATPases. Front. Plant Sci. 3, 31. doi:10.3389/fpls.2012.00031. 692
Pleskot, R., Li, J., Zárský, V., Potocký, M., and Staiger, C. J. (2013). Regulation of cytoskeletal 693
dynamics by phospholipase D and phosphatidic acid. Trends Plant Sci. 18, 496±504. 694
doi:10.1016/j.tplants.2013.04.005. 695
Pleskot, R., Potocký, M., Pejchar, P., Linek, J., Bezvoda, R., Martinec, J., Valentová, O., 696
Novotná, Z., and Zárský, V. (2010). Mutual regulation of plant phospholipase D and the 697
actin cytoskeleton. Plant J. 62, 494±507. doi:10.1111/j.1365-313X.2010.04168.x. 698
Pomorski, T., Lombardi, R., Riezman, H., Devaux, P. F., Meer, G. Van, and Holthuis, J. C. M. 699
(2003). Drs2p-related P-type ATPases Dnf1p and Dnf2p are required for phospholipid 700
translocation across the Yeast plasma membrane and serve a role in endocytosis. Mol. Biol. 701
Cell 14, 1240 ±1254. doi:10.1091/mbc.E02. 702
Potocký, M., Eliás, M., Profotová, B., Novotná, Z., Valentová, O., and Zárský, V. (2003). 703
Phosphatidic acid produced by phospholipase D is required for tobacco pollen tube growth. 704
Planta 217, 122±30. doi:10.1007/s00425-002-0965-4. 705
Potocký, M., Pleskot, R., Pejchar, P., Vitale, N., Kost, B., and Zárský, V. (2014). Live-cell 706
imaging of phosphatidic acid dynamics in pollen tubes visualized by Spo20p-derived 707
biosensor. New Phytol. 203, 483±94. doi:10.1111/nph.12814. 708
Poulsen, L. R., López-Marqués, R. L., McDowell, S. C., Okkeri, J., Licht, D., Schulz, A., 709
Pomorski, T., Harper, J. F., and Palmgren, M. G. (2008). The Arabidopsis P4-ATPase 710
ALA3 localizes to the Golgi and requires a beta-subunit to function in lipid translocation 711
and secretory vesicle formation. Plant Cell 20, 658±76. doi:10.1105/tpc.107.054767. 712
Qin, Y., Leydon, A. R., Manziello, A., Pandey, R., Mount, D., Denic, S., Vasic, B., Johnson, M. 713
A., and Palanivelu, R. (2009). Penetration of the stigma and style elicits a novel 714
transcriptome in pollen tubes, pointing to genes critical for growth in a pistil. PLoS Genet. 715

19
5, e1000621. doi:10.1371/journal.pgen.1000621. 716
Raghu, P., Manifava, M., Coadwell, J., and Ktistakis, N. T. (2009). Emerging findings from 717
studies of phospholipase D in model organisms (and a short update on phosphatidic acid 718
effectors). Biochim. Biophys. Acta 1791, 889±97. doi:10.1016/j.bbalip.2009.03.013. 719
Ripmaster, T. L., Vaughn, G. P., and Woolford, J. L. (1993). DRS1 to DRS7, novel genes 720
required for ribosome assembly and function in Saccharomyces cerevisiae. Mol. Cell. Biol. 721
13, 7901±12. Available at: 722
http://www.pubmedcentral.nih.gov/articlerender.fcgi?artid=364862&tool=pmcentrez&rend723
ertype=abstract [Accessed March 31, 2012]. 724
Rose, A. B., and Broach, J. R. (1990). Propagation and expression of cloned genes in yeast: 2-725
microns circle-based vectors. Methods Enzymol. 185, 234±79. Available at: 726
http://www.ncbi.nlm.nih.gov/pubmed/2199781 [Accessed December 19, 2014]. 727
Rousseeuw, P. J., Ruts, I., and Tukey, J. W. (1999). The Bagplot: A bivariate boxplot. Am. Stat. 728
53, 382±387. Available at: http://www.jstor.org/stable/2686061. 729
Sapperstein, S. K., Lupashin, V. V, Schmitt, H. D., and Waters, M. G. (1996). Assembly of the 730
ER to Golgi SNARE complex requires Uso1p. J. Cell Biol. 132, 755±67. Available at: 731
http://www.pubmedcentral.nih.gov/articlerender.fcgi?artid=2120746&tool=pmcentrez&ren732
dertype=abstract [Accessed December 20, 2014]. 733
Schindelin, J., Arganda-Carreras, I., Frise, E., Kaynig, V., Longair, M., Pietzsch, T., Preibisch, 734
S., Rueden, C., Saalfeld, S., Schmid, B., et al. (2012). Fiji: an open-source platform for 735
biological-image analysis. Nat. Methods 9, 676±82. doi:10.1038/nmeth.2019. 736
Schiøtt, M., Romanowsky, S. M., Baekgaard, L., Jakobsen, M. K., Palmgren, M. G., and Harper, 737
J. F. (2004). A plant plasma membrane Ca2+ pump is required for normal pollen tube 738
growth and fertilization. Proc. Natl. Acad. Sci. U. S. A. 101, 9502±7. doi:PMC439006. 739
Sebastian, T. T., Baldridge, R. D., Xu, P., and Graham, T. R. (2012). Phospholipid flippases: 740
building asymmetric membranes and transport vesicles. Biochim. Biophys. Acta 1821, 741
1068±77. doi:10.1016/j.bbalip.2011.12.007. 742
Sharom, F. J. (2011). Flipping and flopping--lipids on the move. IUBMB Life 63, 736±46. 743
doi:10.1002/iub.515. 744
Siegmund, A., Grant, A., Angeletti, C., Malone, L., Nichols, J. W., and Rudolph, H. K. (1998). 745
Loss of Drs2p does not abolish transfer of fluorescence-labeled phospholipids across the 746
plasma membrane of Saccharomyces cerevisiae. J. Biol. Chem. 273, 34399±405. Available 747
at: http://www.ncbi.nlm.nih.gov/pubmed/9852106 [Accessed March 31, 2012]. 748
Stace, C. L., and Ktistakis, N. T. (2006). Phosphatidic acid- and phosphatidylserine-binding 749
proteins. Biochim. Biophys. Acta 1761, 913±26. doi:10.1016/j.bbalip.2006.03.006. 750

20
Tanaka, K., Fujimura-Kamada, K., and Yamamoto, T. (2011). Functions of phospholipid 751
flippases. J. Biochem. 149, 131±43. doi:10.1093/jb/mvq140. 752
Tannert, A., Wüstner, D., Bechstein, J., Müller, P., Devaux, P. F., and Herrmann, A. (2003). 753
Aminophospholipids have no access to the luminal side of the biliary canaliculus: 754
implications for thr specific lipid composition of the bile fluid. J. Biol. Chem. 278, 40631±9. 755
doi:10.1074/jbc.M302131200. 756
Testerink, C., and Munnik, T. (2011). Molecular, cellular, and physiological responses to 757
phosphatidic acid formation in plants. J. Exp. Bot. 62, 2349±61. doi:10.1093/jxb/err079. 758
Testerink, C., and Munnik, T. (2005). Phosphatidic acid: a multifunctional stress signaling lipid 759
in plants. Trends Plant Sci. 10, 368±75. doi:10.1016/j.tplants.2005.06.002. 760
Thole, J. M., and Nielsen, E. (2008). Phosphoinositides in plants: novel functions in membrane 761
trafficking. Curr. Opin. Plant Biol. 11, 620±31. doi:10.1016/j.pbi.2008.10.010. 762
Verhoven, B., Schlegel, R. A., and Williamson, P. (1995). Mechanisms of phosphatidylserine 763
exposure, a phagocyte recognition signal, on apoptotic T lymphocytes. J. Exp. Med. 182, 764
1597±601. Available at: 765
http://www.pubmedcentral.nih.gov/articlerender.fcgi?artid=2192221&tool=pmcentrez&ren766
dertype=abstract [Accessed March 2, 2013]. 767
Vestergaard, A. L., Coleman, J. A., Lemmin, T., Mikkelsen, S. A., Molday, L. L., Vilsen, B., 768
Molday, R. S., Dal Peraro, M., and Andersen, J. P. (2014). Critical roles of isoleucine-364 769
and adjacent residues in a hydrophobic gate control of phospholipid transport by the 770
mammalian P4-ATPase ATP8A2. Proc. Natl. Acad. Sci. U. S. A. 111, E1334±43. 771
doi:10.1073/pnas.1321165111. 772
Wang, X. (2004). Lipid signaling. Curr. Opin. Plant Biol. 7, 329±36. 773
doi:10.1016/j.pbi.2004.03.012. 774
Wang, X., Devaiah, S. P., Zhang, W., and Welti, R. (2006). Signaling functions of phosphatidic 775
acid. Prog. Lipid Res. 45, 250±78. doi:10.1016/j.plipres.2006.01.005. 776
Winter, D., Vinegar, B., Nahal, H., Ammar, R., Wilson, G. V, and Provart, N. J. (2007). An 777
³(OHFWURQLF�)OXRUHVFHQW�3LFWRJUDSK´�EURZVHU�IRU�H[SORULQJ�DQG�DQDO\]LQJ�ODUJH-scale 778
biological data sets. PLoS One 2, e718. doi:10.1371/journal.pone.0000718. 779
Xu, P., Baldridge, R. D., Chi, R. J., Burd, C. G., and Graham, T. R. (2013). Phosphatidylserine 780
flipping enhances membrane curvature and negative charge required for vesicular transport. 781
J. Cell Biol. 202, 875±86. doi:10.1083/jcb.201305094. 782
Xue, H.-W., Chen, X., and Mei, Y. (2009). Function and regulation of phospholipid signalling in 783
plants. Biochem. J. 421, 145±56. doi:10.1042/BJ20090300. 784

21
Zhang, X., and Oppenheimer, D. G. (2009). IRREGULAR TRICHOME BRANCH 2 (ITB2) 785
encodes a putative aminophospholipid translocase that regulates trichome branch elongation 786
in Arabidopsis. Plant J. Cell Mol. Biol. 60, 195±206. doi:10.1111/j.1365-787
313X.2009.03954.x. 788
Zhou, X., and Graham, T. R. (2009). Reconstitution of phospholipid translocase activity with 789
purified Drs2p, a type-IV P-type ATPase from budding yeast. Proc. Natl. Acad. Sci. U. S. A. 790
106, 16586±91. doi:10.1073/pnas.0904293106. 791
792
793

22
Table I. Segregation analysis shows a defect in transmission through male gametophytes 794
carrying ala6-1 and ala6-1/7-2 mutations. WT is an abbreviation for wild-type. The observed 795
results were compared to an expected Mendelian segregation. Statistical significance was 796
determined by the Pearson's Chi-Squared test. 797
798
��[�� Cross Description Assay Expected (%) Observed (%) n p-Value ala6-1(+/-)/ala7-2 x same Selfed ala6(-/-) 25 5.3 94 <0.0001 ala6-1/ala7-2(+/-) x same Selfed ala7(-/-) 25 8.3 144 <0.0001 ala6-1/ala7-2(+/-) x WT Male Outcross ala7(-) 50 3.7 301 <0.0001 WT x ala6-1/ala7-2(+/-) Female Outcross ala7(-) 50 44.7 152 0.1944
ala6-1(+/-) x same Selfed ala6(-/-) 25 20 90 0.4803 ala7-2(+/-) x same Selfed ala7(-/-) 25 27.3 132 0.5465 ala6-1(+/-) x WT Male Outcross ala6(-) 50 25.6 238 <0.0001 ala7-2(+/-) x WT Male Outcross ala7(-) 50 50.2 221 0.9464
799
800

23
Table II. Segregation analysis shows that the pollen transmission defects of ala6-1 and 801
ala6-1/7-2 can be rescued by ALA6-YFP or GFP-ALA6 fusion proteins. Lines containing a 802
single copy of the transgene were maintained through outcrosses. WT is an abbreviation for 803
wild-type and TG is an abbreviation for transgene. The observed results were compared to an 804
expected Mendelian segregation. Statistical significance was determined by the Pearson's Chi-805
Squared test. For the GFP-ALA6 rescue construct: 6/6 lines showed equivalent rescue of ala6-806
1/7-2 (ss1878-1881, ss1883-1884); 3/3 lines showed equivalent rescue of ala6-1 (ss1889-1891); 807
and 9/9 lines did not improve reproductive fitness in WT (ss1895-1903). For the ALA6-YFP 808
rescue construct, 3/3 lines showed equivalent rescue of ala6-1/7-2 (ss1885, ss1886, ss1888); 3/3 809
lines showed equivalent rescue of ala6-1 (ss1892-1894); and 6/6 failed to show any changes to 810
reproductive fitness in a WT background (ss1904-1909). For the YFP-only control construct, 811
7/7 lines failed to rescue ala6-1/7-2 (ss1910-1916). For the ALA1-YFP control construct, 2/2 812
lines failed to rescue ala6-1/7-2 (ss1917-1918). 813
814
��[�� Cross Description
Transgene (TG) Expected TG (%)
Observed TG (%)
n p-Value
ala6-1/7-2 + TG(+/-) x same Selfed ALA6-YFP, GFP-ALA6 75 93.2, 91.5 869, 1509 Both <0.0001 ala6-1/7-2 + TG(+/-) x WT Male Outcross ALA6-YFP, GFP-ALA6 50 97.5, 99.1 475, 875 Both <0.0001
ala6-1 + TG(+/-) x WT Male Outcross ALA6-YFP, GFP-ALA6 50 77.7, 82.8 282, 331 Both <0.0001 WT x ala6-1/7-2 + TG(+/-) Female Outcross ALA6-YFP, GFP-ALA6 50 51.7, 51.3 487, 567 0.4411, 0.5287
WT x ala6-1 + TG(+/-) Female Outcross ALA6-YFP, GFP-ALA6 50 51.4, 51.6 140, 221 0.7353, 0.6377 ala6-1/7-2 + TG(+/-) x same Selfed YFP 75 72.5 1601 0.0218 ala6-1/7-2 + TG(+/-) x same Selfed ALA1-YFP 75 75.6 324 0.7975
WT + TG(+/-) x same Selfed ALA6-YFP, GFP-ALA6 75 68.3, 71.4 1854, 2735 Both <0.0001
815
816

24
Table III. The transmission of ala6-1/7-2 through pollen is restricted to the top 2/3 of the 817
silique. Wild-type (WT) and ms-1 pistils were fertilized with ala6-1(-/-)/7-2(+/-) pollen and the 818
resulting siliques were divided into three sectors of equal length Top (stigma end), Middle, and 819
Bottom (base of the silique). The observed results are compared to an expected equal 820
distribution of mutant alleles across all three sectors. Statistical significance was determined by 821
the Pearson's Chi-Squared test. 822
823
% Total ala6-1/7-2 Transmission ��[�� Assay Top Middle Bottom n p-Value
Expected n/a 33 33 33 n/a n/a ala6-1/7-2(+/-) x WT ala7(-) 72.7 27.3 0 11 0.01
824
825

25
Figure Legends 826
Figure 1. Diagrams of ALA6 and ALA7 showing locations of T-DNA disruptions. Filled 827
boxes represent exons and open boxes represent introns. T-DNA insertions are represented with 828
triangles and identified by ala allele numbers and T-DNA allele accessions. Primers used for 829
PCR genotyping are represented by arrows and point in the 5' to 3' direction. Primer 1343 830
corresponds to the T-DNA left border. The left-border junctions are as follows: ala6-1, 831
TGGGACTCCGGCTCAAGCACGCACCgatcgccttaatcgccttaatccgt; and ala7-5, 832
GTAACTGTAGATCTTTCCCTTGTTTttatcggccccagtgaaggtatatc. Capital letters represent ALA 833
genomic DNA and lowercase letters represent T-DNA. 834
835
Figure 2: Loss of ALA6 and ALA7 results in reduced seed set with an uneven distribution 836
of seed. (A) Representative examples of wild-type and ala6-1/7-2 siliques cleared with 70% 837
EtOH to show seed positions. (B) Graph of seed set by sector. Siliques were divided into four 838
sectors of equal length with sector 1 at the top (stigma end) of the silique and sector 4 at the base 839
of the silique. Average results (±SE) are reported for two independent experiments, n = 35-93 840
siliques. Siliques were collected from a total of 5-13 plants for each genotype. Sector numbers 841
appear below each column and the average total seed set for each genotype is given above the 842
corresponding sector data. For the GFP-ALA6 rescue construct, 7/9 lines showed equivalent 843
rescue of ala6-1/7-2: ss1878-1884. For the ALA6-YFP rescue construct, 4/6 lines showed 844
equivalent rescue of ala6-1/7-2: ss1885-1888. 845 a,b,c Columns sharing common labels (letters) are not significantly different from each other (p > 846
0.05). 847
848
Figure 3. Loss of ALA6 and ALA7 results in sterility under hot-day/cold-night 849
temperature stress. Plants were allowed to self-fertilize under a temperature stress that cycled 850
between hot-days (40qC peak) and cold-nights (-1qC low) with periods of intermediate 851
temperature between the extremes for acclimation. (A) Representative examples of wild-type 852
and ala6-1/7-2 siliques cleared with 70% EtOH to show seed positions. (B) Graph of overall 853
seed set. Average results (±SE) are reported for two independent experiments, n = 15-85 854
siliques. Siliques were collected from at least four plants for each genotype. For the GFP-ALA6 855
rescue construct, 6/6 lines showed equivalent rescue of ala6-1/7-2: ss1878, ss1879, and ss1881-856
1884. For the ALA6-YFP rescue construct, 3/3 lines showed equivalent rescue of ala6-1/7-2: 857
ss1885, ss1887, and ss1888. 858
* Statistically significant difference between wild-type and ala6-1/7-2 (Welch's t-test, p < 0.05) 859
860
Figure 4. In-vitro assays show ala6-1/7-2 pollen tubes are short with reduced rates of 861
growth. Pollen was placed on pistils, either from the corresponding genotype or from surrogate 862
ms-1 plants, and the pistils were placed on agar-solidified growth media. Pollen tubes growing 863
out of the pistils were measured over a 24 h time course. Lengths were reported for each time 864
point as the average length of the 10 longest pollen tubes. Values and error bars represent mean 865
± SE for three independent experiments for all genotypes. An independent transgenic line was 866
used for each ala6-1/7-2 + TG experiment (ss1883, ss1886, and ss1888) with each line showing 867
similar results. 868
869
Figure 5. Confocal fluorescence micrographs showing GFP-ALA6 localizes to the pollen 870
tube perimeter and endomembrane structures. (A-B) Growing pollen tubes expressing (A) 871

26
YFP (ss1919) as a marker for the cytosol and (B) ACA9-YFP (ss471-472) as a marker for the 872
plasma membrane (Myers et al., 2009). (C-D) Pollen tubes expressing GFP-ALA6 (ss1880) 873
either (C) treated with 0.05% NaAz, or (D) growing. Constructs were expressed under the 874
control of the ACA9 promoter in stable transgenic Arabidopsis plants. Images of GFP-ALA6 875
are representative of seven GFP-ALA6 (ss1878-1884) and four ALA6-YFP (ss1885-1888) 876
transgenic lines in which the transgene were shown to rescue the ala6-1/7-2 phenotype. The 877
pattern of localization was equivalent for expression levels that ranged from high to the lower 878
limits of detection. The images shown for GFP-ALA6 represent GFP signals that were 879
significantly above background autofluorescence, as determined by comparison with WT pollen 880
imaged using the same exposure settings (black images not shown). 881
882
Figure 6: The quantification of lipid head-groups and unsaturation reveals significant 883
differences between wild-type and ala6-1/7-2 pollen. Lipid concentrations were measured 884
using tandem mass spectrometry (MS/MS) that detected 11 different head-groups and quantified 885
the acyl carbons and double bonds within the corresponding acyl side chain(s). Concentrations 886
are expressed as a percentage of the total lipid detected for a specific sample and are represented 887
as mean ± SE, n = 4 for both WT and ala6-1/7-2. Pollen was collected from independent, 888
parallel-grown, groups of ~75 plants. (A) Concentrations of lipid head-groups. Higher- 889
concentration head-groups appear on the left and lower-concentration head-groups appear on the 890
right. (B) Unsaturation in acyl side chain(s). Unsaturation in diacyl lipids (2 acyl chains) 891
appears on the left and unsaturation in lysophospholipids (1 acyl chain) appears on the right. 892
Abbreviations: MGDG, monogalactosyldiacylglycerol; PC, phosphatidylcholine; PE, 893
phosphatidylethanolamine; PI, phosphatidylinositol; PA, phosphatidic acid; DGDG, 894
digalactosyldiacylglycerol; PG, phosphatidylglycerol; LPG, lysophosphatidylglycerol; LPC, 895
lysophosphatidylcholine; LPE, lysophosphatidylethanolamine; PS, phosphatidylserine. 896 * Statistically significant difference between wild-type and ala6-1/7-2 (Welch's t-test, p<0.05) 897
898
Figure 7: Loss of ALA6 and ALA7 reduces the ability of lipophilic FM dyes to stain living 899
pollen tubes. (A) Confocal micrographs showing DIC and FM dye emission for wild-type and 900
ala6-1/7-2 pollen tubes stained with FM4-64. (B) Quantitative analysis of FM dye emission 901
from pollen tubes stained with FM4-64 and FM1-43. Average results (±SE) are reported for 902
three independent experiments, n = 21-36 pollen tubes. Pollen tubes were collected from a total 903
of 5-11 different plants for each genotype and dye. For the GFP-ALA6 rescue construct, 4/4 904
lines showed equivalent rescue of ala6-1/7-2: ss1878, ss1880, ss1881, ss1883. For the ALA6-905
YFP rescue construct, 4/4 lines showed equivalent rescue of ala6-1/7-2: ss1885-1888. 906
* Statistically significant difference between wild-type and ala6-1/7-2 (Welch's t-test, p < 0.05) 907
908
909
910

27
Supplemental Material 911
Figure S1. Expression profiling data showing preferential pollen expression for ALA6 and 912
ALA7 mRNAs (A) Expression levels of the seven pollen-expressed ALA isoforms in pollen 913
grains: ALA1 (At5g04930), ALA2 (At5g44240), ALA3 (At1g59820), ALA6 (At1g54280), ALA7 914
(At3g13900), ALA9 (At1g68710), and ALA12 (At1g26130). Expression data was obtained from 915
a pollen RNA-seq dataset (Loraine et al., 2013) and is expressed as reads per KB per million 916
reads (RPKM). (B) Expression of ALA6 and ALA7 in different tissues. Data was obtained from 917
the Arabidopsis eFP Browser (http://bar.utoronto.ca/efp/cgi-bin/efpWeb.cgi) (Winter et al., 918
2007) and was normalized against: EF1-alpha (AT5G60390), CBP20 (At5g44200), Actin-2 919
(At3g18780), and UBC (At5g25760). Expression of ALA6 in microspore (MS) tissue was 920
arbitrarily set to 1, and the rest of the data adjusted accordingly. Expression data for pollen grain 921
maturation (Honys and Twell, 2004) and pollen tube growth (Qin et al., 2009) were collected in 922
independent experiments. Developmental stages are abbreviated as: MS, microspore; BC, 923
bicellular pollen; TC, tricellular pollen; MP, mature pollen; 30 m, pollen tube germinated in-vitro 924
for 30 minutes; 4 h, pollen tube germinated in-vitro for 4 hours; and SIV, pollen tubes after semi 925
in-vivo growth through a stigma. 926
927
Figure S2. Fertilization of ala6-1/7-2 pistils with wild-type pollen resulted in siliques with 928
full seed set. (A) Representative example of an ala6-1/7-2 silique fertilized with wild-type 929
(WT) pollen and cleared with 70% EtOH to show seed positions. Siliques were divided into four 930
sectors of equal length with sector 1 at the top (stigma end) of the silique and sector 4 at the base 931
of the silique. Sector numbers appear to the right of the silique. (B) Graph of seed set by sector. 932
Average results (±SE) are reported for two independent experiments; n = 6 siliques, each from a 933
different plant. Sector numbers appear below each column and the average total seed set is given 934
above the sector data. 935
936
Figure S3. Schematic diagram of the hot-day/cold-night temperature stress that blocked 937
pollen fertility in ala6-1/7-2 plants. Temperature cycles from 40qC during the day to -1qC at 938
night, with periods of intermediate temperature between the extremes for acclimation. Manually 939
pollinated plants were immediately moved to hot-day/cold-night stress between 15:00 and 17:00 940
h on the diurnal cycle (chamber temperature of 10qC), forcing the period of pollen tube growth 941
and fertilization to overlap with stress temperatures. 942
943
Figure S4. Loss of ALA6 and ALA7 does not reduce the staining of membranes by Filipin, 944
or the ability of FM dyes to stain pollen tubes after NaAz treatment. (A) Filipin III dye 945
staining of living pollen tubes. Average results (±SE) are reported for two independent 946
experiments, n = 8 pollen tubes for both genotypes. (B) FM4-64 staining of pollen tubes killed 947
by prolonged exposure to 0.05% NaAz. Average results (±SE) are reported for three 948
independent experiments, n = 9 pollen tubes for ala6-1/7-2 and n = 25 pollen tubes for wild-type. 949
Pollen tubes were collected from four or more different plants for each genotype and dye 950
combination. Differences between wild-type and ala6-1/7-2 were not statistically significant 951
(p=0.705 for Filipin III and p=0.337 for FM4-64, Welch's t-test). 952
953
Figure S5. Expression of ALA6 in yeast failed to show detectable flippase activity. (A) 954
Lipid translocation assays were carried out for ALA6 alone and in the presence of three putative 955
beta-subunits: ALIS1, ALIS3, and ALIS5. An empty vector was used as a negative control, and 956

28
vectors were transformed into wild type yeast as a positive control. Average results (±SE) are 957
reported for at least four independent experiments. (B) Discontinuous sucrose density gradient 958
fractionation of PM-enriched yeast membranes expressing RGSH10:ALA6 alone or coexpressed 959
with RGSH6:ALIS1. Fractions enriched in ER (30% sucrose) and PM (48% sucrose) were 960
analyzed with a Western blot using the following antibodies: anti-Pma1p, plasma membrane; 961
anti-Dpm1p, ER; anti-Sed5p, Golgi; anti-RGSHis, ALA6 and ALIS5. 962
963
Figure S6. Cytoplasmic streaming is not altered in ala6-1/7-2 pollen tubes. (A) Wild-type 964
pollen tube with white arrows pointing to representative vesicles visible with DIC optics. Scale 965
bar = 5µM. (B) Exemplary model trajectories with high and low progressiveness ratios. (C and 966
D) Bagplots (Rousseeuw et al., 1999) of vesicular speed and progressiveness ratios for vesicles 967
within wild-type (C) and ala6-1/7-2 (D) pollen tubes. The shaded region represents an area 968
containing 50% of the data points. The two-dimensional median is represented by the crosshairs 969
within the shaded region. Differences between wild-type and ala6-1/7-2 were not statistically 970
significant for either speed (p=0.923) or progressiveness ratio (p=0.444), Welch's t-test. N = 4 971
for both wild-type and ala6-1/7-2. 972
973
File S1. Concentrations of 144 lipids in ala6-1/7-2 and wild-type pollen. This data is 974
summarized in Figure 6. Lipid concentrations were measured using tandem mass spectrometry 975
(MS/MS) that detected 11 different head-groups and quantified the acyl carbons and double 976
bonds within the corresponding acyl side chain(s). Concentrations are expressed as a percentage 977
of the total lipid detected for a specific sample and were calculated using the formula: % total 978
signal = 100 * nmol individual lipid / total nmol for that sample. Pollen was collected from 979
independent, parallel-grown, groups of ~75 plants (n = 4 for both WT and ala6-1/7-2). 980
981
File S2. PCR primers used for genotyping T-DNA insertion lines and cloning. Sequences 982
UHDG�LQ�WKH���:���GLUHFWLRQ���)RU�FORQLQJ�SULPHUV��XSSHUFDVH�OHWWHUV�UHSUHVHQW�JHQRPLF�'1$�DQG�983
lowercase letters represent introduced restriction or recombination sites. 984
985
File S3. DNA sequences of the plasmid constructs used in this study. Each plasmid is 986
UHSUHVHQWHG�E\�DQ�LQGLYLGXDO�VHTXHQFH�ILOH�LQ�)$67$�IRUPDW�DQG�UHDGV�LQ�WKH���:���GLUHFWLRQ� 987
988
Movie S1. Movie of NaAz-treated pollen tube expressing GFP-ALA6. Movie depicts the 989
pollen tube shown in Figure 5c. See caption to Figure 5 for details. Images were taken at 990
regular intervals of ~1.25 s over a ~2 m time period. Movie plays at ~15x speed. 991
992
Movie S2. Movie of growing pollen tube expressing GFP-ALA6. Movie depicts the pollen 993
tube shown in Figure 5d. See caption to Figure 5 for details. Images were taken at regular 994
intervals of ~1.25 s over a ~2 m time period. Movie plays at ~15x speed. 995
996
997

Figure 1.TIF
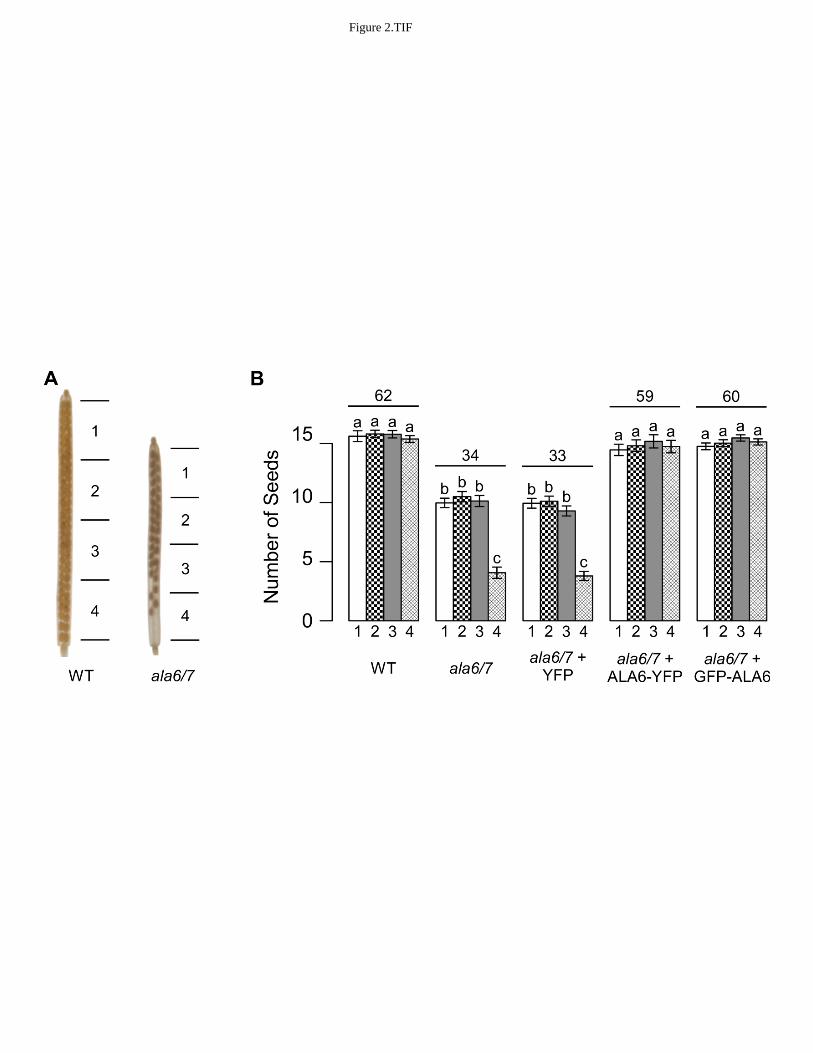
Figure 2.TIF

Figure 3.TIF

Figure 4.TIF

Figure 5.TIF

Figure 6.TIF

Figure 7.TIF