longitudinal analysis of built environment and aerosol
TRANSCRIPT

Longitudinal Analysis of Built Environment andAerosol Contamination Associated with IsolatedCOVID-19 Positive IndividualsPatrick Horve
Biology and the Built Environment Center, University of Oregon, Eugene, OR, 97403Leslie Dietz
Biology and the Built Environment Center, University of Oregon, Eugene, OR, 97403Garis Bowles
Biology and the Built Environment Center, University of Oregon, Eugene, OR, 97403Georgia MacCrone
Biology and the Built Environment Center, University of Oregon, Eugene, OR, 97403Andreas Olsen-Martinez
Biology and the Built Environment Center, University of Oregon, Eugene, OR, 97403Dale Northcutt
Energy Studies in Buildings Laboratory, University of Oregon, Eugene, OR, 97403Vincent Moore
Biology and the Built Environment Center, University of Oregon, Eugene, OR, 97403Liliana Barnatan
Biology and the Built Environment Center, University of Oregon, Eugene, OR, 97403Hooman Parhizkar
Energy Studies in Buildings Laboratory, University of Oregon, Eugene, OR, 97403Kevin Van Den Wymelenberg ( [email protected] )
Institute for Health and the Built Environment, University of Oregon, Portland, OR, 97209
Research Article
Keywords: COVID-19, SARS-CoV-2, aerosol, viral load
Posted Date: August 31st, 2021
DOI: https://doi.org/10.21203/rs.3.rs-861942/v1
License: This work is licensed under a Creative Commons Attribution 4.0 International License. Read Full License

Title: Longitudinal Analysis of Built Environment and Aerosol Contamination Associated 1
with Isolated COVID-19 Positive Individuals 2
3
Funding Statement: Funding for this research was partially provided by Thermo Fisher Scientific 4
under award number 4133V1, as well as a confidential gift to the University of Oregon. 5
6
7
8
9
10
11
12
13
14
15
16
17
18
19

Abstract 20
The indoor environment is the primary location for the transmission of severe acute respiratory 21
syndrome coronavirus 2 (SARS-CoV-2), the causative agent of coronavirus disease 2019 (COVID-22
19), largely driven by respiratory particle accumulation in the air and increased connectivity between 23
the individuals occupying indoor spaces. In this study, we aimed to track a cohort of subjects as they 24
occupied a COVID-19 isolation dormitory to better understand the impact of subject and 25
environmental viral load over time, symptoms, and room ventilation on the detectable viral load 26
within a single room. We find that subject samples demonstrate a decrease in overall viral load over 27
time, symptoms significantly impact environmental viral load, and we provide the first real-world 28
evidence for decreased aerosol SARS-CoV-2 load with increasing ventilation, both from mechanical 29
and window sources. These results may guide environmental viral surveillance strategies and be used 30
to better control the spread of SARS-CoV-2 within built environments and better protect those 31
caring for individuals with COVID-19. 32
33
34
35
36
37
38

Introduction 39
The built environment (BE)1,2, or the spaces that we, as humans, have built for ourselves to work in, 40
inhabit, and enjoy life, play an essential role in mitigating the spread of severe acute respiratory 41
syndrome coronavirus 2 (SARS-CoV-2), the causative agent of coronavirus disease 2019 (COVID-42
19)3. SARS-CoV-2 transmission indoors is aided through extended close contact and the 43
accumulation and persistence of aerosolized SARS-CoV-2, largely driven by poor ventilation4–17. 44
Significant effort has gone into the identification of SARS-CoV-2 in a multitude of BE’s6,8,18,18,19,19,20,20–32. 45
However, most efforts to understand the environmental contamination associated with individuals 46
diagnosed with COVID-19 have been performed at a single time point, missing critical information 47
about the longitudinal dynamics of that environmental contamination. Additionally, minimal 48
characterization has been performed to understand how symptoms and BE factors such as 49
ventilation, measured in air changes per hour (ACH), impact the total environmental and aerosolized 50
contamination by SARS-CoV-2 within the BE over time. 51
One common scenario faced by people throughout the world is co-occupation of an indoor space 52
with a COVID-19 positive individual while they themselves are not known to be positive. Three of 53
the major outstanding questions in regard to COVID-19 infections and the built environment 54
include (i) how individuals emit virus into the environment over time, (ii) how different forms of 55
environmental sampling are able to support biosurveillance initiatives, and (iii) and to what degree 56
does ventilation mitigate environmental contamination. In order to better understand the 57
longitudinal dynamics associated with the occupation of the BE when suffering from COVID-19, 58
the impact of ventilation, and the potential role of different surveillance methods, isolation dorm 59
rooms housing residence hall students that tested positive for COVID-19 were sampled throughout 60
the course of the individual’s isolation period, typically allowing for up to 10 days of sample 61
collection. Here, we provide the first real-world experimental evidence for the suppression of 62

aerosol viral loads through the use of increased ACH from exhaust air and increased natural 63
ventilation through the use of windows. Additionally, we demonstrate that symptom type, severity, 64
and presence are predictive factors for the level of environmental contamination observed and that 65
environmental contamination decreases as individuals recover. Additionally, we identified variability 66
in viral shedding over time and provide evidence useful to guide environmental viral surveillance. 67
Results and Discussion 68
Study Population 69
A total of 35 subjects were recruited and consented into the study between January and May 2021. 70
All subjects tested positive for SARS-CoV-2 RNA through shallow nasal swabs and qRT-PCR. The 71
study cohort was made up of 17 males and 18 females between the age of 18 and 24 (Table 1). The 72
majority of individuals in the study cohort identified as White (68.6%) followed by 73
Hispanic/Latino/Spanish (14.3%). A full breakdown of the self-identifying ethnicity of the study 74
cohort can be found in Table 1. 75
Table 1. Demographic data of the study subjects. 76
Sex at Birth Percent (n)
Male 48.6 (17)
Female 51.4 (18)
Ethnicity Percent (n)
White 68.6 (24)
Hispanic/Latino/Spanish 14.3 (5)
Native Hawaiian/Pacific Islander 2.9 (1)
Black 2.9 (1)
Multiple 5.7 (2)
Asian 5.7 (2)

Viral Shedding and Environmental Contamination Associate with Isolation Day 77
In an attempt to assess the viral load dynamics over the course of the study cohort’s time in the 78
isolation dormitory, the mean CT, a proxy for observed total viral load, of each study participant 79
from each location was tracked throughout the course of the isolation period. CT values of subject 80
shallow nasal and mouth swabs were found to be significantly (P < 0.05) associated with day since 81
positive test, with CT values increasing (lower viral load) as time since positive test increases (Figure 82
1). Additionally, significant increases in CT values were observed as time progressed in environmental 83
swabs taken from the study subject’s computer, phone, the settling plate closest to the study 84
participant, and in the active air samples (AerosolSense). Statistically significant increases in the CT 85
values of participant bathroom floors, bathroom exhaust, and far passive air settling plate were not 86
observed, although nearly all sample types trended towards increased CT values over time. 87
Furthermore, environmental samples demonstrated decreasing percent positivity over time (Figure 88
2). 89
Increasing nasal and mouth CT values and decreasing rate of positivity of environmental samples as 90
the isolation period progresses both suggest that decreasing viral load in study participants directly 91
translates to decreased viral load within the space occupied by individuals positive for COVID-19 92
Figure 1). While previous investigations have demonstrated the presence of SARS-CoV-2 RNA in 93
BE’s occupied by COVID-19 positive individuals5,18,23,32–34, this represents the first link between 94
infection stage, subject viral load over time, and environmental viral load. Additionally, we confirm 95
the findings of multiple other studies that have demonstrated the persistence of SARS-CoV-2 96
genetic material in patient-derived samples at the end of a treatment and/or isolation period35,36. The 97
persistence of environmental SARS-CoV-2 genomic material has been cited as a potential limitation 98
in multiple sampling campaigns that utilize surface swabs to assess contamination37,38. The strongest 99
trends in increasing CT values among environmental samples were observed in the phone and 100

computer swabs, and AerosolSense active air samples. In comparison to samples that did not 101
demonstrate a significant increase in CT values over time (bathroom exhaust and bathroom floor), 102
these sampling locations were either cleaned in between sampling (phone and computer) or utilize a 103
fresh substrate during each collection period (AerosolSense). This comparison suggests that relic 104
RNA may compose at least a part of the RNA collected in some environmental surveillance 105
sampling methods and that sampling methods that routinely cleaned or were more resistant to relic 106
RNA collection (such as active air sampling with a fresh substrate) may provide more utility as a 107
surveillance tool against SARS-CoV-2 than typical environmental swabbing campaigns. 108

109
Figure 1. Longitudinal Viral Shedding and Environmental Contamination Dynamics. The mean daily cycle 110 threshold (CT) for each sampling location throughout the course of the participants’ involvement in the study. 111 Individual points represent the mean daily CT value per individual. The black line represents a linear mixed 112 model estimated using a restricted maximum likelihood (REML) approach and including the individual 113 occupying the room as a random effect and the grey area represents the 95% confidence interval for that 114 model. 115

116
Figure 2. Mean daily percent positivity at each sampling location. The percent positivity rate per entry per 117 study subject was calculated and the mean positivity rate of all participants per day enrolled in the study was 118 calculated as the daily percentage rate. The black line represents a linear mixed model estimated using a 119 restricted maximum likelihood (REML) approach and including the individual occupying the room as a 120 random effect and the grey area represents the 95% confidence interval for that model. 121
Symptom Presence Impacts Viral Shedding and Environmental Contamination 122
The presence (or lack thereof) of symptoms associated with COVID-19 positive individuals and 123
associated viral load in patient samples (nasopharyngeal and oral swabs) has been investigated in a 124
multitude of previous articles and significant differences have not been identified in the viral load 125
associated with symptomatic versus asymptomatic COVID-19 infections39–47. However, the 126
relationship between symptomatic infection and environmental contamination has not yet been 127
investigated. Among the symptoms that were reported by the study population, seven symptoms 128
(coughing, watering eyes, sore throat, loss of smell, gastroinstestinal (GI) symptoms, congestion, and 129
brain fog) were found to be significantly associated with altered levels of viral load in the isolation 130
dormitory rooms (Table 2). Increased self-reported coughing, sore throat, loss of smell, and GI 131
symptoms were associated with lower environmental CT values (and thus higher viral loads), with GI 132
symptoms and coughing most strongly correlating with decreased CT values. In comparison, watery 133
eyes, congestion, and brain fog were associated with increased CT values. Coughing while infected 134
with COVID-19 has been estimated to produce significantly more viral particles than normal 135
breathing48. This small cohort study of 35 individuals supports the hypothesis that increased 136
respiratory expulsion from activities such as coughing would result in increased environmental 137
contamination with SARS-CoV-249,50. Furthermore, it is known, through wastewater analysis and 138
sequencing for the surveillance of SARS-CoV-251, that SARS-CoV-2 is readily emitted from and 139
detected in stool samples in nearly half of COVID-19 positive individuals52. Here we observe 140
increased viral load associated with increased GI symptoms, further supporting the potential for a 141
fecal-oral transmission route of SARS-CoV-2 in certain circumstances. Additionally, the other 142
symptoms associated with increased environmental viral load (sore throat and loss of smell) both 143
implicate the upper respiratory tract. Active viral replication has been identified in the upper 144
respiratory tract and suggests that ongoing infection and symptom onset in the upper respiratory 145
tract may indicate increased levels of viral secretion and environmental contamination in buildings53. 146
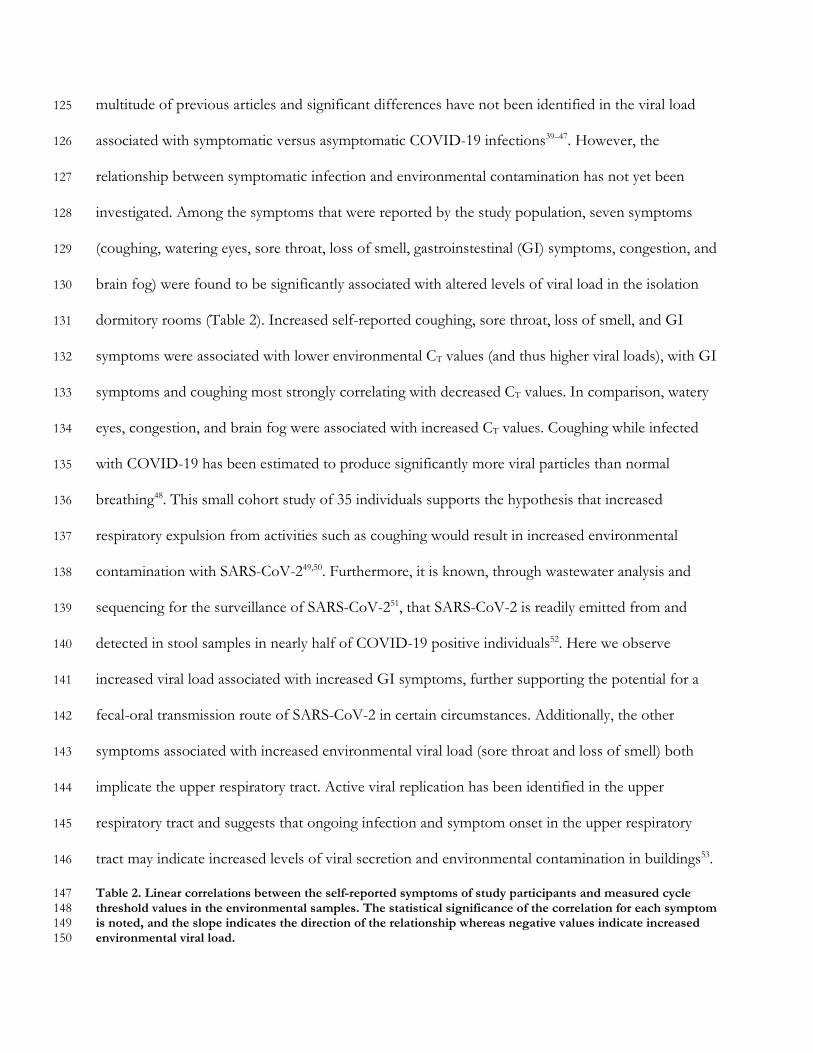
Table 2. Linear correlations between the self-reported symptoms of study participants and measured cycle 147 threshold values in the environmental samples. The statistical significance of the correlation for each symptom 148 is noted, and the slope indicates the direction of the relationship whereas negative values indicate increased 149 environmental viral load. 150

Symptom Correlation Coefficients
Symptom Slope Significance Level
Fever -0.35 Not Significant
Coughing -0.52 < 0.001
Sneezing -0.12 Not Significant
Difficulty Breathing -0.03 Not Significant
Fatigue 0.13 Not Significant
Headache -0.16 Not Significant
Eyes Ache 0.15 Not Significant
Eyes Watering 1.48 < 0.001
Sore Throat -0.30 < 0.05
Distorted Taste 0.06 Not Significant
Loss of Taste 0.01 Not Significant
Distorted Smell 0.00 Not Significant
Loss of Smell -0.13 < 0.01
Ears Ringing 0.37 Not Significant
GI Symptoms -0.93 < 0.01
Congestion 1.00 < 0.001
Brain Fog 0.31 < 0.01
We sought to further understand the potential impact that symptoms play in the transmission of 151
SARS-CoV-2 inside of the BE, and particularly, the impact symptom presence may have on 152
subsequent environmental contamination. As such, each entry into a study participant’s room was 153
queried to determine if the participant had self-reported any symptoms during that visit only. 154
Individual entries were sorted into symptomatic and asymptomatic entries and the CT values from 155
each group were compared. Significantly lower CT values were observed in active air samples 156
collected during entries where the participant reported symptoms (Figure 3a), representing greater 157
aerosolized viral particles present during that collection time. Furthermore, significantly lower CT 158

values were observed in aerosol-based sampling methods (active air samples and passive settling 159
plates) during symptomatic entries (Figure 3b). Lastly, significantly lower CT values were also 160
observed in environmental swab samples collected during symptomatic visits compared to 161
asymptomatic visits (Figure 3c). All together, these results suggest the potential that the presence of 162
symptoms, even periodically in some individuals, contributes to increased viral shedding and 163
environmental contamination with SARS-CoV-2. 164
165
Figure 3. Impact of symptom presence on viral shedding and detection. (a) Boxplots of the observed cycle 166 threshold values for active air samples collected by the AerosolSense sampler from rooms occupied by 167 asymptomatic (yellow) and symptomatic (purple) individuals. (b) Boxplots of observed cycle threshold values 168 for aerosol particulate samples collected by the AerosolSense sampler, passive air settling plate, and bathroom 169 exhaust vents from rooms occupied by asymptomatic (yellow) and symptomatic (purple) individuals. (c) 170 Boxplots of the observed cycle threshold values for environmental swabs collected from the computer, phone, 171 and bathroom floor from rooms occupied by asymptomatic (yellow) and symptomatic (purple) individuals. 172

Additionally, some subjects enrolled in the study demonstrated intermittent negative shallow nasal 173
and oral swabs. To understand whether these intermittent periods of potentially low viral source 174
load further translated to decreased levels of aerosolized viral particles, each entry into a study 175
participant’s room was investigated to determine whether a positive or negative human swab 176
(shallow nasal and oral swabs separately) was associated with that entry. Significantly lower CT values 177
were observed in active air samples collected during entries where the participant returned a positive 178
shallow nasal swab (Figure 4a). This same statistically significant relationship was also observed 179
when grouping samples based upon the result of their oral swabs (Figure 4b). Some intermittent 180
detection of SARS-CoV-2 RNA in the later stages of infection have been previously reported54–56. 181
COVID-19 is unique in that it has been associated with significant numbers of super spreader 182
events11,57–59. It has been suggested that as low as 2% of COVID-19 positive individuals may account 183
for up to 20% of confirmed cases57. Here, we find a potential relationship between intermittent 184
positivity, symptom dynamics, and the detectable viral load of the subject and their environment. 185
We hypothesize that individuals suffering from COVID-19 may undergo transient periods of viral 186
shedding that may contribute (among many other factors) to lack of transmission in some exposure 187
events and super spreader transmission in other exposure events. This potential intermittency of 188
viral shedding underscores the value of high temporal resolution of environmental viral surveillance. 189

190
Figure 4. Potential intermittency of viral shedding and production. (a) Boxplots of the observed cycle 191 threshold values for active air samples collected by the AerosolSense sampler from room entries when the 192 study participant returned a negative shallow nasal swab (yellow) and a positive shallow nasal swab (purple). 193 (b) Boxplots of the observed cycle threshold values for active air samples collected by the AerosolSense 194 sampler from room entries when the study participant returned a negative oral swab (yellow) and a positive 195 oral swab (purple). 196
Built Environment Factors and Environmental Viral Detectivity 197
The BE has been demonstrated to be an area of high risk when there is a COVID-19 positive 198
individual occupying the indoor space60–64. Despite initial guidance that SARS-CoV-2 is transmitted 199
through droplets and close interactions between individuals65, it has become readily apparent that a 200
major transmission method is through aerosolized viral particles that remain suspended in the air for 201
extended periods of time5,6,8–10,14–17. As such, we sought to understand the relationship between a 202
range of air exchange rates in the isolation rooms studied and detectability of aerosolized SARS-203

CoV-2. The rate of exhausted air was measured from each isolation dorm room and the air changes 204
per hour (ACH) were calculated for each room (See Materials and Methods for full details). The 205
ACH from mechanically exhausted air in the isolation dorm rooms ranged from 0.16 ACH to 0.93 206
ACH (Figure 5a). Current American Society of Heating, Refrigerating, and Air-Conditioning 207
Engineers (ASHRAE) guidelines suggest a minimum of 0.35 ACH for multifamily units, 1.7 ACH 208
for retail spaces, and 2.8 ACH for classrooms66. ACH from mechanical exhaust in the isolation 209
rooms was found to be significantly and positively related to observed CT values (P < 0.01), with 210
increased ACH in the room more likely to produce higher CT values, thus lower viral loads (Figure 211
5b). However, a significant decrease in the percent positivity of aerosol samples was not observed (P 212
= 0.43) as ACH increased across study rooms (Figure 5c).. Taken together, these results suggest that, 213
even across a fairly narrow and low range of ACH, increased ventilation rate decreases the 214
detectable aerosolized viral load within enclosed spaces. However, the lack of significance in the 215
decrease in percent positivity suggests that the modest range of ACH values found in this study is 216
not enough to decrease the abundance of viral particles in the enclosed space to an undetectable 217
level, thus suggesting higher ACH is required to support safer indoor congregation. Multiple articles 218
have previously hypothesized that increased ventilation rate would translate to lower airborne viral 219
loads22,67–70. To our knowledge, this study demonstrates the first real-world experimental evidence of 220
increased ventilation within the built environment contributing to decreased aerosolized viral load. 221
One common method for increasing the ventilation that is available in the vast majority of BE’s is 222
the operation of windows. Windows can dramatically increase the overall ACH within buildings and 223
other enclosed spaces71. In this case, opening a dorm room window will decrease the pressure on the 224
mechanical ventilation (the exhaust air fan in the bathroom) and increase the efficiency of air 225
movement by the exhaust fan72. More importantly, opening a window often increases the absolute 226
ACH (not just the measured ACH of the mechanical exhaust, in the room through increased air 227
movement in and out of the open window73. In order to assess the potential impact of window 228
operations on the aerosolized viral load present within the study participant’s rooms, study 229
participants were asked the status of their room windows during the course of the previous sampling 230
period and researchers observed current window operation status at each entry. Samples were split 231
into two groups consisting of (i) the window was open for more than 50% of the sampling period or 232
(ii) the window was open for less than 50% of the sampling period. Samples from aerosol collection 233
methods (AerosolSense and passive settling plates) demonstrated a significant increase in CT values 234
(correlating with a decrease in viral load) when the window was open for more than 50% of the 235
sampling period (Figure 5d). These results suggest that the increased ventilation that is provided 236
from an open window has the ability to reduce the detectable viral load in the room by half (or 237
more) when windows are open (x‾=34.4) compared to when the windows are closed (x‾=33.2). 238
Window opening, as suggested by a variety of previous analyses and reviews69,74–78, appears to 239
provide significant reduction in viral load while being a low-cost and low-labor intervention when 240
thermal control, security, and outdoor contaminants are not a concern. 241

242
Figure 5. Impact of differential ventilation rates on SARS-CoV-2 RNA identification. (a) Distribution of the 243 calculated air exchanges per hour (ACH) from mechanical exhaust across all isolation rooms occupied by 244 study participants. (b) Relationship between the observed cycle threshold (CT) values and the air changes per 245 hour (ACH) from occupied isolation rooms. The black line indicates fit from a linear model to the raw data 246 and the grey area represents the 95% confidence interval for that model. Individual points are colored based on 247 the ACH observed in that sample with darker colors representing lower ACH values and lighter colors 248 representing higher ACH values. (c) Relationship between the observed percent positivity from each entry into 249 a subject room and the air changes per hour (ACH) from occupied isolation rooms. The black line indicates fit 250 from a linear model to the raw data and the grey area represents the 95% confidence interval for that model. 251 Individual points are colored based on the ACH observed in that sample with darker colors representing lower 252 ACH values and lighter colors representing higher ACH values. (d) Boxplots of observed cycle threshold (CT) 253 values of aerosol samples taken during periods when the window was open for more than 50% of the sampling 254 period (yellow) or closed for more than 50% of the sampling period (purple), as recorded during the entry 255 surveys answered by participants. 256
There are multiple limitations to note in our investigation. Our study population, made up of 257
students living in the university residence halls, is inherently not a representative sample of the broad 258
spectrum of individuals that may contract COVID-19. Particularly, our study population is 259
composed of individuals between the ages of 18 and 24. The age of the individual suffering from 260

COVID-19 has been associated with altered levels of detectable SARS-CoV-2 RNA79 and viral 261
shedding dynamics may differ from that seen in our investigation. Furthermore, our symptom and 262
window position results are largely based upon the results of self-reported survey data. This survey 263
data may suffer from inconsistencies and misclassification bias, particularly data pertaining to 264
symptom presence and severity80–83. Lastly, there is a lack of data demonstrating a presence or absence 265
of SARS-CoV-2 viability throughout the course of the study participants’ time in the isolation 266
rooms. SARS-CoV-2 RNA has been demonstrated to remain within patient and environmental 267
samples, even when SARS-CoV-2 viability and infectiousness has ceased84–87. 268
269
Overall, we present a detailed longitudinal analysis of oral, nasal, and environmental viral loads 270
associated with individuals in a quarantine environment. We find that subject samples demonstrate a 271
decrease, but not a ceasing, in overall viral load as their quarantine period progresses. Based upon 272
the self-reported symptoms of study participants, we find that coughing and GI symptoms most 273
strongly correlate with increased environmental contamination, likely through an increase in virus 274
shedding during coughing and bowel activity and movements. Additionally, we demonstrate 275
significant differences in environmental contamination between symptomatic and asymptomatic 276
individuals, as well as between periods of intermittent positive and negative human samples. Lastly, 277
we provide the first real-world experiential evidence for decreased aerosol viral load with increasing 278
mechanical ventilation levels and demonstrate significantly reduced detectable SARS-CoV-2 in study 279
rooms with open windows compared with those with closed windows. These results are directly 280
applicable to those occupying common spaces with an individual known to be positive for COVID-281
19. We demonstrate that even asymptomatic infection with SARS-CoV-2 can yield high levels of 282
environmental contamination. However, we also identified that increasing the total ACH within the 283
space occupied by the COVID-19 positive individual can aid in the reduction of the overall viral 284
load present in that environment. Furthermore, we add to the mounting evidence that SARS-CoV-2 285
is emitted by COVID-19 positive individuals which then disperse into the surrounding space as 286
potentially infectious aerosols which can be monitored through environmental surveillance 287
programs to support awareness and safety. We observe that indoor bioaerosols can be consistently 288
measured with a high-flow bioaerosol sampler and demonstrate utility in biosurveillance and to 289
assess mitigation effectiveness. Ideally, individuals would physically distance themselves from and 290
avoid shared air spaces with a COVID-19 positive individual, ensure the positive individual wears a 291
mask to reduce the quantity of emitted virus, and wear a mask themselves indoors. Ideally, building 292
operators would monitor indoor air for pathogenic bioaerosols and make preparations to increase 293
ventilation when pathogenic bioaerosols are present. 294
295
Materials and Methods 296
Institutional Approval and Data Availability 297
All protocols regarding to the handling of biological materials were reviewed and approved by 298
Advarra Institutional Biosafety Committee (IBC) (Protocol #PROTO202000132). Advarra IBC is 299
an authorized external IBC for the University of Oregon and is registered with the National Institute 300
of Health (NIH). All protocols relating to human subjects involved in the study were reviewed and 301
approved by the University of Oregon Institutional Review Board (IRB) (Protocol #12292020). 302
Subject Recruitment 303
University of Oregon COVID-19 protocols require individuals living in the residence halls to move 304
out of their current residence and occupy an isolation dormitory room during the course of their 305
isolation period (14 days). Individuals positive for COVID-19 were identified through the University 306
of Oregon Monitoring and Assessment Program (MAP)88. Following transfer to the isolation 307

dormitory, individuals were recruited into the program for the duration of their stay at the isolation 308
dormitory or until they wished to be removed from the study. 309
Subject Questionnaire 310
During the first sampling period, study subjects verbally filled out a questionnaire (1st entry 311
questionnaire) that asked participants about their infection timeline, positive test date, age, biological 312
sex, race and ethnicity, recent travel history, lifestyle, medications taken, and symptom onset and 313
severity. Additionally, study subjects verbally completed a followup questionnaire during each 314
subsequent entry into the room to track their symptoms, medications taken, and the status of the 315
study room windows. The symptoms that were tracked included fever, coughing, sneezing, difficulty 316
breathing, fatigue, headache, aching eyes, watering eyes, sore throat, distorted taste, loss of taste, 317
distorted smell, loss of smell, ringing ears, gastrointestinal (GI) symptoms, congestion, and brain fog. 318
Study participants indicated whether or not they were currently experiencing any of the surveyed or 319
other symptoms and the severity on a scale of 1-5, with 5 being the most severe. All survey answers 320
were self-reported by the study participants. 321
Airflow Monitoring 322
The rate of air exhausted from the isolation rooms were determined for each room. The only 323
location which is designed to exhaust air from the rooms is through the exhaust air vent located in 324
the bathroom of each unit or an open window. The room air is supplied from either the building 325
common areas (via a roof-top unit supplying 100% outside air) or the dormitory room windows. 326
The velocity of exhausted air from each room was measured by placing a customized adapter with a 327
three inch diameter outlet that rested against the exhaust air grille structural perimeter. A hot wire 328
anemometer (TSI Incorporated, model #9565) with probe (TSI Incorporated, model #964) 329
measured the velocity of flow at the center. The measurement was converted to volumetric flow rate 330

using the equation 𝑉𝑉𝑉𝑉 = 0.9∗𝜋𝜋∗0.2524 ∗ 𝑉𝑉, where 𝑉𝑉 is the measured velocity at the center in feet per 331
minute, 0.25 is the three inch diameter outlet converted to feet, and 0.9 is the conversion factor 332
accounting for peak flow at the center and averaging flow across the area of the hole. The air 333
changes per hour (ACH) flow rate was calculated using the dimensions of the study rooms as 334
described in the architectural plans and the equation 𝐴𝐴𝐴𝐴𝐻𝐻𝐹𝐹 = 𝑉𝑉𝐹𝐹∗60𝑣𝑣 , where 𝑣𝑣 is the volume of the 335
room in cubic feet, 60 is the minutes in an hour, and 𝑉𝑉𝑉𝑉 is the calculated volumetric flow rate. 336
Measurements were taken with (1) the hall door, exterior window and, bathroom door closed, and 337
(2) the hall door closed and the exterior window and bathroom door open. 338
Sample Collection 339
Samples were collected 3-5 times throughout a day with approximately two hours lapsing between 340
subsequent sampling times. At each entry, both a mouth and shallow nasal swab were collected from 341
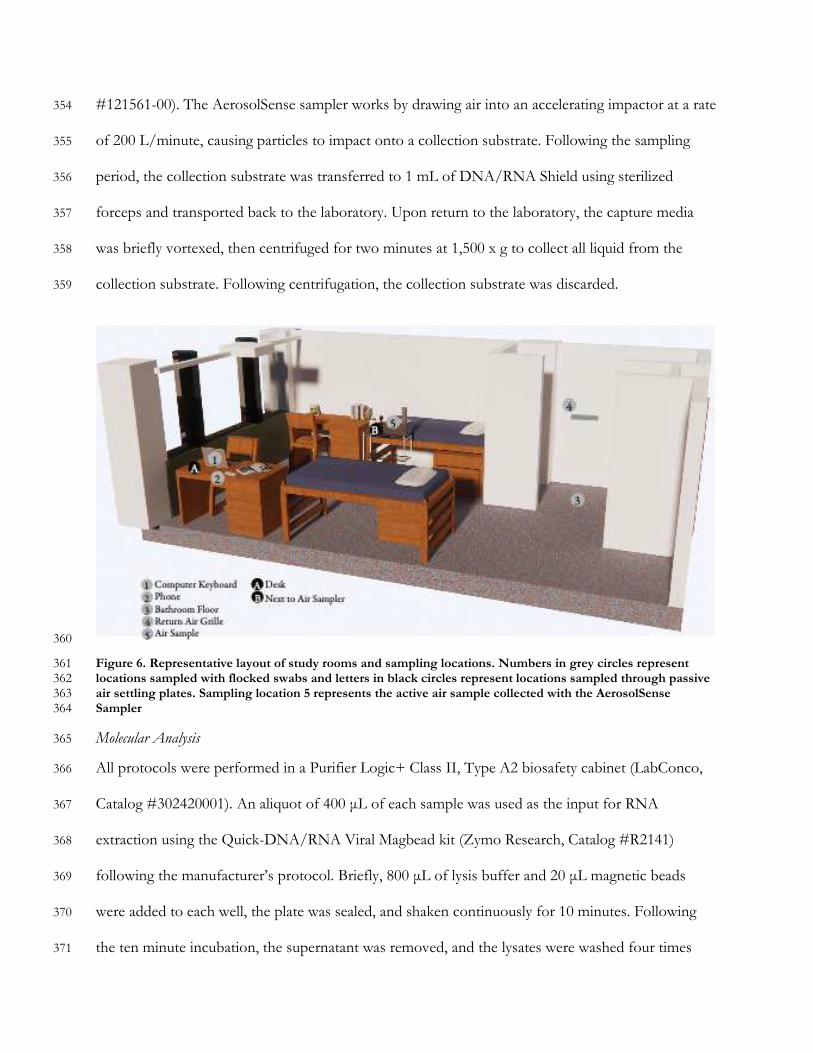
the study participant. Environmental samples were collected through environmental swabs, passive 342
air settling plates, and active air sampling (Figure 6). Environmental swabs were collected from the 343
participant’s cell phone, computer, bathroom floor, and exhaust air grille located within the 344
bathroom. Flocked nylon fiber oropharyngeal swabs (Typenex Medical LLC, Catalog #SW0202) 345
pre-moistened with DNA/RNA Shield (Zymo Research, Catalog #R1100) were used to thoroughly 346
swab the sampling location (sampling area ~600 cm2, except for smaller items such as cellphones) 347
for 15-20 seconds and returned to 1 mL of DNA/RNA Shield. Subject phones and computers were 348
cleaned with bleach wipes following sampling to remove the residue left behind by the DNA/RNA 349
shield. Settled particulates were captured using both components (base and lid) of standard Petri 350
dishes (Corning Scientific). Following the sampling period, both sides of the Petri dish (sampling 351
area ~110 cm2) were swabbed following the protocol described above for environmental swabs. 352
Active air samples were collected using the AerosolSense 2900 sampler (Thermo Scientific, Catalog 353
#121561-00). The AerosolSense sampler works by drawing air into an accelerating impactor at a rate 354
of 200 L/minute, causing particles to impact onto a collection substrate. Following the sampling 355
period, the collection substrate was transferred to 1 mL of DNA/RNA Shield using sterilized 356
forceps and transported back to the laboratory. Upon return to the laboratory, the capture media 357
was briefly vortexed, then centrifuged for two minutes at 1,500 x g to collect all liquid from the 358
collection substrate. Following centrifugation, the collection substrate was discarded. 359
360
Figure 6. Representative layout of study rooms and sampling locations. Numbers in grey circles represent 361 locations sampled with flocked swabs and letters in black circles represent locations sampled through passive 362 air settling plates. Sampling location 5 represents the active air sample collected with the AerosolSense 363 Sampler 364
Molecular Analysis 365
All protocols were performed in a Purifier Logic+ Class II, Type A2 biosafety cabinet (LabConco, 366
Catalog #302420001). An aliquot of 400 μL of each sample was used as the input for RNA 367
extraction using the Quick-DNA/RNA Viral Magbead kit (Zymo Research, Catalog #R2141) 368
following the manufacturer’s protocol. Briefly, 800 μL of lysis buffer and 20 μL magnetic beads 369
were added to each well, the plate was sealed, and shaken continuously for 10 minutes. Following 370
the ten minute incubation, the supernatant was removed, and the lysates were washed four times 371

(1X with MagBead DNA/RNA Wash 1, 1X MagBead with DNA/RNA Wash 2, 2X with 100% 372
ethanol). Nucleic acids were eluted into 50 μL nuclease-free water and stored at -80°C until 373
downstream analysis. Successful RNA extraction was confirmed in each sample through the addition 374
of a 5 μL spike-in of Escherichia coli MS2 bacteriophage into each extraction well. Each extraction 375
plate also contained one extraction control containing nuclease-free water instead of sample. 376
All samples underwent quantitative reverse-transcription polymerase chain reaction (qRT-PCR) 377
analysis using the TaqPath COVID-19 Combo Kit (Thermo Fisher Scientific, Catalog #A47814). 378
This quadruplex qRT-PCR reaction targets the spike (S), nucleocapsid (N), and RNA-dependent 379
RNA polymerase (RdRP/ORF1ab) genomic regions. Additionally, the assay also targets the 380
Escherichia coli MS2 bacteriophage as an internal process control. The reaction mixtures included 5 381
μL TaqPath 1-Step Multiplex Mastermix without ROX (Thermo Fisher Scientific, Catalog 382
#A28521), 9 μL nuclease-free water (Invitrogen, Catalog #4387936), 1 µL COVID-19 Real Time 383
PCR Assay Multiplex Mix (Thermo Fisher Scientific, Catalog #A47814), and 5 µL of template RNA. 384
Thermocycling was performed with the QuantStudio5 (Applied Biosystems) using the following 385
cycling conditions: 25°C for 2 minutes, 53°C for 10 minutes, 95°C for 2 minutes, and 40 cycles of 386
95°C for 3 seconds and 60°C for 30 seconds. Samples were considered positive if amplification was 387
observed in two of three genome targets with a cycle threshold (CT) value less than or equal to 35 388
(CT<35)89. Each qRT-PCR plate contained a positive RNA control, a no-template control (nuclease-389
free water), and three extraction controls. All controls performed as expected. 390
Statistical Analyses 391
Analyses were performed using the statistical programming environment R90. Associations between 392
observed CT values and study subject symptoms were identified through the use of a generalized 393
linear model of the form 𝑦𝑦 = 𝛽𝛽1(𝑥𝑥1) + 𝛽𝛽2(𝑥𝑥2)+. . .𝛽𝛽𝑛𝑛(𝑥𝑥𝑛𝑛 + 𝐸𝐸) where 𝑦𝑦 is the observed CT, 𝛽𝛽𝑖𝑖 394

values are linear regression coefficients for fixed effects 𝑥𝑥𝑖𝑖 , and 𝐸𝐸 is a vector of errors. Significant 395
changes in CT values over time were identified through linear mixed models of the form 𝑦𝑦𝑖𝑖 = 𝑋𝑋𝑖𝑖𝛽𝛽 +396 𝑍𝑍𝑖𝑖𝑢𝑢𝑖𝑖 + 𝜖𝜖𝑖𝑖91,92 using a restricted maximum likelihood (REML) approach and including the individual 397
occupying the room as a random effect. Student’s t-tests were used to compare differences in 398
observed CT values between sampling groups. Differences were considered significant with P < 0.05. 399
Data and Code Availability 400
All data and code supporting this study and required to recreate the analyses are deposited in Github 401
at https://github.com/BioBE/UO-COVID-Dorms. 402
References 403
1. National Academies of Sciences, Engineering, and Medicine et al. Microbiomes of the built 404
environment: A research agenda for indoor microbiology, human health, and buildings. (National 405
Academies Press, 2017). 406
2. Horve, P. F. et al. Building upon current knowledge and techniques of indoor microbiology 407
to construct the next era of theory into microorganisms, health, and the built environment. J. 408
Expo. Sci. Environ. Epidemiol. 1–17 (2019). 409
3. Organization, W. H. & Others. World health organization coronavirus disease (COVID-19) 410
dashboard. (2020). 411
4. Lu, J. et al. COVID-19 outbreak associated with air conditioning in restaurant, guangzhou, 412
china, 2020. Emerging Infectious Diseases 26, 1628–1631 (2020). 413
5. Lednicky, J. A. et al. Collection of SARS-CoV-2 virus from the air of a clinic within a 414
university student health care center and analyses of the viral genomic sequence. Aerosol and 415
Air Quality Research vol. 20 1167–1171 (2020). 416
6. Lednicky, J. A. et al. Viable SARS-CoV-2 in the air of a hospital room with COVID-19 417
patients. medRxiv (2020). 418
7. Hamner, L. et al. High SARS-CoV-2 attack rate following exposure at a choir practice skagit 419
county, washington, march 2020. MMWR. Morbidity and Mortality Weekly Report 69, 606–610 420
(2020). 421
8. Razzini, K. et al. SARS-CoV-2 RNA detection in the air and on surfaces in the COVID-19 422
ward of a hospital in milan, italy. Sci. Total Environ. 742, 140540 (2020). 423

9. Morawska, L. & Cao, J. Airborne transmission of SARS-CoV-2: The world should face the 424
reality. Environ. Int. 139, 105730 (2020). 425
10. Allen, J. G. & Marr, L. C. Recognizing and controlling airborne transmission of SARS‐CoV‐426
2 in indoor environments. Indoor Air vol. 30 557–558 (2020). 427
11. Liu, J., Huang, J. & Xiang, D. Large SARS-CoV-2 outbreak caused by asymptomatic traveler, 428
china. Emerging Infectious Diseases 26, 2260–2263 (2020). 429
12. Speake, H. et al. Flight-associated transmission of severe acute respiratory syndrome 430
coronavirus 2 corroborated by whole-genome sequencing. Emerging Infectious Diseases 26, 431
2872–2880 (2020). 432
13. Katelaris, A. L. et al. Epidemiologic evidence for airborne transmission of SARS-CoV-2 433
during church singing, australia, 2020. Emerging Infectious Diseases 27, 1677–1680 (2021). 434
14. Nissen, K. et al. Long-distance airborne dispersal of SARS-CoV-2 in COVID-19 wards. Sci. 435
Rep. 10, 19589 (2020). 436
15. Somsen, G. A., Rijn, C. van, Kooij, S., Bem, R. A. & Bonn, D. Small droplet aerosols in 437
poorly ventilated spaces and SARS-CoV-2 transmission. Lancet Respir Med 8, 658–659 (2020). 438
16. Dumont-Leblond, N. et al. Positive no-touch surfaces and undetectable SARS-CoV-2 439
aerosols in long-term care facilities: An attempt to understand the contributing factors and 440
the importance of timing in air sampling campaigns. Am. J. Infect. Control (2021). 441
17. Correia, G., Rodrigues, L., Gameiro da Silva, M. & Gonçalves, T. Airborne route and bad 442
use of ventilation systems as non-negligible factors in SARS-CoV-2 transmission. Med. 443
Hypotheses 141, 109781 (2020). 444
18. Ye, G. et al. Environmental contamination of SARS-CoV-2 in healthcare premises. J. Infect. 445
(2020). 446
19. Ryu, B.-H. et al. Environmental contamination of SARS-CoV-2 during the COVID-19 447
outbreak in south korea. Am. J. Infect. Control 48, 875–879 (2020). 448
20. Ahn, J. Y. et al. Environmental contamination in the isolation rooms of COVID-19 patients 449
with severe pneumonia requiring mechanical ventilation or high-flow oxygen therapy. Journal 450
of Hospital Infection vol. 106 570–576 (2020). 451
21. Jin, T. et al. SARS-CoV-2 presented in the air of an intensive care unit (ICU). Sustain Cities Soc 452
65, 102446 (2021). 453
22. Cheng, V. C.-C. et al. Air and environmental sampling for SARS-CoV-2 around hospitalized 454
patients with coronavirus disease 2019 (COVID-19). Infection Control & Hospital Epidemiology 455
41, 1258–1265 (2020). 456
23. Fernández-de-Mera, I. G. et al. Detection of environmental SARS-CoV-2 RNA in a high 457
prevalence setting in spain. Transbound. Emerg. Dis. 68, 1487–1492 (2021). 458

24. Li, Y. H., Fan, Y. Z., Jiang, L. & Wang, H. B. Aerosol and environmental surface monitoring 459
for SARS-CoV-2 RNA in a designated hospital for severe COVID-19 patients. Epidemiol. 460
Infect. 148, e154 (2020). 461
25. Escudero, D. et al. SARS-CoV-2 analysis on environmental surfaces collected in an intensive 462
care unit: Keeping ernest shackleton’s spirit. Intensive Care Med Exp 8, 68 (2020). 463
26. Environmental surface and air sampling in the context of the COVID-19 pandemic. 464
27. Ong, S. W. X. et al. Air, surface environmental, and personal protective equipment 465
contamination by severe acute respiratory syndrome coronavirus 2 (SARS-CoV-2) from a 466
symptomatic patient. JAMA (2020). 467
28. Coil, D. A. et al. SARS-CoV-2 detection and genomic sequencing from hospital surface 468
samples collected at UC davis. medRxiv (2021). 469
29. Coil, D. A. et al. SARS-CoV-2 detection and genomic sequencing from hospital surface 470
samples collected at UC Davis. PLOS ONE 16, e0253578 (2021). 471
30. Borges, J. T., Nakada, L. Y. K., Maniero, M. G. & Guimarães, J. R. SARS-CoV-2: A 472
systematic review of indoor air sampling for virus detection. Environ. Sci. Pollut. Res. Int. 473
(2021). 474
31. Horve, P. F. et al. Identification of SARS-CoV-2 RNA in healthcare heating, ventilation, and 475
air conditioning units. Infectious Diseases (except HIV/AIDS) (2020). 476
32. Hermesch, A. C. et al. Severe acute respiratory syndrome coronavirus 2 (SARS-CoV-2) 477
environmental contamination and childbirth. Obstet. Gynecol. 136, 827–829 (2020). 478
33. Doremalen, N. van et al. Aerosol and surface stability of SARS-CoV-2 as compared with 479
SARS-CoV-1. N. Engl. J. Med. (2020). 480
34. Lednicky, J. A. et al. Viable SARS-CoV-2 in the air of a hospital room with COVID-19 481
patients. Int. J. Infect. Dis. 100, 476–482 (2020). 482
35. Joukar, F. et al. Persistence of SARS-CoV-2 RNA in the nasopharyngeal, blood, urine, and 483
stool samples of patients with COVID-19: a hospital-based longitudinal study. Virology 484
Journal 18, (2021). 485
36. Aranha, C., Patel, V., Bhor, V. & Gogoi, D. Cycle threshold values in RT-PCR to determine 486
dynamics of SARS-CoV-2 viral load: An approach to reduce the isolation period for 487
COVID-19 patients. Journal of Medical Virology (2021) doi:10.1002/jmv.27206. 488
37. Coil, D. A. et al. SARS-CoV-2 detection and genomic sequencing from hospital surface 489
samples collected at UC Davis. PLOS ONE 16, e0253578 (2021). 490
38. Zhou, Y., Zeng, Y. & Chen, C. Presence of SARS-CoV-2 RNA in isolation ward 491
environment 28 days after exposure. International Journal of Infectious Diseases 97, 258–259 492
(2020). 493

39. Lavezzo, E. et al. Suppression of a SARS-CoV-2 outbreak in the Italian municipality of Vo’. 494
Nature 584, 425–429 (2020). 495
40. Finelli, C. & Parisi, S. The clinical impact of COVID-19 epidemic in the hematologic setting. 496
Advances in Biological Regulation 77, 100742 (2020). 497
41. Arons, M. M. et al. Presymptomatic SARS-CoV-2 Infections and Transmission in a Skilled 498
Nursing Facility. New England Journal of Medicine 382, 2081–2090 (2020). 499
42. Zhou, R. et al. Viral dynamics in asymptomatic patients with COVID-19. International Journal 500
of Infectious Diseases 96, 288–290 (2020). 501
43. Wei, W. E. et al. Presymptomatic transmission of SARS-CoV-2 singapore, january 23march 502
16, 2020. MMWR. Morbidity and Mortality Weekly Report 69, 411–415 (2020). 503
44. Bernal, J. L. et al. Transmission dynamics of COVID-19 in household and community 504
settings in the united kingdom. (2020). 505
45. Decker, A. et al. Prolonged SARS-CoV-2 shedding and mild course of COVID-19 in a 506
patient after recent heart transplantation. American Journal of Transplantation 20, 3239–3245 507
(2020). 508
46. Folgueira, M. D., Luczkowiak, J., Lasala, F., Pérez-Rivilla, A. & Delgado, R. Persistent 509
SARS-CoV-2 replication in severe COVID-19. (2020). 510
47. van Kampen, J. J. A. et al. Shedding of infectious virus in hospitalized patients with 511
coronavirus disease-2019 (COVID-19): Duration and key determinants. (2020). 512
48. Riediker, M. & Tsai, D.-H. Estimation of Viral Aerosol Emissions From Simulated 513
Individuals With Asymptomatic to Moderate Coronavirus Disease 2019. JAMA Network 514
Open 3, e2013807 (2020). 515
49. Wang, Y., Xu, G. & Huang, Y.-W. Modeling the load of SARS-CoV-2 virus in human 516
expelled particles during coughing and speaking. PLOS ONE 15, e0241539 (2020). 517
50. Riediker, M. & Tsai, D.-H. Estimation of Viral Aerosol Emissions From Simulated 518
Individuals With Asymptomatic to Moderate Coronavirus Disease 2019. JAMA Network 519
Open 3, e2013807 (2020). 520
51. Peccia, J. et al. Measurement of SARS-CoV-2 RNA in wastewater tracks community 521
infection dynamics. Nature Biotechnology 38, 1164–1167 (2020). 522
52. Parasa, S. et al. Prevalence of Gastrointestinal Symptoms and Fecal Viral Shedding in 523
Patients With Coronavirus Disease 2019. JAMA Network Open 3, e2011335 (2020). 524
53. V’kovski, P. et al. Disparate temperature-dependent virushost dynamics for SARS-CoV-2 525
and SARS-CoV in the human respiratory epithelium. PLOS Biology 19, e3001158 (2021). 526
54. AlJishi, J. M. & Al-Tawfiq, J. A. Intermittent viral shedding in respiratory samples of patients 527
with SARS-CoV-2: observational analysis with infection control implications. Journal of 528
Hospital Infection 107, 98–100 (2021). 529

55. Li, N., Wang, X. & Lv, T. Prolonged SARS-CoV-2 RNA shedding: Not a rare phenomenon. 530
Journal of Medical Virology 92, 2286–2287 (2020). 531
56. Liu, W.-D. et al. Prolonged virus shedding even after seroconversion in a patient with 532
COVID-19. Journal of Infection 81, 318–356 (2020). 533
57. Lau, M. S. Y. et al. Characterizing superspreading events and age-specific infectiousness of 534
SARS-CoV-2 transmission in Georgia, USA. Proceedings of the National Academy of Sciences 117, 535
22430–22435 (2020). 536
58. Parhizkar, H., Van Den Wymelenberg, K., Haas, C. & Corsi, R. A quantitative risk 537
estimation platform for indoor aerosol transmission of COVID-19. (2021). 538
59. Majra, D., Benson, J., Pitts, J. & Stebbing, J. SARS-CoV-2 (COVID-19) superspreader 539
events. J. Infect. 82, 36–40 (2021). 540
60. Hamner, L. High SARS-CoV-2 attack rate following exposure at a choir practice—skagit 541
county, washington, march 2020. MMWR Morb. Mortal. Wkly. Rep. 69, (2020). 542
61. Jianyun Lu et al. COVID-19 outbreak associated with air conditioning in restaurant, 543
guangzhou, china, 2020. Emerging Infectious Disease journal 26, (2020). 544
62. Speake, H. et al. Flight-associated transmission of severe acute respiratory syndrome 545
coronavirus 2 corroborated by whole-genome sequencing. Emerging Infectious Diseases 26, 546
2872–2880 (2020). 547
63. Katelaris, A. L. et al. Epidemiologic evidence for airborne transmission of SARS-CoV-2 548
during church singing, australia, 2020. Emerging Infectious Diseases 27, 1677–1680 (2021). 549
64. Thanh, H. N. et al. Outbreak investigation for COVID-19 in northern Vietnam. The Lancet 550
Infectious Diseases 20, 535–536 (2020). 551
65. Escandón, K. et al. COVID-19 false dichotomies and a comprehensive review of the 552
evidence regarding public health, COVID-19 symptomatology, SARS-CoV-2 transmission, 553
mask wearing, and reinfection. BMC Infectious Diseases 21, (2021). 554
66. The American Society of Heating, Refrigerating and Air Condition Engineers, Inc. 555
(ASHRAE). Ventilation of health care facilities (ANSI/ASHRAE/ASHE standard 170-2017). 556
(2017). 557
67. Allen, J. G. & Ibrahim, A. M. Indoor Air Changes and Potential Implications for SARS-558
CoV-2 Transmission. JAMA 325, 2112 (2021). 559
68. Chia, P. Y. et al. Detection of air and surface contamination by SARS-CoV-2 in hospital 560
rooms of infected patients. Nature Communications 11, (2020). 561
69. Dietz, L. et al. 2019 Novel Coronavirus (COVID-19) Pandemic: Built Environment 562
Considerations To Reduce Transmission. mSystems 5, (2020). 563
70. Klompas, M., Baker, M. A. & Rhee, C. Airborne Transmission of SARS-CoV-2. JAMA 324, 564
441 (2020). 565

71. Howard-Reed, C., Wallace, L. A. & Ott, W. R. The Effect of Opening Windows on Air 566
Change Rates in Two Homes. Journal of the Air & Waste Management Association 52, 147–159 567
(2002). 568
72. Qian, H. et al. Natural ventilation for reducing airborne infection in hospitals. Building and 569
Environment 45, 559–565 (2010). 570
73. Escombe, A. R. et al. Natural Ventilation for the Prevention of Airborne Contagion. PLoS 571
Medicine 4, e68 (2007). 572
74. Morawska, L. et al. How can airborne transmission of COVID-19 indoors be minimised? 573
Environment International 142, 105832 (2020). 574
75. Nembhard, M. D., Burton, D. J. & Cohen, J. M. Ventilation use in nonmedical settings 575
during COVID-19: Cleaning protocol, maintenance, and recommendations. Toxicology and 576
Industrial Health 36, 644–653 (2020). 577
76. Mathai, V., Das, A., Bailey, J. A. & Breuer, K. Airflows inside passenger cars and 578
implications for airborne disease transmission. Science Advances 7, eabe0166 (2020). 579
77. Bhagat, R. K., Davies Wykes, M. S., Dalziel, S. B. & Linden, P. F. Effects of ventilation on 580
the indoor spread of COVID-19. Journal of Fluid Mechanics 903, (2020). 581
78. Jarvis, M. C. Aerosol transmission of SARS-CoV-2: Physical principles and implications. 582
Frontiers in Public Health 8, (2020). 583
79. Zhou, C. et al. Impact of age on duration of viral RNA shedding in patients with COVID-19. 584
Aging (2020) doi:10.18632/aging.104114. 585
80. Daniali, H. & Flaten, M. A. What psychological factors make individuals believe they are 586
infected by coronavirus 2019? Frontiers in Psychology 12, (2021). 587
81. Kluytmans-van den Bergh, M. F. Q. et al. Prevalence and Clinical Presentation of Health 588
Care Workers With Symptoms of Coronavirus Disease 2019 in 2 Dutch Hospitals During an 589
Early Phase of the Pandemic. JAMA Network Open 3, e209673 (2020). 590
82. Nomura, S. et al. An assessment of self-reported COVID-19 related symptoms of 227,898 591
users of a social networking service in Japan: Has the regional risk changed after the 592
declaration of the state of emergency? The Lancet Regional Health - Western Pacific 1, 100011 593
(2020). 594
83. Merckelbach, H., Dandachi-FitzGerald, B., van Helvoort, D., Jelicic, M. & Otgaar, H. When 595
Patients Overreport Symptoms: More Than Just Malingering. Current Directions in Psychological 596
Science 28, 321–326 (2019). 597
84. Zhang, Y. et al. Prevalence and Persistent Shedding of Fecal SARS-CoV-2 RNA in Patients 598
With COVID-19 Infection: A Systematic Review and Meta-analysis. Clinical and Translational 599
Gastroenterology 12, e00343 (2021). 600
85. Rawlings, S. A. et al. No Evidence of SARS-CoV-2 Seminal Shedding Despite SARS-CoV-2 601
Persistence in the Upper Respiratory Tract. Open Forum Infectious Diseases 7, (2020). 602

86. Yang, J.-R. et al. Persistent viral RNA positivity during the recovery period of a patient with 603
SARS-CoV-2 infection. Journal of Medical Virology 92, 1681–1683 (2020). 604
87. Kang, H., Wang, Y., Tong, Z. & Liu, X. Retest positive for SARS-CoV-2 RNA of 605
“recovered” patients with COVID-19: Persistence, sampling issues, or re-infection? Journal of 606
Medical Virology 92, 2263–2265 (2020). 607
88. University of Oregon. Monitoring and assessment program (MAP). 608
89. TaqPath COVID-19 combo kit - instructions for use. 609
90. Team, R. C. & Others. R: A language and environment for statistical computing. (2013). 610
91. Laird, N. M. & Ware, J. H. Random-effects models for longitudinal data. Biometrics 38, 963–611
974 (1982). 612
92. Raudenbush, S. W. & Bryk, A. S. Hierarchical linear models: Applications and data analysis methods. 613
(SAGE, 2002). 614
615
Acknowledgements 616
The authors would like to thank Chuck Williams and Tony Schaffer, University of Oregon, for their 617
aid in forming a relationship with Thermo Fisher Scientific. The authors would like to thank 618
countless staff members from the University of Oregon. The authors would like to acknowledge the 619
tireless team at BioBE for all of their help, including Surbhi Nahata, Kate Qi, Jackson Mestler, Dan 620
Richards, Kathrine Tush, Liliya Zagorski, and Ellie Thacker. Most importantly, we would like to 621
extend a special thanks to the study participants who welcomed us during a very stressful event in 622
their lives. 623
Author Contributions 624
KGVDW performed funding acquisition and managed the investigation team. PFH, LGD, and 625
KGVDW conceived of project scope and methodology. KGVDW and LGD enrolled and 626
consented study participants. GB and PFH performed data curation and initial data exploration. 627
PFH developed final analysis scripts, performed final analysis, and created visualizations. PFH, 628

LGD, GB, GM, AOM, DN, VM, LB, and HP collected field samples and performed laboratory 629
analyses. PFH developed the original manuscript with direction and input from KGVDW. LGD, 630
GB, GM, AOM, DN, VM, LB, HP, and KGVDW provided manuscript revisions and edits on 631
subsequent manuscript drafts. 632
Competing Interests Statement 633
KGVDW has a company called Duktile through which he provides healthy building consulting, 634
including consulting related to viral pathogens, and he serves as a scientific advisor to EnviralTech, a 635
company that conducts viral surface surveillance, including in senior care facilities. No other authors 636
have any competing interests to declare. 637