long-term radio monitoring of sn 1993j - core.ac.uk · long-term radio monitoring of sn 1993j kurt...
TRANSCRIPT

LONG-TERM RADIO MONITORING OF SN 1993J
Kurt W. Weiler
Naval Research Laboratory, Code 7210, Washington, DC 20375-5351; [email protected]
Christopher L. Williams1
Naval Research Laboratory, Code 7213, Washington, DC 20375-5351; [email protected]
Nino Panagia2,3
Space Telescope Science Institute, 3700 San Martin Drive, Baltimore, MD 21218; [email protected]
Christopher J. Stockdale and Matthew T. Kelley
Marquette University, Physics Department, P.O. Box 1881, Milwaukee, WI 53214-1881; [email protected];
Richard A. Sramek
P.O. Box 0, National Radio Astronomy Observatory, Socorro, NM 87801; [email protected]
Schuyler D. Van Dyk
IPAC/California Institute of Technology, Mail Code 100-22, Pasadena, CA 91125; [email protected]
and
J. M. Marcaide
Departamento de Astronomia, Universitat de Valencia, 46100 Burjassot, Spain; [email protected]
Received 2007 March 6; accepted 2007 September 7
ABSTRACT
We present our extensive observations of the radio emission from supernova (SN) 1993J, in M81 (NGC 3031),made with the Very Large Array, at 90, 20, 6, 3.6, 2, 1.2, and 0.7 cm, as well as numerous measurements from othertelescopes and at other wavelengths. The combined data set constitutes probably the most detailed set of measure-ments ever established for any SN outside of the Local Group in any wavelength range. The radio emission evolvesregularly in both time and frequency, and the usual interpretation in terms of shock interaction with a circumstellarmedium (CSM) formed by a pre-supernova stellar wind describes the observations rather well. However, (1) Thehighest frequency measurements at 85Y110 GHz at early times (<40 days) are not well fitted by the parameteriza-tion which describes the centimeter wavelength measurements. (2) At midcentimeter wavelengths there is often deviationfrom the fitted radio light curves. (3) At a time �3100 days after shock breakout, the decline rate of the radio emissionsteepens from (tþ�) � � �0:7 to�2.7 without change in the spectral index (�þ�; � � �0:81); however, this declineis best described not as a power-law, but as an exponential decay with an e-folding time of �1100 days. (4) The bestoverall fit to all of the data is a model including both nonthermal synchrotron self-absorption (SSA) and thermal free-free absorbing (FFA) components at early times, evolving to a constant spectral index, optically thin decline rate untilthe break. (5) The radio andX-ray light curves display quite similar behavior and both suggest a sudden increase in thesupernova progenitor mass-loss rate occurred at �8000 yr prior to shock breakout.
Subject headinggs: galaxies: individual (NGC 3031, M81) — radio continuum: stars — stars: mass loss —supernovae: general — supernovae: individual (SN 1993J)
1. INTRODUCTION
SN 1993J [R:A: (J2000:0) ¼ 9h55m24:7740s � 0:0006s,decl: (J2000:0) ¼ þ69
�01013:70000 � 0:00300; Marcaide et al.
1993a] in M81 (NGC 3031) was discovered at magnitude V �11:80 mag on 1993 March 28.91 (Ripero et al. 1993) and byMarch 30, at maximum optical magnitude V ¼ 10:70 mag, hadbecome the brightest supernova (SN) in the northern hemispheresince SN 1954A. Hydrogen was soon identified in its opticalspectrum, classifying it as a Type II SN (SNII; see, e.g., Gomez1993; Andrillat et al. 1993; Filippenko et al. 1993b).
From the outset, SN 1993J displayed unusual characteristicsfor a SNII. The visual light curve was markedly different from
both the SNIIL ( linear) and SNIIP (plateau) subtypes in that itexhibited a second maximum �17 days after the first one (vanDriel et al. 1993). Its unusual light curve and spectrum werequickly interpreted by Podsiadlowski et al. (1993), Nomoto et al.(1993), and Swartz et al. (1993) as implying a red supergiantprogenitor with a thin hydrogen envelope which would spectrallyevolve from resembling a SNII to resembling a SNIb, therebysuggesting a SNIIb classification for SN 1993J. Continuing ob-servations of visual spectra by Filippenko et al. (1993a) confirmedthis transition.
Due to its proximity (3:63 � 0:34Mpc; Freedman et al.1994)and the fact that SNeII are expected to be strong radio emitters(Weiler et al.1989), Sramek et al. (1993) made very early attemptswith the Very Large Array (VLA)4 to detect the SN. After estab-lishing upper limits at 3.6 and 20 cm on UT 1993 March 31.07
1 Current address: Massachusetts Institute of Technology, Kavli Institute forAstrophysics and Space Research, Cambridge, MA 02139.
2 INAF-Osservatorio Astrofisico de Catania, Via S. Sofia 78, I-95123 Cata-nia, Italy.
3 Supernova Ltd., Olde Yard Village #131, Northsound Road, Virgin Gorda,British Virgin Islands.
4 The VLA telescope of the National Radio Astronomy Observatory is op-erated by Associated Universities, Inc., under a cooperative agreement with theNational Science Foundation.
1959
The Astrophysical Journal, 671:1959Y1980, 2007 December 20
# 2007. The American Astronomical Society. All rights reserved. Printed in U.S.A.
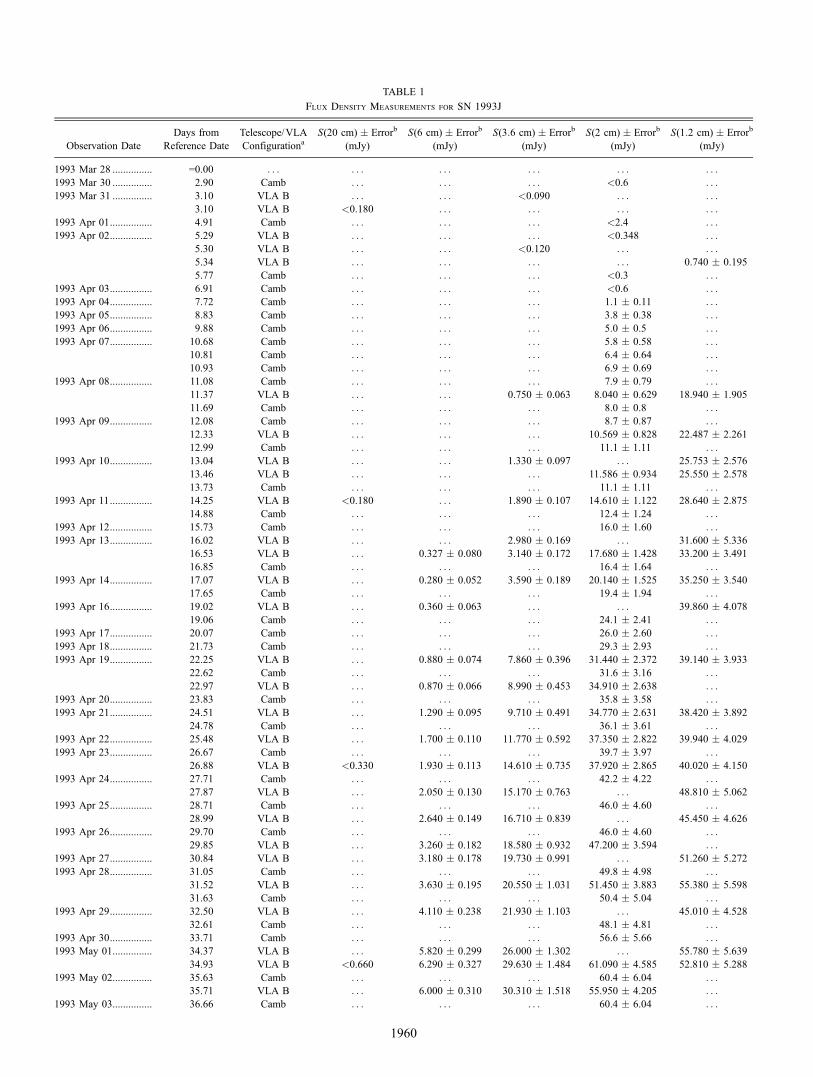
TABLE 1
Flux Density Measurements for SN 1993J
Observation Date
Days from
Reference Date
Telescope/VLA
ConfigurationaS(20 cm) � Errorb
(mJy)
S(6 cm) � Errorb
(mJy)
S(3:6 cm) � Errorb
(mJy)
S(2 cm) � Errorb
(mJy)
S(1:2 cm) � Errorb
(mJy)
1993 Mar 28 ............... =0.00 . . . . . . . . . . . . . . . . . .
1993 Mar 30 ............... 2.90 Camb . . . . . . . . . <0.6 . . .
1993 Mar 31 ............... 3.10 VLA B . . . . . . <0.090 . . . . . .3.10 VLA B <0.180 . . . . . . . . . . . .
1993 Apr 01................ 4.91 Camb . . . . . . . . . <2.4 . . .
1993 Apr 02................ 5.29 VLA B . . . . . . . . . <0.348 . . .5.30 VLA B . . . . . . <0.120 . . . . . .
5.34 VLA B . . . . . . . . . . . . 0.740 � 0.195
5.77 Camb . . . . . . . . . <0.3 . . .
1993 Apr 03................ 6.91 Camb . . . . . . . . . <0.6 . . .1993 Apr 04................ 7.72 Camb . . . . . . . . . 1.1 � 0.11 . . .
1993 Apr 05................ 8.83 Camb . . . . . . . . . 3.8 � 0.38 . . .
1993 Apr 06................ 9.88 Camb . . . . . . . . . 5.0 � 0.5 . . .
1993 Apr 07................ 10.68 Camb . . . . . . . . . 5.8 � 0.58 . . .10.81 Camb . . . . . . . . . 6.4 � 0.64 . . .
10.93 Camb . . . . . . . . . 6.9 � 0.69 . . .
1993 Apr 08................ 11.08 Camb . . . . . . . . . 7.9 � 0.79 . . .
11.37 VLA B . . . . . . 0.750 � 0.063 8.040 � 0.629 18.940 � 1.905
11.69 Camb . . . . . . . . . 8.0 � 0.8 . . .
1993 Apr 09................ 12.08 Camb . . . . . . . . . 8.7 � 0.87 . . .
12.33 VLA B . . . . . . . . . 10.569 � 0.828 22.487 � 2.261
12.99 Camb . . . . . . . . . 11.1 � 1.11 . . .
1993 Apr 10................ 13.04 VLA B . . . . . . 1.330 � 0.097 . . . 25.753 � 2.576
13.46 VLA B . . . . . . . . . 11.586 � 0.934 25.550 � 2.578
13.73 Camb . . . . . . . . . 11.1 � 1.11 . . .1993 Apr 11................ 14.25 VLA B <0.180 . . . 1.890 � 0.107 14.610 � 1.122 28.640 � 2.875
14.88 Camb . . . . . . . . . 12.4 � 1.24 . . .
1993 Apr 12................ 15.73 Camb . . . . . . . . . 16.0 � 1.60 . . .
1993 Apr 13................ 16.02 VLA B . . . . . . 2.980 � 0.169 . . . 31.600 � 5.336
16.53 VLA B . . . 0.327 � 0.080 3.140 � 0.172 17.680 � 1.428 33.200 � 3.491
16.85 Camb . . . . . . . . . 16.4 � 1.64 . . .
1993 Apr 14................ 17.07 VLA B . . . 0.280 � 0.052 3.590 � 0.189 20.140 � 1.525 35.250 � 3.540
17.65 Camb . . . . . . . . . 19.4 � 1.94 . . .
1993 Apr 16................ 19.02 VLA B . . . 0.360 � 0.063 . . . . . . 39.860 � 4.078
19.06 Camb . . . . . . . . . 24.1 � 2.41 . . .
1993 Apr 17................ 20.07 Camb . . . . . . . . . 26.0 � 2.60 . . .1993 Apr 18................ 21.73 Camb . . . . . . . . . 29.3 � 2.93 . . .
1993 Apr 19................ 22.25 VLA B . . . 0.880 � 0.074 7.860 � 0.396 31.440 � 2.372 39.140 � 3.933
22.62 Camb . . . . . . . . . 31.6 � 3.16 . . .
22.97 VLA B . . . 0.870 � 0.066 8.990 � 0.453 34.910 � 2.638 . . .1993 Apr 20................ 23.83 Camb . . . . . . . . . 35.8 � 3.58 . . .
1993 Apr 21................ 24.51 VLA B . . . 1.290 � 0.095 9.710 � 0.491 34.770 � 2.631 38.420 � 3.892
24.78 Camb . . . . . . . . . 36.1 � 3.61 . . .1993 Apr 22................ 25.48 VLA B . . . 1.700 � 0.110 11.770 � 0.592 37.350 � 2.822 39.940 � 4.029
1993 Apr 23................ 26.67 Camb . . . . . . . . . 39.7 � 3.97 . . .
26.88 VLA B <0.330 1.930 � 0.113 14.610 � 0.735 37.920 � 2.865 40.020 � 4.150
1993 Apr 24................ 27.71 Camb . . . . . . . . . 42.2 � 4.22 . . .27.87 VLA B . . . 2.050 � 0.130 15.170 � 0.763 . . . 48.810 � 5.062
1993 Apr 25................ 28.71 Camb . . . . . . . . . 46.0 � 4.60 . . .
28.99 VLA B . . . 2.640 � 0.149 16.710 � 0.839 . . . 45.450 � 4.626
1993 Apr 26................ 29.70 Camb . . . . . . . . . 46.0 � 4.60 . . .29.85 VLA B . . . 3.260 � 0.182 18.580 � 0.932 47.200 � 3.594 . . .
1993 Apr 27................ 30.84 VLA B . . . 3.180 � 0.178 19.730 � 0.991 . . . 51.260 � 5.272
1993 Apr 28................ 31.05 Camb . . . . . . . . . 49.8 � 4.98 . . .
31.52 VLA B . . . 3.630 � 0.195 20.550 � 1.031 51.450 � 3.883 55.380 � 5.598
31.63 Camb . . . . . . . . . 50.4 � 5.04 . . .
1993 Apr 29................ 32.50 VLA B . . . 4.110 � 0.238 21.930 � 1.103 . . . 45.010 � 4.528
32.61 Camb . . . . . . . . . 48.1 � 4.81 . . .1993 Apr 30................ 33.71 Camb . . . . . . . . . 56.6 � 5.66 . . .
1993 May 01............... 34.37 VLA B . . . 5.820 � 0.299 26.000 � 1.302 . . . 55.780 � 5.639
34.93 VLA B <0.660 6.290 � 0.327 29.630 � 1.484 61.090 � 4.585 52.810 � 5.288
1993 May 02............... 35.63 Camb . . . . . . . . . 60.4 � 6.04 . . .35.71 VLA B . . . 6.000 � 0.310 30.310 � 1.518 55.950 � 4.205 . . .
1993 May 03............... 36.66 Camb . . . . . . . . . 60.4 � 6.04 . . .
1960

TABLE 1—Continued
Observation Date
Days from
Reference Date
Telescope/VLA
ConfigurationaS(20 cm) � Errorb
(mJy)
S(6 cm) � Errorb
(mJy)
S(3:6 cm) � Errorb
(mJy)
S(2 cm) � Errorb
(mJy)
S(1:2 cm) � Errorb
(mJy)
1993 May 04............... 37.27 VLA B . . . 8.060 � 0.406 33.320 � 1.668 67.320 � 5.066 62.900 � 6.327
37.78 Camb . . . . . . . . . 65.4 � 6.54 . . .
1993 May 05............... 38.79 Camb . . . . . . . . . 63.1 � 6.31 . . .
1993 May 06............... 39.79 Camb . . . . . . . . . 65.7 � 6.57 . . .
1993 May 07............... 40.11 VLA B . . . 10.510 � 0.529 37.070 � 1.854 67.440 � 5.074 53.640 � 5.396
40.79 Camb . . . . . . . . . 65.7 � 6.57 . . .
1993 May 09............... 42.78 Camb . . . . . . . . . 64.0 � 6.40 . . .
1993 May 11............... 44.74 VLA B/C . . . 15.550 � 0.785 52.100 � 2.611 69.900 � 5.249 46.700 � 4.691
1993 May 12............... 45.71 Camb . . . . . . . . . 70.4 � 7.04 . . .
1993 May 13............... 46.74 Camb . . . . . . . . . 70.9 � 7.09 . . .
1993 May 14............... 47.20 VLA B/C . . . 18.170 � 0.915 59.030 � 2.960 77.150 � 5.805 61.070 � 6.169
47.73 Camb . . . . . . . . . 73.5 � 7.35 . . .1993 May 16............... 49.70 Camb . . . . . . . . . 71.0 � 7.10 . . .
49.86 VLA B/C <1.903 22.100 � 1.110 . . . . . . . . .
1993 May 17............... 50.00 VLAc . . . . . . 63.0 � 3.2 . . . . . .
50.13 VLA B/C . . . . . . 61.910 � 3.099 74.400 � 5.582 54.610 � 5.470
50.69 Camb . . . . . . . . . 70.2 � 7.02 . . .
1993 May 19............... 52.76 Camb . . . . . . . . . 71.4 � 7.14 . . .
1993 May 20............... 53.17 VLA B/C <1.045 25.819 � 1.298 63.900 � 3.201 72.698 � 5.474 54.749 � 5.502
1993 May 21............... 54.68 Camb . . . . . . . . . 72.0 � 7.20 . . .
1993 May 22............... 55.65 Camb . . . . . . . . . 72.6 � 7.26 . . .
1993 May 23............... 56.65 Camb . . . . . . . . . 73.7 � 7.37 . . .
1993 May 24............... 57.68 Camb . . . . . . . . . 76.7 � 7.67 . . .1993 May 25............... 58.67 Camb . . . . . . . . . 71.2 � 7.12 . . .
58.99 VLA B/C <0.613 34.560 � 1.734 77.920 � 3.898 79.480 � 5.979 67.480 � 6.810
1993 May 26............... 59.66 Camb . . . . . . . . . 74.1 � 7.41 . . .
1993 May 30............... 63.04 VLA B/C . . . 40.000 � 2.007 81.500 � 4.080 76.2 � 5.726 53.000 � 5.342
1993 Jun 01 ................ 65.72 Camb . . . . . . . . . 77.2 � 7.72 . . .
1993 Jun 02 ................ 66.62 Camb . . . . . . . . . 77.9 � 7.79 . . .
1993 Jun 03 ................ 67.57 Camb . . . . . . . . . 75.9 � 7.59 . . .
1993 Jun 04 ................ 68.06 VLA B/C <1.035 43.970 � 2.220 . . . 65.593 � 4.960 47.200 � 4.759
1993 Jun 06 ................ 70.71 Camb . . . . . . . . . 76.9 � 7.69 . . .
1993 Jun 07 ................ 71.85 Camb . . . . . . . . . 76.4 � 7.64 . . .
1993 Jun 09 ................ 73.71 Camb . . . . . . . . . 78.2 � 7.82 . . .1993 Jun 10 ................ 74.70 Camb . . . . . . . . . 78.0 � 7.80 . . .
1993 Jun 11 ................ 75.06 VLA C 0.650 � 0.103 56.330 � 2.820 90.740 � 4.538 77.270 � 5.808 51.140 � 5.157
1993 Jun 13 ................ 77.69 Camb . . . . . . . . . 72.9 � 7.29 . . .
1993 Jun 18 ................ 82.92 VLA C 1.220 � 0.141 70.740 � 3.572 108.980 � 5.472 74.920 � 5.641 . . .1993 Jun 20 ................ 84.59 Camb . . . . . . . . . 67.9 � 6.79 . . .
1993 Jun 21 ................ 85.57 Camb . . . . . . . . . 70.9 � 7.09 . . .
1993 Jun 22 ................ 86.60 Camb . . . . . . . . . 71.3 � 7.13 . . .
1993 Jun 23 ................ 87.46 Camb . . . . . . . . . 72.0 � 7.20 . . .1993 Jun 24 ................ 88.77 Camb . . . . . . . . . 72.2 � 7.22 . . .
1993 Jun 25 ................ 89.75 VLA C 2.850 � 0.314 79.780 � 4.018 101.370 � 5.094 75.860 � 5.695 51.820 � 5.212
1993 Jul 01 ................. 95.22 VLA C 2.940 � 0.330 87.200 � 4.379 102.730 � 5.138 73.660 � 5.539 44.850 � 4.552
95.64 Camb . . . . . . . . . 75.0 � 7.50 . . .
1993 Jul 07 ................. 101.82 Camb . . . . . . . . . 69.1 � 6.91 . . .
1993 Jul 08 ................. 102.66 Camb . . . . . . . . . 70.0 � 7.00 . . .
102.76 VLA C 4.090 � 0.436 102.670 � 5.142 129.360 � 6.472 . . . . . .1993 Jul 13 ................. 107.77 VLA C 6.840 � 0.694 111.420 � 5.583 134.220 � 6.716 89.190 � 6.718 . . .
1993 Jul 19 ................. 113.02 VLA C 6.520 � 0.657 104.370 � 5.223 108.630 � 5.434 72.960 � 5.488 47.630 � 4.820
1993 Jul 20 ................. 114.55 Camb . . . . . . . . . 70.9 � 7.09 . . .
1993 Jul 30 ................. 124.38 Camb . . . . . . . . . 64.9 � 6.49 . . .124.88 VLA C 9.770 � 0.982 110.540 � 5.539 103.430 � 5.179 62.920 � 4.761 41.680 � 4.457
1993 Aug 02............... 127.74 Camb . . . . . . . . . 56.7 � 5.67 . . .
1993 Aug 04............... 129.75 Camb . . . . . . . . . 56.8 � 5.68 . . .1993 Aug 05............... 130.34 Camb . . . . . . . . . 61.3 � 6.13 . . .
1993 Aug 06............... 131.95 VLA C 11.720 � 1.430 116.930 � 6.236 115.980 � 6.075 58.860 � 4.513 . . .
1993 Aug 10............... 135.94 VLA C/D 16.747 � 1.752 112.510 � 5.660 84.150 � 4.223 37.856 � 2.884 19.540 � 2.223
1993 Aug 12............... 137.93 VLA C/D 17.193 � 1.964 110.230 � 5.523 . . . 42.091 � 3.219 26.270 � 2.859
1993 Aug 13............... 138.32 Camb . . . . . . . . . 54.7 � 5.47 . . .
1993 Aug 14............... 139.73 Camb . . . . . . . . . 56.2 � 5.62 . . .
1993 Aug 16............... 141.72 Camb . . . . . . . . . 56.6 � 5.66 . . .
1993 Aug 17............... 142.79 VLA C 15.180 � 1.583 114.720 � 5.971 92.280 � 4.904 . . . 31.360 � 3.651
1993 Aug 20............... 145.45 Camb . . . . . . . . . 60.6 � 6.06 . . .
1961

TABLE 1—Continued
Observation Date
Days from
Reference Date
Telescope/VLA
ConfigurationaS(20 cm) � Errorb
(mJy)
S(6 cm) � Errorb
(mJy)
S(3:6 cm) � Errorb
(mJy)
S(2 cm) � Errorb
(mJy)
S(1:2 cm) � Errorb
(mJy)
1993 Aug 21............... 146.41 Camb . . . . . . . . . 54.8 � 5.48 . . .1993 Aug 22............... 147.71 Camb . . . . . . . . . 57.4 � 5.74 . . .
1993 Aug 23............... 148.54 VLA C 15.137 � 1.576 112.250 � 5.925 88.740 � 4.574 59.740 � 4.502 36.350 � 3.716
1993 Aug 25............... 150.49 Camb . . . . . . . . . 56.1 � 5.61 . . .
1993 Aug 26............... 151.93 VLA C 17.560 � 1.906 120.120 � 6.057 102.840 � 5.334 . . . 35.540 � 4.317
1993 Aug 29............... 154.69 Camb . . . . . . . . . 49.7 � 4.97 . . .
1993 Aug 31............... 156.78 VLA C/D . . . 111.520 � 5.620 92.185 � 4.688 47.432 � 3.618 27.964 � 2.990
1993 Sep 02................ 158.39 Camb . . . . . . . . . 50.2 � 5.02 . . .1993 Sep 03................ 159.33 Camb . . . . . . . . . 50.6 � 5.06 . . .
1993 Sep 05................ 161.35 Camb . . . . . . . . . 47.8 � 4.78 . . .
1993 Sep 06................ 162.48 Camb . . . . . . . . . 48.5 � 4.85 . . .
1993 Sep 09................ 165.59 Camb . . . . . . . . . 48.3 � 4.83 . . .1993 Sep 11 ................ 167.91 VLA C/D 22.790 � 2.751 103.650 � 5.202 . . . . . . . . .
1993 Sep 13................ 169.59 Camb . . . . . . . . . 48.1 � 4.81 . . .
1993 Sep 15................ 171.49 Camb . . . . . . . . . 45.1 � 4.51 . . .
1993 Sep 18................ 174.33 Camb . . . . . . . . . 43.5 � 4.35 . . .174.72 VLA C/D . . . . . . 78.700 � 3.984 49.500 � 3.732 39.100 � 3.918
1993 Sep 19................ 175.00 VLAc . . . . . . 78.7 � 4.0 49.5 � 3.0 . . .
175.75 VLA C/D 26.870 � 3.148 103.990 � 5.211 61.341 � 3.207 37.243 � 2.810 22.630 � 2.302
1993 Sep 25................ 181.34 Camb . . . . . . . . . 44.8 � 4.48 . . .
1993 Sep 26................ 182.75 VLA C/D 30.940 � 3.488 104.930 � 5.268 70.460 � 3.594 43.950 � 3.324 28.000 � 2.864
1993 Sep 27................ 183.30 Camb . . . . . . . . . 43.4 � 4.34 . . .
1993 Sep 29................ 185.62 Camb . . . . . . . . . 42.7 � 4.27 . . .1993 Oct 04 ................ 190.50 Camb . . . . . . . . . 39.8 � 3.98 . . .
190.66 VLA C/D 28.303 � 3.098 100.050 � 5.013 68.947 � 3.491 39.930 � 3.006 24.152 � 2.437
1993 Oct 08 ................ 194.31 Camb . . . . . . . . . 43.7 � 4.37 . . .
1993 Oct 09 ................ 195.27 Camb . . . . . . . . . 42.7 � 4.27 . . .1993 Oct 16 ................ 202.26 Camb . . . . . . . . . 44.1 � 4.41 . . .
1993 Oct 17 ................ 203.80 VLA C/D 35.770 � 3.982 99.880 � 5.012 65.150 � 3.791 24.650 � 2.003 15.970 � 1.939
1993 Oct 25 ................ 211.56 Camb . . . . . . . . . 37.9 � 3.79 . . .
211.61 VLA C/D 33.220 � 3.662 97.260 � 4.905 . . . 37.320 � 2.830 23.640 � 2.486
1993 Nov 01............... 218.58 VLA D 24.590 � 2.478 105.560 � 5.474 67.210 � 3.471 38.930 � 2.954 30.360 � 3.101
1993 Nov 05............... 222.26 Camb . . . . . . . . . 37.8 � 3.78 . . .
1993 Nov 06............... 223.00 VLAc 61.5 � 5.8 97.6 � 4.9 64.7 � 3.2 39.6 � 2.0 25.7 � 3.9
223.21 Camb . . . . . . . . . 38.4 � 3.84 . . .
1993 Nov 10............... 227.23 Camb . . . . . . . . . 39.7 � 3.97 . . .
1993 Nov 11 ............... 228.22 Camb . . . . . . . . . 36.4 � 3.64 . . .
1993 Nov 16............... 233.40 Camb . . . . . . . . . 37.1 � 3.71 . . .1993 Nov 19............... 236.58 VLA D 34.510 � 3.466 97.110 � 4.924 64.320 � 3.252 38.610 � 2.921 25.790 � 2.643
1993 Nov 20............... 237.17 Camb . . . . . . . . . 35.4 � 3.54 . . .
1993 Nov 23............... 240.06 Camb . . . . . . . . . 36.1 � 3.61 . . .
1993 Nov 28............... 245.56 VLA D 47.020 � 5.230 94.940 � 4.758 61.470 � 3.083 36.840 � 2.813 26.140 � 2.701
1993 Nov 29............... 246.45 Camb . . . . . . . . . 32.2 � 3.22 . . .
1993 Dec 01 ............... 248.26 Camb . . . . . . . . . 35.5 � 3.55 . . .
1993 Dec 02 ............... 249.14 Camb . . . . . . . . . 32.7 � 3.27 . . .1993 Dec 03 ............... 250.14 Camb . . . . . . . . . 32.6 � 3.26 . . .
1993 Dec 05 ............... 252.14 Camb . . . . . . . . . 33.5 � 3.35 . . .
252.58 VLA D 59.100 � 6.118 91.660 � 4.674 59.630 � 2.994 32.290 � 2.440 23.720 � 2.468
1993 Dec 06 ............... 253.13 Camb . . . . . . . . . 32.6 � 3.26 . . .1993 Dec 17 ............... 264.00 VLAc 86.3 � 4.7 93.3 � 4.7 57.1 � 2.9 33.2 � 1.7 27.4 � 2.0
1993 Dec 19 ............... 266.58 VLA D 63.110 � 6.642 89.160 � 4.517 56.880 � 2.873 34.300 � 2.625 22.260 � 2.365
1993 Dec 20 ............... 267.15 Camb . . . . . . . . . 34.0 � 3.40 . . .
1993 Dec 22 ............... 269.10 Camb . . . . . . . . . 32.9 � 3.29 . . .1993 Dec 25 ............... 272.09 Camb . . . . . . . . . 32.5 � 3.25 . . .
1993 Dec 26 ............... 273.93 Camb . . . . . . . . . 33.3 � 3.33 . . .
1993 Dec 27 ............... 274.56 VLA D 63.590 � 6.522 87.350 � 4.396 55.750 � 3.156 33.280 � 2.525 23.520 � 2.472
1993 Dec 28 ............... 275.93 Camb . . . . . . . . . 34.5 � 3.45 . . .
1994 Jan 03................. 281.07 Camb . . . . . . . . . 33.2 � 3.32 . . .
1994 Jan 07................. 285.37 VLA D 58.780 � 5.965 84.470 � 4.238 55.740 � 2.817 33.740 � 2.547 23.080 � 2.357
1994 Jan 10................. 288.12 Camb . . . . . . . . . 34.0 � 3.40 . . .1994 Jan 13................. 291.51 VLA D 58.900 � 5.957 84.850 � 4.267 54.640 � 2.804 32.480 � 2.449 23.420 � 2.373
1994 Jan 27................. 305.30 VLA D 50.400 � 5.125 80.860 � 4.052 55.430 � 2.832 32.260 � 2.443 22.140 � 2.302
1994 Jan 28................. 306.00 VLAc . . . 80.4 � 4.000 52.2 � 2.6 29.2 � 2.9 . . .
306.86 Camb . . . . . . . . . 29.9 � 2.99 . . .1994 Feb 07................ 316.82 Camb . . . . . . . . . 30.2 � 3.02 . . .
1962

TABLE 1—Continued
Observation Date
Days from
Reference Date
Telescope/VLA
ConfigurationaS(20 cm) � Errorb
(mJy)
S(6 cm) � Errorb
(mJy)
S(3:6 cm) � Errorb
(mJy)
S(2 cm) � Errorb
(mJy)
S(1:2 cm) � Errorb
(mJy)
1994 Feb 08................ 317.22 VLA D 60.830 � 6.472 94.640 � 4.804 60.240 � 3.106 31.230 � 2.395 24.950 � 2.614
1994 Feb 15................ 324.80 Camb . . . . . . . . . 27.8 � 2.78 . . .
1994 Feb 17................ 326.90 Camb . . . . . . . . . 26.6 � 2.66 . . .
1994 Feb 18................ 327.30 VLA A 78.700 � 7.882 79.720 � 4.031 49.420 � 2.490 34.350 � 2.610 17.980 � 2.057
1994 Feb 19................ 328.96 Camb . . . . . . . . . 26.1 � 2.61 . . .1994 Feb 20................ 329.96 Camb . . . . . . . . . 25.700 � 2.570 . . .
1994 Mar 08 ............... 345.18 Camb . . . . . . . . . 27.4 � 2.74 . . .
345.80 Camb . . . . . . . . . 26.5 � 2.65 . . .1994 Mar 15 ............... 352.00 VLAc 99.1 � 5.0 71.4 � 3.6 45.7 � 2.3 . . . . . .
1994 Mar 20 ............... 357.36 VLA A 91.217 � 9.123 74.070 � 3.762 43.370 � 2.282 29.717 � 2.276 15.540 � 1.929
1994 Mar 22 ............... 359.00 Camb . . . . . . . . . 28.4 � 2.84 . . .
1994 Apr 07................ 375.70 Camb . . . . . . . . . 21.3 � 2.13 . . .1994 Apr 12................ 380.16 VLA A 86.830 � 8.684 . . . . . . . . . . . .
1994 Apr 22................ 390.00 VLAc 102.7 � 5.1 . . . . . . . . . . . .
390.10 VLA A . . . 65.820 � 3.291 42.210 � 2.111 . . . . . .
1994 Apr 25................ 393.18 VLA A 87.470 � 8.772 64.490 � 3.274 39.820 � 2.009 17.950 � 1.447 10.390 � 1.247
1994 May 14............... 412.57 Camb . . . . . . . . . 21.8 � 2.18 . . .
1994 May 26............... 424.16 VLA A/B 96.810 � 9.707 73.280 � 3.757 40.290 � 2.071 26.790 � 2.061 12.320 � 1.407
1994 Jun 20 ................ 449.60 Camb . . . . . . . . . 23.3 � 2.33 . . .1994 Jun 22 ................ 451.00 VLAc . . . 59.3 � 3.0 39.0 � 2.0 . . . . . .
1994 Jun 23 ................ 452.98 VLA B 104.520 � 10.534 53.820 � 2.919 30.550 � 1.627 . . . 7.196 � 0.896
1994 Sep 01................ 522.69 VLA B 101.940 � 10.297 57.430 � 3.041 30.770 � 1.674 15.710 � 1.313 9.080 � 1.442
1994 Oct 13 ................ 564.64 VLA C 101.290 � 10.215 51.060 � 3.135 29.260 � 2.183 14.440 � 1.248 9.960 � 1.622
1994 Oct 31 ................ 582.00 VLAc . . . 53.0 � 2.6 33.0 � 1.7 . . . . . .
1994 Nov 07............... 589.47 VLA C 112.280 � 11.291 42.450 � 2.188 31.480 � 1.584 . . . . . .
1994 Dec 23 ............... 635.00 VLAc . . . 49.0 � 2.5 31.9 � 1.6 . . . . . .
1995 Jan 05................. 648.39 VLA C/D 107.010 � 10.736 45.210 � 2.764 23.210 � 1.920 16.220 � 1.667 15.290 � 2.638
1995 Feb 12................ 686.00 VLAc 120.0 � 10.0 46.4 � 2.3 29.2 � 1.5 . . . . . .
1995 Apr 06................ 739.14 VLA D 118.840 � 12.205 44.230 � 2.242 28.200 � 1.468 9.670 � 0.864 14.800 � 1.593
1995 May 11............... 774.00 VLAc . . . . . . 25.6 � 1.5 . . . . . .
1995 Jun 16 ................ 810.05 VLA D/A 101.760 � 10.247 34.960 � 1.939 16.480 � 0.877 6.490 � 0.727 . . .1995 Aug 18............... 873.00 VLAc . . . 37.7 � 1.9 24.5 � 1.2 . . . . . .
1995 Oct 06 ................ 922.69 VLA B 99.910 � 9.992 35.810 � 1.965 23.300 � 1.425 14.300 � 1.152 9.360 � 1.086
1995 Dec 19 ............... 996.00 VLAc . . . 33.9 � 1.7 22.1 � 1.1 . . . . . .1996 Jan 12................. 1020.00 VLA B/C 84.007 � 8.415 33.770 � 1.696 21.062 � 1.061 13.345 � 1.030 9.393 � 0.983
1996 Apr 08................ 1107.00 VLAc . . . 31.4 � 1.6 20.2 � 1.1 . . . 10.3 � 0.7
1996 Sep 01................ 1253.00 VLAc . . . 29.0 � 1.4 19.1 � 1.0 . . . . . .
1996 Oct 05 ................ 1287.57 VLA D/A 70.860 � 7.132 26.950 � 1.434 16.310 � 2.013 10.370 � 1.672 9.160 � 2.899
1996 Dec 13 ............... 1356.00 VLAc 70.8 � 3.7 28.6 � 1.4 18.7 � 0.9 . . . . . .
1997 Jan 23................. 1397.21 VLA A/B 71.910 � 7.297 26.340 � 1.573 16.750 � 0.965 10.700 � 0.915 7.340 � 0.974
1997 Jun 07 ................ 1532.00 VLAc . . . 26.3 � 1.3 17.2 � 0.9 . . . . . .
1997 Aug 14............... 1600.99 VLA C/D 61.631 � 6.176 . . . . . . . . . . . .1997 Nov 15............... 1693.00 VLAc 60.6 � 3.3 24.3 � 1.3 17.2 � 0.9 14.0 � 2.6 10.4 � 1.3
1998 Jun 03 ................ 1893.00 VLAc . . . 22.8 � 1.3 16.0 � 1.0 . . . . . .
1998 Jun 09 ................ 1899.85 VLA A/B 52.165 � 5.356 20.803 � 1.136 9.632 � 0.610 4.735 � 0.435 3.927 � 0.762
1998 Nov 20............... 2063.00 VLAc 48.2 � 2.8 20.5 � 1.1 13.9 � 0.7 12.3 � 1.0 7.7 � 0.9
1998 Dec 07 ............... 2080.00 VLAc 47.9 � 2.8 20.7 � 1.0 14.3 � 0.8 12.3 � 1.3 5.1 � 1.0
1999 Jun 06 ................ 2261.00 VLAc 39.6 � 2.1 . . . 12.8 � 0.8 8.4 � 0.8 5.5 � 1.0
1999 Jun 13 ................ 2268.96 VLA D/A 37.770 � 3.799 12.155 � 0.927 . . . . . . . . .1999 Jun 16 ................ 2271.00 VLAc . . . 20.9 � 1.2 . . . . . . . . .
1999 Nov 24............... 2432.00 VLAc 38.8 � 2.3 17.5 � 0.9 12.5 � 0.7 . . . . . .
2000 Feb 25................ 2525.00 VLAc . . . . . . 12.0 � 0.8 9.0 � 4.0 . . .
2000 Nov 08............... 2782.00 GMRTd 35.1 � 3.5 . . . . . . . . . . . .2000 Nov 13............... 2787.00 VLAc 33.8 � 1.7 . . . 10.9 � 0.6 8.3 � 0.8 . . .
2000 Dec 16 ............... 2820.00 GMRTd 36.1 � 3.6 . . . . . . . . . . . .
2000 Dec 19 ............... 2823.00 VLA Ae 30.5 � 0.4f . . . . . . . . . . . .2823.00 VLA Ae 33.7 � 0.4f . . . . . . . . . . . .
2000 Dec 21 ............... 2825.00 VLA Ae . . . 14.7 � 0.4 10.4 � 0.2 6.7 � 0.1 . . .
2001 Jan 23................. 2858.00 VLAc . . . . . . 9.7 � 0.7 . . . . . .
2001 Jun 02 ................ 2988.00 GMRTd 32.7 � 3.3 . . . . . . . . . . . .2001 Jun 10 ................ 2996.00 VLAc 28.8 � 1.6 14.4 � 0.7 9.4 � 0.5 . . . . . .
2001 Oct 15 ................ 3123.00 GMRTd 33.9 � 3.3 . . . . . . . . . . . .
2001 Nov 25............... 3164.00 VLA Ac 24.4 � 1.5 . . . 8.4 � 0.5 . . . . . .
2002 Jan 13................. 3213.38 VLA D/A 31.440 � 4.278 15.000 � 0.774 7.880 � 0.459 4.490 � 0.479 2.495 � 0.282
2002 Apr 07................ 3297.00 GMRTd 24.6 � 3.7 . . . . . . . . . . . .
1963

(Sramek et al. 1993), radio emission was detected with the VLAon UT 1993 April 02.30, with a flux density of 0:8 � 0:2 mJy at1.3 cm (Weiler et al. 1993; see also Van Dyk et al.1993a,1993c)and with the Ryle Telescope in Cambridge, UK, on UT 1993April 5.7 at 2 cm (15.3 GHz) by Pooley et al. (1993). By UT 1993April 25, the rapidly expanding SN already had ameasurable sizeof 0:25 � 0:1 milliarcseconds (mas) with Very Long Baseline In-terferometry (VLBI) techniques (Marcaide et al. 1993a, 1993b).
High angular resolution VLBI size measurements of the ex-panding SNwere conducted very early by Marcaide et al. (1994)and Bartel et al. (1994) and VLBI monitoring continues to thepresent at multiple wavelengths (see, e.g., Marcaide et al.1995a,1995b, 1997, 2005, 2008; Bartel et al. 2000, 2002; Bietenholzet al. 2001, 2003).
Extensive radio monitoring of the integrated flux density ofSN 1993J has been conducted by the VLA at 20 cm (1.4 GHz),6 cm (4.9 GHz), 3.6 cm (8.4 GHz), 2 cm (14.9 GHz), and 1.2 cm(22.5 GHz) by Van Dyk et al. (1994) and with the Ryle Tele-scope at 2 cm (15.3 GHz) by Pooley&Green (1993). Additionalobservations were also conducted at 0.3 cm (85Y110 GHz) withthe Institut de Radioastronomie Millimetrique (IRAM) telescope(Radford et al. 1993) and at the Caltech Owens Valley RadioObservatory (OVRO; Phillips et al. 1993a, 1993b), and at 0.9 cmwith the Effelsberg 100 m telescope of MPIfR (W. Reich 1993,private communication). More recently, Chandra et al. (2001)have conducted observations with the Giant Metrewave RadioTelescope (GMRT) in India at 49 cm (0.6 GHz) and 20 cm(1.4 GHz), and we have added new measurements with the VLAat 90 cm (0.3 GHz) and 0.7 cm (43 GHz).
In this paper we consider the integrated flux density measure-ments and their physical interpretation.
2. RADIO OBSERVATIONS
Almost a decade and a half has passed since the explosion ofSN 1993J, and this is an appropriate interval to consider the ex-tensive set of radio observations which are now available from90 cm at the longest wavelength to 0.3 cm at the shortest. In ad-dition to previously published VLA results (Van Dyk et al.1994), we present here almost 200 new VLA observations ofSN 1993J at 90, 20, 6, 3.6, 2, 1.2, and 0.7 cm along with all pub-lished results which could be found in the literature or have
been provided to us as private communications at 49, 20, 0.9,and 0.3 cm.All of the available data are presented in Tables 1 and 2 and
the data at the best sampled wavelengths of 90, 49, 20, 6, 3.6, 2,1.2 and 0.3 cm, principally from the VLA and the CambridgeRyle telescope, along with contributions from the IRAM andOVRO millimeter telescopes and the GMRT, are plotted in andFigures 1 and 2 (see also Figs. 8, 11, and 13). The previously pub-lished results from Van Dyk et al. (1994) are also included inTables 1 and 2 and plotted in the figures for completeness and easeof reference. However, to reduce the size and complexity of Fig-ures 1 and 2 (and also Figs. 8, 11, and 13), the sparse measure-ments at 32 and 43 GHz are not plotted, even though they wereused in the fitting procedure.The techniques of observation, editing, calibration, and error
estimation are described in previous publications on the radioemission from SNe (see, e.g.,Weiler, et al.1986,1990). The ‘‘pri-mary’’ calibrator was 3C 286, which is assumed to be constant intime with flux densities of 25.84, 14.45, 7.42, 5.20, 3.45, and2.52 Jy at 90, 20, 6, 3.6, 2, and 1.2 cm, respectively. The ‘‘sec-ondary’’ calibrator5 was normally J1048+717,6 with a defined po-sition of R:A: (J2000:0) ¼ 10h48m27:619917s, decl: (J2000:0) ¼þ71�43035:93828000. After flux density calibration by 3C 286, itserved as the actual gain and phase calibrator for SN 1993J. Asexpected for secondary calibrators, the flux density of J1048+717 has been varying over the years, as can be seen in Table 3 andFigure 3.The flux density measurement errors for SN 1993J are a com-
bination of the rms map error, which measures the contributionof small unresolved fluctuations in the background emission andrandom map fluctuations due to receiver noise, and a basic frac-tional error �, included to account for the normal inaccuracy of
TABLE 1—Continued
Observation Date
Days from
Reference Date
Telescope/VLA
ConfigurationaS(20 cm) � Errorb
(mJy)
S(6 cm) � Errorb
(mJy)
S(3:6 cm) � Errorb
(mJy)
S(2 cm) � Errorb
(mJy)
S(1:2 cm) � Errorb
(mJy)
2002 Jun 24 ................ 3375.00 GMRTd 23.4 � 2.5 . . . . . . . . . . . .2002 Sep 21................ 3464.00 GMRTd 24.2 � 2.4 . . . . . . . . . . . .
2003 May 23............... 3708.93 VLA A 17.377 � 1.968 6.962 � 0.429 3.943 � 0.207 . . . 1.928 � 0.237
2003 Jun 13 ................ 3729.00 GMRTd 20.2 � 2.1 . . . . . . . . . . . .
2003 Jun 26 ................ 3742.91 VLA A . . . 8.349 � 0.424 . . . �0.975 �0.816
2004 Jan 29................. 3959.47 VLA B/C 14.359 � 1.469 6.973 � 0.376 4.513 � 0.241 2.492 � 0.215 1.792 � 0.191
2004 Sep 10................ 4184.57 VLA A 11.309 � 1.142 5.526 � 0.304 3.220 � 0.257 2.470 � 0.323 0.967 � 0.217
2005 Jun 13 ................ 4460.90 VLA B/C 8.893 � 0.894 3.906 � 0.276 2.562 � 0.136 0.990 � 0.152 0.897 � 0.139
2006 Jan 24................. 4685.17 VLA D . . . 3.880 � 0.480 1.307 � 0.371 �1.440 . . .
2006 Jun 28 ................ 4840.05 VLA B 5.303 � 0.469 . . . . . . . . . . . .
2006 Sep 25................ 4929.64 VLA B/C . . . �1.800 �0.957 . . . . . .
a The ‘‘Camb’’ data are all from the Ryle Telescope (Pooley et al. 1993; Pooley & Green 1993; G. G. Pooley & D. A. Green 1994, private communication). For adiscussion of why 10% errors were assumed for the Cambridge data, see x 2.
b All upper limits are three times the map rms (3 �).c Bartel et al. 2002.d Chandra et al. 2004.e Perez-Torres et al. 2002.f Perez-Torres et al. 2002 give two measurements of SN 1993J in the 20 cm band, a value of 30:5 � 0:4 at 1.67 GHz and 33:7 � 0:4 at 1.34 GHz. We include both
measurements here.
5 Secondary calibrators are chosen to be compact and unresolved by thelongest VLA baselines. While compact and serving as good phase references,such objects are usually variable, so that their flux density must be recalibratedregularly from the primary calibrators.
6 Several of the early observations at 90 cm used J0834+555, with a positionof R:A: (J2000:0) ¼ 08h34m54:904117s, decl: (J2000:0) ¼ þ55�34021:07098000
as a secondary calibrator. Also, between 1993 September 11 and 1994 Feb-ruary 8, J0949+662 [R:A: (J2000:0) ¼ 09h49m12:2100s, decl: (J2000:0) ¼þ66�14059:32100] was used as a secondary calibrator at 20 cm.
WEILER ET AL.1964 Vol. 671

VLA flux density calibration (see, e.g., Weiler et al. 1986) andpossible deviations of the primary calibrator from an absoluteflux density scale. The final errors (�f ) given for the measurementsof SN 1993J are taken as
�2f ¼ (�S0)
2þ �20 ; ð1Þ
where S0 is the measured flux density, �0 is the map rms for eachobservation, and � ¼ 0:15 for 90 cm, 0.10 for 20 cm, 0.05 for 6 and3.6 cm, 0.075 for 2 cm, and 0.10 for 1.2 cm. All upper limits arelisted as three sigma (3 �).
The appropriate errors to use for the Cambridge measure-ments at 2 cm are difficult to determine. The authors (Pooley &Green1993) mention that the variable nucleus of M81 is not fully
TABLE 2
Other Flux Density Measurements for SN 1993J
Observation Date Days from Reference Date Telescope
Flux Density � Error
(mJy)
Frequency
(GHz) Reference
1993 Mar 28 ................... =0.00 . . . . . . . . . . . .
1993 Apr 09.................... 12.00 IRAM 11.0 � 3.0 87 1
1993 Apr 11.................... 14.00 IRAM 11.0 � 3.0 87 1
14.39 OVRO 18 � 4 99.4 2
1993 Apr 12.................... 15.00 IRAM 13.5 � 3.4 87 1
1993 Apr 14.................... 17.39 OVRO 17 � 4 99.4 2
1993 Apr 15.................... 18.00 IRAM 12.5 � 3.2 87 1
1993 Apr 16.................... 19.00 IRAM 10.0 � 2.8 110 1
1993 Apr 21.................... 24.00 IRAM 14.3 � 3.5 86.2 3
24.38 OVRO 20 � 4 99.4 2
1993 Apr 30.................... 33.28 OVRO 17.0 � 3.5 99.4 3
33.65 Bonn 59.1 � 16.8 32 4
1993 May 10................... 43.00 Bonn 65.8 � 17.8 32 4
43.39 OVRO 23.0 � 4.8 99.4 3
1993 May 11................... 44.00 Bonn 64.8 � 17.7 32 4
1993 May 17................... 50.00 Bonn 62.0 � 19.5 32 4
1993 May 24................... 57.00 Bonn 63.9 � 17.5 32 4
1993 May 25................... 58.00 Bonn 67.7 � 24.2 32 4
1993 May 30................... 63.32 OVRO 19.0 � 3.8 99.4 3
1993 Jun 02 .................... 66.33 OVRO 22.0 � 4.5 99.4 3
1993 Jun 18 .................... 82.23 OVRO 14.0 � 2.8 99.4 3
1993 Jul 03 ..................... 97.17 OVRO 16.0 � 3.2 99.4 3
1993 Sep 12.................... 168.80 OVRO 13 � 3 99.4 5
1993 Oct 09 .................... 195.61 OVRO 8 � 2 99.4 5
1993 Nov 14................... 231.67 OVRO 8.0 � 1.7 99.4 3
1994 Jul 28 ..................... 487.93 VLA B <31.662 0.330a 6
1995 Jun 16 .................... 810.10 VLA D/A <27.386 0.330 6
1995 Oct 06 .................... 922.74 VLA B 15.500 � 3.161 0.330a 6
1995 Dec 12 ................... 989.49 VLA B <33.513 0.330a 6
1996 Jan 12..................... 1020.41 VLA B/C <65.100 0.330a 6
1997 Jan 23..................... 1397.17 VLA A/B 83.700 � 21.195 0.330 6
1998 Jun 09 .................... 1899.89 VLA A/B 63.690 � 24.758 0.330 6
1999 Nov 24................... 2432.00 VLA 108 � 20 0.330 7
2000 Dec 19 ................... 2823.00 VLA A 71.1 � 3.4 0.324 8
2001 Mar 24 ................... 2918.00 GMRT 56.1 � 5.5 0.610 9
2001 Jul 05 ..................... 3021.00 GMRT 69.2 � 15.8 0.325 9
2001 Aug 24................... 3071.00 GMRT 55.8 � 5.7 0.610 9
2001 Dec 30 ................... 3199.00 GMRT 47.8 � 5.5 0.610 9
2001 Dec 31 ................... 3200.00 GMRT 57.8 � 7.6 0.239 9
2002 Jan 19..................... 3219.49 VLA A 61.501 � 10.136 0.330 6
2002 Mar 07 ................... 3266.00 GMRT 56.2 � 7.4 0.325 9
2002 Mar 08 ................... 3267.00 GMRT 60.9 � 10.8 0.243 9
3267.00 GMRT 44.4 � 4.5 0.610 9
2002 May 19................... 3339.00 GMRT 44.6 � 4.5 0.610 9
2002 Aug 16................... 3428.00 GMRT 61.8 � 8.8 0.325 9
2002 Sep 16.................... 3459.00 GMRT 56.7 � 8.7 0.243 9
3459.00 GMRT 37.5 � 3.8 0.610 9
2003 May 23................... 3708.89 VLA A 62.673 � 13.793 0.330 6
3708.99 VLA A <0.667 43.315 6
2003 Jun 17 .................... 3733.00 GMRT 58.2 � 11.8 0.243 9
3733.00 GMRT 33.4 � 4.3 0.610 9
2004 Sep 10.................... 4184.55 VLA A 35.500 � 8.480 0.330 6
a Calibrator is J1331+305 (3C 286).References.—(1) Radford et al. 1993; (2) Phillips et al. 1993a; (3) S. Radford 1993, private communication; (4) W. Reich 1993, private
communication; (5) Phillips & Kulkarni 1993; (6) this paper; (7) Bartel et al. 2002; (8) Perez-Torres et al. 2001; (9) Chandra et al. (2004).
LONG-TERM RADIO MONITORING OF SN 1993J 1965No. 2, 2007

resolved from SN 1993J, and that their calibrator B0954+658 isclearly variable. However, they have done their best to removesuch effects and estimate that 5% ‘‘is a good estimate of the un-certainty in the observations.’’ Because of our knowledge of theuncertainties of observations with the VLA at 2 cm wavelength,and our decision to use a standard minimum error of 7.5% inequation (1) at that wavelength, we have chosen to assign a 10%error to all Cambridge data to additionally account for possiblesystematic effects between the two telescopes and the two differentsecondary calibrators. Such a valuemaywell be too conservative
but because of the large number of multifrequency points in thedata set, the assumption of possibly too large errors for the Cam-bridge data does not affect any of our fits or conclusions.
3. RADIO SUPERNOVA MODELS
All known RSNe appear to share common properties of (1)nonthermal synchrotron emission with high brightness tempera-ture; (2) a decrease in absorption with time, resulting in a smoothturn-on first at shorter wavelengths and later at longer wave-lengths; (3) a power-law decline of the flux density with time at
Fig. 1.—Radio light curves for SN 1993J, plotted from left to right and top to bottom at 0.3, 1.2, 2, 3.6, 6, 20, 49, and 90 cm. The solid lines represent the best-fit ‘‘pure’’synchrotron self-absorption (SSA) model as described in the text with the parameters listed in Table 4, col. (2), and an exponential flux density decline after day 3100 withan e-folding time of 1100 days. The extrapolation of the best-fit model curves without the exponential roll-off is shown as the dotted lines. Upper limits (3 �) are shown asopen inverted triangles.
WEILER ET AL.1966 Vol. 671

each wavelength after the source becomes optically thin at thatwavelength; and (4) a final, asymptotic approach of spectral index� (S / �þ�) to an optically thin, nonthermal, constant negativevalue (Weiler et al. 1986, 1990).
Chevalier (1982a,1982b) proposed that the relativistic electronsand enhanced magnetic field necessary for synchrotron emissionarise from the SN blast wave interacting with a relatively highdensity CSM which has been ionized and heated by the initialUV/X-ray flash. This CSM is presumed to have been establishedby a constant mass-loss (M ) rate, constant velocity (wwind) wind
[i.e., � / M / wwind r2ð Þ] from a massive stellar progenitor or a
companion. This ionized CSM is the source of some or all of theinitial free-free absorption (FFA), althoughmore recentlyChevalier(1998) has proposed that synchrotron self-absorption (SSA) mayplay a role at some times and in some objects.
A rapid rise in the observed radio flux density results from adecrease in these absorption processes as the radio emitting regionexpands and the absorption processes, either internal or along theline of sight, decrease.Weiler et al. (1990) have suggested that thisCSMcan be ‘‘clumpy’’ or ‘‘filamentary,’’ leading to a slower radio
Fig. 2.—Radio light curves for SN 1993J, plotted from left to right and top to bottom at 0.3, 1.2, 2, 3.6, 6, 20, 49, and 90 cm. The solid lines represent the best-fit ‘‘pure’’thermal, free-free absorption (FFA)model as described in the text with the parameters listed in Table 4, col. (3), and an exponential flux density decline after day 3100withan e-folding time of 1100 days. The extrapolation of the best-fit model curves without the exponential roll-off is shown as the dotted lines. Upper limits (3 �) are shown asopen inverted triangles.
LONG-TERM RADIO MONITORING OF SN 1993J 1967No. 2, 2007

TABLE 3
Flux Density Measurements for the VLA Secondary Calibrator J1048+717
Observation Date Days from Reference Date Telescope/VLA Configuration
S(20 cm)
(mJy)
S(6 cm)
(mJy)
S(3:6 cm)
(mJy)
S(2 cm)
(mJy)
S(1:2 cm)
(mJy)
1993 Mar 31 ................................... 3.10 VLA B . . . . . . 0.566 . . . . . .
3.10 VLA B 0.754 . . . . . . . . . . . .
1993 Apr 02.................................... 5.29 VLA B . . . . . . . . . 0.577 . . .5.30 VLA B . . . . . . 0.583 . . . . . .
5.34 VLA B . . . . . . . . . . . . 0.596
1993 Apr 08.................................... 11.37 VLA B . . . . . . 0.582 0.583 0.611
1993 Apr 09.................................... 12.33 VLA B . . . . . . . . . 0.591a 0.616a
1993 Apr 10.................................... 13.04 VLA B . . . . . . 0.585a . . . 0.619a
13.46 VLA B . . . . . . . . . 0.602a 0.621a
1993 Apr 11.................................... 14.25 VLA B 0.715 . . . 0.588 0.609 0.624
1993 Apr 13.................................... 16.02 VLA B . . . . . . 0.581a . . . 0.613a
16.53 VLA B . . . 0.601a 0.581a 0.593a 0.613a
1993 Apr 14.................................... 17.07 VLA B . . . 0.599 0.574 0.577 0.602
1993 Apr 16.................................... 19.02 VLA B . . . 0.598a . . . . . . 0.596a
1993 Apr 19.................................... 22.25 VLA B . . . 0.597 0.563 0.577 0.591
22.97 VLA B . . . 0.593a 0.565a 0.568a . . .
1993 Apr 21.................................... 24.51 VLA B . . . 0.593a 0.565a 0.568a 0.563a
1993 Apr 22.................................... 25.48 VLA B . . . 0.589 0.567 0.559 0.535
1993 Apr 23.................................... 26.88 VLA B 0.710a 0.589a 0.566a 0.569a 0.570a
1993 Apr 24.................................... 27.87 VLA B . . . 0.589a 0.566a . . . 0.570a
1993 Apr 25.................................... 28.99 VLA B . . . 0.589a 0.566a . . . 0.570a
1993 Apr 26.................................... 29.85 VLA B . . . 0.589a 0.566a 0.569a . . .
1993 Apr 27.................................... 30.84 VLA B . . . 0.589a 0.566a . . . 0.570a
1993 Apr 28.................................... 31.52 VLA B . . . 0.589a 0.566a 0.569a 0.570a
1993 Apr 29.................................... 32.50 VLA B . . . 0.589a 0.566a . . . 0.570a
1993 May 01................................... 34.37 VLA B . . . 0.589 0.564 . . . 0.604
34.93 VLA B 0.692 0.589a 0.565a 0.573a 0.596a
1993 May 02................................... 35.71 VLA B . . . 0.590a 0.565a 0.573a . . .
1993 May 04................................... 37.27 VLA B . . . 0.591 0.566 0.567 0.587
1993 May 07................................... 40.11 VLA B . . . 0.595 0.574 0.582 0.535
1993 May 11................................... 44.74 VLA B/C . . . 0.595 0.573 0.582 0.535
1993 May 14................................... 47.20 VLA B/C . . . 0.586 0.577 0.599 0.566
1993 May 16................................... 49.86 VLA B/C 0.754a 0.595 . . . . . . . . .
1993 May 17................................... 50.13 VLA B/C . . . . . . 0.579 0.604 0.618
1993 May 20................................... 53.17 VLA B/C 0.754a 0.595a 0.585a 0.613a 0.688a
1993 May 25................................... 58.99 VLA B/C 0.637 0.604 0.596 0.627 0.734
1993 May 30................................... 63.04 VLA B/C . . . 0.595 0.576 0.581 0.596
1993 Jun 04 .................................... 68.06 VLA B/C 0.711 0.594 . . . 0.566 0.604
1993 Jun 11 .................................... 75.06 VLA C 0.754 0.610 0.593 0.615 0.622
1993 Jun 18 .................................... 82.92 VLA C . . . 0.597 . . . 0.596a . . .1993 Jun 25 .................................... 89.75 VLA C 0.747a 0.603a 0.582a 0.596a 0.580a
1993 Jul 01 ..................................... 95.22 VLA C 0.740 0.597 0.571 0.578 0.539
1993 Jul 08 ..................................... 102.76 VLA C 0.737a 0.629a 0.615a . . . . . .1993 Jul 13 ..................................... 107.77 VLA C 0.734 0.662 0.659 0.600 . . .
1993 Jul 19 ..................................... 113.02 VLA C 0.739 0.614 0.592 0.611 0.603
1993 Jul 30 ..................................... 124.88 VLA C 0.765 0.601 0.589 0.605 0.623
1993 Aug 06................................... 131.95 VLA C 0.744 0.568 0.677 0.506 . . .1993 Aug 10................................... 135.94 VLA C/D 0.818a 0.607a 0.568a 0.608a 0.618a
1993 Aug 12................................... 137.93 VLA C/D 0.828a 0.608a . . . 0.609a 0.616a
1993 Aug 17................................... 142.79 VLA C 0.758 0.636 0.628 . . . 0.664
1993 Aug 23................................... 148.54 VLA C 0.760 0.618 0.602 0.620 0.568
1993 Aug 26................................... 151.93 VLA C 0.811 0.650 0.684 . . . 0.914
1993 Aug 31................................... 156.78 VLA C/D . . . 0.604 0.671a 0.634a 0.651a
1993 Sep 11 .................................... 167.91 VLA C/D 2.238 0.616 . . . . . . . . .
1993 Sep 18.................................... 174.72 VLA C/D . . . . . . 0.863 0.889 0.996
1993 Sep 19.................................... 175.75 VLA C/D 2.200 0.626 0.620 0.654 0.660
1993 Sep 26.................................... 182.75 VLA C/D 2.231 0.624 0.618 0.640 0.638
1993 Oct 04 .................................... 190.66 VLA C/D 2.200 0.636 0.625 0.624 0.591
1993 Oct 17 .................................... 203.80 VLA C/D 2.236 0.631 0.616 0.588 0.489
1993 Oct 25 .................................... 211.61 VLA C/D 2.260 0.637 . . . 0.620 0.582
1993 Nov 01................................... 218.58 VLA D 2.205 0.649 0.637 0.620 0.590
1993 Nov 19................................... 236.58 VLA D 2.230 0.633 0.617 0.601 0.563
1993 Nov 28................................... 245.56 VLA D 2.237 0.636 0.623 0.604 0.581
1993 Dec 05 ................................... 252.58 VLA D 2.230 0.640 0.624 0.595 0.561

turn-on, and Montes et al. (1997) have found at least one examplefor the presence of a distant ionized medium along the line ofsight which is time independent and can cause a spectral turnoverat low radio frequencies. In addition to clumps or filaments, theCSMmay be structuredwith significant density irregularities suchas rings, disks, shells, or gradients and many, if not most, well-studied RSNe appear to show a transition to a significantly lessdense CSM after a number of years (several thousand years inthe time frame of the presupernova wind; see, e.g., SN 1980K,Montes et al. 1998; SN 1988Z, Van Dyk et al. 1993b; Williamset al. 2002; and SN 2001gd, Stockdale et al. 2007).
3.1. Radio Light Curves
Following the most recent RSNmodeling discussion of Weileret al. (2002) and Sramek & Weiler (2003) we adopt a parame-terized model:
S(mJy) ¼ K1
�
5 GHz
� ��t � t0
1 day
� ��
; e��ext1� e��CSMcl
�CSMcl
� �1� e��int
�int
� �; ð2Þ
with
�ext ¼ �CSMhomþ �dist; ð3Þ
where
�CSMhom¼ K2
�
5 GHz
� ��2:1t � t0
1 day
� ��
; ð4Þ
�dist ¼ K4
�
5 GHz
� ��2:1
; ð5Þ
�CSMcl¼ K3
�
5 GHz
� ��2:1t � t0
1 day
� �� 0
; ð6Þ
with K1, K2, K3, and K4 determined from fits to the data andcorresponding, formally, to the flux density (K1), homogeneous(K2,K4), and clumpy or filamentary (K3) FFA at 5 GHz 1 day af-ter the explosion date t0. The terms �CSMhom
and �CSMcldescribe
the attenuation of local, homogeneous free-free absorption CSMand clumpy or filamentary free-free absorbing CSM, respectively,that are near enough to the SN progenitor that they are alteredby the rapidly expanding SN blast wave. The �CSMhom
FFA isproduced by an ionized medium that completely covers the emit-ting source (‘‘homogeneous external absorption’’), and the 1�ðe��CSMcl Þ��1
CSMclterm describes the attenuation produced by an
inhomogeneous FFA medium (‘‘clumpy absorption’’; see Natta& Panagia 1984 for a more detailed discussion of attenuation ininhomogeneous media). The �dist term describes the attenuationproduced by a homogeneous FFA medium which completelycovers the source but is so distant from the SN progenitor that it isnot affected by the expanding SN blast wave and is consequently
TABLE 3—Continued
Observation Date Days from Reference Date Telescope/VLA Configuration
S(20 cm)
(mJy)
S(6 cm)
(mJy)
S(3:6 cm)
(mJy)
S(2 cm)
(mJy)
S(1:2 cm)
(mJy)
1993 Dec 19 ................................... 266.58 VLA D 2.226 0.650 0.641 0.625 0.600
1993 Dec 27 ................................... 274.56 VLA D 2.234 0.646 0.646 0.649 0.631
1994 Jan 07..................................... 285.37 VLA D 2.226 0.658 0.653 0.628 0.590
1994Jan 13...................................... 291.51 VLA D 2.230 0.671 0.659 0.644 0.600
1994 Jan 27..................................... 305.30 VLA D 2.226 0.647 0.658 0.664 0.620
1994 Feb 08.................................... 317.22 VLA D 2.236 0.652 0.673 0.705 0.754
1994 Feb 18.................................... 327.30 VLA A 0.698 0.671 0.670 0.744 0.767
1994 Mar 20 ................................... 357.36 VLA A 0.688 0.727 0.842 1.160 1.159
1994 Apr 25.................................... 393.18 VLA A 0.698 0.816 0.836 0.742 0.668
1994 May 26................................... 424.16 VLA A/B 0.713 0.937 0.965 0.905 0.845
1994 Jun 23 .................................... 452.98 VLA B 0.733 0.968 0.979 . . . 0.874
1994 Nov 07................................... 589.47 VLA C 0.786 1.102 1.091 . . . . . .1995 Jan 05..................................... 648.39 VLA C/D 0.788 1.129 1.098 0.973 0.934
1995 Apr 06.................................... 739.14 VLA D 0.790 1.156 1.103 1.029 0.941
1995 Jun 16 .................................... 810.05 VLA D/A 0.837 1.113 0.989 0.763 . . .
1995 Oct 06 .................................... 922.69 VLA B 0.786 1.029 0.986 0.939 1.110
1996 Jan 12..................................... 1020.00 VLA B/C 0.821 1.066 1.069 1.094 1.100
1996 Oct 05 .................................... 1287.57 VLA D/A 0.978 1.578 1.489 1.157 1.145
1997 Jan 23..................................... 1397.21 VLA A/B 1.096 1.719 1.711 1.691 1.570
1997 Aug 14................................... 1600.99 VLA C/D 1.256 . . . . . . . . . . . .
1998 Jun 09 .................................... 1899.85 VLA A/B 1.335 1.647 1.411 1.209 1.125
1999 Jun 13 .................................... 2268.96 VLA D/A 1.299 1.117 . . . . . . . . .
2002 Jan 13..................................... 3213.38 VLA D/A 1.610 1.774 1.181 1.307 1.295
2003 May 23................................... 3708.93 VLA A 1.397 1.347 1.249 . . . 1.383
2003 Jun 26 .................................... 3742.91 VLA A . . . 1.358a . . . 1.406 1.55
2004 Jan 29..................................... 3959.47 VLA B/C 1.464 1.353 1.247 1.181 1.102
2004 Sep 10.................................... 4184.57 VLA A 1.312 1.323 1.445 1.734 1.830
2005 Jun 13 .................................... 4460.90 VLA B/C 1.277 1.825 2.008 2.117 2.102
2006 Jan 24..................................... 4685.17 VLA D . . . 2.178 2.418 2.768 . . .
2006 Jun 28 .................................... 4840.05 VLA B 1.556 . . . . . . . . . . . .
2006 Sep 25.................................... 4929.64 VLA B/C . . . 3.058 1.182 . . . . . .
Notes.—For the measurements from 1993 September 11 through 1994 February 8, the secondary calibrator at 20 cm was J0949+662.a A primary calibrator was not measured, so the flux density for the secondary calibrator was determined from earlier observations.
LONG-TERM RADIO MONITORING OF SN 1993J 1969

constant in time. All external and clumpy absorbing media areassumed to be purely thermal, singly ionized gas which absorbsvia free-free absorption (FFA) with frequency dependence ��2:1
in the radio. The parameters � and � 0 describe the time dependenceof the optical depths for the local homogeneous and clumpy orfilamentary media, respectively.Since it is physically realistic andmay be needed in someRSNe
where radio observations have been obtained at early times andhigh frequencies, equation (2) also includes the possibility for aninternal absorption term.7 This internal absorption (�int) term mayconsist of two parts: synchrotron self-absorption (SSA; �intSSA ),and mixed, thermal FFA/nonthermal emission (�intFFA ):
�int ¼ �intSSA þ �intFFA ; ð7Þ
�intSSA ¼ K5
�
5 GHz
� ���2:5t � t0
1 day
� �� 0 0
; ð8Þ
�intFFA ¼ K6
�
5 GHz
� ��2:1t � t0
1 day
� �� 0 0 0
; ð9Þ
with K5 corresponding, formally, to the internal, nonthermal(� ��2:5) SSA and K6, corresponding, formally, to the internalthermal (��2:1) free-free absorption mixed with nonthermal emis-sion, at 5 GHz 1 day after the explosion date t0. The parameters � 00
and � 000 describe the time dependence of the optical depths for theSSA and FFA internal absorption components, respectively.
TABLE 4
Model Fitting Results for SN 1993J
Early Datab
Parametera
(1)
SSA Only Fit
(2)
FFA Only Fit
(3)
SSA+FFA ‘‘Best’’ Fit
(4)
K1 ................................................. 3:3 ; 103 4:9 ; 103 4:8 ; 103
� ................................................... �0.77 �0.82 �0.81
� ................................................... �0.68 �0.73 �0.73
K2 ................................................. 0c 1:7 ; 102 1:6 ; 102
�.................................................... . . . �1.42 �1.88
K3 ................................................. 0c 4:3 ; 105 4:6 ; 105
� 0 .................................................. . . . �2.84 �2.83
K4 ................................................. 0c 0c 0c
K5 ................................................. 9:2 ; 106 0c 2:62 ; 103
� 00 ................................................. �3.41 . . . �2.05
2 ................................................. 12.8 8.8 8.1
Shock breakoutd........................... 1993 March 28.0 1993 March 28.0 1993 March 28.0
Distancee ...................................... . . . . . . 3:63 � 0:34 Mpc
M (M� yr�1)f ............................... . . . . . . (0:5Y5:9) ; 10�6
tmax(6 cm peak)............................ . . . . . . 133 days
Smax(6 cm peak)........................... . . . . . . 96.9 mJy
Lmax(6 cm peak)........................... . . . . . . 1:5 ; 1027 erg s�1 Hz�1
a See the text for an explanation of the model fitting parameters.b Using data from the first radio detection to day 3100.c Defined fixed for the fit.d From Wheeler et al. 1993.e From Freedman et al. 1994.f Assuming wwind ¼ 10 km s�1, ti ¼ 45 days, vi ¼ 15; 000 km s�1, T ¼ 20; 000 K, and m ¼ 0:845 (see eq. [12]).
Fig. 3.—Flux density measurements for the VLA secondary calibrator J1048+717 at wavelengths of 1.2, 2, 3.6, 6, and 20 cm. Calibration measurements at otherobserving bands were too sparse to show any trends.
7 Note that for simplicity an internal absorber attenuation of the form (1�e�� int )/� int , which is appropriate for a plane-parallel geometry, is used insteadof the more complicated expression (e.g., Osterbrock1974, p. 82) valid for thespherical case. The assumption does not affect the quality of the analysis, be-cause, to within 5% accuracy, the optical depth obtained with the spherical caseformula is simply three-fourths of that obtained with the plane-parallel slabformula.
WEILER ET AL.1970 Vol. 671

Application of this basic parameterization has been shown tobe effective in describing the physical characteristics of the pre-supernova system, its CSM, and its final stages of evolutionbefore explosion for objects ranging from the two decades ofmonitoring the complex radio emission from SN1979C (Monteset al. 2000) through the unusual SN 1998bw (GRB 980425;Weileret al. 2001) and most recent -ray bursters (Weiler et al. 2002,2003).
3.2. Brightness Temperature
Given the measured fluxes, we can compute the correspond-ing brightness temperatures if the angular size of the radio regionis known. Marcaide et al. (1995a,1995b,1997, 2005, 2008) havemeasured the apparent expansion of SN 1993J in the radio with aseries of VLBI experiments, starting as early as day 182 and ex-tending up to day 3858. Marcaide et al. (2008) find that a powerlaw of the form r / t m can provide a good, frequency-independentfit to all observations of the angular diameter at 3.6, 6, and 18 cmwith m ¼ 0:845 � 0:005 through day 1500. Although there areno measurements at early epochs, the remarkably good qualityof the fit up to day 1500 justifies our assumingm ¼ 0:845, since
the epoch of the SN shock breakout. Under this assumption wecan express the angular expansion of SN 1993J as
r ¼ 6:2 t=1 dayð Þ0:845 �as; ð10Þ
which gives the radius r of the circle in microarcseconds (�as)that encompasses half of the total radio flux density to better than20%, assuming isotropic radio emission. Adopting this expan-sion rate, the brightness temperature turns out to be
TB ¼ 1:30 ; 1010 S� corrð Þ=2½ �k2t�1:69 K; ð11Þ
where the radio flux density S�(corr) is the observed flux density,corrected for model estimated external free-free absorption, ex-pressed inmJy, the wavelength (k) in cm, and the time (t) in days.The term S�/2 accounts for the fact that the circular area insider is defined to include only half of the total flux density.
4. FITTING RESULTS
Note that even approximate fitting of the data with our standardmodels requires splitting it into two parts: an ‘‘early’’ data set from
Fig. 4.—Spectral index (�; S / �þ�) evolution for SN 1993J between 1.2 and 2 cm (top left), between 2 and 3.6 cm (top right), between 3.6 and 6 cm (bottom left), andbetween 6 and 20 cm (bottom right). As in Fig. 1 the lines represent the best-fit pure synchrotron self-absorption (SSA) model as described in the text with the parameterslisted in Table 4, col. (2). Note that the observed spectral index values at early times are much in excess of the asymptotic SSA value of � ¼ þ2:5.
LONG-TERM RADIO MONITORING OF SN 1993J 1971No. 2, 2007
the first radio detection through day �3100 and a ‘‘late’’ data setfor the period from day �3100 through the final measurementson day 4930. The reason for this splitting of the data set is that thedecline rate � is clearly much steeper after day�3100, which, forillustrative purposes, we have shown in Figures 1 and 2 (seealso Figs. 8, 11, and 13) as an exponential with e-folding time of1100 days. Of course, the transition interval is gradual, but in orderto maintain model simplicity, we have taken day 3100 as markingthe break between the early and late fitting procedures.
4.1. Early Data Fitting
The early (day<3100) data were first fitted with two possible‘‘pure’’ absorption models, namely, pure SSA (i.e., negligibleFFA at all times) and pure FFA (i.e., negligible SSA at all times).The parameters derived from these fits are listed in Table 4, col-umns (2) and (3), respectively, and the resulting curves are plottedwith the data in Figures 1 and 2, respectively. We also show thespectral index evolution calculated for pairs of frequencies in Fig-ures 4 and 5. The lines in this case are derived from exactly thesame models (pure SSA for Fig. 4 and pure FFA for Fig. 5) aswere derived for Figures 1 and 2.We see that bothmodels are ableto represent the light curves as well as the spectral index evolutionfairly well. However, there are some features that are systemat-
ically misrepresented by these ‘‘pure’’ models, which we discussbelow.We also calculate the apparent brightness temperature evo-
lution from equation (11) for both the pure SSA and pure FFAmodels and plot them in Figures 6 and 7, respectively. Note that,for Figures 6 and 7, we have applied a correction derived fromour models for the presumed external thermal absorption for theearly data to obtain a ‘‘true’’ flux density, and thus a ‘‘true’’ bright-ness temperature, as if no thermal absorption were present.For the pure SSAmodel (Fig. 1), the rising branch of the light
curve at early times tends to be ‘‘too straight’’ in that it cannotreproduce the apparent curvature in the flux density turn-on thatis most noticeable at frequencies lower than 5 GHz. Also, thespectral index evolution at early times (Fig. 4) is clearly inade-quate to represent the observations. This is to be expected be-cause with pure SSA the asymptotic spectral index cannot exceed� ¼ þ2:5 (S / �þ�), clearly at variance with values of � ¼ 4Y5observed at early epochs. Moreover, the corresponding bright-ness temperature evolution seen in Figure 6 is rather strange inthat the temperature appears to peak at later times for lowerfrequencies.For the pure FFA model the rising branch of the light curves
appears to provide a better fit for both the light curves (Fig. 2)
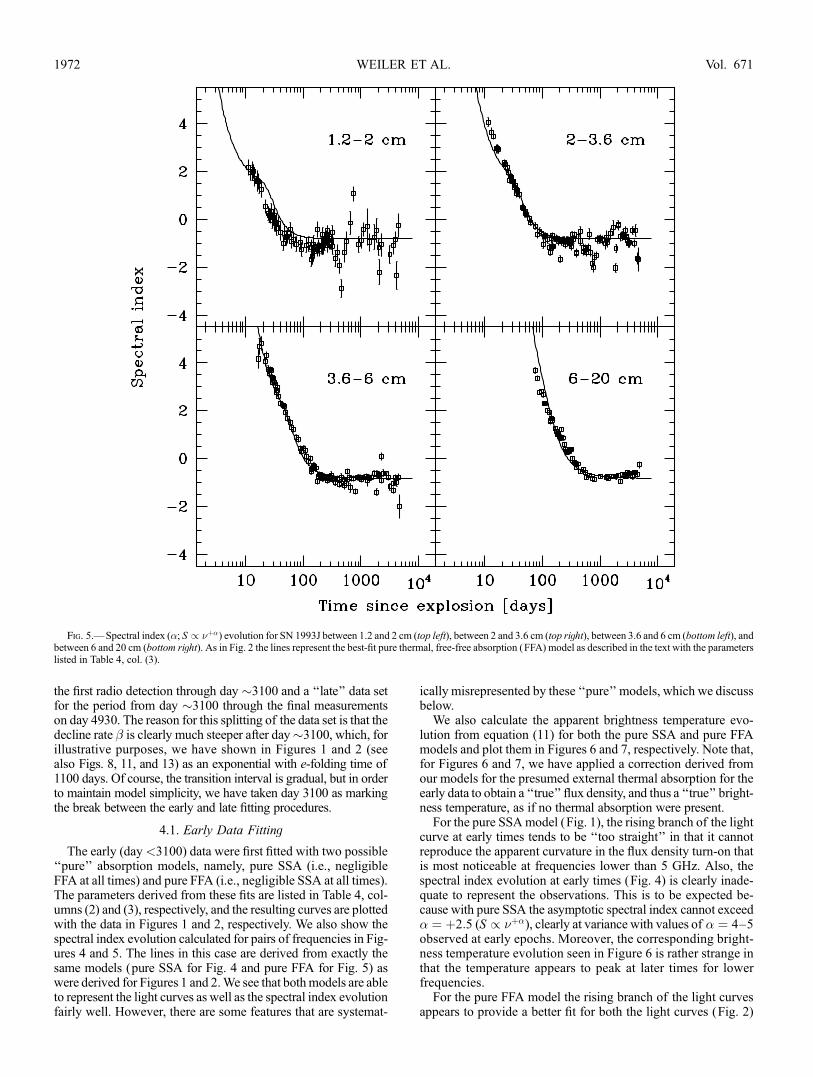
Fig. 5.—Spectral index (�; S / �þ�) evolution for SN 1993J between 1.2 and 2 cm (top left), between 2 and 3.6 cm (top right), between 3.6 and 6 cm (bottom left), andbetween 6 and 20 cm (bottom right). As in Fig. 2 the lines represent the best-fit pure thermal, free-free absorption (FFA) model as described in the text with the parameterslisted in Table 4, col. (3).
WEILER ET AL.1972 Vol. 671

and the spectral index (Fig. 5), but it fails the test of the bright-ness temperature (Fig. 7). After flux density correction for theexternal, thermal absorption, the implied brightness temperatureat early times, for several frequencies, exceeds the physical limitof TB ’ 3 ; 1011 K (see, e.g., Kellermann & Pauliny-Toth1969;Readhead 1994).
Thus, it is clear that no ‘‘simple’’ model, either pure SSA orpure FFA, can account for all observational aspects of the dataand a combination of the two absorption mechanisms must be atwork. The best results are achieved with a model that comprisesboth SSA and FFA; the best-fit parameters are given in Table 4,column (4) and the corresponding fits are displayed in Figures 8,9, and 10, which show the light curves, the spectral index evolu-tion, and the brightness temperature evolution, respectively.As before, after day �3100 we have shown, for illustrative pur-poses, an exponential with an e-folding time of 1100 days for theplotted curve. These results are discussed further in x 5.
4.2. Late-Time Data Fitting
Even though the data are well described after day �3100 byan exponential decay with an e-folding time of 1100 days, toshow the increasing decline rate of the flux density at all wave-lengths, it is perhaps worthwhile to describe the decline after day3100 in terms of our standard model parameters. Since all of theabsorption processes are negligible by the time of the steepeningflux density decline around day�3100, the ‘‘late’’ radio light curvesare essentially the same for both thermal, free-free absorption (FFA)and nonthermal synchrotron self-absorption (SSA) models. There-fore, the only two remaining parameters to be determined are thespectral index (�) and the decline rate (� ). Least-squares fittingreveals that the ‘‘late’’ data are consistent with a constant spectral
index equal to that derived for the early data (� ¼ �0:8) but witha much faster rate of decline with � steepening from �0.7 to�2.7. However, examination of Figure 11 shows that such a fit(dotted lines) does not describe the data well, and an exponentialdecline with an e-folding time of 1100 days (Fig. 11, solid lines)provides a much better fit. Chandra et al. (2004) have proposed asteepening of the spectral index after day 3200, but Figures 9 and11, both of which use constant spectral index models, do notappear to confirm their suggestion (see also x 5.4).
5. DISCUSSION
5.1. Synchrotron Self-Absorption versusThermal Free-Free Absorption
Chevalier (1998) proposed that nonthermal synchrotron self-absorption (SSA) could play a significant role in the early turn-on,absorption-dominated phase of the radio emission from super-novae.While the possibility is included in the parameterization ofthe radio emission discussed above in equations (2) and (8), actualobservational evidence for the difference in turn-on rate expectedbetween thermal free-free absorption (FFA) and SSA has beendifficult to establish. Certainly there are valid physical argumentsfor expecting SSA to play a role in the radio emission from RSNewhich are radio luminous at early times.
The source brightness temperature (TB) is simply proportionalto the source flux density (S ), corrected where appropriate forsuppression of the flux density by external free-free absorption,divided by the source angular size (��2). The temperature TB can-not exceed 3 ; 1011 K (Kellermann & Pauliny-Toth 1969;Readhead 1994) without being quenched by inverse Comptonscattering and the consequent SSA. The problems in determining
Fig. 6.—Brightness temperature (TB) evolution for SN 1993J for, from left toright, 0.3 cm (crosses), 1.2 cm ( filled squares), 2 cm (open squares), 3.6 cm( filled circles), 6 cm (open triangles), 20 cm ( filled triangles), 49 cm (stars), and90 cm (open diamonds) for the case of a pure synchrotron self-absorption (SSA)model as described in the text with the parameters listed in Table 4, col. (2). Thehorizontal dashed line denotes the limiting value of TB ’ 3 ; 1011 K (Kellermann&Pauliny-Toth 1969;Readhead 1994), which is not reached at any frequency. Notethat the brightness temperature is low at early times, reaches a peak which alwaysfalls well below 3 ; 1011 K, and occurs at later times for lower frequencies.
Fig. 7.—Brightness temperature (TB) evolution for SN 1993J for, from left toright, 0.3 cm (crosses), 1.2 cm ( filled squares), 2 cm (open squares), 3.6 cm( filled circles), 6 cm (open triangles), 20 cm ( filled triangles), 49 cm (stars), and90 cm (open diamonds) for the case of a pure thermal, free-free absorption (FFA)model as described in the text with the parameters listed in Table 4, col. (3). Toobtain the ‘‘true’’ brightness temperature at early times, the measured flux den-sities have been corrected for the model estimated external, thermal, free-freeabsorption. The horizontal dashed line denotes the limiting value of TB ’ 3 ;1011 K (Kellermann & Pauliny-Toth 1969; Readhead 1994), which is greatlyexceeded for most frequencies at early times.
LONG-TERM RADIO MONITORING OF SN 1993J 1973No. 2, 2007

this relatively straightforward quantity are that the source angularsize at very early times cannot be directly observed, even withVLBI techniques; there is likely to be some thermal, ionized,absorbing material surrounding these massive exploding stellarsystems giving some level of initial thermal absorption; currentmodels do not include a start-up engine to predict what the fluxdensity would be without any absorption present; and the ve-locity of expansion of the radio emitting region maywell changeduring the very early phases of the radio supernova phenomenon.
All of these factors could lead to a false estimate of the source sizeand source flux density at early times and to an incorrect estimateof the source brightness temperature and the likelihood of SSAdominating.In some objects such as GRBs, where there is evidence for
very little external material to give rise to thermal absorption, andthe objects are very compact and very radio luminous, the casefor SSA seems clear. For example, the nearby GRB 980425 (SN1998bw), although somewhat ambiguous with Kulkarni et al.
Fig. 8.—Radio light curves for SN 1993J, plotted from left to right and top to bottom at 0.3, 1.2, 2, 3.6, 6, 20, 49, and 90 cm. The solid lines represent the best-fitcombined synchrotron self-absorption (SSA) and thermal, free-free absorption (FFA) model as described in the text with the parameters listed in Table 4, col. (4), and anexponential flux density decline after day 3100with an e-folding time of 1100 days. The extrapolation of the best-fit model curves without the exponential roll-off is shownas the dotted lines. Upper limits (3 �) are shown as open inverted triangles.
WEILER ET AL.1974 Vol. 671

(1998) claiming evidence for SSAwhileWeiler et al. (2001) showedthat FFA gives a fit to the data of equal quality, is probably a goodexample where SSA is dominant, at least early on.
Several authors have discussed the possibility of SSA being aprominent absorption mechanism for SN 1993J (Fransson &Bjornsson 1998; Perez-Torres et al. 2001; Bartel et al. 2002),whereas Van Dyk et al. (1994) were able to describe the early ab-sorption effects entirely through FFA in a circumstellar mediumwith a density profile flatter (�CSM / r�1:5) than the �CSM / r�2
expected for a constant mass-loss rate, constant velocity, pre-supernova stellar wind. We have investigated the fitting of bothpure SSA (Figs. 1 and 4) and pure FFA (Figs. 2 and 5) to theextensive data for SN 1993J and find that bothmodels are accept-able from light curve fitting considerations alone (2
SSA ¼ 12:8,2FFA ¼ 8:8)with each fitting some parts of the light curves slightly
better, and some parts of the data slightly worse, than the other.However, when the additional parameters of the spectral indexevolution (Figs. 4 and 5) and the brightness temperature evolution(Figs. 6 and 7) are considered, neither the pure SSA nor the pureFFA models can satisfy all physical conditions, i.e., to reproducesimultaneously the light curves, the spectral index evolution, andthe brightness temperature limit. However, amodelwhich includesboth SSA and FFA can account rather well (2
SSAþFFA ¼ 8:1) for
the observed radio emission from SN 1993J without violatingthe brightness temperature limit and provides a good descriptionof the spectral index evolution (see Figs. 8, 9, and 10).
5.2. Evidence for a ‘‘Flatter’’ Circumstellar Density Profile
When Van Dyk et al. (1994) presented multifrequency radioobservations of SN 1993J for the first eight months of moni-toring, they concluded that the CSM surrounding the supernova,which was likely established by the SN progenitor in the laststages of evolution, consists of (1) a homogeneous medium (K2)with embedded clumpy or filamentary components (K3), and (2) aCSMwith a density profile that is significantly flatter (�CSM / r�1:5)than the �CSM / r�2 expected for a constant mass-loss rate, con-stant velocity presupernova stellar wind. Since the density, andtherefore the radio emission, is proportional to the ratio of themass-loss rate (M ) to the wind speed (w), i.e., M /w, and since thewind speed is unlikely to vary on relatively short timescales, VanDyk et al. (1994) estimated that the mass-loss rate from the SN1993J progenitor system decreased from �10�4 M� yr�1 to�10�5M� yr�1 during the last 1000 yr before explosion. This con-clusion was later supported by Immler et al. (2001), who found asimilarly flat CSM density profile from X-ray observations, andaccepted by other modeling work (Fransson et al.1996). However,
Fig. 9.—Spectral index (�; S / �þ�) evolution for SN 1993J between 1.2 and 2 cm (top left), between 2 and 3.6 cm (top right), between 3.6 and 6 cm (bottom left), andbetween 6 and 20 cm (bottom right). As in Fig. 8 the lines represent the best-fit combined synchrotron self-absorption (SSA) and thermal, free-free absorption (FFA)modelas described in the text with the parameters listed in Table 4, col. (4).
LONG-TERM RADIO MONITORING OF SN 1993J 1975No. 2, 2007
Fransson & Bjornsson (1998) later concluded that the flatter CSMdensity profile is not necessary and the results can be interpreted interms of SSAwith an r�2 density profile and an electron coolingmechanism. Nevertheless, because the X-ray emission arises fromthe thermal component of the CSM, rather than the nonthermalcomponent which gives rise to the radio emission, the support for a‘‘flatter’’ CSM density profile from both radio and X-ray obser-vations appears strong.
With a model that includes both SSA and FFA, the radio dataalone are not able to constrain the CSM profile efficiently, be-cause fits with steep � slopes and high values of the K2 can pro-vide comparable accuracy to shallow � slopes and lowK2 values.Therefore, to calculate our best model, which includes both SSAand FFA and satisfies all observational and physical constraints,we adopted a CSM density profile of �CSM / r�1:61, which isclose to the behavior determined from the evolution of the X-rayluminosity ( Immler et al. 2001; Zimmermann & Aschenbach2003; see also x 5.5).
With these assumptions, the mass-loss rate giving rise to uni-form, external thermal absorption is given by a straightforwardmodification of equation (16) of Weiler et al. (1986), whichbecomes
M M� yr�1ð Þ(wwind=10 km s�1)
¼ 3:0 ; 10�6 �0:5m�1:5
;vi
104 km s�1
� �1:5ti
45 days
� �1:5t
ti
� �1:5mT
104 K
� �0:68
;
ð12Þ
where the extra factor is a small correction that takes into ac-count the fact that, in this case, the CSM density behaves like�CSM / r�1:61 instead of r�2 as it does under the usual constant
mass-loss rate assumption. The factor is given by the squareroot of the ratio of the integration constant for � in the case of�CSM / r�1:61 to the one appropriate for �CSM / r�2, i.e.,
¼ 2 ; 1:61� 1
2 ; 2� 1
� �0:5
¼ 0:86: ð13Þ
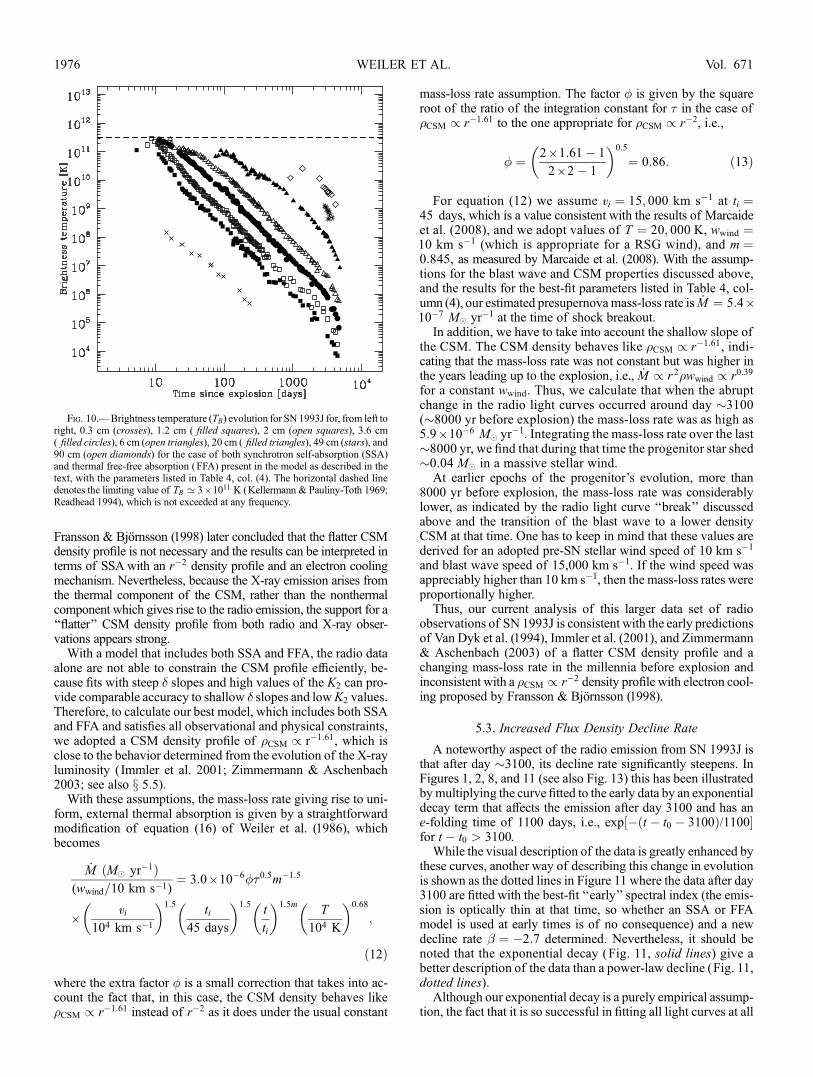
For equation (12) we assume vi ¼ 15; 000 km s�1 at ti ¼45 days, which is a value consistent with the results of Marcaideet al. (2008), and we adopt values of T ¼ 20; 000 K, wwind ¼10 km s�1 (which is appropriate for a RSG wind), and m ¼0:845, as measured by Marcaide et al. (2008). With the assump-tions for the blast wave and CSM properties discussed above,and the results for the best-fit parameters listed in Table 4, col-umn (4), our estimated presupernovamass-loss rate is M ¼ 5:4 ;10�7 M� yr�1 at the time of shock breakout.
In addition, we have to take into account the shallow slope ofthe CSM. The CSM density behaves like �CSM / r�1:61, indi-cating that the mass-loss rate was not constant but was higher inthe years leading up to the explosion, i.e., M / r2�wwind / r0:39
for a constant wwind. Thus, we calculate that when the abruptchange in the radio light curves occurred around day �3100(�8000 yr before explosion) the mass-loss rate was as high as5:9 ; 10�6 M� yr�1. Integrating the mass-loss rate over the last�8000 yr, we find that during that time the progenitor star shed�0.04 M� in a massive stellar wind.At earlier epochs of the progenitor’s evolution, more than
8000 yr before explosion, the mass-loss rate was considerablylower, as indicated by the radio light curve ‘‘break’’ discussedabove and the transition of the blast wave to a lower densityCSM at that time. One has to keep in mind that these values arederived for an adopted pre-SN stellar wind speed of 10 km s�1
and blast wave speed of 15,000 km s�1. If the wind speed wasappreciably higher than 10 km s�1, then the mass-loss rates wereproportionally higher.Thus, our current analysis of this larger data set of radio
observations of SN 1993J is consistent with the early predictionsof Van Dyk et al. (1994), Immler et al. (2001), and Zimmermann& Aschenbach (2003) of a flatter CSM density profile and achanging mass-loss rate in the millennia before explosion andinconsistent with a �CSM / r�2 density profile with electron cool-ing proposed by Fransson & Bjornsson (1998).
5.3. Increased Flux Density Decline Rate
A noteworthy aspect of the radio emission from SN 1993J isthat after day �3100, its decline rate significantly steepens. InFigures 1, 2, 8, and 11 (see also Fig. 13) this has been illustratedbymultiplying the curve fitted to the early data by an exponentialdecay term that affects the emission after day 3100 and has ane-folding time of 1100 days, i.e., exp � t � t0 � 3100ð Þ/1100½ �for t � t0 > 3100.While the visual description of the data is greatly enhanced by
these curves, another way of describing this change in evolutionis shown as the dotted lines in Figure 11 where the data after day3100 are fitted with the best-fit ‘‘early’’ spectral index (the emis-sion is optically thin at that time, so whether an SSA or FFAmodel is used at early times is of no consequence) and a newdecline rate � ¼ �2:7 determined. Nevertheless, it should benoted that the exponential decay (Fig. 11, solid lines) give abetter description of the data than a power-law decline (Fig. 11,dotted lines).Although our exponential decay is a purely empirical assump-
tion, the fact that it is so successful in fitting all light curves at all
Fig. 10.—Brightness temperature (TB) evolution for SN 1993J for, from left toright, 0.3 cm (crosses), 1.2 cm ( filled squares), 2 cm (open squares), 3.6 cm( filled circles), 6 cm (open triangles), 20 cm ( filled triangles), 49 cm (stars), and90 cm (open diamonds) for the case of both synchrotron self-absorption (SSA)and thermal free-free absorption (FFA) present in the model as described in thetext, with the parameters listed in Table 4, col. (4). The horizontal dashed linedenotes the limiting value of TB ’ 3 ; 1011 K (Kellermann & Pauliny-Toth 1969;Readhead 1994), which is not exceeded at any frequency.
WEILER ET AL.1976 Vol. 671

frequencies simultaneously indicates that the decay is the resultof a phenomenon whose e-folding time at all frequencies is veryshort. In other words, the observed decay appears to be domi-nated by the decline of a synchrotron emission energy supply,such as that derived from the blast wave-CSM interaction, implyinga sudden variation in the circumstellar density (and, therefore, in themass-loss rate) rather than an energy loss reflecting the coolingtimes at individual frequencies.
Interpreting this exponential decay in terms of a sudden de-crease of the CSM density leads to a presupernova density dis-tribution that decreases like r�1:61 up a distance of 2:4 ; 1017 cm,and has a sudden drop by a factor of �3 by a radius of �4 ;1017 cm. To cause this, the mass-loss rate had to have a steepenhancement by at least a factor of 3 around 8000 yr before thesupernova explosion and to decrease afterward at a rate pro-portional to t�0:39. This scenario is illustrated in Figure 12, thatshows the mass-loss rate as function of the time before explosion(left) and the H number density as a function of radius (right).The heavy solid curves correspond to behaviors actually con-strained by the radio observations, whereas the dashed curves areextrapolations as a simple power law very near to the star and as
an exponential cutoff plus a constant mass-loss rate at large times(radii) before explosion. This last, an assumed constant mass-loss rate at large times before explosion, is simply notional, sinceour observations provide no constraints at such times (radii). Thedotted lines are power-law extrapolations of the density for largerradii, or the mass-loss rate at earlier epochs, which are drawn justto guide the eye to better appreciate the variations.
In astrophysical terms our empirical result suggests that theprogenitor star underwent a shell ejection that, �8000 yr beforethe supernova explosion, increased the effective mass-loss ratefrom the star by possibly an order of magnitude, which then slowlydecreased with time. This phenomenon is reminiscent of the re-current shell ejections considered by Panagia & Bono (2001) forstars of masses around 12Y14M� that become pulsationally un-stable in their red supergiant phases.
5.4. Spectral Index Evolution
In addition to the radio light curves and their comparison withmodels, it is also possible to examine the spectral index evolu-tion and its comparison with pure SSA (Fig. 4) and pure FFA(Fig. 5) model predictions. Examination of both figures shows
Fig. 11.—‘‘Late’’ (after day 3100) radio light curves, plotted from left to right and top to bottom at 1.2, 2, 3.6, 6, 20, and 49 cm. Since all absorption processes arenegligible, the best model consists of a constant spectral index � fixed from the best-fit ‘‘early’’ light curve model, a decline rate �, and a normalization K1. Whereas the‘‘early’’ data before day 3100 were described by a decline rate of � ¼ �0:7, the ‘‘late’’ data require a decline rate of � ¼ �2:7, shown as the dotted lines. However, aconstant decline rate � is clearly not the best description of the data and an exponential declinewith an e-folding time of 1100 days (solid lines) is a better description. Upperlimits (3 �) are shown as open inverted triangles.
LONG-TERM RADIO MONITORING OF SN 1993J 1977No. 2, 2007

that the spectral index evolution is reasonably well describedonly by the FFA model. However, as discussed earlier, the pureFFA model appears unrealistic when brightness temperature con-siderations (Fig. 7) are included. Our best model, a combinationof both SSA and FFA processes (Fig. 8), fits the spectral indexevolution (Fig. 9) quite well and satisfies the brightness temper-ature limitations (Fig. 10). Nevertheless, deviations can still benoticed in the light curves and in the spectral index evolutionbecause, as mentioned earlier, we cannot expect simple modelsto describe such a complex phenomenon as a supernova explo-sion in detail.
Particular note should be made of the late time spectral indexevolution. Chandra et al. (2004) suggest a break in the spectrumaround day �3200, with higher frequency flux densities declin-ing faster than lower frequency ones, leading to a steepening ofthe spectral index. From this they were able to calculate a num-ber of physical properties of the radio emitting region. With datanow extending to day �5000 it is possible to check for such abreak. Examination of the agreement between our constant spec-tral index model curves and the data, particularly in Figure 11,does not appear to confirm this suggestion.
5.5. Radio and X-Ray Evolution
A comparison of the radio and X-ray light curves reveals fea-tures that can help to understand the SN 1993J phenomenon. Thetop panel of Figure 13 shows the X-ray light curve as summa-rized by Zimmermann & Aschenbach (2003) plus two recentmeasurements obtained with the Swift satellite (S. Immler 2007,private communication). We have calculated a fit to the upperenvelope of the X-ray data that gives LX / t�0:22, i.e., a slopethat is a little flatter than the Zimmermann &Aschenbach (2003)value of �0.30, and that implies a density behavior of �CSM /r�1:61, again marginally flatter than Zimmermann&Aschenbach(2003) estimate of �CSM / r�1:65.
The other five panels display the observed radio data (withoutshowing upper limits) at 1.2, 2, 3.6, 6, and 20 cm and their best-
fit curves as already shown in Figure 8 and given in Table 4,column (4). The two vertical dashed lines are meant to guide theeye to two particular events, the rightmost being the alreadydiscussed steepening of the flux density decline rate of the radioemission after day �3100, and the leftmost being an apparent‘‘dip’’ of the X-ray luminosity around day�460. Even if the X-raycoverage at late times is rather sparse, the two most recent meas-urements appear to confirm a steepening seen in the radio decayrate after day 3100, consistent with the same e-folding time of1100 days. Also, it is intriguing that the radio light curve at 1.2cm appears to ‘‘dip’’ in a manner similar to the X-ray luminosityaround day�460. Both the X-ray and the 1.2 cm light curves arewell enough sampled to provide rough timescales for this event,i.e., the dip has �70 days half-power width at 1.2 cm and�280 days half-power width at X-ray wavelengths.Since radio emission is due to synchrotron processes, whereas
the X-ray emission is accounted for by reverse shock heating,these coincidences in the overall evolution suggest that the ob-served variations are the result of a change in the efficiency of theenergy supply, i.e., most likely due to anomalies in the circum-stellar medium density distribution. On the other hand, it is notclear why a significant variation is observed in the 1.2 cm fluxdensity at the time of the X-ray dip around 460 days, but no ap-preciable changes are recorded at other equally well sampledradio frequencies.
6. CONCLUSIONS
We present detailed radio observations of SN 1993J at mul-tiple wavelengths for �13 yr after explosion. This data collec-tion arguably represents the most detailed set of observations ofany supernova at any wavelength except for the nearby andspectacular SN 1987A.The radio emission evolves regularly in both time and fre-
quency, and the usual interpretation in terms of shock interactionwith a complex circumstellar medium (CSM) formed by a pre-supernova structured stellar wind, with the inclusion of both
Fig. 12.—Left: Presupernova mass-loss rate as function of the time before explosion. Right: CSM hydrogen number density as a function of radius. The heavy solidcurves correspond to behaviors actually constrained by the radio observations, whereas the dashed curves are extrapolations as a simple power law very near to the star andan exponential cutoff plus a constant mass-loss rate at large times (radii) before explosion. This last—an assumed constant mass-loss rate at large times before explosion—is simply notional since our observations provide no constraints at such times (radii). The dotted lines are power-law extrapolations of the density for larger radii or themass-loss rate at earlier epochs, which are drawn just to guide the eye to better appreciate the variations.
WEILER ET AL.1978 Vol. 671

synchrotron self-absorption (SSA) and thermal free-free absorp-tion (FFA) at early times, describes the observations rather wellconsidering the complexity of the phenomenon. However, thereare some notable characteristics peculiar to SN 1993J: (1) At atime around day �3100 after shock breakout the decline rate ofthe radio emission steepens from (tþ�) � � �0:7 to �2.7 withoutchange in the spectral index (�þ�;� � �0:81); this variation, how-ever, can better be described in terms of an exponential decay start-
ing at day �3100 with an e-folding time of �1100 days. (2) Thespectral index appears constant throughout our measurement era.(3) The best overall fit to all of the ‘‘early’’ (i.e., before day 3100)data is a model including both SSA and FFA components, evolv-ing to a constant decline rate until the break at day �3100; inparticular, neither a pure SSA nor a pure FFA absorbing modelcan provide a fit that simultaneously reproduces the light curves andthe spectral index evolution and provides a physically realistic
Fig. 13.—X-ray and best-populated radio data sets (no upper limits are shown) plotted on the same timescale for comparison. Each panel is labeledwith the wavelengthof the observations. The vertical dashed lines denote the epoch of a prominent dip in the X-ray light curve (around day�460) and the beginning of the overall decay at allfrequencies (around day�3100). Note that the first X-ray dip corresponds to a similar dip in the 1.2 cm radio light curve that is not prominent at longer radio wavelengths.
LONG-TERM RADIO MONITORING OF SN 1993J 1979No. 2, 2007

brightness temperature evolution. (4) The radio and X-ray lightcurves display quite similar behavior and their comparison sug-gests the presence of at least two episodes of change in the super-nova progenitor mass-loss rate in the last several thousand yearsbefore explosion.
We are indebted to the VLATAC and schedulers for permit-ting and arranging our numerous observations over many yearsand to observers who have contributed data at other radio wave-
lengths, sometimes unpublished. K. W. W. wishes to thank theOffice of Naval Research (ONR) for the 6.1 funding supportinghis research. C. J. S. is a Cottrell Scholar of Research Corporationand work on this project has been supported by the NASA Wis-consin Space Grant Consortium. N. P. is Astronomer Emeritus atthe Space Telescope Science Institute (STScI) that kindly pro-vided research facilities and partial support for this work. J.M.M.acknowledges support from grant AYA2006-14986-C02-02. Ad-ditional information and data on radio supernovae can be found onhttp://rsd-www.nrl.navy.mil/7213/weiler/sne-home.html and linkedpages.
REFERENCES
Andrillat, Y., Prugniel, P., Perelmuter, J.-M., Shanklin, J. D.,Kohl, R., Cianciolo, F.,Gearhart, R., & Dosaj, A. 1993, IAU Circ., 5736
Bartel, N., et al. 1994, Nature, 368, 610———. 2000, Science, 287, 112———. 2002, ApJ, 581, 404Bietenholz, M. F., Bartel, N., & Rupen, M. P. 2001, ApJ, 557, 770———. 2003, ApJ, 597, 374Chandra, P., Bhatnagar, S., & Ray, A. 2001, IAU Circ., 7657Chandra, P., Ray, A., & Bhatnagar, S. 2004, ApJ, 612, 974Chevalier, R. A. 1982a, ApJ, 259, 302———. 1982b, ApJ, 259, L85———. 1998, ApJ, 499, 810Filippenko, A. V., Matheson, T., & Ho, L. 1993a, ApJ, 415, L103Filippenko, A. V., et al. 1993b, IAU Circ., 5740Fransson, C., & Bjornsson, C.-I. 1998, ApJ, 509, 861Fransson, C., Lundqvist, P., & Chevalier, R. A. 1996, ApJ, 461, 993Freedman, W. L., et al. 1994, ApJ, 427, 628Gomez, G. 1993, IAU Circ., 5733Immler, S., Aschenbach, B., & Wang, Q. D. 2001, ApJ, 561, L107Kellermann, K. I., & Pauliny-Toth, I. I. K. 1969, ApJ, 155, L71Kulkarni, S. R., et al. 1998, Nature, 395, 663Marcaide, J. M. 2005, in ASP Conf. Ser. 342, 1604-2004: Supernovae asCosmological Lighthouses, ed. M. Turatto et al. (San Francsco: ASP), 298
Marcaide, J. M., et al. 1993a, IAU Circ., 5785———. 1993b, IAU Circ., 5820———. 1994, ApJ, 424, L25———. 1995a, Nature, 373, 44———. 1995b, Science, 270, 1475———. 1997, ApJ, 486, L31———. 2008, in pressMontes, M. J., Van Dyk, S. D., Weiler, K. W., Sramek, R. A., & Panagia, N.1998, ApJ, 506, 874
Montes, M. J., Weiler, K. W., & Panagia, N. 1997, ApJ, 488, 792Montes, M. J., Weiler, K. W., Van Dyk, S. D., Panagia, N., Lacey, C. K.,Sramek, R. A., & Park, R. 2000, ApJ, 532, 1124
Natta, A., & Panagia, N. 1984, ApJ, 287, 228Nomoto, K., Suzuki, T., Shigeyama, T., Kumagai, S., Yamaoka, H., & Saio, H.1993, Nature, 364, 507
Osterbrock, D. E. 1974, Astrophysics of Gaseous Nebulae (San Francisco:Freeman)
Panagia, N., & Bono, G. 2001, in The Largest Explosions Since the Big Bang,ed. M. Livio, N. Panagia, & K. Sahu (Cambridge: Cambridge Univ. Press),184
Perez-Torres, M. A., Alberdi, A., & Marcaide, J. M. 2001, A&A, 374, 997———. 2002, A&A, 394, 71Phillips, J. A., & Kulkarni, S. R. 1993, IAU Circ., 5884Phillips, J. A., Kulkarni, S. R., Skiff, B., Hanzl, D., Hornoch, K., & Kysely, J.1993a, IAU Circ., 5775
Phillips, J. A., Morbidelli, L., & Kulkarni, S. R. 1993b, IAU Circ., 5763Podsiadlowski, P., Hsu, J. J. L., Joss, P. C., & Ross, R. R. 1993, Nature, 364,509
Pooley, G. G., & Green, D. A. 1993, MNRAS, 264, L17Pooley, G. G., Green, D. A., & Romanishin, W. 1993, IAU Circ., 5751Radford, S., Neri, R., Guilloteau, S., & Downes, D. 1993, IAU Circ., 5768Readhead, A. C. S. 1994, ApJ, 426, 51Ripero, J., et al. 1993, IAU Circ., 5731Sramek, R. A., & Weiler, K. W. 2003, in LNP 598, Supernovae and Gamma-Ray Bursters, ed. K. W. Weiler (Berlin: Springer), 145
Sramek, R. A., et al. 1993, IAU Circ., 5743Stockdale, C. J., et al. 2007, ApJ, in pressSwartz, D. A., Clocchiatti, A., Benjamin, R., Lester, D. F., & Wheeler, J. C.1993, Nature, 365, 232
van Driel, W., et al. 1993, PASJ, 45, L59Van Dyk, S. D., Nguyen, H.-A., Weiler, K. W., Sramek, R. A., Rupen, M. P., &Panagia, N. 1993a, IAU Circ., 5828
Van Dyk, S. D., Sramek, R. A., Weiler, K., & Panagia, N. 1993b, ApJ, 419, L69Van Dyk, S. D., Weiler, K. W., Rupen, M. P., Sramek, R. A., & Panagia, N.1993c, IAU Circ., 5759
Van Dyk, S. D., Weiler, K. W., Sramek, R. A., Rupen, M. P., & Panagia, N.1994, ApJ, 432, L115
Weiler, K. W., Panagia, N., & Montes, M. J. 2001, ApJ, 562, 670———. 2003, in LNP 598, Supernovae and Gamma-Ray Bursters, ed. K. W.Weiler (Berlin: Springer), 367
Weiler, K. W., Panagia, N., Montes, M. J., & Sramek, R. A. 2002, ARA&A, 40,387
Weiler, K. W., Panagia, N., & Sramek, R. A. 1990, ApJ, 364, 611Weiler, K. W., Panagia, N., Sramek, R. A., van der Hulst, J. M., Roberts, M. S.,& Nguyen, L. 1989, ApJ, 336, 421
Weiler, K. W., Sramek, R. A., Panagia, N., van der Hulst, J. M., & Salvati, M.1986, ApJ, 301, 790
Weiler, K. W., Sramek, R. A., Van Dyk, S. D., & Panagia, N. 1993, IAU Circ.,5752
Wheeler, J. C., et al. 1993, ApJ, 417, L71Williams, C. L., Panagia, N., Van Dyk, S. D., Lacey, C. K., Weiler, K. W., &Sramek, R. A. 2002, ApJ, 581, 396
Zimmermann, H.-U., & Aschenbach, B. 2003, A&A, 406, 969
WEILER ET AL.1980