long-term effect of nutrient management on soil fertility and soil organic carbon pools under a...
TRANSCRIPT

Lps
PD
a
ARRA
KSSNCP
1
mcdraiTbgeorto
0h
Field Crops Research 136 (2012) 32–41
Contents lists available at SciVerse ScienceDirect
Field Crops Research
jou rna l h om epage: www.elsev ier .com/ locate / fc r
ong-term effect of nutrient management on soil fertility and soil organic carbonools under a 6-year-old pearl millet–wheat cropping system in an Inceptisol ofubtropical India
.C. Moharana, B.M. Sharma, D.R. Biswas ∗, B.S. Dwivedi, R.V. Singhivision of Soil Science and Agricultural Chemistry, Indian Agricultural Research Institute, New Delhi 110012, India
r t i c l e i n f o
rticle history:eceived 18 May 2012eceived in revised form 29 June 2012ccepted 2 July 2012
eywords:oil fertilityoil organic carbon poolsutrient managementarbon management indexearl millet–wheat cropping system
a b s t r a c t
We studied the long-term effect of nutrient management on soil fertility and soil organic carbon (SOC)pools under a 6-year-old pearl millet–wheat cropping system in an Inceptisol of subtropical India. Sig-nificant build-up in soil fertility in terms of alkaline KMnO4-N, Olsen-P, NH4OAc-K and CaCl2-S as wellas SOC pools namely, total organic carbon (TOC), Walkley and Black organic carbon (WBC), labile organiccarbon (LBC) and microbial biomass carbon (MBC) were maintained under FYM and integrated nutrientmanagement involving FYM and NPK than unfertilized control plot in 0–15 and 15–30 cm soil depths. Thehighest values of TOC (11.48 g kg−1) and WBC (7.86 g kg−1) were maintained in FYM treated plot, whilethe highest values of LBC (1.36 g kg−1) and MBC (273 mg kg−1) were found in FYM + NPK. The magnitude ofchange in pools of SOC in sub-surface (15–30 cm) soil was low as compared to the surface soil (0–15 cm).Significant increase in all the pools of SOC in FYM treated plots indicates the importance of application oforganic manure like FYM in maintaining organic carbon in soil. Highly strong relationships were exhibited
between LBC and MBC with yield, indicating that these pools are more important for nutrient turn-overand their availability to plants than total SOC. Carbon management index revealed that integrated nutri-ent management could be followed for enhancing crop productivity, nutrient availability and soil carbonpools for long-term. These results conclude that for sustainable crop production and maintaining soilquality, input of organic manure like FYM is of major importance and should be advocated in the nutrientmanagement of intensive cropping system for improving soil fertility and biological properties of soils.. Introduction
Soil organic carbon (SOC) is the most important component inaintaining soil quality because of its role in improving physi-
al, chemical and biological properties of the soil. Stagnation orecline in yields has been observed in intensive cropping systems inecent times all over the world and India in particular. The reasonsscribed to this phenomenon are quality and quantity of SOC and itsmpact on nutrient supply (Bhandari et al., 2002; Ladha et al., 2003).he level of SOC at a point of time reflects the long-term balanceetween addition and losses of SOC, particularly carbon and nitro-en, under continuous cultivation (Dalal and Mayer, 1986; Dawet al., 2003; Manna et al., 2005). Changes in agricultural practicesften influence both quantity and quality of SOC and its turn-over
ates. Application of manure is a common management practicehat improves the fertility status of soil and SOC level. As the turn-ver of SOC is of paramount importance for sustaining soil quality∗ Corresponding author. Tel.: +91 11 25841494/965; fax: +91 11 25841529.E-mail address: drb [email protected] (D.R. Biswas).
378-4290/$ – see front matter © 2012 Elsevier B.V. All rights reserved.ttp://dx.doi.org/10.1016/j.fcr.2012.07.002
© 2012 Elsevier B.V. All rights reserved.
and long-term productivity of agricultural systems, measurementsof changes in SOC under various nutrient management practicesin intensive cropping system are the need of the day. In additionto total SOC, it is also important to determine active carbon frac-tions in soil (Lal, 1994). Small changes in total SOC are difficult todetect because of large background levels and natural variability(Blair et al., 1995; Carter, 2002). Intensive cultivation can declineboth total and labile organic carbon in soil (Blair, 2000). Thus, reg-ular additions of organic materials to soil are required to improveand maintain SOC pools as well as to help in governing nutrientfluxes, microbial biomass and their activities and improvement insoil physical properties (Marinari et al., 2000).
Labile organic carbon is sensitive to soil management practicesand thus provides the better management of carbon dynamics inshort-term to medium-term effect than total carbon alone. Soilorganic carbon refers to the sum total of different heterogeneousorganic substances, which may be simply divided into stable and
labile organic carbon fractions (Wander, 2004). Stable SOC fractionsare relatively resistant to decompose, take longer time to turn-overand do not take part in several nutrient cycling. However, labile SOCfractions are readily accessible source of microorganisms, turn-over
rops R
rptttablSs
teaiti2ssfeiammrwfeuoptatptfam
2
2
sInTfivtsmcaetavmct
P.C. Moharana et al. / Field C
apidly (weeks or months) and have impact on plant nutrient sup-ly. Labile SOC fractions could indicate changes in soil quality dueo management practices more rapidly than measuring changes inhe magnitude of total SOC (Ding et al., 2006). Some of the impor-ant labile pools of SOC currently used as indicators of soil qualityre microbial biomass carbon (MBC), mineralizable organic car-on (Cmin), particulate organic carbon (POC) and KMnO4-oxidizable
abile organic carbon (LBC). Highly recalcitrant or passive pool ofOC is very slowly altered by microbial activities and hence hardlyerves as a good indicator for judging soil quality.
Pearl millet–wheat cropping system is the second most impor-ant system after rice–wheat in Indo-Gangetic Plain of India (Kumart al., 2005). This cropping system is followed in an estimatedrea of 2.26 million ha in India (Yadav and Subba Rao, 2002). Its being increasingly realized that when crops are grown in sys-em, the fertilizer requirements of the cropping system as a wholes important than that of the individual crop (Sharma and Singh,003). The soil fertility status and their availability to plants aretrongly affected by nutrient management practices and croppingystems (Bhandari et al., 2002; Kundu et al., 2002). The loss of soilertility, in many developing countries, due to continuous nutri-nt depletion by crops without adequate replenishment poses anmmediate threat to food and environmental securities. There is
need to revive the age-old practice of application of farmyardanure (FYM) to maintain soil fertility and also to supplementany essential plant nutrients for crop productivity. The fertilizer
ecommendations based on targeted yield equations have beenell established in India through number of follow-up trials and
rontline demonstrations (Subba Rao and Srivastava, 2001). How-ver, information on long-term effect of these recommendationssed with or without FYM in a pearl millet–wheat cropping systemn soil fertility and different pools of SOC is limited. Keeping theseoints in mind, the present field experiment was conducted to seehe long-term effect of soil fertility and pools of soil organic carbons influenced by nutrient management with FYM and chemical fer-ilizers applied either alone or in combination under a 6-year-oldearl millet–wheat cropping system. We hypothesized that long-erm application of carbon through FYM and N, P and K throughertilizers will have distinct effects on the soil fertility, nutrientvailability and soil organic carbon pools under a 6-year-old pearlillet–wheat cropping system in an Inceptisol of subtropical India.
. Materials and methods
.1. Site descriptions
The present field experiment on pearl millet–wheat croppingystem was initiated in monsoon 2003 at the research farm ofndian Agricultural Research Institute (IARI), New Delhi under theetwork of All India Coordinated Research Project (AICRP) on Soilest Crop Response (STCR) Correlation Studies. The experimentaleld is located at 28.4◦N latitude, 77.1◦E longitude and at an ele-ation of about 250 m above the mean sea level. The climate ofhe experimental site is semi-arid with hot and dry summer andevere cold winter intervened by short monsoon period of 2–3onths spreading from July to September. On the basis of 30 years
limatic data, the mean maximum temperature, minimum temper-ture and rainfall are 31.2 ◦C, 17.0 ◦C and 821 mm, respectively. Thexperimental area represents Indo-Gangetic Plains which belongso Mehrauli series. The soil is Inceptisol having sandy loam texture,lkaline reaction and free from salinity occurring on nearly level to
ery gently sloping land. Soil structure is sub-angular blocky. Clayineralogy is dominated by illite along with presence of kaolinite,hlorite and chloritized montmorillonite. Taxonomically it belongso Typic Haplustept.
esearch 136 (2012) 32–41 33
2.2. Experimental design and treatments
The field experiment on pearl millet–wheat cropping systemwas designed under AICRP-STCR with three different nutrient man-agement practices along with a control in a randomized blockdesign with four replications. The treatments selected for this studyconsisted of (i) unfertilized/unmanured control (Control); (ii) FYMalone @ 20 Mg ha−1 to each crop (FYM); (iii) STCR-based fertil-izer NPK alone for grain yield target of 2.5 Mg ha−1 of pearl milletand 5.0 Mg ha−1 of wheat (NPK); and (iv) STCR-based integrateduse of 10 Mg ha−1 of FYM + fertilizer NPK for grain yield target of2.5 Mg ha−1 of pearl millet and 5.0 Mg ha−1 of wheat (FYM + NPK).The purpose of selecting FYM alone was to investigate the long-term use of organic manure alone on yield and soil productivity.Application of FYM @ 20 Mg ha−1 was adopted so as to provide100 kg N ha−1. The treatments, NPK fertilizer alone and FYM + NPKwere selected to investigate the effect of STCR-based fertilizer NPKmanagement (i.e. fertilizers only) and STCR-based integrated man-agement of FYM + fertilizers NPK on soil available nutrient andpools of SOC at the same level of targeted yield production asestablished by Ramamoorthy et al. (1967). In the present fieldexperiment, the soil test based fertilizer adjustment equations withand without FYM for targeted levels of grain production of pearlmillet (2.5 Mg ha−1) and wheat (5.0 Mg ha−1) grown in sequencefor 6 years as developed by Sharma and Singh (2003) under AICRPon Soil Test Crop Response Correlation at IARI, New Delhi wereused for fertilizer management in NPK and FYM + NPK treatments,respectively. The following fertilizer adjustment equations wereused for calculation of inputs of nutrients from fertilizers and FYM:
Fertilizer adjustment equations for pearl milletWithout FYM With FYMFN = 69.7 T − 0.36 SN FN = 53.5 T − 0.29 SN − 2.23 FYMFP2O5 = 57.3 T − 4.81 SP FP2O5 = 47.2 T − 3.29 SP − 2.48 FYMFK2O = 39.2 T − 0.28 SK FK2O = 28.8 T − 0.17 SK − 1.35 FYMFertilizer adjustment equations for wheatWithout FYM With FYMFN = 43.0 T − 0.44 SN FN = 38.5 T − 0.41 SN − 1.64 FYMFP2O5 = 37.9 T − 6.02 SP FP2O5 = 27.8 T − 4.12 SP − 1.72 FYMFK2O = 23.4 T − 0.33 SK FK2O = 20.4 T − 0.29 SK − 0.88 FYM
where FN, FP2O5 and FK2O stand for fertilizer rate (kg ha−1) of N,P2O5 and K2O, respectively; SN, SP and SK stand for soil test values(kg ha−1) for KMnO4-N (Subbiah and Asija, 1956), Olsen-P (Olsenet al., 1954) and NH4OAc-K (Hanway and Heidel, 1952), respec-tively; FYM stands for dose of farmyard manure (Mg ha−1) and Tdenotes the targeted yield (Mg ha−1). Based on the above equa-tions, the inputs of nutrients from fertilizers and FYM under eachtreatment are presented year-wise in Table 1.
2.3. Soil sampling and crop management
Prior to start of the experiment, two exhaustive crops namely,pearl millet during monsoon and wheat during winter seasonwere grown to bring the uniformity in soil fertility in the field.After harvesting the second exhaustive crop of wheat, the com-posite initial soil samples from surface (0–15 cm) and sub-surface(15–30 cm) layer were collected and analyzed for physicochemicalproperties. The field was divided into four equal size strips andeach strip was divided into four equal size plots of 20 m × 4 m each.The treatments were distributed randomly using a randomizedblock design. Before application of fertilizer doses in each crop,plot-wise soil samples from 0 to 15 cm and 15 to 30 cm depthwere collected and analyzed for available N, P and K status and
soil test based fertilizer doses for NPK and FYM + NPK treatmentswere calculated from the fertilizer adjustment equations for pearlmillet and wheat as mentioned earlier. The pearl millet (cv Pusa383) and wheat (cv HD 2687) were grown in sequence for 6 years
34 P.C. Moharana et al. / Field Crops Research 136 (2012) 32–41
Table 1Year-wise input of nutrients from fertilizers and FYM under each treatment in a 6-year-old pearl millet–wheat cropping system using targeted yield equations.
Year Treatments
Control FYM (Mg ha−1) NPK NPK + FYM
N (kg ha−1) P2O5 (kg ha−1) K2O (kg ha−1) N (kg ha−1) P2O5 (kg ha−1) K2O (kg ha−1) FYM (Mg ha−1)
Pearl millet2003 0 20.0 108.0 36.5 45.8 59.3 19.8 26.6 10.02004 0 20.0 109.8 27.8 43.5 53.6 11.9 26.5 10.02005 0 20.0 110.7 21.1 44.0 52.7 11.9 26.2 10.02006 0 20.0 111.6 15.5 42.8 50.0 7.7 23.6 10.02007 0 20.0 111.3 17.7 44.2 50.0 5.4 23.7 10.02008 0 20.0 110.9 12.3 43.4 50.0 1.4 22.7 10.0
Wheat2003–04 0 20.0 134.9 47.3 53.1 100.7 18.0 38.0 10.02004–05 0 20.0 136.7 43.2 52.5 93.3 21.7 37.8 10.02005–06 0 20.0 137.6 33.0 51.2 93.3 20.0 25.8 10.0
51.0
49.8
49.4
wdHbdkpo
2
(t(ss
swrtp(itc
TP
2006–07 0 20.0 138.0 25.8
2007–08 0 20.0 139.3 25.8
2008–09 0 20.0 139.3 23.3
ith the same treatments. Fertilizer materials used were urea,iammonium phosphate (DAP) and muriate of potash (MOP).alf quantity of N and full quantities of P and K were applied asasal in both the crops by broadcasting followed by mixing byisc plough. Remaining half of N was applied as top-dressing atnee-height stage (45 days after sowing) in pearl millet and atanicle emergence (55 days after sowing) in wheat. Irrigation andther agronomic practices were carried out as and when required.
.4. Soil analysis
The initial soil samples from surface (0–15 cm) and sub-surface15–30 cm) were analyzed for mechanical composition, pH, elec-ric conductivity (EC), cation exchange capacity (CEC), bulk densityBD), organic carbon and available nutrients (N, P, K and S) followingtandard procedures. The physicochemical properties of the initialoil under study are presented in Table 2.
After completion of six cropping cycles of pearl millet–wheat,oil samples from surface (0–15 cm) and sub-surface (15–30 cm)ere collected. In each plot the soil was collected from ten points
andomly, and mixed into one sample. After carefully removinghe surface organic materials and fine roots, each mixed soil sam-le was divided into two parts. One part of the fresh soil sample
∼100 g) was sieved through a 2-mm screen and immediately keptn a refrigerator at 4 ◦C in plastic bags for a few days to stabilizehe microbiological activity and subsequently analyzed for biologi-al properties. The other part of the sample was air-dried in shade,able 2hysicochemical properties and fertility status of the experimental soil before commenci
Soil characteristics Soil depth
0–15 cm
Mechanical composition
Sand (%) 56.5
Silt (%) 25.0
Clay (%) 18.5
Texture Sandy loam
pH 8.44
EC (dS m−1) 0.32
Bulk density (Mg m−3) 1.59Organic carbon (g kg−1) 5.2
CEC [cmol(p+) kg−1 soil] 10.7
KMnO4-N (kg ha−1) 183
Olsen-P (kg ha−1) 22.4
NH4OAc-K (kg ha−1) 188
CaCl2-S (kg ha−1) 10.6
88.8 10.6 30.9 10.088.4 8.9 28.2 10.088.0 8.9 27.7 10.0
ground to pass through a 2-mm sieve and used for the estimationof soil chemical properties.
The alkaline potassium permanganate oxidizable soil N(KMnO4-N) as an index of available N was determined as perthe procedure given by Subbiah and Asija (1956). Olsen-P wasextracted with 0.5 M sodium bicarbonate (pH 8.5) as outlined by(Olsen et al., 1954) and the P content in the extract was deter-mined using ascorbic acid as reducing agent (Watanabe and Olsen,1965) by a spectrophotometer. Available potassium (NH4OAc-K)was extracted with neutral 1 N ammonium acetate (Hanway andHeidel, 1952) and estimated by a flame photometer; while availablesulphur (CaCl2-S) was determined by extracting the soil samplewith 0.15% CaCl2 (Williams and Steinbergs, 1959) and sulphur con-tent in the extract was estimated by turbidimetric method (Chesninand Yien, 1950).
Total organic carbon (TOC) in soil was determined by wet oxida-tion method (Snyder and Trofymow, 1984). While, organic carboncontent was determined by wet oxidation method of Walkley andBlack (1934). The Walkley and Black method is based on oxidationof organic matter by K2Cr2O7 with H2SO4 heat of dilution. Some-what less of the total organic matter is oxidized by this method,because the heating obtained by the H2SO4 dilution is less andthus Walkley–Black method tends to underestimate SOC concen-trations. Studies have shown that the recovery of organic C using
the Walkley and Black procedure ranged from 60 to 86% with amean recovery being 76% as a result of the incomplete oxidation(Walkley and Black, 1934). To overcome the concern of incom-plete digestion of the organic matter, TOC in soil is determined byng the study.
Method followed
15–30 cm
Bouyoucos (1962)56.426.017.6
Sandy loam8.44 Jackson (1973)0.25 Jackson (1973)1.72 Veihmeyer and Hendrickson (1948)2.6 Walkley and Black (1934)6.15 Jackson (1973)168 Subbiah and Asija (1956)6.3 Olsen et al. (1954)134 Hanway and Heidel (1952)8.2 Williams and Steinbergs (1959)
rops R
wmFwwtaitc
cP(ft1deotht
wcsfwl
M
wgbsa
cistwtstM(
2
6sc(dsmcap
(m
4 (m
P.C. Moharana et al. / Field C
et oxidation method (Snyder and Trofymow, 1984) where organicatter in the sample is converted to CO2 which is then quantified.
or this, air-dried sample of soil (1.0 g, 1-mm sieve) was pre-treatedith 3.0 ml of 2 N HCl to remove carbonates, then soil was oxidizedith potassium dichromate (K2Cr2O7) in presence of 25 ml of mix-
ure of concentrated H2SO4 and H3PO4 in a ratio of 3:2 by heating on digestion block at 120 ± 1 ◦C for 2 h. The evolved CO2 was trappedn 2 N NaOH and amount of CO2 (entrapped) was measured by backitration with 0.5 N HCl using phenolphthalein as indicator. Totalarbon content was computed based on the amount of CO2 evolved.
Microbial biomass carbon (MBC) was estimated by thehloroform-fumigation incubation method of Jenkinson andowlson (1976). Sample of soil (10.0 g) rewetted to 40–60% WHCwater holding capacity) was fumigated with ethanol-free chloro-orm (CHCl3) in a vacuum desiccator. Following fumigant removal,he soil was extracted with 0.5 M K2SO4 (soil:solution ratio of:2.5) through 30 min horizontal shaking at 200 rpm and filtered. Auplicate soil sample without fumigation (unfumigated) was alsoxtracted with 0.5 M K2SO4 in a similar fashion. Both the extractsf fumigated and unfumigated soil were subjected to wet oxida-ion separately with potassium persulphate and 0.025 N H2SO4 byeating on a digestion block at 120 ± 1 ◦C for 2 h. Evolved CO2 washen trapped in 0.1 N NaOH solution. The amount of CO2 evolved
as determined by back titration with 0.05 N HCl. The MBC wasomputed by subtracting the amount of CO2 evolved in fumigatedoil from that of unfumigated one. A sub-sample of soil was drawnor moisture determination so as to express the data on oven dryeight basis. The amount of the MBC in soil was calculated as fol-
ows:
icrobial biomass carbon = OCF − OCUF
KEC
here OCF and OCUF are the organic carbon extracted from fumi-ated and unfumigated soil, respectively (expressed on oven dryasis), and KEC is the efficiency of extraction. A value of 0.45 is con-idered as a general KEC value for microbial extraction efficiencynd used for calculation.
Labile carbon (LBC) in soil was determined by following the pro-edure of Blair et al. (1995). Moist sample of soil (2.0 g) was takenn centrifuge tube and oxidized with 25 ml of 333 mM KMnO4 byhaking on a mechanical shaker for 1 h. The tubes were then cen-rifuged for 5 min at 4000 rpm and 1.0 ml of supernatant solutionas diluted to 250 ml with double distilled water. The concen-
ration of KMnO4 was measured at 565 nm wavelength using apectrophotometer. The change in concentration of KMnO4 is usedo estimate the amount of carbon oxidized assuming that 1.0 mM of
nO4− was consumed (Mn7+ → Mn2+) in the oxidation of 0.75 mM
9.0 mg) of carbon.
.5. Plant and FYM analysis
Plot-wise samples of wheat grain and straw were dried at5 ± 1 ◦C in oven and ground in a Wiley mill for chemical analy-is. Total nitrogen was determined after digesting the sample withoncentrated H2SO4 using digestion mixture of K2SO4 and CuSO410:1) followed by steam distillation in a micro-Kjeldahl nitrogenistillation unit (Jackson, 1973). For other nutrients, grain and strawamples were digested with di-acid mixture of HNO3:HClO4 (10:4
Lability of C (L) = C in fraction oxidized by KMnO4
C remaining unoxisized by KMnO
ixing ratio) and subsequently used for analysis. Total phosphorusontent in the acid digest was determined by a spectrophotometerfter developing vanadomolybdo–phosphate yellow colour com-lex as described by Jackson (1973). Potassium content in the acid
esearch 136 (2012) 32–41 35
digest was determined by a flame photometer (Jackson, 1973) andsulphur content by turbidimetric method (Chesnin and Yien, 1950).Fresh sample of FYM was analyzed for total C, N, P, K and S as in caseof plant analysis. Moisture content was determined by gravimetricmethod. The fresh sample of FYM had 0.50% N, 0.32% P, 0.46% K,0.32% S, C/N ratio of 26.5 and 8.9% moisture content (w/w).
2.6. Carbon management index
The carbon management index (CMI) was obtained according tothe mathematical procedures used by Blair et al. (1995), which aredescribed below:
CMI = CPI × LI × 100 (1)
where CPI is the carbon pool index and LI is the lability index.The CPI and the LI are calculated as follows:
Carbon pool index (CPI) = Total C in treated sample (mg g−1)Total C in reference soil (mg g−1)
(2)
Lability index (LI) = Lability of C in sample soilLability of C in reference soil
(3)
g labile C g−1 soil)
g labile C g−1 soil)= LBC (Labile C)
NLC (Non-labile C)(4)
The native uncultivated soil near the experimental field wasused as the reference, with a CMI defined as 100. The labile Cwas considered as the portion of soil organic C that was oxidizedby 333 mM KMnO4 (Blair et al., 1995). The non-labile C (NLC)was estimated from the difference between total organic C poolas determined by wet oxidation method (Snyder and Trofymow,1984) and the labile C (NLC = TOC − LBC).
2.7. Statistical analysis
For statistical analysis of data, Microsoft Excel (Microsoft Cor-poration, USA) and SPSS (Statistical Package for the Social Science,SPSS, Inc., Chicago, USA) window version 16.0 were used. Analy-sis of variance (ANOVA) was done as per the procedure outlinedby Gomez and Gomez (1984). The significant differences betweentreatments were compared with the least significance (LSD) at 5%level of probability. Pearson’s correlations matrix was used to eval-uate the relationships between yields, nutrients uptake by wheatand soil available nutrients and different pools of organic carbon.Unless otherwise stated, the level of significance referred to in theresults is P < 0.05.
3. Results and discussion
3.1. Changes in soil fertility
3.1.1. Alkaline KMnO4-NSignificant increase in alkaline KMnO4-N in surface soil
(0–15 cm) was maintained in plots receiving FYM (262 kg N ha−1)and integrated use of FYM + NPK fertilizer (270 kg N ha−1) over NPKtreated (182 kg N ha−1) and unfertilized control plots (178 kg ha−1)(Table 3). However, increases in KMnO4-N in sub-surface soil(15–30 cm) were observed only under plots receiving FYM andFYM + NPK fertilizer over unfertilized control. Increase in KMnO4-Nin surface soil was 47.2 and 51.7% in FYM and FYM + NPK fertilizer
treated plots over control, respectively. The increase in KMnO4-Nin FYM amended plots is attributed to the increase in total SOCand might have been partially due to a slow release of N frommanure, as suggested by Yadav et al. (2000), Gami et al. (2001)
36 P.C. Moharana et al. / Field Crops Research 136 (2012) 32–41
Table 3Effect of FYM and fertilizers on KMnO4-N and Olsen-P in a 6-year-old pearlmillet–wheat cropping system.
Treatments KMnO4-N (kg ha−1) Olsen-P (kg ha−1)
0–15 cm 15–30 cm 0–15 cm 15–30 cm
Control 178 150 18.3 5.5FYM 262 (47.2)a 169 (12.7) 20.7 (13.1) 8.2 (49.1)NPK 182 (2.2) 163 (8.7) 22.4 (22.4) 7.3 (32.7)FYM + NPK 270 (51.7) 181 (20.7) 24.9 (36.1) 7.7 (40.0)SEM (±) 3.93 4.77 0.82 0.82
alrNstchpdp
3
ta(watrpsnrsodFariiwfp2oac(otrot
3
cKt
Table 4Effect of FYM and fertilizers on NH4OAc-K and CaCl2-S in a 6-year-old pearlmillet–wheat cropping system.
Treatments NH4OAc-K (kg ha−1) CaCl2-S (kg ha−1)
0–15 cm 15–30 cm 0–15 cm 15–30 cm
Control 169 119 13.2 8.4FYM 245 (45.0)a 152 (27.7) 21.3 (61.4) 9.6 (14.3)NPK 184 (8.9) 123 (3.4) 16.4 (24.2) 9.2 (9.5)FYM + NPK 214 (26.6) 137 (15.1) 22.2 (68.2) 9.4 (11.9)SEM (±) 10.3 4.70 0.54 0.41
LSD (P = 0.05) 12.6 15.3 2.61 NS
a Figure in parentheses indicate percent increase over control.
nd Bhandari et al. (2002). Farmyard manure is known to stimu-ate biological N2 fixation in the soil, which may also have beenesponsible for the increase in soil N (Ladha et al., 1989) overPK treatment, apart from FYM’s own N contribution. In addition,
oils under NPK + FYM treated plots produced more biomass and,herefore, possibly had more extensive root systems that may haveontributed to increased N levels. It is evident from this study thatigher values of KMnO4-N were observed in surface soil as com-ared to sub-surface soil irrespective of treatments. This might beue to higher organic carbon content observed in surface as com-ared to sub-surface soil.
.1.2. Olsen-PSignificantly greater amount of Olsen-P in surface soil was main-
ained in all the three treatments receiving manure and fertilizerpplied either alone or in combination over unfertilized control plotTable 3). The build-up of Olsen-P in surface soil (0–15 cm depth)ere 24.9, 22.4 and 20.7 kg P ha−1 in plots receiving FYM + NPK, NPK
nd FYM, respectively as against 18.3 kg P ha−1 in unfertilized con-rol plot. The Olsen-P increased by 36.1, 22.4 and 13.1% in plotseceiving FYM + NPK, NPK and FYM, respectively over unfertilizedlot. However, no significant differences were found in sub-surfaceoil where Olsen-P varied from 5.5 to 8.2 kg P ha−1 in differentutrient management practices. The increase in Olsen-P in plotseceiving FYM applied either alone or in combination with NPK pos-ibly due to release of organically bound P during decompositionf organic matter, solubilization of soil P by organic acids produceduring decomposition of organic matter. Continuous application ofYM also reduced the activity of polyvalent cations such as Ca, Fe,nd Al due to chelation which, in turn, considered responsible foreduction in P-fixation (Gupta et al., 1988). The application of FYMncreased Olsen-P because of its P content, and possibly by increas-ng retention of P in soil. A positive effect of FYM on P availability
as also observed by Roy et al. (2001). This might be due to theact that the major P fraction added through FYM is in the organicool, which mineralized slowly with time (Yadvinder-Singh et al.,004). Increase in Olsen-P in NPK fertilizer is due to residual effectf higher amount of fertilizer P applied annually in this treatments compared to no application of fertilizer in FYM and low appli-ation of fertilizer P in FYM + NPK treated plots. Biswas and Benbi1997) reported considerable build-up of Olsen-P with applicationf phosphatic fertilizer, while those not receiving phosphatic fer-ilizer annually have shown a decline in Olsen-P. Similarly, earliereports suggested that long-term application of P fertilizer in excessf crop requirement can build-up large amounts of P in soil in bothhe inorganic and organic pools (Singh et al., 2007).
.1.3. NH4OAc-extractable-K
The NH4OAc-extractable-K (NH4OAc-K) showed significanthanges in both the depths in different treatments. The NH4OAc- content of soil under different treatments varied from 169
o 245 kg ha−1 in surface soil and from 119 to 152 kg ha−1 in
LSD (P = 0.05) 33.1 15.1 1.71 NS
a Figure in parentheses indicate percent increase over control.
sub-surface soil (Table 4). Plots received with FYM maintained sig-nificantly highest amount of NH4OAc-K (245 kg ha−1) followed byintegrated use of FYM + NPK (214 kg ha−1), NPK alone (184 kg ha−1)and control (169 kg ha−1) in surface soil (0–15 cm). In contrast toOlsen-P, NH4OAc-K declined significant in treatments that receivedNPK fertilizers over 6 years, suggesting that the current rate ofK application in the plots under NPK treatment was insufficientto sustain soil K fertility in the present pearl millet–wheat sys-tem where crop residues, particularly wheat straw, are removedfrom the fields. On the contrary, application of FYM resulted in anincrease in NH4OAc-K due to more release of non-exchangeable Kfrom the soil as FYM increased soil cation exchange capacity, whichmight have resulted in increased NH4OAc-K and its utilization bycrops (Blake et al., 1999), besides FYM’s own K supply. The plotsunder FYM treatments either alone or in combination with NPKfertilizer showed the maximum accumulation of exchangeable K,possibly because of the increased sorption of K following continu-ous addition of FYM (Poonia et al., 1986; Mehta et al., 1988). Thisdemonstrates that inputs of K with organic materials resulted ina build-up of soil NH4OAc-K because FYM generally contains highamounts of K. Considerable build-up of NH4OAc-K under FYM + NPKtreatment in a long-term fertilizer experiment was reported by oth-ers (Nand Ram, 1998; Singh et al., 2000). Similar trend in NH4OAc-Kdue to different treatments was found in sub-surface soil. However,the levels of NH4OAc-K content were lower in sub-surface thansurface soil.
3.1.4. CaCl2-extractable-SThe 0.15% CaCl2-extractable-S (CaCl2-S) content in surface
soil (0–15 cm) was significantly higher in FYM + NPK treatment(22.2 kg ha−1) followed by FYM alone (21.3 kg ha−1) and least inunfertilized control plot (13.2 kg ha−1) (Table 4). However, no sig-nificant effect was observed in sub-surface soil. The increase inCaCl2-S in 0–15 cm soil depth was 68.2 and 61.4% in FYM + NPK andFYM treated plots over control. This increase is attributed to theaccretion of sulphur through FYM application. Sarkar et al. (1998)reported that application of various organic sources like compost,FYM, green manure and crop residues can supply adequate quanti-ties of sulphur to crops. Nambiar and Abrol (1989) also reportedfrom the long-term fertilizer experiments conducted at severallocations that the treatment involving un-interrupted yearly appli-cation of FYM could maintain adequate status of sulphur to guardagainst its deficiency in soils.
3.2. Pools of soil organic carbon
3.2.1. Total organic carbonContinuous application of FYM either alone or in com-
bination with NPK resulted in considerable accumulation oftotal SOC in 0–15 cm soil layer than unfertilized control plots(Table 5). Soils under the FYM + NPK treated plots resultedin higher total SOC in the 0–15 cm soil layer over those
P.C. Moharana et al. / Field Crops Research 136 (2012) 32–41 37
Table 5Carbon management index (CMI) as affected by application of FYM and fertilizersin a 6-year-old pearl millet–wheat cropping system.
Treatment TOC(g kg−1)
LBC(g kg−1)
NLC(g kg−1)
CPI LC LI CMI
0–15 cm depthControl 7.53 0.79 6.74 1.00 0.12 1.00 100FYM 11.48 1.20 10.28 1.52 0.12 1.52 232NPK 8.50 0.94 7.56 1.13 0.12 1.19 134FYM + NPK 11.08 1.36 9.72 1.47 0.14 1.72 253SEM (±) 0.39 0.07 0.36LSD (P = 0.05) 1.25 0.23 1.14
15–30 cm depthControl 5.87 0.64 5.23 1.00 0.12 1.00 100FYM 7.86 0.84 7.02 1.34 0.12 1.31 176NPK 6.37 0.70 5.67 1.09 0.12 1.09 119FYM + NPK 7.85 0.87 6.98 1.34 0.12 1.36 182SEM (±) 0.19 0.03 0.20LSD (P = 0.05) 0.60 0.10 0.64
Tp
ut(iici4giFbbbtpgwtpwbbpmiloi(P
3
sbpfda(bcia
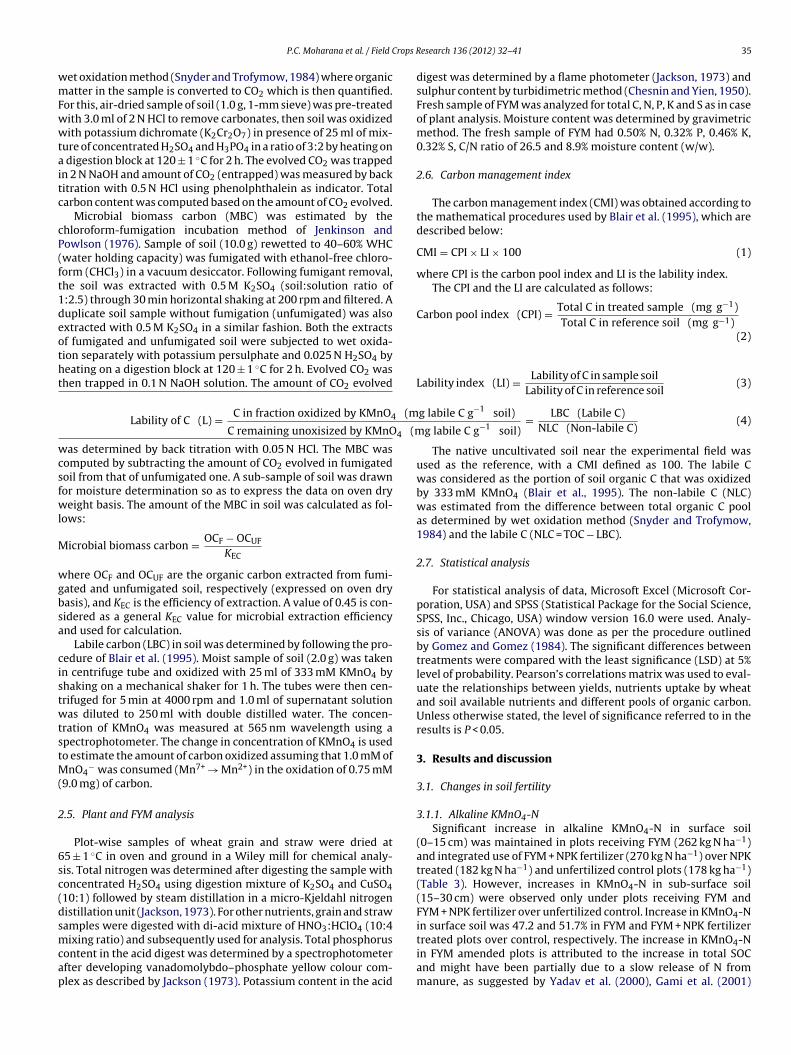
Fig. 1. Changes in Walkley and Black organic carbon as influenced by application of
OC, total organic carbon; LBC, labile organic carbon; NLC, non-labile C; CPI, carbonool index; LC, lability of C; LI, lability index; CMI, carbon management index.
nder the NPK treated plots. The TOC in surface soil were inhe order of FYM (11.48 g kg−1) > FYM + NPK (11.08 g kg−1) > NPK8.50 g kg−1) > unfertilized control (7.53 g kg−1). However, increasen TOC was more in surface as compared to sub-surface soil, whichndicate that higher accumulation of organic carbon due to appli-ation of FYM was confined to surface soil. The increase in TOCn FYM and FYM + NPK treatments in surface layer was 52.5 and7.1% over unfertilized control, while they were 35.0 and 30.3%reater over NPK treatment, respectively. No significant differencen TOC in FYM and FYM + NPK treatments although the amount ofYM applied during the study period in FYM treated plot was dou-le of the amount applied in FYM + NPK treated plot. This mighte due to more turn-over of root biomass in FYM + NPK treatmentecause of better growth and higher average yields obtained duringhe study period of both the crops in FYM + NPK treatment as com-ared to FYM treatment. It is evident that irrespective of depths,reater accumulation of TOC was observed with FYM treatmenthile control plot showed the lowest value. In the present study,
he above-ground biomass was removed and there was no incor-oration of residues to the soil. The only input of organic matteras through root biomass. Thus, increase in TOC in optimal and
alanced application of NPK is because of greater input of rootiomass due to better crop growth. It was supported by the dataublished by Manjaiah and Singh (2001) who noted an annual esti-ated organic carbon input to the tune of 8190 and 2780 kg ha−1
n 100% NPK + FYM and 100% NPK treatments, respectively. Simi-ar effects of manure and inorganic fertilizer applications on soilrganic C has also been reported from Rothamsted classical exper-ments (Jenkinson, 1991) and long-term experiments elsewhereKukreja et al., 1991; Campbell et al., 1996; Biswas and Benbi, 1997;otter et al., 1998; Rudrappa et al., 2006).
.2.2. Walkley and Black organic carbonWalkley and Black method mostly determines both labile and
mall part of non-labile organic carbon which is the readily accessi-le source of carbon to microorganisms and have direct impact onlant nutrient supply. The monitoring of soil organic carbon eitheror agricultural sustainability or environmental quality has beenone in most of the studies by Walkley and Black method (Walkleynd Black, 1934). In the present study, the plots that received FYM7.30 g kg−1) and FYM + NPK (6.50 g kg−1) had significantly higher
−1
uild-up in WBC over NPK treated (5.10 g kg ) and unfertilizedontrol plots (4.90 g kg−1) in the surface soil (Fig. 1). The increasen build-up in WBC under FYM and FYM + NPK treatments was 43.1nd 27.5% greater over treatment receiving NPK fertilizer alone andFYM and fertilizers after wheat grown in a 6-year-old pearl millet–wheat croppingsystem. Error bars represent standard deviation of the mean.
49.0 and 32.7% greater over treatment receiving no fertilizer ormanure (control). In case of sub-surface soil, the build-up in WBCunder plots receiving FYM alone (4.1 g kg−1) and FYM + NPK fertil-izer (3.8 g kg−1) was higher than in the plots receiving only NPKfertilizer (3.0 g kg−1) and in the control (2.5 g kg−1). In general, thevalues of WBC in sub-surface soils due to application of differenttreatments were low compared to surface soil. The WBC and TOCshowed similar trend with respect to the changes in soil organic car-bon due to different treatments, however, the values of WBC werelower as compared to TOC. The values of this pool of soil organiccarbon varied between 58.6 and 65.0% of total soil organic carbonin surface soil.
The significantly greater SOC in the fertilized plots over the con-trol may be explained by the greater yield and associated greateramount of root residues and stubbles of all the crops added to thesoil (Ghosh et al., 2003). Greater SOC under complete doses of NPKfertilizer as compared to unfertilized soil has also been reportedin long-term studies (Swarup and Wanjari, 2000). Application oforganic amendments (FYM) also increased the SOM content to amuch greater extent than that of inorganic fertilizer alone. Thismay be attributed to enhanced crop growth which in turn, resultedin increased above and below-ground organic residues (e.g. roots),and thus raised the SOM content. The increased SOM in FYM treatedplots also due to slower breakdown rate (less and constant miner-alization rate) of FYM in soil. Kundu et al. (2002) reported that SOCcontent improved in fertilized plots as compared to the unfertil-ized plots due to C addition through the roots and crop residues,higher humification rate constant, and lower decay rate. Similarly,in a long-term experiment, Masto et al. (2006) observed that theSOC was considerably greater in soils receiving FYM or straw alongwith NPK fertilizer than in plots receiving merely NPK fertilizer. Inthis study, the combination of organic and inorganic fertilizationenhanced the accumulation of SOC which is consistent with manyother studies (Jenkinson, 1991; Kukreja et al., 1991; Biswas andBenbi, 1997; Majumder et al., 2007, 2008; Hao et al., 2008; Bangeret al., 2009).
3.2.3. Labile organic carbonThe labile organic carbon (LBC) pool or KMnO4 oxidizable car-
bon is considered as a useful approach for the characterization ofSOC resulting from different soil management practices includingcropping systems and application of organic and inorganic sources
of nutrients. The values of LBC in surface soil were 1.20, 1.36, 0.94and 0.79 g kg−1 in FYM, FYM + NPK, NPK and unfertilized controltreatments, respectively (Table 5) which were 10.5, 12.3, 11.1 and10.5% of the TOC, respectively. Similar trend in LBC were observed
38 P.C. Moharana et al. / Field Crops R
FfE
itusiabc1FNHftract2ahpbtmafassmp
3
nncisFt1gfs
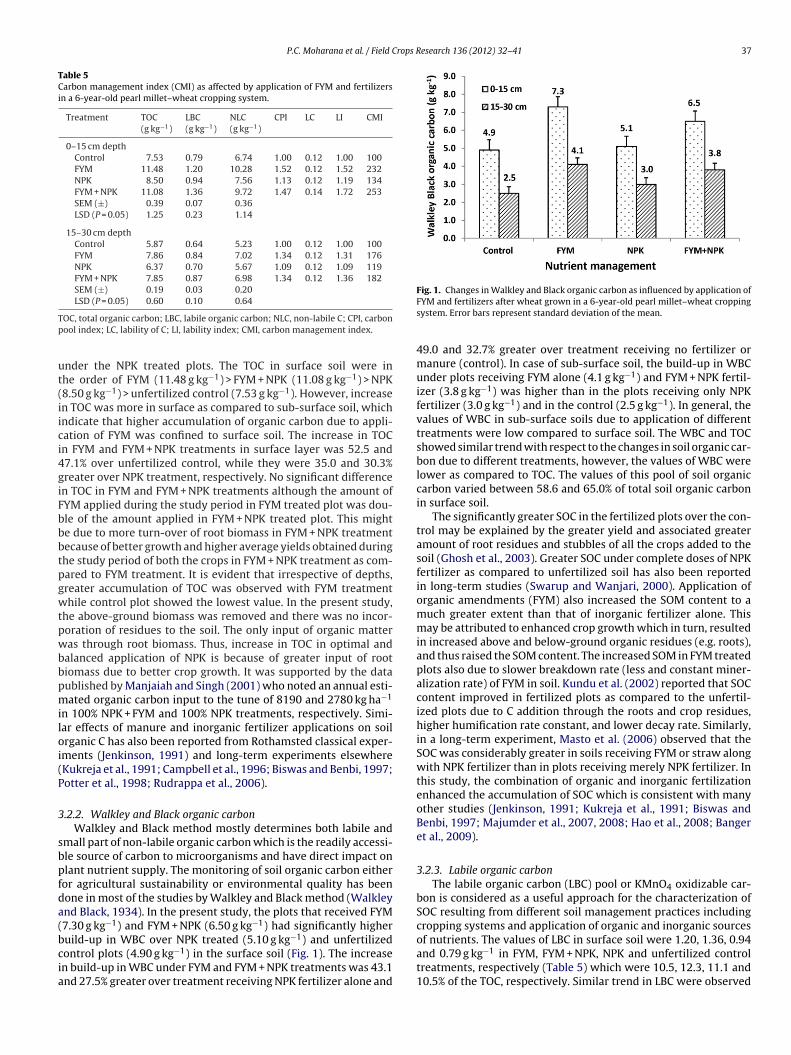
ig. 2. Changes in microbial biomass carbon as influenced by application of FYM andertilizers after wheat grown in a 6-year-old pearl millet–wheat cropping system.rror bars represent standard deviation of the mean.
n sub-surface soil. The plots received with FYM and FYM + NPKreatments showed significant increase in LBC over NPK andnfertilized control treatments in both surface and sub-surfaceoil depth. However, the highest value of 1.36 g kg−1 was observedn FYM + NPK treatment in surface soil. This may be due to thepplication of FYM as well as higher turn-over of root biomassecause of better growth and yield of pearl millet and wheatrops under combined application of FYM + NPK as compared to.20 g kg−1 in FYM alone. The percent increase in LBC in FYM andYM + NPK treatments in surface soil was 27.7 and 44.7% overPK and 51.9 and 72.2% over unfertilized control, respectively.igher variations in LBC in combined application of FYM + NPK
ertilizer indicate that this pool of soil organic C is more sensitiveo change due to manuring and fertilization. Higher turn-over ofoot biomass under integrated nutrient management (FYM + NPK)lso might have attributed to higher increase in this pool asompared to other treatments. Our results are in agreement withhe values reported by others (Conteh et al., 1997; Rudrappa et al.,006). Labile soil organic carbon pool is considered as the readilyccessible source of microorganisms which turns over rapidly andas direct impact on nutrient supply. Labile soil organic carbonool generally includes light faction of organic matter, microbialiomass and mineralizable organic matter. Adoption of procedurehat can preferentially extract more labile soil organic carbon
ight be a useful approach for characterizing soil organic carbonnd hence soil fertility and nutrient availability to plant resultingrom different management practices including cropping systemsnd application of organic and inorganic sources of nutrients. Theignificant increase in LBC under integrated nutrient managementystem (FYM + NPK) indicates its superiority over the manage-ent by organic and chemical fertilizer alone in sustaining crop
roductivity.
.2.4. Microbial biomass carbonThe microbial biomass carbon (MBC) is an important compo-
ent of the SOM that regulates the transformation and storage ofutrients. The soil MBC regulates all SOM transformations and isonsidered to be the chief component of the active SOM pool. Its evident that the MBC contents in both surface and sub-surfaceoil were significantly higher in plots receiving FYM + NPK andYM treated plots compared to NPK fertilizer and unfertilized con-rol plots (Fig. 2). The values of MBC in surface soil varied from
−1 −1
55 mg kg in unfertilized control plot to 273 mg kg in inte-rated nutrient use of FYM + NPK plots, respectively; while it variedrom 113 mg kg−1 (control) to 156 mg kg−1 (FYM + NPK) in sub-urface soil. The values of MBC increased by 56.3 and 76.5% underesearch 136 (2012) 32–41
FYM and FYM + NPK treatments in surface soil over control. While,there were 26.7 and 43.0% increase of MBC over NPK fertilizer,respectively. The highest value of MBC due to integrated use of FYMand NPK fertilizer might be due to higher turn-over of root biomassproduced under FYM + NPK treatment. Application of NPK fertilizeris not only required for better growth of the crop but also requiredfor synthesis of cellular components of microorganisms. There-fore, higher root biomass under FYM + NPK fertilizer treatmenthelped in increasing MBC over other treatments. Similar increasesin integrated nutrient management with manure + fertilizer havebeen reported by others (Hopkins and Shiel, 1996; Grego et al.,1998; Dezhi et al., 2007). Although MBC content in soil repre-sent a small fraction i.e. about 1–5% of TOC), however, variationin this pool due to management and cropping systems indicateabout the quality of soil, because the turn-over of SOM is con-trolled by this pool of SOC which can provide an effective earlywarning of the improvement or deterioration of soil quality asa result of different management practices (Powlson and Brooks,1987).
In our study, MBC was highest in the FYM plus inorganic fertil-izer treatment. The increase of MBC under FYM amended soils couldbe attributed to several factors, such as higher moisture content,greater soil aggregation and higher SOC content. The FYM amendedplots provided a steady source of organic C to support the microbialcommunity compared to NPK treated plots. Generally, FYM appliedto soil has long been employed to enhance favourable soil condi-tions. Decomposition of manure in soil releases essential nutrientssuch as N, P and S that are required by microorganisms. Fauci andDick (1994) suggested that soils with a long-term use of organicamendments, such as animal manure, generally maintain high lev-els of MBC. In long-term field experiments in Denmark, Powlsonet al. (1987) showed that straw manure could increase MBC up to45%. Similar to our study, Kandeler et al. (1999) earlier reported thatFYM (30 Mg ha−1, applied every second year) doubled the microbialbiomass in a Haplic Phaeocem under spring barley. Manjaiah andSingh (2001) reported an increase of MBC by a factor of three aftera combined application of FYM and mineral N-fertilizer in a semi-arid Cambisol. The higher microbial biomass in FYM + NPK might beboth due to higher below ground plant residues as well as addedFYM (Grego et al., 1998). This observation is consistent with that ofHopkins and Shiel (1996), who reported that the MBC was greater insoils receiving annual additions of FYM for nearly 100 years in addi-tion to inorganic NPK. However, in a different study, a significantincrease in MBC was found only in soils fertilized with compost,while treatment with mineral fertilizers was characterized by asmall MBC, as small as in the control soil (Grego et al., 1998). Sim-ilarly, Omay (1997) reported a significant decrease in MBC due tofertilizer applications, particularly N. The imbalanced use of fer-tilizers also decreased MBC due to limitation imposed by majornutrients like P and K, which are essential for higher crop produc-tion as well as for microbial cell synthesis. The surface soil exhibitedhigher MBC compared to lower soil depths primarily because ofaddition of left-over crop residues and root biomass into the top-soil. This view is consistent with the observation of Hao et al. (2008)who observed that the microbial biomass was considerably greaterin soils receiving FYM along with NPK fertilizer than in plots receiv-ing merely NPK fertilizer in three subtropical paddy soils. Mandalet al. (2007) also reported that the microbial biomass was greater insoils due to addition of straw plus inorganic NPK for 34 years thanthat of inorganic NPK fertilizers. Similarly, Kaur et al. (2005) alsoobserved that in general, MBC tends to be smaller in unfertilizedsoils or those fertilized with chemical fertilizers compared to soil
amended with organic manures. The readily metabolizable carbonand N in FYM in addition to increasing root biomass and root exu-dates due to greater crop growth are the most influential factorscontributing to the increase in soil MBC.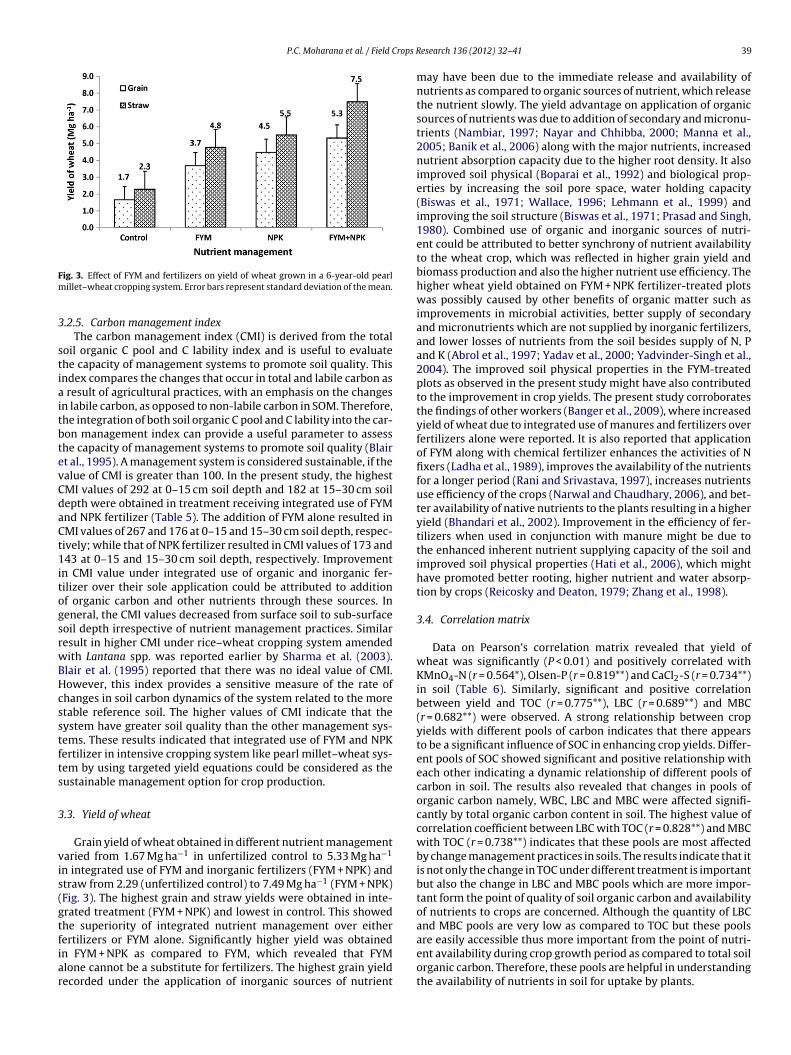
P.C. Moharana et al. / Field Crops R
Fm
3
stiaitbtevCdaCt1itogsrwBHcsstfts
3
vis(gtfiar
ig. 3. Effect of FYM and fertilizers on yield of wheat grown in a 6-year-old pearlillet–wheat cropping system. Error bars represent standard deviation of the mean.
.2.5. Carbon management indexThe carbon management index (CMI) is derived from the total
oil organic C pool and C lability index and is useful to evaluatehe capacity of management systems to promote soil quality. Thisndex compares the changes that occur in total and labile carbon as
result of agricultural practices, with an emphasis on the changesn labile carbon, as opposed to non-labile carbon in SOM. Therefore,he integration of both soil organic C pool and C lability into the car-on management index can provide a useful parameter to assesshe capacity of management systems to promote soil quality (Blairt al., 1995). A management system is considered sustainable, if thealue of CMI is greater than 100. In the present study, the highestMI values of 292 at 0–15 cm soil depth and 182 at 15–30 cm soilepth were obtained in treatment receiving integrated use of FYMnd NPK fertilizer (Table 5). The addition of FYM alone resulted inMI values of 267 and 176 at 0–15 and 15–30 cm soil depth, respec-ively; while that of NPK fertilizer resulted in CMI values of 173 and43 at 0–15 and 15–30 cm soil depth, respectively. Improvement
n CMI value under integrated use of organic and inorganic fer-ilizer over their sole application could be attributed to additionf organic carbon and other nutrients through these sources. Ineneral, the CMI values decreased from surface soil to sub-surfaceoil depth irrespective of nutrient management practices. Similaresult in higher CMI under rice–wheat cropping system amendedith Lantana spp. was reported earlier by Sharma et al. (2003).lair et al. (1995) reported that there was no ideal value of CMI.owever, this index provides a sensitive measure of the rate ofhanges in soil carbon dynamics of the system related to the moretable reference soil. The higher values of CMI indicate that theystem have greater soil quality than the other management sys-ems. These results indicated that integrated use of FYM and NPKertilizer in intensive cropping system like pearl millet–wheat sys-em by using targeted yield equations could be considered as theustainable management option for crop production.
.3. Yield of wheat
Grain yield of wheat obtained in different nutrient managementaried from 1.67 Mg ha−1 in unfertilized control to 5.33 Mg ha−1
n integrated use of FYM and inorganic fertilizers (FYM + NPK) andtraw from 2.29 (unfertilized control) to 7.49 Mg ha−1 (FYM + NPK)Fig. 3). The highest grain and straw yields were obtained in inte-rated treatment (FYM + NPK) and lowest in control. This showedhe superiority of integrated nutrient management over either
ertilizers or FYM alone. Significantly higher yield was obtainedn FYM + NPK as compared to FYM, which revealed that FYMlone cannot be a substitute for fertilizers. The highest grain yieldecorded under the application of inorganic sources of nutrientesearch 136 (2012) 32–41 39
may have been due to the immediate release and availability ofnutrients as compared to organic sources of nutrient, which releasethe nutrient slowly. The yield advantage on application of organicsources of nutrients was due to addition of secondary and micronu-trients (Nambiar, 1997; Nayar and Chhibba, 2000; Manna et al.,2005; Banik et al., 2006) along with the major nutrients, increasednutrient absorption capacity due to the higher root density. It alsoimproved soil physical (Boparai et al., 1992) and biological prop-erties by increasing the soil pore space, water holding capacity(Biswas et al., 1971; Wallace, 1996; Lehmann et al., 1999) andimproving the soil structure (Biswas et al., 1971; Prasad and Singh,1980). Combined use of organic and inorganic sources of nutri-ent could be attributed to better synchrony of nutrient availabilityto the wheat crop, which was reflected in higher grain yield andbiomass production and also the higher nutrient use efficiency. Thehigher wheat yield obtained on FYM + NPK fertilizer-treated plotswas possibly caused by other benefits of organic matter such asimprovements in microbial activities, better supply of secondaryand micronutrients which are not supplied by inorganic fertilizers,and lower losses of nutrients from the soil besides supply of N, Pand K (Abrol et al., 1997; Yadav et al., 2000; Yadvinder-Singh et al.,2004). The improved soil physical properties in the FYM-treatedplots as observed in the present study might have also contributedto the improvement in crop yields. The present study corroboratesthe findings of other workers (Banger et al., 2009), where increasedyield of wheat due to integrated use of manures and fertilizers overfertilizers alone were reported. It is also reported that applicationof FYM along with chemical fertilizer enhances the activities of Nfixers (Ladha et al., 1989), improves the availability of the nutrientsfor a longer period (Rani and Srivastava, 1997), increases nutrientsuse efficiency of the crops (Narwal and Chaudhary, 2006), and bet-ter availability of native nutrients to the plants resulting in a higheryield (Bhandari et al., 2002). Improvement in the efficiency of fer-tilizers when used in conjunction with manure might be due tothe enhanced inherent nutrient supplying capacity of the soil andimproved soil physical properties (Hati et al., 2006), which mighthave promoted better rooting, higher nutrient and water absorp-tion by crops (Reicosky and Deaton, 1979; Zhang et al., 1998).
3.4. Correlation matrix
Data on Pearson’s correlation matrix revealed that yield ofwheat was significantly (P < 0.01) and positively correlated withKMnO4-N (r = 0.564*), Olsen-P (r = 0.819**) and CaCl2-S (r = 0.734**)in soil (Table 6). Similarly, significant and positive correlationbetween yield and TOC (r = 0.775**), LBC (r = 0.689**) and MBC(r = 0.682**) were observed. A strong relationship between cropyields with different pools of carbon indicates that there appearsto be a significant influence of SOC in enhancing crop yields. Differ-ent pools of SOC showed significant and positive relationship witheach other indicating a dynamic relationship of different pools ofcarbon in soil. The results also revealed that changes in pools oforganic carbon namely, WBC, LBC and MBC were affected signifi-cantly by total organic carbon content in soil. The highest value ofcorrelation coefficient between LBC with TOC (r = 0.828**) and MBCwith TOC (r = 0.738**) indicates that these pools are most affectedby change management practices in soils. The results indicate that itis not only the change in TOC under different treatment is importantbut also the change in LBC and MBC pools which are more impor-tant form the point of quality of soil organic carbon and availabilityof nutrients to crops are concerned. Although the quantity of LBCand MBC pools are very low as compared to TOC but these pools
are easily accessible thus more important from the point of nutri-ent availability during crop growth period as compared to total soilorganic carbon. Therefore, these pools are helpful in understandingthe availability of nutrients in soil for uptake by plants.
40 P.C. Moharana et al. / Field Crops Research 136 (2012) 32–41
Table 6Pearson’s correlation matrix between yield, available nutrients and pools of soil organic carbon as affected by FYM and fertilizers in a 6-year-old pearl millet–wheat system.
Parameter Yield KMnO4-N Olsen-P NH4OAc-K CaCl2-S TOC WBC LBC
KMnO4-N 0.564*
Olsen-P 0.819** 0.453*
NH4OAc-K 0.368 0.680** 0.271CaCl2-S 0.734** 0.918** 0.595** 0.750**
TOC 0.775** 0.805** 0.530* 0.648** 0.844**
WBC 0.398 0.867** 0.247 0.718** 0.785** 0.736**
LBC 0.689** 0.841** 0.457* 0.584** 0.789** 0.828** 0.638**
MBC 0.682** 0.816** 0.592** 0.708** 0.864** 0.738** 0.648** 0.829**
4
Nsipaiifplncefbdp
A
RRsRc
R
A
B
B
B
B
B
B
B
B
* Correlation is significant at the 0.05 level (1-tailed).** Correlation is significant at the 0.01 level (1-tailed).
. Conclusions
The present study demonstrated that integrated use of FYM andPK fertilizer using STCR-based targeted yield approach increased
oil fertility and pools of soil organic carbon. Significant and pos-tive correlations of LBC and MBC with yield indicate that theseools are more important for nutrient turn-over and their avail-bility to plants than TOC. Carbon management index revealed thatntegrated nutrient management could be followed for enhanc-ng crop productivity, nutrient availability and soil carbon poolsor long-term. These results conclude that for sustainable croproduction and maintaining soil quality, input of organic manure
ike FYM is of major importance and should be advocated in theutrient management of intensive cropping system for improvinghemical and biological properties of soils. Therefore, the gov-rnment should encourage farmers to manage nutrients and soilertility following soil test based integrated nutrient managementy combining organic with inorganic fertilizer to increase crop pro-uctivity, enhancing nutrient availability and sustaining soil carbonools for long-term.
cknowledgments
The senior author thanks the Indian Council of Agriculturalesearch, New Delhi, India, for providing financial support as Junioresearch Fellowship during his research work and the Head, Divi-ion of Soil Science and Agricultural Chemistry, Indian Agriculturalesearch Institute, New Delhi, India, for providing facilities for suc-essful completion of the research work.
eferences
brol, I.P., Bronson, K.F., Duxbury, J.M., Gupta, R.K., 1997. Long-term soil fertilityexperiments in rice–wheat cropping systems. In: Rice–Wheat Consortium PaperSeries No. 1. Rice–Wheat Consortium for the Indo-Gangetic Plains, New Delhi,India, pp. 14–15.
anger, K., Kukal, S.S., Toor, G., Sudhir, K., Hanumanthraju, T.H., 2009. Impact oflong-term additions of chemical fertilizers and farmyard manure on carbon andnitrogen sequestration under rice–cowpea cropping system in semi-arid tropics.Plant Soil 318, 27–35.
anik, P., Ghosal, P.K., Sasmal, T.K., Bhattacharya, S., Sarkar, B.K., Bagchi, D.K., 2006.Effect of organic and inorganic nutrients for soil quality conservation and yieldof rainfed low land rice in subtropical plateau region. J. Agron. Crop Sci. 192,331–343.
handari, A.L., Ladha, J.K., Pathak, H., Padre, A.T., Dawe, D., Gupta, R.K., 2002. Yieldand soil nutrient changes in a long-term rice–wheat rotation in India. Soil Sci.Soc. Am. J. 66, 162–170.
iswas, C.R., Benbi, D.K., 1997. Sustainable yield trends of irrigated maize and wheatin LTFE on loamy sand in semi arid India. Nutr. Cycl. Agroecosyst. 46, 225–234.
iswas, T.D., Jain, B.L., Mandal, S.C., 1971. Cumulative effect of different levels ofmanures on the physical properties of soil. J. Indian Soc. Soil Sci. 19, 31–37.
lair, G.J., Lefroy, R.D.B., Lisle, L., 1995. Soil carbon fractions based on their degree ofoxidation, and the development of a carbon management index for agriculturalsystems. Aust. J. Agric. Res. 46, 1459–1466.
lair, N., 2000. Impact of cultivation and sugar-cane green trash management oncarbon fractions and aggregate stability for a chromic luvisol in Queensland,Australia. Soil Till. Res. 55, 183–191.
lake, L., Mercik, S., Koerschens, M., Goulding, K.W.T., Stempen, S., Weigel, A., Poul-ton, P.R., Powlson, D.S., 1999. Potassium content in soil, uptake in plants and the
potassium balance in three European long-term field experiments. Plant Soil216, 1–14.
Boparai, B.S., Singh, Y., Sharma, B.D., 1992. Effect of green manuring with Sesba-nia aculeata on physical properties of soil and growth of wheat in rice–wheatand maize–wheat cropping sequence in semiarid regions of India. Arid Soil Res.Rehabil. 6, 135–143.
Bouyoucos, G.J., 1962. Hydrometer method improved for making particle size anal-ysis of soils. Agron. J. 54, 464.
Campbell, C.A., McConkey, B.G., Zentner, R.P., Selles, F., Curtin, D., 1996. Tillage andcrop rotation effects on soil organic C and N in a coarse-textured Typic Hap-loboroll in South western Saskatchewan. Soil Till. Res. 37, 3–14.
Carter, M.R., 2002. Soil quality for sustainable land management: organic matter andaggregation interactions that maintain soil functions. Agron. J. 94, 38–47.
Chesnin, L., Yien, C.H., 1950. Turbidimetric determination of available sulphates. SoilSci. Soc. Am. Proc. 15, 149–151.
Conteh, A., Lefroy, R.D.B., Blair, G.J., 1997. Dynamics of organic matter in soil asdetermined by variations in 13C/12C isotopic ratios and fractionation by ease ofoxidation. Aust. J. Soil Res. 35, 881–890.
Dalal, R.C., Mayer, R.J., 1986. Long-term trends in fertility of soils under continuouscultivation and cereal cropping in Southern Queensland: III. Distribution andkinetics of soil organic carbon in particle size fractions. Aust. J. Soil Res. 24,293–300.
Dawe, D., Dobermann, A., Ladha, J.K., Yadav, R.L., Bao Lin Gupta, R.K., Lal, P., Panaullah,G., Sariam, O., Singh, Y., Swarup, A., Zhen, Q.-X., 2003. Do organic amendmentsimprove yield trends and profitability in intensive rice systems? Field Crops Res.83, 191–213.
Dezhi, Y., Dejian, W., Linzhang, Y., 2007. Long-term effect of chemical fertilizer,straw, and manure on labile organic matter fractions in a paddy soil. Biol. Fertil.Soils 44, 93–101.
Ding, G.W., Liu, X.B., Herbert, S., Novak, J., Amarasiriwardena, D., Xing, B.H., 2006.Effect of cover crop management on soil organic matter. Geoderma 130,229–239.
Fauci, M.F., Dick, R.P., 1994. Soil microbial dynamics: short and long term effects ofinorganic and organic nitrogen. Soil Sci. Soc. Am. J. 58, 801–806.
Gami, S.K., Ladha, J.K., Pathak, H., Shah, M.P., Pasuquin, E., Pandey, S.P., Hobbs, P.R.,Joshy, D., Mishra, R., 2001. Long-term changes in yield and soil fertility in a20-year rice–wheat experiment in Nepal. Biol. Fertil. Soils 34, 73–78.
Ghosh, P.K., Dayal, D., Mandal, K.G., Wanjari, R.H., Hati, K.M., 2003. Optimizationof fertilizer schedules in fallow and groundnut-based cropping systems and anassessment of system sustainability. Field Crops Res. 80, 83–98.
Gomez, K.A., Gomez, A.A., 1984. Statistical Procedures for Agricultural Research.Wiley Interscience, New York.
Grego, S., Marinari, S., Moscatelli, M.C., Badalucco, L., 1998. Effect of ammoniumnitrate and stabilized farmyard manure on microbial biomass and metabolicquotient of soil under Zea mays. Agric. Meditern. 128, 132–137.
Gupta, A.P., Antil, R.S., Narwal, R.P., 1988. Effect of farmyard manure on organic car-bon, available N, and P content of soil during different periods of wheat growth.J. Indian Soc. Soil Sci. 262, 269–273.
Hanway, J.J., Heidel, H., 1952. Soil analysis methods as used in Iowa State CollegeSoil Testing Laboratory. Iowa Agric. 57, 1–31.
Hao, X.H., Liu, S.L., Wu, J.S., Hu, R.G., Tong, C.L., Su, Y.Y., 2008. Effect of long-term appli-cation of inorganic fertilizer and organic amendments on soil organic matter andmicrobial biomass in three subtropical paddy soils. Nutr. Cycl. Agroecosyst. 81,17–24.
Hati, K.M., Swarup, A., Singh, D., Mishra, A.K., Ghosh, P.K., 2006. Long-term con-tinuous cropping, fertilization and manuring effects on physical properties andorganic carbon content of a sandy loam soil. Aust. J. Soil Res. 44, 487–495.
Hopkins, D.W., Shiel, R.S., 1996. Size and activity of soil microbial communitiesin long term experimental grassland plots treated with manure and inorganicfertilizers. Biol. Fertil. Soils 22, 66–70.
Jackson, M.L., 1973. Soil Chemical Analysis. Prentice Hall of India Pvt. Ltd., New Delhi.Jenkinson, D.S., 1991. The Rothamsted long-term experiments: are they still in use?
Agron. J. 83, 2–10.
Jenkinson, D.S., Powlson, D.S., 1976. The effects of biocidal treatment on metabolismin soil. I. Fumigation with chloroform. Soil Biol. Biochem. 8, 167–177.Kandeler, E., Stemmer, M., Klimanek, E.M., 1999. Response of soil microbial biomass,
urease and xylanase within particle size fractions to long-term soil management.Soil Biol. Biochem. 31, 261–273.
rops R
K
K
K
K
L
L
L
L
M
M
M
M
M
M
M
M
N
N
N
N
N
O
O
P
P.C. Moharana et al. / Field C
aur, K., Kapoor, K.K., Gupta, A.P., 2005. Impact of organic manures with and with-out mineral fertilizers on soil chemical and biological properties under tropicalconditions. J. Plant Nutr. Soil Sci. 168, 117–122.
ukreja, K., Mishra, M.M., Dhankar, S.S., Kapoor, K.K., Gupta, A.P., 1991. Effect oflong term manurial application on microbial biomass. J. Indian Soc. Soil Sci. 39,685–688.
umar, P., Nanwal, R.K., Yadav, S.K., 2005. Integrated nutrient management in pearlmillet (Pennisetum glaucum)–wheat (Triticum aestivum) cropping system. IndianJ. Agric. Sci. 75, 640–643.
undu, S., Prakash, V., Ghosh, B.N., Singh, R.D., Srivastva, A.K., 2002. Quantitativerelationship between annual carbon inputs and soil organic carbon build-up insoybean (Glycine max)–wheat (Triticum aestivum) cropping sequence. In: 2ndInt. Agron. Congress, New Delhi, India, November 26–30, 2002, pp. 108–110.
adha, J.K., Padre, A.T., Punzalan, G.C., Garcia, M., Watanabe, I., 1989. Effect of inor-ganic N and organic fertilizers on nitrogen-fixing (acetylene-reducing) activityassociated with wetland rice plants. In: Skinner, F.A. (Ed.), N2 Fixation withNon-legumes. Kluwer Academic Publishers, Dordrecht, pp. 263–272.
adha, J.K., Pathak, H., Padre, A.T., Dawe, D., Gupta, R.K., 2003. Productivity trends inintensive rice–wheat cropping systems in Asia. In: Ladha, J.K., Hill, J.E., Duxbury,J.M., Gupta, R.K., Buresh, R.J. (Eds.), Improving the Productivity and Sustain-ability of Rice–Wheat Systems: Issues and Impacts, ASA Special Publication 65.ASA–CSSA–SSSA, Madison, USA, pp. 45–76.
al, R., 1994. Methods and guidelines for assessing sustainable use of soil and waterresources in the tropics. In: SMSS Tech. Monograph No. 21. USDA, Washington,DC, p. 78.
ehmann, J., Feilner, T., Gebauer, G., Zech, W., 1999. Nitrogen uptake of sorghum(Sorghum bicolor L.) from tree mulch and mineral fertilizer under high leachingconditions estimated by nitrogen-15 enrichment. Biol. Fertil. Soils 30, 90–95.
ajumder, B., Mandal, B., Bandyopadhyay, P.K., 2008. Soil organic carbon pools andproductivity in relation to nutrient management in a 20-year-old rice-berseemagro-ecosystem. Biol. Fertil. Soils 44, 451–561.
ajumder, B., Mandal, B., Bandyopadhyay, P.K., Chaudhury, J., 2007. Soil organiccarbon pools and productivity relationships for a 34 year old rice–wheat–juteagro-ecosystem under different fertilizer treatments. Plant Soil 297, 53–67.
andal, A., Patra, A.K., Singh, D., Swarup, A., Masto, R.E., 2007. Effect of long-termapplication of manure and fertilizer on biological and biochemical activities insoil during crop development stages. Bioresour. Technol. 98, 3585–3592.
anjaiah, K., Singh, D., 2001. Soil organic matter and biological properties after 26years of maize–wheat–cowpea cropping as affected by manure and fertilizationin Cambisol in semiarid region of India. Agric. Ecosyst. Environ. 86, 155–162.
anna, M.C., Swarup, A., Wanjari, R.H., Ravankar, H.N., Mishra, B., Saha, M.N., Singh,Y.V., Shahi, D.K., Sarap, P.A., 2005. Long-term effect of fertilizer and manureapplication on soil organic carbon storage, soil quality and yield sustainabilityunder sub-humid and semi-arid tropical India. Field Crops Res. 93, 264–280.
arinari, S., Masciandaro, G., Ceccanti, B., Grego, S., 2000. Influence of organic andmineral fertilisers on soil biological and physical properties. Bioresour. Technol.72, 9–17.
asto, R.E., Chhonkar, P.K., Singh, D., Patra, A.K., 2006. Changes in soil biological andbiochemical characteristics in a long-term field trial on a sub-tropical Inceptisol.Soil Biol. Biochem. 38, 1577–1582.
ehta, S.C., Sharma, D.R., Mittal, S.B., 1988. Influence of long-term application offarmyard manure on K–Ca and K–Na exchange equilibrium in a tropical soil. J.Potassium Res. 4, 168–173.
ambiar, K.K.M., 1997. Soil health and organic matter – changing scenario. Proc.Natl. Acad. Sci. India 67B, 141–160.
ambiar, K.K.M., Abrol, I.P., 1989. Long term fertilizer experiments in India – anoverview. Fertil. News 34, 11–26.
and, R., 1998. Effects of continuous fertilizer use on soil fertility and productivity ofa mollisol. In: Swarup, A., Reddy, D., Prasad, R.N. (Eds.), Long-term Soil FertilityManagement Through Integrated Plant Nutrient Supply. Indian Institute of SoilScience, Bhopal, India, pp. 229–237.
arwal, R.P., Chaudhary, M., 2006. Effect of long-term application of FYM and fer-tilizer N on available P, K and S content of soil. In: 18th World Congress of SoilScience in Philadelphia, Pennsylvania, USA, July 9–15, 2006.
ayar, V.K., Chhibba, I.M., 2000. Effect of green manuring on micronutrientavailability in rice–wheat cropping system of northwest India. In: Abrol,I.P., Bronson, K.F., Duxbury, J.M., Gupta, R.M. (Eds.), Long-term Soil FertilityExperiments in Rice–Wheat Cropping Systems. Rice–Wheat Consortium PaperSeries 6, Rice–Wheat Consortium for the Indo-Gangetic Plains, New Delhi,pp. 68–72.
lsen, S.R., Cole, C.V., Watanabe, F.S., Dean, L.A., 1954. Estimation of Available Phos-phorus in Soils by Extraction with Sodium Bicarbonate. US Dept. Agric. Circular,
p. 939.may, A.B., 1997. Soil microbial and chemical property under long crop rotation andfertilization. Soil Sci. Soc. Am. J. 61, 1672–1678.
oonia, S.R., Mehta, S.C., Pal, R., 1986. Exchange equilibrium of potassium in soils. 1.Effect of farmyard manure on K and Ca exchange. Soil Sci. 141, 77–83.
esearch 136 (2012) 32–41 41
Potter, K.N., Tolbert, H.A., Jones, O.R., Matocha, J.E., Morrison, J.E., Unger, P.W., 1998.Distribution and amount of soil organic C in the long-term management systemsin Texas. Soil Till. Res. 47, 309–321.
Powlson, D.S., Brookes, P.C., Christensen, B.T., 1987. Measurement of soil microbialbiomass provides an early indication of changes in total soil organic matter dueto straw incorporation. Soil Biol. Biochem. 19, 159–164.
Powlson, D.S., Brooks, P.C., 1987. Measurement of soil microbial biomass providesan early indication of changes in total soil organic matter due to straw incorpo-ration. Soil Biol. Biochem. 19, 159–164.
Prasad, B., Singh, A.P., 1980. Changes in soil properties with long-term use of fertil-izer, lime and farmyard manure. J. Indian Soc. Soil Sci. 28, 465–468.
Ramamoorthy, B., Narasimham, R.L., Dinesh, R.S., 1967. Fertilizer application forspecific yield targets of Sonara 64. Indian Farming 17, 43–45.
Rani, R., Srivastava, O.P., 1997. Vermicompost: a potential supplement to nitroge-nous fertilizer in rice nutrition. Int. Rice Res. Notes 22, 30–31.
Reicosky, D.C., Deaton, D.E., 1979. Soybean water extraction, leaf water potentialand evapo-transpiration during drought. Agron. J. 7, 45–50.
Roy, S.K., Sharma, R.C., Trehan, S.P., 2001. Integrated nutrient management by usingfarmyard manure and fertilizers in potato–sunflower–paddy rice rotation in thePunjab. J. Agric. Sci. 137, 271–278.
Rudrappa, L., Purakayestha, T.J., Singh, D., Bhadraray, S., 2006. Long-term manuringand fertilization effects on soil organic carbon pools in a Typic Haplustept ofsemi-arid sub-tropical India. Soil Till. Res. 88, 180–192.
Sarkar, M.C., Sachdev, M.S., Datta, S.P., 1998. Interaction of soil organic matter withnutrients. Bull. Indian Soc. Soil Sci. 19, 90–102.
Sharma, B.M., Singh, R.V., 2003. Soil test and crop need based fertilizer recommen-dations for field crops. In: Proceedings of Training Workshop on Soil Testingfor Balanced and Integrated Use of Fertilizers and Manures, PAU, Ludhiana, pp.106–121.
Sharma, P.K., Ladha, J.K., Verma, T.S., Bhagat, R.M., Padre, A.T., 2003. Rice–wheatproductivity and nutrient status in a lantana – (Lantana spp.) amended soil. Biol.Fertil. Soils 37, 108–114.
Singh, M., Reddy, D., Tripathi, A.K., 2000. Potassium status of soil and uptake asinfluenced by integrated use of FYM and fertilizer N in soybean–wheat for sevenyears in Vertisols. J. Potassium Res. 16, 48–51.
Singh, M., Reddy, S.R., Singh, V.P., Rupa, T.R., 2007. Phosphorus availability to rice(Oriza sativa L.)–wheat (Triticum estivum L.) in a Vertisol after eight years ofinorganic and organic fertilizer additions. Bioresour. Technol. 98, 1474–1481.
Snyder, J.D., Trofymow, J.A., 1984. A rapid accurate wet oxidation diffusion procedurefor determining organic and inorganic carbon in pot and soil samples. Commun.Soil Sci. Plant Anal. 15, 587–597.
Subba Rao, A., Srivastava, S., 2001. Soil Test Based Fertilizer Recommendations forTargeted Yields of Crops. Indian Institute of Soil Science, Bhopal, India, pp. 1–326.
Subbiah, B.V., Asija, G.L., 1956. A rapid method for the estimation of available nitro-gen in soils. Curr. Sci. 25, 259–260.
Swarup, A., Wanjari, R.H., 2000. Three Decades of All India Coordinated ResearchLong Term Fertilizer Experiments for Studying Changes in Fertility Crop Pro-ductivity and Sustainability. Indian Institute of Soil Science, Bhopal, India.
Veihmeyer, F.Y., Hendrickson, A.H., 1948. Soil density and root penetration. Soil Sci.65, 487–493.
Walkley, A., Black, I.A., 1934. An examination of the Degtjareff method for determin-ing soil organic matter and a proposed modification of the chromic acid titrationmethod. Soil Sci. 37, 29–38.
Wallace, J.S., 1996. The water balance of mixed tree-crop systems. In: Ong, C.K.,Huxley, P. (Eds.), Tree–crop Interactions, A Physiological Approach. CAB Inter-national, Wallingford, UK, pp. 73–158.
Wander, M., 2004. Soil organic matter fractions and their relevance to soil function.In: Magdoff, F.R., Weil, R.R. (Eds.), Soil Organic Matter in Sustainable Agriculture.CRC, Boca Raton, pp. 67–102.
Watanabe, F.S., Olsen, S.R., 1965. Test of an ascorbic acid method for determiningphosphorus in water and NaHCO3 extracts from soils. Soil Sci. Soc. Am. Proc. 29,677–678.
Williams, C.H., Steinbergs, A., 1959. Soil sulphur fraction as chemical indices ofavailable sulphur in soils. Aust. J. Soil Res. 10, 340–352.
Yadav, R.L., Subba Rao, A.V.M., 2002. Atlas of cropping systems in India. PDCSRBulletin No. 2001-2, Project Directorate for Cropping Systems Research. Modipu-ram, Meerut, Uttar Pradesh.
Yadav, R.L., Dwivedi, B.S., Prasad, K., Tomar, O.K., Shurpali, N.J., Pandey, P.S., 2000.Yield trends and changes in soil organic-C and available NPK in a long-termrice–wheat system under integrated use of manures and fertilizers. Field CropsRes. 68, 219–246.
Yadvinder-Singh, Bijay-Singh, Ladha, J.K., Khind, C.S., Khera, T.S., Bueno, C.S., 2004.
Effects of residue decomposition on productivity and soil fertility in rice–wheatrotation. Soil Sci. Soc. Am. J. 68, 854–864.Zhang, H., Oweis, T.Y., Garabet, Y., Pala, M., 1998. Water use efficiency and transpi-ration efficiency of wheat under rainfed condition and supplementing irrigationin a Mediterranean type environment. Plant Soil 201, 295–305.