long-duration drought variability and impacts on ecosystem
TRANSCRIPT
Copyright © 2006, Paper 10-004; 11,437 words, 6 Figures, 0 Animations, 6 Tables.http://EarthInteractions.org
Long-Duration Drought Variabilityand Impacts on EcosystemServices: A Case Study fromGlacier National Park, MontanaGregory T. Pederson*Big Sky Institute, Montana State University, Bozeman, and Glacier Field Station,
Northern Rocky Mountain Science Center, U.S. Geological Survey, West Glacier,Montana
Stephen T. GrayDesert Laboratory, U.S. Geological Survey, Tucson, Arizona
Daniel B. FagreGlacier Field Station, Northern Rocky Mountain Science Center, U.S. Geological
Survey, West Glacier, Montana
Lisa J. GraumlichBig Sky Institute, Montana State University, Bozeman, Montana
Received 29 November 2004; accepted 18 March 2005
ABSTRACT: Instrumental climate records suggest that summer precipita-tion and winter snowpack in Glacier National Park (Glacier NP), Montana,vary significantly over decadal to multidecadal time scales. Because instru-mental records for the region are limited to the twentieth century, knowledge
* Corresponding author address: Gregory T. Pederson, Big Sky Institute, Montana StateUniversity, 106 AJM Johnson Hall, Bozeman, MT 59717.
E-mail address: [email protected]
Earth Interactions • Volume 10 (2006) • Paper No. 4 • Page 1
of the range of variability associated with these moisture anomalies and theirimpacts on ecosystems and physical processes are limited. The authors devel-oped a reconstruction of summer (June–August) moisture variability spanningA.D. 1540–2000 from a multispecies network of tree-ring chronologies in Gla-cier NP. Decadal-scale drought and pluvial regimes were defined as any eventlasting 10 yr or greater, and the significance of each potential regime wasassessed using intervention analysis. Intervention analysis prevents single in-tervening years of average or opposing moisture conditions from ending whatwas otherwise a sustained moisture regime. The reconstruction shows numer-ous decadal-scale shifts between persistent drought and wet events prior to theinstrumental period (before A.D. 1900). Notable wet events include a series ofthree long-duration, high-magnitude pluvial regimes spanning the end of theLittle Ice Age (A.D. 1770–1840). Though the late-nineteenth century wasmarked by a series of >10 yr droughts, the single most severe dry eventoccurred in the early-twentieth century (A.D. 1917–41). These decadal-scale dryand wet events, in conjunction with periods of high and low snowpack, haveserved as a driver of ecosystem processes such as forest fires and glacialdynamics in the Glacier NP region.
Using a suite of paleoproxy reconstructions and information from previousstudies examining the relationship between climate variability and natural pro-cesses, the authors explore how such persistent moisture anomalies affect thedelivery of vital goods and services provided by Glacier NP and surroundingareas. These analyses show that regional water resources and tourism areparticularly vulnerable to persistent moisture anomalies in the Glacier NP area.Many of these same decadal-scale wet and dry events were also seen among awider network of hydroclimatic reconstructions along a north–south transect ofthe Rocky Mountains. Such natural climate variability can, in turn, have enor-mous impacts on the sustainable provision of natural resources over wide areas.Overall, these results highlight the susceptibility of goods and services pro-vided by protected areas like Glacier NP to natural climate variability, andshow that this susceptibility will likely be compounded by the effects of futurehuman-induced climate change.
KEYWORDS: Paleoclimatology; Glacier National Park; Ecosystem ser-vices
1. IntroductionEvidence from an increasingly rich paleoproxy record demonstrates that over thelast millennium decadal to multidecadal precipitation anomalies have been a sub-stantial, if not defining, component of western North America’s climates. As in thetwentieth century, the last 1000 yr has experienced sporadic episodes of bothpersistent (>10 yr) droughts and wet regimes, though the magnitude and durationof many paleodroughts surpass those captured by the instrumental record (Graum-lich 1993; Cook et al. 2004; Stine 1994; Woodhouse and Overpeck 1998). Theselong-duration droughts and pluvials likely result from a complex set of forcingslinked to low-frequency variations and state changes in sea surface temperatureand pressure anomalies in both the Atlantic and Pacific Oceans (McCabe et al.2004; Gray et al. 2003a; Cayan et al. 1998). Such mechanisms, based on ocean–atmosphere teleconnections, often produce regional to subcontinental dry-
Earth Interactions • Volume 10 (2006) • Paper No. 4 • Page 2
ing or wetness (Cook et al. 2004; Fye et al. 2003; Gray et al. 2003a) and mayfacilitate rapid phase switching between moisture regimes.
In combination with a severe, ongoing drought, and concerns over future cli-mate change in western North America, these findings have invigorated interestconcerning the influence of long-duration precipitation anomalies on natural pro-cesses, particularly on regional scales. A growing body of work demonstrates thatremote large-scale forcing mechanisms associated with persistent droughts andpluvial events in western North America (e.g., Pacific decadal oscillation, Atlanticmultidecadal oscillation, etc.) also entrain ecosystem processes across broad geo-graphic regions. In systems ranging from ocean fisheries, (e.g., Stenseth et al.2002) to semiarid woodlands (e.g., Swetnam and Betancourt 1998) to herds ofungulates in the Arctic (e.g., Post and Stenseth 1998), decadal to multidecadalclimate anomalies serve to synchronize ecosystem processes and may lead to rapidshifts in the structure and function of ecosystem processes. Such rapid shifts inecosystem structure and function have large implications for management andconservation goals in light of increasing habitat fragmentation and future climatechange scenarios.
When considered from the standpoint of human/environment interactions, thesepersistent climate anomalies can also have dramatic effects on the provision of“ecosystem services,” or the benefits people obtain from ecosystems (Daily 1997),over decadal to multidecadal time scales. As in the case of fisheries and forests(e.g., Stenseth et al. 2002; Swetnam and Betancourt 1998) these services includethe production of goods essential to human societies (i.e., provisioning services).In addition, ecosystem services include the maintenance and regulation of naturalprocesses such as water and nutrient cycling (i.e., regulating services) and providenonmaterial benefits related to recreational and aesthetic values (i.e., culturalservices). In this paper, we first present a case study from a tree-ring reconstructionof summer precipitation variability in Glacier National Park (Glacier NP), Mon-tana, over the period A.D. 1540–2000. We then use this and other paleoproxyrecords of regional climate and ecosystem dynamics to explore how persistent(>10 yr) droughts and wet events affect ecosystem services provided by GlacierNP. Finally, we expand this discussion to include other mountainous protectedareas in western North America. Our goal is, ultimately, to broaden discussion ofthe impacts of climatic variability by defining linkages between drought, large-scale climate regimes, and the sustainable provision of ecosystem services.
2. Study areaGlacier NP encompasses an area totaling 4082 km2 that is composed primarily ofmontane, subalpine, and alpine communities in the northern U.S. Rocky Moun-tains. The climate of this region can be described as Pacific Maritime with con-tinental modifications, and is most similar climatologically, as well as geologicallyand biologically, to the southern Canadian Rockies (Finklin 1986). The annualdistribution of precipitation is defined by two distinct periods of peak precipitation,with significant amounts received during the early growing season (April–June)and over the winter months (October–March). Here, valley inversions are com-mon, and the orographic effect of the Continental Divide causes the western slopesof the park to be some of the most mesic areas in Montana (Figure 1). Similarly,
Earth Interactions • Volume 10 (2006) • Paper No. 4 • Page 3
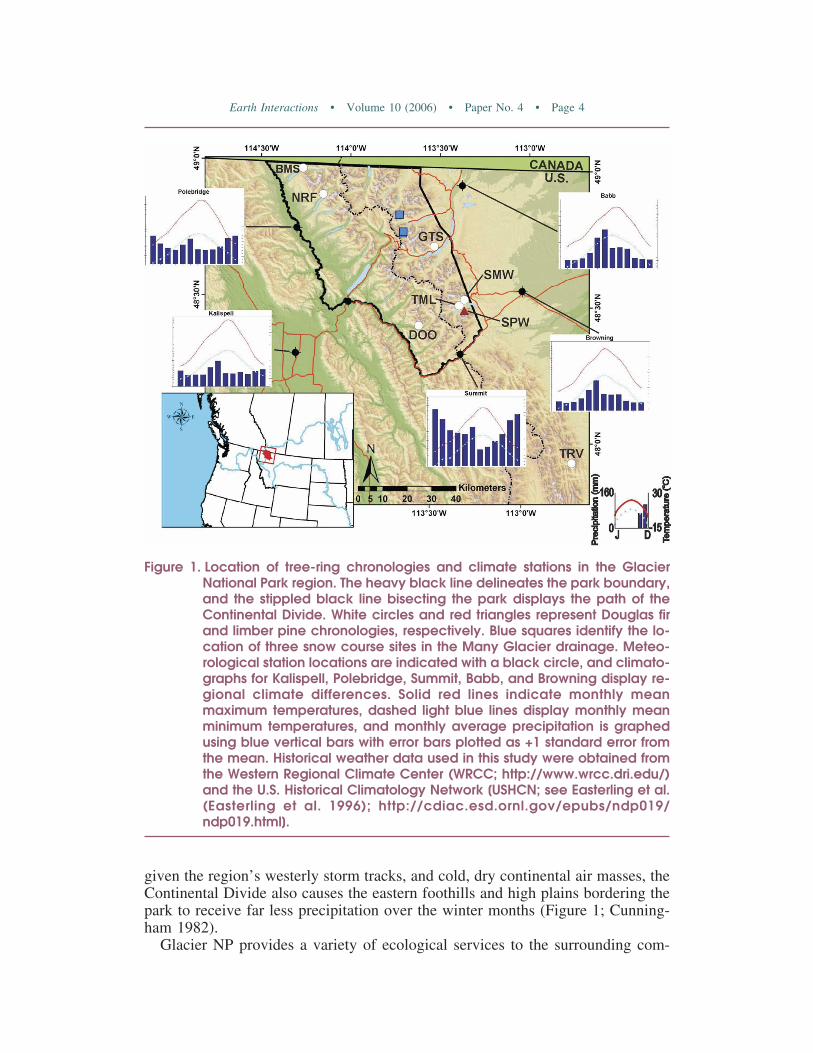
given the region’s westerly storm tracks, and cold, dry continental air masses, theContinental Divide also causes the eastern foothills and high plains bordering thepark to receive far less precipitation over the winter months (Figure 1; Cunning-ham 1982).
Glacier NP provides a variety of ecological services to the surrounding com-
Figure 1. Location of tree-ring chronologies and climate stations in the GlacierNational Park region. The heavy black line delineates the park boundary,and the stippled black line bisecting the park displays the path of theContinental Divide. White circles and red triangles represent Douglas firand limber pine chronologies, respectively. Blue squares identify the lo-cation of three snow course sites in the Many Glacier drainage. Meteo-rological station locations are indicated with a black circle, and climato-graphs for Kalispell, Polebridge, Summit, Babb, and Browning display re-gional climate differences. Solid red lines indicate monthly meanmaximum temperatures, dashed light blue lines display monthly meanminimum temperatures, and monthly average precipitation is graphedusing blue vertical bars with error bars plotted as +1 standard error fromthe mean. Historical weather data used in this study were obtained fromthe Western Regional Climate Center (WRCC; http://www.wrcc.dri.edu/)and the U.S. Historical Climatology Network [USHCN; see Easterling et al.(Easterling et al. 1996); http://cdiac.esd.ornl.gov/epubs/ndp019/ndp019.html].
Earth Interactions • Volume 10 (2006) • Paper No. 4 • Page 4
munities and the regional economy (Table 1). Three major river systems have aportion of their headwaters in Glacier NP: the Missouri/Mississippi, the Columbia,and the Saskatchewan/Nelson. Given the semiarid climate of the eastern slope,Glacier NP functions as a regional “water tower” providing critical water suppliesfor agricultural uses as well as hydropower. The park is surrounded by two na-tional forests, the Blackfoot Indian Reservation, Waterton National Park in Canadaand, to a lesser extent, private lands. Tourism facilities are embedded within thepark and are a prominent feature of all surrounding gateway communities. Thegateway communities thrive because of their dependence on visitors attracted toone of the nation’s premier national parks. The tourism industry located in andnear the park is a strong and growing part of the region’s economy. The role oftourism on the regional economy is best illustrated with Montana’s statewide data
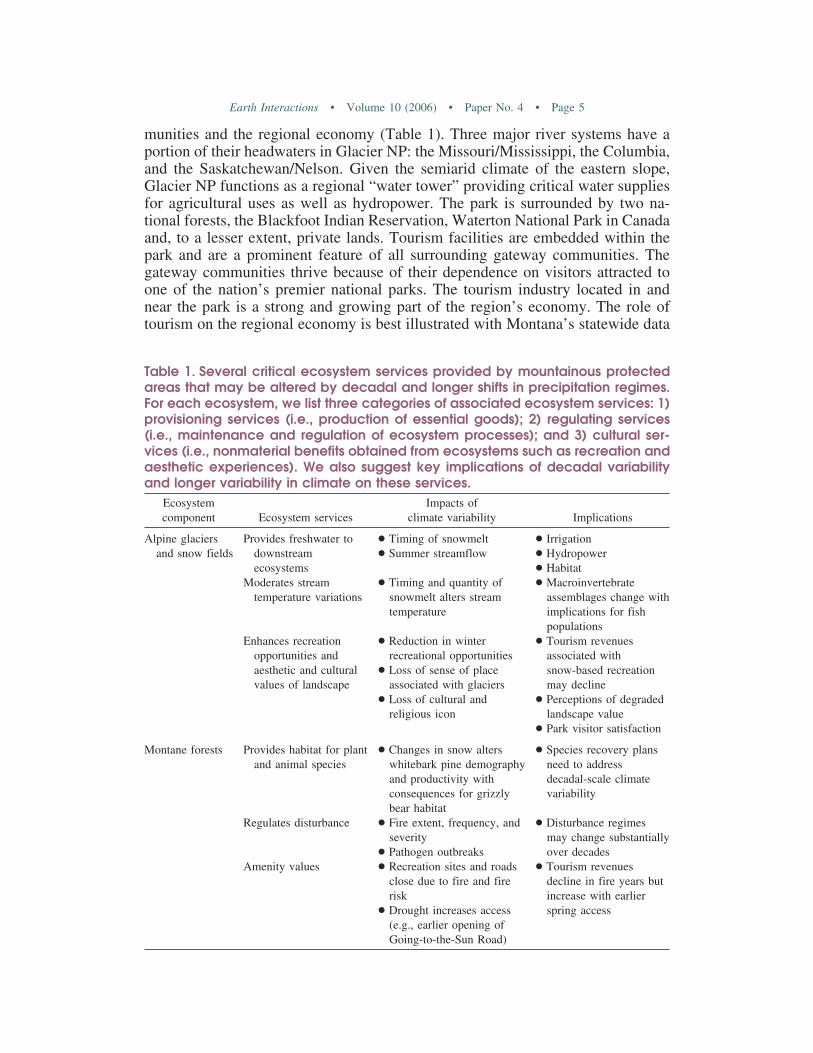
Table 1. Several critical ecosystem services provided by mountainous protectedareas that may be altered by decadal and longer shifts in precipitation regimes.For each ecosystem, we list three categories of associated ecosystem services: 1)provisioning services (i.e., production of essential goods); 2) regulating services(i.e., maintenance and regulation of ecosystem processes); and 3) cultural ser-vices (i.e., nonmaterial benefits obtained from ecosystems such as recreation andaesthetic experiences). We also suggest key implications of decadal variabilityand longer variability in climate on these services.
Ecosystemcomponent Ecosystem services
Impacts ofclimate variability Implications
Alpine glaciersand snow fields
Provides freshwater todownstreamecosystems
● Timing of snowmelt● Summer streamflow
● Irrigation● Hydropower● Habitat
Moderates streamtemperature variations
● Timing and quantity ofsnowmelt alters streamtemperature
● Macroinvertebrateassemblages change withimplications for fishpopulations
Enhances recreationopportunities andaesthetic and culturalvalues of landscape
● Reduction in winterrecreational opportunities
● Loss of sense of placeassociated with glaciers
● Loss of cultural andreligious icon
● Tourism revenuesassociated withsnow-based recreationmay decline
● Perceptions of degradedlandscape value
● Park visitor satisfaction
Montane forests Provides habitat for plantand animal species
● Changes in snow alterswhitebark pine demographyand productivity withconsequences for grizzlybear habitat
● Species recovery plansneed to addressdecadal-scale climatevariability
Regulates disturbance ● Fire extent, frequency, andseverity
● Pathogen outbreaks
● Disturbance regimesmay change substantiallyover decades
Amenity values ● Recreation sites and roadsclose due to fire and firerisk
● Drought increases access(e.g., earlier opening ofGoing-to-the-Sun Road)
● Tourism revenuesdecline in fire years butincrease with earlierspring access
Earth Interactions • Volume 10 (2006) • Paper No. 4 • Page 5
recently released from the Institute for Tourism and Recreation Research at Uni-versity of Montana (Wilton 2004): in 2003 nearly 10 million nonresident travelersvisited Montana and their expenditures directly and indirectly contributed to thegeneration of nearly 6% of all jobs in the state; in 2003, nonresident travel ex-penditures in Montana totaled $1.86 billion, which constitutes a steady annualgrowth of 1%, making tourism one of the fastest growing segments of Montana’seconomy. Natural amenities associated with the park are cited as the primaryattraction for tourists to the region.
3. Data and methods3.1. Paleoproxy reconstructions of climate
Though instrumental climate records are invaluable tools for understanding short-term (years to a few decades) atmospheric variations, such observations are inad-equate for capturing decadal to multidecadal phenomena (Cayan et al. 1998). Inthe case of precipitation, only three to four significant wet/dry regimes spanninga decade or more were experienced in western North America during the instru-mental period (roughly the last 100 yr), and each of these regimes likely resultedfrom a different combination of forcings (Gedalof and Smith 2001; Villalba et al.2001). As a result, long-duration, moisture-sensitive tree-ring records provide theprimary means for examining decadal to multidecadal variability in the hydrocli-matic system. In the Rocky Mountains, ring widths from climatically sensitivetrees are especially suited to this purpose because they provide records of moisturevariability that encompass several centuries or even millennia (Fritts 1976; Briffaand Matthews 2002). Tree rings also yield continuous, precisely dated proxies thatare highly replicable (Fritts 1976; Cook and Kairiukstis 1990). With proper sam-pling and analysis, tree rings preserve both the high- and low-frequency (decadalto multidecadal) components of precipitation variability (Cook et al. 1995).
3.2. Tree-ring chronology development for Glacier NP
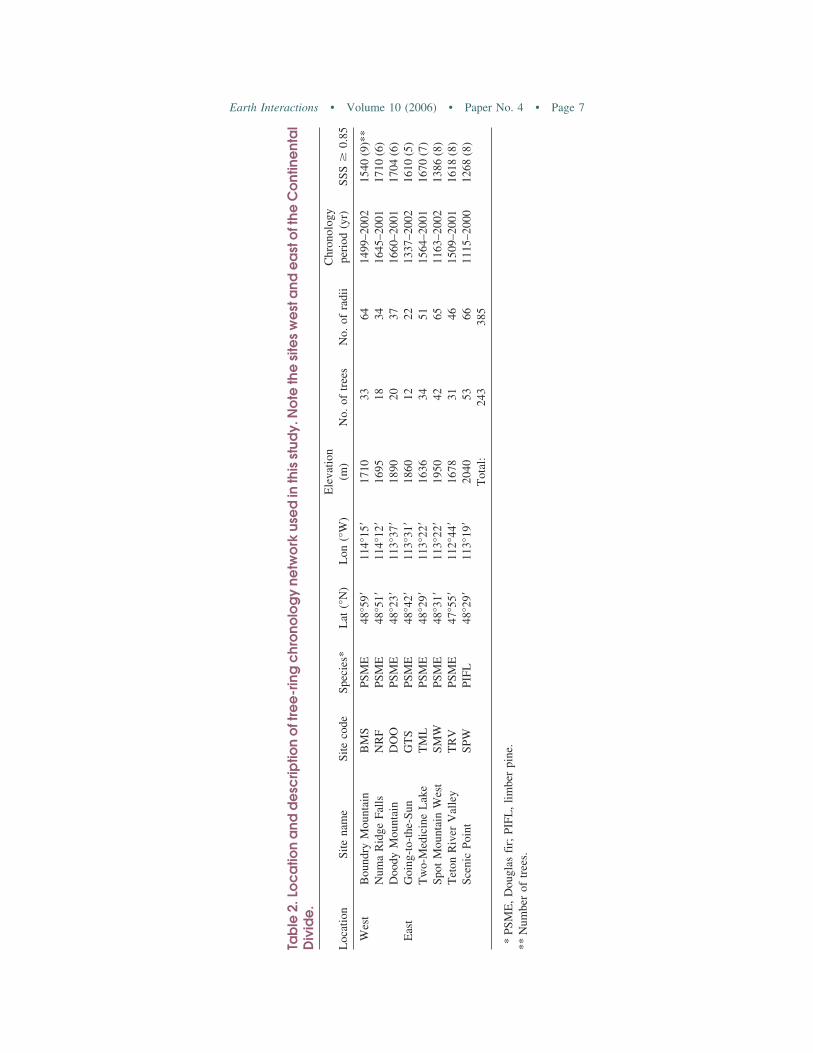
We sampled midelevation (1600–2040 m) sites in the Livingston, Lewis, andsoutheastern Teton mountain ranges (Figure 1; Table 2) to provide a north–southtransect of tree-ring records on both sides of the Continental Divide. Douglas fir[Pseudotsuga menziesii (Mirb.) Franco] were sampled at seven sites. Limber pine(Pinus flexilis James) was collected from a single location. All samples were takenfrom open-grown stands located on well-drained, south-facing slopes with sparseunderstory vegetation without signs of recent disturbance. Soils were shallow andcalcareous, originating from sedimentary rocks of the Appekunny, Prichard, andAltyn Formations (Middle Proterozoic).
We collected at least two cores from each suitable live tree, and samples wereobtained from remnant wood when available. A total of 243 trees (385 cores) wereused in constructing the final chronologies, with records from each site encom-passing between 341 and 885 yr. Numbers of trees sampled at each site rangedfrom a minimum of 12 to a maximum of 53 (Table 2). Cores and cross sectionswere mounted, sanded, and cross dated following standard techniques (Stokes andSmiley 1968; Fritts 1976; Briffa and Jones 1990). Total ring widths were measured
Earth Interactions • Volume 10 (2006) • Paper No. 4 • Page 6
Tab
le2.
Loc
atio
na
ndd
esc
riptio
no
ftre
e-r
ing
chr
ono
log
yne
two
rkus
ed
inth
isst
udy.
No
teth
esi
tes
we
sta
nde
ast
oft
heC
ont
ine
nta
lD
ivid
e.
Loc
atio
nSi
tena
me
Site
code
Spec
ies*
Lat
(°N
)L
on(°
W)
Ele
vatio
n(m
)N
o.of
tree
sN
o.of
radi
iC
hron
olog
ype
riod
(yr)
SSS
�0.
85
Wes
tB
ound
ryM
ount
ain
BM
SPS
ME
48°5
9�11
4°15
�17
1033
6414
99–2
002
1540
(9)*
*N
uma
Rid
geFa
llsN
RF
PSM
E48
°51�
114°
12�
1695
1834
1645
–200
117
10(6
)D
oody
Mou
ntai
nD
OO
PSM
E48
°23�
113°
37�
1890
2037
1660
–200
117
04(6
)E
ast
Goi
ng-t
o-th
e-Su
nG
TS
PSM
E48
°42�
113°
31�
1860
1222
1337
–200
216
10(5
)T
wo-
Med
icin
eL
ake
TM
LPS
ME
48°2
9�11
3°22
�16
3634
5115
64–2
001
1670
(7)
Spot
Mou
ntai
nW
est
SMW
PSM
E48
°31�
113°
22�
1950
4265
1163
–200
213
86(8
)T
eton
Riv
erV
alle
yT
RV
PSM
E47
°55�
112°
44�
1678
3146
1509
–200
116
18(8
)Sc
enic
Poin
tSP
WPI
FL48
°29�
113°
19�
2040
5366
1115
–200
012
68(8
)T
otal
:24
338
5
*PS
ME
,D
ougl
asfi
r;PI
FL,
limbe
rpi
ne.
**N
umbe
rof
tree
s.
Earth Interactions • Volume 10 (2006) • Paper No. 4 • Page 7
to a precision of ±0.001 mm, and dating of all series was verified using theCOFECHA program (Grissino-Mayer et al. 1997). Age-related growth trends ineach ring-width series were removed using methods that preserve both high- andlow-frequency variability (negative exponential curve, or linear trend line of nega-tive or zero slope), and the individual series combined into a standardized chro-nology using the biweight robust mean function in the ARSTAN program (Cooket al. 1990). To constrain error resulting from decreasing sample depth in the earlyportion of the record, subsample signal strength (SSS; Wigley et al. 1984) wascomputed for each chronology. An SSS value of 0.85 was selected as the cutoff forincluding a chronology in the reconstruction, thus limiting the amount of errorarising from a decreasing number of trees to 15% (Table 2).
3.3. Exploring potential tree-growth responses to climate
To determine the suitability of these tree-ring records for use in climate recon-structions, we used standard and bootstrapped correlation analyses and moving-window correlation coefficients (Biondi 1997; Biondi and Waikul 2004) to com-pare each chronology with local meteorological stations and Montana state climatedivision records (Figure 1). Correlations were calculated between individual chro-nologies and monthly, seasonal, and annual combinations of temperature andprecipitation. Many western U.S. chronologies integrate temperature and precipi-tation signals, so relationships between mean summer deficit (MSD) and thePalmer Drought Severity Index (PDSI; Palmer 1965) were examined. Calculationof MSD (precipitation − potential evapotranspiration [Thornthwaite (1948) forJune–August] and monthly PDSI was performed using the individual station New-hall Soil Moisture model (Newhall and Berdanier 1996) and PDSI software avail-able from the National Agricultural Decision Support System (http://nadss.unl.edu/). Each chronology was compared against instrumental climaterecords at t, t − 1(2,3), and t + 1(2,3) yr to account for lags in growth response andpersistence in the climate system.
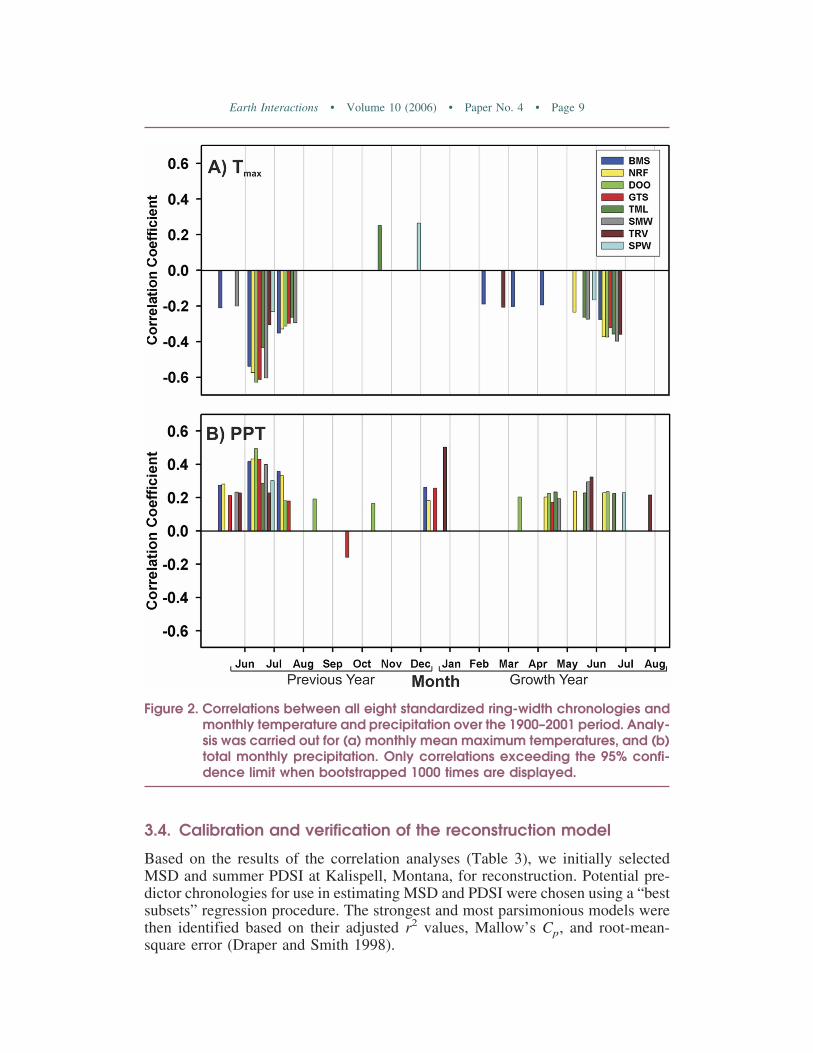
Correlation analysis showed a significant relationship between monthly tem-peratures and precipitation at each of the eight study sites (Figures 2a,b). Thestrongest and most temporally stable monthly correlations were found betweenring widths and mean monthly maximum temperature (Tmax) for the previous July(r � −0.30 to −0.63), with a consistent, but slightly reduced, response to growth-year July Tmax (r � −0.28 to −0.40). We also observed significant positive cor-relations (r � 0.23–0.49) with previous July total precipitation (PPT), and half ofthe Douglas fir chronologies responded to January PPT (r � 0.18–0.50). Themajority of the chronologies exhibits a consistent response to previous growingseason, or summer (June–August), PPT and Tmax with a reduced response to springand summer conditions during the year of growth (Figures 2a,b). Overall, thestrongest and most temporally stable correlations were observed between eachchronology and Kalispell MSD (r � 0.33–0.64) and summer PDSI [r � 0.25–0.62 (Table 3)]. Summer PDSI calculated for Montana climate division data failedto improve the relationship with all chronologies, especially those east of theContinental Divide, as did the use of station records other than Kalispell. Annu-alized climatic data and drought indices for 13 different 12-month periods resultedin lower overall correlations and decreased temporal stability (Pederson 2004).
Earth Interactions • Volume 10 (2006) • Paper No. 4 • Page 8
3.4. Calibration and verification of the reconstruction model
Based on the results of the correlation analyses (Table 3), we initially selectedMSD and summer PDSI at Kalispell, Montana, for reconstruction. Potential pre-dictor chronologies for use in estimating MSD and PDSI were chosen using a “bestsubsets” regression procedure. The strongest and most parsimonious models werethen identified based on their adjusted r2 values, Mallow’s Cp, and root-mean-square error (Draper and Smith 1998).
Figure 2. Correlations between all eight standardized ring-width chronologies andmonthly temperature and precipitation over the 1900–2001 period. Analy-sis was carried out for (a) monthly mean maximum temperatures, and (b)total monthly precipitation. Only correlations exceeding the 95% confi-dence limit when bootstrapped 1000 times are displayed.
Earth Interactions • Volume 10 (2006) • Paper No. 4 • Page 9
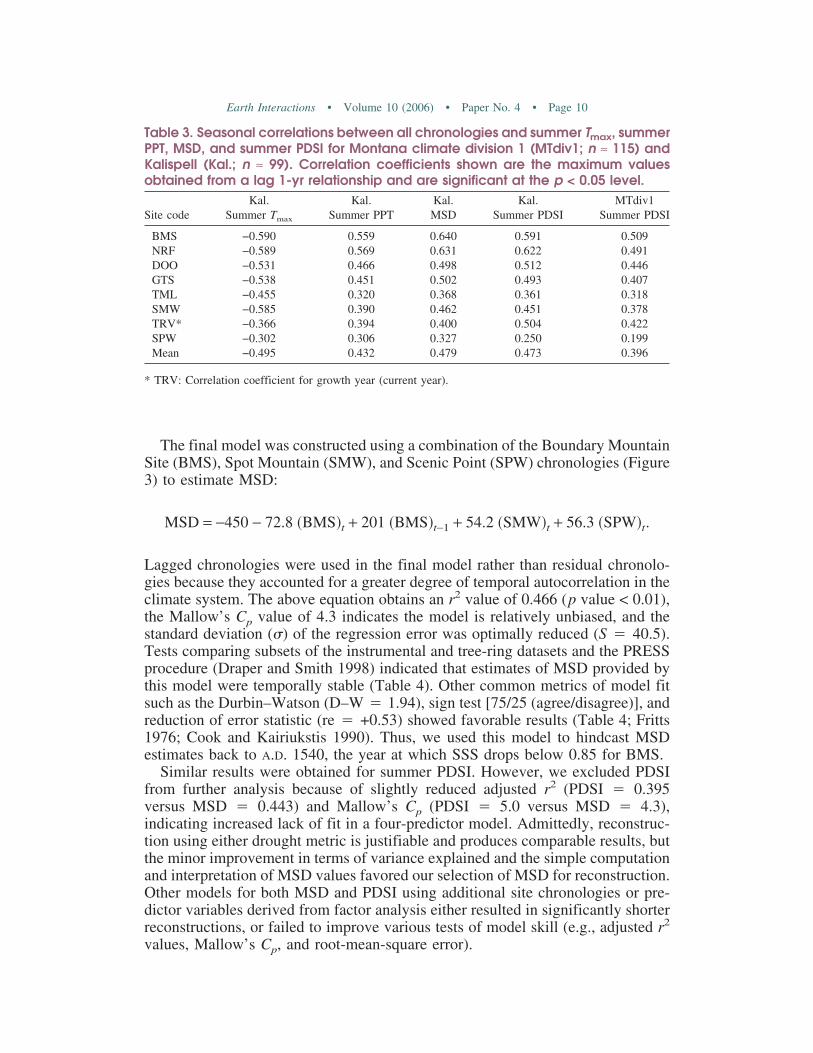
The final model was constructed using a combination of the Boundary MountainSite (BMS), Spot Mountain (SMW), and Scenic Point (SPW) chronologies (Figure3) to estimate MSD:
MSD = −450 − 72.8 �BMS�t + 201 �BMS�t−1 + 54.2 �SMW�t + 56.3 �SPW�t.
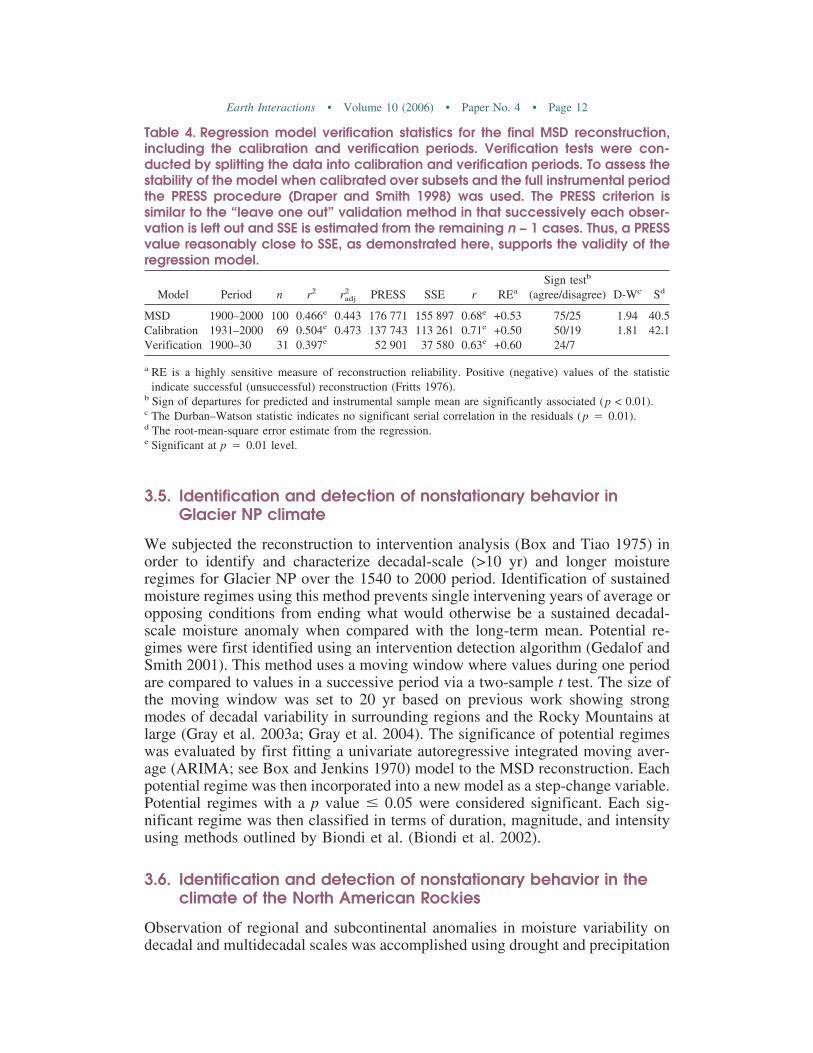
Lagged chronologies were used in the final model rather than residual chronolo-gies because they accounted for a greater degree of temporal autocorrelation in theclimate system. The above equation obtains an r2 value of 0.466 (p value < 0.01),the Mallow’s Cp value of 4.3 indicates the model is relatively unbiased, and thestandard deviation (�) of the regression error was optimally reduced (S � 40.5).Tests comparing subsets of the instrumental and tree-ring datasets and the PRESSprocedure (Draper and Smith 1998) indicated that estimates of MSD provided bythis model were temporally stable (Table 4). Other common metrics of model fitsuch as the Durbin–Watson (D–W � 1.94), sign test [75/25 (agree/disagree)], andreduction of error statistic (re � +0.53) showed favorable results (Table 4; Fritts1976; Cook and Kairiukstis 1990). Thus, we used this model to hindcast MSDestimates back to A.D. 1540, the year at which SSS drops below 0.85 for BMS.
Similar results were obtained for summer PDSI. However, we excluded PDSIfrom further analysis because of slightly reduced adjusted r2 (PDSI � 0.395versus MSD � 0.443) and Mallow’s Cp (PDSI � 5.0 versus MSD � 4.3),indicating increased lack of fit in a four-predictor model. Admittedly, reconstruc-tion using either drought metric is justifiable and produces comparable results, butthe minor improvement in terms of variance explained and the simple computationand interpretation of MSD values favored our selection of MSD for reconstruction.Other models for both MSD and PDSI using additional site chronologies or pre-dictor variables derived from factor analysis either resulted in significantly shorterreconstructions, or failed to improve various tests of model skill (e.g., adjusted r2
values, Mallow’s Cp, and root-mean-square error).
Table 3. Seasonal correlations between all chronologies and summer Tmax, summerPPT, MSD, and summer PDSI for Montana climate division 1 (MTdiv1; n ≈ 115) andKalispell (Kal.; n ≈ 99). Correlation coefficients shown are the maximum valuesobtained from a lag 1-yr relationship and are significant at the p < 0.05 level.
Kal. Kal. Kal. Kal. MTdiv1Site code Summer Tmax Summer PPT MSD Summer PDSI Summer PDSI
BMS −0.590 0.559 0.640 0.591 0.509NRF −0.589 0.569 0.631 0.622 0.491DOO −0.531 0.466 0.498 0.512 0.446GTS −0.538 0.451 0.502 0.493 0.407TML −0.455 0.320 0.368 0.361 0.318SMW −0.585 0.390 0.462 0.451 0.378TRV* −0.366 0.394 0.400 0.504 0.422SPW −0.302 0.306 0.327 0.250 0.199Mean −0.495 0.432 0.479 0.473 0.396
* TRV: Correlation coefficient for growth year (current year).
Earth Interactions • Volume 10 (2006) • Paper No. 4 • Page 10
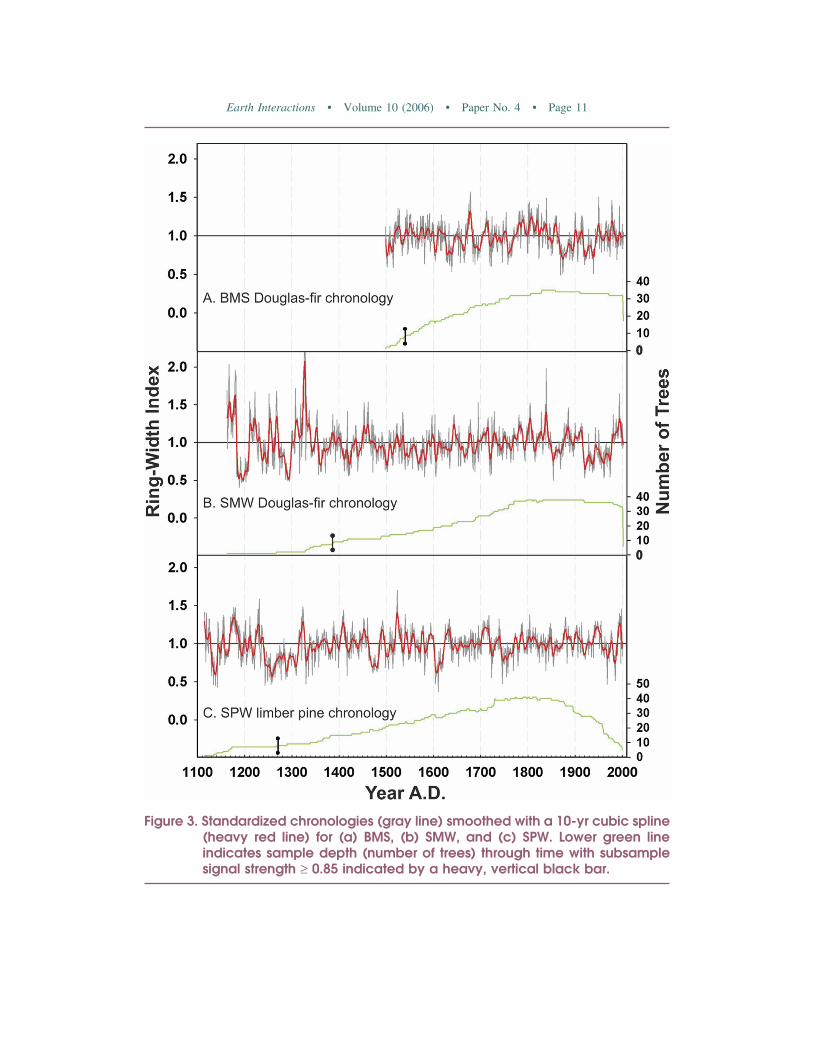
Figure 3. Standardized chronologies (gray line) smoothed with a 10-yr cubic spline(heavy red line) for (a) BMS, (b) SMW, and (c) SPW. Lower green lineindicates sample depth (number of trees) through time with subsamplesignal strength ≥ 0.85 indicated by a heavy, vertical black bar.
Earth Interactions • Volume 10 (2006) • Paper No. 4 • Page 11
3.5. Identification and detection of nonstationary behavior inGlacier NP climate
We subjected the reconstruction to intervention analysis (Box and Tiao 1975) inorder to identify and characterize decadal-scale (>10 yr) and longer moistureregimes for Glacier NP over the 1540 to 2000 period. Identification of sustainedmoisture regimes using this method prevents single intervening years of average oropposing conditions from ending what would otherwise be a sustained decadal-scale moisture anomaly when compared with the long-term mean. Potential re-gimes were first identified using an intervention detection algorithm (Gedalof andSmith 2001). This method uses a moving window where values during one periodare compared to values in a successive period via a two-sample t test. The size ofthe moving window was set to 20 yr based on previous work showing strongmodes of decadal variability in surrounding regions and the Rocky Mountains atlarge (Gray et al. 2003a; Gray et al. 2004). The significance of potential regimeswas evaluated by first fitting a univariate autoregressive integrated moving aver-age (ARIMA; see Box and Jenkins 1970) model to the MSD reconstruction. Eachpotential regime was then incorporated into a new model as a step-change variable.Potential regimes with a p value � 0.05 were considered significant. Each sig-nificant regime was then classified in terms of duration, magnitude, and intensityusing methods outlined by Biondi et al. (Biondi et al. 2002).
3.6. Identification and detection of nonstationary behavior in theclimate of the North American Rockies
Observation of regional and subcontinental anomalies in moisture variability ondecadal and multidecadal scales was accomplished using drought and precipitation
Table 4. Regression model verification statistics for the final MSD reconstruction,including the calibration and verification periods. Verification tests were con-ducted by splitting the data into calibration and verification periods. To assess thestability of the model when calibrated over subsets and the full instrumental periodthe PRESS procedure (Draper and Smith 1998) was used. The PRESS criterion issimilar to the “leave one out” validation method in that successively each obser-vation is left out and SSE is estimated from the remaining n − 1 cases. Thus, a PRESSvalue reasonably close to SSE, as demonstrated here, supports the validity of theregression model.
Sign testb
Model Period n r2 r2adj PRESS SSE r REa (agree/disagree) D-Wc Sd
MSD 1900–2000 100 0.466e 0.443 176 771 155 897 0.68e +0.53 75/25 1.94 40.5Calibration 1931–2000 69 0.504e 0.473 137 743 113 261 0.71e +0.50 50/19 1.81 42.1Verification 1900–30 31 0.397e 52 901 37 580 0.63e +0.60 24/7
a RE is a highly sensitive measure of reconstruction reliability. Positive (negative) values of the statisticindicate successful (unsuccessful) reconstruction (Fritts 1976).
b Sign of departures for predicted and instrumental sample mean are significantly associated (p < 0.01).c The Durban–Watson statistic indicates no significant serial correlation in the residuals (p � 0.01).d The root-mean-square error estimate from the regression.e Significant at p � 0.01 level.
Earth Interactions • Volume 10 (2006) • Paper No. 4 • Page 12
reconstructions arrayed along a north to south transect through the Rockies. Thesereconstructions include the following: annual precipitation (pJuly–June) fromBanff National Park (NP) and Waterton NP, Alberta, Canada (Watson and Luck-man 2004a); summer drought (June–August) for Glacier NP, Montana (this study);annual precipitation (pJune–June) for Yellowstone NP, Wyoming (S. T. Gray et al.2006); Uinta Basin, Utah, June PDSI (Gray et al. 2003b; Gray et al. 2004); andannual precipitation (pJuly–July) for El Malpias National Monument (NM) innorthwestern New Mexico (Grissino-Mayer 1996a,b). Though the choice of sea-son for reconstruction varies among these records, all of the proxies have signalsthat are strongly related to growing-season drought while also integrating precipi-tation over the winter and spring months (Stahle et al. 2000). The associatedauthors provided data for the Banff NP, Waterton NP, and Yellowstone NP re-constructions, and all remaining datasets were obtained from the World DataCenter for Paleoclimatology (http://www.ngdc.noaa.gov/paleo/recons.html).
For each reconstruction along the Rocky Mountain transect, dominant modes ofmoisture variability were examined using multitaper method (MTM; Mann andLees 1996) spectral analysis. Power in the frequency domain was tested against ared-noise background over an interval common to all of the reconstructions (1540–1992), and only peaks exceeding the 95% confidence limit were considered sig-nificant. Based on the MTM analysis, we determined that all of the reconstructionsshare similar modes of lower-frequency variability in a band from 20 to 30 yr (andgenerally >50 yr). We then smoothed the reconstructions with a 25-yr spline tohighlight this common variability.
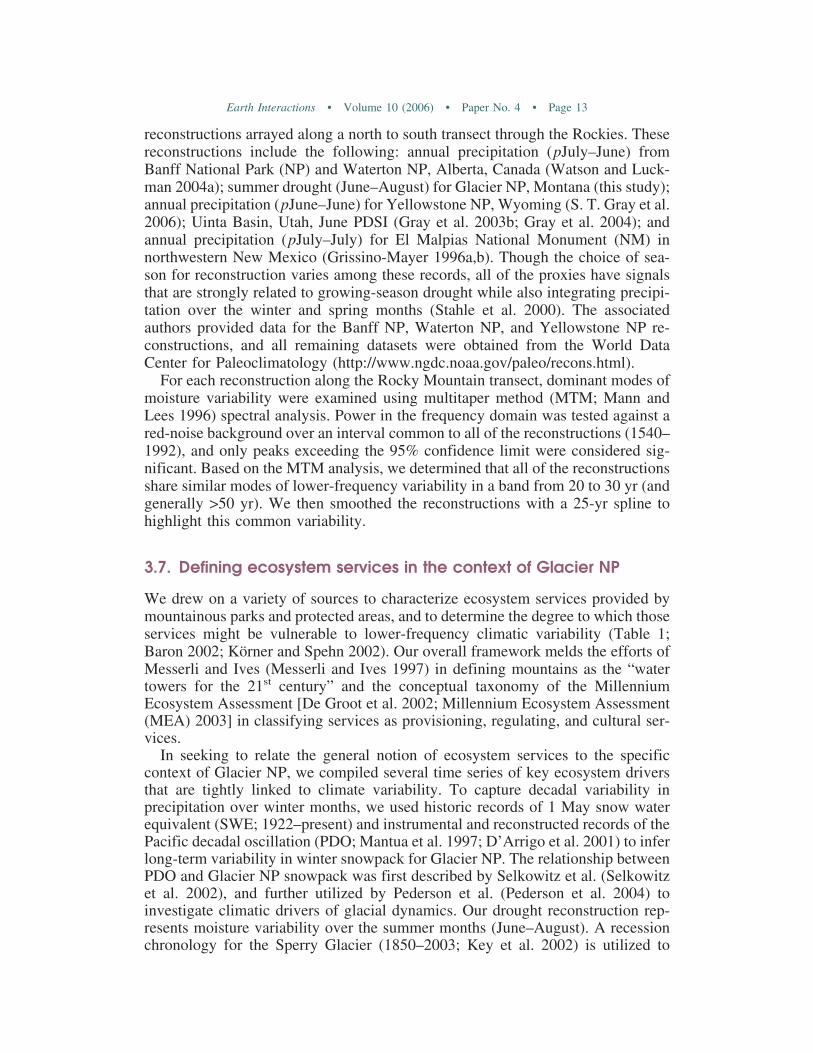
3.7. Defining ecosystem services in the context of Glacier NP
We drew on a variety of sources to characterize ecosystem services provided bymountainous parks and protected areas, and to determine the degree to which thoseservices might be vulnerable to lower-frequency climatic variability (Table 1;Baron 2002; Körner and Spehn 2002). Our overall framework melds the efforts ofMesserli and Ives (Messerli and Ives 1997) in defining mountains as the “watertowers for the 21st century” and the conceptual taxonomy of the MillenniumEcosystem Assessment [De Groot et al. 2002; Millennium Ecosystem Assessment(MEA) 2003] in classifying services as provisioning, regulating, and cultural ser-vices.
In seeking to relate the general notion of ecosystem services to the specificcontext of Glacier NP, we compiled several time series of key ecosystem driversthat are tightly linked to climate variability. To capture decadal variability inprecipitation over winter months, we used historic records of 1 May snow waterequivalent (SWE; 1922–present) and instrumental and reconstructed records of thePacific decadal oscillation (PDO; Mantua et al. 1997; D’Arrigo et al. 2001) to inferlong-term variability in winter snowpack for Glacier NP. The relationship betweenPDO and Glacier NP snowpack was first described by Selkowitz et al. (Selkowitzet al. 2002), and further utilized by Pederson et al. (Pederson et al. 2004) toinvestigate climatic drivers of glacial dynamics. Our drought reconstruction rep-resents moisture variability over the summer months (June–August). A recessionchronology for the Sperry Glacier (1850–2003; Key et al. 2002) is utilized to
Earth Interactions • Volume 10 (2006) • Paper No. 4 • Page 13
display common patterns of glacial retreat since the Little Ice Age (LIA) maxi-mum, as Sperry is representative of the general pattern of glacial retreat throughoutthe park. Finally, we characterized the long-term pattern of fire in Glacier NP bycompiling records of historic fire extent and frequency from Barrett (Barrett 1982;Barrett 1986; Barrett 1988; Barrett 1993) and Key (Key 1984) along with thecurrent fire database provided by (and maintained by) Glacier NP. The fire historydataset is most useful for observing the frequency of fires through time. Due to theextent of late-nineteenth-century and early-twentieth-century fires, estimates ofareas burned for previous centuries are confounded, and may be underestimated byan unknown order of magnitude (S. W. Barrett 2004, personal communication).
4. Results4.1. Reconstructed summer moisture availability in Glacier NP, A.D.
1540 to 2000
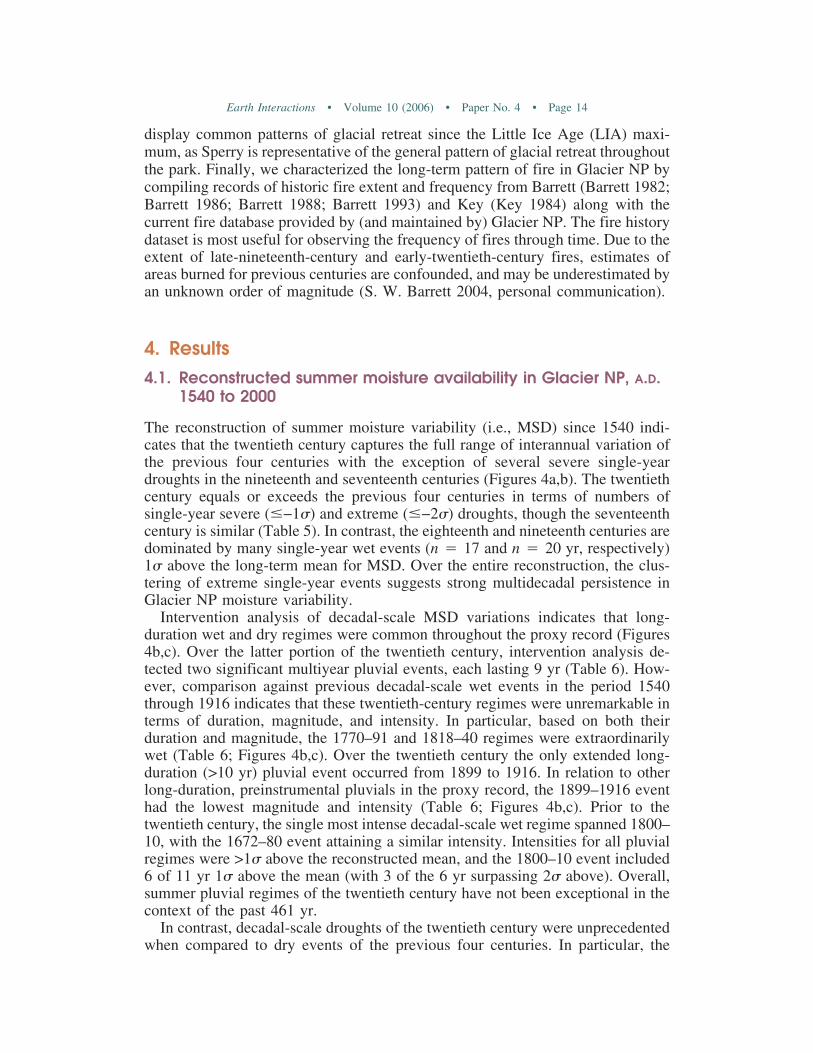
The reconstruction of summer moisture variability (i.e., MSD) since 1540 indi-cates that the twentieth century captures the full range of interannual variation ofthe previous four centuries with the exception of several severe single-yeardroughts in the nineteenth and seventeenth centuries (Figures 4a,b). The twentiethcentury equals or exceeds the previous four centuries in terms of numbers ofsingle-year severe (�−1�) and extreme (�−2�) droughts, though the seventeenthcentury is similar (Table 5). In contrast, the eighteenth and nineteenth centuries aredominated by many single-year wet events (n � 17 and n � 20 yr, respectively)1� above the long-term mean for MSD. Over the entire reconstruction, the clus-tering of extreme single-year events suggests strong multidecadal persistence inGlacier NP moisture variability.
Intervention analysis of decadal-scale MSD variations indicates that long-duration wet and dry regimes were common throughout the proxy record (Figures4b,c). Over the latter portion of the twentieth century, intervention analysis de-tected two significant multiyear pluvial events, each lasting 9 yr (Table 6). How-ever, comparison against previous decadal-scale wet events in the period 1540through 1916 indicates that these twentieth-century regimes were unremarkable interms of duration, magnitude, and intensity. In particular, based on both theirduration and magnitude, the 1770–91 and 1818–40 regimes were extraordinarilywet (Table 6; Figures 4b,c). Over the twentieth century the only extended long-duration (>10 yr) pluvial event occurred from 1899 to 1916. In relation to otherlong-duration, preinstrumental pluvials in the proxy record, the 1899–1916 eventhad the lowest magnitude and intensity (Table 6; Figures 4b,c). Prior to thetwentieth century, the single most intense decadal-scale wet regime spanned 1800–10, with the 1672–80 event attaining a similar intensity. Intensities for all pluvialregimes were >1� above the reconstructed mean, and the 1800–10 event included6 of 11 yr 1� above the mean (with 3 of the 6 yr surpassing 2� above). Overall,summer pluvial regimes of the twentieth century have not been exceptional in thecontext of the past 461 yr.
In contrast, decadal-scale droughts of the twentieth century were unprecedentedwhen compared to dry events of the previous four centuries. In particular, the
Earth Interactions • Volume 10 (2006) • Paper No. 4 • Page 14
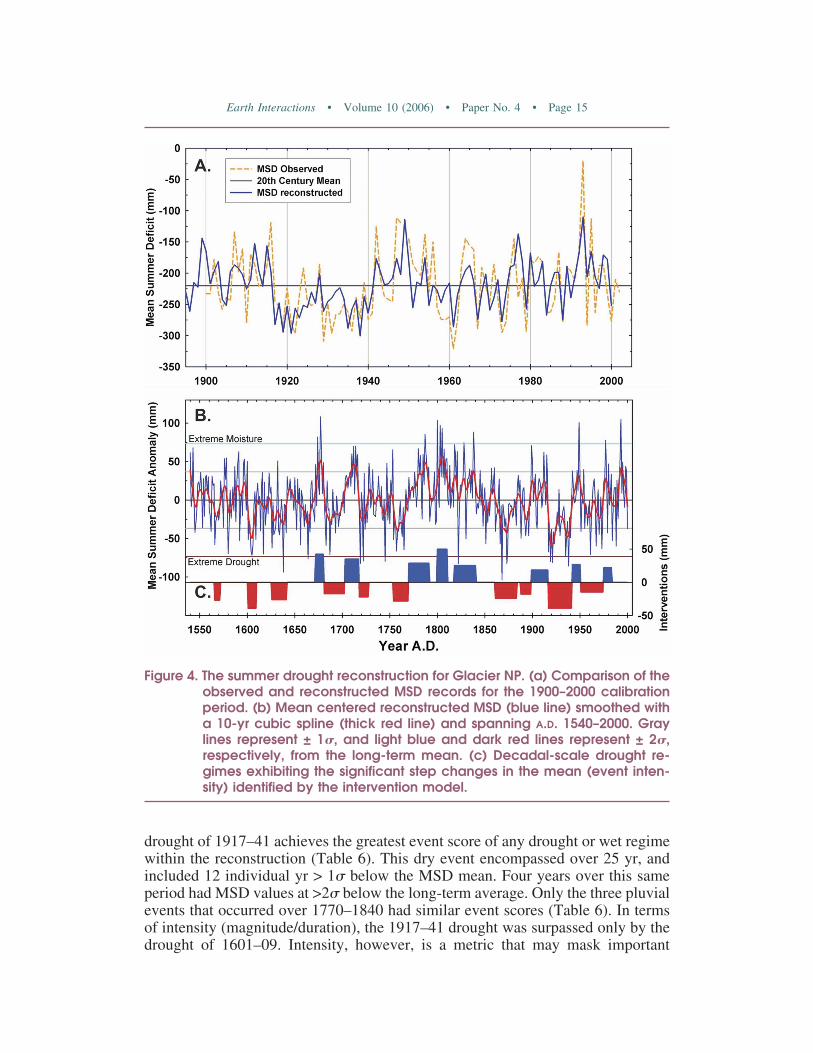
drought of 1917–41 achieves the greatest event score of any drought or wet regimewithin the reconstruction (Table 6). This dry event encompassed over 25 yr, andincluded 12 individual yr > 1� below the MSD mean. Four years over this sameperiod had MSD values at >2� below the long-term average. Only the three pluvialevents that occurred over 1770–1840 had similar event scores (Table 6). In termsof intensity (magnitude/duration), the 1917–41 drought was surpassed only by thedrought of 1601–09. Intensity, however, is a metric that may mask important
Figure 4. The summer drought reconstruction for Glacier NP. (a) Comparison of theobserved and reconstructed MSD records for the 1900–2000 calibrationperiod. (b) Mean centered reconstructed MSD (blue line) smoothed witha 10-yr cubic spline (thick red line) and spanning A.D. 1540–2000. Graylines represent ± 1�, and light blue and dark red lines represent ± 2�,respectively, from the long-term mean. (c) Decadal-scale drought re-gimes exhibiting the significant step changes in the mean (event inten-sity) identified by the intervention model.
Earth Interactions • Volume 10 (2006) • Paper No. 4 • Page 15
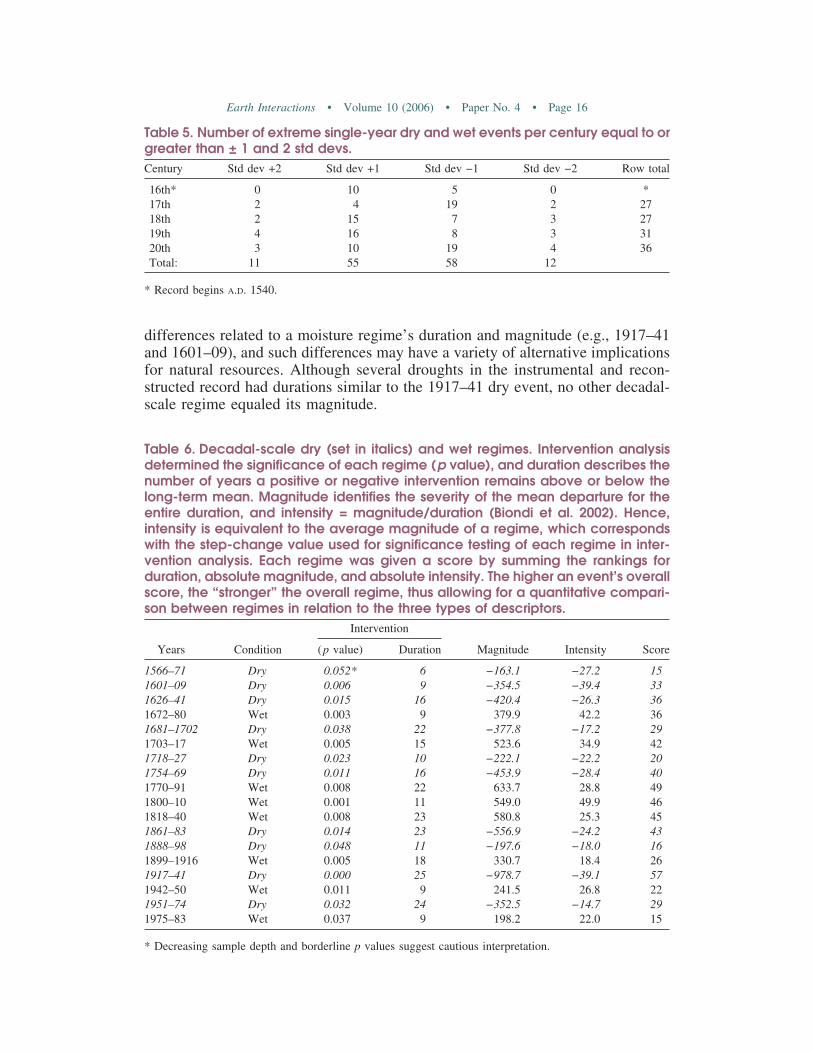
differences related to a moisture regime’s duration and magnitude (e.g., 1917–41and 1601–09), and such differences may have a variety of alternative implicationsfor natural resources. Although several droughts in the instrumental and recon-structed record had durations similar to the 1917–41 dry event, no other decadal-scale regime equaled its magnitude.
Table 6. Decadal-scale dry (set in italics) and wet regimes. Intervention analysisdetermined the significance of each regime (p value), and duration describes thenumber of years a positive or negative intervention remains above or below thelong-term mean. Magnitude identifies the severity of the mean departure for theentire duration, and intensity = magnitude/duration (Biondi et al. 2002). Hence,intensity is equivalent to the average magnitude of a regime, which correspondswith the step-change value used for significance testing of each regime in inter-vention analysis. Each regime was given a score by summing the rankings forduration, absolute magnitude, and absolute intensity. The higher an event’s overallscore, the “stronger” the overall regime, thus allowing for a quantitative compari-son between regimes in relation to the three types of descriptors.
Intervention
Years Condition (p value) Duration Magnitude Intensity Score
1566–71 Dry 0.052* 6 −163.1 −27.2 151601–09 Dry 0.006 9 −354.5 −39.4 331626–41 Dry 0.015 16 −420.4 −26.3 361672–80 Wet 0.003 9 379.9 42.2 361681–1702 Dry 0.038 22 −377.8 −17.2 291703–17 Wet 0.005 15 523.6 34.9 421718–27 Dry 0.023 10 −222.1 −22.2 201754–69 Dry 0.011 16 −453.9 −28.4 401770–91 Wet 0.008 22 633.7 28.8 491800–10 Wet 0.001 11 549.0 49.9 461818–40 Wet 0.008 23 580.8 25.3 451861–83 Dry 0.014 23 −556.9 −24.2 431888–98 Dry 0.048 11 −197.6 −18.0 161899–1916 Wet 0.005 18 330.7 18.4 261917–41 Dry 0.000 25 −978.7 −39.1 571942–50 Wet 0.011 9 241.5 26.8 221951–74 Dry 0.032 24 −352.5 −14.7 291975–83 Wet 0.037 9 198.2 22.0 15
* Decreasing sample depth and borderline p values suggest cautious interpretation.
Table 5. Number of extreme single-year dry and wet events per century equal to orgreater than ± 1 and 2 std devs.Century Std dev +2 Std dev +1 Std dev −1 Std dev −2 Row total
16th* 0 10 5 0 *17th 2 4 19 2 2718th 2 15 7 3 2719th 4 16 8 3 3120th 3 10 19 4 36Total: 11 55 58 12
* Record begins A.D. 1540.
Earth Interactions • Volume 10 (2006) • Paper No. 4 • Page 16
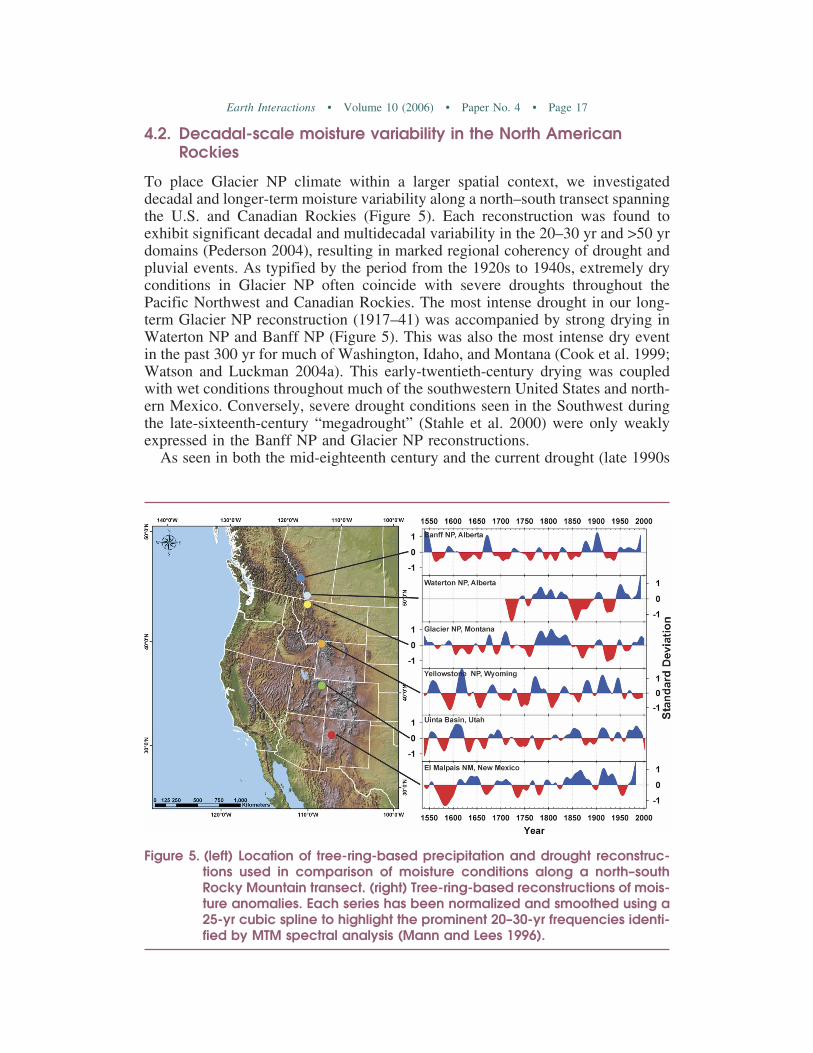
4.2. Decadal-scale moisture variability in the North AmericanRockies
To place Glacier NP climate within a larger spatial context, we investigateddecadal and longer-term moisture variability along a north–south transect spanningthe U.S. and Canadian Rockies (Figure 5). Each reconstruction was found toexhibit significant decadal and multidecadal variability in the 20–30 yr and >50 yrdomains (Pederson 2004), resulting in marked regional coherency of drought andpluvial events. As typified by the period from the 1920s to 1940s, extremely dryconditions in Glacier NP often coincide with severe droughts throughout thePacific Northwest and Canadian Rockies. The most intense drought in our long-term Glacier NP reconstruction (1917–41) was accompanied by strong drying inWaterton NP and Banff NP (Figure 5). This was also the most intense dry eventin the past 300 yr for much of Washington, Idaho, and Montana (Cook et al. 1999;Watson and Luckman 2004a). This early-twentieth-century drying was coupledwith wet conditions throughout much of the southwestern United States and north-ern Mexico. Conversely, severe drought conditions seen in the Southwest duringthe late-sixteenth-century “megadrought” (Stahle et al. 2000) were only weaklyexpressed in the Banff NP and Glacier NP reconstructions.
As seen in both the mid-eighteenth century and the current drought (late 1990s
Figure 5. (left) Location of tree-ring-based precipitation and drought reconstruc-tions used in comparison of moisture conditions along a north–southRocky Mountain transect. (right) Tree-ring-based reconstructions of mois-ture anomalies. Each series has been normalized and smoothed using a25-yr cubic spline to highlight the prominent 20–30-yr frequencies identi-fied by MTM spectral analysis (Mann and Lees 1996).
Earth Interactions • Volume 10 (2006) • Paper No. 4 • Page 17
to 2004), severe dry events may also span almost all of western North America.Similarly, wet events centered around the 1910s and 1980s through 1990s spannedmuch of the U.S. and Canadian Rockies (Figure 5). Thus, the paleoproxy recordsdemonstrate both regional and subcontinental phasing of long-duration moistureanomalies.
5. Discussion5.1. Linking decadal-scale moisture regimes and natural processes
in western North America
Our reconstruction of summer moisture variability for Glacier NP exhibits strongdecadal to multidecadal variability resulting in persistent (>10 yr) wet and dryregimes over the past five centuries. The period spanning A.D. 1670 to 1850 wascharacterized by many long-duration, high-intensity pluvial events (e.g., Figures4b,c) that correspond with the height of the LIA (∼1300–1850 A.D.). This periodof generally cool and wet summers was unsurpassed by any other wet regime inthe instrumental or proxy record. Since the middle of the nineteenth century,however, our reconstruction indicates that summer drought regimes have generallybeen more severe than those in previous centuries. Consistent with the findings ofCook et al. (Cook et al. 2004), Glacier NP and much of the West has again shiftedto a severe drought phase, though conditions abated somewhat in 2004.
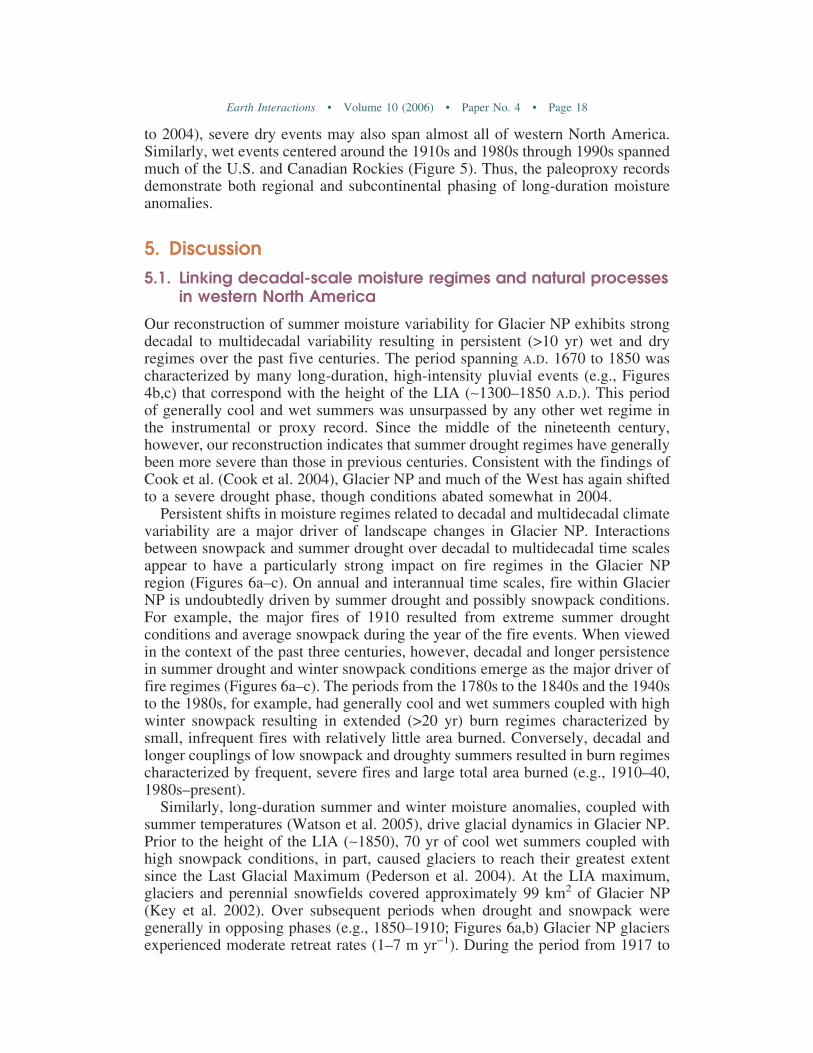
Persistent shifts in moisture regimes related to decadal and multidecadal climatevariability are a major driver of landscape changes in Glacier NP. Interactionsbetween snowpack and summer drought over decadal to multidecadal time scalesappear to have a particularly strong impact on fire regimes in the Glacier NPregion (Figures 6a–c). On annual and interannual time scales, fire within GlacierNP is undoubtedly driven by summer drought and possibly snowpack conditions.For example, the major fires of 1910 resulted from extreme summer droughtconditions and average snowpack during the year of the fire events. When viewedin the context of the past three centuries, however, decadal and longer persistencein summer drought and winter snowpack conditions emerge as the major driver offire regimes (Figures 6a–c). The periods from the 1780s to the 1840s and the 1940sto the 1980s, for example, had generally cool and wet summers coupled with highwinter snowpack resulting in extended (>20 yr) burn regimes characterized bysmall, infrequent fires with relatively little area burned. Conversely, decadal andlonger couplings of low snowpack and droughty summers resulted in burn regimescharacterized by frequent, severe fires and large total area burned (e.g., 1910–40,1980s–present).
Similarly, long-duration summer and winter moisture anomalies, coupled withsummer temperatures (Watson et al. 2005), drive glacial dynamics in Glacier NP.Prior to the height of the LIA (∼1850), 70 yr of cool wet summers coupled withhigh snowpack conditions, in part, caused glaciers to reach their greatest extentsince the Last Glacial Maximum (Pederson et al. 2004). At the LIA maximum,glaciers and perennial snowfields covered approximately 99 km2 of Glacier NP(Key et al. 2002). Over subsequent periods when drought and snowpack weregenerally in opposing phases (e.g., 1850–1910; Figures 6a,b) Glacier NP glaciersexperienced moderate retreat rates (1–7 m yr−1). During the period from 1917 to
Earth Interactions • Volume 10 (2006) • Paper No. 4 • Page 18
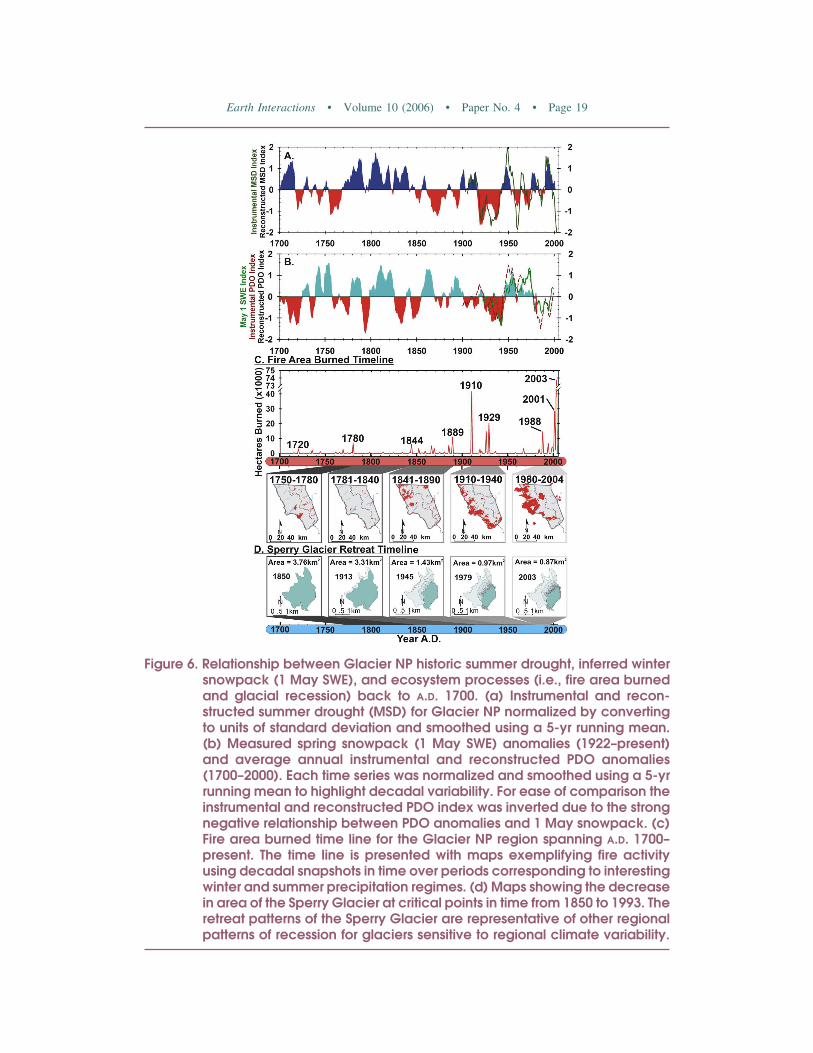
Figure 6. Relationship between Glacier NP historic summer drought, inferred wintersnowpack (1 May SWE), and ecosystem processes (i.e., fire area burnedand glacial recession) back to A.D. 1700. (a) Instrumental and recon-structed summer drought (MSD) for Glacier NP normalized by convertingto units of standard deviation and smoothed using a 5-yr running mean.(b) Measured spring snowpack (1 May SWE) anomalies (1922–present)and average annual instrumental and reconstructed PDO anomalies(1700–2000). Each time series was normalized and smoothed using a 5-yrrunning mean to highlight decadal variability. For ease of comparison theinstrumental and reconstructed PDO index was inverted due to the strongnegative relationship between PDO anomalies and 1 May snowpack. (c)Fire area burned time line for the Glacier NP region spanning A.D. 1700–present. The time line is presented with maps exemplifying fire activityusing decadal snapshots in time over periods corresponding to interestingwinter and summer precipitation regimes. (d) Maps showing the decreasein area of the Sperry Glacier at critical points in time from 1850 to 1993. Theretreat patterns of the Sperry Glacier are representative of other regionalpatterns of recession for glaciers sensitive to regional climate variability.
Earth Interactions • Volume 10 (2006) • Paper No. 4 • Page 19
1941, however, sustained low-snowpack coupled with extreme summer droughtconditions, in part, drove rapid glacial retreat. The Sperry Glacier, for example,retreated at 15–22 m yr−1 and lost approximately 68% of its area (Figure 6d). Otherglaciers such as the Jackson and Agassiz Glaciers at times retreated at rates � 100m yr−1 (Carrara and McGimsey 1981; Key et al. 2002; Pederson et al. 2004).Climatic conditions over the middle of the twentieth century became generallyfavorable (i.e., high snowpack with variable summer drought conditions) for sta-bilization and even slight readvance at some glaciers (Figures 6a,b). Combinedwith changes in the glacier retreat rates due to topography (e.g., increased shad-ing), retreat rates decreased after the 1940s (11 m yr−1 by 1950; 5 m yr−1 by 1979for the Sperry Glacier). Since the late 1970s, however, winter snowpack has beenlow while severe and sustained summer drought conditions have returned, andmany Glacier NP glaciers are again shrinking rapidly (Figures 6a,b,d). If thispattern of hot and dry summers coupled with extremely low snowpack continues,Hall and Fagre (Hall and Fagre 2003) predict glaciers will be largely gone by 2030.
As in our study of Glacier NP climate, networks of moisture reconstructionsfrom the Rocky Mountains (Figure 5) indicate strong regional expression of long-duration drought and pluvial anomalies. The patterns associated with regionalmoisture anomalies often exhibit opposing phases between the northern and south-ern Rocky Mountains (Fye et al. 2003; Gray et al. 2003a). However, subconti-nental-scale droughts spanning large portions of the Rockies from Canada to thesouthwestern United States were also observed.
Regional- to subcontinental-scale synchrony of moisture regimes during strongand persistent drought/wet events, as well as the consistency of decadal to mul-tidecadal modes throughout the Rockies (Gray et al. 2003a; Pederson 2004),suggests that a common mechanism drives the spatial and temporal expression ofprecipitation variability in these regions. Because many different tree species wereincluded in the transect, this coherency implies that these low-frequency signals donot result from species-specific biological traits (e.g., needle retention, masting,etc.). Instead, the observed modes of variation most likely extend from complexocean–atmosphere teleconnections associated with the Pacific decadal oscillation(20–30-yr modes of variation; see Mantua and Hare 2002) and Atlantic multidec-adal oscillation (60–80-yr modes of variation; Enfield et al. 2001; Gray et al.2003a; McCabe et al. 2004).
Such ocean–atmosphere linkages provide a means for entraining natural pro-cesses over regional to subcontinental scales. Swetnam and Betancourt (Swetnamand Betancourt 1998), for example, documented how droughts can synchronizewestern spruce budworm outbreaks and natality/mortality events in woodlands andconifer forests throughout the West. Decadal-scale shifts in moisture regimes havealso been shown to drive the productivity of high-elevation forests of the PacificNorthwest (Peterson and Peterson 2001) as well as rapid and persistent landscapechange (Allen and Breshears 1998). In addition to its effects on mortality andrecruitment, landscape composition and structure might also be affected by plantmigration dynamics related to persistent moisture anomalies. Lyford et al. (Lyfordet al. 2003) showed that, over the late Holocene, climate variability at multidecadaland longer time scales strongly influenced the probability of successful coloniza-tion by new plant species. In this case, low-frequency climate variability regulatesthe distribution and density of suitable habitats at regional scales. Decadal to
Earth Interactions • Volume 10 (2006) • Paper No. 4 • Page 20
multidecadal climate variability may also impact the strength of seed sources anddispersal of propagules.
A growing number of studies document the importance of decadal to multidec-adal drought variability in controlling the frequency and severity of fires over theentire West. Over the past 20 yr, widespread fires in the western United Statesshow a strong response to drought regimes, regardless of twentieth-century man-agement practices (Westerling et al. 2003). The PDO, in particular, has beenshown to modulate the severity of fire seasons in western North America overlonger (>10 yr) time scales (Norman and Taylor 2003; Hessl et al. 2004).
Large-scale impacts of decadal to multidecadal moisture regimes are also ob-served in many physical systems. In the western United States and Canada,changes in snow depth and SWE show strong modes of decadal to multidecadalvariability (Brown and Braaten 1998; Cayan et al. 1998; Dettinger et al. 1998;Selkowitz et al. 2002). Coupled with summer drought and increasing temperatures,these regimelike shifts in wintertime precipitation affect glacial dynamics andrunoff from high mountain areas (McCabe and Fountain 1995; Pelto 1996; Watsonand Luckman 2004b; Pederson et al. 2004; Watson et al. 2005). Persistent changesin precipitation, and in some regions runoff from glaciers, then reinforce strongdecadal to multidecadal variations in the availability of water resources in westernNorth America (McCabe and Dettinger 2002; Jain et al. 2002; Hidalgo 2004).
5.2. Decadal-scale variability in ecosystem services
Among the services provided by ecosystems of Glacier NP, spring–summer sea-sonal water availability, governed by snowpack accumulation, is the most easilyquantified. Selkowitz et al. (Selkowitz et al. 2002) have demonstrated that GlacierNP snowpack is significantly correlated with indices of ocean–atmosphere inter-actions, specifically the PDO. Taken together with the summer drought recon-struction presented here, it is clear that the drivers of Glacier NP regional watersupplies are characterized by persistent episodes above and below the long-termmean.
Research from throughout the West echoes this point. Under the Colorado RiverCompact of 1922, flows were divided among the upper-basin states (Wyoming,Colorado, Utah, and New Mexico) and lower-basin states (Nevada, Arizona, andCalifornia) based on observations made from 1905 to 1922. When tree-ring-basedclimate reconstructions were used to examine these flows in a longer-term context,this early-twentieth-century reference period was seen to be part of an anoma-lously wet regime (Meko and Graybill 1995; Hidalgo et al. 2000; Piechota et al.2004). Thus, water that will rarely, if ever, return to the river was promised to thelower-basin states. Such case studies consistently demonstrate that the instrumen-tal climate record and, in turn, observations of ecosystem services made during theinstrumental period, fail to capture the full range of variability we should expectand plan for (Cook and Evans 2000; Gray et al. 2004). Moreover, these examplesshow how expectations for the delivery of a vital resource that were developedduring one type of climate regime may not be viable under subsequent regimes.
While the scientific evidence for decadal to multidecadal variability in watersupplies continues to accumulate, demands on water resources in the westernUnited States have risen with increasing human populations (Gray et al. 2004;
Earth Interactions • Volume 10 (2006) • Paper No. 4 • Page 21
Hidalgo 2004). These findings, coupled with the current severe, multiyear droughtin the western United States are invigorating a dialogue between researchers andwater managers that may result in new concepts and tools for Western watermanagement. To date, most of this attention has focused on the semiarid South-west (e.g., Lord et al. 1995). We anticipate that as the demand for water increasesin the northern Rocky Mountains, water managers will look to the Colorado andother southwestern basins for lessons learned.
Beyond their role as a regional water tower, the ecosystems of Glacier NP playa regulatory role that is less tangible. First, the diverse habitat and large areacontained within Glacier NP not only conserves a high level of biodiversity, butallows the region to function as source of biodiversity. Also, like all of the mon-tane regions in the western United States, the forests of Glacier NP play a key rolein the global carbon cycle (Schimel et al. 2002). The most important role ofclimate variability at decadal and longer time scales in the regulatory function ofmountain ecosystems is likely to be its influence on the release of carbon throughfire. In compiling the fire history results and comparing these results with long-term climate variability (Figures 6a–c), we see intriguing evidence for long-termdrought as a factor governing large, stand-replacing fires in the montane forests ofGlacier NP. Multimillennial records of fire and climate from Yellowstone NP areasimilarly suggest a relationship between persistent drought and substantial changesin the frequency of stand-replacing fires (Pierce et al. 2004). An intriguing andimportant result from Pierce et al. (Pierce et al. 2004) is the role of superposedcentennial- to millennial-length climate variability in regulating the large standreplacing fires associated with severe multidecadal droughts of the “MedievalWarm Period” (MWP; A.D. 900–1300), and the frequent but low-severity firesassociated with generally cooler conditions of the LIA. This is of great concerntoday because Cook et al. (Cook et al. 2004) find that since our emergence fromthe LIA, the twentieth-century anthropogenic warming has been trending towardconditions similar to the extraordinary droughts of the MWP. These results, takentogether with the findings of Swetnam and Betancourt (Swetnam and Betancourt1998) on the capacity for climate to synchronize fire at regional to subcontinentalscales, imply that the regulatory role of montane forests as carbon sinks will varyover decadal and longer time scales as future climate change continues to alterlarge-scale fire regimes.
Such regimelike behavior may confound efforts to disentangle the effects ofmanagement activities and climate impacts on the provisioning of key ecosystemservices. Beginning in 1977, salmon harvests in the Pacific Northwest underwenta dramatic decline that lasted for nearly two decades (Mantua et al. 1997). Di-minished salmon populations were widely seen as a sign of overfishing, andnumerous reforms were enacted to counteract the “improper exploitation” of avaluable ecosystem service. Careful examination of long-term records of PacificNorthwest salmon and other fisheries, however, revealed that changes in thisecosystem service were related to a major reorganization of Pacific Basin climate(Mantua et al. 1997; Chavez et al. 2003). Likewise, shifts in Glacier NP climatemay have led to alternating twentieth-century fire regimes that are often associatedwith management activities.
Finally, the cultural services provided by ecosystems are inherently difficult toquantify in an economic valuation, in part, because they are not consumed (i.e.,
Earth Interactions • Volume 10 (2006) • Paper No. 4 • Page 22
nonuse values; see Randall 1991). The loss of glaciers in Glacier NP has anobvious cultural resonance value that has not been lost on politicians and punditswho refer to a scenario by which Glacier NP is the “Park formerly known asGlacier” (Henneberger 2004). At the same time, a diminished snowpack reducessome Glacier NP operational expenses and potentially provides a boon for localtourism. The sole road across the crest of the Rockies in Glacier NP (the “Going-to-the-Sun Road”) is closed in the winter due to snow, and there is a substantialcost to plow and open the road each spring. The road is the economic lifeline forgateway and regional communities, generating approximately one million dollarsper day in revenue when open. Thus, a longer snow-free season may not onlyprovide local economic benefits, but also reduce costs associated with home heat-ing and decrease the number of days of treacherous road travel. However, thedegree to which this trade-off is underpinned by decade and longer shifts inclimate has not been clearly articulated. Also, what seems on the surface to carrypotential benefits for local communities (i.e., shorter winters and lower snowpack)may be offset by increasingly longer and dryer summers and the resulting fireseasons that are predicted to increase in length by up to two weeks over thetwenty-first century (Brown et al. 2004). In any case, economic strategies thatdepend heavily on climate-related services are especially vulnerable to naturalclimate variability and future climate change.
6. ConclusionsAs demonstrated in these analyses for Glacier NP and surrounding regions, theprovision of a wide range of ecosystem services is strongly influenced by climatevariability over decadal and longer time scales. This relationship between provi-sioning of ecosystem services and the attendant regimelike behavior of climatepose challenges to management and sustainability in three key ways. First, long-duration proxy reconstructions call into question the conventional strategy ofdefining reference conditions or management targets based solely on short dura-tion (<100 yr) observational records. For example, the use of 30-yr climatology forallocation of natural resources, and development of resource management goals, isclearly flawed as it is probable that any 30-yr climatic mean might only capture asingle mode of climate variability (i.e., an extended regime of wet or dry condi-tions). Second, steplike changes from one climate regime to the next can haveprolonged impacts on ecosystem services. These persistent and frequent shifts inthe availability of natural resources and services may be misinterpreted as resultingfrom management activities. Likewise such climate-related shifts may amplify ordampen the effects of management activities. Last, decadal and longer persistenceof either deficits or abundances of climate-related services can lead to managementpolicies and economic strategies that, while appropriate during the current regime,may not be robust under subsequent climates. Overall, greater awareness ofregimelike behavior must shape our expectations for ecosystem services and, in theface of global change, the institutions that manage these resources.
Acknowledgments. We thank Andy Bunn, Chris Caruso, Brian Peters, Karen Holzer,Todd Kipfer, Jeremy Littell, Blase Reardon, Anne Schrag, and Lindsey Waggoner forsuggestions and technical assistance in the field and lab. The comments from an anony-
Earth Interactions • Volume 10 (2006) • Paper No. 4 • Page 23
mous reviewer helped improve the quality of the manuscript. We thank Brian Luckman,Emma Watson, and contributers to NOAA’s World Data Center for Paleoclimatology forproviding their precipitation reconstructions. We also thank Steve Barrett for sharing anddiscussing his fire history data, and Richard Menicke for technical assistance and distri-bution of the GIS database. We are grateful for all the support Glacier National Park andthe National Park Service provided in allowing us to conduct this research, and alsocommunicating the results to the public and park service staff. This work was funded bythe U.S. Geological Survey–Northern Rocky Mountain Science Center and the NationalScience Foundation (NSF Grant 0082376).
ReferencesAllen, C. D., and D. D. Breshears, 1998: Drought-induced shift of a forest–woodland ecotone:
Rapid landscape response to climate variation. Proc. Natl. Acad. Sci., 95, 14 839–14 842.Baron, J. Ed., 2002: Rocky Mountain Futures: An Ecological Perspective. Island Press, 325 pp.Barrett, S. W., 1982: Fire history of Glacier National Park: North Fork Flathead River drainage:
Final report. National Park Service, Glacier National Park, West Glacier, MT, 95 pp.——, 1986: Fire history of Glacier National Park: Middle Fork Flathead River drainage: Final
report. National Park Service, Glacier National Park, West Glacier, MT, 32 pp.——, 1988: Fire history of Glacier National Park: McDonald Creek Basin: Final report. National
Park Service, Glacier National Park, West Glacier, MT, 32 pp.——, 1993: Fire history of southeastern Glacier National Park: Missouri River drainage: Final
report. National Park Service, Glacier National Park, West Glacier, MT, 43 pp.Biondi, F., 1997: Evolutionary and moving response functions in dendroclimatology. Dendrochro-
nologia, 15, 139–150.——, and K. Waikul, 2004: DENDROCLIM2002: A C++ program for statistical calibration of
climate signals in tree-ring chronologies. Comput. Geosci., 30, 303–311.——, T. J. Kozubowski, and A. K. Panorska, 2002: Stochastic modeling of regime shifts. Climate
Res., 23, 23–30.Box, G. E. P., and G. M. Jenkins, 1970: Time Series Analysis: Forecasting and Control. Holden-
Day, 575 pp.——, and G. C. Tiao, 1975: Intervention analysis with applications to economic and environmental
problems. J. Amer. Stat. Assoc., 70, 70–79.Briffa, K. R., and P. D. Jones, 1990: Basic chronology statistics and assessment. Methods of
Dendrochronology: Applications in the Environmental Sciences, E. R. Cook and L. A.Kairiukstis, Eds., Kluwer, 137–152.
——, and J. A. Matthews, 2002: ADVANCE-10K: A European contribution towards a hemisphericdendroclimatology for the Holocene. Holocene, 12, 639–642.
Brown, R. D., and R. O. Braaten, 1998: Spatial and temporal variability of Canadian monthly snowdepths. Atmos.–Ocean, 36, 37–54.
Brown, T. J., B. L. Hall, and A. L. Westerling, 2004: The impact of twenty-first century climatechange on wildland fire danger in the western United States: An applications perspective.Climatic Change, 62, 365–388.
Carrara, P. E., and R. G. McGimsey, 1981: The late-neoglacial histories of the Agassiz and JacksonGlaciers, Glacier National Park, Montana. Arct. Alp. Res., 13, 183–196.
Cayan, D. R., M. D. Dettinger, H. F. Diaz, and N. E. Gram, 1998: Decadal variability of precipi-tation over western North America. J. Climate, 11, 3148–3166.
Chavez, F. P., J. Ryan, S. E. Lluch-Cota, and M. Niquen C., 2003: From anchovies to sardines andback: Multidecadal change in the Pacific Ocean. Science, 299, 217–221.
Earth Interactions • Volume 10 (2006) • Paper No. 4 • Page 24
Cook, E. R., and L. Kairiukstis, Eds., 1990: Methods of Dendrochronology: Applications in theEnvironmental Sciences. Kluwer, 394 pp.
——, and M. Evans, 2000: Improving estimates of drought variability and extremes from centuries-long tree-ring chronologies: APAGES/CLIVAR example. CLIVAR Exchanges, Vol. 5, No.1/PAGES Newsletter, Vol. 8, No. 1, International CLIVAR Project Office, Southampton,United Kingdom, 10–12.
——, S. Shiyatov, and V. Mazepa, 1990: Estimation of the mean chronology. Methods of Den-drochronology: Applications in the Environmental Sciences, E. R. Cook and L. A. Kairiuk-stis, Eds., Kluwer, 123–132.
——, K. R. Briffa, D. M. Meko, D. A. Graybill, and G. Funkhouser, 1995: The “segment lengthcurse” in long tree-ring chronology development for paleoclimatic studies. Holocene, 5,229–237.
——, D. M. Meko, D. W. Stahle, and M. K. Cleaveland, 1999: Drought reconstructions for thecontinental United States. J. Climate, 12, 1145–1162.
——, C. Woodhouse, C. M. Eakin, D. M. Meko, and D. W. Stahle, 2004: Long-term ariditychanges in the western United States. Science, 306, 1015–1018.
Cunningham, C., 1982: Montana weather. Montana Magazine.Daily, G. C., Ed., 1997: Nature’s Services: Society Dependence on Natural Ecosystems. Island
Press, 416 pp.D’Arrigo, R. D., R. Villalba, and G. Wiles, 2001: Tree-ring estimates of Pacific decadal climate
variability. Climate Dyn., 18, 219–224.De Groot, R. S., M. A. Wilson, and R. M. J. Boumans, 2002: A typology for the classification,
description and valuation of ecosystem functions, goods and services. Ecol. Econ., 41,393–408.
Dettinger, M. D., H. F. Diaz, and D. M. Meko, 1998: North–south precipitation patterns in westernNorth America on interannual-to-decadal timescales. J. Climate, 11, 3095–3111.
Draper, N. R., and H. Smith, 1998: Applied Regression Analysis. 3d ed. Wiley, 706 pp.Easterling, D. R., T. R. Karl, E. H. Mason, P. Y. Hughes, D. P. Bowman, R. C. Daniels, and T. A.
Boden, Eds., 1996: United States Historical Climatology Network (U.S. HCN) monthlytemperature and precipitation data. Carbon Dioxide Information Analysis Center, Oak RidgeNational Laboratory, Oak Ridge, TN.
Enfield, D. B., A. M. Mestas-Nunez, and P. J. Trimble, 2001: The Atlantic multidecadal oscillationand its relation to rainfall and river flows in the continental U.S. Geophys. Res. Lett., 28,2077–2080.
Finklin, A. I., 1986: A climatic handbook for Glacier National Park—With data for Waterton LakesNational Park. Tech. Rep. INT-204, USDA Forest Service, Intermountain Research StationGeneral, 124 pp.
Fritts, H. C., 1976: Tree Rings and Climate. Academic Press, 567 pp.Fye, F. K., D. W. Stahle, and E. R. Cook, 2003: Paleoclimatic analogs to twentieth-century
moisture regimes across the United States. Bull. Amer. Meteor. Soc., 84, 901–909.Gedalof, Z., and D. J. Smith, 2001: Interdecadal climate variability and regime-scale shifts in
Pacific North America. Geophys. Res. Lett., 28, 1515–1518.Graumlich, L. J., 1993: A 1000-year record of temperature and precipitation in the Sierra-Nevada.
Quat. Res., 39, 249–255.Gray, S. T., L. J. Graumlick, and J. L. Betancourt, 2006: Annual precipitation in the Yellowstone
National Park region since A.D. 1173. Quat. Res., in press.——, J. L. Betancourt, C. L. Fastie, and S. T. Jackson, 2003a: Patterns and sources of multidecadal
oscillations in drought-sensitive tree-ring records from the central and southern Rocky Moun-tains. Geophys. Res. Lett., 30, 1316, doi:10.1029/2002GL016154.
——, S. T. Jackson, and J. L. Betancourt, 2003b: Northeastern Utah Palmer Drought SeverityIndex reconstruction. IGBP PAGES/World Data Center for Paleoclimatology Data Contri-bution Series 2003-043, NOAA/NGDC Paleoclimatology Program, Boulder, CO.
Earth Interactions • Volume 10 (2006) • Paper No. 4 • Page 25
——, ——, and ——, 2004: Tree-ring based reconstructions of interannual to decadal-scaleprecipitation variability for northeastern Utah. J. Amer. Water Res. Assoc., 40, 947–960.
Grissino-Mayer, H. D., 1996a: El Malpais precipitation reconstruction. International Tree-RingData Bank, IGBP PAGES/World Data Center, Paleoclimatology Data Contribution Series96-002, NOAA/NGDC Paleoclimatology Program, Boulder, CO. [Available online at ftp://ftp.ncdc.noaa.gov/pub/data/paleo/treering/reconstructions/newmexico/malpais_recon.txt.]
——, 1996b: A 2129 year annual reconstruction of precipitation for northwestern New Mexico,USA. Tree Rings, Environment, and Humanity, J. S. Dean, D. M. Meko, and T. W. Swetnam,Eds., Radiocarbon, Department of Geosciences, University of Arizona, 191–204.
——, R. L. Holmes, and H. C. Fritts, 1997: The International Tree-Ring Data Bank ProgramLibrary. Version 2.1, users manual, Tucson, AZ, 106 pp.
Hall, M. P., and D. B. Fagre, 2003: Modeled climate-induced glacier change in Glacier NationalPark, 1850–2100. Bioscience, 53, 131–140.
Henneberger, M., cited 2004: In the balance: Gore has finally found his campaign voice and he’susing it to batter Bush over the environment. [Available online at http://www.msnbc.msn.com/id/6234461/site/newsweek/.]
Hessl, A. E., D. McKenzie, and R. Schellhass, 2004: Drought and Pacific decadal oscillation linkedto fire occurrence in the inland Pacific Northwest. Ecol. Appl., 14, 425–442.
Hidalgo, H. G., 2004: Climate precursors of multidecadal drought variability in the western UnitedStates. Water Resour. Res., 40, W12504, doi:10.1029/2004WR003350.
——, T. C. Piechota, and J. A. Dracup, 2000: Alternative principal components regression pro-cedures for dendrohydrologic reconstructions. Water Resour. Res., 36, 3241–3249.
Jain, S., C. A. Woodhouse, and M. P. Hoerling, 2002: Multidecadal streamflow regimes in theinterior western United States: Implications for the vulnerability of water resources. Geophys.Res. Lett., 29, 2036, doi:10.1029/2001GL014278.
Key, C. H., 1984: Development of a fire information map and database for Glacier National Park:Final report. National Park Service, Glacier National Park, West Glacier, MT, 55 pp.
——, D. B. Fagre, and R. K. Menicke, 2002: Glacier retreat in Glacier National Park, Montana.Satellite Image Atlas of Glaciers of the World, Glaciers of North America—Glaciers of theWestern United States, R. S. Williams Jr. and J. G. Ferrigno, Eds., United States GovernmentPrinting Office, J365–J381.
Körner, C., and E. Spehn, Eds., 2002: Mountain Biodiversity: A Global Assessment. Parthenon, 350pp.
Lord, W. B., J. F. Booker, D. H. Getches, B. L. Harding, D. S. Kenney, and R. A. Young, 1995:Managing the Colorado River in a severe sustained drought: An evaluation of institutionaloptions. Water Resour. Bull., 31, 939–944.
Lyford, M. E., S. T. Jackson, J. L. Betancourt, and S. T. Gray, 2003: Influence of landscapestructure and climate variability in a late Holocene natural invasion. Ecol. Monogr., 73,567–583.
Mann, M. E., and J. M. Lees, 1996: Robust estimation of background noise and signal detectionin climatic time series. Climatic Change, 33, 409–445.
Mantua, N. J., and S. R. Hare, 2002: The Pacific decadal oscillation. J. Oceanogr., 58, 35–44.——, ——, Y. Zhang, J. M. Wallace, and R. C. Francis, 1997: A Pacific decadal climate oscillation
with impacts on salmon. Bull. Amer. Meteor. Soc., 78, 1069–1079.Meko, D. M., and D. A. Graybill, 1995: Tree-ring reconstruction of Upper Gila River discharge.
Water Resour. Bull., 31, 605–616.Messerli, B., and J. D. Ives, 1997: Mountains of the World: A Global Priority. Parthenon, 510 pp.McCabe, G. J., and A. G. Fountain, 1995: Relations between atmospheric circulation and mass-
balance at South Cascade Glacier, Washington, USA. Arct. Alp. Res., 27, 226–233.——, and M. D. Dettinger, 2002: Primary modes and predictability of year-to-year snowpack
variations in the western United States from teleconnections with Pacific Ocean climate. J.Hydrometeor., 3, 13–25.
Earth Interactions • Volume 10 (2006) • Paper No. 4 • Page 26
——, M. A. Palecki, and J. L. Betancourt, 2004: Pacific and Atlantic Ocean influences on mul-tidecadal drought frequency in the United States. Proc. Natl. Acad. Sci., 101, 4136–4141.
Millennium Ecosystem Assessment (MEA), 2003: Ecosystems and Human Well-Being: A Frame-work for Assessment. Island Press, 245 pp.
Newhall, F., and C. R. Berdanier, 1996: Calculation of soil moisture regimes from the climaticrecord. Soil Survey Investigations Rep. 46, USDA Natural Resources Conservation Service,Washington, DC, 13 pp.
Norman, S. P., and A. H. Taylor, 2003: Tropical and North Pacific teleconnections influence fireregimes in pine-dominated forests of north-eastern California, USA. J. Biogeogr., 30, 1081–1092.
Palmer, W. C., 1965: Meteorological drought. Weather Bureau Research Paper 45, U.S. Depart-ment of Commerce, Washington, DC, 58 pp.
Pederson, G. T., 2004: Long-term perspectives on northern Rockies climatic variability from treerings in Glacier National Park, Montana. M.S. thesis, Dept. of Land Resources and Envi-ronmental Science, Montana State University, Bozeman, MT, 95 pp.
——, D. B. Fagre, S. T. Gray, and L. J. Graumlich, 2004: Decadal-scale climate drivers for glacialdynamics in Glacier National Park, Montana, USA. Geophys. Res. Lett., 31, L12203,doi:10.1029/2004GL019770.
Pelto, M. S., 1996: Annual net balance of North Cascade glaciers. J. Glaciol., 42, 3–9.Peterson, D. W., and D. L. Peterson, 2001: Mountain hemlock growth responds to climatic vari-
ability at annual and decadal time scales. Ecology, 82, 3330–3345.Piechota, T., J. Timilsena, G. Tootle, and H. Hidalgo, 2004: The western U.S. drought: How bad
is it? Eos, Trans. Amer. Geophys. Union, 85, 301–308.Pierce, J. L., G. A. Meyer, and A. J. Timothy Jull, 2004: Fire-induced erosion and millennial-scale
climate change in northern ponderosa pine forests. Nature, 432, 87–90.Post, E., and N. C. Stenseth, 1998: Large-scale climatic fluctuation and population dynamics of
moose and white-tailed deer. J. Anim. Ecol., 67, 537–543.Randall, A., 1991: The value of biodiversity. Ambio, 20 (2), 64–68.Schimel, D., T. Kittel, S. Running, R. Monson, A. Turnipseed, and D. Anderson, 2002: Carbon
sequestration studied in western U.S. mountains. Eos, Trans. Amer. Geophys. Union, 83,445–449.
Selkowitz, D. J., D. B. Fagre, and B. A. Reardon, 2002: Interannual variations in snowpack in thecrown of the continent ecosystem. Hydrol. Processes, 16, 3651–3665.
Stahle, D. W., E. R. Cook, M. K. Cleaveland, M. D. Therrell, D. M. Meko, H. D. Grissino-Mayer,E. Watson, and B. H. Luckman, 2000: Epic 16th century drought over North America. Eos,Trans. Amer. Geophys. Union, 81, 121–125.
Stenseth, N. C., A. Mysterud, G. Ottersen, J. W. Hurrell, K. S. Chan, and M. Lima, 2002:Ecological effects of large-scale climate fluctuations. Science, 297, 1292–1296.
Stine, S., 1994: Extreme and persistent drought in California and Patagonia during mediaevaltimes. Nature, 369, 546–549.
Stokes, M. A., and T. L. Smiley, 1968: An Introduction to Tree-Ring Dating. University of ChicagoPress, 73 pp.
Swetnam, T. W., and J. L. Betancourt, 1998: Mesoscale disturbance and ecological response todecadal climatic variability in the American Southwest. J. Climate, 11, 3128–3147.
Thornthwaite, C. W., 1948: An approach towards a rational classification of climate. Geogr. Rev.,38, 55–102.
Villalba, R., R. D. D’Arrigo, E. R. Cook, G. C. Jacoby, and G. Wiles, 2001: Decadal-scale climaticvariability along the extratropical western coast of the Americas: Evidence from tree-ringrecords. Interhemispheric Climate Linkages, V. Markgraf, Ed., Academic Press, 155–172.
Watson, E., and B. H. Luckman, 2004a: Tree-ring based reconstructions of precipitation for thesouthern Canadian Cordillera. Climatic Change, 65, 209–241.
Earth Interactions • Volume 10 (2006) • Paper No. 4 • Page 27
——, and ——, 2004b: Tree-ring-based mass-balance estimates for the past 300 years at PeytoGlacier, Alberta, Canada. Quat. Res., 62, 9–18.
——, G. T. Pederson, B. H. Luckman, and D. B. Fagre, 2005: Glacier mass balance in the northernU.S. and Canadian Rockies: Paleo-perspectives and 20th century change. Darkening Peaks,B. H. Luckman, B. Orlove, and E. Wiegandt, Eds., University of California Press.
Westerling, A. L., A. Gershunov, T. J. Brown, D. R. Cayan, and M. D. Dettinger, 2003: Climateand wildfire in the western United States. Bull. Amer. Meteor. Soc., 84, 595–604.
Wigley, T. M. L., K. R. Briffa, and P. D. Jones, 1984: On the average of correlated time series, withapplications in dendroclimatology and hydrometeorology. J. Climate Appl. Meteor., 23,201–213.
Wilton, J., cited 2004: 2003 Montana nonresident economic impacts and expenditures. [Availableonline at http://www.itrr.umt.edu/economicest.htm.]
Woodhouse, C. A., and J. T. Overpeck, 1998: 2000 years of drought variability in the centralUnited States. Bull. Amer. Meteor. Soc., 79, 2693–2697.
Earth Interactions is published jointly by the American Meteorological Society, the American GeophysicalUnion, and the Association of American Geographers. Permission to use figures, tables, and brief excerptsfrom this journal in scientific and educational works is hereby granted provided that the source is acknowl-edged. Any use of material in this journal that is determined to be “fair use” under Section 107 or thatsatisfies the conditions specified in Section 108 of the U.S. Copyright Law (17 USC, as revised by P.IL.94-553) does not require the publishers’ permission. For permission for any other form of copying, contactone of the copublishing societies.
Earth Interactions • Volume 10 (2006) • Paper No. 4 • Page 28