loglinear models for contingency · pdf fileloglinear models for contingency tables ......
TRANSCRIPT
Karin Beijering
www.rug.nl/staff/k.beijering
Loglinear Models for Contingency Tables
Seminar in Methodology and Statistics
RUG1
Slide 1
RUG1 To set the date:* >Insert >Date and Time* At Fixed: fill the date in format mm-dd-yy* >Apply to AllRUG; 30-8-2007

05-06-2009 | 2
Outline
› Introduction
› Data
› Running Loglinear Analysis
› Output / Results
› Concluding remarks
05-06-2009 | 3
Introduction
› Study the relationship between categorical variables- Chi-Square- Loglinear Models
› Loglinear Analysis is an extension of Chi-Square
› Modeling of cell counts in contingency tables
› Robust analysis of complicated contingency tables involving several variables
› Describe associations and interaction patterns among a set of categorical variables
05-06-2009 | 4
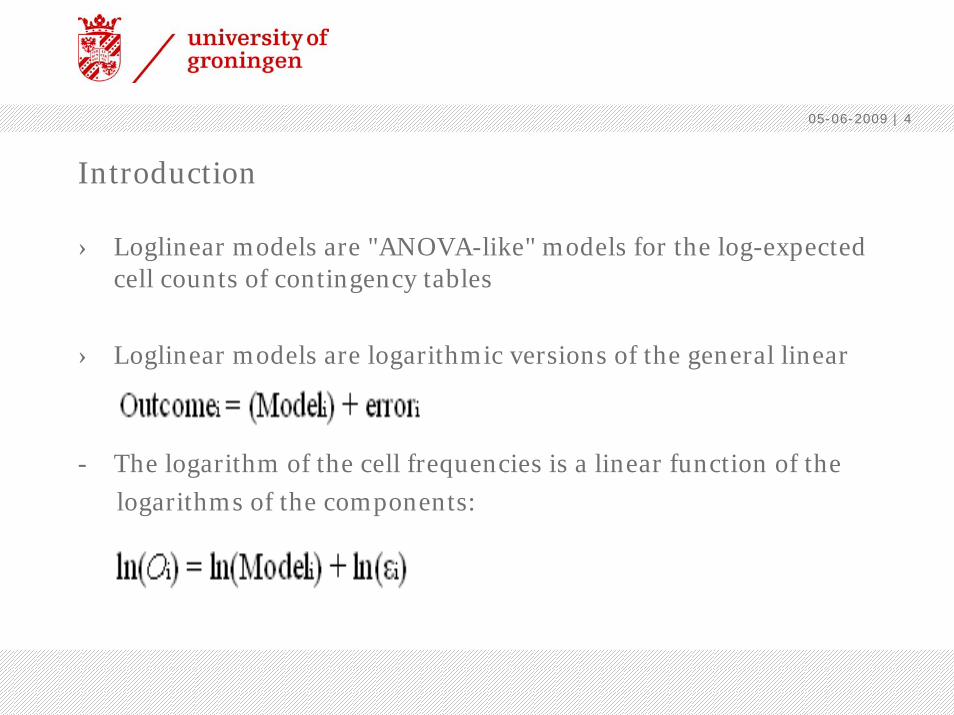
Introduction
› Loglinear models are "ANOVA-like" models for the log-expected cell counts of contingency tables
› Loglinear models are logarithmic versions of the general linear model:
- The logarithm of the cell frequencies is a linear function of the
logarithms of the components:
05-06-2009 | 5
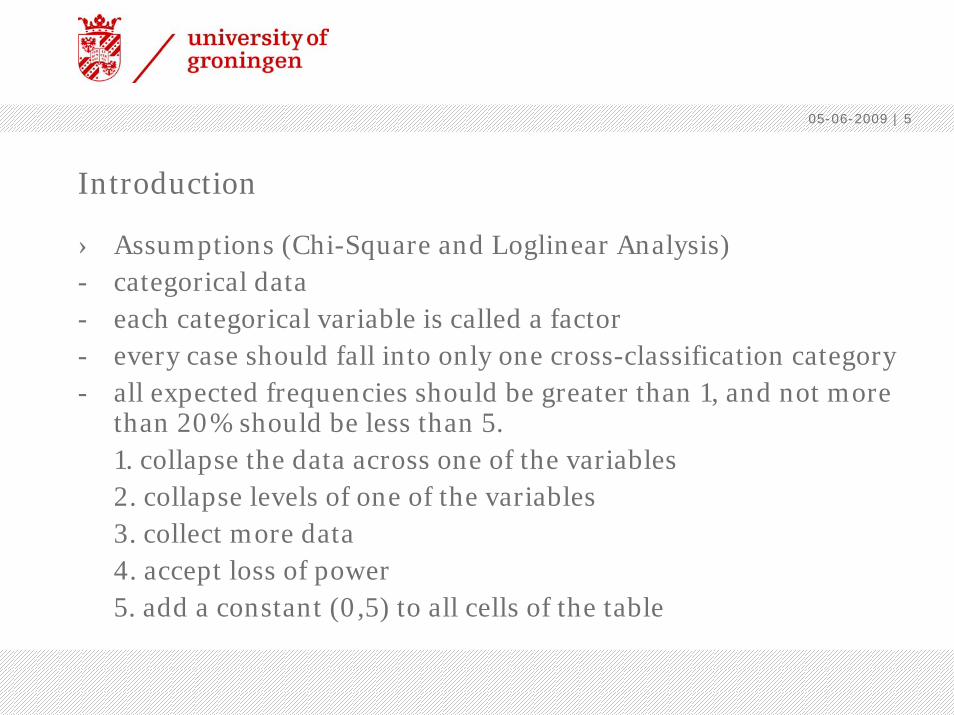
Introduction
› Assumptions (Chi-Square and Loglinear Analysis)- categorical data - each categorical variable is called a factor - every case should fall into only one cross-classification category - all expected frequencies should be greater than 1, and not more
than 20% should be less than 5.1. collapse the data across one of the variables2. collapse levels of one of the variables3. collect more data4. accept loss of power5. add a constant (0,5) to all cells of the table

05-06-2009 | 6
Data
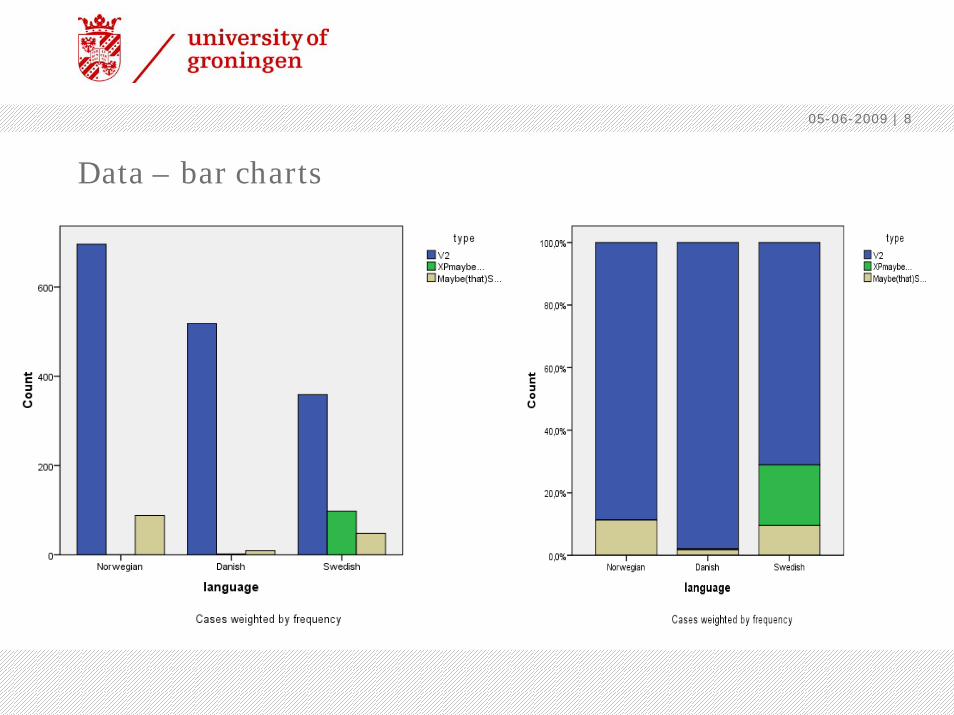
› Random samples of Danish, Norwegian and Swedish declarative main clauses containing the word ‘maybe’ (resp. måske, kanskje,kanske)
› Three possible structures:
- V2
-! XP MAYBE …
- MAYBE (that) S …
05-06-2009 | 7
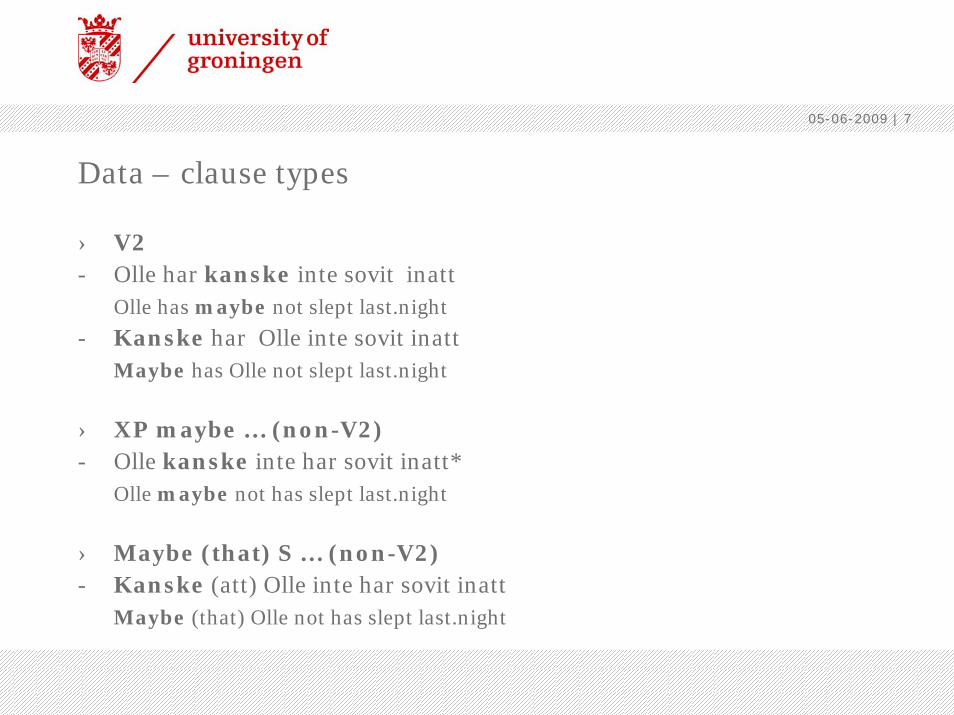
Data – clause types
› V2- Olle har kanske inte sovit inatt
Olle has maybe not slept last.night
- Kanske har Olle inte sovit inattMaybe has Olle not slept last.night
› XP maybe … (non-V2)- Olle kanske inte har sovit inatt*
Olle maybe not has slept last.night
› Maybe (that) S … (non-V2)- Kanske (att) Olle inte har sovit inatt
Maybe (that) Olle not has slept last.night
05-06-2009 | 8
Data – bar charts
05-06-2009 | 9
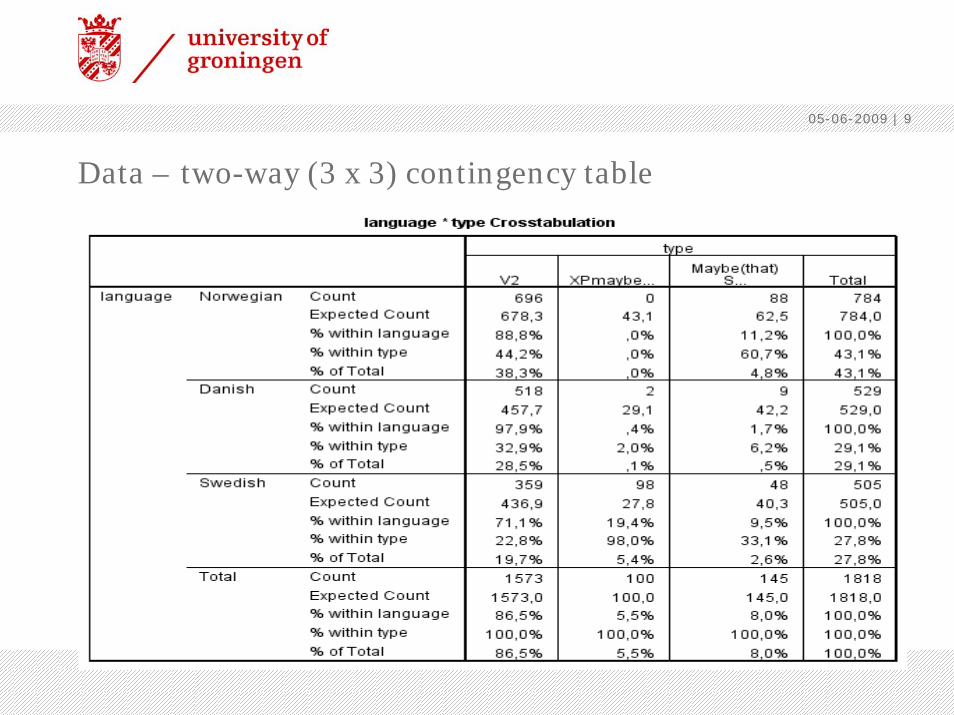
Data – two-way (3 x 3) contingency table
05-06-2009 | 10
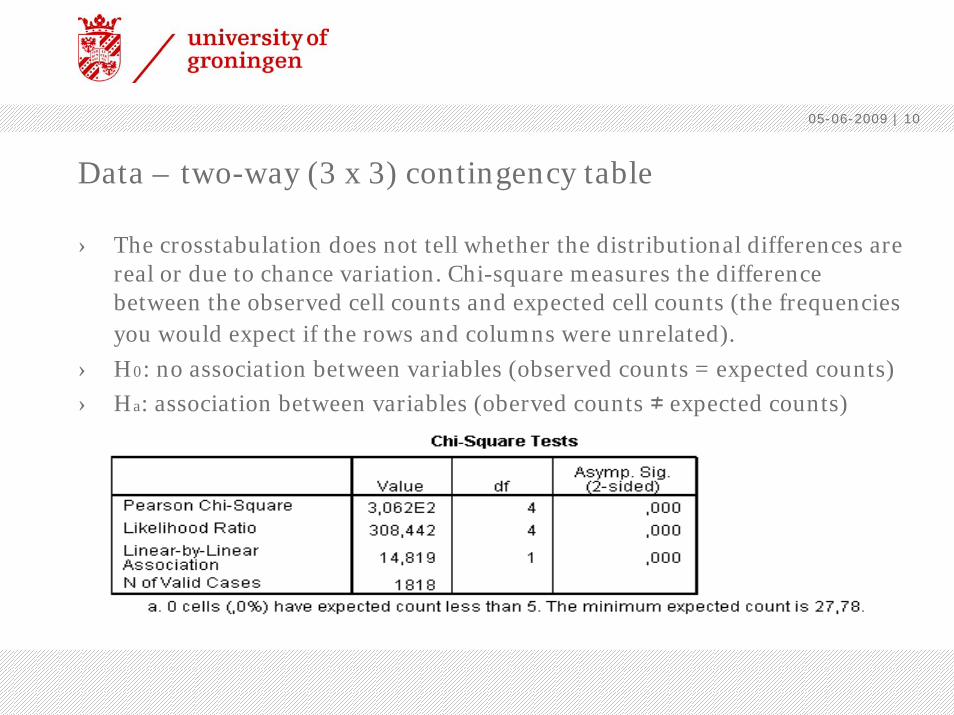
Data – two-way (3 x 3) contingency table
› The crosstabulation does not tell whether the distributional differences are real or due to chance variation. Chi-square measures the difference between the observed cell counts and expected cell counts (the frequencies you would expect if the rows and columns were unrelated).
› H0: no association between variables (observed counts = expected counts)
› Ha: association between variables (oberved counts ≠ expected counts)

05-06-2009 | 11
Data – two-way (3 x 3) contingency table
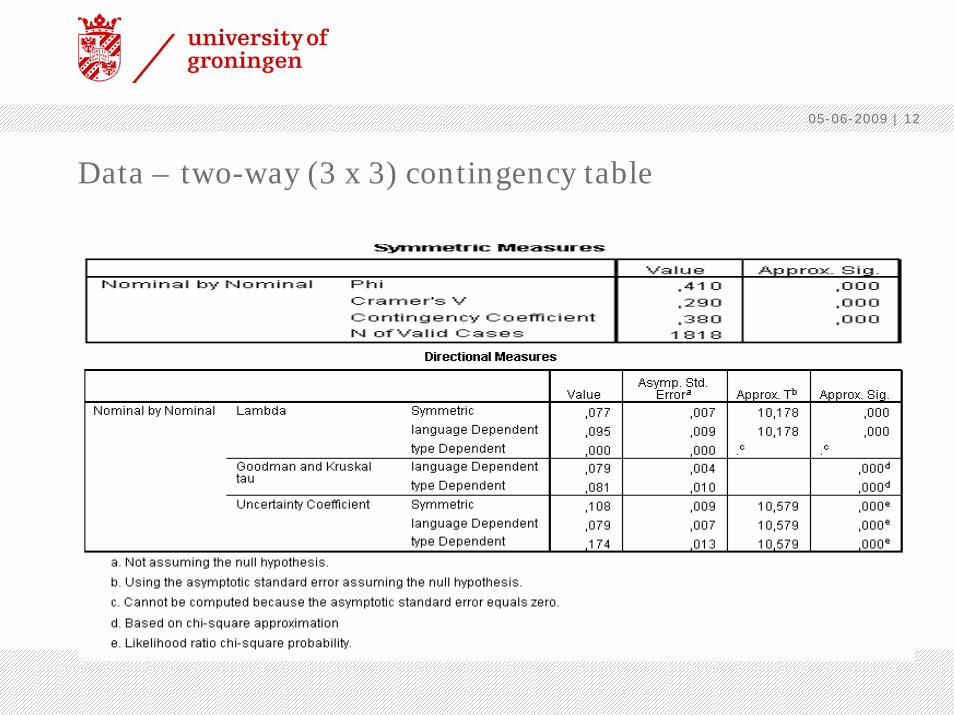
› Chi-Square is useful for determining relationships between categorical variables, however, it does not provide information about the strength and direction of the relationship.
- Symmetric measures quantify the strength of an association- Directional measures quantify the reduction in the error of
predicting the row variable value when the column variable value is known, or vice versa.
- The values of the measures of association are between 0 and 1.0= no relationship1= perfect relationship
- NB Odds Ratios are more suitable to measure effect size (2 x 2 tables).
05-06-2009 | 12
Data – two-way (3 x 3) contingency table
05-06-2009 | 13
Loglinear analysis
› Three procedures are available for using loglinear models to study relationships between categorical variables:
- Model Selection Loglinear Analysis
- General Loglinear Analysis
- Logit Loglinear Analysis
05-06-2009 | 14
Model Selection Loglinear Analysis
› Identify models for describing the relationship between categorical variables.
› Find out which categorical variables are associated
› Find the "Best" Model
› Fits hierarchical loglinear models to multi-dimensional crosstabulations using an iterative proportional-fitting algorithm.
05-06-2009 | 15
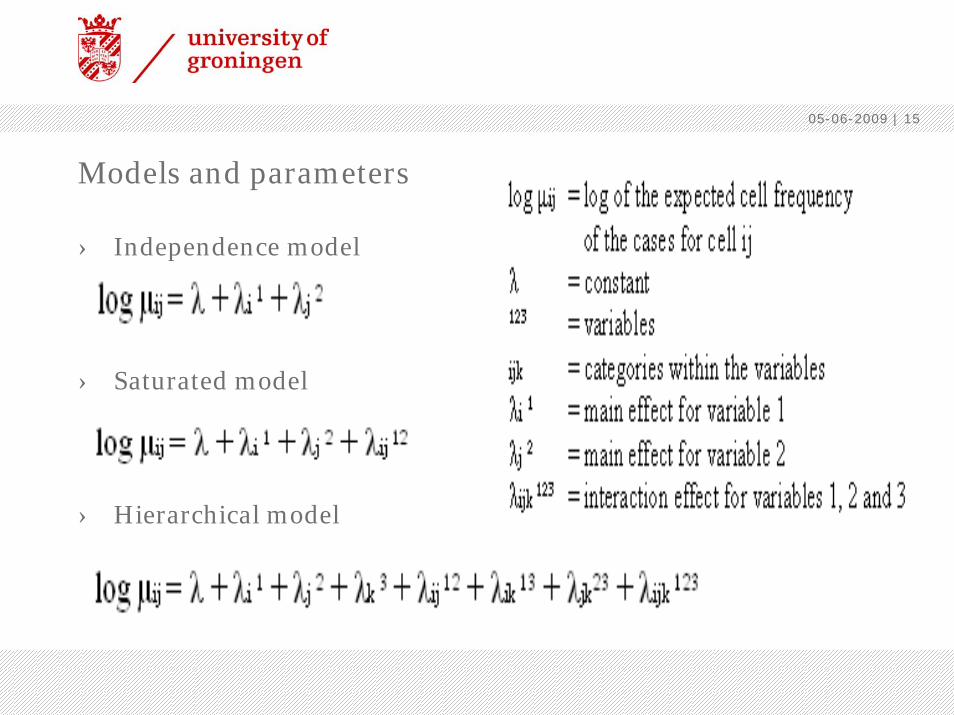
Models and parameters
› Independence model
› Saturated model
› Hierarchical model

05-06-2009 | 16
Similarities to regression and ANOVA
05-06-2009 | 17
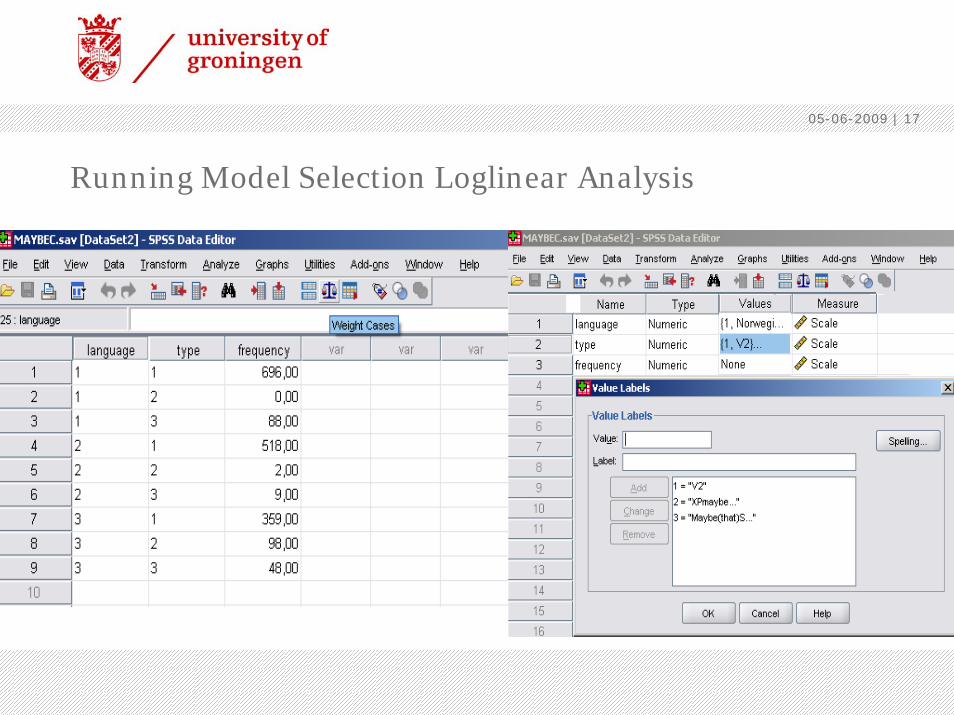
Running Model Selection Loglinear Analysis
05-06-2009 | 18
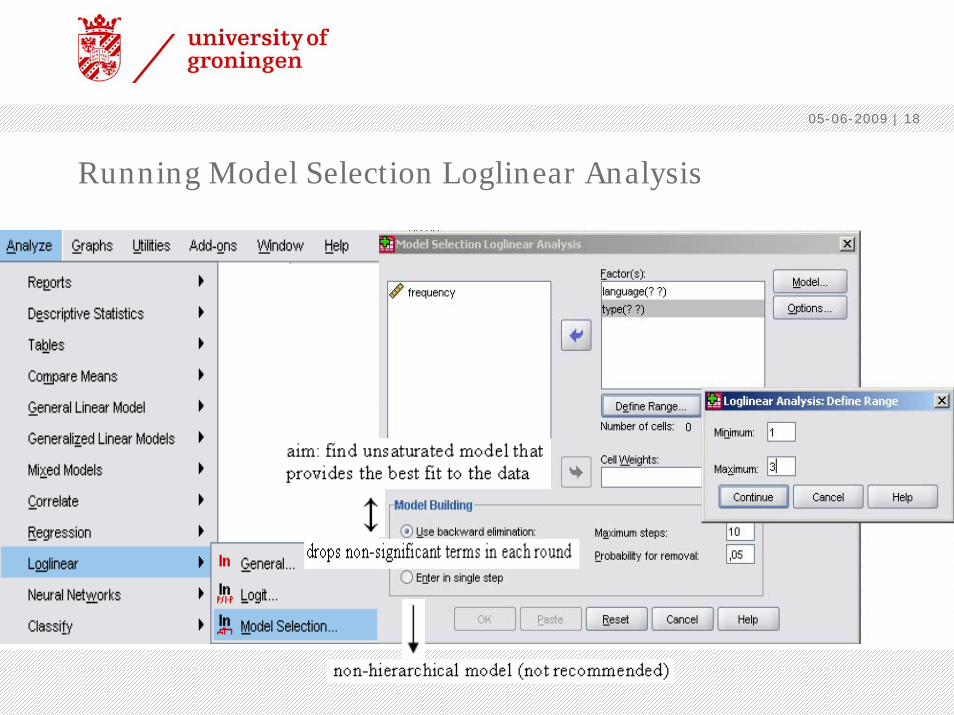
Running Model Selection Loglinear Analysis
05-06-2009 | 19
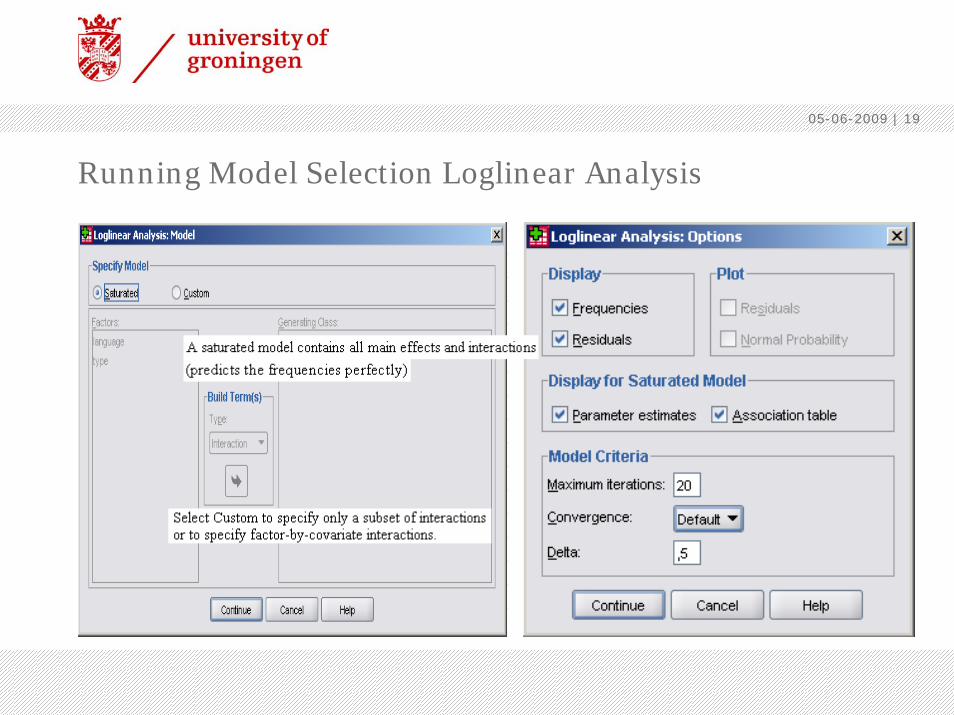
Running Model Selection Loglinear Analysis

05-06-2009 | 20
Output Model Selection Loglinear Analysis
› Cell Counts and Residuals (saturated model)
› Convergence Information
› K-Way and Higher-Order Effects
› Parameter Estimates
› Partial Associations
› Backward Elimination Statistics
› Goodness-of-Fit-Tests

05-06-2009 | 21
Convergence Information

05-06-2009 | 22
K-Way and Higher-Order Effects

05-06-2009 | 23
Parameter Estimates
- Add 0,5 to each cell in case of structural zero’s (empty cells in the crosstabulation)

05-06-2009 | 24
Partial Associations
05-06-2009 | 25
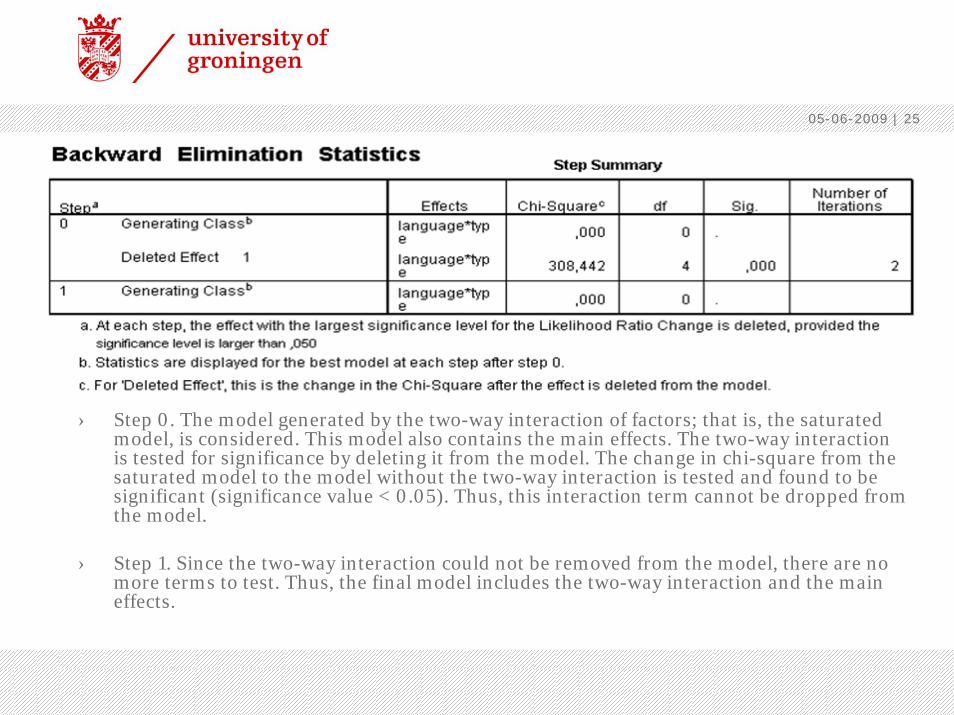
› Step 0. The model generated by the two-way interaction of factors; that is, the saturated model, is considered. This model also contains the main effects. The two-way interaction is tested for significance by deleting it from the model. The change in chi-square from the saturated model to the model without the two-way interaction is tested and found to be significant (significance value < 0.05). Thus, this interaction term cannot be dropped from the model.
› Step 1. Since the two-way interaction could not be removed from the model, there are no more terms to test. Thus, the final model includes the two-way interaction and the main effects.

05-06-2009 | 26
Goodness-of-Fit-Tests
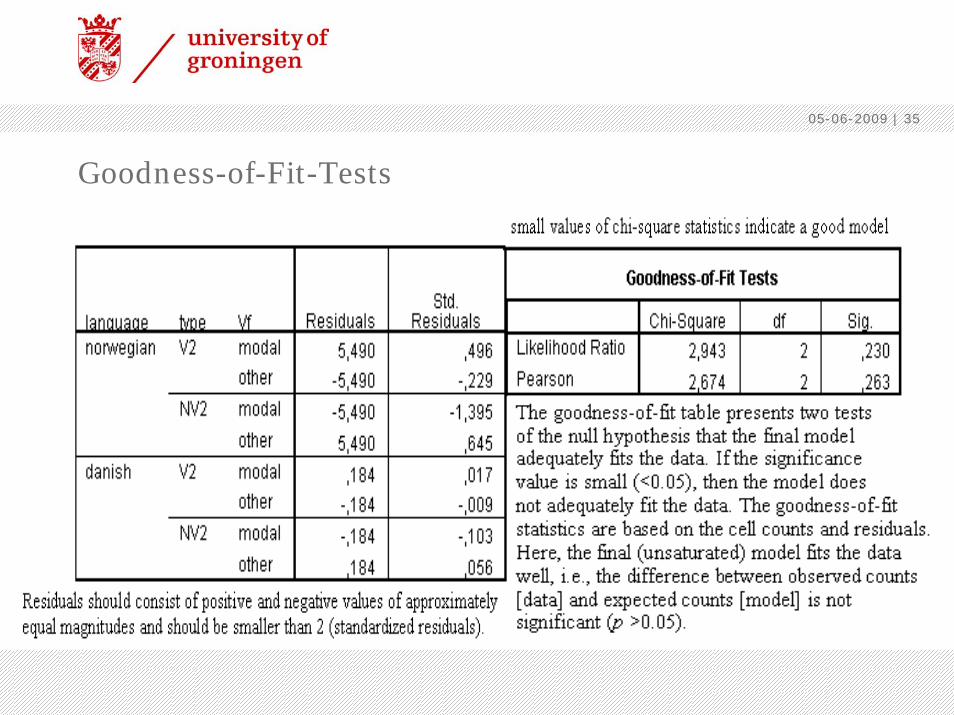
› The goodness-of-fit table presents two tests of the null hypothesis that the final model adequately fits the data. If the significance value is small (<0.05), then the model does not adequately fit the data. The goodness-of-fit statistics are based on the cell counts and residuals.Here, the model perfectly predicts the data.

05-06-2009 | 27
Multi-way tables
› Cross tables can be extended/refined, i.e. more factors can be added to the table.
› In addition to language and type, information about other epistemic elements in the clause (auxiliaries, adverbs, particles etc.), the finite verb (modal or not), the type of subject (pronoun or not), etc. can be added.
› 2 x 2 x 2 table
language (Danish / Norwegian) * type (V2 / NV2) * Vf (modal / other)

05-06-2009 | 28
Three-way (2 x 2 x 2) contingency table

05-06-2009 | 29
Convergence Information

05-06-2009 | 30
K-Way and Higher-Order Effects
05-06-2009 | 31
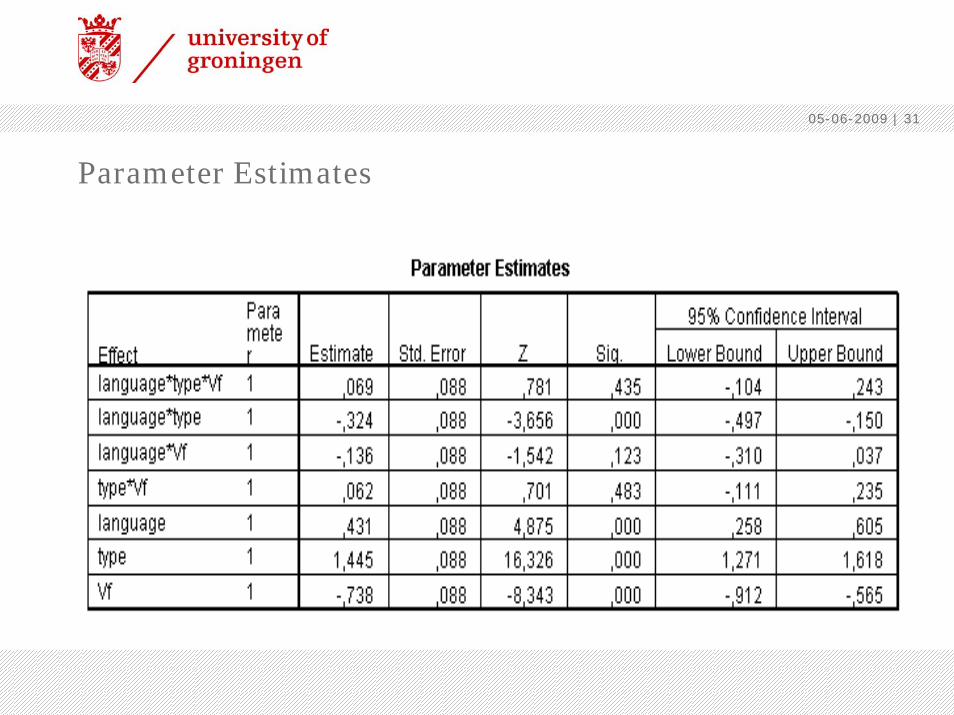
Parameter Estimates

05-06-2009 | 32
Partial Associations

05-06-2009 | 33
Backward Elimination Statistics
05-06-2009 | 34
Backward Elimination Statistics
› Step 0. This model includes all interactions and main effects. The three-way interaction is tested for significance by deleting it from the model. The change in chi-square from the saturated model to the model without the three-way interaction is tested and found to be not significant (significance value > 0.05). Thus, the three-way interaction term can be dropped from the model.
› Step 1. The model generated by all two-way interactions is considered. This model also includes the main effects. Each two-way interaction is tested for significance by deleting it from the model. Since the significance value for the change in chi-square for the effects language*type and language*Vf is less than 0.05, these terms should be kept in the model. The effect type*Vf can be dropped.
› Step 2. The retained two-way interactions language*type and language*Vf are considered. None of them can be removed from the model (significance value < 0.05), there are no more terms to test.
› Step 3. The final model includes the main effects and the two-way interaction terms language*type and language*Vf.
05-06-2009 | 35
Goodness-of-Fit-Tests

05-06-2009 | 36
Related procedures
Model Selection Loglinear Analysis is useful for identifying an initial model for further analysis in General Loglinear Analysis or Logit Loglinear Analysis.
› General Loglinear Analysis uses loglinear models without specifying response or predictor variables. It has more input and output options, and is useful for examining the final model produced by Model Selection Loglinear Analysis. Either a Poisson or a multinomial distribution can be analyzed.
› Logit Loglinear Analysis models the values of one or more categorical variables given one or more categorical predictors using logit-expected cell counts of crosstabulation tables. It treats one or more categorical variables as responses (independent), and tries to predict their values given the other (explanatory/dependent) categorical variables.
05-06-2009 | 37
Related procedures
› If there is one dependent variable, you can alternately use Multinomial Logistic Regression.
› If there is one dependent variable and it has just two categories, you can alternately use Logistic Regression.
› If there is one dependent variable and its categories are ordered, you can alternately use Ordinal Regression.
05-06-2009 | 38
Concluding remarks
+ suitable to analyse complicated multiway-tables
+ robust “ANOVA-like” analysis of complicated contingency tables
+ interactions and main effects of factors
+ parameter estimates / partial associations
- individual effect of values of factors cannot be determined
- structural zero’s
- no distinction between dependent / independent variables
- specification of many variables with many levels can lead to a situation where many cells have small numbers of observations.
05-06-2009 | 39
References
› Agresti, A. 1996. An Introduction to Categorical Data Analysis.Wiley: New York.
› Everitt, B.S. 1992. The Analysis of Contingency Tables. Chapman & Hall: London.
› Field, A. 2005. Discovering Statistics Using SPSS. Sage Publications: London.
› SPSS 16. - Online Help: loglinear analysis- Tutorial: Loglinear Modeling