localization and orientation of homopolymer in block copolymer lamella: a near-field optical...
TRANSCRIPT
Localization and Orientation of Homopolymer in Block CopolymerLamella: A Near-Field Optical Microscopy Study
Jian Yang, Ryojun Sekine, Hiroyuki Aoki,* and Shinzaburo Ito
Department of Polymer Chemistry, Graduate School of Engineering, Kyoto UniVersity, Katsura,Kyoto 615-8510, Japan
ReceiVed June 18, 2007; ReVised Manuscript ReceiVed August 8, 2007
ABSTRACT: The experiments described here were designed to characterize the location and orientation of asingle homopolymer chain embedded in a block copolymer lamella. We used scanning near-field optical microscopy(SNOM) to image individual perylene-labeled poly(methyl methacrylate) (PMMA-Pe) chains sparsely distributedin lamellar phases formed by poly(styrene-b-methyl methacrylate) (PS-PMMA). By calculating the center ofmass (CM) of the PMMA-Pe chain, we found that the homopolymer chains were distributed throughout thePMMA-rich domain layers, with the maximum CM population at the domain centers. The orientation of thehomopolymer chains is dependent on the location of the CM of the homopolymer in the PMMA block domain.If the CM locates at the domain center, the homopolymer chain prefers an orientation parallel with the lamella.If the CM is close to the block interface, the homopolymer chain tends to orient itself perpendicularly to theinterface. This location dependence of chain orientation is likely the result of the rotational freedom of PMMA-Pe chains in the PMMA-rich domains of the PS-PMMA block copolymer lamella.
Introduction
Melts of block copolymers undergo disorder-order transitionwhen the product of the Flory-Huggins interaction parameter(øFH) and the degree of polymerization (N) exceeds 10.6.1
Confined by the covalent bond between blocks, block copoly-mers can only phase-separate on the microscopic scale and self-assemble into various ordered structures such as spheres,cylinders, and lamellae.2 The scale of block copolymer self-assembly is directly related to the sizes of the blocks. Therefore,the periodicity of self-assembled patterns formed by blockcopolymers is normally in the 10-100 nm range.
In recent years, there has been strong interest in studyinghomopolymer blends with block copolymers. When a ho-mopolymer A dissolves in a matrix of a block copolymer A-b-B, where the two constituent polymers A and B are immiscible,the homopolymer will be confined to the A-rich domain formedby the block copolymer. This confinement results in entropyloss of the system. As an energetic compensation, individualhomopolymers may have preferred locations, conformations, andorientations in the block domains.
Studies of homopolymer localization in block copolymerlamellae have been widely explored both theoretically3,4 andexperimentally by small-angle X-ray and neutron scattering,5
transmission electron microscopy,6 atomic force microscopy,7
specular neutron reflectivity,8,9 and fluorescence resonanceenergy transfer.10 If the concentration of the homopolymer islow enough, the presence of the homopolymer will not alterthe lamellar structure of the block copolymer. The location ofthe homopolymer in the block copolymer lamella mainlydepends on the molecular weights of the homopolymer A (MA)and block A of the block copolymer (MbA). Briefly, if MA <MbA, the homopolymer distributes throughout the A-rich domain.As MA increases, A tends to concentrate in the center of theA-rich domain.11 To the best of our knowledge, all of the relatedresearch has concentrated on characterizing the localization and
spatial distribution of the homopolymer chains in the blockdomains. The conformation and orientation of the homopolymerchains confined to the block domains have not been studieddue to the lack of suitable experimental techniques.
Characterization of polymer chain conformations requires atechnique that has both high spatial resolution and the capabilityto distinguish the target polymer chain from the rest of thematrix. Fluorescence technique appears to be a very promisingtool in the studies such as polymer conformation, morphology,and blend miscibility.12,13The merit of this technique is its highsensitivity associated with fluorescence (FL) detection. Oneneeds only a trace amount of the FL chromophore to acquireinformation about a system, and the system itself will not bedistorted significantly by the presence of the chromophore.Among fluorescence techniques, fluorescence microscopy isvery powerful in detecting a single dye-labeled polymer chainin a nonfluorescent matrix. But because of the diffraction limit,14
the highest resolution of a conventional fluorescence microscopecan only reach about half of its excitation wavelength. Thissignificantly limits its application in characterizing the confor-mation of a single polymer chain.
Scanning near-field optical microscopy (SNOM) is a noveltechnique that breaks the optical diffraction barrier. As a memberof the family of scanning probe microscopies, SNOM isequipped with a quasi-point light source that has a diametermuch smaller than the wavelength of the excitation light. Byscanning the sample surface at a very close distance, SNOMcan reach a resolution down to tens of nanometers.15,16 Theadvantage of SNOM over other microscopy techniques arisesnot only from its ability to create high resolution, spectrallyresolved optical images that allows one to study the objectswithin nanometer scale, but also from its nature of operatingwith light. As a complement to other techniques such asscanning tunneling microscopy, scanning electron microscopy,and atomic force microscopy, SNOM is extremely useful innanoscience related to different optical properties, such asfluorescence, absorption, and polarization. In recent years,SNOM has been widely applied to many fields in polymer
* To whom correspondence should be addressed: e-mail [email protected]; Tel+81-75-383-2613; Fax+81-75-383-2617.
7573Macromolecules2007,40, 7573-7580
10.1021/ma071350+ CCC: $37.00 © 2007 American Chemical SocietyPublished on Web 09/25/2007
science such as studies on phase separation in polymer blend,17
single-chain characterizations in polymer monolayers,18 andinvestigations on the ordered structure of block copolymers.19,20
In this paper, we describe SNOM experiments on imagingsingle perylene-labeled poly(methyl mathacrylate) (PMMA-Pe)homopolymer chains embedded in lamellar domains formed bypoly(styrene-b-methyl methacrylate) (PS-PMMA). We inves-tigated the localization, shape, and orientation of single PMMA-Pe chains in the PMMA-rich domain of the block copolymerlamella. In order to observe polymer chain conformations anddistinguish the chemically distinct domains of the blockcopolymer using SNOM, we chose PMMA-Pe and PS-PMMAwith high molecular weights. The PS-PMMA has a lamellarspacing about 156 nm in bulk, and the two block domains canbe easily distinguished by SNOM. Our results show that thePMMA-Pe chain has preferred orientation inside the PMMAblock domain, and this preference depends on the location ofthe center of mass (CM) of the PMMA-Pe chain. However, theshape of a PMMA-Pe chain is almost independent of the locationof the CM of the homopolymer in the block.
Experimental Section
Synthesis of Perylene-Labeled PMMA.Perylene-labeled poly-(methyl methacrylate) (PMMA-Pe) was synthesized by radicalcopolymerization of methyl methacrylate (MMA) and 3-perylenylmethyl methacrylate at 55°C for 24 h. 2,2′-Azobis(isobutyronitrile)(Wako) was used as the initiator. MMA (Wako) was purified bydistillation under reduced pressure. 3-Perylenyl methacrylate mono-mer was synthesized by the reduction of 3-formylperylene followingthe Vilsmeiyer reaction of perylene.21 The raw polymer obtainedafter polymerization was purified by fractional precipitation toobtain PMMA-Pe with narrow molecular weight distribution. Themolecular weight of the synthesized PMMA-Pe was determinedby gel permeation chromatography (D-7000G, Hitachi), with THFas the eluent and PMMA (American Polymer Standards Corp.) asthe molecular weight standard. Signals were collected by tandemRI and UV (442 nm) detectors. The perylene fraction of the PMMA-Pe was determined from UV-vis absorption spectra by assumingthat PMMA-Pe and perylene have the same extinction coefficient.
Sample Preparation. Symmetric PS-PMMA (molecularweight: 868 000 (PS)-857 000 (PMMA) g/mol; PDI: 1.3) waspurchased from Polymer Source and used without further purifica-tion. We prepared four sets of PMMA-Pe/PS-PMMA mixtures(molar ratios of PMMA-Pe/PS-PMMA: 1.6 × 10⁻⁵, 3.7× 10-5,6.4 × 10-5, and 9.0× 10⁻⁵), each of which was dissolved inchloroform (reagent grade, Wako) to form a 2 wt %solution. Thepolymer solutions were spread on clean glass plates. After drying,all of the films were annealed sequentially in chloroform vapor atroom temperature (72 h) and in vacuum at 170°C (24 h). In thisway, we obtained a thick film (∼30 µm), with long-range orderedlamellar structure.
PMMA-Pe/PMMA thick film was prepared in a similar way,but without the solvent treatment. PMMA standard (ScientificPolymer Products Inc.,Mn ) 1 700 000 g/mol) was used as thematrix. We controlled the concentration of PMMA-Pe in PMMAat 0.0025 wt %. The polymer solution (1 wt % in toluene) wasspread on glass plate and slowly dried at room temperature for 72h. The dried thick film was then annealed in vacuum at 130°C for24 h and at 170°C for 48 h.
All prepared thick films were removed from the glass substratesand sliced into ultrathin films (∼50 nm) by microtoming (UltracutUTC, Leica microsystems). The sliced ultrathin films were thenmounted on cover glass slips for the SNOM measurements.
SNOM Measurements.SNOM imaging was performed usinga commercialR-SNOM (WITec) with a 441 nm laser (BCL-015-440, CrystaLaser) as the excitation source. A cantilever probe wasused to scan the sample surface in contacting mode. The probe hasa nanoaperture (∼60 nm) at the tip end, and the light passing
through the aperture excites the perylene chromophores inside thepolymer film. The signal light from the specimen was collected bya microscope objective (60×, 0.8 NA, Nikon) and split by a beamsampler. 4% of the collected signal was directed to an analog PMT(H5784, Hamamatsu Photonics) to obtain the transmission image,and the rest was detected by a photon counting PMT (H8631,Hamamatsu Photonics) after passing through a long-pass filter(LP02-442RS-25, Semrock) to acquire the fluorescence image. Allimages were recorded at a pixel size of 3.9 nm× 3.9 nm and apixel dwell time of 3.9 ms. With our experimental setup, the surfacetopography (TP), fluorescence (FL), and transmission (TRANS)images can be simultaneously obtained from the scanning area.
Results and Discussion
Synthesis of PMMA-Pe and Sample Preparation.Thesynthesized PMMA-Pe after fractionation had the molecularweight (Mn) of 2 300 000 g/mol and polydispersity index 1.3.The GPC curve shows the PMMA-Pe free of unreacted dyemonomers. It was found that 0.84% of the MMA monomer unitsin a PMMA chain had a perylene moiety attached to it, whichis sufficient to give detectable fluorescence signal from a singlepolymer chain but not high enough to alter the physicalproperties of PMMA.
Treating block copolymer films with solvent vapor is veryhelpful to obtain long-range ordered structures.22,23We followedthis method and treated the thick PS-PMMA films withchloroform vapor. The well-oriented lamellar structure insidethe thick block copolymer film was significantly enhanced afterthe treatment. Although we were unable to obtain well-orientedlamellar patternthroughoutthe film, the size of the area withwell-oriented lamellar structure in the thick film was largeenough (∼10 µm × 10 µm) to obtain high-quality SNOMimages. We also found that solvent vapor treatment hadnegligible effect on the lamellar spacing of PS-PMMA in bulk.The well-ordered lamellar structures inside the thick film haveno preferred orientation relative to the film surface, resultingin extreme difficulties in slicing the thick film in the directionperpendicular to the lamellar alternating phases. We sliced thethick film in different directions relative to the film surface.All sliced thin films had thickness of about 50 nm. The acquiredTRANS images showed no relationship between the slicingdirection and the lamellar spacing. We take this result to meanthat the sliced ultrathin films can be treated as quasi-two-dimensional planes, and the cutting direction has no effect onour SNOM results.
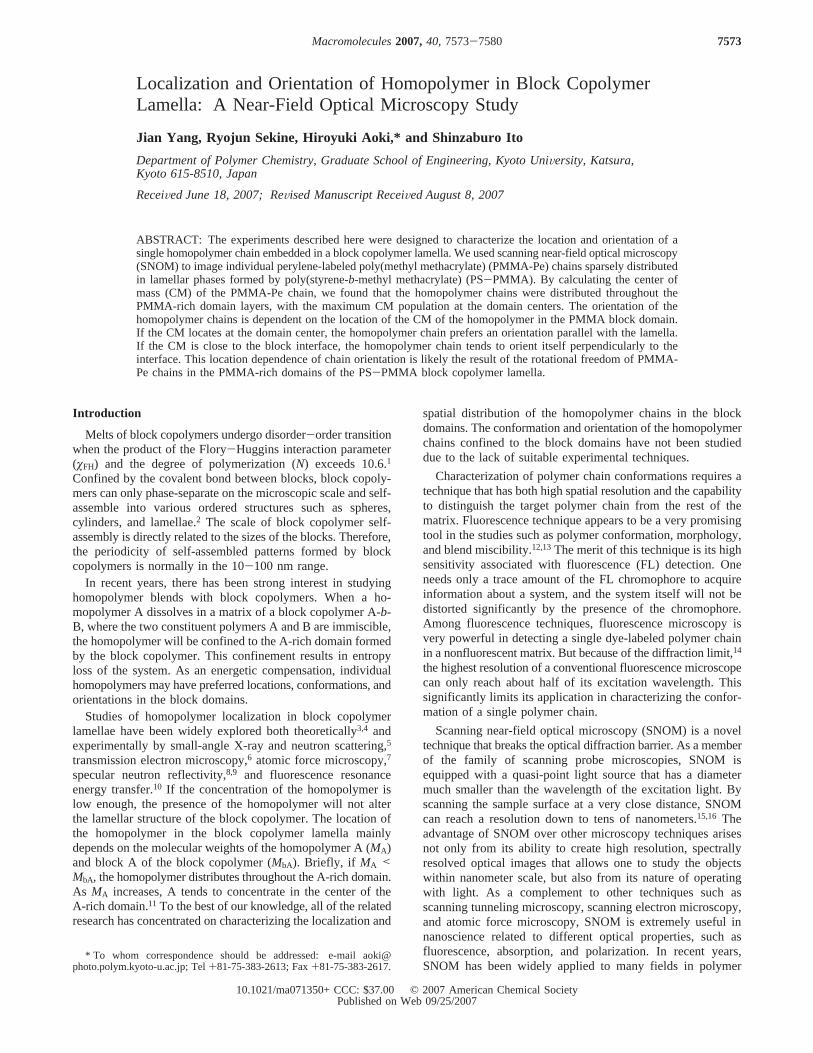
SNOM Imaging of a Single PMMA-Pe Chain.The objec-tive of this research is to investigate the orientation andlocalization of single PMMA-Pe homopolymer chains in thePS-PMMA block copolymer lamella. We blended the PS-PMMA with different trace amounts of PMMA-Pe and imagedthe ultrathin sliced films for each sample. The acquired FLimages show that all fluorescent spots are homogeneouslydistributed throughout the sliced thin films. For each FL image(dimensions: 15µm × 15 µm), we calculated the numberdensity of the fluorescent spots by counting the number offluorescent spots in the image. Figure 1 shows the observednumber density of fluorescent spots at different PMMA-Pe/PS-PMMA ratios. The number density of fluorescent spots is ingood agreement with the number density of PMMA-Pe chainsin PS-PMMA matrix, based on the polymer molar ratio. Thisindicates that one fluorescent spot in the SNOM FL imagescorresponds to a single PMMA-Pe chain embedded in the blockcopolymer matrix.
Figure 2 shows a set of SNOM images obtained simulta-neously from an area (1µm × 1 µm) in a sliced PS-PMMA
7574 Yang et al. Macromolecules, Vol. 40, No. 21, 2007
ultrathin film doped with PMMA-Pe. The TP image (a) showsno surface feature and can hardly provide any useful informationabout the morphology or polymer chain conformation. TheTRANS image (b) clearly shows the alternative local contrastbetween the two block domains of the PS-PMMA. Thiscontrast may originate from the different refractive indices ofPS (1.59) and PMMA (1.49).24 The bright areas correspond tothe PMMA domains and the dark parts are the areas occupiedby the PS blocks (see Supporting Information for the identifica-tion of the two domains). The bright spot in the FL image (c)corresponds to the single PMMA-Pe chain embedded in theblock copolymer lamella. (d) is a pseudo-colored superimposedimage of (b) and (c), which indicates the location and orientationof the homopolymer chain in the PMMA-rich domain layer ofthe PS-PMMA lamella.
Analyses of SNOM Images.The FL image of the PS-PMMA/PMMA-Pe mixture provides rich information about thelocation and orientation of the PMMA-Pe chain, while theTRANS image contains information about the lamellar structureof the block copolymer. By analyzing the FL and TRANSimages, we were able to determine the relative position andorientation of the PMMA-Pe chain inside the PMMA-richdomain layer of the PS-PMMA block copolymer lamella. Atypical procedure of the image analysis may be described asfollows:
1. Characterization of the Conformation, Orientation, andCenter of Mass of a Single PMMA-Pe Chain.We followeda standard procedure to analyze the chain conformations of thePMMA-Pe chains shown in the acquired FL images.25,26Briefly,as shown in Figure 3, we select an area including the brightspot in the FL image and read the fluorescence intensity at everypixel throughout this area. The normalized second moments ofthe fluorescence intensity distribution (M) in two dimensionsare expressed as
whereI0 is the sum of the intensity of the selected area and (xij,yij) is the Cartesian coordinate of the pixel (i, j) in the image.M is a tensor and stands for the anisotropic intensity distributionof the investigated fluorescent spot (corresponds to a PMMA-
Pe coil). The coordinate of the intensity-weighted center of mass(CM) of the PMMA-Pe chain is
The tensorM is a measure of the size and shape of the PMMA-Pe polymer chain. In this way, the investigated polymer chainspot can be represented as an ellipse with long and shortprincipal axes. The eigenvalues of the long (λl) and the short(λs) principal axes are given by
where tr(M ) and det(M ) are the trace and the determinant ofM . The trace ofM defines the radius of gyration,Rg
2 ) tr(M ).The orientation of the PMMA-Pe chain is defined as theorientational angle (θ) of the long principal axis relative to thepositiveX-axis
2. Determination of Lamellar Spacing and LamellarOrientation. The periodical spacing and the orientation of thePS-PMMA lamella were determined from the fast Fouriertransform (FFT) of the TRANS images, as shown in Figure4.27 Figure 4a is the duplicated TRANS image of Figure 2b,which shows the lamellar structure formed by the PS-PMMAblock copolymer. FFT (inset of Figure 4a) of the TRANS imageshows an ordered pattern of the lamellar structure in thereciprocal space. We drew a line that passes through the patternand counted the intensity along the line. The direction of theline indicates the orientation of the lamellar structure (lamellarnormal). We defined the angle between the orientation of thePMMA-Pe chain and the lamellar normal as the relativeorientational angle of the PMMA-Pe chain embedded in thePS-PMMA lamella.28 The lamellar spacing of PS-PMMA is156 ( 6 nm, calculated from the distance between thecharacteristic peaks in the intensity distribution profile, as shownin Figure 4b.
3. Determination of the CM Location of a PMMA-PeChain in the Lamella. We located the CM of the PMMA-Pechain, calculated from Figure 3 and eq 2, in the TRANS image.In Figure 5a, the CM of PMMA-Pe is indicated as a white circlein the TRANS image. The black solid line passes through theCM and has the same orientation as the block copolymerlamellar normal. We tracked the transmission intensity in theTRANS image across the PMMA-rich domain along this solidline. The transmission intensity distribution, shown as the opencircles in Figure 5b, was then fitted to a modified Helfand-Tagami hyperbolic function29
In eq 5,I(x) is the fitted transmission intensity distribution acrossthe PMMA-rich domain, along the solid line shown in Figure5a.x is the coordinate along the solid line.a, b, c, d, andδ arethe floating parameters used in the fitting. Among thoseparameters,c refers to the distance between the CM and thecenter of the PMMA-rich domain layer in the direction of the
Figure 1. Number densities of fluorescent spots (solid squares witherror bars) obtained from SNOM FL images at different PMMA-Pe/PS-PMMA ratios. For each ratio, we selected three different FL images(15 µm × 15 µm) and counted the number of fluorescent spots in eachimage. The density value with the error bar at each ratio is the averagedvalue with standard deviation. The solid line is the calculated numberdensity of PMMA-Pe chains in the PS-PMMA matrix, based on themolar ratio of PMMA-Pe to PS-PMMA.
Mxx )1
I0∑i,j
I ij(xij - xCM)2; Myy )1
I0∑i,j
I ij(yij - yCM)2
Mxy ) Myx )1
I0∑i,j
I ij(xij - xCM)(yij - yCM) (1)
xCM )1
I0∑i,j
I ijxij; yCM )1
I0∑i,j
I ijyij (2)
λl,s )tr(M ) ( xtr(M )2 - 4 det(M )
2; M ) (Mxx Mxy
Myx Myy) (3)
θ ) arctan(λl - Mxx
Mxy) (4)
I(x) )
a + b{tanh2[(x - c) + d]
δ- tanh
2[(x - c) - d]δ } (5)
Macromolecules, Vol. 40, No. 21, 2007 Homopolymer in Block Copolymer Lamella7575

lamellar normal.δ is the width of the interface between the PSand PMMA domains. We defined the full width at half-maximum (FWHM) of the fitted profile as the width of thePMMA-rich domain.
Using our methodology of the SNOM image analysis, weanalyzed 100 PMMA-Pe chains located at different areas in thePS-PMMA lamellae. We calculated the orientational angle ofeach PMMA-Pe chain relative to the lamellar normal and therelative position of the PMMA-Pe chain located in the PMMA-rich domain of the copolymer matrix. All information wascompiled to construct the relationship between the chain
orientation and the location of PMMA-Pe in the PS- PMMAlamella.
Localization of PMMA-Pe Chains in the PS-PMMALamella. Russell and co-workers investigated the localizationof PMMA homopolymers in PS-PMMA block copolymerlamellae, using specular neutron reflectivity.8,9 According to theirresults, the localization of PMMA homopolymer in the PS-
Figure 2. Topography (a), transmission (b), fluorescence (c), and superimposed (b and c) images of a scanning area in a PS-PMMA/PMMA-Pethin film. The dimension of all images is 1µm × 1 µm. The lamellar pattern shown in (b) corresponds to the lamellar morphology formed byPS-PMMA. The blue and dark parts in the image correspond to PMMA and PS, respectively. The bright spot in (c) corresponds to a singlePMMA-Pe chain embedded in the PS-PMMA matrix. The pseudo-colored superimposed image (d) shows the location and orientation of thePMMA-Pe homopolymer chain in the PS-PMMA lamella.
Figure 3. Determination of the orientation and the center of mass of a PMMA-Pe chain. (a) Duplicated FL image of Figure 2c (dimension: 1µm× 1 µm). The bright white spot corresponds to a single PMMA-Pe chain. The chain orientation, indicated as the long axis, is calculated on the basisof the method described in the text. The short axis is perpendicular to the chain orientation. The center of mass of the PMMA-Pe chain is locatedat the intersection of the two axes. The orientational angle (θ) of the polymer chain is indicated in the figure. (b) Enlarged image of the PMMA-Pechain shown in (a). The radius of the red circle is the calculatedRg of the PMMA-Pe chain. The green ellipse is drawn with the square roots of thetwo eigenvalues (λl andλs) as the long and short axes. The long axis defines the orientation of the PMMA-Pe chain. The scale bar in (b) is 100 nm.
Figure 4. Determination of the orientation and the spacing of a samplelamellar structure formed by PS-PMMA. (a) TRANS image and itsfast Fourier transform (FFT) image (inset). The white dotted line passesthrough the pattern in the FFT image and shows the orientation of thelamellar structure (lamellar normal). (b) Intensity distribution along thedotted line shown in the inset of (a). The ordered peaks are indicatedin the figure.H is the lamellar spacing.
Figure 5. Location of the center of mass (CM) of a PMMA-Pehomopolymer chain in the PS-PMMA lamella (a) and cross-sectionprofile in the normal direction to the lamella (b). (a) TRANS imageduplicated from Figure 2b. The CM of the Pe-PMMA is shown as thewhite spot. The solid line is the line path used to calculate the cross-section profile of the transmission intensity. It passes through the CMof the PMMA-Pe and has the same orientation as the PS-PMMAlamellar normal. (b) Cross-section distribution (open circles) of thetransmission intensity recovered from (a) along the solid line. The solidcurve in (b) is the fitted intensity profile (eq 5). We set the origin ofthe distance coordinate to the center of the PMMA-rich layer. Thecoordinate of the dashed line represents the distance between the CMof the PMMA-Pe and the center of the PMMA-rich domain.
7576 Yang et al. Macromolecules, Vol. 40, No. 21, 2007

PMMA lamella depends on the molecular weights of the PMMA(Mh-PMMA) and the PMMA block of the PS-PMMA (Mb-PMMA):
If Mh-PMMA is small compared toMb-PMMA, the PMMAhomopolymer tends to distribute throughout the PMMA domainhomogeneously; ifMh-PMMA is comparable toMb-PMMA, thehomopolymer tends to distribute in the domain with the highestconcentration at the center; ifMh-PMMA is much larger thanMb-PMMA, the PMMA chains segregate from the block domainand form relatively small domains distributed throughout thefilm. In our experiments, we are interested in characterizing asingle polymer chain in a copolymer matrix. The extremely lowconcentration of PMMA-Pe in the matrix is unfavorable for theaggregation of PMMA-Pe. As a consequence, individual ho-mopolymer chains will be isolated in the copolymer matrix. Thelocation and conformation of the single polymer chain dependon the local enthalpic interactions between the homopolymerchain and the surrounding block copolymer chains.
In Figure 6, we show a histogram of the localization of the100 PMMA-Pe chains in PS-PMMA. In this figure, thepopulation of PMMA-Pe chains is plotted against the distancebetween the CM of the PMMA-Pe chain and the center of thePMMA-rich domain layer. The average size of half of a PMMAdomain was found to be 41( 5 nm. It is easily seen that thePMMA-Pe chains are neither homogeneously distributed in thePMMA-rich domain nor all confined to the center of the blockdomain layer. The FL images show that segments of thePMMA-Pe chains distribute throughout the PMMA-rich domain.We found that more than 90% of the CMs of PMMA-Pe chainswere located in the PMMA-rich domain, and the center of thePMMA-rich domain had the highest CM population. FewPMMA-Pe chains protrude from the PMMA-rich domain andentangle with the PS block chains. The embedded PMMA-Pehomopolymers have an averageRg of 88 ( 13 nm. This valueis smaller than theRg of the PMMA-Pe in the PMMA matrix(117 ( 13 nm).30 The synthesized PMMA-Pe has a molecularweight (2 300 000 g/mol) 3 times larger than that of the PMMAblock (857 000 g/mol) of the PS-PMMA sample. The differ-ence of the twoRg’s clearly shows the confinement effect ofthe block copolymer lamella on the conformation of theembedded PMMA-Pe homopolymer.31 Segments of the indi-vidual homopolymer chains crowd into the PMMA-rich domainlayers due to the repulsive interaction between PMMA-Pe andPS. The FL images also show that the compression of thePMMA-Pe chain is not homogeneous, resulting in a certainorientation along the calculated long principal axis. The averagesquare roots of the two eigenvalues of the PMMA-Pe chains
were found to be 67( 10 and 56( 8 nm in the directionparallel with and perpendicular to the chain orientation,respectively. The difference is small and independent of the CMlocation of the PMMA-Pe chains, indicating that the restrictedPMMA-rich domain in a PS-PMMA lamella only has amoderate effect on the anisotropic deformation of the embeddedPMMA-Pe chains.
Relative Orientation of PMMA-Pe Chain in PS-PMMALamella. Although the deformation of the homopolymer chainsinside the block domain is less than what we expected, theorientation of an embedded PMMA-Pe chain can still beaccurately determined using the method described in the sectionof image analysis. We constructed a relationship between theorientation and location of homopolymer chains embedded inthe PMMA-rich domains of the block copolymer lamella. Asshown in Figure 7a, for each PMMA-Pe chain, the anglebetween the chain orientation and the lamellar normal wasplotted against the relative CM position of the homopolymerchain in the block domain. We found a weak tendency that thehomopolymer chains oriented themselves depending on theirlocations in the PMMA-rich domain layer. When the CM ofPMMA-Pe is at the center of the PMMA-rich domain layer,the homopolymer prefers an orientation parallel to the lamellaphase; i.e., the orientation has an angle of 90° from the lamellarnormal. When the PMMA-Pe chain is situated close to theinterface, its orientation tends to be perpendicular to the lamellaphase. In Figure 7a, we also show superimposed (FL andTRANS) images of three PMMA-Pe chains located at differentpositions in the PMMA-rich domain. From the three images,one can easily see the tendency of the orientational changewith distance between the CM of PMMA-Pe and the center ofthe PMMA-rich layer.
Figure 7b shows the shape parameter, defined as the squareroot of the ratio between the two eigenvalues of the long (λl)and the short (λs) principal axes, of a PMMA-Pe homopolymerchain relative to its location in the block copolymer lamellae.Although we found the PMMA-Pe chain had weak preferredorientation depending on its location in the block copolymerlamella, the shape of a homopolymer chain seems to have norelationship with its CM location. Moreover, the blurring effect,caused by the finite dimension of the aperture on the SNOMprobe, always exists in the fluorescence imaging. This blurringeffect makes the fluorescent object more roundlike than its realshape. As a consequence, it is difficult to compare the shapedetermined from the FL image to the real shape of the PMMA-Pe homopolymer chain. Here we only showed the determinedshape parameters of the PMMA-Pe chains, and were reluctantto draw further conclusions about the shape of the homopolymerchains.
We show a sketch of the position dependence of the PMMA-Pe chain orientation in the PS-PMMA block copolymer lamellain Figure 8. It is well-known that the system free energy of aneat, phase-separated block copolymer system can be split intoan interfacial and a stretching contribution.1 The interfacial freeenergy includes the contact enthalpy between the blocks andthe confinement entropy originating from the selective locationof the block chains in the ordered structure. The stretchingenergy is caused by the extension of the block chain, whichtends to compensate for the unfavorable contact with thedifferent block type. The chain stretching effect causes preferredorientation of the block chains perpendicularly to the lamellarphase.5 When an ordered structure is formed, all energeticcontributions balance each other to minimize the overall freeenergy of the system. If the PMMA-Pe chains sparsely locate
Figure 6. Histogram of the localization of PMMA-Pe in the PMMA-rich domain of the PS-PMMA block copolymer lamella. The popula-tion of PMMA-Pe chains is plotted against the distance between theCM of a PMMA-Pe chain and the center of the PMMA-rich domain(parameterc in eq 5). The average size of half of the PMMA-richdomain is 41( 5 nm (half of the fwhm in eq 5).
Macromolecules, Vol. 40, No. 21, 2007 Homopolymer in Block Copolymer Lamella7577

in a matrix of PS-PMMA lamellae, the individual chains areconfined to the PMMA-rich domain due to the repulsiveinteraction between the PS block and the PMMA-Pe chain. Thisconfinement results in entropy loss of the system, and as anenergetic compensation, the PMMA-Pe chain will have preferredlocation and orientation in the PMMA-rich domain. Since theinvestigated PMMA-Pe has a molecular weight 3 times largerthan that of the PMMA block, to minimize the system energy,the PMMA-Pe chains tend to locate at the center of the PMMA-rich domain. Meanwhile, the PMMA-Pe chains are compressedand, most likely, anisotropically deformed in the directionparallel with the lamella phase due to the large molecular weightof the homopolymer. In a neat block copolymer lamella, thesimulation results showed that the segments close to the end ofthe block chain had more rotational freedom than those closeto the block junction.32 If the homopolymer chain is at the centerof the domain layer, it is in an environment that allows thehomopolymer chain to rotate more freely upon annealing. Thehomopolymer chain can easily rotate and rearrange itself to
minimize the local free energy in its neighborhood. Thehomopolymer chain will, therefore, have preferred orientationparallel to the lamella phase.
Although most of the PMMA-Pe chains locate at the centerof the PMMA-rich domain, our results show that, for somehomopolymer chains, part of the chain segments are in areasclose to the block interface, or even in the PS domain, due tofluctuations. When most of the segments of the homopolymerchain are localized close to the block interface, the rotationalmovement of the homopolymer chain is much retarded by blockchains (lack of rotational freedom). Segments can rearrangealongside the block chains only during annealing. The blockchains have preferred orientations perpendicular to the lamellarphase due to the chain stretching effect, and the homopolymerchains close to interfacial area will also have preferred orienta-tions perpendicular to the lamella.
Possible Distortion of the FL Image in the SNOMMeasurements.33 The possible distortion of the FL imagesobtained from our SNOM experiments may originate either from
Figure 7. (a) Plot of chain orientation of PMMA-Pe against the CM location in the PMMA-rich domains of PS-PMMA lamellae.Y-axis showsthe relative angle between the chain orientation and the lamellar normal.X-axis shows the distance between the CM of PMMA-Pe and the centerof the corresponding PMMA-rich domain layer. Superimposed images (FL and TRANS) of three PMMA-Pe chains located in different areas in thePS-PMMA block copolymer lamellae are also shown in the figure. The corresponding CM positions of the three PMMA-Pe chains in the figureare indicated as the solid points. The transparent broad red arrow serves as a guide for the eye. The bright spot in each of the superimposed imagescorresponds to the single PMMA-Pe chain. (b) Plot of the shape parameter (defined as the square root of the ratio between the two eigenvalues ofthe long (λl) and the short (λs) principal axes) of a PMMA-Pe homopolymer chain against its CM location in the PS-PMMA block copolymerlamellae. TheX-axis has the same meaning as that in (a). The three PMMA-Pe chains shown in the superimposed images are also indicated as solidpoints.
Figure 8. Sketch showing the relationship between the orientation and location of PMMA-Pe chains inside a PMMA-rich domain layer. The blackcoils represent the PMMA block chains. The elliptical shadows stand for the PMMA-Pe chains with specific conformation and orientation insidethe block domain (see the image analysis section). The longer black line in each shadow indicates the orientation of the specific PMMA-Pe chain.The CM of the PMMA-Pe chain is located at the intersection of the two black lines in each shadow.
7578 Yang et al. Macromolecules, Vol. 40, No. 21, 2007
the finite dimension the aperture on the SNOM probe or fromthe change of the refractive index in the alternating PS andPMMA domains. The distortion of FL image can be tested byimaging an infinitely small single fluorescent object. Thenanocrystal of semiconductor, quantum dot (QD), is a goodcandidate due to its bright fluorescence and infinitely small sizecompared to the SNOM aperture. The fluorescence image of aQD directly indicates the point spread function of the apparatus.
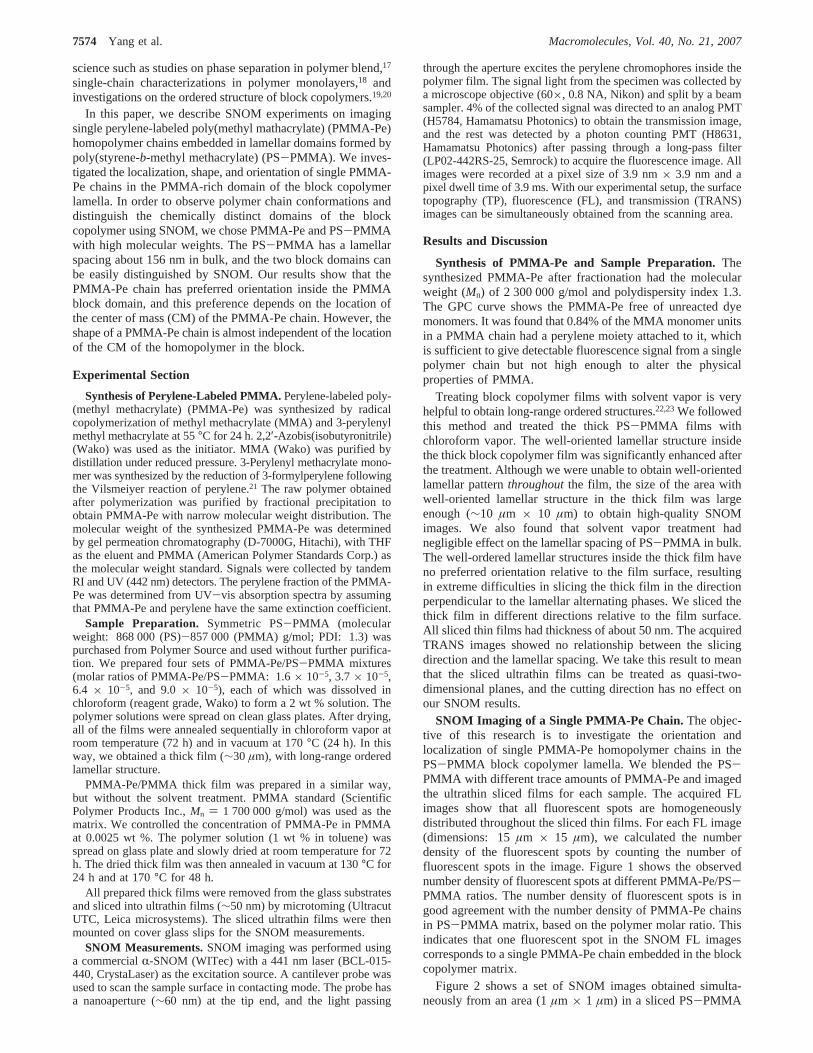
We spin-coated a thin layer (∼20 nm) of poly(vinyl alcohol)(PVA, Wako, degree of polymerization∼ 2000) on themicrotomed PS-PMMA block copolymer thin film. The PVAfilm was doped by QDs (Qdot 655 ITK, Invitrogen) at anultradiluted concentration. We imaged individual QDs locatedon the block copolymer film with lamellar structure. Figure 9ais a FL image that shows several QDs on a block copolymerfilm. Since the irregular blinking of QD makes the imageanalysis difficult, we only tried to analyze one of the QDs usingour methodology described previously. Results show that theQD has a near-round shape with an averaged value of FWHMabout 95 nm. Figure 9b shows a high-resolution FL image withtwo QDs on the PS-PMMA block copolymer lamella. The near-round shape of the fluorescent spots in the FL image indicatesthat the effect of the image distortion in our SNOM experimentis not obvious. Furthermore, as shown in Figure 9c, the intensitydistributions of the QDs are not related to the positions of QDson the PS-PMMA lamella, which is good evidence that thechange of the refractive index across the different block domainsin the block copolymer film has negligible effect on the FLimaging of QD.
Conclusions
In this paper, we report studies on the localization andorientation of single PMMA-Pe homopolymer chains in a PS-PMMA block copolymer lamella. Our results show that mostof the dispersed PMMA-Pe chains are localized in the PMMA-rich layers. The PMMA-Pe chains are deformed due to theconfinement of the block domains of the block copolymer. Butthe extent of the deformation is neither significant nor dependenton the chain location. We, for the first time, report theorientational preference of the homopolymer chain in the blockdomain. The orientation of the homopolymer chain has a weakdependency on the location of the homopolymer inside the blockdomain. When the homopolymer is situated at the center of thedomain layer, it has an orientation parallel to the lamellar phase.With the increase of the distance between the CM of homopoly-mer chain and the center of the domain layer, the homopolymer
chain tends to orient itself perpendicularly to the interface. Weconsider this a result of the rotational freedom of the homopoly-mer in the block domain of the block copolymer lamella.
Acknowledgment. This work is supported by the Grant-in-Aid from the Japan Society for the Promotion of Science (JSPS)and from the Ministry of Education, Culture, Sports, Scienceand Technology (MEXT), Japan. This work is partly supportedby Innovative Techno-Hub for Integrated Medical Bio-imagingProject of the Special Coordination Funds for Promoting Scienceand Technology from MEXT. J. Yang acknowledges a post-doctoral fellowship from JSPS. The authors also thank Dr. JohnG. Spiro (University of Toronto, Canada) for his kind help inthe revision of this manuscript.
Supporting Information Available: Descriptions of experi-ments on distinguishing PS and PMMA domains in the PS-PMMAlamella. This material is available free of charge via the Internet athttp://pubs.acs.org.
References and Notes
(1) Bates, F. S.; Fredrickson, G. H.Annu. ReV. Phys. Chem.1990, 41,525.
(2) Hamley, I. W.The Physics of Block Copolymers; Oxford UniversityPress: New York, 1998.
(3) Shull, K. R.; Winey, K. I.Macromolecules1992, 25, 2637.(4) Vavasour, J. D.; Whitemore, M. D.Macromolecules2001, 34, 3471.(5) Matsushita, Y.; Mori, K.; Saguchi, R.; Nakao, Y.; Noda, I.; Nagasawa,
M. Macromolecules1990, 23, 4313. Hasegawa, H.; Hashimoto, T.;Kawai, H.; Lodge, T. P.; Amis, E. J.; Glinka, C. J.; Han, C. C.Macromolecules1985, 18, 67. Matsushita, Y.; Mori, K.; Mogi, Y.;Saguchi, R.; Noda, I.; Nagasawa, M.; Chang, T.; Glinka, C. J.; Han,C. C. Macromolecules1990, 23, 4317. Koizumi, S.; Hasegawa, H.;Hashimoto, T.Macromolecules1994, 27, 7893.
(6) Winey, K. I.; Thomas, E. L.; Fetters, L. J.Macromolecules1992, 25,2645.
(7) Orso, K. A.; Green, P. F.Macromolecules1999, 32, 1087.(8) Mayes, A. M.; Russell, T. P.; Satija, S. K.; Majkrzak, C. F.
Macromolecules1992, 25, 6523.(9) Shull, K. R.; Mayes, A. M.; Russell, T. P.Macromolecules1993, 26,
3929.(10) Rharbi, Y.; Zhang. J.; Spiro, J. G.; Chen, L.; Winnik, M. A.; Vavasour,
J. D.; Whitmore, M. D.; Je´rome, R.Macromolecules, 2003, 36, 1241.(11) Koizumi, S.; Hasegawa, H.; Hashimoto, T.Macromolecules1994, 27,
6532.(12) Winnik, M. A., Ed.Photophysical and Photochemical Tools in Polymer
Science;Reidel: Dordrecht, 1985.(13) Tanaka, T., Ed.Experimental Methods in Polymer Science; Aca-
demic: San Diego, 2000; Chapter 3.(14) Abbe, E.Arch. Mikrosk. Anat.1873, 9, 413.(15) Betzig, E.; Trautman, J. K.Science1992, 257, 189.(16) Dunn, R.Chem. ReV. 1999, 99, 2891.
Figure 9. (a). Fluorescence (FL) image of QDs on a microtomed block copolymer film with lamellar structure. The upper inset shows the enlargedimage of an investigated QD, indicated by the arrow. The lower inset shows the intensity distribution along the long and the short axes. The twovalues of FWHM are indicated in the inset. (b). FL image of two QDs located on a microtomed PS-PMMA block copolymer film. We adjustedthe intensity scale to show both QDs clearly. (c) FL image shown in (a) superimposed on the TRANS image of the same SNOM scanning area.The dimension of images (b) and (c) is 1µm × 1 µm.
Macromolecules, Vol. 40, No. 21, 2007 Homopolymer in Block Copolymer Lamella7579

(17) Aoki, H.; Kunai, Y.; Ito, S.; Yamada, H.; Matsushige, K.Appl. Surf.Sci.2002, 188, 534.
(18) Aoki, H.; Anryu, M.; Ito, S.Polymer2005, 46, 5896.(19) Fasolka, M. J.; Goldner, L. S.; Hwang, J.; Urbas, A. M.; DeRege, P.;
Swager, T.; Thomas, E. L.Phys. ReV. Lett. 2003, 90, 016107.(20) Raschke, M. B.; Molina, L.; Elsaesser, T.; Kim, D. H.; Knoll, W.;
Hinrichs, K. ChemPhysChem2005, 6, 2197.(21) Aoki, H.; Ito, S.J. Phys. Chem. B2001, 105, 4558.(22) Kim, S. H.; Misner, M. J.; Xu, T.; Kimura, M.; Russell, T. P.AdV.
Mater. 2004, 16, 226.(23) Xuan, Y.; Peng, J.; Cui, L.; Wang, H.; Li, B.; Han, Y.Macromolecules
2004, 37, 7301.(24) Brandrup, J., Immergut, E. H., Eds.Polymer Handbook, 3rd ed.; John
Wiley & Sons: New York, 1989.(25) Maier, B.; Ra¨dler, J. O.Rhys. ReV. Lett. 1999, 82, 1911.(26) Maier, B.; Ra¨dler, J. O.Macromolecules2001, 34, 5723.(27) The FFT on the TRANS images was performed via Gwyddion, a free
SPM data analysis framework developed under the terms of the GNUGeneral Public License.
(28) The angle between chain orientation and the orientation of the lamellarstructure is in the 0-90° range. For a calculated value (R) larger than90°, we use 180° - R as the angle.
(29) Helfand, E.; Tagami, Y.J. Chem. Phys.1972, 56, 3592. Helfand, E.;Wasserman, Z. R.Macromolecules1976, 9, 879.
(30) We followed the same method to calculate the FWHM of PMMA-Pein the PMMA matrix. FL images show that the PMMA-Pe has nopreferred orientation in the PMMA matrix. We analyzed 40 fluorescentspots, each of which corresponds to single PMMA-Pe chains, andaveraged allRg values.
(31) The values ofRg obtained from the analysis of the FL image containthe blurring effect of fluorescence due to the finite dimension of theaperture on the SNOM probe. As a consequence, the determined valuesof Rg are larger than those measured by the small-angle neutronscattering (SANS).
(32) Yang, J.; Winnik, M. A.; Pakula, T.Macromol. Theory Simul.2005,14, 9.
(33) After we submitted this manuscript toMacromolecules, the reviewersraised questions about the possible distortion in the FL images in ourSNOM experiments. We believe this issue is worth a brief discussionin this paper. Therefore, we added the discussion of the possible imagedistortion as an independent section at the end of this paper.
MA071350+
7580 Yang et al. Macromolecules, Vol. 40, No. 21, 2007