local understandability final
TRANSCRIPT

7/25/2019 Local Understandability Final
http://slidepdf.com/reader/full/local-understandability-final 1/16
See discussions, stats, and author profiles for this publication at: http://www.researchgate.net/publication/220921190
Cognitive Complexity in Business ProcessModeling
CONFERENCE PAPER · JUNE 2011DOI: 10.1007/978-3-642-21640-4_34 · Source: DBLP
CITATIONS
13READS
55
2 AUTH O RS , INCLUDING:
Kathrin Figl
Wirtschaftsuniversität Wien
66 PUBLICATIONS 244 CITATIONS
SEE PROFILE
Available from: Kathrin FiglRetrieved on: 17 December 2015
7/25/2019 Local Understandability Final
http://slidepdf.com/reader/full/local-understandability-final 2/16
Cognitive Complexity in Business ProcessModeling
Kathrin Figl 1 and Ralf Laue 2
1 Vienna University of Economics and Business Administration, [email protected]
2 Computer Science Faculty, University of Leipzig, [email protected]
Abstract. Although (business) process models are frequently used topromote human understanding of processes, practice shows that under-standing complex models soon reach cognitive limits. The aim of this
paper is to investigate the cognitive difficulty of understanding differ-ent relations between model elements. To allow for empirical assessmentof this research question we systematically constructed model sets andcomprehension questions. The results of an empirical study with 199students tend to suggest that comprehension questions on order andconcurrency are easier to answer than on repetition and exclusiveness.Additionally, results lend support to the hypothesis that interactivity of model elements inuences cognitive difficulty. While our ndings shedlight on human comprehension of process models, they also contributeto the question on how to assure understandability of models in practice.Key words: Business Process Models, Understandability, Cognitive Com-plexity
1 IntroductionBusiness process models (BPM) serve as a basis for communication betweendomain experts, business process analysts and software developers. To fulllthis purpose, such models have to be easy to understand and easy to maintain.Comprehension of process models is relevant for all tasks in which users interactwith models, as for example in business process redesign or implementation of process-aware systems.
Many researchers have recently turned to investigate comprehensibility of process models and investigated various inuence factors as modularity [1], do-main knowledge [2] and notational aspects [3]. In addition, various complexitymetrics have been proposed for BPM in the past years (see [4, 5] for the discus-sion of relevant concepts and [6] for a comprehensive survey on related work).It has been shown that some of these metrics are signicantly correlated withthe number of control-ow errors in a BPM [5] and with the understandabilityof a BPM, measured in terms of correctly answered questions about the model[7, 8]. [2] and [7] discuss how global measures (like the number of split nodes ina BPM) affect the understandability of a BPM.
7/25/2019 Local Understandability Final
http://slidepdf.com/reader/full/local-understandability-final 3/16
However, the scope of existing studies is limited, because the metrics used inthese studies assign single (global) values to a BPM to describe its complexity.Ananda et al. [9] state: “Although studying the overall comprehensibility of a model is important, from a language evolution perspective it is even morerelevant to discover which elements of a notation work well and which do not.”With this paper, we want to give some rst answers on the question which relations between model elements in a BPM are difficult to understand.
Despite increasing consciousness about the need to consider comprehensibil-ity of process models, little research has been undertaken in order to improveand understand the relationships between modeling elements and comprehensi-bility. In this paper, we want to explore comprehensibility as a local property.This means that we measure the comprehensibility of a specic part of a BPMinstead of the model as a whole. This way, we seek to investigate, which rela-tions between elements in a graphical BPM are difficult to understand. In theresearch area of software complexity metrics, similar research has been published
by Yang et al. [10]. Research results suggest that local complexity metrics couldbe a promising predictor for understandability. Therefore, we address the ques-tion as to when or under what circumstances similar relationships with localmetrics will emerge in the context of BPM.
Our motivation is to complement the existing stream of work on improvingthe comprehensibility of BPM by examining local comprehensibility. In contrastto existing research such as [7, 8] we assign own metrics to each comprehensionquestion in our study, not to the models as a whole.
The remainder of this paper proceeds as follows: First, comprehensibility of process model elements and their relationships is placed in context with a reviewof relevant theoretical perspectives. Next, we articulate a research model. Then,we discuss design and ndings of an empirical study. The nal section discussesthe limitations of our work and presents the implications of our research.
2 Measuring the Cognitive Load of Process Models
2.1 Comprehensibility and Cognitive Load Theory
For dening the term comprehensibility , we adapt the denition for understand-ing of computer programs given by Biggerstaff [11] by relating it to the modelingcontext and replacing the word “program” by “BPM”:
“A person understands a BPM when they are able to explain the BPM, itsstructure, its behavior, its effects on its operational context, and its relationshipsto its application domain in terms that are qualitatively different from the tokensused to construct the BPM in a modeling language.”
Further popular explanations of the term comprehensibility such as “the easewith which the . . . model can be understood” [12] suggest that cognitive effortis an important factor determining model comprehensibility and should be aslow as possible. Based on the complex relationships and control ow logic of organizational processes in practice, understanding of BPM is a task likely todemand high cognitive effort.
7/25/2019 Local Understandability Final
http://slidepdf.com/reader/full/local-understandability-final 4/16
For conceptualizing model comprehensibility in greater detail we draw onthe notion that understanding of a fact in a BPM becomes more difficult if the number of model elements that need to be attended to increases. This isbacked by the work on Cognitive Load Theory. Cognitive Load Theory buildson the fact that the capacity of the working memory at a given point of time islimited [13]. If the amount of information to be processed exceeds this capacity,comprehension is affected negatively. It has been shown that an instructionaldesign that avoids an overload of the working memory makes understanding of the instructional material easier [14]. Prior research on various visual languageslike entity-relationship models [15] or UML class diagrams [16] suggests thatreducing the cognitive load improves the understandability of visual models.
2.2 Inuence Factors for Model Comprehensibility
To determine the relevant factors for the cognitive load involved in understanding
elements and their relations in a model, we draw on work on BPM metrics.
Relations between Elements Based on the similarity between structures insoftware code and process models, research results on code comprehensibilitycan serve as a profound basis for analyzing BPM comprehensibility. A largebody of research exists on the cognitive complexity of different programmingelements. Different control structures demand e.g. different levels of effort forunderstanding [17]. Little research has been undertaken to investigate the cog-nitive difficulty of different understanding tasks in process models. First effortshave been made by Melcher et al. [18]. In an experiment with 42 students readinga rather small BPM (containing 12 activities) they found that understandabilityvalues for questions on the four aspects order, concurrency, repetition and exclu-siveness are different. As this is the only study in this context, further empiricalresearch still needs to be done. Additionally, there is another strand of researchstemming from the area of cognitive psychology, relating control ow elementsand cognitive effort. Research on deductive reasoning has shown that systematicfallacies (so called ‘illusory inferences’) can occur when individuals constructor interpret mental models on premises concerning modeling-level connectives(like conjunctions or disjunctions) [19]. This situation may also be present forexternalized visual BPM and may lead to higher error rates for understandingspecic control ow elements. The current body of literature on error analysisof process models suggests for instance the existence of systematic reasoningfallacies concerning routing elements as inclusive OR gateways [20].
Element Interactivity The cognitive load that a task imposes on a person isrepresented by the number of elements that have to be attended to. This num-ber is determined by the level of interactivity between the elements. Elementsinteract if they are interrelated such that it is necessary to assimilate them si-multaneously [21]. High interactivity leads to high cognitive load because eachelement has to be processed with references to other elements. On the other

7/25/2019 Local Understandability Final
http://slidepdf.com/reader/full/local-understandability-final 5/16
1
4
2
3
5
6
7
9
8
10
11
12
13
14
15 16
19
18
17
21
20
A
BC
D
E
F
G H
I
LK
M
N
= AND
= exclusive OR
Fig. 1. business process model, structured into regions
Fig. 2. PST for the model shown in Fig. 1
hand, cognitive load is low if the elements can be processed serially withoutreferring to other elements.
In order to dene a measure for the cognitive load resulting from the effortto understand the relation between two elements in a BPM, we follow the idea
of Vanhatalo et al. [22] to decompose the BPM into canonical fragments witha single entry and a single exit. These fragments can be arranged in a process-structure tree (PST) such that there is exactly one PST for each BPM. Fordetails we refer to [22], but we introduce the concept of a PST by an example.Fig. 1 shows a BPM (similar to the ones used in our experiment) and its canonicalfragments that form the PST. Additionally to the fragments that are markedwith dotted boxes, all single activities and the model as a whole are canonicalfragments in the PST. From the example, it can be seen that canonical fragmentscan be nested. For example, the fragments D and E are within a larger fragmentC. The depth of the nesting shows how many routing constructs in the BPMhave to be understood in order to reason about the execution of an activity. ThePST of the model is shown in Fig. 2. For a better readability, the control nodes(called gateways in BPMN) are omitted in this graph.
We argue that the distance between two elements in the PST can serve asa measure for the interactivity between those elements. Each region in the PSTrepresents one concept (for example the concept of an exclusive choice or theconcept of parallel branching) that the reader of the model has to understand.If elements are located in deeply nested control-ow blocks, the reader has to

7/25/2019 Local Understandability Final
http://slidepdf.com/reader/full/local-understandability-final 6/16
understand a large number of concepts before being able to answer a questionon the relation between those elements. In this case, the path between the twoelements in the PST contains many arcs. On the other hand, if both elements arelocated into the same control block without additional nesting, they will also bein the same region of the PST, i.e. there are exactly two arcs in the PST betweenthe elements. The assumption that the PST-distance can be an indicator of thedifficulty to reason about a relation between two model elements is in line withthe conceptual model of cognitive complexity by Cant et al. [23] that has beendeveloped with respect to understanding software. Cant et al. discuss nestingwithin a a piece of software and argue that “the number of ‘steps’ [groups of control-ow statements; note from the authors] involved indicates the numberof chunks which need to be considered” [23].
Formally, we dene the PST-distance between two elements A and B of aBPM as the number of arcs between A and B in the PST minus one. This meansthat elements in a sequence or in the same control block have a PST-distance of
1. For example, in Fig. 1 the activities 17 and 18 which are executed in parallelinside the same control block have a PST-distance of 1 while the activities 16and 17 (the latter is inside the fragments M and N) have a PST-distance of 3.
Element Separateness: Cut-Vertices A second aspect we take into accountwhen discussing the interactivity between elements A and B in a BPM is thespecial case where a single arc in the BPM separates the BPM into two disjointparts P 1 and P 2 such that A P 1 and B P 2 .
In terms of graph theory this means that the connected graph G that formsthe BPM has a so-called cut-vertex on a path from A to B , i.e. a vertex thatwhen removed causes that the remaining graph is not connected anymore. If such a cut-vertex between A and B exists, the mental model of the relationshipsbetween A and B becomes much easier, because A is located “before” and Bis located “after” an easy-to-spot reference point (the cut-vertex). For example,in Fig. 1 it is easy to see that activity 7 cannot be executed after activity 17.Because of the cut-vertices before and after activity 16, this can be concludedwithout analyzing the control structures in which the activities 7 and 17 areembedded. The assumption that the presence of a cut-vertex makes it easier tounderstand a model is backed by results by Mendling and Strembeck [2] whofound that a large number of cut-vertices in a model has a positive effect on itsunderstandability.
3 Research Model
Having laid out the relevant theoretical factors related to local understandabilityof process models, we will now draw several propositions to suggest how thesefactors will inuence cognitive difficulty in comprehension tasks. Prior researchon process model comprehension has almost exclusively focused on global modelunderstanding, a focus of study that we extend in this paper by looking at theunderstandability of relations between elements in a process model.

7/25/2019 Local Understandability Final
http://slidepdf.com/reader/full/local-understandability-final 7/16
Model Elements
F: Relations betweenElements
O: Item Type Cognitive Difficulty
• Order
• Concurrency
• Exclusiveness
F: Objective CognitiveDifficulty
i i l• Repetition
i i l
F : Sub ectiveCo nitiveF: Element Interactivity
i i iDifficulty
O : Subjective Rating ofCognitive Load
O: Process-Structure-Tree Distance
F: ElementSeparateness
O: Cut-Vertex
F: Theoretical Factor O: Operationalisation of Factor
Fig. 3. Research Model
Fig. 3 shows our research model. The model proposes that the cognitivedifficulty of understanding the relation between model elements is inuenced bythree factors: the type of relation between elements that has to be understood,the interactivity and the separateness of elements.
Following the research model, we now discuss three expected effects. As weanticipate similar effects on both objective as well as subjective side of the de-pendent variable ’cognitive difficulty’, we formulate hypotheses for cognitive dif-culty in general. First, we turn to different relations between elements. Westate:
H1. The type of relation between elements that has to be understood (or-der, concurrency, repetition, exclusiveness) will have an inuence on cognitivedifficulty of understanding.
Second, we turn to the interactivity between elements. We expect that itis more difficult to understand relations between elements with a large PST-distance between them. Therefore, we have:
H 2. The interactivity between elements (high PST-distance) will be posi-tively associated with the cognitive difficulty of understanding the relation be-tween them.
Additionally we hypothesize if separateness of elements is low, understandingtheir relation gets easier:H 3. High separateness between elements (existence of a cut-vertex between
those elements) will be negatively associated with the cognitive difficulty of understanding the relations between them.

7/25/2019 Local Understandability Final
http://slidepdf.com/reader/full/local-understandability-final 8/16
4 Research Method
4.1 Design and Measures
To test our hypotheses, we conducted an experiment in which the participantshad to answer questions on a BPM. Model understandability (in terms of cor-rectly answered questions) and perceived subjective difficulty were measuredat each of the four levels order , concurrency , repetition and exclusiveness of thefactor “type of comprehension question”. To manipulate the main factor we con-structed comprehension questions targeting the four different relations betweenactivities.
Comprehension Questions When selecting the questions, we took intoconsideration the work of Melcher et al. [18]. However, in comparison to [18]we formulated questions consistently, so that participants always had to con-sider two model elements (two activities) and their relationship for answeringa question. Additionally we tried to use every-day-language in the questions.We used two different wordings to ask for the four relations between activities.To demonstrate the type of questions we refer to two activities with alphabeticnames, although A and B were replaced with activity labels in the test material:
– Concurrency:• “A and B can be executed at the same point of time.”• “A and B can be executed in parallel.”
– Exclusiveness:• “In one process instance, A as well as B can be executed.”• “The activities A and B are mutually exclusive.”
– Order:• “If A as well as B are executed in a process instance, then A has to be
nalized, before B can start.”• “If A as well as B are executed in a process instance, then A is executed
before B.”– Repetition:
• “A can be executed more often than B.”• “In each process instance A is executed exactly as often as B.”
We took care that the wording in the questions is understandable, and we rana pre-test in order to make sure that the participants understood the questions[24]. The comprehension questions, to which participants had to give a responseof “right”, “wrong” or “I don’t know”, were selected so that each activity wasaddressed approximately once in each diagram. The response option “I don’tknow” was included to lower guessing probability.
Questionnaire Construction For each model in the questionnaire we posedthe same eight types of comprehension questions. Despite the use of the samewording, it is obvious that there is a large number of possibilities how to askthese questions, because any two activities can be targeted with the same ques-tion. We identied two basic variations: 1) the statement given in the questionis correct or wrong and 2) the location of the chosen activities. For varying the

7/25/2019 Local Understandability Final
http://slidepdf.com/reader/full/local-understandability-final 9/16
Version A Version B• Concurrency 1: L and M can be executed at
the same point of time. (correct, close) • Concurrency 1: D and P can be executed
at the same point of time. (wrong, distant) •
Concurrency 2: G and S can be executed in parallel. (wrong, distant) •
Concurrency 2: G and H can beexecuted in parallel. (wrong, close) • Exclusiveness 1: In one process instance E as
well as F can be executed. (correct, close) • Exclusiveness 1: In one process instance
K as well as S can be executed. (correct,distant)
• Exclusiveness 2: The process steps C and Rare mutually exclusive. (wrong, distant)
• Exclusiveness 2: The process steps E andF are mutually exclusive. (wrong, close)
• Sequence 1: If T as well as J are executed ina process instance, then T has to be finalized,
before J can start. (wrong, distant)
• Sequence 1: If A as well as C areexecuted in a process instance, then A hasto be finalized, before C can start.(correct,close)
• Sequence 2: If B as well as A are executed ina process instance, then B is executed beforeA. (wrong, close)
• Sequence 2: If B as well as T areexecuted in a process instance, then B isexecuted before T. (correct, distant)
• Repetition 1: U can be executed more oftenthan D. (correct, distant)
• Repetition 1: L can be executed moreoften than M. (wrong, close)
• Repetition 2: In each process instance Q isexecuted exactly as often as P. (correct, close)
• Repetition 2: In each process instance Ois executed exactly as often as I. (correct,distant)
A
B DC
E F
G IH J
K
L M N
O
P
SRQ
UT
Fig. 4. Example of Asking Model Comprehensability Questions
location of activities consistently, we decided to use pairs of activities, whichare either close ( ≤ 1 activity between them) or distant ( > 1 activity betweenthem). As a consequence, we constructed the test material, such that each ques-tion was used once in each of four constellations (correct-close, correct-distant,wrong-close, wrong-distant), leading to 32 different question instances.
To ensure reliability of measurement we used a replication of the study design(questionnaire version A and B). In the replication, exactly the same models andcomprehension questions were used, but the questions were asked for differentactivities in another constellation. Fig. 4 demonstrates how questions were askedfor a specic process model.
Measured Variables The outcome of our main dependent variable com-prehension is cognitive per se, i.e. it is created in the viewer’s cognition andnot directly observable. Therefore, it can only be measured indirectly or viacomprehension questions. According to Aranda et al. [9] there are four variablesthat can measure comprehensibility: correctness (did the participant give theright answer?), condence (certainty of the participant in his answers), perceived difficulty (to answer the question, as subjective judgment by the participant)and time (required to give an answer). In our experiment, we chose to use themain objective and subjective measure of cognitive difficulty, viz. the percentageof correct answers (correctness) as objective measure and the user’s rating of cognitive load as subjective measure (perceived difficulty). To measure the per-ceived difficulty, we asked the users to rate it on a 7-point Likert-scale (with thelabels “very difficult”, “difficult”, “rather difficult”, “neither difficult nor easy”,“rather easy”, “easy” and “very easy”).

7/25/2019 Local Understandability Final
http://slidepdf.com/reader/full/local-understandability-final 10/16
4.2 Materials
Questionnaire Parts We used a pencil-and-paper questionnaire including threedifferent sections in the experiment. The rst section comprised items to obtaininformation about participants’ demographic data, academic qualications andmodeling experience. Participants were asked about the number of years theyhad worked in the IT sector and the extent to which they had previously beeninvolved with modeling in the context of education and work. After the rstsection, the questionnaire included a tutorial on process modeling, which coveredall aspects the participants would need to know to perform the comprehensiontasks. The third section included four different models with eight correspondingcomprehension tasks per model. The amount of models used was determinedby the selection of the comprehension questions during the experiment, as wewanted to ask 32 different instances of comprehension questions. To avoid ordereffects due to decreasing motivation or concentration of participants, we used twodifferent scramblings. Models as well as comprehension questions were presentedin different order, respectively.
Model Domain The four models were selected from different domains suchthat we could expect that they are understandable for an average student withno special domain knowledge.
Model Language Because it has been shown that the graphic style of amodeling language can inuence the understandability of the model [25], wepresented BPM modeled using different graphic styles. The models were mod-eled in different modeling directions and with three different routing symboldesigns (UML Activity Diagrams, BPMN and Event-Driven Process Chains).These variations were included for allowing to generalize ndings beyond spe-cic layout and design restrictions. Additionally, they served as an experimentalcontrol to prevent a possible bias due to choosing only one modeling direction
and routing symbols from a specic modeling language for all diagrams.Model Layout We took into account that a change in the graphical layoutof a BPM can inuence its comprehensibility [9]. For this reason, we took carethat the graphical layout of the models did not impose additional challenges tothe reader.
Model Size Each of the four models used contained 21 activities. The modelsize was held constant for all models, because this variable is likely to have aninuence on cognitive load of answering understandability questions.
4.3 Participants
A total of 199 business students participated in this study (125 males, 74 fe-males), aged 23.5 years on average. Of all respondents, 36% were undergraduatestudents, 60% were master’s level students and 4% had already completed theirmaster’s degrees. 67% had received training in modeling at university with 1.6credit hours on average. About half of participants were familiar with Event-Driven Process Chains (60%) and UML Activity Diagrams (50%). 27% hadwork experience in the IT industry and 10% had already worked with BPMs.
7/25/2019 Local Understandability Final
http://slidepdf.com/reader/full/local-understandability-final 11/16
5 Results
We rst screened the data for its conformance with the assumptions of our sta-tistical test. One assumption behind the use of ANCOVAs is that the variablesare normally distributed. Kolmogorov-Smirnov tests conrmed that the depen-dent variables “percentage of correct answers” and “perceived difficulty” metthis criterion ( p = 0 .105 and p = 0 .722).
For each dependent variable, we ran a univariate ANCOVA with “relationsbetween elements” and “element separateness” as independent factors and “el-ement interactivity” as a covariate. According to the respective hypothesis, thepercentage of correct answers and the perceived difficulty were the dependentvariables. The ANCOVAs allow us to test the inuence of the three predictorvariables (two independent variables and a covariate) on the dependent variablesas well as possible interaction effects. We use “element interactivity” as a co-variate, because it is a continuous variable, which co-varies with the dependentvariables percentage of correct answers ( r = − 0.37, p = 0 .002) and perceiveddifficulty ( r = − 0.61, p < 0.001). Therefore, the covariate accounts for variancein the dependent variables and the inclusion of the covariate can increase thestatistical power of the procedure.
5.1 Results for Hypothesis 1
ANCOVA results indicate that there is a effect of different types of relationsbetween model elements (order, concurrency, repetition and exclusiveness) oncognitive difficulty of understanding their relation (H1). While there is only atrend for the percentage of correct answers (F 3,55 = 2.65, p = 0 .058), the effect
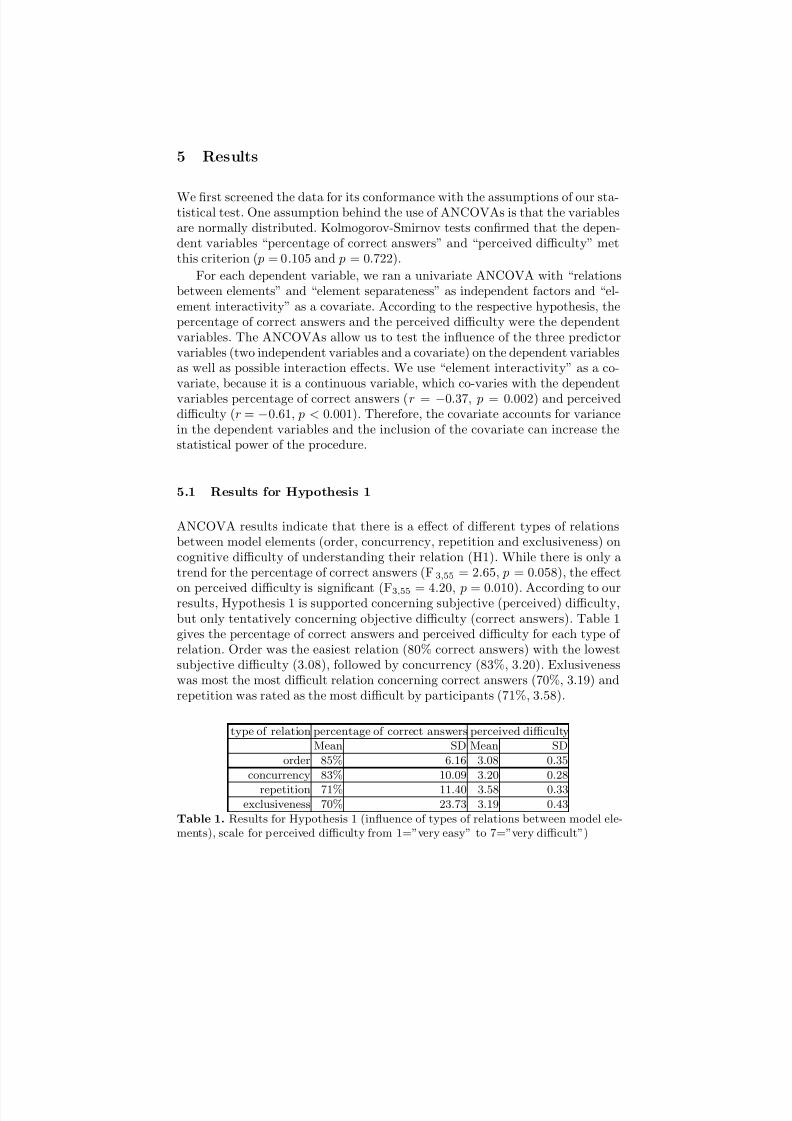
on perceived difficulty is signicant (F 3,55 = 4.20, p = 0 .010). According to ourresults, Hypothesis 1 is supported concerning subjective (perceived) difficulty,but only tentatively concerning objective difficulty (correct answers). Table 1gives the percentage of correct answers and perceived difficulty for each type of relation. Order was the easiest relation (80% correct answers) with the lowestsubjective difficulty (3.08), followed by concurrency (83%, 3.20). Exlusivenesswas most the most difficult relation concerning correct answers (70%, 3.19) andrepetition was rated as the most difficult by participants (71%, 3.58).
type of relation percentage of correct answers perceived difficultyMean SD Mean SD
order 85% 6.16 3.08 0.35concurrency 83% 10.09 3.20 0.28
repetition 71% 11.40 3.58 0.33exclusiveness 70% 23.73 3.19 0.43
Table 1. Results for Hypothesis 1 (inuence of types of relations between model ele-ments), scale for perceived difficulty from 1=”very easy” to 7=”very difficult”)

7/25/2019 Local Understandability Final
http://slidepdf.com/reader/full/local-understandability-final 12/16
PST-distance cases percentage of correct answers perceived difficultyMean SD Mean SD
1 19 80.2% 20.62 2.89 0.312 13 79.5% 10.35 3.30 0.263 15 76.9% 15.06 3.42 0.274 5 76.4% 76.38 3.47 0.545 6 64.9% 64.85 3.55 0.296 4 74.8% 74.80 3.47 0.367 2 79.6% 79.64 3.54 0.28
Table 2. Results for Hypothesis 2 (Inuence of PST-Distance)
5.2 Results for Hypothesis 2
As expected, the covariate PST-distance (element interactivity) has an inuence
on the percentage of correct answers (F 1,55 = 4.32, p = 0 .042). Additionallythere is a highly signicant effect on perceived difficulty (F 1,55 = 22.04, p <0.001). Table 2 shows the average percentages of correct answers and the averageperceived difficulties across different PST-distances. Hypothesis 2 predicted thatPST-distance will be positively associated with cognitive difficulty. Therefore,Hypothesis 2 is supported.
5.3 Results for Hypothesis 3
79.9% of the questions about two activities with a cut-vertex between themhave been answered correctly, compared to 75.8% of the questions about twoactivities without a cut-vertex. Although the difference between means shows inthe expected direction, the results of the ANCOVA indicate that this differenceis not statistically signicant and that there is also no signicant inuence onperceived difficulty. Moreover, there are also no interaction effects of “elementseparateness” (cut vertex) with “relations between elements”.
Therefore, there is not enough evidence to support Hypothesis 3, which ex-pected that the presence of a cut-vertex makes it easier to answer a question.
6 Discussion
This study provides empirical results on the inuence of different relation typesof elements, their interactivity and their separateness on cognitive difficulty of understanding the relation between elements.
In line with our predictions in Hypothesis 1, we found that different controlstructures in a BPM (like order or concurrency) differ according to their difficultyto be understood. Our results are in line with [18]. However, results are notdirectly comparable, as we used different wordings of possible understandabilityquestions based on possible issues concerning ambiguousness (see [24] for details)and consistently addressed two model elements in the questions.

7/25/2019 Local Understandability Final
http://slidepdf.com/reader/full/local-understandability-final 13/16
We further found that users perceive the relation between elements with alarger PST-distance as more difficult to understand. This effect has not beenresearched so far but is comparable to the discussion whether the nesting levelin a BPM has an inuence on its understandability. Mendling et al. [7, 8] did notfound a signicant relationship between the nesting level and the understand-ability of a model. However, while Mendling et al. regarded the nesting level asa global attribute of a BPM, we related the PST-distance to the model elementswe asked about.
While our results on Hypothesis 2 support the theory that the PST-distanceis correlated with the difficulty of a task, the results are still not yet conclusive.
In particular, in our experiment there were too few cases with a PST-distancegreater than 3 to come to reliable results about deeply nested model elements.Furthermore, in the models we used for our experiment, the presence of a cut-vertex was more likely between elements with a large PST-distance (like theactivities 10 and 20 in Fig. 1). This can explain the fact that understanding for
the elements with PST-distance 6 and 7 was better than for those elements withPST-distance 5 (see Tab. 2). Future research on this question will be necessary.An interesting observation was that in some cases, a small PST-distance can
even mislead to a wrong conclusion. For the model shown in Fig. 1, we askedthe question whether both activity 5 as activity 6 can occur in the same processinstance. Because of the exclusive OR-gateway before those activities, 76% of the participants answered “no”. We assume that they did not bother to look atthe parts of the model outside fragment E. Therefore they did not realize thatthis fragment is inside a loop and can be executed more than once. 3
Our results did not conrm an inuence of the existence of a cut vertex onthe cognitive difficulty of an understanding task (H3). This relationship has alsobeen discussed by other authors [7, 8, 2]. In contrast to our results, a similarexperiment by Mendling and Strembeck [2] provided support for the hypothesisthat a BPM with more cut-vertices is easier to be understood. Further studies [7,8] yielded inconsistent results on this topic, so further research will be necessary.
From a more general perspective, our ndings highlight that reducing the cog-nitive load improves the understandability of process models as already demon-strated for other visual models [15, 16]. Additionally our results provide supportfor the contention that the cognitive process for understanding a model dependson the actual task being carried out. This has already been substantiated in theresearch area of software comprehension by the work of Gilmore and Green [26].
7 Limitations
As with all studies, the research results presented here are subject to a numberof limitations.
Model Size We acknowledge that our models might not be representativefor all kinds of BPM. Models from real projects are often much larger than the
3 A very similar observation has been reported in [7].

7/25/2019 Local Understandability Final
http://slidepdf.com/reader/full/local-understandability-final 14/16
ones used in our experiment. On the other hand, selecting rather simple modelsallowed us to keep the number of activities constant for all models and to avoidmodels that cannot be understood without the knowledge of a particular domain.
Questions Right/wrong questions can introduce a measurement error, be-cause on average 50% of the questions will be answered by guessing alone. Forthis reason, we left the possibility of checking “I don’t know”. Additionally, weacknowledge that for some questions users might have guessed the expected an-swer based on domain knowledge. Future research should collect similar data setsbased on models with meaningless activity labels like “activity XY” as suggestedin [27]. While we did not nd understanding problems during the pre-test, in theanalysis we realized that the statement “The activities A and B are mutuallyexclusive.” gives room for misunderstandings (“A and B can not be processedeither at the same time vs. both in the same process instance”). However, asthose questions did not lead to more wrong answers as the alternative questions(see Sect. 4.1), we refrained from excluding these questions from our data.
Participants The participants of our study were students who were famil-iar with the modeling languages, although they were not experts in this area.The results might differ if the experiment is replicated with experts in businessprocess modeling [28]. We tried to select participants for the experiment so thatthere was a variation of little to medium experience with conceptual model-ing, resembling potential users in practice. However, the results might not begeneralizable to the entire population of BPM users.
Selection of Inuence Factors The factors for BPM understanding wehave analyzed are not exhaustive. For example, we did not take into accountthe effect of the type of control structures (for example alternative or parallelbranching) that are nested in the PST-tree. As related papers on this subjectsuggest that this factor should be considered as well [23], future research couldexamine this topic in detail.
8 Implications and Conclusion
This study is one of the rst to investigate understandability as a local propertyin a model and denotes an important extension to the literature on inuence fac-tors for BPM understandability. Our main contribution is a rst analysis of thecognitive difficulty of different relations between elements (order, concurrency,repetition, exclusiveness) in process models. Prior research has predominantlylooked at global understandability of models and differences between models thatinuence understandability, in contrast we investigated local understandabilityof different items in a model.
Our results have implications for business process modeling practice andresearch. In terms of research, the results have an implication on the design of future experiments that measure understandability aspects of BPM. Our resultsdemonstrate that several aspects of question selection (as the selection of themodel elements and the type of the question) have an inuence on cognitivedifficulty. Implications of these results for researchers include exercising caution

7/25/2019 Local Understandability Final
http://slidepdf.com/reader/full/local-understandability-final 15/16
when aggregating answering rates of randomly chosen comprehension questionsto total comprehension measures for models. As the choice of questions mightsignicantly inuence comprehension scores, balanced selection and constructionof questions is highly relevant.
In addition, our work provides further evidence that high interactivity of ele-ments may heighten cognitive load and lower comprehensibility of BPM. If pos-sible, deep nesting of control-ow blocks should be avoided in order to make un-derstanding easier and – in the end – to improve the quality of BPM and reducemodeling errors. Research on modularity of BPM [1] suggests that decomposingcomplex models into smaller submodels can improve model comprehensibility.Additionally syntax highlighting [29] can be used to heighten comprehensibilityof deeply nested blocks.
Future research is needed to determine valid and reliable values for the cogni-tive difficulty of understanding specic relations between model elements. Thesevalues could make it possible to nally estimate understandability of models
without the need of a user evaluation. Looking ahead, exact comprehension val-ues could then be used to guide modeling tool developers to provide feedback oncognitive difficulty of models to users or to give hints on possible understand-ability problems in models.
References
1. Reijers, H., Mendling, J.: Modularity in process models: Review and effects. In:Proc. of the 6th Int. Conf. on Business Process Management, Springer (2008) 20–35
2. Mendling, J., Strembeck, M.: Inuence factors of understanding business processmodels. In: Business Information Systems. Volume 7 of LNBIP. Springer (2008)142–153
3. Genon, N., Heymans, P., Moody, D., Amyot, D.: Improving the cognitive effec-tiveness of the bpmn 2.0 visual syntax. (2010)
4. Gruhn, V., Laue, R.: Complexity metrics for business process models. In: 9thInternational Conference on Business Information, Springer (2006) 1–12
5. Mendling, J.: Metrics for Process Models: Empirical Foundations of Verication,Error Prediction, and Guidelines for Correctness. Volume 6 of LNBIP. Springer(2008)
6. Gonz alez, L.S., Rubio, F.G., Gonz´ alez, F.R., Velthuis, M.P.: Measurement in busi-ness processes: a systematic review. Business Process Management Journal 16(2010) 114–134
7. Mendling, J., Reijers, H.A., Cardoso, J.: What makes process models understand-able? In: Business Process Management, 5th International Conference. Volume4714 of LNCS., Springer (2007) 48–63
8. Reijers, H., Mendling, J.: A study into the factors that inuence the understand-ability of business process models. IEEE Transactions on Systems, Man, andCybernetics, Part A (2010)
9. Aranda, J., Ernst, N., Horkoff, J., Easterbrook, S.: A framework for empirical eval-uation of model comprehensibility. In: MISE ’07: Proceedings of the InternationalWorkshop on Modeling in Software Engineering. (2007)

7/25/2019 Local Understandability Final
http://slidepdf.com/reader/full/local-understandability-final 16/16
10. Yang, J., Hendrix, T.D., Chang, K.H., Umphress, D.: An empirical validation of complexity prole graph. In: Proceedings of the 43rd annual Southeast regionalconference - Volume 1. ACM-SE 43, New York, NY, USA, ACM (2005) 143–149
11. Biggerstaff, T.J., Mitbander, B.G., Webster, D.: The concept assignment problemin program understanding. In: ICSE ’93: Proceedings of the 15th internationalConference on Software Engineering. (1993) 482–498
12. Moody, D.L.: Metrics for evaluating the quality of entity relationship models. In:Conceptual Modeling ER ’98. Number 1507 in LNCS. Springer (1998) 211–225
13. Kirschner, P.A.: Cognitive load theory: implications of cognitive load theory onthe design of learning. Learning and Instruction 12 (2002) 1–10
14. Sweller, J.: Cognitive load during problem solving: Effects on learning. CognitiveScience 12 (1988) 257–285
15. Moody, D.L.: Cognitive load effects on end user understanding of conceptual mod-els: An experimental analysis. In: Proceedings of 8th East European Conferenceon Advances in Databases and Information Systems, ADBIS 2004. Number 3255in LNCS, Springer (2004) 129–143
16. Genero, M., Manso, E., Visaggio, A., Canfora, G., Piattini, M.: Building measure-based prediction models for UML class diagram maintainability. Empirical Soft-ware Engineering 12 (2007) 517–549
17. Cant, S.N., Jeffery, D.R.: A conceptual model of cognitive complexity of elementsof the programming process. Information and Software Tech. 37 (1995) 351–362
18. Melcher, J., Mendling, J., Reijers, H.A., Seese, D.: On measuring the understand-ability of process models. In: Revised Papers of the BPM 2009 International Work-shops. Volume 43 of LNBIP., Ulm, Germany, Springer (2010) 465–476
19. Khemlani, S., Johnson-Laird, P.N.: Disjunctive illusory inferences and how toeliminate them. Memory & Cognition 37 (2009) 615–623
20. Mendling, J., Neumann, G., van der Aalst, W.M.P.: Understanding the occurrenceof errors in process models based on metrics. In: On the Move to MeaningfulInternet Systems 2007. Volume 4803 of LNCS. Springer (2007) 113–130
21. Sweller, J.: Cognitive load theory, learning difficulty, and instructional design.Learning and Instruction 4 (1994) 295 – 312
22. Vanhatalo, J., V¨ olzer, H., Koehler, J.: The rened process structure tree. Data &Knowledge Engineering 68 (2009) 793 – 81823. Cant, S., Jeffery, D., Henderson-Sellers, B.: A conceptual model of cognitive com-
plexity of elements of the programming process. Information and Software Tech.37 (1995) 351 – 362
24. Laue, R., Gaddatsch, A.: Measuring the understandability of business processmodels - are we asking the right questions? In: 6th International Workshop onBusiness Process Design. (2010)
25. Nordbotten, J.C., Crosby, M.E.: The effect of graphic style on data model inter-pretation. Inf. Syst. J. 9 (1999) 139–156
26. Gilmore, D.J., Green, T.R.G.: Comprehension and recall of miniature programs.International Journal of Man-Machine Studies 21 (1984) 31–48
27. Parsons, J., Cole, L.: What do the pictures mean?: guidelines for experimentalevaluation of representation delity in diagrammatical conceptual modeling tech-
niques. Data Knowl. Eng. 55 (2005) 327–34228. Petre, M.: Why looking isn’t always seeing: readership skills and graphical pro-gramming. Commun. ACM 38 (1995) 33–44
29. Reijers, H., Freytag, T., Mendling, J., Eckleder, A.: Syntax highlighting in businessprocess models. Decision Support Systems to appear (2011)