local transport plan 3
TRANSCRIPT
1
Local Transport Plan 3
Implementation Plan for Southampton 2015-2018
December 2015
2
Contents
Executive Summary ............................................................................................................................................................................................. 4
Part 1: Context for the 2015-18 Implementation Plan ........................................................................................................................................... 7
This Implementation Plan ................................................................................................................................................................................. 7
Part 2: Achievements of LTP3 Implementation Plan 2011-2015 ........................................................................................................................... 9
What Has Been Done ....................................................................................................................................................................................... 9
Funding Received .......................................................................................................................................................................................... 10
LTP3 Programme 2011-2015 ......................................................................................................................................................................... 11
Road Safety ................................................................................................................................................................................................ 12
Public Transport .......................................................................................................................................................................................... 13
Network Management ................................................................................................................................................................................. 16
Active Travel ............................................................................................................................................................................................... 18
Public Realm ............................................................................................................................................................................................... 20
Local Sustainable Transport Fund (LSTF) Programme 2011-2015 ................................................................................................................. 21
Asset Management & Maintenance............................................................................................................................................................. 24
Part 3: Implementation Plan 2015-2018 ............................................................................................................................................................. 25
LSTF Programme for 2015/16 ........................................................................................................................................................................ 25
LTP Programme 2015-2018 ........................................................................................................................................................................... 26
Road Safety ................................................................................................................................................................................................ 27
Public Transport .......................................................................................................................................................................................... 27
Network Management ................................................................................................................................................................................. 28
Smarter Choices ......................................................................................................................................................................................... 28
Active Travel ............................................................................................................................................................................................... 29
3
Public Realm ............................................................................................................................................................................................... 30
Asset Management & Maintenance............................................................................................................................................................. 30
Part 4: Looking Forward ..................................................................................................................................................................................... 34
Microsimulation Traffic Model ......................................................................................................................................................................... 34
LTP4 .............................................................................................................................................................................................................. 34
Local Plan ...................................................................................................................................................................................................... 34
Highways England .......................................................................................................................................................................................... 35
4
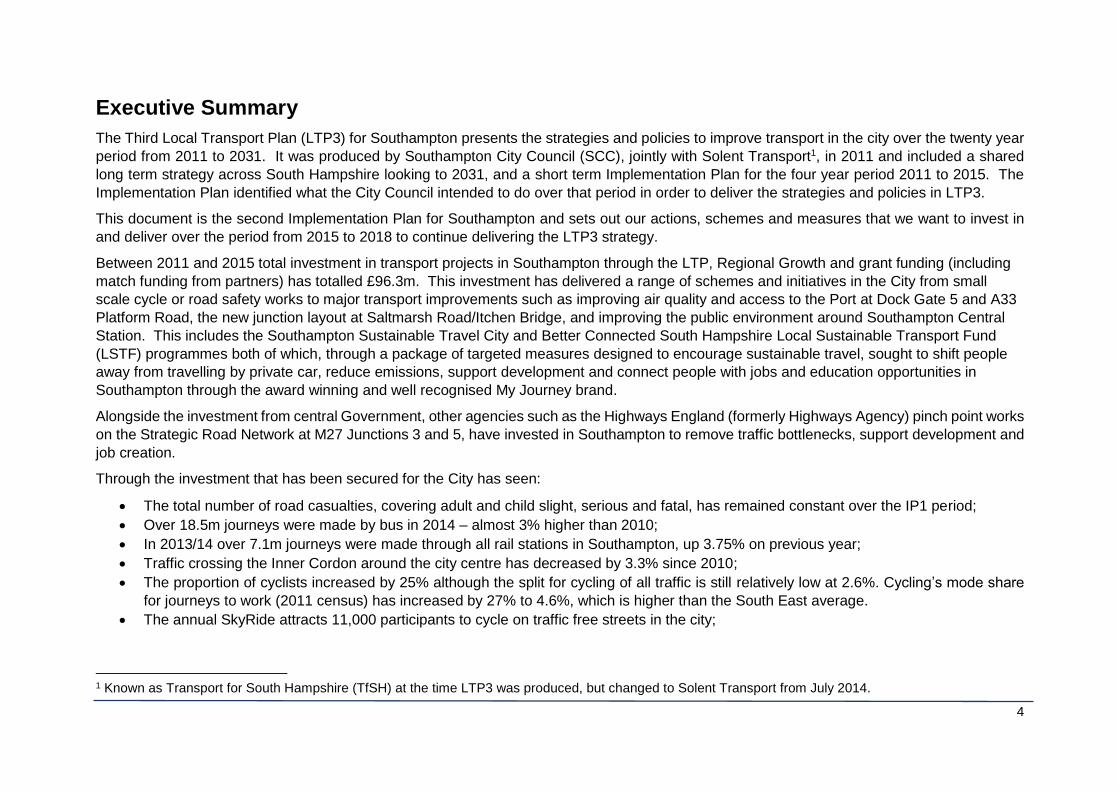
Executive Summary
The Third Local Transport Plan (LTP3) for Southampton presents the strategies and policies to improve transport in the city over the twenty year
period from 2011 to 2031. It was produced by Southampton City Council (SCC), jointly with Solent Transport1, in 2011 and included a shared
long term strategy across South Hampshire looking to 2031, and a short term Implementation Plan for the four year period 2011 to 2015. The
Implementation Plan identified what the City Council intended to do over that period in order to deliver the strategies and policies in LTP3.
This document is the second Implementation Plan for Southampton and sets out our actions, schemes and measures that we want to invest in
and deliver over the period from 2015 to 2018 to continue delivering the LTP3 strategy.
Between 2011 and 2015 total investment in transport projects in Southampton through the LTP, Regional Growth and grant funding (including
match funding from partners) has totalled £96.3m. This investment has delivered a range of schemes and initiatives in the City from small
scale cycle or road safety works to major transport improvements such as improving air quality and access to the Port at Dock Gate 5 and A33
Platform Road, the new junction layout at Saltmarsh Road/Itchen Bridge, and improving the public environment around Southampton Central
Station. This includes the Southampton Sustainable Travel City and Better Connected South Hampshire Local Sustainable Transport Fund
(LSTF) programmes both of which, through a package of targeted measures designed to encourage sustainable travel, sought to shift people
away from travelling by private car, reduce emissions, support development and connect people with jobs and education opportunities in
Southampton through the award winning and well recognised My Journey brand.
Alongside the investment from central Government, other agencies such as the Highways England (formerly Highways Agency) pinch point works
on the Strategic Road Network at M27 Junctions 3 and 5, have invested in Southampton to remove traffic bottlenecks, support development and
job creation.
Through the investment that has been secured for the City has seen:
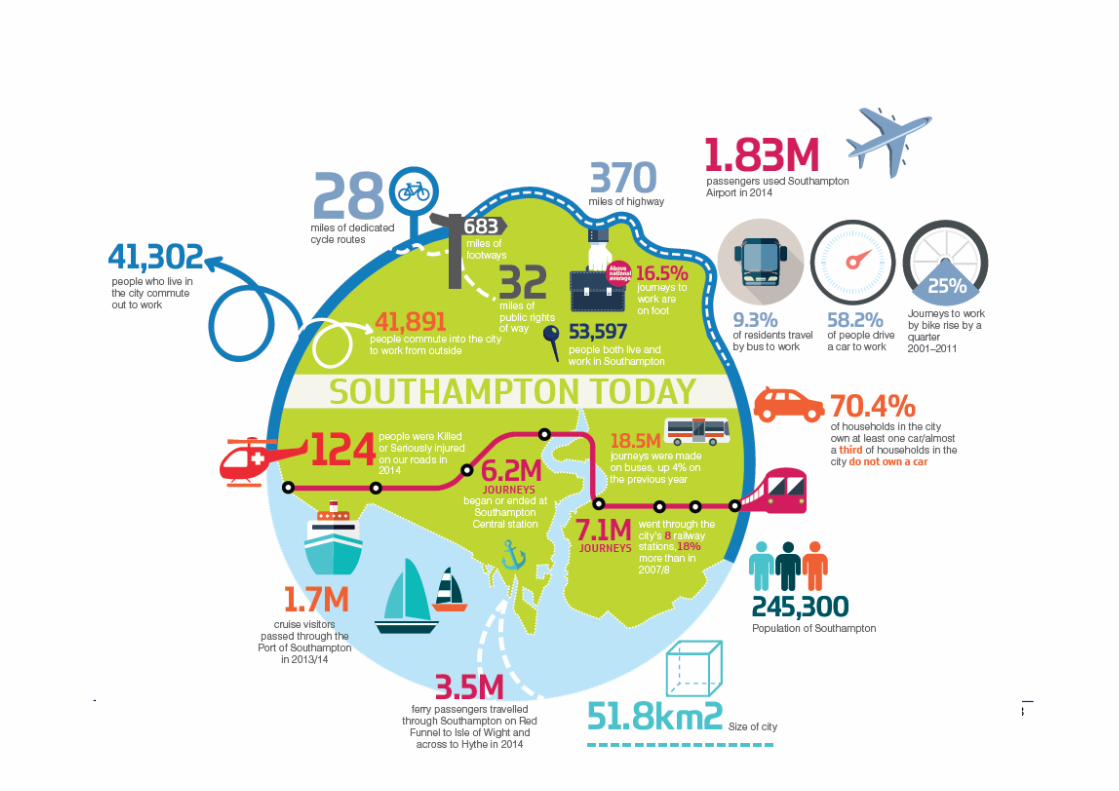
The total number of road casualties, covering adult and child slight, serious and fatal, has remained constant over the IP1 period;
Over 18.5m journeys were made by bus in 2014 – almost 3% higher than 2010;
In 2013/14 over 7.1m journeys were made through all rail stations in Southampton, up 3.75% on previous year;
Traffic crossing the Inner Cordon around the city centre has decreased by 3.3% since 2010;
The proportion of cyclists increased by 25% although the split for cycling of all traffic is still relatively low at 2.6%. Cycling’s mode share
for journeys to work (2011 census) has increased by 27% to 4.6%, which is higher than the South East average.
The annual SkyRide attracts 11,000 participants to cycle on traffic free streets in the city;
1 Known as Transport for South Hampshire (TfSH) at the time LTP3 was produced, but changed to Solent Transport from July 2014.
5
Evidence indicates that for every £1 spent on public realm improvements, such as Station Quarter North, £5 of private sector money is
levered into the city.
Progressing is being made to deliver major developments in Southampton, to 2013 a significant proportion of the City Centre Action Plan
(CCAP) has been implemented – with 50% of the targeted new office space delivered, 85% of the required retail space, and almost 50% of the
required citywide target for new homes has been built by 2014.
Following a successful bid, the Southampton Sustainable Travel City LSTF programme will continue for another year into 2015/16 carrying on
with the travel behaviour change programme focusing on shifting journeys to walking and cycling including an Urban Freight Strategy, rolling out
a Legible Cycle Network, continuing the My Journey brand and initiatives, and work with businesses and schools providing travel planning support.
The LTP3 Implementation Plan for 2015-18 will deliver localised transport improvements including:
New pedestrian crossing points and traffic calming features to make getting around safer supported by educational initiatives through the
Road Safety Partnership;
Working with bus operators in the City through the Bus Punctuality Task Force to improve access to bus services and bus service reliability
continuing to deliver measures on the Portswood Road and Shirley Road corridors and expanding the SolentGo smartcard;
Schemes to manage the City’s highway network through improved journey time reliability enhancing the Intelligent Transport Systems
(ITS) network, local capacity improvements to address key pinch points and measures to assist with uptake of alternative fuel vehicles, and
deliver a Low Emissions Strategy to reduce congestion and manage air quality on the main routes in the city;
Encourage more sustainable ways of getting to school or work through developing effective and quality Travel Plans and supporting these
with local infrastructure improvements;
Delivering new cycle routes along the City’s Strategic Cycle Corridors, improving pedestrian routes and safer routes to school;
Expanding the better public realm around Southampton Central Station along Kingsbridge Lane and Station Boulevard to connect the
station to the Cultural Quarter and West Quay;
Continued investment in maintaining the highway infrastructure to offset the deterioration of the City’s roads and footways, and a major
maintenance scheme at A33 Millbrook Roundabout, funded by Solent LEP, to improve reliable access to the Port.
Alongside the City Council’s investment, major projects are planned to commence by Highways England to reduce congestion on the strategic
road network.
Highways England’s Route Investment Strategy names four major scheme planned to be delivered close to Southampton to 2021 –
o M3 Junction 9-13 Managed Motorways; o M27 Junctions 3-11 Managed Motorways; o M271/A33 Redbridge Roundabout capacity improvements;
6
o M27 Southampton Junctions – to relieve pressure on the M27 corridor by improving the route into Southampton from M27 via A3024
consisting of five elements M27 Junction 8 capacity upgrade; A27 Windhover Roundabout capacity upgrade; A3024 Northam Rail Bridge – replacement of a major pinch point; A3024 Eastern Access Corridor – major highway improvements aimed at improving traffic capacity and accessibility into
Southampton; and Widening and realigning A27 Wide Lane Rail Bridge.
7
Part 1: Context for the 2015-18 Implementation Plan
Every Local Transport Authority (LTA) must produce a statutory Local Transport Plan (LTP). The LTP document outlines the LTA’s strategic
approach to manage and deliver transport now, and in the future, and where it intends to invest resources in transport schemes and initiatives.
Guidance states that a LTP should include a long-term strategy and a short-term Implementation Plan.
This Implementation Plan
The Third Local Transport Plan (LTP3) for Southampton, adopted in 2011, presents the strategies and policies to improve transport in the City
over the next twenty years setting out how we and our partners are going to manage and improve transport in the city. LTP3 is split into two
parts:
A twenty year transport strategy for the whole of south Hampshire for delivery up to 2031, developed jointly with Solent Transport covering
Southampton and Portsmouth as well as parts of Hampshire.
A four year implementation plan identifying transport schemes planned for delivery in Southampton. The current Implementation Plan
set out the planned interventions between 2011 and 2015.
This document is the second Implementation Plan (IP2) for Southampton and covers the period from 2015 to 2018. It sets out proposals for the
capital investment programme of schemes and measures to maintain, manage and improve the city’s transport network that will be implemented
over the next three years in order to achieve the sub-regional policies and local goals outlined within the LTP3 strategy. The IP2 will also assist
in meeting wider local and policy objectives to grow the economy, protect the environment and the city, and improve the health, safety and
equality for residents, businesses and visitors.
The IP2 will follow the LTP3 policies using seven themes in order to deliver the local goals and sub-regional outcomes required to achieve the
anticipated growth in Southampton in a sustainable manner:
1. Road Safety – ensuring the number of accidents is minimised;
2. Public Transport – SmartCards, buses, trains, taxis and ticketing;
3. Network Management, ITS & Enforcement – keeping the traffic moving, improving air quality and providing information for travellers;
4. Smarter Choices – encouraging people to choose the best mode of transport for their journey;
5. Active Travel – walking and cycling;
6. Asset Management – looking after our roads and footpaths; and
7. Public Realm – the appearance of roads, footpaths and the urban environment.
8
9
Part 2: Achievements of LTP3 Implementation Plan 2011-2015
What Has Been Done
Since the adoption of LTP3 in 2011 a range of transport projects have been implemented to support the LTP policies and new development
across the city. The projects have ranged in scope from small scale local schemes, such as road safety schemes to major junction
improvements and city wide behaviour change initiatives. They have been delivered using LTP funding, direct investment by transport
operators or developer contributions, and through additional funding opportunities (bids) over the past 4 years. The City Council, often working
in partnership with the Solent Transport authorities (Hampshire, Isle of Wight and Portsmouth) or third parties such as bus operators, Network
Rail, Highways England or ABP, has been able to secure this additional money to deliver the larger transformational projects. The City Council
has shown a consistent track record in securing additional funding and delivering these transport improvement projects to time and budget,
which help to keep the city’s transport network moving efficiently and effectively, whilst supporting economic development and the environment.
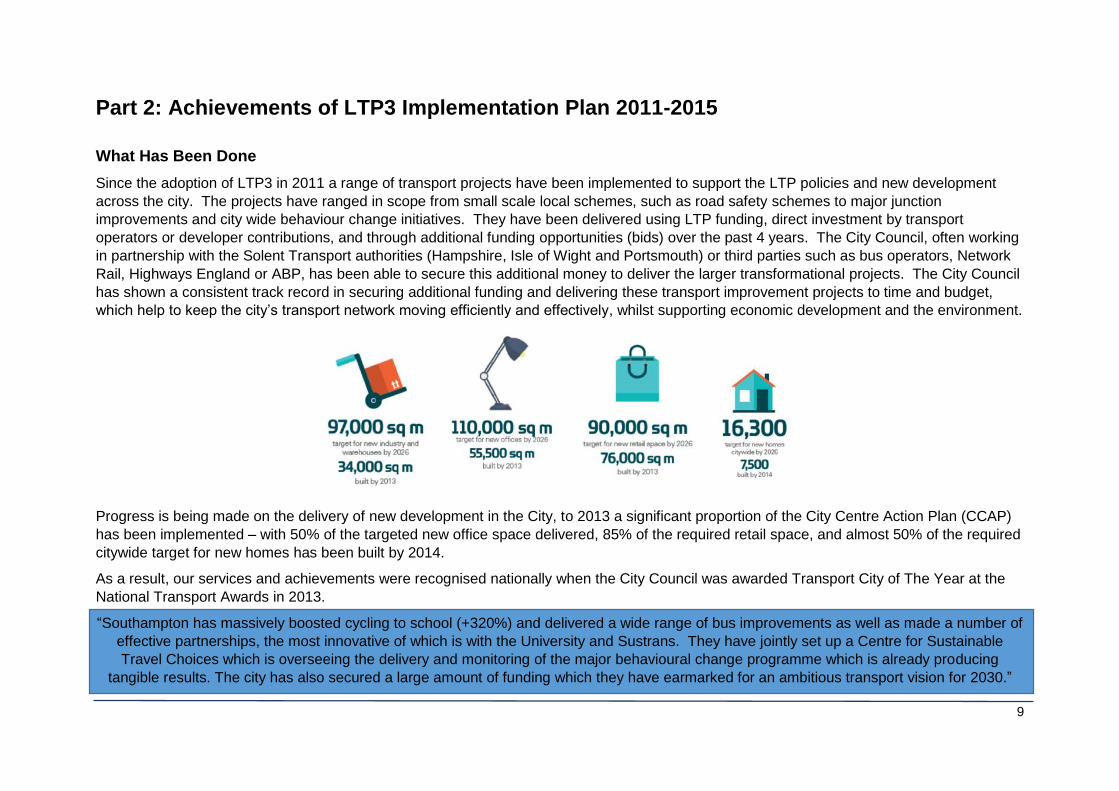
Progress is being made on the delivery of new development in the City, to 2013 a significant proportion of the City Centre Action Plan (CCAP)
has been implemented – with 50% of the targeted new office space delivered, 85% of the required retail space, and almost 50% of the required
citywide target for new homes has been built by 2014.
As a result, our services and achievements were recognised nationally when the City Council was awarded Transport City of The Year at the
National Transport Awards in 2013.
“Southampton has massively boosted cycling to school (+320%) and delivered a wide range of bus improvements as well as made a number of
effective partnerships, the most innovative of which is with the University and Sustrans. They have jointly set up a Centre for Sustainable
Travel Choices which is overseeing the delivery and monitoring of the major behavioural change programme which is already producing
tangible results. The city has also secured a large amount of funding which they have earmarked for an ambitious transport vision for 2030.”
10
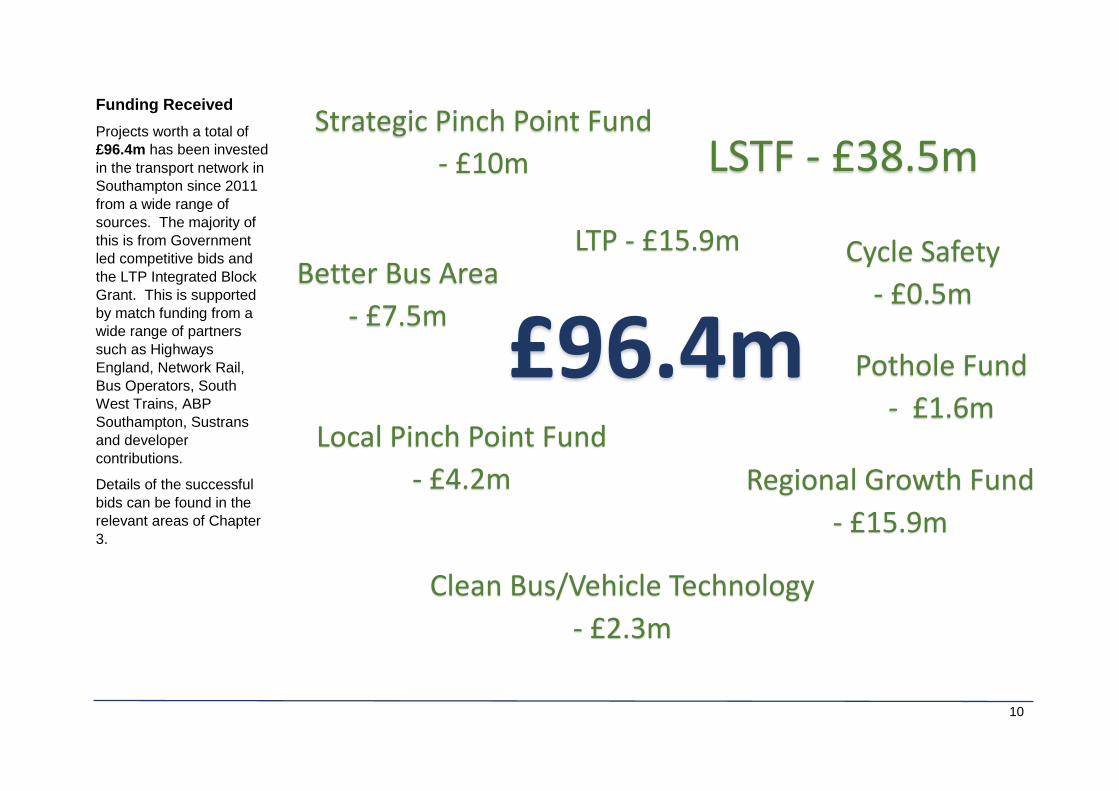
Funding Received
Projects worth a total of
£96.4m has been invested
in the transport network in
Southampton since 2011
from a wide range of
sources. The majority of
this is from Government
led competitive bids and
the LTP Integrated Block
Grant. This is supported
by match funding from a
wide range of partners
such as Highways
England, Network Rail,
Bus Operators, South
West Trains, ABP
Southampton, Sustrans
and developer
contributions.
Details of the successful
bids can be found in the
relevant areas of Chapter
3.
£96.4m
LSTF - £38.5m
LTP - £15.9m
Local Pinch Point Fund
- £4.2m
Clean Bus/Vehicle Technology
- £2.3m
Pothole Fund
- £1.6m
Regional Growth Fund
- £15.9m
Better Bus Area
- £7.5m
Cycle Safety
- £0.5m
Strategic Pinch Point Fund
- £10m
11
LTP3 Programme 2011-2015
The annual Environment & Transport Capital Programme sets out how the City Council intends to spend its annual Local Transport Capital
Block allocation from central Government. It provides detail on transport improvements it aims to deliver (e.g. cycling, road safety, travel
planning, congestion reduction), and highways maintenance.
The Capital programme is broadly aligning to the themes presented in LTP3.
Road Safety
Public Transport
Network Management
Smarter Choices
Active Travel
Public Realm
Asset Management & Maintenance
This section looks at how the LTP funding, along with the additional funding levered in, has been invested in Southampton’s transport network
focussing on each specific them in turn. The monitoring we have done has helped us to ensure we are investing in the correct locations and
techniques. For each theme, data has been analysed to demonstrate the effectiveness of the investment and progress against baseline
conditions.
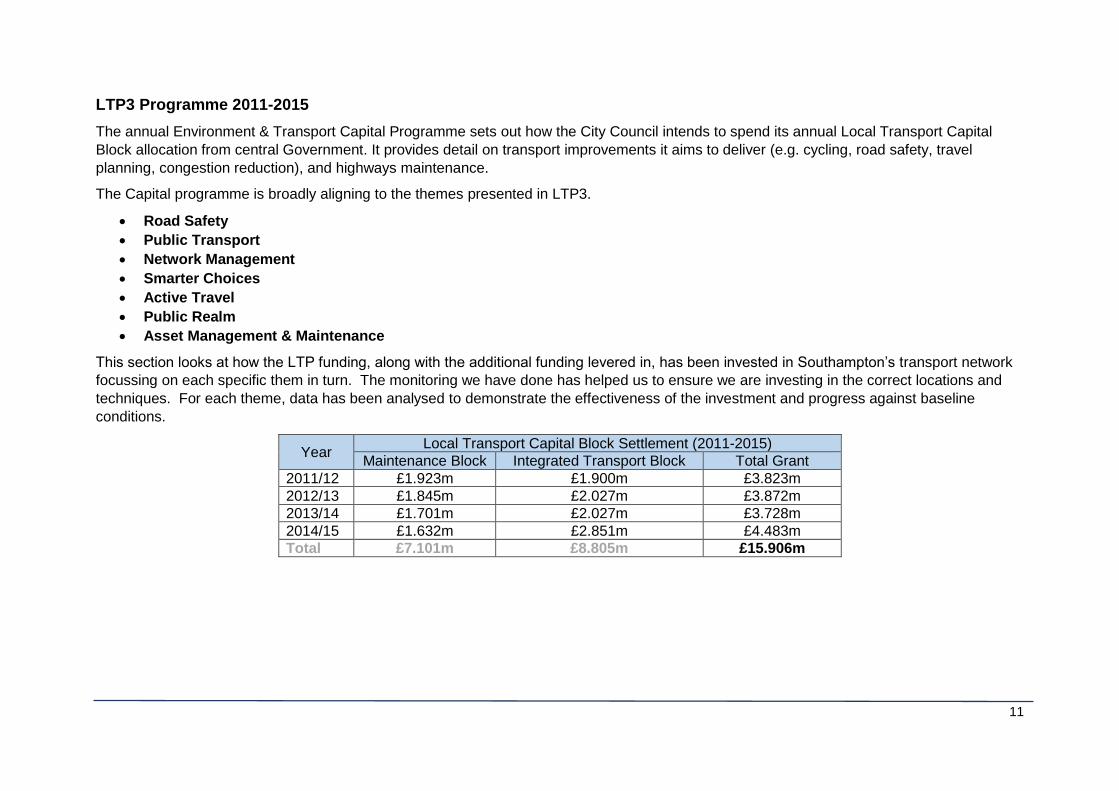
Year Local Transport Capital Block Settlement (2011-2015)
Maintenance Block Integrated Transport Block Total Grant
2011/12 £1.923m £1.900m £3.823m
2012/13 £1.845m £2.027m £3.872m
2013/14 £1.701m £2.027m £3.728m
2014/15 £1.632m £2.851m £4.483m
Total £7.101m £8.805m £15.906m
12
Road Safety
Investigating and improving road safety is a statutory duty for Highway Authorities. The Council is obliged to prioritise the available funds to
those locations that have the most serious road safety issues to minimise the number of accidents, based on an evidence led approach.
Southampton’s approach for improving road safety has been through providing engineering measures where feasible, a series of targeted
campaigns highlighting better road safety and events, and speed enforcement at known casualty ‘hotspots’.
Schemes introduced include:
Speed calming measures were introduced on South East Road at Kathleen Road in Sholing to decrease vehicle speeds approaching
the junction to tackle a hotspot of vehicle and pedestrian conflicts;
Zebra crossing facilities on Spring Road, Lodge Road and Highfield Lane;
Vehicle Activated Signs (VAS) and Vehicle Message Signs (VMS) at junctions or recorded accident hotspots.
Safer Routes to Schools schemes implemented at or in close proximity to schools across Southampton; and
Major changes to the Saltmarsh Junction at the western end of Itchen Bridge to improve road, pedestrian and cycle safety.
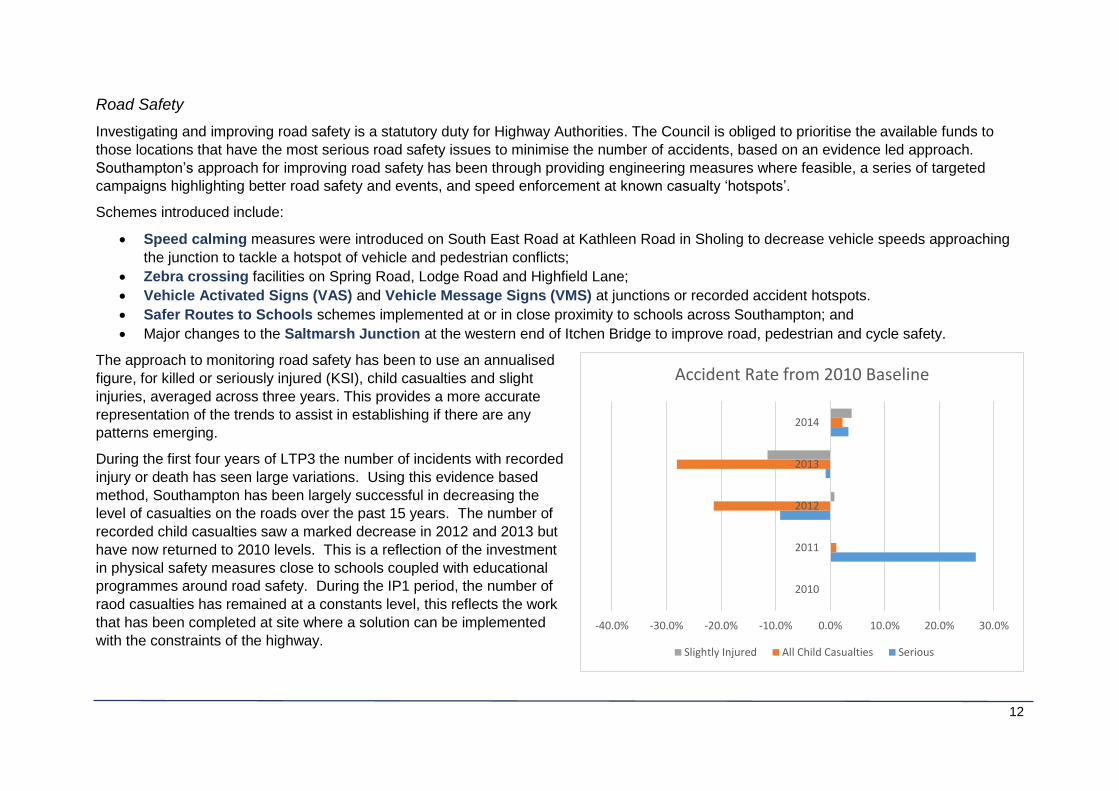
The approach to monitoring road safety has been to use an annualised
figure, for killed or seriously injured (KSI), child casualties and slight
injuries, averaged across three years. This provides a more accurate
representation of the trends to assist in establishing if there are any
patterns emerging.
During the first four years of LTP3 the number of incidents with recorded
injury or death has seen large variations. Using this evidence based
method, Southampton has been largely successful in decreasing the
level of casualties on the roads over the past 15 years. The number of
recorded child casualties saw a marked decrease in 2012 and 2013 but
have now returned to 2010 levels. This is a reflection of the investment
in physical safety measures close to schools coupled with educational
programmes around road safety. During the IP1 period, the number of
raod casualties has remained at a constants level, this reflects the work
that has been completed at site where a solution can be implemented
with the constraints of the highway. -40.0% -30.0% -20.0% -10.0% 0.0% 10.0% 20.0% 30.0%
2010
2011
2012
2013
2014
Accident Rate from 2010 Baseline
Slightly Injured All Child Casualties Serious
13
Public Transport
Public transport in Southampton covers buses, rail, ferries, taxis and coaches. The strategy for South Hampshire has been to focus on modal
shift to public transport to reduce car dependence. This has been through measures such as highway capacity optimisation, journey time
reliability, travel information and image perception. Projects to deliver this in Southampton include:
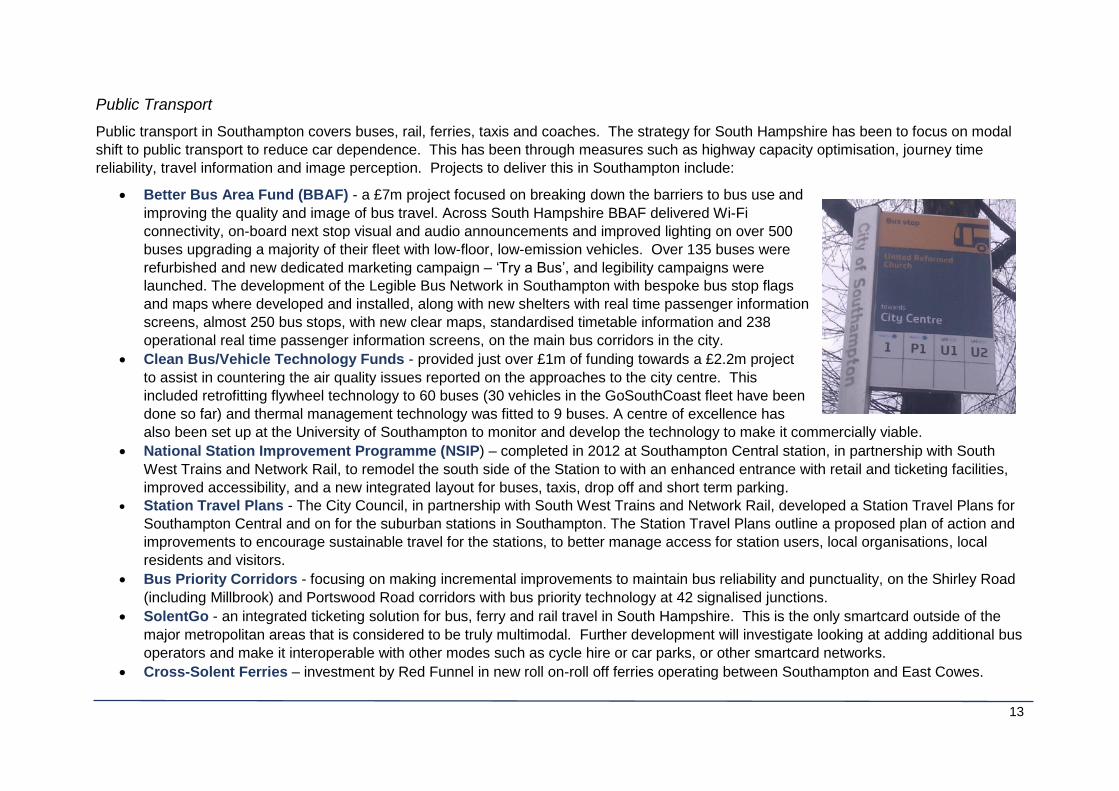
Better Bus Area Fund (BBAF) - a £7m project focused on breaking down the barriers to bus use and
improving the quality and image of bus travel. Across South Hampshire BBAF delivered Wi-Fi
connectivity, on-board next stop visual and audio announcements and improved lighting on over 500
buses upgrading a majority of their fleet with low-floor, low-emission vehicles. Over 135 buses were
refurbished and new dedicated marketing campaign – ‘Try a Bus’, and legibility campaigns were
launched. The development of the Legible Bus Network in Southampton with bespoke bus stop flags
and maps where developed and installed, along with new shelters with real time passenger information
screens, almost 250 bus stops, with new clear maps, standardised timetable information and 238
operational real time passenger information screens, on the main bus corridors in the city.
Clean Bus/Vehicle Technology Funds - provided just over £1m of funding towards a £2.2m project
to assist in countering the air quality issues reported on the approaches to the city centre. This
included retrofitting flywheel technology to 60 buses (30 vehicles in the GoSouthCoast fleet have been
done so far) and thermal management technology was fitted to 9 buses. A centre of excellence has
also been set up at the University of Southampton to monitor and develop the technology to make it commercially viable.
National Station Improvement Programme (NSIP) – completed in 2012 at Southampton Central station, in partnership with South
West Trains and Network Rail, to remodel the south side of the Station to with an enhanced entrance with retail and ticketing facilities,
improved accessibility, and a new integrated layout for buses, taxis, drop off and short term parking.
Station Travel Plans - The City Council, in partnership with South West Trains and Network Rail, developed a Station Travel Plans for
Southampton Central and on for the suburban stations in Southampton. The Station Travel Plans outline a proposed plan of action and
improvements to encourage sustainable travel for the stations, to better manage access for station users, local organisations, local
residents and visitors.
Bus Priority Corridors - focusing on making incremental improvements to maintain bus reliability and punctuality, on the Shirley Road
(including Millbrook) and Portswood Road corridors with bus priority technology at 42 signalised junctions.
SolentGo - an integrated ticketing solution for bus, ferry and rail travel in South Hampshire. This is the only smartcard outside of the
major metropolitan areas that is considered to be truly multimodal. Further development will investigate looking at adding additional bus
operators and make it interoperable with other modes such as cycle hire or car parks, or other smartcard networks.
Cross-Solent Ferries – investment by Red Funnel in new roll on-roll off ferries operating between Southampton and East Cowes.
14
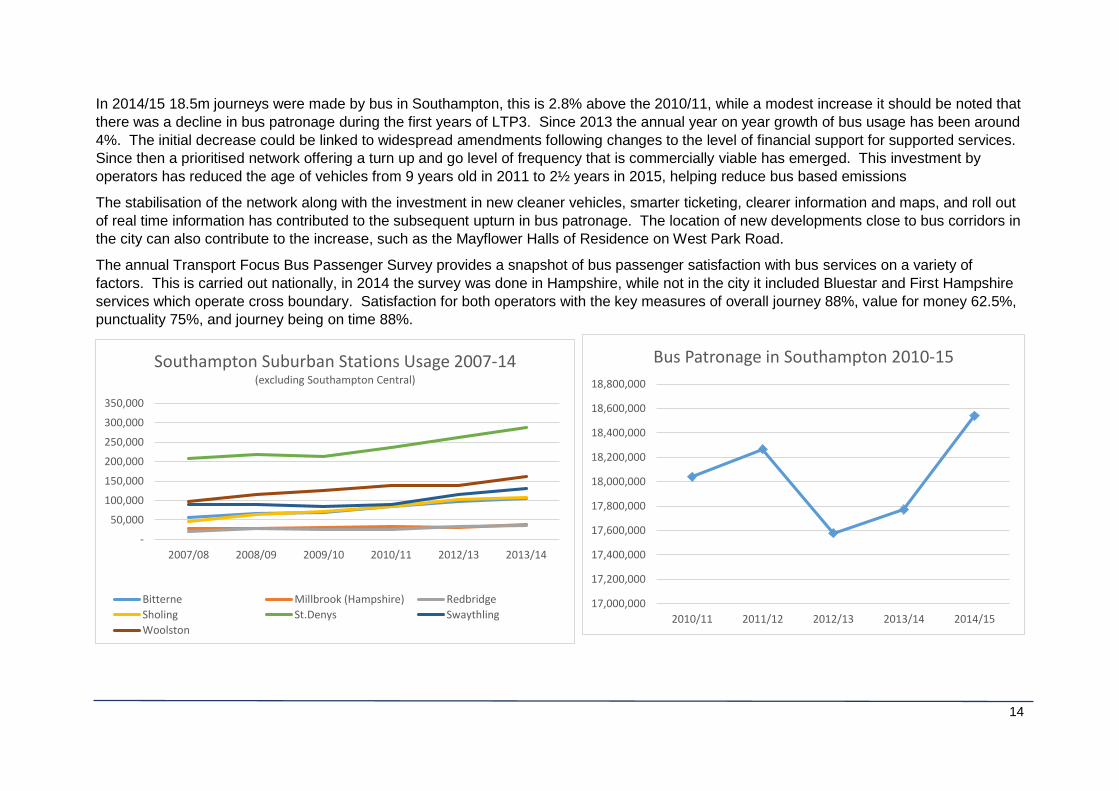
In 2014/15 18.5m journeys were made by bus in Southampton, this is 2.8% above the 2010/11, while a modest increase it should be noted that
there was a decline in bus patronage during the first years of LTP3. Since 2013 the annual year on year growth of bus usage has been around
4%. The initial decrease could be linked to widespread amendments following changes to the level of financial support for supported services.
Since then a prioritised network offering a turn up and go level of frequency that is commercially viable has emerged. This investment by
operators has reduced the age of vehicles from 9 years old in 2011 to 2½ years in 2015, helping reduce bus based emissions
The stabilisation of the network along with the investment in new cleaner vehicles, smarter ticketing, clearer information and maps, and roll out
of real time information has contributed to the subsequent upturn in bus patronage. The location of new developments close to bus corridors in
the city can also contribute to the increase, such as the Mayflower Halls of Residence on West Park Road.
The annual Transport Focus Bus Passenger Survey provides a snapshot of bus passenger satisfaction with bus services on a variety of
factors. This is carried out nationally, in 2014 the survey was done in Hampshire, while not in the city it included Bluestar and First Hampshire
services which operate cross boundary. Satisfaction for both operators with the key measures of overall journey 88%, value for money 62.5%,
punctuality 75%, and journey being on time 88%.
17,000,000
17,200,000
17,400,000
17,600,000
17,800,000
18,000,000
18,200,000
18,400,000
18,600,000
18,800,000
2010/11 2011/12 2012/13 2013/14 2014/15
Bus Patronage in Southampton 2010-15
-
50,000
100,000
150,000
200,000
250,000
300,000
350,000
2007/08 2008/09 2009/10 2010/11 2012/13 2013/14
Southampton Suburban Stations Usage 2007-14 (excluding Southampton Central)
Bitterne Millbrook (Hampshire) Redbridge
Sholing St.Denys Swaythling
Woolston
15
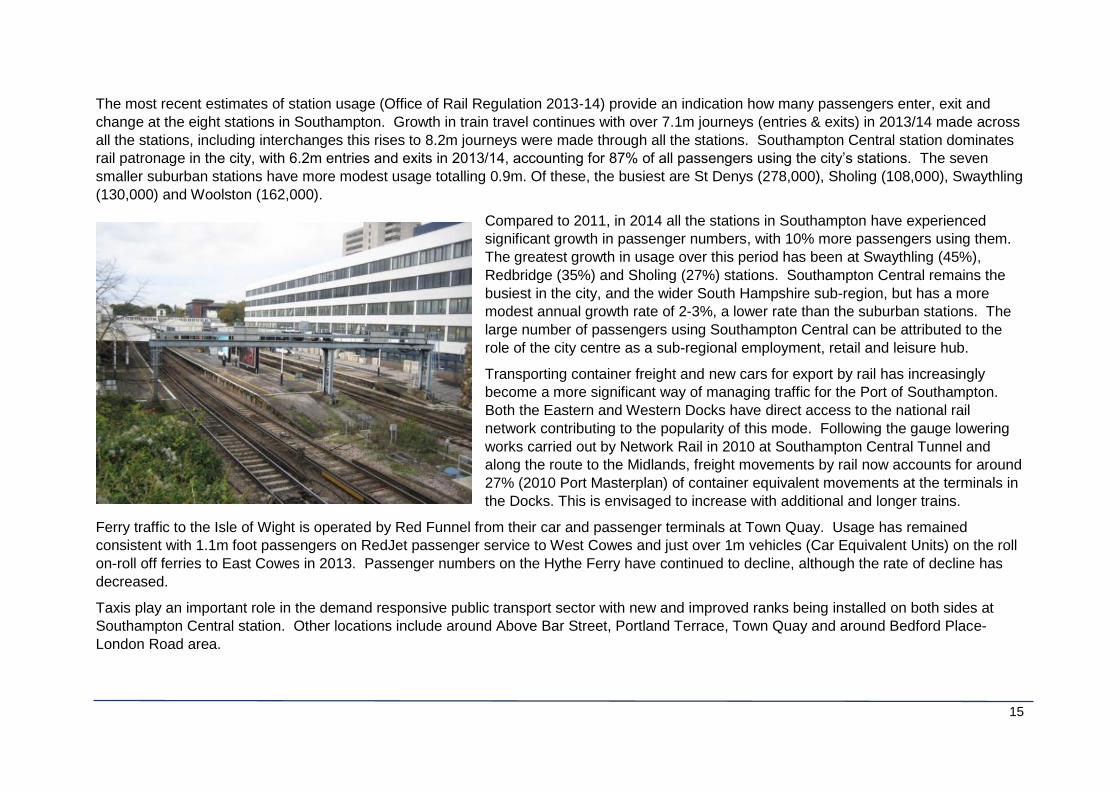
The most recent estimates of station usage (Office of Rail Regulation 2013-14) provide an indication how many passengers enter, exit and
change at the eight stations in Southampton. Growth in train travel continues with over 7.1m journeys (entries & exits) in 2013/14 made across
all the stations, including interchanges this rises to 8.2m journeys were made through all the stations. Southampton Central station dominates
rail patronage in the city, with 6.2m entries and exits in 2013/14, accounting for 87% of all passengers using the city’s stations. The seven
smaller suburban stations have more modest usage totalling 0.9m. Of these, the busiest are St Denys (278,000), Sholing (108,000), Swaythling
(130,000) and Woolston (162,000).
Compared to 2011, in 2014 all the stations in Southampton have experienced
significant growth in passenger numbers, with 10% more passengers using them.
The greatest growth in usage over this period has been at Swaythling (45%),
Redbridge (35%) and Sholing (27%) stations. Southampton Central remains the
busiest in the city, and the wider South Hampshire sub-region, but has a more
modest annual growth rate of 2-3%, a lower rate than the suburban stations. The
large number of passengers using Southampton Central can be attributed to the
role of the city centre as a sub-regional employment, retail and leisure hub.
Transporting container freight and new cars for export by rail has increasingly
become a more significant way of managing traffic for the Port of Southampton.
Both the Eastern and Western Docks have direct access to the national rail
network contributing to the popularity of this mode. Following the gauge lowering
works carried out by Network Rail in 2010 at Southampton Central Tunnel and
along the route to the Midlands, freight movements by rail now accounts for around
27% (2010 Port Masterplan) of container equivalent movements at the terminals in
the Docks. This is envisaged to increase with additional and longer trains.
Ferry traffic to the Isle of Wight is operated by Red Funnel from their car and passenger terminals at Town Quay. Usage has remained
consistent with 1.1m foot passengers on RedJet passenger service to West Cowes and just over 1m vehicles (Car Equivalent Units) on the roll
on-roll off ferries to East Cowes in 2013. Passenger numbers on the Hythe Ferry have continued to decline, although the rate of decline has
decreased.
Taxis play an important role in the demand responsive public transport sector with new and improved ranks being installed on both sides at
Southampton Central station. Other locations include around Above Bar Street, Portland Terrace, Town Quay and around Bedford Place-
London Road area.
16
Network Management
The Traffic Management Act (2004) places a duty on highways authorities to ensure ‘expeditious’ movement of traffic; this is not just about
keeping the city’s street moving but ensuring the network is safe, providing up to date information and minimising the environmental impact of
travel such as air quality and noise. The focus of LTP3 has been on delivery of targeted network capacity improvements and complementing
this with ITS technology to maximise highway capacity and dynamic demand management to get the best out of it.
Strategic Pinch Point Funding - to ease local bottlenecks, improve safety and road layouts on the Strategic Road Network. While not
within the city boundary, two Highways England schemes received funding in the Southampton area and completed in 2015 to improve
capacity and efficiency at these junctions. M27 Junction 3 (M271) was a £2.3m scheme that aims to improve access to the city centre
by widening of the westbound slip road from M27, providing four lanes on all four carriageway sections and installing traffic signals on
the roundabout. M27 Junction 5 (A335 Southampton Airport) a £8m scheme to reduce congestion by widening approach roads and slip
roads on all arms of the roundabout from M27 and A335, four lanes on all four carriageways, a free flow lanes from M27 westbound exit
slips and from A335 Wide Lane to M27 westbound entry slips, and traffic signals.
Local Pinch Point Fund - to remove bottlenecks on the local highway network which were seen as impeding growth, the City Council
received £4.2m of funding for improvements to six bridges (Itchen, Northam River, Central, Vicarage Lane, Western Approach Rail and
Western Approach Flyovers) collectively called ‘Bridges to Prosperity’ to improve journey time reliability and ensure the longevity of the
bridges by carrying out major maintenance works.
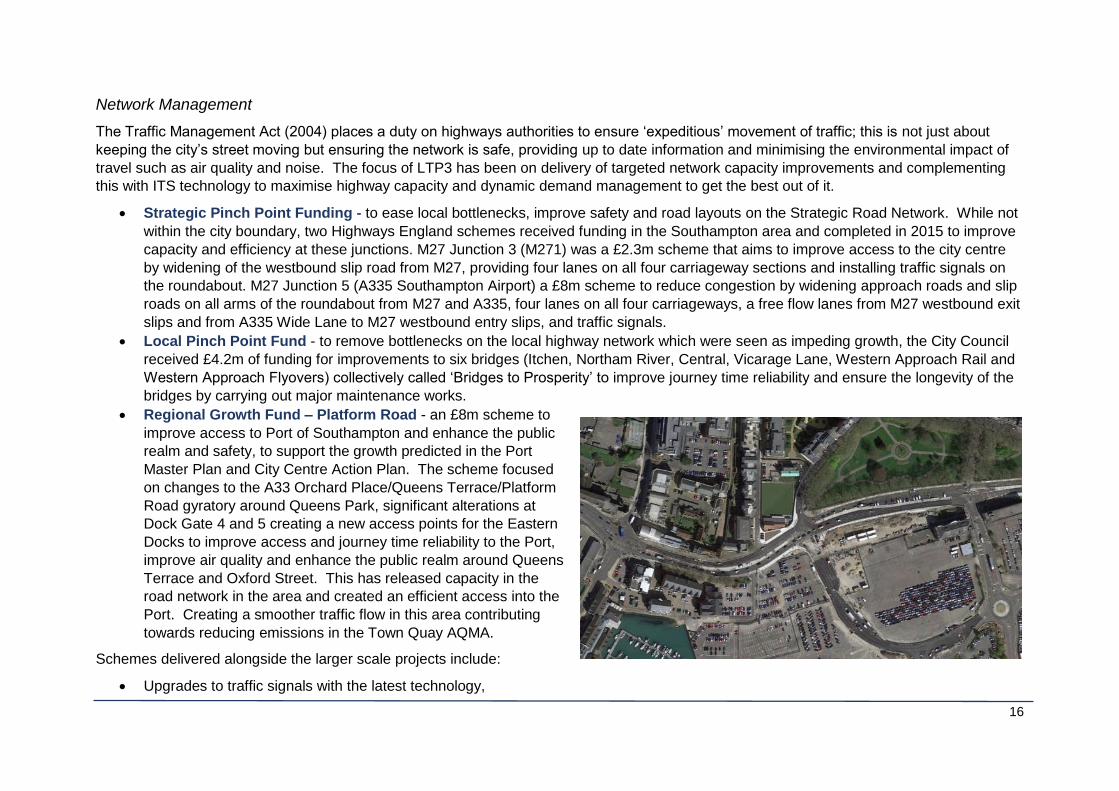
Regional Growth Fund – Platform Road - an £8m scheme to
improve access to Port of Southampton and enhance the public
realm and safety, to support the growth predicted in the Port
Master Plan and City Centre Action Plan. The scheme focused
on changes to the A33 Orchard Place/Queens Terrace/Platform
Road gyratory around Queens Park, significant alterations at
Dock Gate 4 and 5 creating a new access points for the Eastern
Docks to improve access and journey time reliability to the Port,
improve air quality and enhance the public realm around Queens
Terrace and Oxford Street. This has released capacity in the
road network in the area and created an efficient access into the
Port. Creating a smoother traffic flow in this area contributing
towards reducing emissions in the Town Quay AQMA.
Schemes delivered alongside the larger scale projects include:
Upgrades to traffic signals with the latest technology,
17
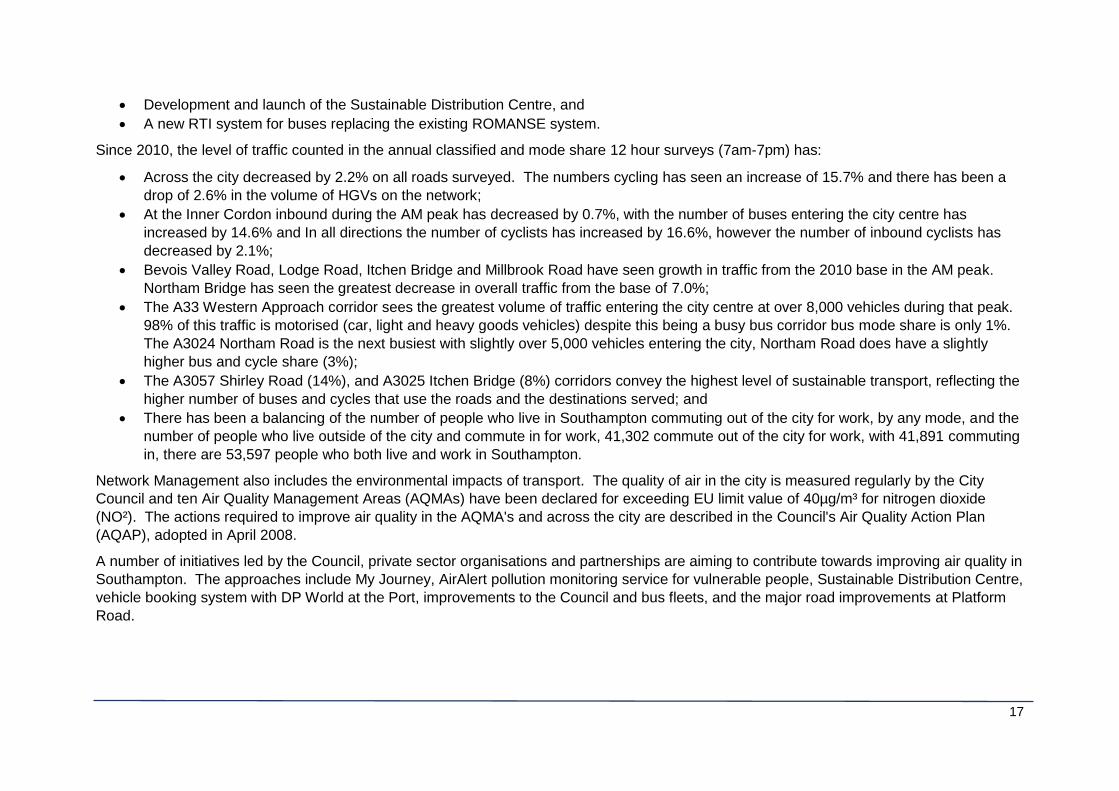
Development and launch of the Sustainable Distribution Centre, and
A new RTI system for buses replacing the existing ROMANSE system.
Since 2010, the level of traffic counted in the annual classified and mode share 12 hour surveys (7am-7pm) has:
Across the city decreased by 2.2% on all roads surveyed. The numbers cycling has seen an increase of 15.7% and there has been a
drop of 2.6% in the volume of HGVs on the network;
At the Inner Cordon inbound during the AM peak has decreased by 0.7%, with the number of buses entering the city centre has
increased by 14.6% and In all directions the number of cyclists has increased by 16.6%, however the number of inbound cyclists has
decreased by 2.1%;
Bevois Valley Road, Lodge Road, Itchen Bridge and Millbrook Road have seen growth in traffic from the 2010 base in the AM peak.
Northam Bridge has seen the greatest decrease in overall traffic from the base of 7.0%;
The A33 Western Approach corridor sees the greatest volume of traffic entering the city centre at over 8,000 vehicles during that peak.
98% of this traffic is motorised (car, light and heavy goods vehicles) despite this being a busy bus corridor bus mode share is only 1%.
The A3024 Northam Road is the next busiest with slightly over 5,000 vehicles entering the city, Northam Road does have a slightly
higher bus and cycle share (3%);
The A3057 Shirley Road (14%), and A3025 Itchen Bridge (8%) corridors convey the highest level of sustainable transport, reflecting the
higher number of buses and cycles that use the roads and the destinations served; and
There has been a balancing of the number of people who live in Southampton commuting out of the city for work, by any mode, and the
number of people who live outside of the city and commute in for work, 41,302 commute out of the city for work, with 41,891 commuting
in, there are 53,597 people who both live and work in Southampton.
Network Management also includes the environmental impacts of transport. The quality of air in the city is measured regularly by the City
Council and ten Air Quality Management Areas (AQMAs) have been declared for exceeding EU limit value of 40µg/m³ for nitrogen dioxide
(NO²). The actions required to improve air quality in the AQMA's and across the city are described in the Council's Air Quality Action Plan
(AQAP), adopted in April 2008.
A number of initiatives led by the Council, private sector organisations and partnerships are aiming to contribute towards improving air quality in
Southampton. The approaches include My Journey, AirAlert pollution monitoring service for vulnerable people, Sustainable Distribution Centre,
vehicle booking system with DP World at the Port, improvements to the Council and bus fleets, and the major road improvements at Platform
Road.
18
Active Travel
Almost half of all journeys to work in Southampton are under five kilometres (approximately 3 miles), a distance that can comfortably be made
on foot or by bike. This indicates there is a potential market for healthy active travel. People state that they would be willing to make these
journeys walking or cycling but feel that it is not safe to do so. The Active Travel programme sets out measures to provide safe and attractive
walking and cycling infrastructure and promoting Active Travel as an alternative to driving, particularly for short distances.
Investment has delivered major improvements in the cycle network across the city, as well as smaller scale improvements and alterations to the
pedestrian network.
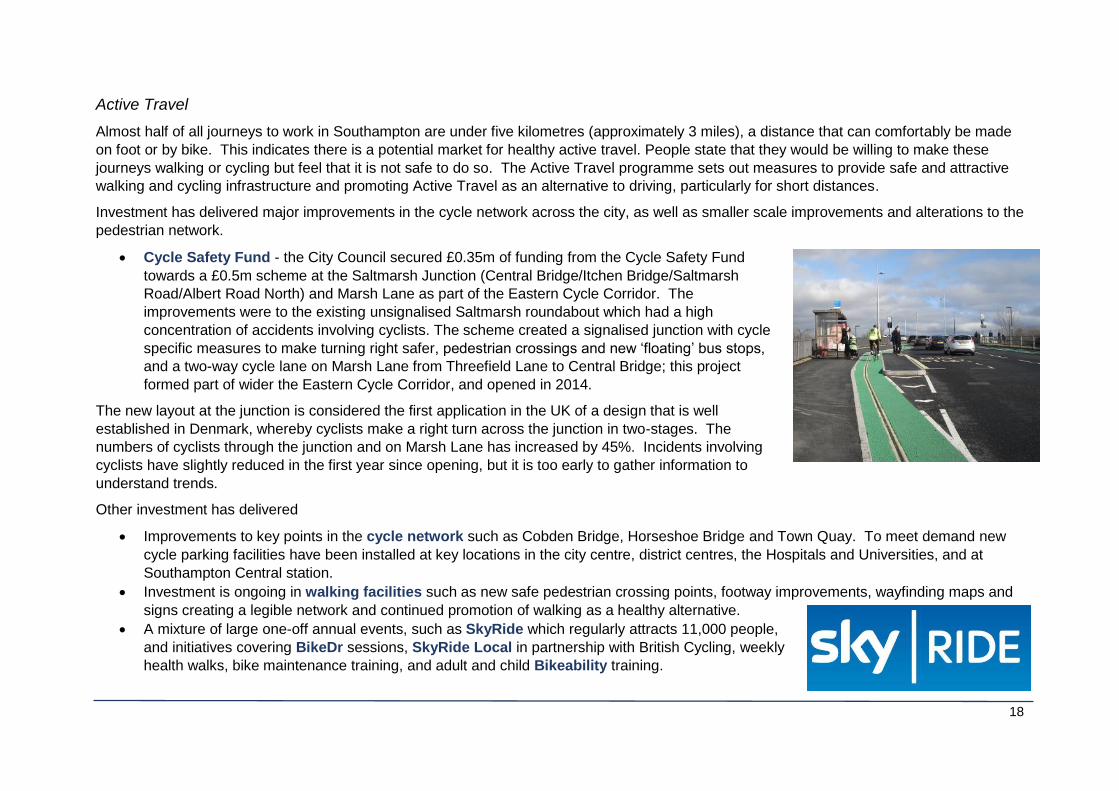
Cycle Safety Fund - the City Council secured £0.35m of funding from the Cycle Safety Fund
towards a £0.5m scheme at the Saltmarsh Junction (Central Bridge/Itchen Bridge/Saltmarsh
Road/Albert Road North) and Marsh Lane as part of the Eastern Cycle Corridor. The
improvements were to the existing unsignalised Saltmarsh roundabout which had a high
concentration of accidents involving cyclists. The scheme created a signalised junction with cycle
specific measures to make turning right safer, pedestrian crossings and new ‘floating’ bus stops,
and a two-way cycle lane on Marsh Lane from Threefield Lane to Central Bridge; this project
formed part of wider the Eastern Cycle Corridor, and opened in 2014.
The new layout at the junction is considered the first application in the UK of a design that is well
established in Denmark, whereby cyclists make a right turn across the junction in two-stages. The
numbers of cyclists through the junction and on Marsh Lane has increased by 45%. Incidents involving
cyclists have slightly reduced in the first year since opening, but it is too early to gather information to
understand trends.
Other investment has delivered
Improvements to key points in the cycle network such as Cobden Bridge, Horseshoe Bridge and Town Quay. To meet demand new
cycle parking facilities have been installed at key locations in the city centre, district centres, the Hospitals and Universities, and at
Southampton Central station.
Investment is ongoing in walking facilities such as new safe pedestrian crossing points, footway improvements, wayfinding maps and
signs creating a legible network and continued promotion of walking as a healthy alternative.
A mixture of large one-off annual events, such as SkyRide which regularly attracts 11,000 people,
and initiatives covering BikeDr sessions, SkyRide Local in partnership with British Cycling, weekly
health walks, bike maintenance training, and adult and child Bikeability training.
19
The number of people walking and cycling had previously been in decline, but trends in Southampton are becoming positive. In the 2011
Census, cycling’s mode share for travel to work was 4.6%, an increase of 27% from the 2001 census. This is higher than the South East
average but below that of other cities in England. Compared to other authorities in South Hampshire, Southampton does not perform as well
as other urban authorities such as Gosport (10.9%) and Portsmouth (7.4%). For walking the mode share is 16.4%, a rise of almost 50% on
2001. This is comparable to other authorities such as Portsmouth, Isle of Wight and Winchester, and higher than the national average.
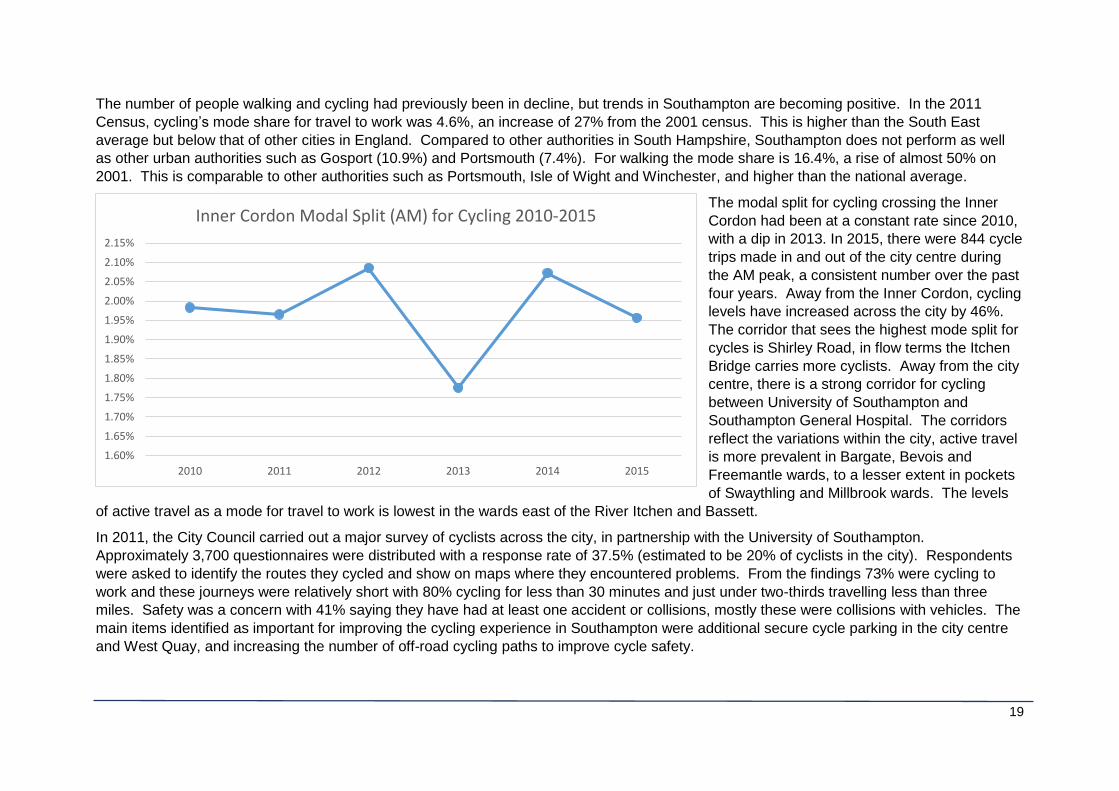
The modal split for cycling crossing the Inner
Cordon had been at a constant rate since 2010,
with a dip in 2013. In 2015, there were 844 cycle
trips made in and out of the city centre during
the AM peak, a consistent number over the past
four years. Away from the Inner Cordon, cycling
levels have increased across the city by 46%.
The corridor that sees the highest mode split for
cycles is Shirley Road, in flow terms the Itchen
Bridge carries more cyclists. Away from the city
centre, there is a strong corridor for cycling
between University of Southampton and
Southampton General Hospital. The corridors
reflect the variations within the city, active travel
is more prevalent in Bargate, Bevois and
Freemantle wards, to a lesser extent in pockets
of Swaythling and Millbrook wards. The levels
of active travel as a mode for travel to work is lowest in the wards east of the River Itchen and Bassett.
In 2011, the City Council carried out a major survey of cyclists across the city, in partnership with the University of Southampton.
Approximately 3,700 questionnaires were distributed with a response rate of 37.5% (estimated to be 20% of cyclists in the city). Respondents
were asked to identify the routes they cycled and show on maps where they encountered problems. From the findings 73% were cycling to
work and these journeys were relatively short with 80% cycling for less than 30 minutes and just under two-thirds travelling less than three
miles. Safety was a concern with 41% saying they have had at least one accident or collisions, mostly these were collisions with vehicles. The
main items identified as important for improving the cycling experience in Southampton were additional secure cycle parking in the city centre
and West Quay, and increasing the number of off-road cycling paths to improve cycle safety.
1.60%
1.65%
1.70%
1.75%
1.80%
1.85%
1.90%
1.95%
2.00%
2.05%
2.10%
2.15%
2010 2011 2012 2013 2014 2015
Inner Cordon Modal Split (AM) for Cycling 2010-2015
20
Public Realm
Public realm can be referred to as ‘space which relates to all those parts of the built and natural environment where the public has free access’
(ODPM 2004). Providing a high quality and well-designed public realm is now regarded an essential component of an overall package of
measures to make towns and cities attractive, vibrant and economically successful.
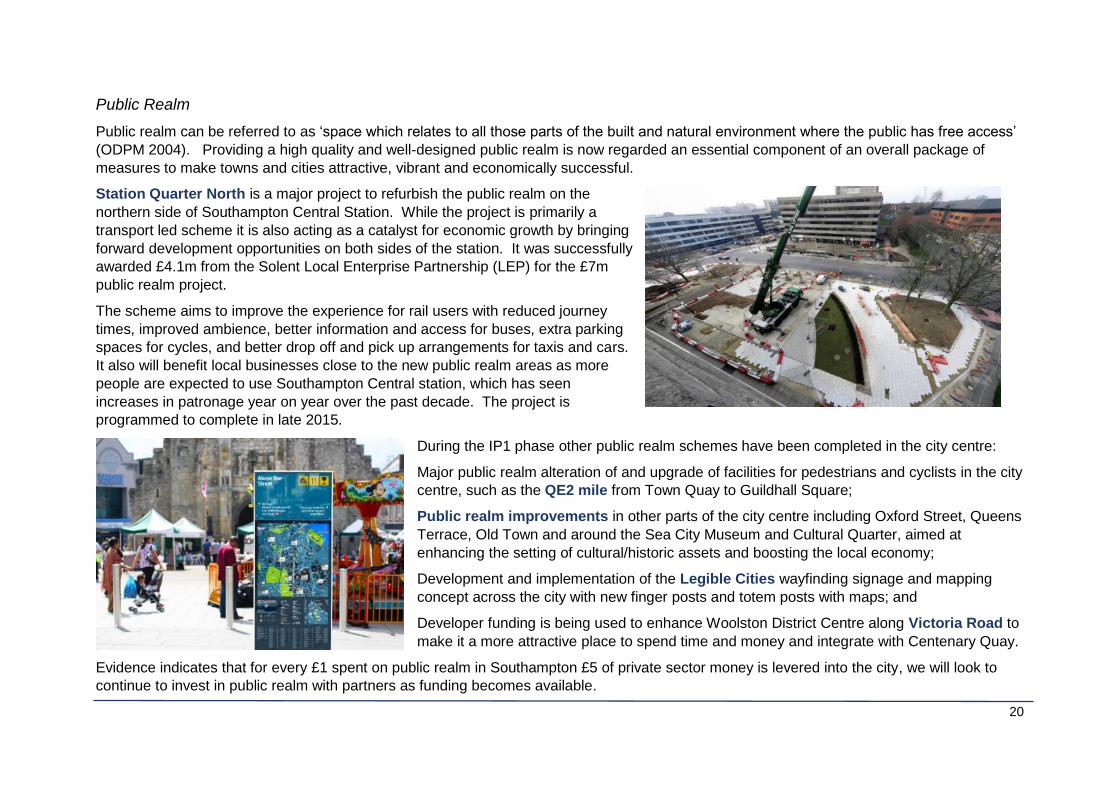
Station Quarter North is a major project to refurbish the public realm on the
northern side of Southampton Central Station. While the project is primarily a
transport led scheme it is also acting as a catalyst for economic growth by bringing
forward development opportunities on both sides of the station. It was successfully
awarded £4.1m from the Solent Local Enterprise Partnership (LEP) for the £7m
public realm project.
The scheme aims to improve the experience for rail users with reduced journey
times, improved ambience, better information and access for buses, extra parking
spaces for cycles, and better drop off and pick up arrangements for taxis and cars.
It also will benefit local businesses close to the new public realm areas as more
people are expected to use Southampton Central station, which has seen
increases in patronage year on year over the past decade. The project is
programmed to complete in late 2015.
During the IP1 phase other public realm schemes have been completed in the city centre:
Major public realm alteration of and upgrade of facilities for pedestrians and cyclists in the city
centre, such as the QE2 mile from Town Quay to Guildhall Square;
Public realm improvements in other parts of the city centre including Oxford Street, Queens
Terrace, Old Town and around the Sea City Museum and Cultural Quarter, aimed at
enhancing the setting of cultural/historic assets and boosting the local economy;
Development and implementation of the Legible Cities wayfinding signage and mapping
concept across the city with new finger posts and totem posts with maps; and
Developer funding is being used to enhance Woolston District Centre along Victoria Road to
make it a more attractive place to spend time and money and integrate with Centenary Quay.
Evidence indicates that for every £1 spent on public realm in Southampton £5 of private sector money is levered into the city, we will look to
continue to invest in public realm with partners as funding becomes available.
21
Local Sustainable Transport Fund (LSTF) Programme 2011-2015
In 2011, the Department for Transport (DfT) launched the Local Sustainable Transport Fund (LSTF) programme. The aim of LSTF was to
promote economic growth and reduce the impacts of climate change through local and sustainable transport projects that reduce the negative
impacts of traffic, facilitate access to local employment and improve air quality.
The LSTF funding cut across many of the LTP3 themes but primarily has assisted in delivering the Smarter Choices, Network Management,
Active Travel and Public Transport themes.
Southampton Sustainable Travel City
Southampton was awarded £3.96m for its ‘Southampton Sustainable Travel City’ LSTF programme, a package of targeted measures to
encourage sustainable travel; designed to achieve a modal shift away from the private car by promoting active travel and public transport over
the use of the car to reduce congestion, improving opportunities for economic growth and reducing carbon emissions. A second element
sought to encourage more sustainable options for freight to be brought in and out of the city.
The programme set some ambitious targets for Southampton:
A 12% modal shift away from private car use toward other modes of transport.
A real-terms cut in emissions from transport (including freight) of between 10 and 20%, even despite the forecasted addition of seven million (more) trips per annum over the next 20 years.
To facilitate the development aspirations of the CCAP (100,000m² of new retail space, 110,000m² of office space, and 5,450 new homes) and creating 6,700 new jobs.
The programme included a range of projects across four themes:
1. Travel marketing and communications – based around the My Journey brand it offered advice about travel choices and options in the
city to help promote mode shift for residents as well as saving time and money;
2. Travel Planning – working with businesses and organisations to deliver sustainable travel initiatives and providing support and advice
through forums and other activities;
3. Active Travel – the BikeIt projects in schools, which aims to get more young people cycling, walking or scooting more often through a
programme of activities designed to bring about long-term behavioural change;
4. Sustainable Travel – development of Delivery and Service Plans (DSPs) to review current freight traffic movements for an organisation
with the aim of identifying more sustainable an efficient options to improve its existing logistics operations, and reduce the impact of
freight traffic in the city.
22
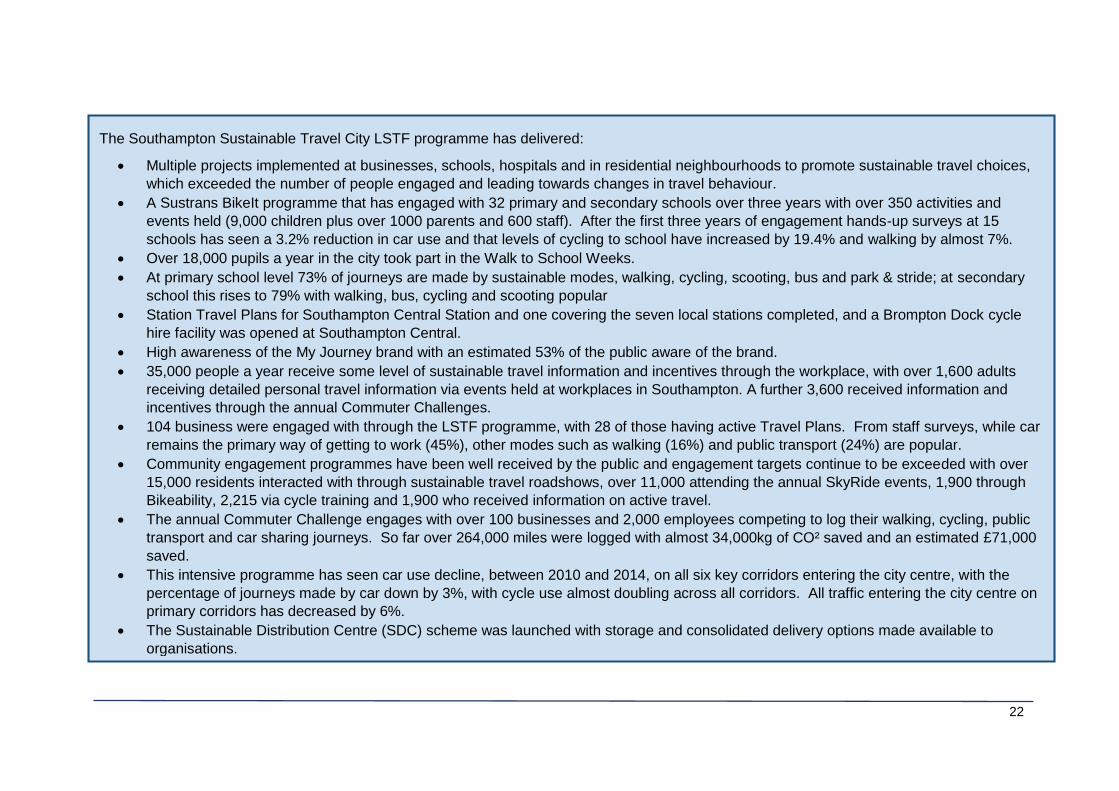
The Southampton Sustainable Travel City LSTF programme has delivered:
Multiple projects implemented at businesses, schools, hospitals and in residential neighbourhoods to promote sustainable travel choices,
which exceeded the number of people engaged and leading towards changes in travel behaviour.
A Sustrans BikeIt programme that has engaged with 32 primary and secondary schools over three years with over 350 activities and
events held (9,000 children plus over 1000 parents and 600 staff). After the first three years of engagement hands-up surveys at 15
schools has seen a 3.2% reduction in car use and that levels of cycling to school have increased by 19.4% and walking by almost 7%.
Over 18,000 pupils a year in the city took part in the Walk to School Weeks.
At primary school level 73% of journeys are made by sustainable modes, walking, cycling, scooting, bus and park & stride; at secondary
school this rises to 79% with walking, bus, cycling and scooting popular
Station Travel Plans for Southampton Central Station and one covering the seven local stations completed, and a Brompton Dock cycle
hire facility was opened at Southampton Central.
High awareness of the My Journey brand with an estimated 53% of the public aware of the brand.
35,000 people a year receive some level of sustainable travel information and incentives through the workplace, with over 1,600 adults
receiving detailed personal travel information via events held at workplaces in Southampton. A further 3,600 received information and
incentives through the annual Commuter Challenges.
104 business were engaged with through the LSTF programme, with 28 of those having active Travel Plans. From staff surveys, while car
remains the primary way of getting to work (45%), other modes such as walking (16%) and public transport (24%) are popular.
Community engagement programmes have been well received by the public and engagement targets continue to be exceeded with over
15,000 residents interacted with through sustainable travel roadshows, over 11,000 attending the annual SkyRide events, 1,900 through
Bikeability, 2,215 via cycle training and 1,900 who received information on active travel.
The annual Commuter Challenge engages with over 100 businesses and 2,000 employees competing to log their walking, cycling, public
transport and car sharing journeys. So far over 264,000 miles were logged with almost 34,000kg of CO² saved and an estimated £71,000
saved.
This intensive programme has seen car use decline, between 2010 and 2014, on all six key corridors entering the city centre, with the
percentage of journeys made by car down by 3%, with cycle use almost doubling across all corridors. All traffic entering the city centre on
primary corridors has decreased by 6%.
The Sustainable Distribution Centre (SDC) scheme was launched with storage and consolidated delivery options made available to
organisations.
23
A Better Connected South Hampshire
The City Council was also part of joint LSTF large project, awarded £17.8m of DfT funding towards a £31.2m package, with Hampshire County
Council and Portsmouth City Council. Titled ‘A Better Connected South Hampshire’ with the authorities working together to deliver sustainable
transport improvements across South Hampshire. The project covers three main areas and focused improvements on nine main transport
corridors2:
1. Low-cost improvements to transport infrastructure along nine corridors, to make public transport a realistic and reliable alternative
linking people to jobs, through enhanced bus-rail interchanges, bus priority measures, information and integrating public transport with
active modes (walking and cycling).
2. An inter-operable smart card ticketing system for South Hampshire known as SolentGo/Solent Travelcard.
3. An overarching marketing campaign branded ‘My Journey’ to achieve behavioural change – travel awareness campaign, station and
interchange travel plans, travel planning works, travel to school and college initiatives and promotion of the smart travel card.
While the project completed in 2015, the final outcomes will not be known until the full package has been implemented and evaluated. Some
early indications are that bus patronage and cycle use has increased across the whole project area as a result traffic on the nine corridors has
decreased by 2-4%.
2 There are six LSTF Corridors in Southampton 1 – Hythe-Southampton (Hythe Ferry), 2 - Totton-Southampton (A33 Millbrook Road), 3 – Romsey-Southampton (A3057 Romsey & Shirley Roads), 4 – Chandler’s Ford-Southampton (A33 The Avenue), 5 – Eastleigh-Southampton (A335 Portswood Road), 6 – Hedge End/Eastern Suburbs (A3024 Bitterne Road & A3025 Itchen Bridge).
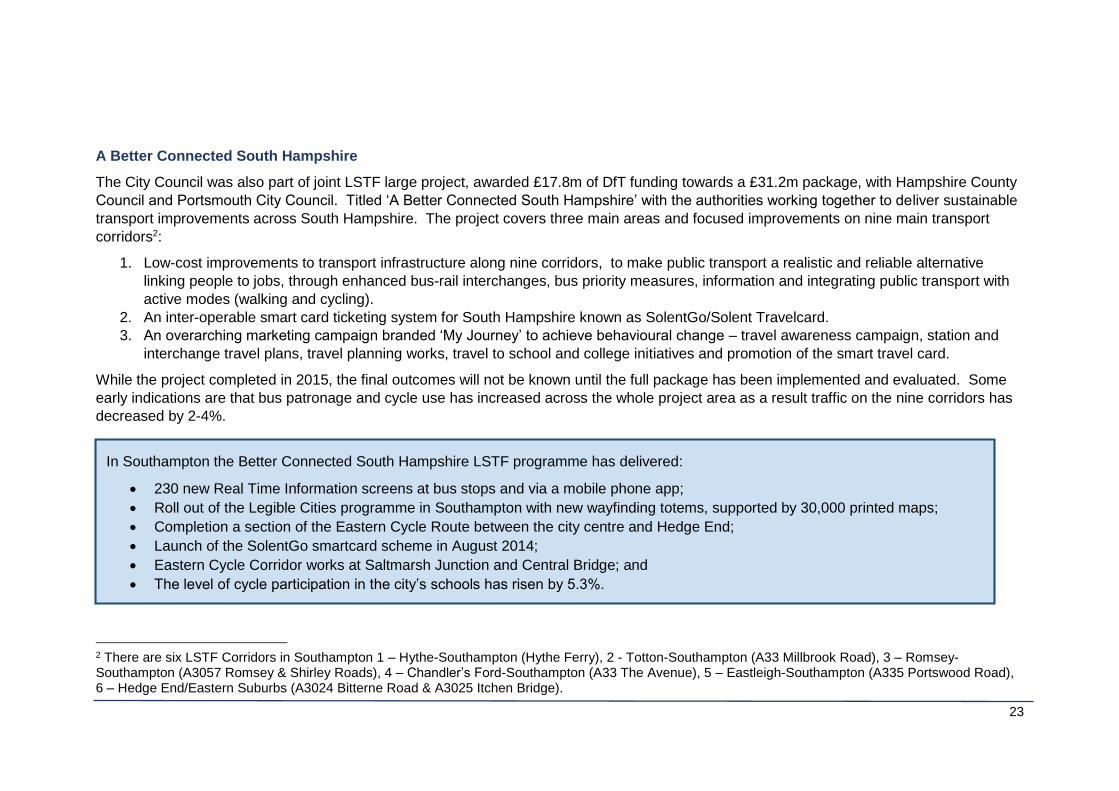
In Southampton the Better Connected South Hampshire LSTF programme has delivered:
230 new Real Time Information screens at bus stops and via a mobile phone app;
Roll out of the Legible Cities programme in Southampton with new wayfinding totems, supported by 30,000 printed maps;
Completion a section of the Eastern Cycle Route between the city centre and Hedge End;
Launch of the SolentGo smartcard scheme in August 2014;
Eastern Cycle Corridor works at Saltmarsh Junction and Central Bridge; and
The level of cycle participation in the city’s schools has risen by 5.3%.
24
Asset Management & Maintenance
Both the LTP3 and Transport Asset Management Plan (TAMP) provide the polices and methodology for prioritising highways maintenance
spend. In 2014, public consultation was carried out to understand local people’s priorities for road maintenance spend. This information has
been referenced with the condition data collected on site to ensure that the TAMP priorities take into account both technical need and
community aspirations.
Funding towards the maintenance of the asset comes through the Highways Maintenance Block portion of the Integrated Transport Capital
Block for 2011-2015, which was £7.1m. Other funding has been received from central Government in response to adverse weather conditions
in the winters of 2013 and 2014, where the DfT made additional funding for potholes available. The 2012 Autumn Statement provided £0.479m
of additional support, on top of the maintenance block allocation, for local highway maintenance to Southampton. Following that
announcement, in 2014 Southampton received a share of £0.232m from a £168m fund to support schemes on seven roads in the city where
surface conditions were in need of urgent repair, as well as an additional £0.221m in June 2014.
The annual National Highways & Transport (NHT) survey provides benchmarking evidence of public perceptions on and satisfaction with a
variety of highways and transport related themes. The 2014 results reported that 29.4% of respondents for Southampton are very dissatisfied
with the condition of road surfaces in the city. This is a drop of 1.4% on the 2013 results, but follows a trend of fluctuation in the perception
around highway condition over the period 2008-2014.
25
Part 3: Implementation Plan 2015-2018
This section sets out how the City Council will continue to deliver its LTP3 priorities over the period between 2015 and 2018 with the budgets it
has available.
A number of factors have influenced the approach taken towards delivering the LTP3 priorities over the next three years. The financial climate
remains challenging and delivery of schemes and initiatives will be prioritised on how they contribute to LTP strategy and budget constraints.
Southampton will experience change over this time with major developments in the city being completed or commenced, such as Watermark
West Quay which has commenced and Royal Pier Waterfront & Trafalgar Dock are expected to come forward. The population of the city will
also continue to grow and change with an aging population, this will continue to place increasing pressure on the city’s transport network.
Given the continued improving economic conditions we will continue to work with partners to ensure that we undertake actions and measures
that support this economic growth. Attempting to provide for this expected growth through new roads is not practical or affordable in
Southampton, therefore the strategy set out in LTP3 will continue to ensure we make the best use of the network. However, this growth should
not be at the expense of other priorities or impacts, such as the environmental impact of transport and climate change or unduly disadvantaging
non-car modes. Air quality is increasingly becoming a pressing issue for Southampton not just impacting on the economic prosperity of the city
but more significantly on the long-term health of our residents. A deteriorating appearance could also have a negative impact on the condition
and operation of the highway network. The LSTF programme is fully funded for the 2015/16 financial year.
It is expected that there will be further opportunities for competitive funding from central Government, the LEP and the EU will arise during the
lifetime of this Implementation Plan, in addition to the Integrated Transport Block funding, for projects that would not be deliverable through
normal means. The City Council will seek to make bid applications to funding for schemes that provide benefits to the residents of the city and
the City Council.
LSTF Programme for 2015/16
Southampton was successful in extending the Sustainable Travel City LSTF programme for an additional year, with £0.996m of DfT funding
towards a total package cost of £1.564m. The programme will continue the highly acclaimed My Journey travel behaviour change programme
in the city focusing on shifting journeys to public transport, walking and cycling. The programme consists of 10 themes, including monitoring
and evaluation, aimed at delivering the objectives and wider policies and priorities.
1. Urban Freight Strategy – a pilot system for ‘Freight Traffic Control’ where dynamic routing is used to guide HGV drivers onto optimal
routes for deliveries and access.
2. Workplace Travel Planning – continuing the travel and transport support to businesses through an expanded travel plan network.
3. School Travel Planning – continuing to work with schools to deliver a programme of initiatives such as STARS accreditation, Bike It or
16-19 bus passes.
26
4. Increasing Physical Activity – delivery of cycle and walking projects in the community.
5. Bike Ownership for All - develop a Bike Exchange Portal.
6. My Journey – continuing the My Journey brand and services including courses, cycle training, SkyRide and Roadshows.
7. Legible Bus Networks – complete the final phase of 180 buses with standardised bus stop appearance, legible maps, network
diagrams and timetables.
8. Legible Cycle Networks – develop and roll out design and production of signage and revised mapping.
9. My Journey Branding – marketing programme focusing on visitor tourism, direct marketing/smarter choices and targeting people at life
decision points (moving house, job or school).
10. Monitoring and Evaluation in partnership with the University of Southampton.
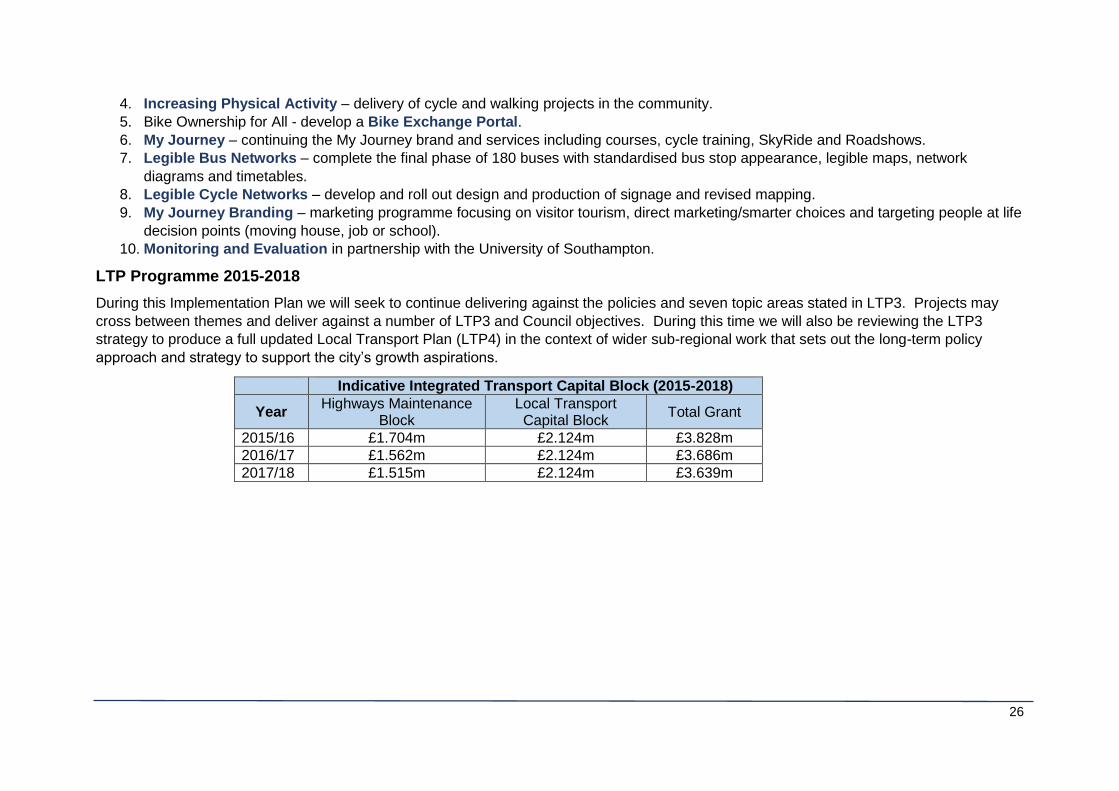
LTP Programme 2015-2018
During this Implementation Plan we will seek to continue delivering against the policies and seven topic areas stated in LTP3. Projects may
cross between themes and deliver against a number of LTP3 and Council objectives. During this time we will also be reviewing the LTP3
strategy to produce a full updated Local Transport Plan (LTP4) in the context of wider sub-regional work that sets out the long-term policy
approach and strategy to support the city’s growth aspirations.
Indicative Integrated Transport Capital Block (2015-2018)
Year Highways Maintenance
Block Local Transport Capital Block
Total Grant
2015/16 £1.704m £2.124m £3.828m
2016/17 £1.562m £2.124m £3.686m
2017/18 £1.515m £2.124m £3.639m
27
Road Safety
The road safety programme is collated based on the continuation of the evidence based approach applied during IP1.
The programme will continue to invest in initiatives to support the reduction in personal injury accidents on the city’s road network through the
Safer Roads Partnership, Safe Routes to School and Engineering with a mix of physical infrastructure improvements and education activities.
These improvements have been identified at priority sites through analysis of Personal Injury Accident Data and subsequent feasibility
appraisal.
Continuing to support the education and enforcement activities through the Road Safety Partnership,
Implement a package Safety Engineering Schemes at locations around the city such as speed calming, crossing facilities, and
electronic signs.
Public Transport
As development and traffic levels increase public transport will have an increasingly important role to play in helping people to get around
easier.
Around Southampton projects have been identified through Network Rail’s long term planning process, and include additional siding capacity at
Western Docks between Millbrook and Redbridge, extending train lengths for car transport to the Eastern Docks and platform capacity at
Southampton Central.
The train operators, SouthWest Trains and Great Western Railway (GWR), are seeking to invest in new rolling stock on services through
Southampton. As part of the new franchise agreement, GWR are updating the trains on the Portsmouth Harbour-Cardiff Central service to
provide additional capacity and Wi-Fi capability. The South Western franchise is expected to be retendered in 2017/18, the City Council will
work closely with Solent Transport to ensure any new franchise can provide capacity, journey times and service enhancements for
Southampton and the sub-region.
Investment will continue to be made in improving localised priority measures for bus services on the Portswood and Shirley corridors
prioritised through the Bus Punctuality Task Force. Providing up to date and clear information on services through real time information
or the Legible Bus Network schemes will continue. Bus operators will be starting to install new stop audio and visual announcements
on vehicles across their fleets.
We will work towards expanding the operation of SolentGo smartcard so that it can include rail travel, as well as bus and ferry. The re-
letting of the South West franchise in 2016/17 offers the opportunity to explore this option with the operator.
To support the increase demands on rail and making the journey to, from and through the city’s rail stations as simple, easy and
sustainable as possible actions from the newly produced Station Travel Plans will start to be implemented.
28
The larger scale public realm and interchange works at Station Quarter North at Southampton Central will continue to be delivered,
and are expected to be completed in Autumn/Winter 2015.
The Solent Gateways project in Southampton and Cowes Isle of Wight is expected to move through to delivery phase within the IP2
period with new ferry terminal facilities on either side of The Solent planned. This is a key LEP priority and has secured £15m of
funding through the Local Growth Deal shared between the Isle of Wight Council and SCC. The new Red Funnel terminal will kick start
the regeneration of the Town Quay/Royal Pier development sites, a key component in the CCAP.
Legible Bus Networks – deliver works at 180 bus stops in Phase 3 and completion of network with standardised bus stop appearance,
legible maps, network diagrams and timetables.
Network Management
To ensure that the city’s transport network continues to perform well, is safe and the environmental impact of traffic is minimised, effective
network management tools can help to reduce delays and journey lengths. The programme seeks to understand how traffic moves around the
city and building analytical tools, such as updating the City Centre Microsimulation Traffic Model and Intelligent Traffic Systems (ITS), to
assist in the planning of future initiatives and schemes. From this analysis and evidence base a package of measures to continue to support
the reduction and management of congestion can be formed.
To help tackle the levels of air pollution a Low Emissions Strategy (LES) for the city is being developed, and working with businesses a series
Delivery Service Plans (DSP) are being developed to promote sustainable and efficient approach to moving goods and services. Details on
the major improvement schemes for Redbridge Roundabout and A3024 Eastern Access Corridor will start to emerge and move towards
implementation. Other schemes include:
increasing the supply of secure motorcycle parking in the city,
upgrade of the Real Time Information (RTI) screens,
measures to assist with the uptake of electric and alternative fuel vehicles, and
enhancements to the ITS network as identified through the emerging ITS Strategy.
Smarter Choices
As an important part of the LTP3 strategy, the Smarter Choices programme will have a direct impact on the success of many other transport
schemes and can provide good value for money. The programme supports many of the other schemes in the Implementation Plan and builds
on elements of the LSTF programme for 2015/16 but will require additional funding to continue beyond that period.
Urban Freight Strategy – a ‘Freight Traffic Control’ system and pilot where dynamic routing is used to guide HGV drivers onto optimal
routes for deliveries and access to limit the amount of unnecessary diversions onto unsuitable residential streets;
29
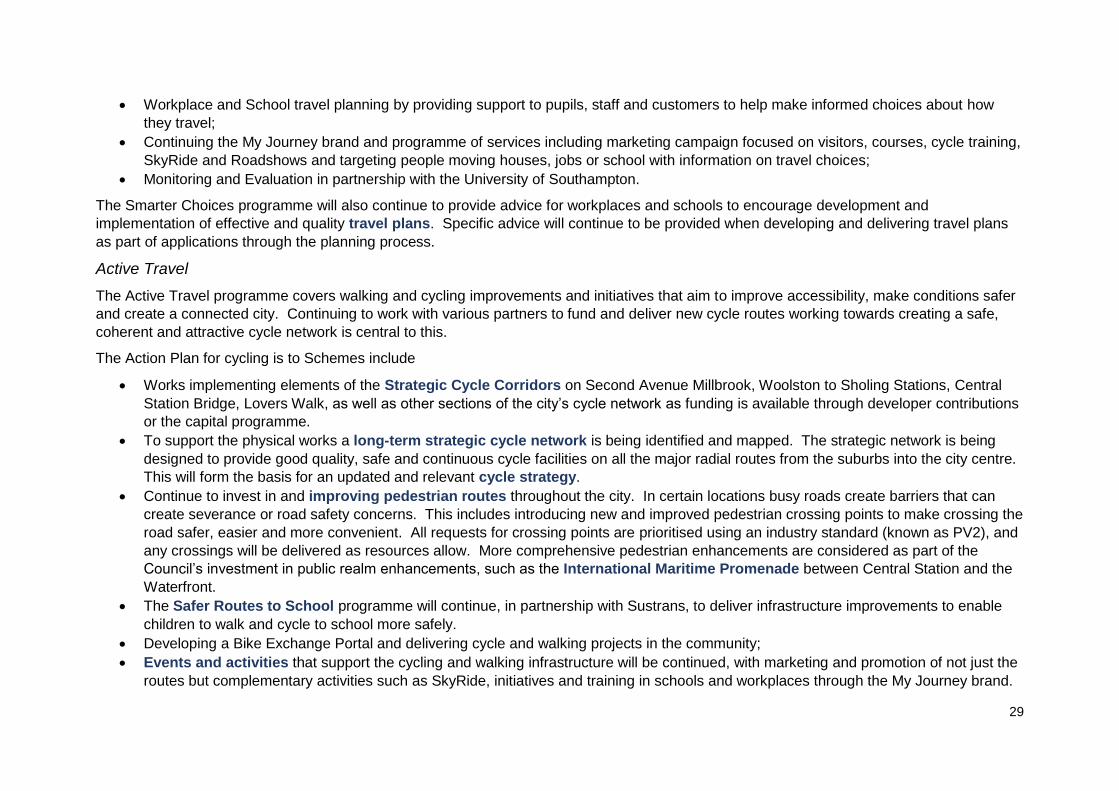
Workplace and School travel planning by providing support to pupils, staff and customers to help make informed choices about how
they travel;
Continuing the My Journey brand and programme of services including marketing campaign focused on visitors, courses, cycle training,
SkyRide and Roadshows and targeting people moving houses, jobs or school with information on travel choices;
Monitoring and Evaluation in partnership with the University of Southampton.
The Smarter Choices programme will also continue to provide advice for workplaces and schools to encourage development and
implementation of effective and quality travel plans. Specific advice will continue to be provided when developing and delivering travel plans
as part of applications through the planning process.
Active Travel
The Active Travel programme covers walking and cycling improvements and initiatives that aim to improve accessibility, make conditions safer
and create a connected city. Continuing to work with various partners to fund and deliver new cycle routes working towards creating a safe,
coherent and attractive cycle network is central to this.
The Action Plan for cycling is to Schemes include
Works implementing elements of the Strategic Cycle Corridors on Second Avenue Millbrook, Woolston to Sholing Stations, Central
Station Bridge, Lovers Walk, as well as other sections of the city’s cycle network as funding is available through developer contributions
or the capital programme.
To support the physical works a long-term strategic cycle network is being identified and mapped. The strategic network is being
designed to provide good quality, safe and continuous cycle facilities on all the major radial routes from the suburbs into the city centre.
This will form the basis for an updated and relevant cycle strategy.
Continue to invest in and improving pedestrian routes throughout the city. In certain locations busy roads create barriers that can
create severance or road safety concerns. This includes introducing new and improved pedestrian crossing points to make crossing the
road safer, easier and more convenient. All requests for crossing points are prioritised using an industry standard (known as PV2), and
any crossings will be delivered as resources allow. More comprehensive pedestrian enhancements are considered as part of the
Council’s investment in public realm enhancements, such as the International Maritime Promenade between Central Station and the
Waterfront.
The Safer Routes to School programme will continue, in partnership with Sustrans, to deliver infrastructure improvements to enable
children to walk and cycle to school more safely.
Developing a Bike Exchange Portal and delivering cycle and walking projects in the community;
Events and activities that support the cycling and walking infrastructure will be continued, with marketing and promotion of not just the
routes but complementary activities such as SkyRide, initiatives and training in schools and workplaces through the My Journey brand.
30
Roll out the first phase of the Legible Cycle Networks project with design and production of signage and revised mapping.
Public Realm
Building on the recent major public realm schemes in the city the Station Quarter North improvements will move towards completion. This will
create a new public space and public transport interchange at one of the main gateways into the city at Southampton Central station. Partially
funded through the Local Growth Fund the new space will help regenerate the area attracting new development that can provide new jobs and
housing close to the city centre.
Station Quarter North is our flagship public realm scheme over the period of IP2 and it will be augmented a scheme on Kingsbridge Lane,
connecting the station with the Civic Centre and northern part of the city centre. This is a key pedestrian link that is tired, unattractive and in
need of works to improve drainage and connectivity. Other public realm schemes will vary in size and scale with long term aspirations for
Royal Pier and Itchen Riverside being associated with regeneration and development in those areas. Completion of the public realm and
accessibility scheme is being implemented on Victoria Road in Woolston in 2016.
Asset Management & Maintenance
The Council will continue to invest in the highway infrastructure of the City using the TAMP principles to help offset the continuing deterioration
of the City’s roads and footways.
A confirmed programme for 2015/16 covering the principle, classified and unclassified roads in Southampton has been agreed, and an
indicative programme for 2016/17 and 2017/18 have been prepared in line with TAMP principles and community aspirations. This will enable
residents to have confidence that their roads have been identified and are in the indicative forward works programme.
A major maintenance scheme will be carried out at A33 Millbrook Roundabout using £1.4m of Local Growth Funding to uphold reliable access
to the Port through Dock Gate 20.
31
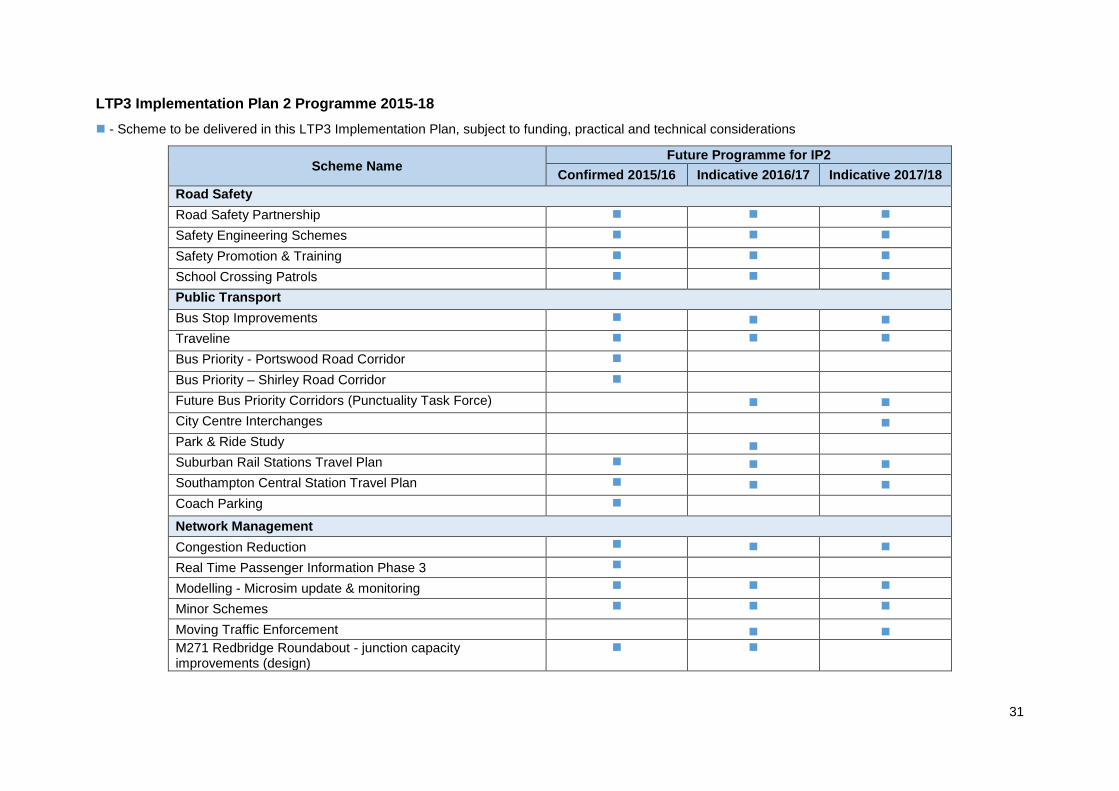
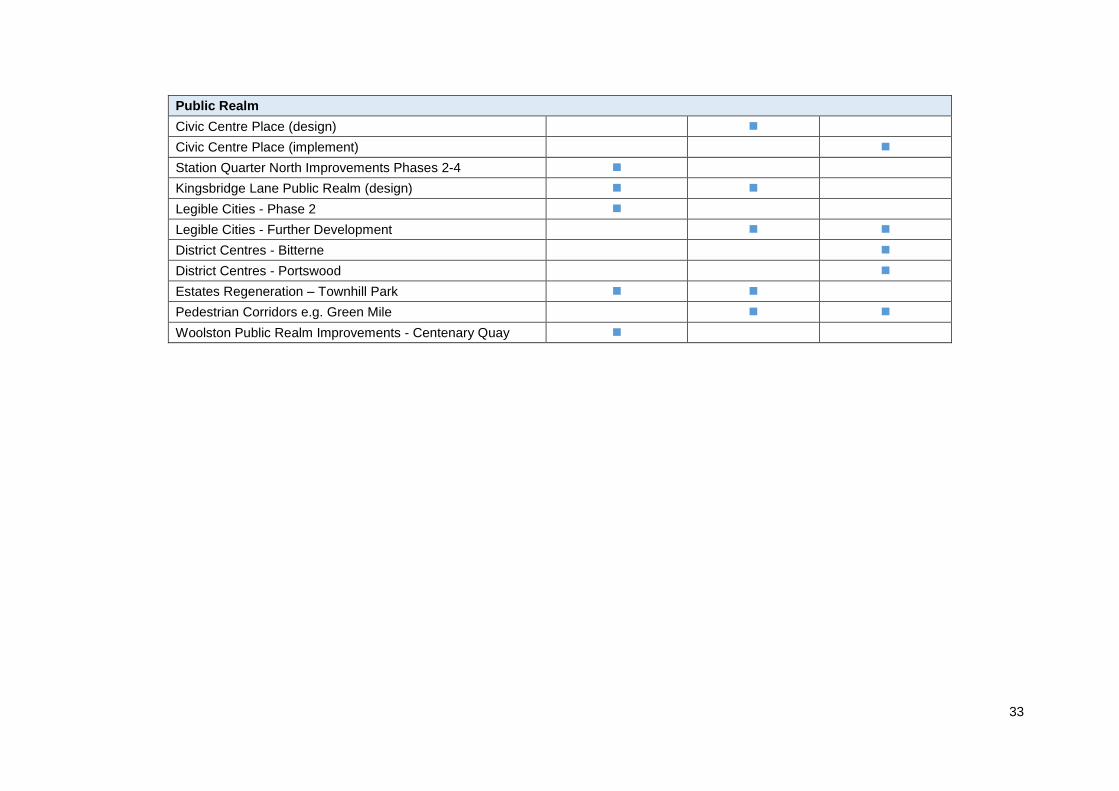
LTP3 Implementation Plan 2 Programme 2015-18
- Scheme to be delivered in this LTP3 Implementation Plan, subject to funding, practical and technical considerations
Scheme Name Future Programme for IP2
Confirmed 2015/16 Indicative 2016/17 Indicative 2017/18
Road Safety
Road Safety Partnership
Safety Engineering Schemes
Safety Promotion & Training
School Crossing Patrols
Public Transport
Bus Stop Improvements
Traveline
Bus Priority - Portswood Road Corridor Bus Priority – Shirley Road Corridor Future Bus Priority Corridors (Punctuality Task Force)
City Centre Interchanges
Park & Ride Study
Suburban Rail Stations Travel Plan
Southampton Central Station Travel Plan
Coach Parking
Network Management
Congestion Reduction
Real Time Passenger Information Phase 3
Modelling - Microsim update & monitoring
Minor Schemes
Moving Traffic Enforcement M271 Redbridge Roundabout - junction capacity improvements (design)
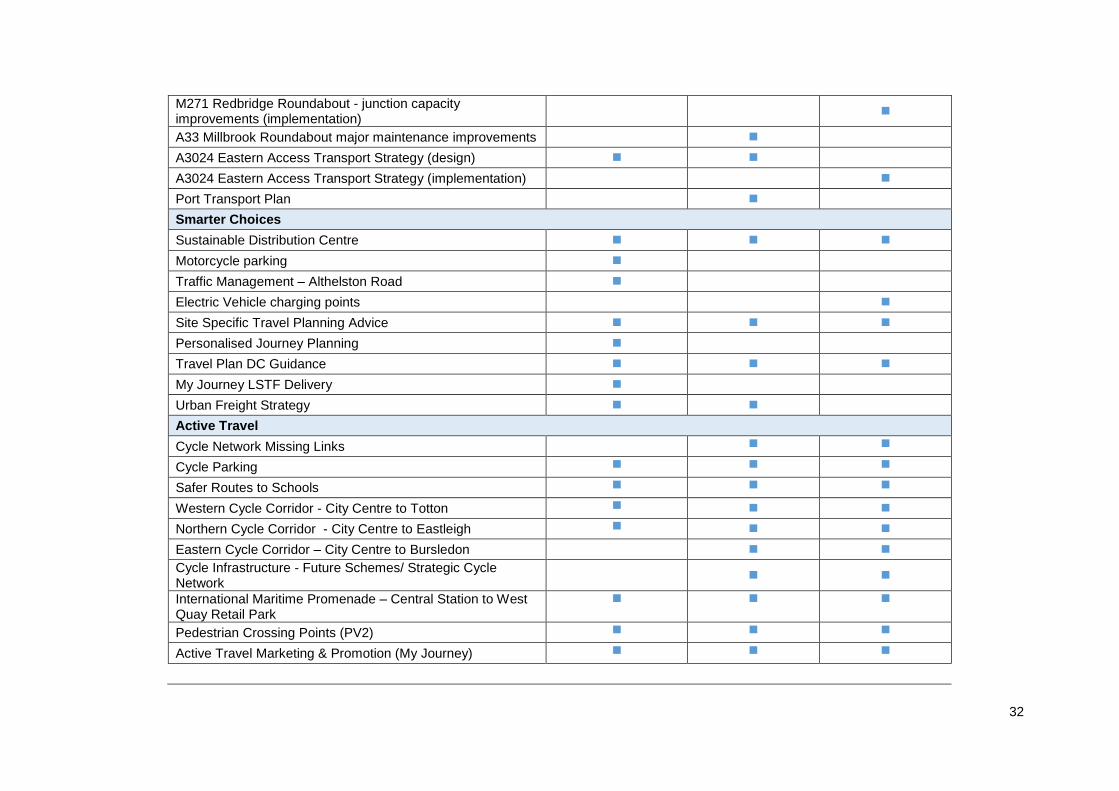
32
M271 Redbridge Roundabout - junction capacity improvements (implementation)
A33 Millbrook Roundabout major maintenance improvements
A3024 Eastern Access Transport Strategy (design)
A3024 Eastern Access Transport Strategy (implementation)
Port Transport Plan
Smarter Choices
Sustainable Distribution Centre
Motorcycle parking
Traffic Management – Althelston Road
Electric Vehicle charging points
Site Specific Travel Planning Advice
Personalised Journey Planning
Travel Plan DC Guidance
My Journey LSTF Delivery
Urban Freight Strategy
Active Travel
Cycle Network Missing Links
Cycle Parking
Safer Routes to Schools
Western Cycle Corridor - City Centre to Totton
Northern Cycle Corridor - City Centre to Eastleigh
Eastern Cycle Corridor – City Centre to Bursledon
Cycle Infrastructure - Future Schemes/ Strategic Cycle Network
International Maritime Promenade – Central Station to West Quay Retail Park
Pedestrian Crossing Points (PV2)
Active Travel Marketing & Promotion (My Journey)
33
Public Realm
Civic Centre Place (design)
Civic Centre Place (implement)
Station Quarter North Improvements Phases 2-4
Kingsbridge Lane Public Realm (design)
Legible Cities - Phase 2
Legible Cities - Further Development
District Centres - Bitterne
District Centres - Portswood
Estates Regeneration – Townhill Park
Pedestrian Corridors e.g. Green Mile
Woolston Public Realm Improvements - Centenary Quay
34
Part 4: Looking Forward Microsimulation Traffic Model
As part of the evidence base the existing City Centre Microsimulation Traffic Model is being updated to provide a current 2015 Reference Case.
Up to date traffic data is being used from surveys around the city centre in Summer 2015 along with the changes to the road layout and scale of
known and committed development. Two future year scenarios will be created, for 2019 and 2026, incorporating all the planned development
in the city. This will provide an indication of the performance of the city’s road network showing where the points of stress and delay on the
network are now and in the future.
This pivotal piece of evidence assists the City Council in planning for updating policies and schemes in LTP4 in tandem with the emerging
spatial policies in the Local Plan.
LTP4
The changes at a national and sub-regional level, availability of new data and information means that the longer term policies and aims in LTP3
require updating. To meet the changing needs and environment of Southampton the development of a new LTP will provide a robust evidence
base with strong linkages to other policies such as the City Strategy, Low Emissions Strategy, Solent Strategic Economic Plan and the
emerging City Local Plan. With the increasing focus on the implications of poor air quality and health inequalities this is now an appropriate
time to update the current LTP policies to provide the City Council with a strong platform for making further applications for funding to invest in
transport infrastructure, support the growth of the city, manage the environment and enable the changes to be accommodated.
This updated Implementation Plan 2015-2018 is the first step in the process, at the same time we are updating our evidence base through the
Microsimulation work and other policy, mode or area specific strategies (ITS, Cycling, VMS, Low Emissions, Air Quality, Transport Asset
Management and Road Safety). These will provide the detail on delivery of the overarching LTP update. Using the strong evidence base an
issues and options stage will follow setting out what challenges the city is facing. The identified issues arising from these assessments will then
be used to develop high level transport solutions which can be tested and consulted on.
Based on the evidence and outcomes of the Issues and Options consultation a new long term policy approach and strategy to tackle the
challenges and meet the city’s growth aspirations and obligations. The long-list package of schemes based around corridors or zones will be
appraised to arrive at a preferred package of schemes and strategy. This can be tested through the Microsim model along with the emerging
development aspirations and proposals in the Local Plan
Local Plan
The Local Plan, the city’s spatial planning document, is being prepared during the lifetime of this Implementation Plan. This will identify sites for
all types of economic, commercial and housing development, and the key transport, utilities and education / health infrastructure needed to
35
support this growth looking forward to 2036. It will also include policies against which all planning applications for this development will be
judged. During the preparation period, a detailed transport assessment on the proposed development quantum will be carried out to ascertain
whether how severe the impact of the plans could be on the transport network.
The expected timeline for the Local Plan is for adoption of the new plan in 2018, following completion of the evidence base and examination by
an Inspector to ensure the plan is sound. This aligns with the timeframe of this Implementation Plan and the adoption of LTP4.
Highways England
Highways England’s Route Investment Strategy 1 (RIS1), which sets out their long term investment programme to 2021 names three major
projects on the Strategic Road Network (SRN) in the vicinity of Southampton that will be planned and could see commencement of delivery
during this Implementation Plan.
M27 Junctions 3-11 Managed Motorways, which aims to increase capacity by introducing hard shoulder running, variable speed limits
and other management measures to ensure traffic runs smoothly in times of high congestion;
M271/A33 Redbridge Roundabout upgrade, to increase the capacity of junction, and;
M27-Southampton Junctions, which consists of four elements, is expected to relieve pressure on the M27 corridor and downstream
junctions (Js3, 5 & 7), by improving the route into Southampton from M27 Junction 8 via A3024, and includes: capacity upgrades to
Junction 8, Windhover Roundabout (A27/A3024/A3025), replacement of Northam Rail Bridge increasing its width from 2 to 4 lanes, and
major highway improvements aimed at improving traffic movements and capacity on the Eastern Access Corridor (A3024) into the city
centre.
These projects are intended to be implemented over the period from 2015 to 2021 and are intended to support employment, housing and
access to the Port. They are currently at an option identification stage to inform more detailed development including engagement with wider
stakeholders. Following these stages the schemes will prepare for construction through detailed design and consultation.
The City Council will work with Highways England on these projects to ensure that they can deliver improvements that the city can benefit from
with adversely affecting the operation of the network.

36
This written information is available, on
request, in larger print, Braile, on audio tape
and on disk. It is also available in other
languages. Please contact 023 8083 xxxx
www.southampton.gov.uk