carlisle local plan transport modelling report
TRANSCRIPT
Cumbria County Council
Serving the people of Cumbria
cumbria.gov.uk
Carlisle Local Plan
Transport Modelling
Report
February 2015

Carlisle Local Plan Transport Modelling Report
February 2015 Page i
Executive Summary
i. The Carlisle Local Plan transport modelling report summarises the transport modelling study undertaken to assess the cumulative impact of the local plan proposals. The results of this study inform a further study which identifies potential transport improvements in Carlisle. This report summarises the methodology and results of the modelling study and forms part of the evidence base for the Carlisle Local Plan.
ii. The study used the Carlisle transport model to assess the local plan proposals. The Carlisle transport model is a traffic model of the Carlisle urban area and the surrounding district. It covers the morning and evening weekday peak periods and was updated in 2013 following the opening of the Carlisle Northern Development Route.
iii. The study considers future years of 2025 and 2030 in line with the plan period. Traffic growth was applied to the base traffic demand to take account of forecast changes in traffic demand in line with guidance from the Department of Transport.
iv. The model was amended to include changes to the highway network, which include proposed site accesses for the development sites. The traffic generation and distribution of future developments was also estimated and included within the model.
v. The results of the forecast scenarios were then analysed to assess the impact of the local plan proposals. The model outputs include traffic flows, queues, delays and the ratio of flow to capacity, which is a measure of congestion.
vi. The results show that congestion and journey times are forecast to increase on key routes from 2013 to 2025, and the local plan proposals would have a further impact. The development at South Carlisle from 2025 is also shown to further increase congestion, as well as journey times along the London Road corridor.
vii. The measures identified in the improvements study have also been tested in the strategic model as part of this study. The aim of this is to assess their cumulative impact. The results of this assessment show that the improvements would help to mitigate the transport impacts of the local plan.
viii. Further details on the nature and cost of improvements proposed to support the Carlisle Local Plan are provided in the Carlisle Transport Improvements Study report by Parsons Brinckerhoff. A summary of this study which details the key themes and findings is also available. The improvements study informs Carlisle City Council’s Infrastructure Delivery Plan, which forms part of the evidence base for the local plan.

Carlisle Local Plan Transport Modelling Report
February 2015 Page ii

Carlisle Local Plan Transport Modelling Report
February 2015 Page iii
Contents
1 Introduction ........................................................................................................ 1
1.1 Introduction .......................................................................................................... 1
1.2 Contents .............................................................................................................. 1
2 Methodology ...................................................................................................... 2
2.1 Overview .............................................................................................................. 2
2.2 Carlisle transport model ....................................................................................... 2
2.3 Forecasting .......................................................................................................... 2
3 Development scenarios .................................................................................... 4
3.1 Introduction .......................................................................................................... 4
3.2 Scenario 1: 2025 Base ......................................................................................... 5
3.3 Scenario 2: 2025 Local Plan ................................................................................ 6
3.4 Scenario 3: 2030 Local Plan ................................................................................ 7
3.5 Trip distribution .................................................................................................... 8
3.6 Summary of development scenarios .................................................................... 9
4 Traffic growth ................................................................................................... 11
4.1 Introduction ........................................................................................................ 11
4.2 Forecast traffic demand ..................................................................................... 11
5 Results .............................................................................................................. 13
5.1 Introduction ........................................................................................................ 13
5.2 2013 Base results .............................................................................................. 14
5.3 Scenario 1: 2025 Base results ........................................................................... 15
5.4 Scenario 2: 2025 Local Plan results ................................................................... 16
5.5 Scenario 3: 2030 Local Plan results ................................................................... 17
5.6 Improvement schemes ....................................................................................... 18
5.7 Summary ........................................................................................................... 22
6 Conclusion ....................................................................................................... 25
6.1 Summary ........................................................................................................... 25

Carlisle Local Plan Transport Modelling Report
February 2015 Page iv
Appendix
Appendix A:
Figure A1: 2025 Base development
Figure A2: 2025 Local Plan development
Site details and trip generation
Trip rates and TRICS output
Appendix B:
Traffic growth factors
Appendix C:
Table C1: Forecast junction performance
Figure C1: Forecast junction performance – base network
Figure C2: Forecast junction performance – junction improvements
Figure C3: Forecast junction performance – sustainable improvements

Carlisle Local Plan Transport Modelling Report
February 2015 Page v
List of Tables
Table 3.1: Scenario 1: 2025 Base trip generation ...................................................... 6
Table 3.2: Scenario 2: 2025 Local Plan trip generation .............................................. 7
Table 3.3: Scenario 3: 2030 Local Plan trip generation .............................................. 7
Table 3.4: Forecast development sites traffic demand ............................................. 10
Table 3.5: Forecast pass-by trips traffic demand ..................................................... 10
Table 3.6: Forecast traffic demand including specific development sites ................. 10
Table 4.1: Forecast traffic demand excluding specific development sites ................ 12
Table 5.1: 2013 Base: junction performance results ................................................ 14
Table 5.2: 2013 Base: journey time summary results............................................... 15
Table 5.3: Scenario 1 2025 Base: junction performance results .............................. 15
Table 5.4: Scenario 1 2025 Base: journey time summary results............................. 16
Table 5.5: Scenario 2 2025 Local Plan: junction performance results ...................... 16
Table 5.6: Scenario 2 2025 Local Plan: journey time summary results .................... 17
Table 5.7: Scenario 3 2030 Local Plan: junction performance results ...................... 17
Table 5.8: Scenario 3 2030 Local Plan: journey time summary results .................... 18
Table 5.9: Highway improvements: junction performance results ............................ 19
Table 5.10: Scenario 2 2025 Local Plan with highway improvements: journey time summary results ....................................................................................................... 20
Table 5.11: Scenario 3 2030 Local Plan with highway improvements: journey time summary results ....................................................................................................... 20
Table 5.12: Sustainable improvements: junction performance results ..................... 21
Table 5.13: Scenario 2 2025 Local Plan with sustainable improvements: journey time summary results ....................................................................................................... 21
Table 5.14: Scenario 3 2030: Local Plan with sustainable improvements: journey time summary results ............................................................................................... 22
Table 5.15: Summary of over capacity junction performance results ....................... 22
Table 5.16: Average speed across Carlisle in kilometres per hour .......................... 23

Carlisle Local Plan Transport Modelling Report
February 2015 Page vi

Carlisle Local Plan Transport Modelling Report
February 2015 Page 1
1 Introduction
1.1 Introduction
1.1.1 Cumbria County Council has undertaken a transport modelling study to help support the development of Carlisle City Council’s Local Plan. The plan is the city council’s strategy for growth from 2015 to 2030. The city council has a statutory duty to prepare a local plan, which will be used to guide development and inform planning decisions once adopted.
1.1.2 The purpose of the modelling study is to assess the cumulative transport impact of the local plan proposals. The study identifies locations on the highway network which are forecast to suffer increased delays as a result of the proposals.
1.1.3 This report summarises the methodology and results of the modelling study.
1.1.4 The results of this study are used in further work to help identify potential transport improvements in the Carlisle Transport Improvements Study. The improvements study informs Carlisle City Council’s Infrastructure Delivery Plan, which forms part of the evidence base for the local plan.
1.2 Contents
1.2.1 The report includes the following information:
The methodology of the transport study
The assumptions used for forecasting future travel demand
A summary of the key results
Conclusions and recommendations

Carlisle Local Plan Transport Modelling Report
February 2015 Page 2
2 Methodology
2.1 Overview
2.1.1 The transport modelling study has been undertaken using Cumbria County Council’s Carlisle transport model.
2.1.2 The methodology used was based on information available in the Department for Transport’s Transport Analysis Guidance (TAG) and the Planning Practical Guidance document Transport evidence bases in plan making.
2.2 Carlisle transport model
2.2.1 The Carlisle transport model is a strategic SATURN traffic model of the Carlisle urban area and surrounding district. The model covers the morning and evening weekday period periods of 8–9am and 5–6pm. The model considers car, light goods vehicle (van) and heavy goods vehicle trips. The car trips are segmented by trip purpose.
2.2.2 The model was originally constructed with a base year of 2008. The model was subsequently updated to a base year of 2013 following the opening of the Carlisle Northern Development Route (CNDR).
2.2.3 The 2013 update of the model included updating both the highway network and the travel demand within the model. Following the update, the model outputs were compared against actual traffic data to validate the results of the model.
2.2.4 Further info on the structure of the Carlisle transport model and the 2013 update are provided in the following report:
Local Model Validation Report, Cumbria County Council, February 2015
2.3 Forecasting
2.3.1 The study considered future years of 2025 and 2030 in line with the plan period. These future year scenarios contained various assumptions relating to potential changes to the highway network and traffic demand.
2.3.2 The future year scenarios considered in this study are shown below. More detail on each scenario is provided in Section 3.
1. 2025 Base
2. 2025 Local Plan
3. 2030 Local Plan
2.3.3 Traffic growth was applied to the base model to account for forecast changes in traffic demand. The growth was calculated based on best practice guidance and future housing targets.

Carlisle Local Plan Transport Modelling Report
February 2015 Page 3
2.3.4 Committed changes to the highway network were included the model. These generally took the form of site accesses for specific sites.
2.3.5 The traffic demand related to specific development sites were added to the model. This involved estimating the traffic demand of each development, and distributing these trips across the model.
2.3.6 The model outputs were used to assess the impact of these scenarios. The model outputs include traffic flows, forecast junction capacity, queues and delays.
2.3.7 The outputs from the model have been used to inform a further study which identifies potential transport improvements in Carlisle. The improvements study identifies potential measures and costs and assesses their effectiveness using detailed modelling software.
2.3.8 The measures identified in the improvements report have also been tested in the strategic model as part of this study to assess their cumulative impact. This is important as improvements to capacity in one location may have further impacts at other locations.
2.3.9 Further details on the nature and cost of improvements proposed to support the Carlisle Local Plan are provided in the Carlisle Transport Improvements Study report by Parsons Brinckerhoff. A summary of this study which details the key themes and findings is also available.

Carlisle Local Plan Transport Modelling Report
February 2015 Page 4
3 Development scenarios
3.1 Introduction
3.1.1 A number of future year demand scenarios were considered as part of the study. The future year demand scenarios are summarised below:
1. 2025 Base
2. 2025 Local Plan
3. 2030 Local Plan
3.1.2 Scenario 1, 2025 Base, is the reference case scenario. It includes development which is currently proposed and considered as likely to occur by 2025. Specifically, this scenario includes new developments which were completed between the model update in July 2013 and September 2014, and committed developments which have received planning permission. It also includes current planning applications as of October 2014 which have not yet been determined but where it is considered that planning permission is likely. This is not meant to be prejudicial to the planning process and is based on guidance on uncertainty as defined by Table A2 in TAG Unit M4 forecasting and uncertainty.
3.1.3 Scenario 2, 2025 Local Plan, is the first local plan scenario. As well as the development in Scenario 1, it includes all development at sites identified within the local plan up to 2025. Some sites are also partially or wholly included in Scenario 1, for example if a planning application has already been submitted for part of a site. The development size of these sites in this scenario has been adjusted to ensure the total development size is not overestimated.
3.1.4 Scenario 3, 2030 Local Plan, is the second local plan scenario. As well as the development in Scenario 2, it includes additional development identified within the local plan from 2025 to 2030 at the broad location of South Carlisle. Full detail is not yet available on the potential layout and distribution of development in this location due to the fact it is proposed for the end of the plan period. Therefore, broad assumptions have been made in regard to development demand and access to the highway network.
3.1.5 The estimated traffic demand for all developments in these scenarios was estimated using the TRICS database. TRICS is a database of traffic and person surveys from different development sites throughout the UK. TRICS is used to estimate the trip generation of a proposed development by selecting surveys from similar sites in the database based on use class, size and location. The output of TRICS includes a trip rate which estimates the traffic or person trip generation per unit of the proposed development.

Carlisle Local Plan Transport Modelling Report
February 2015 Page 5
3.1.6 A separate TRICS analysis was undertaken for each development type included in the future year scenarios. More details on the development assumptions and trip generation in each scenario is provided in the following sections. The trip rates and overall trip generation are provided in the appendix.
3.2 Scenario 1: 2025 Base
3.2.1 Scenario 1 consists of the following assumptions
Developments which have been completed between July 2013 and September 2014
Developments which have been granted planning permission
Developments where planning application has been outlined as of October 2014 which have not yet been determined but are likely to receive planning permission.
3.2.2 Scenario 1 includes a mix of development types, and included residential, offices, light industrial and warehousing and other developments such as leisure or retail. A plan showing the location of development sites in Scenario 1 is provided in the appendix as Figure A1 in Appendix A.
3.2.3 The development included in Scenario 1 includes the following:
4,331 residential dwellings (including 242 student bedrooms)
198,744 square metres of B1/B2/B8 employment development
Mixed/other developments, including:
o 20,404 square metres of B1/B2 employment development
o 1,500 square metres of D1 non-residential institution development
o 154 bedroom hotels development
o 7,446 square metres of A1 food/non-food retail development
o 720 square metres of A3 restaurant/café development
3.2.4 A summary of the trip generation of developments in Scenario 1 is provided in Table 3.1. A detailed list of all the developments in this scenario and their trip generation is given in Appendix A.

Carlisle Local Plan Transport Modelling Report
February 2015 Page 6
Table 3.1: Scenario 1: 2025 Base trip generation
Development type
Vehicle trips
Morning peak Evening peak
In Out In Out
Residential 467 1,306 1,235 723
Employment 683 139 100 520
Mixed/other 620 323 638 831
Total 1,770 1,767 1,973 2,074
3.2.5 The site access for each development was taken from the relevant planning application. Details of the site access location are provided in Appendix A.
3.3 Scenario 2: 2025 Local Plan
3.3.1 Scenario 2 considers specific development sites identified in the local plan up to 2025. Similar to Scenario 1, it includes a mix of development types. A plan showing the location of development sites in Scenario 2 is provided in the appendix as Figure A2 in Appendix A.
3.3.2 The development included in Scenario 2 includes the following:
2,043 urban residential dwellings
1,260 rural residential dwellings
37,415 square metres of B2/B8 employment development
Mixed/other development, including:
o 8,175 square metres of A1 food retail development
o 8,000 square metres of D1 non-residential institution development
City centre regeneration proposals, including:
o 27,260 square metres of A1 non-food retail development
o 1,929 square metres of A3 restaurant/café development
o 6,800 square metres of D2 leisure development
3.3.3 The precise nature of the city centre regeneration proposals is not currently known. The assumptions on the development size and type in the city centre are based on information available in the Carlisle City Centre Development Framework report from July 2014.
3.3.4 A summary of the trip generation of developments in Scenario 2 is provided in Table 3.2. A detailed list of all the developments in this scenario and their trip generation is given in Appendix A.

Carlisle Local Plan Transport Modelling Report
February 2015 Page 7
Table 3.2: Scenario 2: 2025 Local Plan trip generation
Development type
Vehicle trips
Morning peak Evening peak
In Out In Out
Urban residential 306 852 809 474
Rural residential 165 559 501 260
Employment 149 79 36 118
Mixed/other 278 209 561 538
City centre 316 64 364 506
Total 1,215 1,762 2,271 1,896
3.3.5 The site access for each development was assumed based on the location of the site and the surrounding highway network. This assumption was made for the purposes of this study and is not a preference of the council or prejudicial to future planning applications.
3.4 Scenario 3: 2030 Local Plan
3.4.1 Scenario 3 considers development at the broad location of South Carlisle identified in the local plan from 2025 to 2030. This includes residential and employment development.
3.4.2 The development included in Scenario 3 includes the following:
2,825 residential dwellings
40,000 square metres of B1/B2/B8 employment development
3.4.3 A summary of the trip generation of developments in Scenario 3 is provided in Table 3.3. A detailed list of all the developments in this scenario and their trip generation is given in Appendix A.
Table 3.3: Scenario 3: 2030 Local Plan trip generation
Development type
Vehicle trips
Morning peak Evening peak
In Out In Out
Residential 424 1,178 1,119 655
Employment 301 89 51 226
Total 725 1,267 1,170 882
3.4.4 The precise layout and exact quantum of development at South Carlisle is not currently known. It is anticipated that further information will be available as part of an extensive masterplanning process. However, to assess the impact of this development as part of this study, assumptions had to be made on the layout of development in this area.

Carlisle Local Plan Transport Modelling Report
February 2015 Page 8
3.4.5 It has therefore been assumed that a third of the residential development would be accessed from Durdar Road, a third from Carleton Road, and a third from Scalegate Road and Brisco Road. It has also been assumed that the employment development would be accessed from Newbiggin Road, east of Brisco Road.
3.5 Trip distribution
3.5.1 The trips generated by each new development were distributed across the model using a synthetic gravity model. A gravity model distributes trips based on an assumed relationship between the length of a trip and the number of trips made. Traffic is therefore distributed based on the total forecast traffic generation and the cost of travel between origins and destinations in the model.
3.5.2 The cost of travel varies depending on trip purpose, so a separate model was used for each trip purpose. The trips were disaggregated by purpose using data from NTEM.
3.5.3 Before distributing the trips generated by a new development, it was necessary to determine whether all the trips would be ‘new’ to the highway network. For example, a proportion of trips travelling to or from a new development may already be on the network, and would simply divert into the new development. Alternatively, if there are a number of developments nearby, one trip may be linked to multiple developments. Finally, and particularly for food retail developments, people may choose to switch their trip from an existing development to the new development.
3.5.4 For each development, an assumption was made on the proportion of diverted or ‘pass-by’ trips, linked trips and switched or ‘reassigned’ trips. For each of these, a separate process was used to distribute these trips on the network. The remainder of trips were assumed to be ‘new’ and were distributed using the gravity model as defined above.
3.5.5 For pass-by trips, the origin and destination of trips using the nearest key road was analysed. Based on this distribution and the proportion of pass-by trips, each pass-by trip was split into two new trips; one from the existing origin to the new development, and one from the new development to the existing destination.
3.5.6 For linked trips, the proportion of new trips was simply reduced accordingly. For reassigned trips, the proportion of reassigned trips was moved from similar developments in line with existing trip totals to the new development.

Carlisle Local Plan Transport Modelling Report
February 2015 Page 9
3.5.7 The gravity model used for trip distribution in this study was of the form
𝑇𝑖𝑗 = 𝛼𝑂𝑖𝐷𝑗𝑓(𝑐𝑖𝑗) (1)
where 𝑇𝑖𝑗 is the number of trips between origin 𝑖 and destination 𝑗, 𝛼 is a
proportionality factor, 𝑂𝑖 is the total number of trips starting at origin 𝑖, 𝐷𝑗 is the
total number of trips ending at destination 𝑗 and 𝑓(𝑐𝑖𝑗) is a generalised
function of travel costs known as the deterrence function.
3.5.8 The deterrence function used was of the form
𝑓(𝑐𝑖𝑗) = 𝑐𝑖𝑗𝑛 𝑒𝛽𝑐𝑖𝑗 (2)
where 𝑐𝑖𝑗 is the cost of travel between origin 𝑖 and destination 𝑗 and 𝑛, 𝛽 are
parameters to be defined.
3.5.9 Finally, the furness procedure was applied to the future year matrix to ensure the trip totals for each development are correct.
3.5.10 It should be noted that the assumptions regarding the highway network and traffic demand in small rural settlements included in the model are simplistic. The network only includes key routes and traffic demand is aggregated into broad locations. This means that the costs used within the gravity model are often inaccurate for new trips that could potentially stay within the rural settlements. The result of this is that trips generated by new developments in rural locations are all external to that settlement. This represents a pessimistic assessment of trip generation on the wider highway network that is likely to be an overestimate.
3.5.11 Similarly, the assumptions regarding development at South Carlisle are simplistic, due to the current lack of detail regarding development in this area. It is expected that development at South Carlisle will not just include residential housing and employment development, but also a number of associated developments including schools, retail and community facilities. However, the trip generation has not included the effects of this associated development, and assumed no linked trips within the development. This means all residential trips generated are external to South Carlisle. This also represents a pessimistic assessment of trip generation on the wider highway network that is likely to be an overestimate.
3.6 Summary of development scenarios
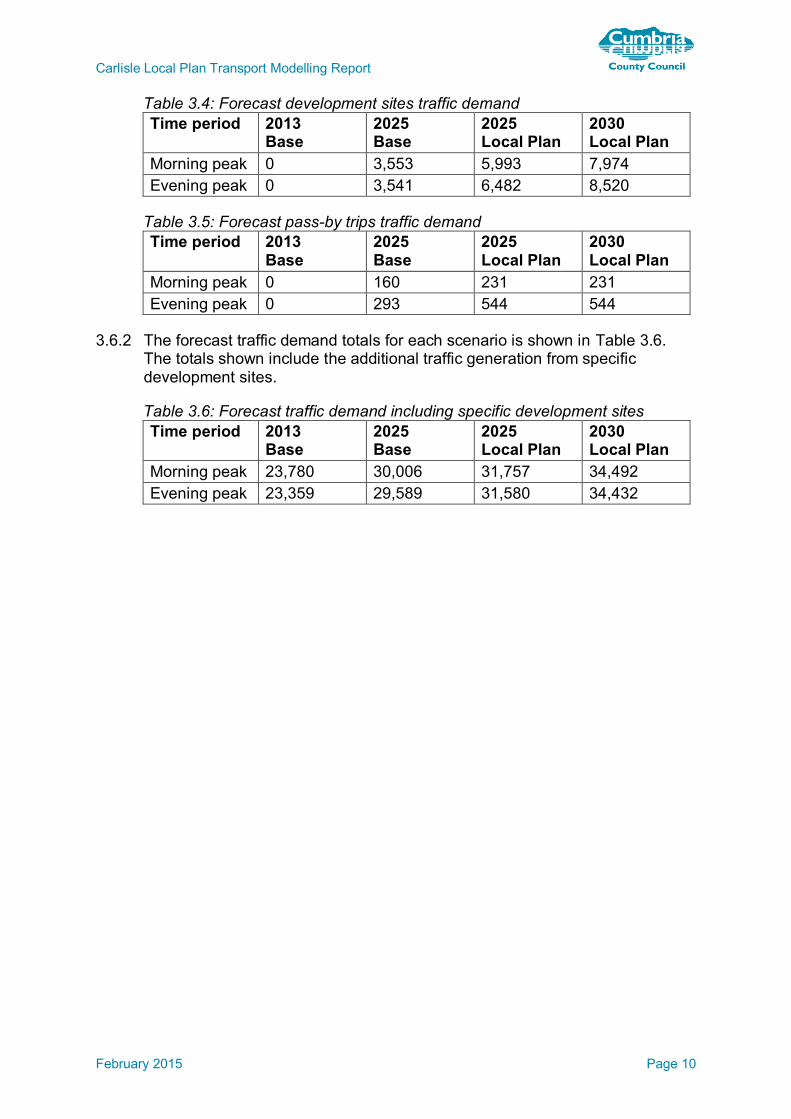
3.6.1 The forecast traffic demand from development sites is shown in Table 3.4. These totals are cumulative, so the 2030 Local Plan totals include traffic demand from Scenario 1, Scenario 2 and Scenario 3. The forecast pass-by trips traffic demand is shown in Table 3.5.
Carlisle Local Plan Transport Modelling Report
February 2015 Page 10
Table 3.4: Forecast development sites traffic demand
Time period 2013 Base
2025 Base
2025 Local Plan
2030 Local Plan
Morning peak 0 3,553 5,993 7,974
Evening peak 0 3,541 6,482 8,520
Table 3.5: Forecast pass-by trips traffic demand
Time period 2013 Base
2025 Base
2025 Local Plan
2030 Local Plan
Morning peak 0 160 231 231
Evening peak 0 293 544 544
3.6.2 The forecast traffic demand totals for each scenario is shown in Table 3.6. The totals shown include the additional traffic generation from specific development sites.
Table 3.6: Forecast traffic demand including specific development sites
Time period 2013 Base
2025 Base
2025 Local Plan
2030 Local Plan
Morning peak 23,780 30,006 31,757 34,492
Evening peak 23,359 29,589 31,580 34,432

Carlisle Local Plan Transport Modelling Report
February 2015 Page 11
4 Traffic growth
4.1 Introduction
4.1.1 Traffic growth is the change over time of the number of cars and goods vehicles on the highway network. When forecasting the performance of the highway network in the future, it is necessary to allow for changes in traffic demand.
4.1.2 Traffic growth can be split into two broad areas:
1. New trips: Changes in population, employment and car ownership
directly affect how many vehicles travel on the highway network.
2. Frequency of trips: Changes in GDP, income and travel costs affect how
frequently people travel
4.2 Forecast traffic demand
4.2.1 Growth in traffic demand in the future year scenarios was considered in line with the fixed demand approach defined in TAG Unit M4 forecasting and uncertainty. A fixed demand approach ignores effects such as induced or suppressed traffic due to changes in travel costs, and changes in travel choice such as peak spreading. A fixed demand approach was used so the impact of the proposed development can be clearly assessed between scenarios without the impact of other variables.
4.2.2 Uncertainty in relation to the growth factors has not been considered as part of the study. It is considered that this is not necessary as the key outputs of the study are the differing impacts between scenarios.
4.2.3 The National Trip End Model (NTEM) dataset represents the Department for Transport’s standard assumptions about growth in travel demand. Access to the dataset is provided through the TEMPRO software.
4.2.4 TEMPRO was used to calculate growth factors for cars based on the future year, trip purpose, time period and the origin and destination of trips. The assumptions within NTEM were adjusted using the alternative assumptions facility within TEMPRO.
4.2.5 The Carlisle Local Plan has an annual average housing target of 565 dwellings from 2015, 70 per cent of which are to be in the Carlisle urban area. This was used as the baseline for future housing numbers. The housing numbers from the specific developments in each scenario were then subtracted from this baseline, and the housing assumptions within TEMPRO were adjusted to match this target.

Carlisle Local Plan Transport Modelling Report
February 2015 Page 12
4.2.6 This ensures that the impact of new housing is not double-counted by including the developments in the model directly as well as applying a growth factor. The growth factors still account for other forecast changes that may affect traffic growth, such as demographic changes and car ownership.
4.2.7 As a fixed demand approach was used, fuel and income factors were calculated using TAG Databook Table M4.2.1 Forecast fuel price and income adjustment factors. These factors are based on relationships between car travel, household income and fuel costs.
4.2.8 Growth factors for light goods vehicles and heavy goods vehicles were estimated from the National Transport Model, adjusted using local NTEM factors.
4.2.9 The forecast traffic demand totals for each scenario is shown in Table 4.1. The totals shown exclude the additional traffic generation from specific development sites. The traffic generation for specific sites is provided in Section 3.
Table 4.1: Forecast traffic demand excluding specific development sites
Time period 2013 Base
2025 Base
2025 Local Plan
2030 Local Plan
Morning peak 23,780 26,288 25,508 26,258
Evening peak 23,359 25,749 24,520 25,330
4.2.10 The growth factors used in the forecasting are provided in Appendix B.

Carlisle Local Plan Transport Modelling Report
February 2015 Page 13
5 Results
5.1 Introduction
5.1.1 The forecast scenarios were created by amending the network to include new accesses, applying traffic growth and including additional development traffic to the validated base model.
5.1.2 The measures identified in the improvements report have also been tested in the strategic model as part of this study to assess their cumulative impact. This is important as improvements to capacity in one location may have further impacts at other locations.
5.1.3 The forecast scenarios also included a traffic signal optimising procedure. The signal timings contained within the model are fixed, and changes in traffic flow due to developments may result in the original timings becoming inappropriate. The majority of signalised junctions within Carlisle operate on a system which coordinates signal timings, so junction capacity at these locations may be underestimated without optimisation.
5.1.4 The results of the forecast scenarios were then analysed. The model outputs include traffic flows, queues, delays, and the Ratio of Flow to Capacity (RFC) for junctions and links in the model.
5.1.5 The RFC of a movement at a junction is a measure of the congestion of that movement. A movement with a capacity of 1,000 vehicles per hour and a traffic demand of 900 vehicles per hour has an RFC of 0.9.
5.1.6 The maximum ideal junction performance is when all movements have an RFC of around 0.85–0.9. A junction is defined as operating over capacity if it has a movement with an RFC greater than one. Over capacity junctions experience an increased sensitivity to variations in traffic flow which manifest in unreliable journey times and an increase in queuing.
5.1.7 The RFC results for key junctions in the model are included as Table C1 and Figures C1–C3 in Appendix C1. This details the maximum RFC for any movement at each junction for each forecast scenario. This also details the results for the tested improvement schemes.
5.1.8 The RFC of a junction can be an abstract concept as it is not easy to relate to when travelling along a road. To counter this, the impact of development can also be assessed by using journey times. Five routes along key corridors have been selected for journey time analysis, with separate journey times calculated for each direction of travel. These routes are presented below.
1 The RFCs presented in the appendix vary slightly when compared to those in the Carlisle Transport
Improvements Study. This is due to minor amendments to the model to correct errors identified during the infrastructure study. These small variations do not alter the conclusions of either study.

Carlisle Local Plan Transport Modelling Report
February 2015 Page 14
Scotland Road/Kingstown Road between Hardwicke Circus and the M6 J44
Castle Way/Wigton Road between Hardwicke Circus and the CNDR
London Road/ Botchergate/Carleton Road between The Crescent and the M6 J42
Warwick Road/Victoria Place between Georgian Way and the M6 J43
CNDR between Wigton Road and the M6 J44
5.1.9 Finally, it should be noted that these results are average results for the whole peak hour and represent what is forecast to typically occur. As junction operation approaches capacity junction performance becomes more sensitive to variations in traffic flow. This means that small changes in traffic flow can result in large increases in queuing and delay throughout the peak hour.
5.1.10 The following sections summarise the RFC and journey time results from the model for each scenario. The RFC figure for each peak period is from the movement with the highest RFC value.
5.2 2013 Base results
5.2.1 The 2013 Base model represents the current conditions on the Carlisle highway network. The results are taken directly from the validated model.
5.2.2 A summary of overall junction performance across the network is provided in Table 5.1. This gives the total number of junctions in the model approaching capacity, with an RFC greater than 0.9 but less than one, and those over capacity, with an RFC greater than one.
Table 5.1: 2013 Base: junction performance results
RFC criteria Morning peak
Evening peak
No. junctions with 0.9 < RFC < 1.0 6 6
No. junctions with RFC > 1.0 0 2
5.2.3 The results shown that there are a handful of junctions operating close to capacity, and fewer junctions operating over capacity.
5.2.4 A summary of journey time performance across the network is given in Table 5.2. This gives the journey time in seconds and the average speed in kilometres per hour for the routes defined in Section 5.1.

Carlisle Local Plan Transport Modelling Report
February 2015 Page 15
Table 5.2: 2013 Base: journey time summary results
Route Length
(km)
Morning peak Evening peak
Time (s)
Speed (kph)
Time (s)
Speed (kph)
Scotland Road northbound 3.52 420 30.1 420 30.1
Scotland Road southbound 3.52 421 30.1 432 29.3
Wigton Road eastbound 4.01 425 34.0 453 31.9
Wigton Road westbound 4.01 466 31.1 468 30.9
London Road northbound 5.15 585 31.7 565 32.8
London Road southbound 5.13 579 31.9 629 29.4
Warwick Road eastbound 2.86 337 30.5 366 28.1
Warwick Road westbound 2.87 387 26.7 423 24.5
CNDR northbound 8.29 555 53.8 552 54.1
CNDR southbound 8.28 539 55.3 544 54.8
5.2.5 The results show that there are existing delays on key routes within the city, although these are not excessive. The Warwick Road route is shown to have the slowest average speed.
5.3 Scenario 1: 2025 Base results
5.3.1 Scenario 1 consists of completed developments, developments with planning permission, and live planning applications as of October 2014.
5.3.2 A summary of overall junction performance across the network is provided in Table 5.3. This gives the total number of junctions in the model approaching capacity, with an RFC greater than 0.9 but less than one, and those over capacity, with an RFC greater than one.
Table 5.3: Scenario 1 2025 Base: junction performance results
RFC criteria Morning peak
Evening peak
No. junctions with 0.9 < RFC < 1.0 12 13
No. junctions with RFC > 1.0 5 5
5.3.3 The results shown that there is an increase in both the number of overcapacity junctions, and the number of junctions approaching capacity. This is as a result of additional traffic demand from new developments and other traffic growth factors.
5.3.4 A summary of journey time performance across the network is given in Table 5.4. This gives the journey time in seconds and the average speed in kilometres per hour for the routes defined in Section 5.1.

Carlisle Local Plan Transport Modelling Report
February 2015 Page 16
Table 5.4: Scenario 1 2025 Base: journey time summary results
Route Length
(km)
Morning peak Evening peak
Time (s)
Speed (kph)
Time (s)
Speed (kph)
Scotland Road northbound 3.52 438 28.9 444 28.5
Scotland Road southbound 3.52 468 27.0 504 25.1
Wigton Road eastbound 4.01 466 31.0 503 28.7
Wigton Road westbound 4.01 488 29.6 487 29.6
London Road northbound 5.15 626 29.6 612 30.3
London Road southbound 5.13 588 31.4 655 28.2
Warwick Road eastbound 2.86 360 28.6 433 23.7
Warwick Road westbound 2.87 471 22.0 485 21.3
CNDR northbound 8.29 628 47.5 581 51.4
CNDR southbound 8.28 624 47.8 664 44.9
5.3.5 The results show a general increase in journey times from 2013, particularly on routes entering the city. This is due to the increase in traffic from background traffic growth and the opening of the specific sites identified within Scenario 1.
5.4 Scenario 2: 2025 Local Plan results
5.4.1 Scenario 2 consists of specific development sites identified in the local plan up to 2025, in addition to the development included in Scenario 1.
5.4.2 A summary of overall junction performance across the network is provided in Table 5.5. This gives the total number of junctions in the model approaching capacity, with an RFC greater than 0.9 but less than one, and those over capacity, with an RFC greater than one.
Table 5.5: Scenario 2 2025 Local Plan: junction performance results
RFC criteria Morning peak
Evening peak
No. junctions with 0.9 < RFC < 1.0 25 20
No. junctions with RFC > 1.0 6 7
5.4.3 The results show a further increase in the number of junctions approaching capacity, but a small increase in the number of junctions operating over capacity.
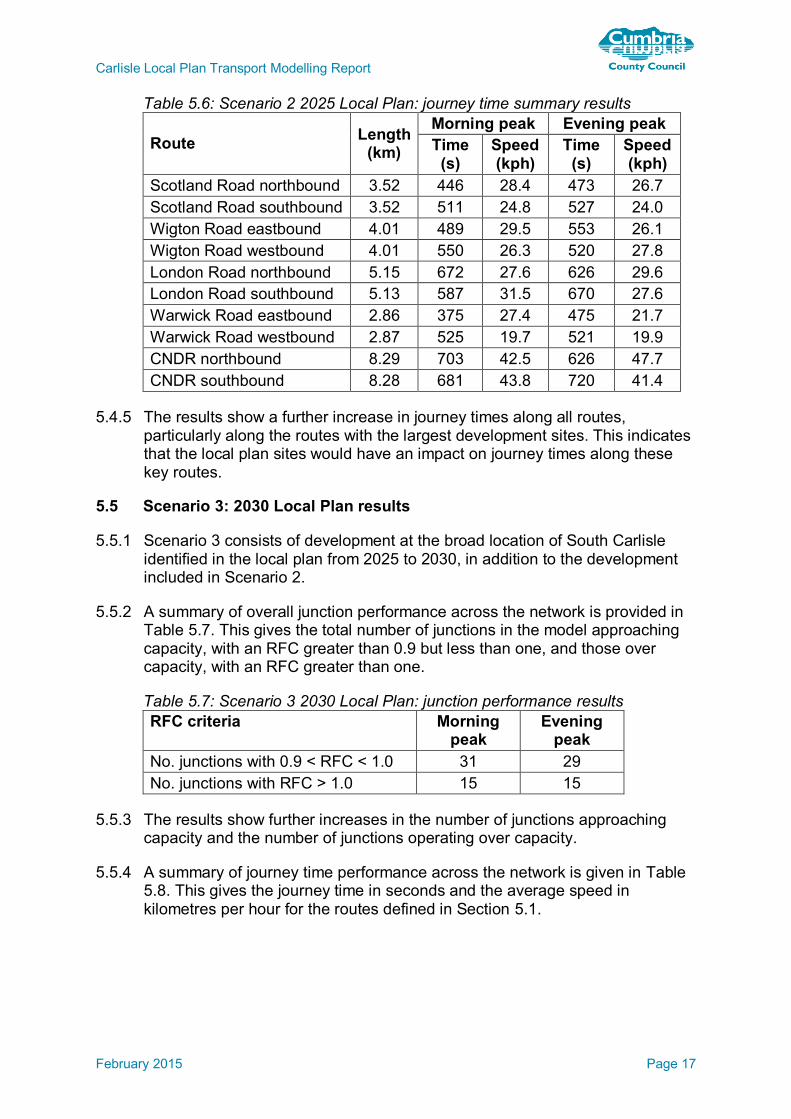
5.4.4 A summary of journey time performance across the network is given in Table 5.6. This gives the journey time in seconds and the average speed in kilometres per hour for the routes defined in Section 5.1.
Carlisle Local Plan Transport Modelling Report
February 2015 Page 17
Table 5.6: Scenario 2 2025 Local Plan: journey time summary results
Route Length
(km)
Morning peak Evening peak
Time (s)
Speed (kph)
Time (s)
Speed (kph)
Scotland Road northbound 3.52 446 28.4 473 26.7
Scotland Road southbound 3.52 511 24.8 527 24.0
Wigton Road eastbound 4.01 489 29.5 553 26.1
Wigton Road westbound 4.01 550 26.3 520 27.8
London Road northbound 5.15 672 27.6 626 29.6
London Road southbound 5.13 587 31.5 670 27.6
Warwick Road eastbound 2.86 375 27.4 475 21.7
Warwick Road westbound 2.87 525 19.7 521 19.9
CNDR northbound 8.29 703 42.5 626 47.7
CNDR southbound 8.28 681 43.8 720 41.4
5.4.5 The results show a further increase in journey times along all routes, particularly along the routes with the largest development sites. This indicates that the local plan sites would have an impact on journey times along these key routes.
5.5 Scenario 3: 2030 Local Plan results
5.5.1 Scenario 3 consists of development at the broad location of South Carlisle identified in the local plan from 2025 to 2030, in addition to the development included in Scenario 2.
5.5.2 A summary of overall junction performance across the network is provided in Table 5.7. This gives the total number of junctions in the model approaching capacity, with an RFC greater than 0.9 but less than one, and those over capacity, with an RFC greater than one.
Table 5.7: Scenario 3 2030 Local Plan: junction performance results
RFC criteria Morning peak
Evening peak
No. junctions with 0.9 < RFC < 1.0 31 29
No. junctions with RFC > 1.0 15 15
5.5.3 The results show further increases in the number of junctions approaching capacity and the number of junctions operating over capacity.
5.5.4 A summary of journey time performance across the network is given in Table 5.8. This gives the journey time in seconds and the average speed in kilometres per hour for the routes defined in Section 5.1.
Carlisle Local Plan Transport Modelling Report
February 2015 Page 18
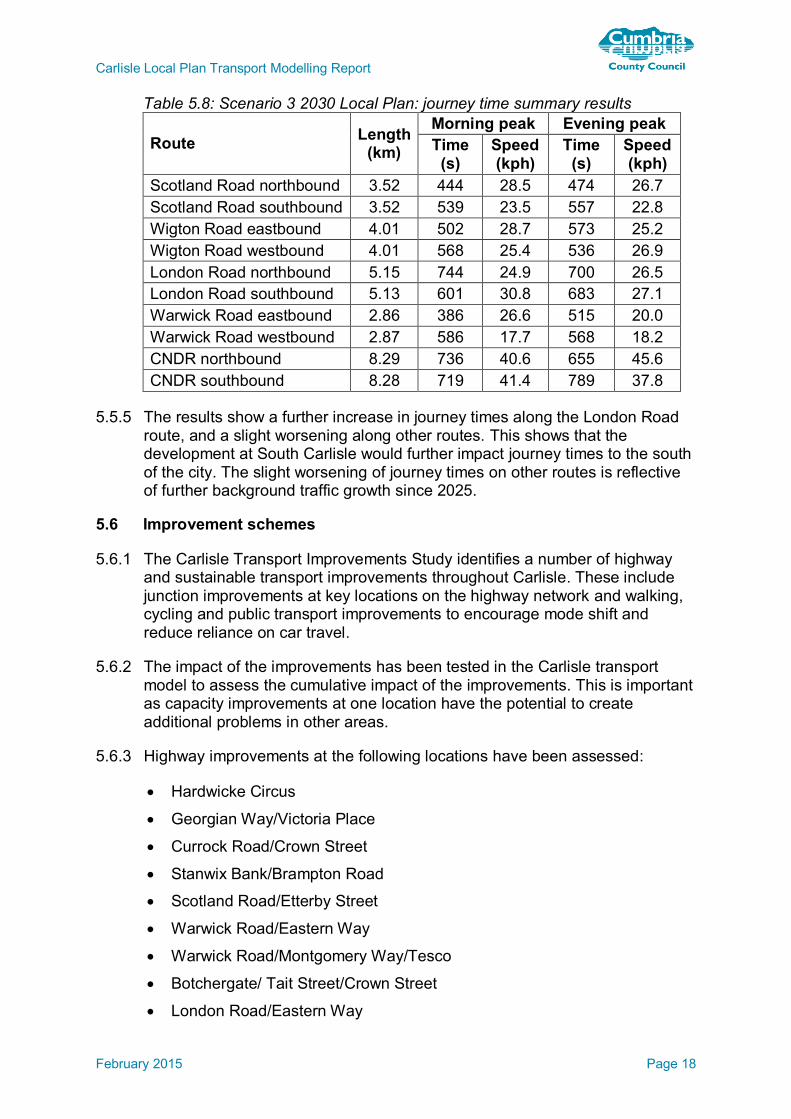
Table 5.8: Scenario 3 2030 Local Plan: journey time summary results
Route Length
(km)
Morning peak Evening peak
Time (s)
Speed (kph)
Time (s)
Speed (kph)
Scotland Road northbound 3.52 444 28.5 474 26.7
Scotland Road southbound 3.52 539 23.5 557 22.8
Wigton Road eastbound 4.01 502 28.7 573 25.2
Wigton Road westbound 4.01 568 25.4 536 26.9
London Road northbound 5.15 744 24.9 700 26.5
London Road southbound 5.13 601 30.8 683 27.1
Warwick Road eastbound 2.86 386 26.6 515 20.0
Warwick Road westbound 2.87 586 17.7 568 18.2
CNDR northbound 8.29 736 40.6 655 45.6
CNDR southbound 8.28 719 41.4 789 37.8
5.5.5 The results show a further increase in journey times along the London Road route, and a slight worsening along other routes. This shows that the development at South Carlisle would further impact journey times to the south of the city. The slight worsening of journey times on other routes is reflective of further background traffic growth since 2025.
5.6 Improvement schemes
5.6.1 The Carlisle Transport Improvements Study identifies a number of highway and sustainable transport improvements throughout Carlisle. These include junction improvements at key locations on the highway network and walking, cycling and public transport improvements to encourage mode shift and reduce reliance on car travel.
5.6.2 The impact of the improvements has been tested in the Carlisle transport model to assess the cumulative impact of the improvements. This is important as capacity improvements at one location have the potential to create additional problems in other areas.
5.6.3 Highway improvements at the following locations have been assessed:
Hardwicke Circus
Georgian Way/Victoria Place
Currock Road/Crown Street
Stanwix Bank/Brampton Road
Scotland Road/Etterby Street
Warwick Road/Eastern Way
Warwick Road/Montgomery Way/Tesco
Botchergate/ Tait Street/Crown Street
London Road/Eastern Way

Carlisle Local Plan Transport Modelling Report
February 2015 Page 19
Wigton Road/Caldcotes
Shaddongate/Junction Street
Wigton Road/Orton Road
5.6.4 It is not possible to directly assess the impact of the proposed sustainable transport improvements in the Carlisle transport model. However, the improvements study concludes that the successful implementation of these measures has the potential to reduce peak hour traffic demand by up to five per cent. The impact of these improvements has therefore been tested in line with this conclusion by reducing traffic demand by five per cent. Further details on the nature and cost of improvements proposed to support the Carlisle Local Plan are provided in the Carlisle Transport Improvements Study report by Parsons Brinckerhoff. A summary of this study which details the key themes and findings is also available.
5.6.5 A summary of the impact of the highway improvements is shown in Table 5.9.
Table 5.9: Highway improvements: junction performance results
Scenario RFC criteria Morning
peak Evening
peak
Scenario 2: 2025 Local Plan
No. junctions with 0.9 < RFC < 1.0
15 19
No. junctions with RFC > 1.0
7 5
Scenario 3: 2030 Local Plan
No. junctions with 0.9 < RFC < 1.0
27 25
No. junctions with RFC > 1.0
11 12
5.6.6 The results show that there is a small reduction in the number of over capacity junctions in Scenario 2, with a larger decrease in the number of junctions approaching capacity. A reduction in the number of both the number of over capacity junctions and junctions approaching capacity is also shown in Scenario 3. This shows that the highway improvements would successfully reduce congestion in Carlisle.
5.6.7 The impact of the highway improvements on journey times is shown in Table 5.10 and Table 5.11 for Scenario 2 and Scenario 3 respectively.

Carlisle Local Plan Transport Modelling Report
February 2015 Page 20
Table 5.10: Scenario 2 2025 Local Plan with highway improvements: journey time summary results
Route Length
(km)
Morning peak Evening peak
Time (s)
Speed (kph)
Time (s)
Speed (kph)
Scotland Road northbound 3.52 451 28.1 486 26.1
Scotland Road southbound 3.52 490 25.9 518 24.4
Wigton Road eastbound 4.01 491 29.4 553 26.1
Wigton Road westbound 4.01 550 26.2 524 27.5
London Road northbound 5.15 656 28.3 621 29.9
London Road southbound 5.13 605 30.5 711 26.0
Warwick Road eastbound 2.86 370 27.8 442 23.3
Warwick Road westbound 2.87 473 21.9 459 22.5
CNDR northbound 8.29 710 42.0 632 47.2
CNDR southbound 8.28 657 45.3 707 42.2
Table 5.11: Scenario 3 2030 Local Plan with highway improvements: journey time summary results
Route Length
(km)
Morning peak Evening peak
Time (s)
Speed (kph)
Time (s)
Speed (kph)
Scotland Road northbound 3.52 452 28.0 490 25.8
Scotland Road southbound 3.52 519 24.4 541 23.4
Wigton Road eastbound 4.01 502 28.8 593 24.3
Wigton Road westbound 4.01 566 25.5 538 26.8
London Road northbound 5.15 718 25.8 660 28.1
London Road southbound 5.13 620 29.8 738 25.0
Warwick Road eastbound 2.86 385 26.7 475 21.6
Warwick Road westbound 2.87 532 19.4 490 21.1
CNDR northbound 8.29 748 39.9 656 45.5
CNDR southbound 8.28 702 42.5 767 38.9
5.6.8 The results show that the impact on journey times varies depending on the route.
5.6.9 A summary of the impact of both the sustainable transport improvements and highway improvements is shown in Table 5.12.

Carlisle Local Plan Transport Modelling Report
February 2015 Page 21
Table 5.12: Sustainable improvements: junction performance results
Scenario RFC criteria Morning
peak Evening
peak
Scenario 2: 2025 Local Plan
No. junctions with 0.9 < RFC < 1.0
10 15
No. junctions with RFC > 1.0
5 2
Scenario 3: 2030 Local Plan
No. junctions with 0.9 < RFC < 1.0
17 21
No. junctions with RFC > 1.0
8 7
5.6.10 The results show a further reduction in both the number of overcapacity junctions and the number of junctions approaching capacity in both scenarios. This suggests that the successful implementation of the sustainable transport measures would reduce congestion throughout Carlisle.
5.6.11 The impact of both the sustainable transport improvements and the highway improvements on journey times is shown in Table 5.13 and Table 5.14 for Scenario 2 and Scenario 3 respectively.
Table 5.13: Scenario 2 2025 Local Plan with sustainable improvements: journey time summary results
Route Length
(km)
Morning peak Evening peak
Time (s)
Speed (kph)
Time (s)
Speed (kph)
Scotland Road northbound 3.52 450 28.1 486 26.0
Scotland Road southbound 3.52 487 26.0 514 24.6
Wigton Road eastbound 4.01 492 29.3 557 25.9
Wigton Road westbound 4.01 552 26.1 519 27.8
London Road northbound 5.15 652 28.4 621 29.9
London Road southbound 5.13 609 30.3 715 25.8
Warwick Road eastbound 2.86 368 28.0 441 23.3
Warwick Road westbound 2.87 470 22.0 463 22.3
CNDR northbound 8.29 708 42.2 625 47.8
CNDR southbound 8.28 667 44.7 708 42.1
Carlisle Local Plan Transport Modelling Report
February 2015 Page 22
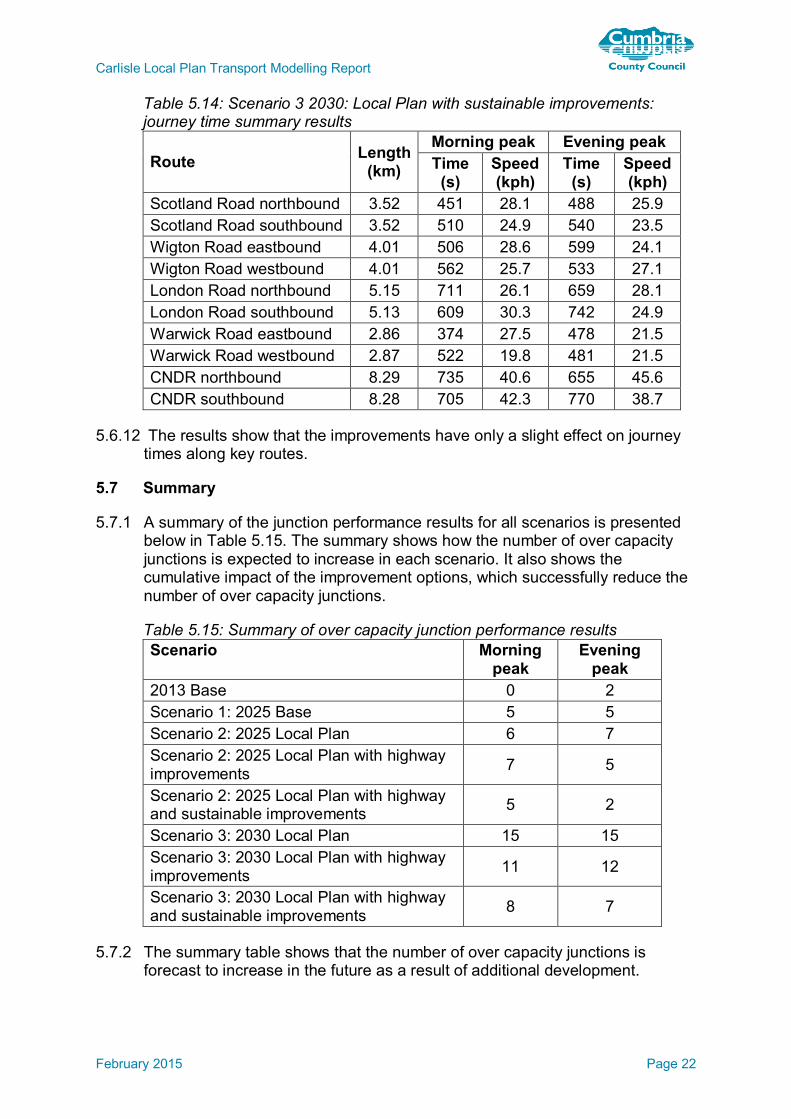
Table 5.14: Scenario 3 2030: Local Plan with sustainable improvements: journey time summary results
Route Length
(km)
Morning peak Evening peak
Time (s)
Speed (kph)
Time (s)
Speed (kph)
Scotland Road northbound 3.52 451 28.1 488 25.9
Scotland Road southbound 3.52 510 24.9 540 23.5
Wigton Road eastbound 4.01 506 28.6 599 24.1
Wigton Road westbound 4.01 562 25.7 533 27.1
London Road northbound 5.15 711 26.1 659 28.1
London Road southbound 5.13 609 30.3 742 24.9
Warwick Road eastbound 2.86 374 27.5 478 21.5
Warwick Road westbound 2.87 522 19.8 481 21.5
CNDR northbound 8.29 735 40.6 655 45.6
CNDR southbound 8.28 705 42.3 770 38.7
5.6.12 The results show that the improvements have only a slight effect on journey times along key routes.
5.7 Summary
5.7.1 A summary of the junction performance results for all scenarios is presented below in Table 5.15. The summary shows how the number of over capacity junctions is expected to increase in each scenario. It also shows the cumulative impact of the improvement options, which successfully reduce the number of over capacity junctions.
Table 5.15: Summary of over capacity junction performance results
Scenario Morning peak
Evening peak
2013 Base 0 2
Scenario 1: 2025 Base 5 5
Scenario 2: 2025 Local Plan 6 7
Scenario 2: 2025 Local Plan with highway improvements
7 5
Scenario 2: 2025 Local Plan with highway and sustainable improvements
5 2
Scenario 3: 2030 Local Plan 15 15
Scenario 3: 2030 Local Plan with highway improvements
11 12
Scenario 3: 2030 Local Plan with highway and sustainable improvements
8 7
5.7.2 The summary table shows that the number of over capacity junctions is forecast to increase in the future as a result of additional development.

Carlisle Local Plan Transport Modelling Report
February 2015 Page 23
5.7.3 The highway improvements are forecast to result in a small change in the number of over capacity junctions in 2025 with the local plan, compared to the base scenario. In 2030, there is a further decrease in the number of over capacity junctions. The results in the previous sections detail how the improvements reduce the number of junctions approaching capacity in both scenarios.
5.7.4 The sustainable transport improvements are shown to reduce the number of over capacity junctions in both the 2025 and 2030 local plan scenarios when compared to the base scenario.
5.7.5 The journey time results showed that journey times on key routes are forecast to increase in the future as a result of additional development.
5.7.6 The results for the highway and sustainable transport improvements show that these are only forecast to have a slight effect on journey times along key routes. This indicates that more significant delays may be present for traffic wishing to access these routes, rather than traffic using this route.
5.7.7 This can be considered by analysing the average speed of vehicles across the whole of Carlisle. Table 5.16 shows the average network speed in kilometres per hour across Carlisle for all forecast scenarios and improvement options. The average speed in 2013 is shown to be above 48 kph (30 mph) due to the inclusion of roads with a higher speed limit, such as rural roads.
Table 5.16: Average speed across Carlisle in kilometres per hour
Scenario Morning peak
Evening peak
2013 Base 49.5 48.6
Scenario 1: 2025 Base 46.6 45.8
Scenario 2: 2025 Local Plan 44.4 44.0
Scenario 2: 2025 Local Plan with highway improvements
44.6 44.3
Scenario 2: 2025 Local Plan with highway and sustainable improvements
46.0 45.1
Scenario 3: 2030 Local Plan 42.6 41.9
Scenario 3: 2030 Local Plan with highway improvements
42.8 42.3
Scenario 3: 2030 Local Plan with highway and sustainable improvements
44.5 43.8
5.7.8 The results for the forecast scenarios show that the average speed is expected to decrease with the new development sites, which correlates with the journey time results.
5.7.9 The results also show that the improvement scenarios have the effect of increasing the average network speed. This shows that whilst the improvements have only a slight effect on journey times on key routes, they are successful in reducing overall network delay.

Carlisle Local Plan Transport Modelling Report
February 2015 Page 24
5.7.10 The results therefore demonstrate the junction improvements and the successful implementation of the sustainable transport improvements would help mitigate the transport impact of the local plan.

Carlisle Local Plan Transport Modelling Report
February 2015 Page 25
6 Conclusion
6.1 Summary
6.1.1 The results of the forecast scenarios have been analysed to assess the impact of the local plan proposals. This included assessing the number of junctions forecast to operate over capacity and the journey times along key routes within Carlisle.
6.1.2 The results forecast that the Carlisle Local Plan proposals would increase congestion, based on the maximum RFC of junctions, compared to the base scenario. The sites allocated to 2025 would only have a small effect on the number of over capacity junctions, but would increase the number of junctions close to capacity. Journey times are forecast to increase on key routes in the city, particularly on routes where a large proportion of development is located.
6.1.3 The development at South Carlisle from 2025 to 2030 would further increase the number of junctions close to capacity and the number of over capacity junctions. The results show that journey times would increase on all routes as a result of an extra five years traffic growth. However, the development at South Carlisle would also increase journey times on London Road.
6.1.4 The outputs from the model have been used to identify areas of Carlisle which are forecast to experience increased queuing and delay with the local plan proposals. This information is used in further work to help identify potential highway improvements in Carlisle and the cost of delivering these improvements. This improvements study also includes measures to increase the use of walking, cycling and public transport, along with indicative costs.
6.1.5 The impact of the measures proposed in the improvements study has also been assessed in the transport model. The results of this assessment show that the highway improvements and successful implementation of the sustainable transport improvements would help mitigate the transport impacts of the local plan.
6.1.6 Further details on the nature and cost of improvements proposed to support the Carlisle Local Plan are provided in the Carlisle Transport Improvements Study report by Parsons Brinckerhoff. A summary of this study which details the key themes and findings is also available. The improvements study informs Carlisle City Council’s Infrastructure Delivery Plan, which forms part of the evidence base for the local plan.