local field potentials primarily reflect inhibitory neuron...
TRANSCRIPT

Local field potentials primarily reflect inhibitory neuron activity in1
human and monkey cortex2
Bartosz Teleńczuka,*, Nima Dehghanib,c, Michel Le Van Quyend, Sydney S. Cashe, Eric3
Halgrenf, Nicholas G. Hatsopoulosg, Alain Destexhea4
aUnité de Neurosciences, Information & Complexité, Centre National de la Recherche Scientifique, 911985
Gif-sur-Yvette, France6
bWyss Institute for Biologically-Inspired Engineering, Harvard University, Boston, USA7
cNew England Complex Systems Institute, Cambridge, USA8
dL’Institut du Cerveau et de la Moelle Épinière, UMRS 1127, CNRS UMR 7225, Hôpital de la9
Pitié-Salpêtrière, Paris, France10
eDepartment of Neurology, Massachusetts General Hospital and Harvard Medical School, USA.11
fMultimodal Imaging Laboratory, Departments of Neurosciences and Radiology, University of California San12
Diego, USA.13
gDepartment of Organismal Biology and Anatomy, Committee on Computational Neuroscience, University of14
Chicago, USA15
Abstract16
The local field potential (LFP) is generated by large populations of neurons, but unitary17
contribution of spiking neurons to LFP is not well characterized. We investigated this contribution18
in multi-electrode array recordings from the cerebral cortex of human and monkey by calculating19
the spike-triggered LFP average (st-LFP). The resulting st-LFPs were dominated by broad20
spatio-temporal components due to on-going activity, synaptic inputs and recurrent connectivity.21
To observe the local field of a single spike we applied spatial filtering. The filtered st-LFPs22
were limited to an area of 800 𝜇m from the neuron, and propagated at axonal speed, which is23
consistent with their unitary nature. In addition, we discriminated between putative inhibitory24
and excitatory neurons and found that the former dominated this unitary LFP contribution,25
consistently with previous findings in hippocampal slices. Thus, in human and monkey cortex,26
the LFP may primarily reflect inhibitory neuron activity.27
1. Introduction28
The information in neural systems is distributed across a large number of neurons. In29
order to understand how it is encoded, processed and transformed into actions, we need to30
monitor activities of significant fraction of the neuronal population (Georgopoulos et al., 1986).31
A popular measure of the population activity is the local field potential (LFP), which represents32
*Corresponding authorEmail address: [email protected] (Bartosz Teleńczuk)
1
. CC-BY-NC-ND 4.0 International licensenot peer-reviewed) is the author/funder. It is made available under aThe copyright holder for this preprint (which was. http://dx.doi.org/10.1101/052282doi: bioRxiv preprint first posted online May. 10, 2016;

mass activity of neurons located in small volume around the recording site (Einevoll et al.,33
2013). Although LFP is easy to record, it has proven notoriously difficult to interpret and34
model (Einevoll et al., 2013; Buzsáki et al., 2012). These difficulties partially originate from35
the complexity of neuronal coding (Denker et al., 2011; Saleh et al., 2012), but they also result36
from the very nature of the LFP signal, which represents the neuronal activity only indirectly37
through the flow of the extracellular currents (Einevoll et al., 2013; Bédard et al., 2004). This38
current flow depends on a number of parameters such as the neuronal morphology (Lindén et al.,39
2010), membrane ion channels (Reimann et al., 2013), electric properties of the tissue (Bédard40
et al., 2004), brain area and cortical layer (Lindén et al., 2011) impeding the interpretation of41
the resulting LFP signal.42
We have begun to understand some of the cellular origins of the LFP signal (Buzsáki et al.,43
2012). In particular, simultaneous recordings of spiking activity and LFP have proven to be very44
useful in studying its generation (Teleńczuk and Destexhe, 2015). The relation of spikes to LFP45
can be studied, for example, using spike-triggered LFP average (st-LFP) (Teleńczuk et al., 2015),46
which estimates the LFP associated with each spike of a single neuron. Such measures have been47
used to asses gamma-band synchronisation between neurons (Gray and Singer, 1989), to detect48
spike locking to phase of oscillatory LFP (Destexhe et al., 1999), to characterise the synaptic49
connectivity (Swadlow et al., 2002) and to study travelling cortical waves (Nauhaus et al., 2009).50
In addition, the st-LFP is modulated by the waking state (Destexhe et al., 1999) and stimulus51
contrast (Ray and Maunsell, 2011). However, the direct LFP contributions of transmembrane52
and synaptic currents triggered by a single spike (unitary LFP) could not be identified, because53
st-LFP can not discern them from on-going LFP activity and recurrent activity in the network54
(Einevoll et al., 2013; Nauhaus et al., 2012).55
In this study, we aimed to differentiate the contributions of interneurons and pyramidal56
neurons to LFP recorded from awake humans and non-human primates. We anticipated that the57
long-duration recordings with dense grid of electrodes (Utah array) (Peyrache et al., 2012; Dickey58
et al., 2009) will allow us to separate LFP components of putative interneurons and pyramidal59
neurons. Since cell morphology and connectivity affect the LFP (Lindén et al., 2010, 2011), we60
expected that these two types of neurons should be associated with diverse LFP contributions.61
We found that for both populations st-LFPs are dominated by spatially and temporally broad62
2
. CC-BY-NC-ND 4.0 International licensenot peer-reviewed) is the author/funder. It is made available under aThe copyright holder for this preprint (which was. http://dx.doi.org/10.1101/052282doi: bioRxiv preprint first posted online May. 10, 2016;

components, which might correspond to non-causal relation with the population activity. We63
then estimated spatial filters adapted to the structure of on-going LFP, which allowed us to focus64
on the focal contributions instead. Using this methods we could demonstrate for the first time65
that the interneurons in comparison with pyramidal neurons, interneurons have a more dominant66
unitary contribution to local LFP.67
2. Results68
We investigated the local field potential (LFP) contribution associated with a single spike69
in human and non-human-primate cortex. The data were recorded from the temporal cortex of70
patients who underwent a surgical procedure for the localisation of the epileptic foci (Peyrache71
et al., 2012) and from the pre-motor cortex (PMd) of macaque monkey (Saleh et al., 2012)72
(Figure 1A). The LFP and spiking activity (Figure 1B) were recorded with a 10-by-10 array of73
intracortical electrodes (Utah array, interelectrode distance 400 𝜇m). Spikes of single neurons74
were then discriminated by semi-automatic clustering (see Methods) and their relation to the LFP75
was estimated with the spike-triggered LFP average (st-LFP), that is the average of short LFP76
segments centered around each spike time. This procedure can be applied to LFP signals from77
all electrodes, but always keeping firing of the same neuron as the reference. Thus we obtained a78
spatio-temporal map of the LFP components coincident with a spike of a given neuron (Figure79
1C).80
The estimated st-LFPs are not confined to local neighbourhood of the trigger neuron, but81
they spread rapidly through the entire array (Figure 1C, middle and bottom). In addition,82
many components, even at distant electrodes, appear nearly simultaneously with a spike of the83
reference neuron or they even precede the spike. Such components decay with long spatial scale84
from the position of the neuron (Figure 1D-E). Such non-local and non-causal components can85
not be interpreted as the field generated directly by the active neuron (via the post-synaptic86
potentials), because most neurons synapse at distances no more than 1 mm (Holmgren et al.,87
2003; Levy and Reyes, 2012).88
Thus the st-LFP can not be interpreted as the LFP contribution of post-synaptic currents89
triggered by a single spike either directly (mono-synaptically) or mediated through other neurons90
3
. CC-BY-NC-ND 4.0 International licensenot peer-reviewed) is the author/funder. It is made available under aThe copyright holder for this preprint (which was. http://dx.doi.org/10.1101/052282doi: bioRxiv preprint first posted online May. 10, 2016;
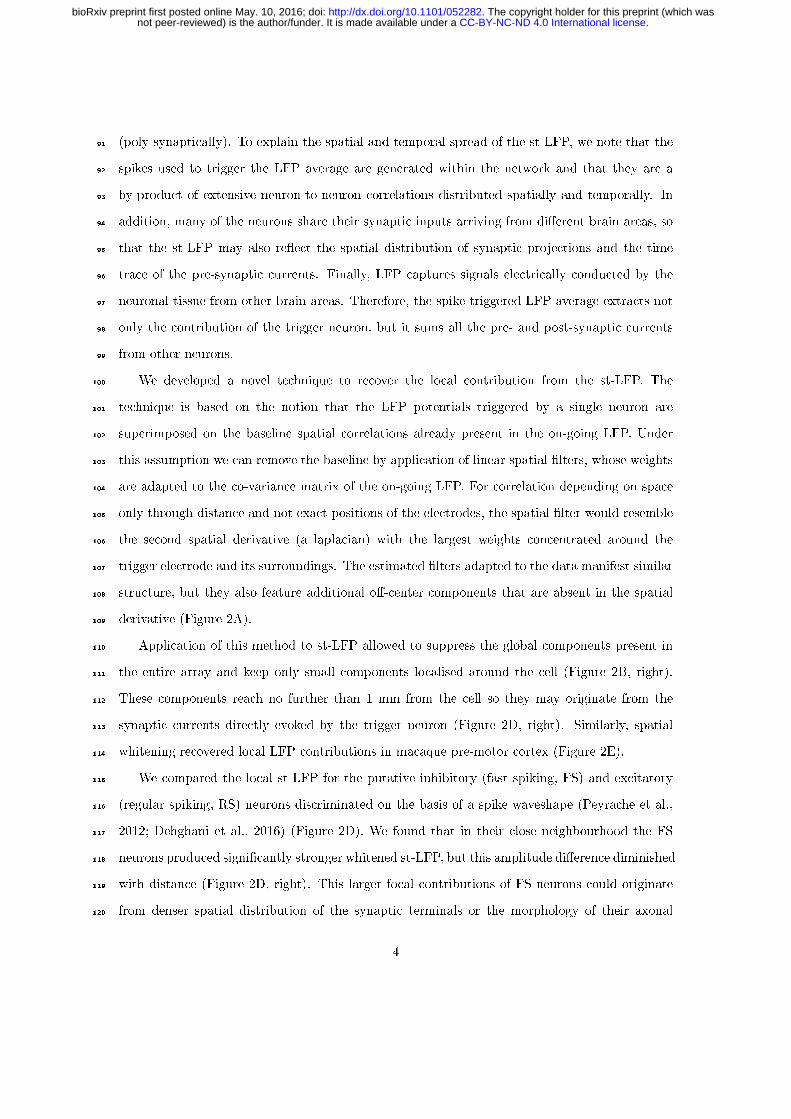
(poly-synaptically). To explain the spatial and temporal spread of the st-LFP, we note that the91
spikes used to trigger the LFP average are generated within the network and that they are a92
by-product of extensive neuron-to-neuron correlations distributed spatially and temporally. In93
addition, many of the neurons share their synaptic inputs arriving from different brain areas, so94
that the st-LFP may also reflect the spatial distribution of synaptic projections and the time95
trace of the pre-synaptic currents. Finally, LFP captures signals electrically conducted by the96
neuronal tissue from other brain areas. Therefore, the spike-triggered LFP average extracts not97
only the contribution of the trigger neuron, but it sums all the pre- and post-synaptic currents98
from other neurons.99
We developed a novel technique to recover the local contribution from the st-LFP. The100
technique is based on the notion that the LFP potentials triggered by a single neuron are101
superimposed on the baseline spatial correlations already present in the on-going LFP. Under102
this assumption we can remove the baseline by application of linear spatial filters, whose weights103
are adapted to the co-variance matrix of the on-going LFP. For correlation depending on space104
only through distance and not exact positions of the electrodes, the spatial filter would resemble105
the second spatial derivative (a laplacian) with the largest weights concentrated around the106
trigger electrode and its surroundings. The estimated filters adapted to the data manifest similar107
structure, but they also feature additional off-center components that are absent in the spatial108
derivative (Figure 2A).109
Application of this method to st-LFP allowed to suppress the global components present in110
the entire array and keep only small components localised around the cell (Figure 2B, right).111
These components reach no further than 1 mm from the cell so they may originate from the112
synaptic currents directly evoked by the trigger neuron (Figure 2D, right). Similarly, spatial113
whitening recovered local LFP contributions in macaque pre-motor cortex (Figure 2E).114
We compared the local st-LFP for the putative inhibitory (fast spiking, FS) and excitatory115
(regular spiking, RS) neurons discriminated on the basis of a spike waveshape (Peyrache et al.,116
2012; Dehghani et al., 2016) (Figure 2D). We found that in their close neighbourhood the FS117
neurons produced significantly stronger whitened st-LFP, but this amplitude difference diminished118
with distance (Figure 2D, right). This larger focal contributions of FS neurons could originate119
from denser spatial distribution of the synaptic terminals or the morphology of their axonal120
4
. CC-BY-NC-ND 4.0 International licensenot peer-reviewed) is the author/funder. It is made available under aThe copyright holder for this preprint (which was. http://dx.doi.org/10.1101/052282doi: bioRxiv preprint first posted online May. 10, 2016;

collaterals as suggested by previous in vitro results (Bazelot et al., 2010). In contrast, we found121
that the raw st-LFP of RS and FS neurons were not significantly different (Figure 1D).122
In addition, the whitened st-LFPs triggered by FS neurons peaked consistently before the123
RS-based st-LFPs (Figure 2D-E, cf. Figure 3). This difference could be explained by an extra124
di-synaptic contribution of the RS neurons: RS neurons would excite the inhibitory interneurons,125
which in turn would contribute to the LFP. In this model the shift in st-LFP latency reflects126
the delay due to synaptic transmission (≈ 2 ms). Importantly, this explanation also accounts127
for the fact that the excitatory and inhibitory unitary LFPs have the same polarity. Identical128
conclusions were reached from unitary LFPs in hippocampal slices (Bazelot et al., 2010), which129
are thus entirely consistent with the present findings.130
The latency of the st-LFPs averaged over electrodes equi-distant to the trigger neuron increased131
gradually with the distance (Figure 2A, left). This is shown more precisely when plotting the132
latency of the trough against the electrode distance from the trigger neuron (Figure 3A). The133
linear dependency between these measures is suggestive of propagation with constant speed,134
which can be estimated from the inverse slope of the linear fit. For the st-LFPs averaged over135
all neurons (Figure 2A) the estimated propagation speed was 2.84 m/s for FS and 0.77 m/s for136
RS; the difference between RS and FS was not significant (bootstrap test, 𝑛 = 1000 repetitions,137
𝑝 > 0.01).138
The propagation speeds might reflect both the synaptic propagation (axonal conduction times139
and synaptic delays), as well as the passive propagation of electric field through the medium140
and indirect correlations between neurons. To focus on the direct effects, we analysed the141
propagation in the whitened st-LFP. We found that the propagation was slower in whitened142
st-LFP in comparison to the raw st-LFP (human: 0.51 m/s for RS neurons, 0.63 m/s, FS;143
monkey: 1.08 m/s, RS, 1.72 m/s, FS; Figure 3B). This may be due to the fact that the144
spatial filtering removes the effects of currents passively conducted through the tissue (volume145
conduction), which can propagate much faster than the synaptically-transmitted signals (Bédard146
and Destexhe, 2012). The combination of the nearly instantaneous (volume-conducted), and147
delayed (synaptically-propagated) st-LFP components may explain the higher overall propagation148
velocity in the non-whitened st-LFP. Interestingly, the propagation speed after whitening is149
consistent with action potential propagation speed in unmyelinated fibers (Debanne et al., 2011),150
5
. CC-BY-NC-ND 4.0 International licensenot peer-reviewed) is the author/funder. It is made available under aThe copyright holder for this preprint (which was. http://dx.doi.org/10.1101/052282doi: bioRxiv preprint first posted online May. 10, 2016;
which further confirms that the whitened st-LFP represents unitary LFPs.151
3. Discussion152
We studied the relationship between neuronal activity and its surrounding electrical field by153
means of simultaneous recordings of single-unit spikes and the LFP signal. We found that the154
spike-triggered LFP can be described by a local component, which reflects single-neuron activity,155
and a diffuse component related to the baseline LFP correlations. Data-driven spatial filters156
recovered the local LFP field of each cell, the unitary LFP, which spreads at distances consistent157
with cortical anatomy and connectivity. The amplitude, peak latencies and propagation of such158
unitary LFP depended on the type of the neuron (inhibitory vs excitatory) used as the trigger.159
Specifically, the inhibitory neurons provide the largest contribution to the LFP in their close160
neighbourhood (< 1 mm).161
The spike-triggered LFP is an estimate of correlation between the (continuous) LFP signal162
and the (point-like) spike trains. As a correlation measure it can not differentiate the causal163
contributions of the spike and its post-synaptic consequences from the incidental correlations164
between LFP and spikes. In line with the argument, we identified st-LFP components that165
were both non-causal (i.e. preceded the spike onset) and non-local (appearing simultaneously in166
distant electrodes, Figure 1C). These components are not specific to the activity of the “trigger”167
neuron, but characterise the local population of neurons and electric properties of neural tissue168
(Einevoll et al., 2013).169
Notwithstanding, we recovered the local correlates of spikes in the LFP using spatial filters170
adapted to the co-variance structure of on-going LFPs (Figure 2A-C). Similar techniques have171
been used as a pre-processing step of blind source separation methods (Hyvärinen et al., 2004)172
and to study neuronal responses to natural stimuli (Schwartz et al., 2006). There is also a173
similarity with the current source density method (CSD) for localising current sources of the174
LFP especially with the inverse CSD formulation (Pettersen et al., 2008; Łęski et al., 2011). An175
alternative, and possibly more direct, method of assessing the spike contribution to LFP consists176
in triggering a spike externally at random times (for example, by means of direct current injection)177
and recording the associated LFP signal. This technique might dissociate the times of spiking178
6
. CC-BY-NC-ND 4.0 International licensenot peer-reviewed) is the author/funder. It is made available under aThe copyright holder for this preprint (which was. http://dx.doi.org/10.1101/052282doi: bioRxiv preprint first posted online May. 10, 2016;

from the neurons’s synaptic inputs and activity of other neurons. However, such recordings in179
intact tissue are technically challenging and to the best of our knowledge have not yet been180
performed in monkey and humans.181
The latency, propagation speed and the spatial extent of the whitened st-LFPs are consistent182
with the hypothesis that they measure the contribution of the post-synaptic currents initiated by183
the “trigger” spike (Figure 2 and 3). Alternatively, the axon-propagating action potential could184
produce similar LFP contribution, albeit at shorter spatial ranges constrained by the axonal185
arborisation (Mitzdorf, 1985). It has been also suggested that the LFP is at least partially186
generated by the dendritic spikes (Nicholson and Llinas, 1971), which could constitute another187
source of the observed st-LFP traces. The fact that the whitened st-LFP propagates with188
a different velocity, approaching unmyelinated axon propagation velocity, constitutes another189
evidence that it represents unitary LFPs.190
Our results are consistent with the finding that the main contribution to the LFP in hippocampal191
slices (the unitary field potentials) is due to inhibitory neurons, while the contribution from192
excitatory neurons is mediated by interneurons, di-synaptically (Bazelot et al., 2010). Two of our193
findings suggest that these conclusions are valid for human and monkey: the putative inhibitory194
neurons produce larger signal in their close neighbourhood compared to the putative excitatory195
neurons; and the excitatory contribution to the LFP lags behind the inhibitory (Figure 2D-E).196
The latency difference might reflect an additional synaptic delay required for the di-synaptic197
activation of the mediating interneuron as suggested by Bazelot et al. (2010), but it was not198
as pronounced as reported in their in vitro study. It remains to be investigated whether this199
difference is specific to the experimental protocol of the present study (behaving awake subjects),200
preparation used (in vivo) or recorded brain area (pre-motor cortex and temporal cortex). In201
the present study, we can not directly address the origin of these cell-type differences. However,202
they are consistent with the differences in the morphologies of the neurons, most notably in the203
degree of axonal arborisation.204
The spike-triggered LFP remains an essential method in answering how activities of single205
neurons are embedded in on-going rhythms (Ray and Maunsell, 2011). In addition, we demonstrated206
that it can be used to asses the specific contribution of the single neurons to the LFP and,207
indirectly, their synaptic connectivity. Future work might clarify whether this contribution is208
7
. CC-BY-NC-ND 4.0 International licensenot peer-reviewed) is the author/funder. It is made available under aThe copyright holder for this preprint (which was. http://dx.doi.org/10.1101/052282doi: bioRxiv preprint first posted online May. 10, 2016;

specific to different brain areas, cortical layers or brain states and whether it might undergo209
dynamic changes during learning. Such an approach provides a new way to investigate the210
interactions between microscopic and macroscopic scales of cortical organisation.211
4. Methods212
4.1. Experimental methods213
Human recordings were acquired from in-patient invasive monitoring of two patients with214
focal epilepsy. The neuroprobe (Utah array) was placed in layer II/III of the middle temporal215
gyrus. This array is silicon-based, made up of 96 microelectrodes with 400 𝜇m spacing, covering216
an area of 4 × 4 mm. Data were sampled at 30 kHz (Cerebrus Blackrock Microsystems). Single217
units were discriminated by using standard clustering methods. The data was recorded under218
normal behaviour (no specific task was administered during this recording). The data were219
scored into awake and slow-wave sleep periods based on EEG and video recordings. The full220
experimental protocol can be found in Peyrache et al. (2012).221
The monkey recordings were performed during the night in the pre-motor cortex of macaque222
monkey (Macaca mulatta) implanted with Utah arrays described above. During a recording223
session, signals from 96 electrodes were amplified (gain of 5,000), band- pass filtered between 0.3224
Hz and 7.5 kHz, and recorded digitally (14-bit) at 30 kHz per channel using a Cerebus acquisition225
system (Blackrock Microsystems). Spike waveform data were sorted off-line (Plexon, Dallas, TX)226
using a user-defined template. All spike waveforms whose mean squared error from this template227
fell below a user-defined threshold were classified as belonging to that unit. The full experimental228
protocol can be found in Dickey et al. (2009).229
We discriminated the putative regular-spiking (RS) and fast-spiking (FS) neurons based on230
their extracellular spike features. The details of the procedure for human and monkey data were231
described elsewhere (Peyrache et al., 2012; Dehghani et al., 2016).232
4.2. Data analysis233
We calculated the spike-triggered average of the LFP (st-LFP) in order to estimate the234
contribution of a single spike to LFP (Schwartz et al., 2006). First, we calculated the average of235
8
. CC-BY-NC-ND 4.0 International licensenot peer-reviewed) is the author/funder. It is made available under aThe copyright holder for this preprint (which was. http://dx.doi.org/10.1101/052282doi: bioRxiv preprint first posted online May. 10, 2016;

short segments of the LFP centered around each spike time of a single trigger neuron. Next, we236
repeated this process across LFP electrodes to obtain a spatio-temporal st-LFP:237
st-LFP𝑖(𝑡) =1
𝑛sp
𝑛sp∑︁𝑘=1
LFP𝑖(𝑡− 𝑡𝑘) (1)
where 𝑖 = 1..96 are the indices of the electrodes and {𝑡𝑘}𝑛sp
𝑘=1 are all 𝑛sp spike times of the trigger238
neuron. To avoid spike artifacts, the LFP signal for the electrode with spikes of the trigger239
neuron was removed from the data. For the purpose of visualisation (Figure 1C and Figure 2C)240
the missing electrodes were replaced with the average of neighbour electrodes.241
We estimated the peak latencies in the population-averaged whitened st-LFP (Figure 3D-E)242
by finding the global minimum of the st-LFP in the time-window of [-10, 15] ms. To estimate243
the peak latency of single-neuron st-LFP (Figure 3A) we fitted an asymmetric Gaussian in the244
time range [−10, 25] ms:245
𝑓(𝑡) = 𝑦0 +𝐴
⎧⎪⎪⎨⎪⎪⎩exp
(︀−(𝑡− 𝛿)2/𝜎2
1
)︀if 𝑡 ≥ 𝛿
exp(︀−(𝑡− 𝛿)2/𝜎2
2
)︀if 𝑡 < 𝛿
(2)
where the baseline 𝑦0, the amplitude 𝐴, the left and right widths 𝜎1, 𝜎2 and the latency 𝛿 are246
fitted using nonlinear least-squares method (Levenberg-Marquardt algorithm).247
To whiten the st-LFPs we first calculated the co-variance matrix of the on-going band-pass248
filtered (15 – 300 Hz) LFP signals (CLFP)𝑖𝑗 = ⟨LFP𝑖(𝑡)LFP𝑗(𝑡)⟩𝑡 (where ⟨·⟩𝑡 denotes temporal249
averaging). The whitening matrixW is calculated by the inverse square root ofCLFP (Hyvärinen250
et al., 2004):251
W = C−1/2LFP = ED−1/2E𝑇 , (3)
where E is a matrix of eigenvectors of CLFP and D is a diagonal matrix with inverse square252
roots of eigenvalues 𝜆𝑖 on its diagonal ((D)𝑖𝑖 = 1/√𝜆𝑖, (D)𝑖𝑗 = 0).253
Given the matrix W the whitening operation amounts to the matrix product of W with the254
spike-triggered LFP:255
9
. CC-BY-NC-ND 4.0 International licensenot peer-reviewed) is the author/funder. It is made available under aThe copyright holder for this preprint (which was. http://dx.doi.org/10.1101/052282doi: bioRxiv preprint first posted online May. 10, 2016;

st-LFP𝑤𝑖 =
96∑︁𝑗=1
(W)𝑖𝑗st-LFP𝑗 (4)
where st-LFP𝑤s are the whitened st-LFPs.256
In pre-processing steps, the LFP signals were band-pass filtered 15 – 300 Hz. The filtering257
was applied in Fourier domain where its response was 1 for all frequencies in the pass-band and258
0 in stop-band. To avoid ringing artifacts, at the corner frequencies the response decayed to 0259
with a profile of a Gaussian with width of 10 Hz.260
Acknowledgments261
Research funded by Centre National de la Recherche Scientifique (CNRS, France), European262
Community Future and Emerging Technologies program (BrainScales FP7-269921; The Human263
Brain Project FP7-604102), National Institutes of Health (NIH grants 5R01NS062092, R01EB009282264
and R01NS045853, R01MH099645) and Office of Naval Research (MURI grant number N00014-13-1-0672).265
References266
Bazelot, M., Dinocourt, C., Cohen, I., Miles, R., 2010. Unitary inhibitory field potentials in the267
CA3 region of rat hippocampus. J. Physiol. (Lond.) 588 (Pt 12), 2077–2090.268
Bédard, C., Destexhe, A., 2012. Modeling local field potentials and their interaction with the269
extracellular medium. In: Brette, R., Destexhe, A. (Eds.), Handbook of Neural Activity270
Measurement. Cambridge University Press, Cambridge, pp. 136–191.271
Bédard, C., Kröger, H., Destexhe, A., 2004. Modeling extracellular field potentials and the272
frequency-filtering properties of extracellular space. Biophys. J. 86 (3), 1829–1842.273
Buzsáki, G., Anastassiou, C. A., Koch, C., 2012. The origin of extracellular fields and274
currents–EEG, ECoG, LFP and spikes. Nat. Rev. Neurosci. 13 (6), 407–420.275
Debanne, D., Campanac, E., Bialowas, A., Carlier, E., Alcaraz, G., 2011. Axon Physiology.276
Physiol. Rev. 91 (2), 555–602.277
10
. CC-BY-NC-ND 4.0 International licensenot peer-reviewed) is the author/funder. It is made available under aThe copyright holder for this preprint (which was. http://dx.doi.org/10.1101/052282doi: bioRxiv preprint first posted online May. 10, 2016;

Dehghani, N., Peyrache, A., Telenczuk, B., Le Van Quyen, M., Halgren, E., Cash, S. S.,278
Hatsopoulos, N. G., Destexhe, A., 2016. Dynamic Balance of Excitation and Inhibition in279
Human and Monkey Neocortex. Sci. Rep. 6, 23176.280
Denker, M., Roux, S., Lindén, H., Diesmann, M., Riehle, A., Grün, S., 2011. The Local Field281
Potential Reflects Surplus Spike Synchrony. Cereb. Cortex 21 (12), 2681–2695.282
Destexhe, A., Contreras, D., Steriade, M., 1999. Spatiotemporal analysis of local field potentials283
and unit discharges in cat cerebral cortex during natural wake and sleep states. J. Neurosci.284
19 (11), 4595–4608.285
Dickey, A. S., Suminski, A., Amit, Y., Hatsopoulos, N. G., 2009. Single-unit stability using286
chronically implanted multielectrode arrays. J. Neurophysiol. 102 (2), 1331–1339.287
Einevoll, G. T., Kayser, C., Logothetis, N. K., Panzeri, S., 2013. Modelling and analysis of288
local field potentials for studying the function of cortical circuits. Nat. Rev. Neurosci. 14 (11),289
770–785.290
Georgopoulos, A. P., Schwartz, A. B., Kettner, R. E., 1986. Neuronal population coding of291
movement direction. Science 233 (4771), 1416–1419.292
Gray, C. M., Singer, W., 1989. Stimulus-specific neuronal oscillations in orientation columns of293
cat visual cortex. Proc. Natl. Acad. Sci. U.S.A 86 (5), 1698–1702.294
Holmgren, C., Harkany, T., Svennenfors, B., Zilberter, Y., 2003. Pyramidal cell communication295
within local networks in layer 2/3 of rat neocortex. J. Physiol. (Lond.) 551 (Pt 1), 139–153.296
Hyvärinen, A., Karhunen, J., Oja, E., 2004. Independent Component Analysis. John Wiley &297
Sons, New York.298
Łęski, S., Pettersen, K. H., Tunstall, B., Einevoll, G. T., Gigg, J., Wójcik, D. K., 2011.299
Inverse current source density method in two dimensions: inferring neural activation from300
multielectrode recordings. Neuroinformatics 9 (4), 401–425.301
Levy, R. B., Reyes, A. D., 2012. Spatial profile of excitatory and inhibitory synaptic connectivity302
in mouse primary auditory cortex. J. Neurosci. 32 (16), 5609–5619.303
11
. CC-BY-NC-ND 4.0 International licensenot peer-reviewed) is the author/funder. It is made available under aThe copyright holder for this preprint (which was. http://dx.doi.org/10.1101/052282doi: bioRxiv preprint first posted online May. 10, 2016;

Lindén, H., Pettersen, K. H., Einevoll, G. T., 2010. Intrinsic dendritic filtering gives low-pass304
power spectra of local field potentials. J. Comput. Neurosci. 29 (3), 423–444.305
Lindén, H., Tetzlaff, T., Potjans, T. C., Pettersen, K. H., Grün, S., Diesmann, M., Einevoll,306
G. T., 2011. Modeling the spatial reach of the LFP. Neuron 72 (5), 859–872.307
Mitzdorf, U., 1985. Current source-density method and application in cat cerebral cortex:308
investigation of evoked potentials and EEG phenomena. Physiol. Rev. 65 (1), 37–100.309
Nauhaus, I., Busse, L., Carandini, M., Ringach, D. L., 2009. Stimulus contrast modulates310
functional connectivity in visual cortex. Nat. Neurosci. 12 (1), 70–76.311
Nauhaus, I., Busse, L., Ringach, D. L., Carandini, M., 2012. Robustness of traveling waves in312
ongoing activity of visual cortex. J. Neurosci. 32 (9), 3088–3094.313
Nicholson, C., Llinas, R., 1971. Field potentials in the alligator cerebellum and theory of their314
relationship to Purkinje cell dendritic spikes. J. Neurophysiol. 34 (4), 509–531.315
Pettersen, K. H., Hagen, E., Einevoll, G. T., 2008. Estimation of population firing rates and316
current source densities from laminar electrode recordings. J. Comput. Neurosci. 24 (3),317
291–313.318
Peyrache, A., Dehghani, N., Eskandar, E. N., Madsen, J. R., Anderson, W. S., Donoghue, J. A.,319
Hochberg, L. R., Halgren, E., Cash, S. S., Destexhe, A., 2012. Spatiotemporal dynamics of320
neocortical excitation and inhibition during human sleep. Proc. Natl. Acad. Sci. U.S.A. 109 (5),321
1731–1736.322
Ray, S., Maunsell, J. H. R., 2011. Network rhythms influence the relationship between323
spike-triggered local field potential and functional connectivity. J. Neurosci. 31 (35),324
12674–12682.325
Reimann, M. W., Anastassiou, C. A., Perin, R., Hill, S. L., Markram, H., Koch, C., 2013. A326
biophysically detailed model of neocortical local field potentials predicts the critical role of327
active membrane currents. Neuron 79 (2), 375–390.328
12
. CC-BY-NC-ND 4.0 International licensenot peer-reviewed) is the author/funder. It is made available under aThe copyright holder for this preprint (which was. http://dx.doi.org/10.1101/052282doi: bioRxiv preprint first posted online May. 10, 2016;

Saleh, M., Takahashi, K., Hatsopoulos, N. G., 2012. Encoding of coordinated reach and grasp329
trajectories in primary motor cortex. J. Neurosci. 32 (4), 1220–1232.330
Schwartz, O., Pillow, J. W., Rust, N. C., Simoncelli, E. P., 2006. Spike-triggered neural331
characterization. J. Vision 6 (4), 484–507.332
Swadlow, H. A., Gusev, A. G., Bezdudnaya, T., 2002. Activation of a cortical column by a333
thalamocortical impulse. J. Neurosci. 22 (17), 7766–7773.334
Teleńczuk, B., Baker, S. N., Kempter, R., Curio, G., 2015. Correlates of a single cortical action335
potential in the epidural EEG. Neuroimage 109, 357–367.336
Teleńczuk, B., Destexhe, A., 2015. Local field potential, relationship to unit activity. In: Jaeger,337
D., Jung, R. (Eds.), Encyclopedia of Computational Neuroscience. Springer, New York, pp.338
1579–1584.339
13
. CC-BY-NC-ND 4.0 International licensenot peer-reviewed) is the author/funder. It is made available under aThe copyright holder for this preprint (which was. http://dx.doi.org/10.1101/052282doi: bioRxiv preprint first posted online May. 10, 2016;

LFP
2 s
spik
es
B C
1 mm
LFP potential
(a.u.)
5 ms
spiketime
-40.0ms
-20.8ms
0.0ms
4.0ms
18.4ms
40.0ms
−3
0
17558 spikes
−10 20−4
1st-LFP (a.u.)
time (ms)
D E2
‒4
1.5
‒2
‒10 0 10 20 ‒10 0 10 20
‒1
1
0.4 1.0 2.0
distance (mm)
1.0
0.1
norm
st-
LFP
am
pl
time (ms)‒10 0 10 20
time (ms)time (ms)
0.4 mm 1.2 mm 2.0 mm
avg s
t-LF
P(a
.u.)
A
V1CS
1 cm
PMd
4 mm
M1
4 mm
2 cm
340
Figure 1: Spikes of single neurons are associated with spatially diffuse and non-causal LFP patterns.(A) Local field potentials and spikes were measured in the premotor cortex of macaques (top) and temporalcortex of human subjects (bottom) using Utah arrays. (B) LFP (top, subset of LFPs recorded simultaneouslyfrom macaque pre-motor cortex) and spikes (bottom, subset of neurons) obtained from Utah array. Neuronswere classified into regular spiking (bottom, blue) and fast spiking (red) types based on spike waveshape. (C)Spatio-temporal spike-triggered LFP average (st-LFP) in human temporal cortex. Top: Average of the st-LFPs(band-pass filtered 15 – 300 Hz, average of 7558 spike-triggered segments) from the electrodes neighbouring withthe trigger neuron. Middle: A color map of st-LFP amplitudes at selected time lags around the spike. Thevalues for missing electrodes were linearly interpolated. Bottom: The st-LFP from all valid electrodes of thearray plotted in time (plotting window adjusted to the gray-shaded segment in top panel). The st-LFP at theneuron position (black rectangle) was replaced with the spike waveform (amplitude normalised). Most st-LFPsexpress non-causal components preceding the spike (spike onset shown with vertical dotted line). (D) st-LFPsaveraged for all electrodes separated from the trigger neuron with same distance (3 distances: 0.4 mm, 1.2 mm,2 mm shown from left to right) and for all neurons classified as inhibitory (red) or excitatory (blue). (E) Thest-LFP trough amplitude as a function of the distance from neuron to LFP electrode.341
14
. CC-BY-NC-ND 4.0 International licensenot peer-reviewed) is the author/funder. It is made available under aThe copyright holder for this preprint (which was. http://dx.doi.org/10.1101/052282doi: bioRxiv preprint first posted online May. 10, 2016;

−7.5
0.0
3.0
filterweight (a.u.)
-40.0ms
-20.8ms
0.0ms
4.0ms
18.4ms
40.0ms
−15 25
time (ms)
−15 25t (ms)
A
D
E
amplitude vs distance
amplitude vs distance
B
C
st-LFP (0.4 mm) st-LFP (0.8 mm) st-LFP (1.2 mm)
st-LFP (0.4 mm) st-LFP (0.8 mm) st-LFP (1.2 mm)
342
Figure 2: The focal LFP of fast spiking (FS) and regular spiking (RS) neurons recovered by spatialdecorrelation (whitening). (A) Spatial filters designed to decorrelate (whiten) the LFP signals. Colors showfilter weights associated with each electrode. Inset : Scaled-up heatmap of weights to whiten a single st-LFP(single row of whitening matrix). (B) Whitened st-LFPs of a single neuron shown in prior (black) and afterwhitening (green). Right : close-up of the whitened st-LFPs enclosed in black rectangle. Most st-LFPs aresuppressed after spatial whitening and only st-LFPs directly adjoining the neuron are conserved. (C) Spatialmaps of whitened st-LFP (top, compare with Figure 1C). (D) The population-averaged st-LFPs after whiteningfor human. Whitened st-LFPs averaged across neurons and electrodes at three distances from the trigger neuron(0.4 mm, 0.8 mm, 1.2 mm; compare with Figure 1D). st-LFP trough amplitude as a function of the distancebetween the neuron and LFP electrode (cf. Figure 1E). The gray horizontal bars at the top indicate significantdifferences between RS and FS neurons (bootstrap test, p < 0.05). The st-LFPs triggered on spikes of fast spikingneurons (red) are of higher amplitude and faster spatial decay (right-most panel). (E) Same as (D) for monkey.343
15
. CC-BY-NC-ND 4.0 International licensenot peer-reviewed) is the author/funder. It is made available under aThe copyright holder for this preprint (which was. http://dx.doi.org/10.1101/052282doi: bioRxiv preprint first posted online May. 10, 2016;

A
Bhuman non-whitened human whitened monkey whitened
−10 150time after spike (ms)
measuredst-LFP(norm.)
0.4 mm0.8 mm1.2 mm1.6 mm2.0 mm2.4 mm
0.4 1.2 2.0distance from trigger neuron (mm)
2.02.53.03.54.04.55.05.56.0
tim
edela
y (
ms)
velocity:1.03 m/s2(r =0.36)
12345678910
peak
late
ncy
(m
s)
344
Figure 3: st-LFPs propagate across cortex. (A) Propagation of the raw st-LFP across the electrode array.From left to right : single-neuron st-LFPs averaged over all electrodes with the same distance from the triggerneuron; the latency of averaged st-LFP troughs (dots) and the linear fit (solid line); the latency of st-LFPs fromeach electrode as a heatmap (blank squares are due to missing electrodes or absence of pronounced st-LFP trough).The latencies increase with the distance supporting the hypothesis of spike-evoked LFP propagation. (B) Thepropagation of population-averaged traces. The trough latencies of whitened st-LFPs shown in Figure 1D (left),2C (middle) and 2D (right) increase with distance. In whitened st-LFPs the RS latencies are consistently largerthan FS at all distances (horizontal bars indicate significant difference between RS and FS neurons, bootstraptest, 𝑝 < 0.01). The propagation velocity estimated from the inverse slope of the linear fit (thin line) is fasterin raw human st-LFP (left) than the whitened human st-LFP (middle). The difference in propagation speedsbetween FS and RS neurons is not significant (bootstrap, 𝑝 > 0.01)345
16
. CC-BY-NC-ND 4.0 International licensenot peer-reviewed) is the author/funder. It is made available under aThe copyright holder for this preprint (which was. http://dx.doi.org/10.1101/052282doi: bioRxiv preprint first posted online May. 10, 2016;