local aggregate assessment 2016 · local aggregate assessment ... to monitor aggregate production...
TRANSCRIPT

Central Bedfordshire, Bedford Borough and Luton Borough Councils’
Local Aggregate Assessment
2016
Central Bedfordshire Council, Bedford Borough Council and Luton Borough Council
Working together
Contact us Write to us: Minerals and Waste Planning Team, Shared Service for Central Bedfordshire, Bedford Borough and Luton Borough Councils, Priory House, Monks Walk, Chicksands, Shefford, Bedfordshire, SG17 5TQ Telephone us: Jerry Smith 0300 300 5881 Email us: [email protected]
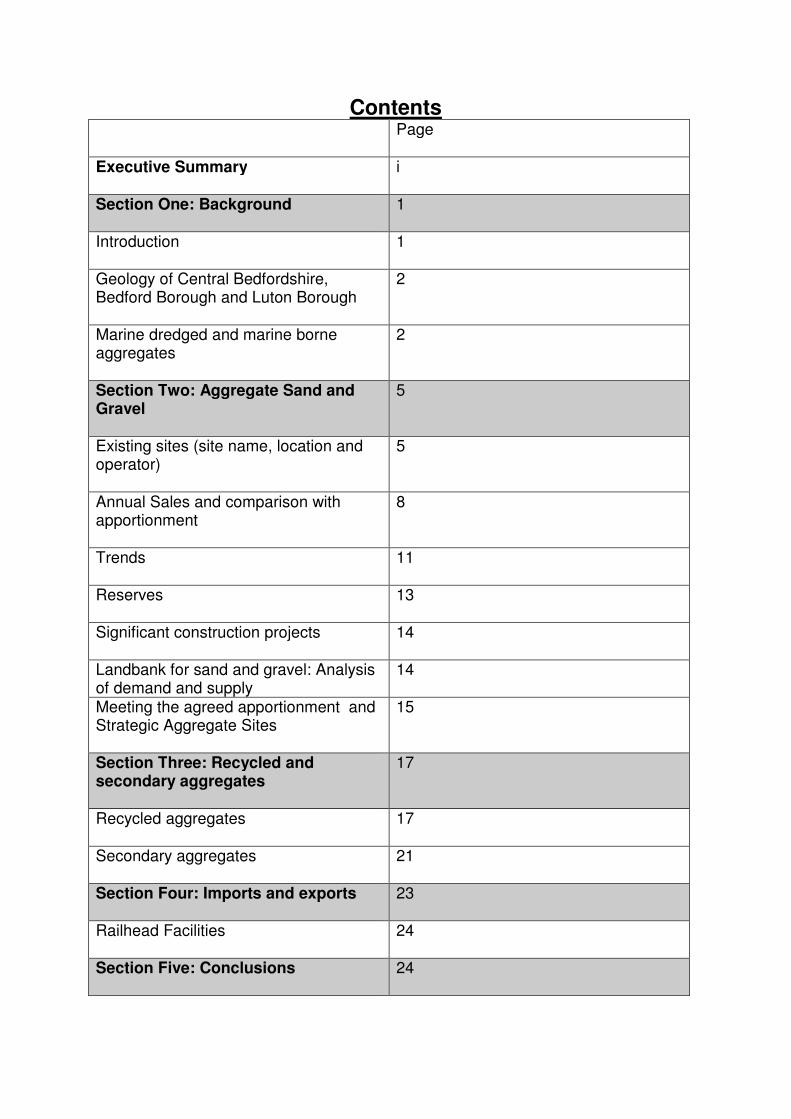
Contents Page
Executive Summary
i
Section One: Background
1
Introduction
1
Geology of Central Bedfordshire, Bedford Borough and Luton Borough
2
Marine dredged and marine borne aggregates
2
Section Two: Aggregate Sand and Gravel
5
Existing sites (site name, location and operator)
5
Annual Sales and comparison with apportionment
8
Trends
11
Reserves
13
Significant construction projects
14
Landbank for sand and gravel: Analysis of demand and supply
14
Meeting the agreed apportionment and Strategic Aggregate Sites
15
Section Three: Recycled and secondary aggregates
17
Recycled aggregates
17
Secondary aggregates
21
Section Four: Imports and exports
23
Railhead Facilities
24
Section Five: Conclusions
24
i
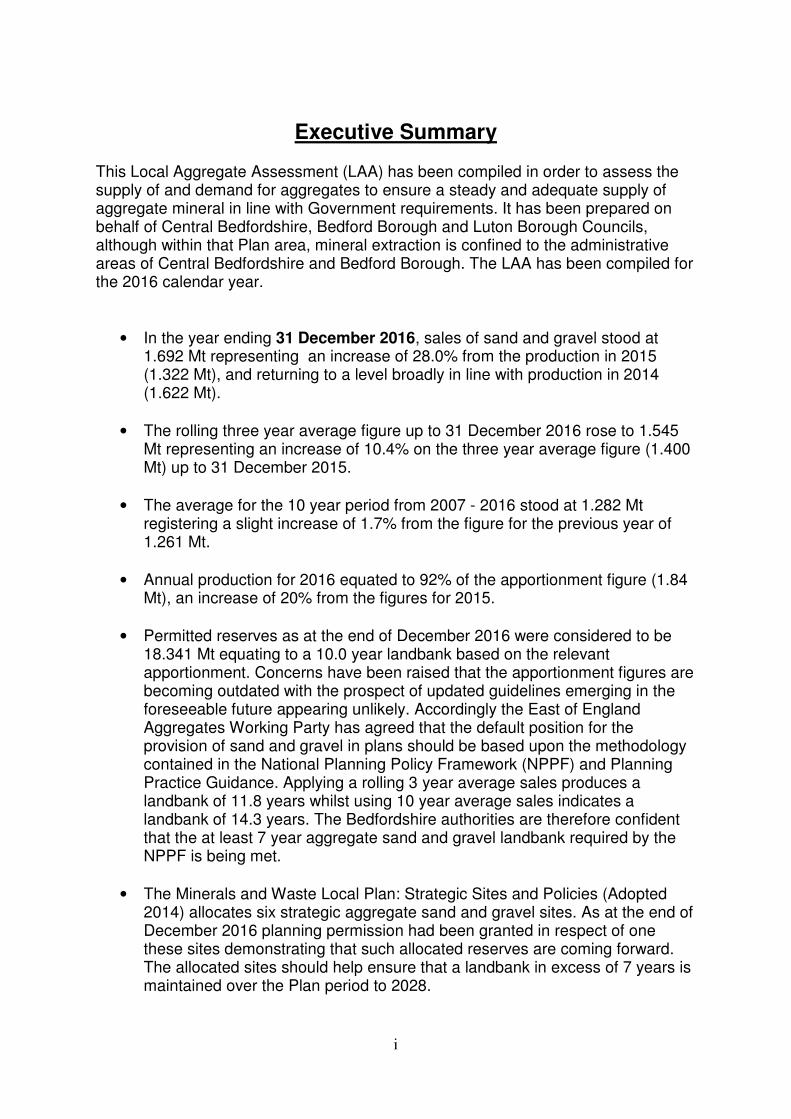
Executive Summary
This Local Aggregate Assessment (LAA) has been compiled in order to assess the supply of and demand for aggregates to ensure a steady and adequate supply of aggregate mineral in line with Government requirements. It has been prepared on behalf of Central Bedfordshire, Bedford Borough and Luton Borough Councils, although within that Plan area, mineral extraction is confined to the administrative areas of Central Bedfordshire and Bedford Borough. The LAA has been compiled for the 2016 calendar year.
• In the year ending 31 December 2016, sales of sand and gravel stood at 1.692 Mt representing an increase of 28.0% from the production in 2015 (1.322 Mt), and returning to a level broadly in line with production in 2014 (1.622 Mt).
• The rolling three year average figure up to 31 December 2016 rose to 1.545 Mt representing an increase of 10.4% on the three year average figure (1.400 Mt) up to 31 December 2015.
• The average for the 10 year period from 2007 - 2016 stood at 1.282 Mt registering a slight increase of 1.7% from the figure for the previous year of 1.261 Mt.
• Annual production for 2016 equated to 92% of the apportionment figure (1.84 Mt), an increase of 20% from the figures for 2015.
• Permitted reserves as at the end of December 2016 were considered to be 18.341 Mt equating to a 10.0 year landbank based on the relevant apportionment. Concerns have been raised that the apportionment figures are becoming outdated with the prospect of updated guidelines emerging in the foreseeable future appearing unlikely. Accordingly the East of England Aggregates Working Party has agreed that the default position for the provision of sand and gravel in plans should be based upon the methodology contained in the National Planning Policy Framework (NPPF) and Planning Practice Guidance. Applying a rolling 3 year average sales produces a landbank of 11.8 years whilst using 10 year average sales indicates a landbank of 14.3 years. The Bedfordshire authorities are therefore confident that the at least 7 year aggregate sand and gravel landbank required by the NPPF is being met.
• The Minerals and Waste Local Plan: Strategic Sites and Policies (Adopted 2014) allocates six strategic aggregate sand and gravel sites. As at the end of December 2016 planning permission had been granted in respect of one these sites demonstrating that such allocated reserves are coming forward. The allocated sites should help ensure that a landbank in excess of 7 years is maintained over the Plan period to 2028.
ii
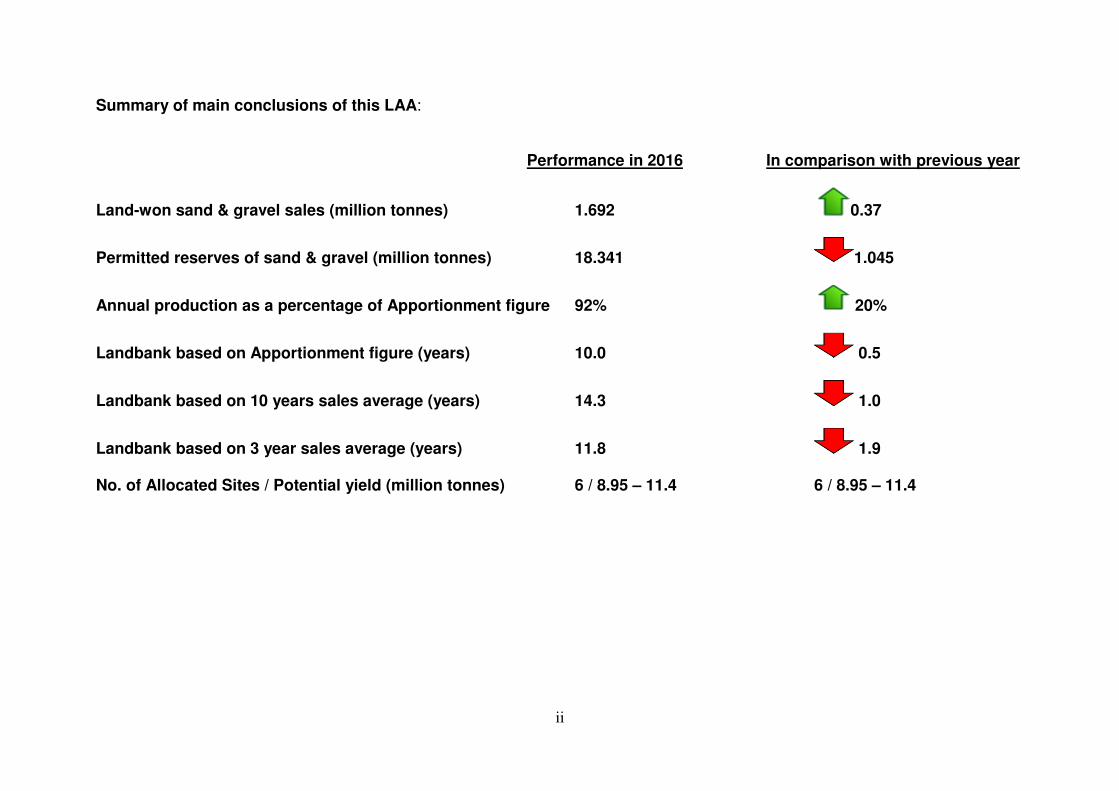
Summary of main conclusions of this LAA: Performance in 2016 In comparison with previous year
Land-won sand & gravel sales (million tonnes) 1.692 0.37
Permitted reserves of sand & gravel (million tonnes) 18.341 1.045
Annual production as a percentage of Apportionment figure 92% 20%
Landbank based on Apportionment figure (years) 10.0 0.5
Landbank based on 10 years sales average (years) 14.3 1.0
Landbank based on 3 year sales average (years) 11.8 1.9 No. of Allocated Sites / Potential yield (million tonnes) 6 / 8.95 – 11.4 6 / 8.95 – 11.4
1
Section One: Background Introduction Aggregate Minerals are needed to sustain the economy, providing the raw materials for built development, construction, maintenance and utilities. However, they are a finite resource and can only be worked where they are found. It is therefore essential that they are used prudently. The National Planning Policy Framework (NPPF) states at paragraph 142: “Minerals are essential to support sustainable economic growth and our quality of life. It is therefore important that there is a sufficient supply of material to provide the infrastructure, buildings, energy and goods that the country needs. However, since minerals are a finite natural resource, and can only be worked where they are found, it is important to make best use of them to secure their long-term conservation.” The Government recognises the importance of maintaining sufficient aggregate production and as such requires Minerals Planning Authorities (MPAs) to produce a Local Aggregate Assessment (LAA) on an annual basis. The purpose of the LAA is to monitor aggregate production and facilitate the steady and adequate supply of aggregates. This is the fourth LAA produced on behalf of Central Bedfordshire, Bedford Borough and Luton Borough Councils. It should be noted that whilst this LAA relates to the Plan area, mineral extraction only takes place within the Bedford Borough and Central Bedfordshire administrative areas. The document meets the requirements of Section 13, paragraph 145 of the NPPF and the Department for Communities and Local Government (DCLG) 2012 Technical Guidance as:
• It includes a forecast of demand for aggregates based on existing reserves and the agreed apportionment;
• It assesses whether an at least 7 year landbank for sand and gravel has been met and whether it is likely to be maintained in the future;
• It provides information on existing sites, strategic sites and the geology of the area;
• It considers other potential sources of aggregates including recycled and secondary aggregates; and
• Looks at the importation of aggregates not found within the Plan area.
The NPPF (paragraph 143) also requires Local Planning Authorities (LPAs) to take account of the contribution that substitute, secondary and recycled minerals waste can make to the supply of materials, before considering extraction of primary materials.
2
Geology of Central Bedfordshire, Bedford Borough and Luton Borough
The Plan area has a rich and varied geology. The most significant minerals found in the Plan area are:
• River Valley/Glacial Sand and Gravel
• Woburn Sands
• Chalk
• Oxford Clay
• Gault Clay
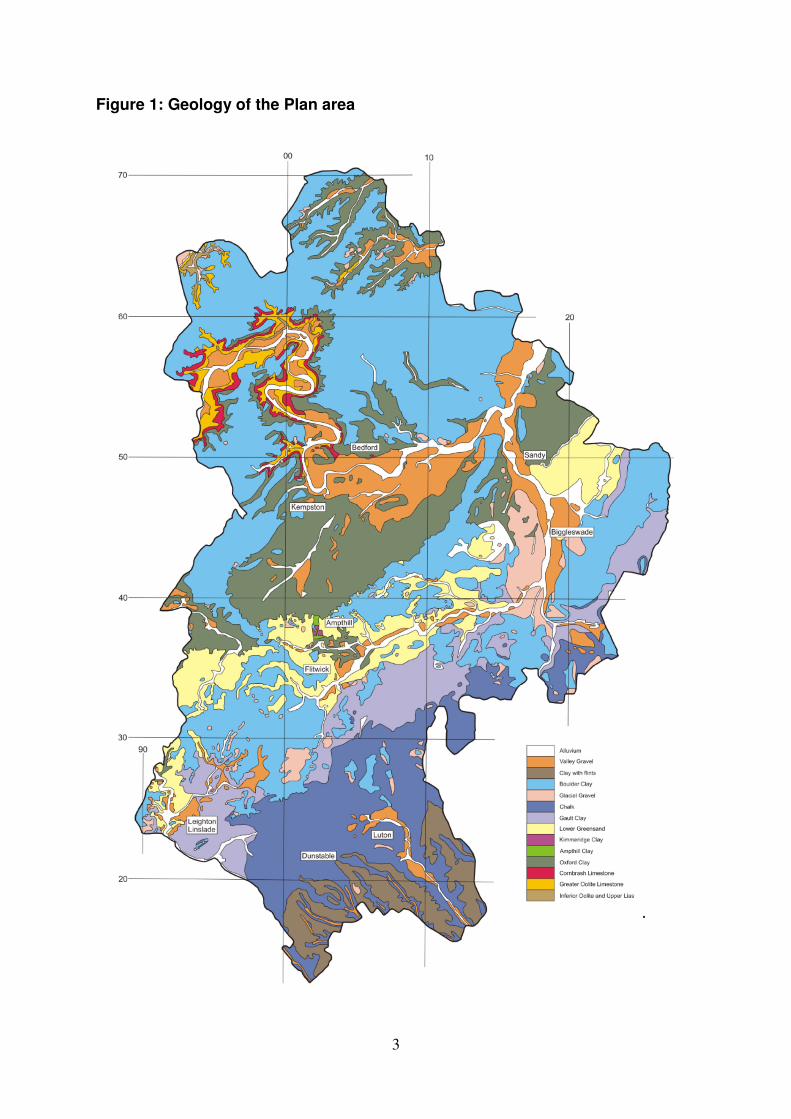
• Cornbrash Limestone Due to the economic importance of these minerals six mineral safeguarding areas (MSAs) have been identified in the Minerals and Waste Local Plan: Strategic Sites and Policies document which was adopted in January 2014 (MWLP: SSP – The Plan). These areas are shown on the MWLP: SSP Policies Map and, in conjunction with Mineral Strategic Policies MSP11: ‘Minerals Resource Assessment’ and MSP12: ‘Surface Development within a Mineral Safeguarding Area’, will ensure that potentially important minerals are safeguarded from needless sterilisation by surface development. A map showing the geology of the Plan area is shown at Figure 1 while the extent of the MSAs is shown at Figure 2. A more detailed version of the MSA map is available to download from the CBC website: http://www.centralbedfordshire.gov.uk/planning/minerals-waste/framework/policies.aspx
River Valley/Glacial Sand and Gravel The Plan area contains significant reserves of aggregate sand and gravel, the majority of which originate from the river valley/glacial sand and gravel deposits found south of the A421 and west of the A1. Woburn Sands The Woburn Sands which stretch diagonally across the Plan area also provide an important source of aggregate sand, and in the area near Leighton Buzzard, silica sand (specialist sand). Chalk and clay The Plan area also contains marine borne minerals in the form of chalk, limestone and clay which could be used as an alternative to aggregate. However, chalk extracted within the Plan area is currently only used for cement works in Rugby and small scale building repair works, while clay extraction ceased a number of years ago. Marine dredged and marine borne Aggregates The Plan area contains significant reserves of aggregate sand and gravel but, being land locked, it contains no areas suitable for the dredging of marine aggregates although a small amount is imported to the Plan area.
3
Figure 1: Geology of the Plan area

4
Figure 2: Mineral Safeguarding Areas

5
Section Two: Aggregate Sand and Gravel Paragraph 145 of the NPPF states that; “Minerals planning authorities should plan for a steady and adequate supply of aggregates by: preparing an annual Local Aggregate Assessment, either individually or jointly by agreement with another or other mineral planning authorities, based on a rolling average of 10 years sales data and other relevant local information, and an assessment of all supply options (including marine dredged, secondary and recycled sources)….”
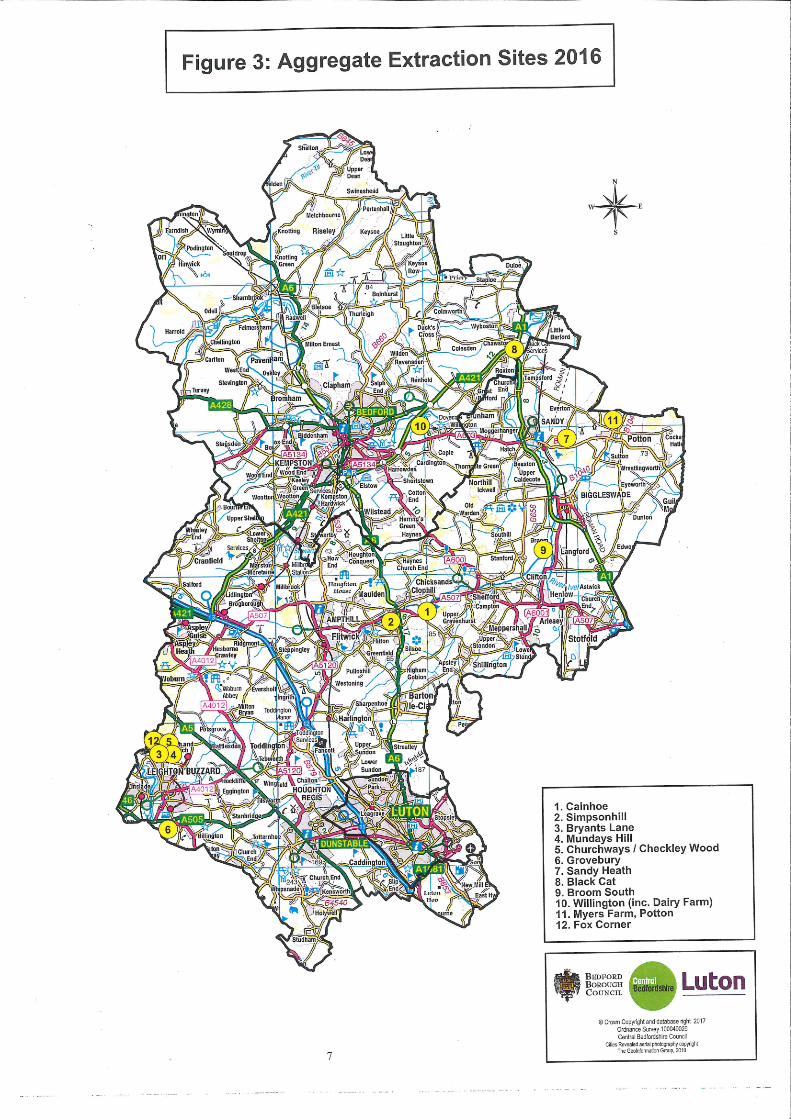
This section contains factual information concerning existing mineral extraction sites, current reserves and annual sales. It includes an assessment of aggregate sand and gravel provision and considers whether there is a surplus or shortfall in aggregate sand and gravel within the Plan area. Existing sites In 2016 twelve permitted aggregate extraction sites were active in the Central Bedfordshire and Bedford Borough Council administrative areas. As noted above, no mineral extraction is undertaken within Luton Borough Council’s administrative area. Table 1 below lists these sites and identifies the operator, mineral type and the status of each site; while the map entitled “Mineral extraction sites (2016)”, illustrates the approximate locations of each site.

6
Table 1: Land-won mineral sites1 Operator Site Mineral
extraction end date as stated in the extant PP
Mineral type Status (extraction undertaken in 2014-5)
1 Thomas Bros Cainhoe Dec 2029 Aggregate Active 2 Forterra Simpsonhill Feb 2042 Aggregate Active
3 LB Silica Sand
Bryants Lane Dec 2041 Both aggregate and silica sand in broadly equal proportions
Active
4 Aggregate Industries
Mundays Hill Feb 2042 Approximately two thirds aggregate sand, one third silica sand
Active
5 Churchways/ Checkleywood
Feb 2042 Both aggregate and silica sand in broadly equal proportions
Active
6 Grovebury July 2021 Both aggregate and silica sand in broadly equal proportions
Active
7 Tarmac Sandy Heath Main site Dec 2017
100% aggregate
Active
8 Black Cat Sept 2020 100% aggregate
Active
9 Broom South April 2026 100% aggregate
Active
10 Breedon Group2
Willington (including Dairy Farm)
19 October 2016
100% aggregate
Active
11 Potton (Myers Farm)
Sept 2024 100% aggregate
Active
12 D B Standing and Sons
Fox Corner Feb 2042 Aggregate sand.
Active
1 Please note “Table 1: Land-won mineral sites” lists sites with permitted mineral reserves available
within Bedford Borough and Central Bedfordshire. It does not include exhausted sites now in
restoration. 2 Breedon Group took over Hope Construction Materials in August 2016

8
East of England Aggregates Working Party and aggregate provision The 2009 DCLG national and regional guidelines for aggregates provision in England replaced those published in 2003. These guidelines take account of a revised target of 64 million tonnes (Mt) per annum by 2015 for alternative materials. The document apportioned 236 Mt of land-won sand and gravel and 8 Mt of land-won crushed rock to originate from the East of England between 2005 and 2020. The sub-national apportionment for the Plan area was set at 1.84 Mt per annum for which provision was made within the adopted Plan. Whilst the Regions have since been abolished; the government recognises the need for Minerals Planning Authorities to co-operate on strategic aggregate minerals planning matters. The NPPF advises MPAs to seek and to take into account the technical advice from the relevant Aggregate Working Party (AWP). The East of England AWP has, in the past, encouraged each MPA within its area to maintain the agreed apportionment figure. For the Central Bedfordshire, Bedford Borough and Luton Borough MPAs this would mean maintaining an aggregate sand and gravel provision of 1.84 Mt per annum. However, at its November 2016 meeting, members of the East of England AWP expressed concern that the 2020 figures were becoming outdated and, given that the prospect of updated guidelines emerging in the foreseeable future appears unlikely, the East of England AWP Chairman has, after discussion with the AWP members, highlighted the need for sand and gravel provision in plans to be based upon national policy and guidance set out in NPPF paragraph 145 and Planning Practice Guidance paragraphs 61 – 71. Annual sales According to the East of England AWP Annual Monitoring Report (AMR) (2016) permitted aggregate reserves in Bedford Borough, Central Bedfordshire and Luton totalled 18.341 Mt in 2016, while aggregate sand and gravel sales for 2016 totalled 1.692 Mt. These figures are derived from the EEAWP survey (2016) and information contained in planning applications’ supporting documents (where 2016 survey information was not available). Figures in the table below show the aggregate sand and gravel annual sales as stated in the EEAWP AMR (2016) covering the 10 year period from 2007 - 2016. Table 2: Sales data (Mt)
2007 2008 2009 2010 2011 2012 2013 2014 2015 2016 1.61 1.02 0.94 1.04 1.12 1.20 1.26 1.62 1.32 1.69
The NPPF requires MPAs to maintain a landbank of at least 7 years for sand and gravel. It also encourages MPAs to base their LAA on a rolling average of 10 years sales data and other relevant information. The graph below illustrates the trends in aggregate sand and gravel sales. It shows that the 10 year sales average at 31st December 2016 totalled 1.282 Mt. It indicates that the agreed apportionment figure

9
of 1.84Mt is 0.558Mt higher than the 10 year sales average up to the end of 2016. The agreed apportionment is 0.295 Mt higher than the three year sales average for 2014-16.

10
0
200
400
600
800
1000
1200
1400
1600
1800
2000
2007 2008 2009 2010 2011 2012 2013 2014 2015 2016
Sale
s (
000 t
on
nes)
Figure 4: Aggregate Sand and Gravel Sales in the Plan area (2007-2016)
SALES
3 YEAR AVERAGE
10 YEAR AVERAGE
SUB NATIONAL APPORTIONMENT (1,840,000)
11
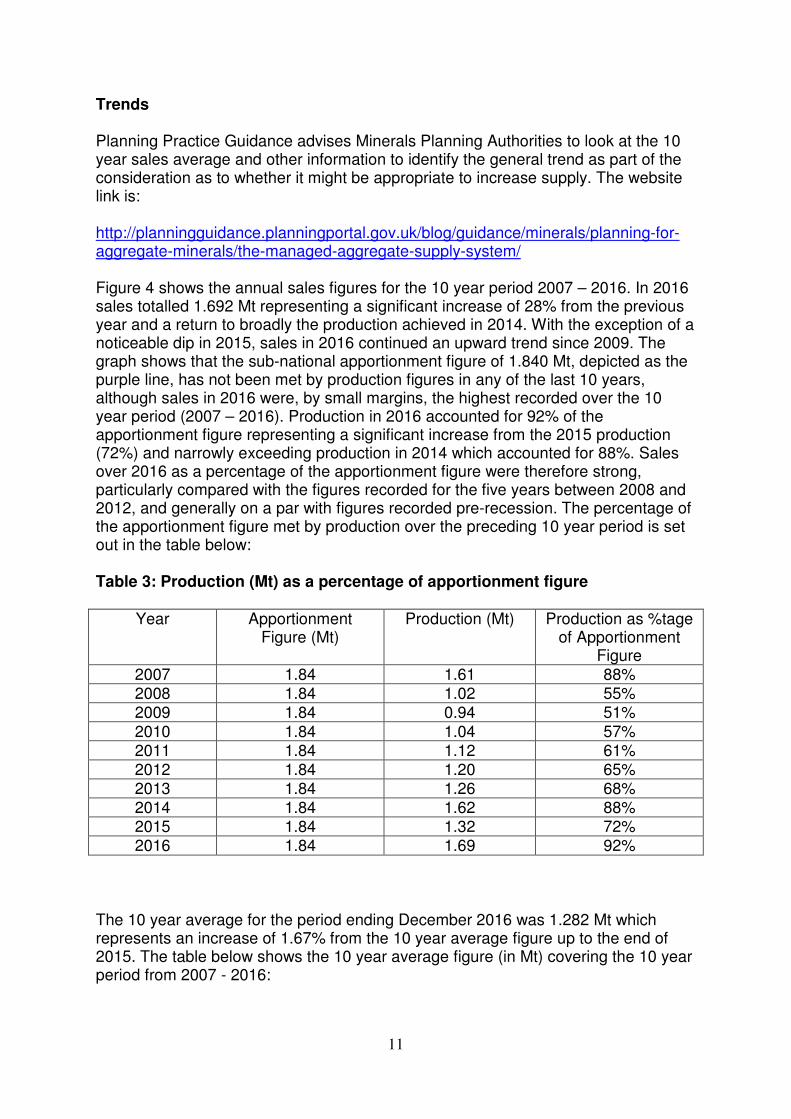
Trends Planning Practice Guidance advises Minerals Planning Authorities to look at the 10 year sales average and other information to identify the general trend as part of the consideration as to whether it might be appropriate to increase supply. The website link is: http://planningguidance.planningportal.gov.uk/blog/guidance/minerals/planning-for-aggregate-minerals/the-managed-aggregate-supply-system/ Figure 4 shows the annual sales figures for the 10 year period 2007 – 2016. In 2016 sales totalled 1.692 Mt representing a significant increase of 28% from the previous year and a return to broadly the production achieved in 2014. With the exception of a noticeable dip in 2015, sales in 2016 continued an upward trend since 2009. The graph shows that the sub-national apportionment figure of 1.840 Mt, depicted as the purple line, has not been met by production figures in any of the last 10 years, although sales in 2016 were, by small margins, the highest recorded over the 10 year period (2007 – 2016). Production in 2016 accounted for 92% of the apportionment figure representing a significant increase from the 2015 production (72%) and narrowly exceeding production in 2014 which accounted for 88%. Sales over 2016 as a percentage of the apportionment figure were therefore strong, particularly compared with the figures recorded for the five years between 2008 and 2012, and generally on a par with figures recorded pre-recession. The percentage of the apportionment figure met by production over the preceding 10 year period is set out in the table below: Table 3: Production (Mt) as a percentage of apportionment figure
Year Apportionment Figure (Mt)
Production (Mt) Production as %tage of Apportionment
Figure 2007 1.84 1.61 88% 2008 1.84 1.02 55% 2009 1.84 0.94 51%
2010 1.84 1.04 57% 2011 1.84 1.12 61% 2012 1.84 1.20 65% 2013 1.84 1.26 68% 2014 1.84 1.62 88% 2015 1.84 1.32 72% 2016 1.84 1.69 92%
The 10 year average for the period ending December 2016 was 1.282 Mt which represents an increase of 1.67% from the 10 year average figure up to the end of 2015. The table below shows the 10 year average figure (in Mt) covering the 10 year period from 2007 - 2016:

12
Table 4: 10 year average sales figures (Mt)
2007 2008 2009 2010 2011 2012 2013 2014 2015 2016 1.78 1.69 1.59 1.51 1.44 1.37 1.33 1.30 1.26 1.28
The 10 year average sales figures have fallen steadily year on year since 2007 until 2016 which showed a modest increase. Sales in 2014, 2015 and 2016 represent the only years within that 10 year period when production of aggregate sand and gravel has exceeded the corresponding 10 year average sales figures. It should be noted that sales data for Bedfordshire for the years 1997 – 1999 was sourced from aggregates monitoring reports prepared by the South East Regional Aggregates Working Party which included Bedfordshire over that period. Advice set out in Planning Practice Guidance (paragraph 064) suggests that Mineral Planning Authorities should also look at 3 yearly average figures to determine recent sales trends and to take account of this in considering whether it may be appropriate to increase supply. Figure 4 depicts the rolling 3 yearly average figures, plotted as a dark blue line. The table below shows the 3 year average (in Mt) covering the 10 year period from 2007 - 2016: Table 5: 3 year average sales figures (Mt)
2007 2008 2009 2010 2011 2012 2013 2014 2015 2016
1.59 1.37 1.19 1.00 1.03 1.12 1.19 1.36 1.40 1.55 The 3 yearly average figure for 2014 - 2016 stood at 1.545 Mt representing a 10.4% rise from the 2013 - 2015 figure. This continues the upward trend in the 3 year average sales recorded year on year since 2010. The 3 yearly figures recorded at the end of 2014, 2015 and 2016 are the only years within the preceding 10 year period when such figures have exceeded the 10 year rolling averages. The Bedfordshire Authorities consider that, when analysing trends, reliance should be placed on the 3 yearly and 10 yearly rolling averages, as the NPPF and Planning Practice Guidance advises, rather than taking any longer term view which would reflect different economic climates, methods of working and markets.
13
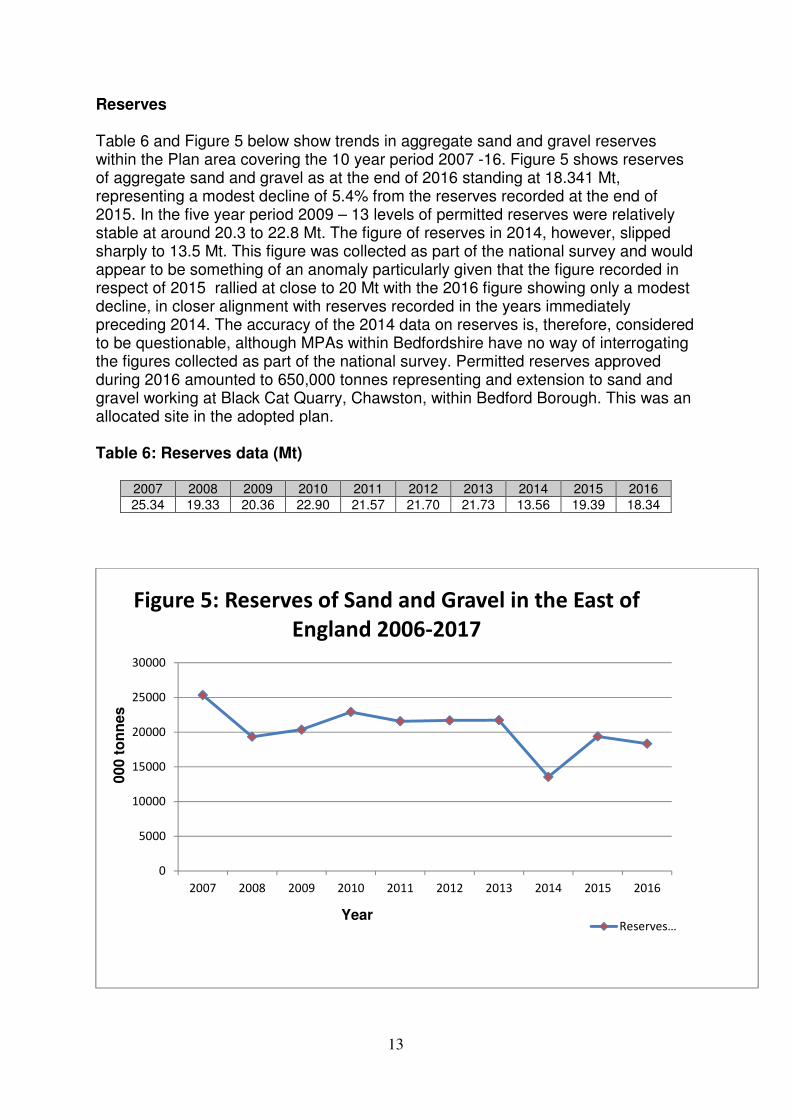
Reserves Table 6 and Figure 5 below show trends in aggregate sand and gravel reserves within the Plan area covering the 10 year period 2007 -16. Figure 5 shows reserves of aggregate sand and gravel as at the end of 2016 standing at 18.341 Mt, representing a modest decline of 5.4% from the reserves recorded at the end of 2015. In the five year period 2009 – 13 levels of permitted reserves were relatively stable at around 20.3 to 22.8 Mt. The figure of reserves in 2014, however, slipped sharply to 13.5 Mt. This figure was collected as part of the national survey and would appear to be something of an anomaly particularly given that the figure recorded in respect of 2015 rallied at close to 20 Mt with the 2016 figure showing only a modest decline, in closer alignment with reserves recorded in the years immediately preceding 2014. The accuracy of the 2014 data on reserves is, therefore, considered to be questionable, although MPAs within Bedfordshire have no way of interrogating the figures collected as part of the national survey. Permitted reserves approved during 2016 amounted to 650,000 tonnes representing and extension to sand and gravel working at Black Cat Quarry, Chawston, within Bedford Borough. This was an allocated site in the adopted plan. Table 6: Reserves data (Mt)
2007 2008 2009 2010 2011 2012 2013 2014 2015 2016
25.34 19.33 20.36 22.90 21.57 21.70 21.73 13.56 19.39 18.34
0
5000
10000
15000
20000
25000
30000
2007 2008 2009 2010 2011 2012 2013 2014 2015 2016
Figure 5: Reserves of Sand and Gravel in the East of
England 2006-2017
Reserves…
000 t
on
nes
Year

14
Significant construction projects The emerging strategic planning documents for Bedford Borough, Central Bedfordshire, and Luton Borough seek to make provision for up to 57,500 new houses (see box below). The construction of these houses will require significant quantities of aggregate. In addition to the aggregates required for the construction of these new homes and associated infrastructure to support this projected growth. Construction continued throughout 2016 on the A5-M1 link road, a £162.1M scheme to improve east-west connectivity though the construction of a new 2.8 mile dual carriageway, a project requiring a significant tonnage of aggregate. Other major construction projects underway during 2016 include the Bedford Western Bypass and the Woodside Road Link.
• The evidence base to support the Draft Central Bedfordshire Local Plan suggests a need for a flexible approach to plan for 20,000 - 30,000 new homes between 2015 and 2035.
• The latest evidence base to support the emerging Bedford Borough Local Plan suggests that around 19,000 houses will be required between 2015 and 2035.
• The Luton Local Plan (2011 – 2031) suggests that around 8,500 new dwellings will realistically be delivered in the borough through key allocations, albeit a balance of a further 9,300 dwellings would be unmet.
Whilst it is clear that there will be significant development within the Plan area in the future, it is impossible to predict the level of development and the tonnage of aggregate that will be required. Nevertheless, the Shared Service is satisfied that the existing permitted reserves are sufficient to ensure the delivery of planned developments, though of course the MPA will continue to closely monitor the aggregate sand and gravel landbank each year as developments come forward. Landbank for sand and gravel: Analysis of demand and supply Paragraph 145 of the NPPF states that MPAs should prepare an annual LAA based on a rolling average of 10 years and other relevant information.

15
Table 7: Landbank Calculations 2016
Bedford Borough, Central Bedfordshire and Luton Borough Sand and gravel sales 2016 estimate (Mt)
1.69
Permitted reserves 31/12/2016 (Mt) 18.34
Measure 1 EoEAWP sub-national apportionment (Mtpa)
1.84
Landbank based on EoEAWP sub-national apportionment (Years)
10.0
Measure 2 Rolling average of 10 year sales (2007-2016)
1.28
Landbank based on rolling 10 year sales average (Years)
14.3
Measure 3 Rolling average of 3 year sales (2014-2016)
1.55
Landbank based on rolling 3 year sales average (Years)
11.8
Applying the 10 year sales average data for the year ending 31 December 2016, results in a sand and gravel landbank of 14.3 years (18.34 Mt / 1.28 Mt). Basing the calculation on the apportionment figure produces a landbank of 10.0 years (18.34 Mt / 1.84 Mt). Based on the 3 year sales average the landbank is 11.8 years (18.34 Mt / 1.55 Mt).Whichever approach is applied to the 2016 figures, the Bedfordshire MPAs can be satisfied that they are continuing to provide for at least a 7 year landbank for aggregates. Meeting the agreed apportionment and Strategic Aggregate Sites The Plan identifies six strategic aggregate sand and gravel sites based on providing the apportionment figure of 1.84 million tonnes per annum for the Plan period (until 2028). The strategic sites have been selected according to the following sequential test:
• Extensions to existing extraction mineral sites
• “Satellite” extraction sites serving an existing processing plant site
• New sites not connected with any existing operation.
The strategic aggregate sites are listed in Table 8 below. During 2016 planning permission was granted in April 2016 for the extraction of 650,000 tonnes of sand and gravel from an allocated extension to the Black Cat Quarry site, Chawston, in Bedford Borough.

16
Table 8: Status of Strategic Mineral Sites as at the end of December 2016 Operator Site Mineral type Potential
yield (tonnes)
Current Status
Breedon Group3 Willington Lock Aggregate sand & gravel
830,000 – 1,180,000
Tarmac Blunham/ Roxton
Aggregate sand & gravel
2,950,000 – 3,550,000
Breedon Group Black Cat (unpermitted area)
Aggregate sand & gravel
670,000 – 770,000
Planning permission granted in April 2016 for the extraction of 650,000 tonnes
Breedon Group Willowhill Farm Aggregate sand & gravel
250-000 – 950,000
Breedon Group Bridge Farm Aggregate sand & gravel
250,000 – 950,000
Tarmac Land south of Broom Village (unpermitted area)
Aggregate sand & gravel
4,000,000
Total = 8,950,000-11,400,000
3 Breedon Group took over Hope Construction Materials in August 2016

17
Section Three: Recycled and secondary aggregates
Secondary and recycled aggregates help to reduce the rate at which primary aggregate resources are depleted and therefore make an important contribution to the supply of aggregates. As such their use is encouraged through the NPPF (paragraph 143). According to the British Geological Society (BGS) report, “Aggregate resource alternatives: Options for future aggregate minerals supply in England” (2008), the quantity of recycled and secondary aggregates produced within Great Britain in 2005 had increased by 107% from the level as at 1990. The National and Regional guidelines for aggregate provision 2005-2020 assume that for the East of England 117 million tonnes of alternative materials will be produced. The guidelines for land-won production are 236 million tonnes and 8 million tonnes in the East of England for land-won sand and gravel and crushed rock respectively as shown in the table below. Table 9: National and regional guidelines for aggregate provision in England 2005-2020 (million tonnes).4 Guidelines for land-won
production Assumptions
Land-won sand and gravel
Land won Crushed rock
Marine sand and gravel
Alternative materials
Net imports to England
East of England
236 8 14 117 7
England 1,028 1,492 259 993 136
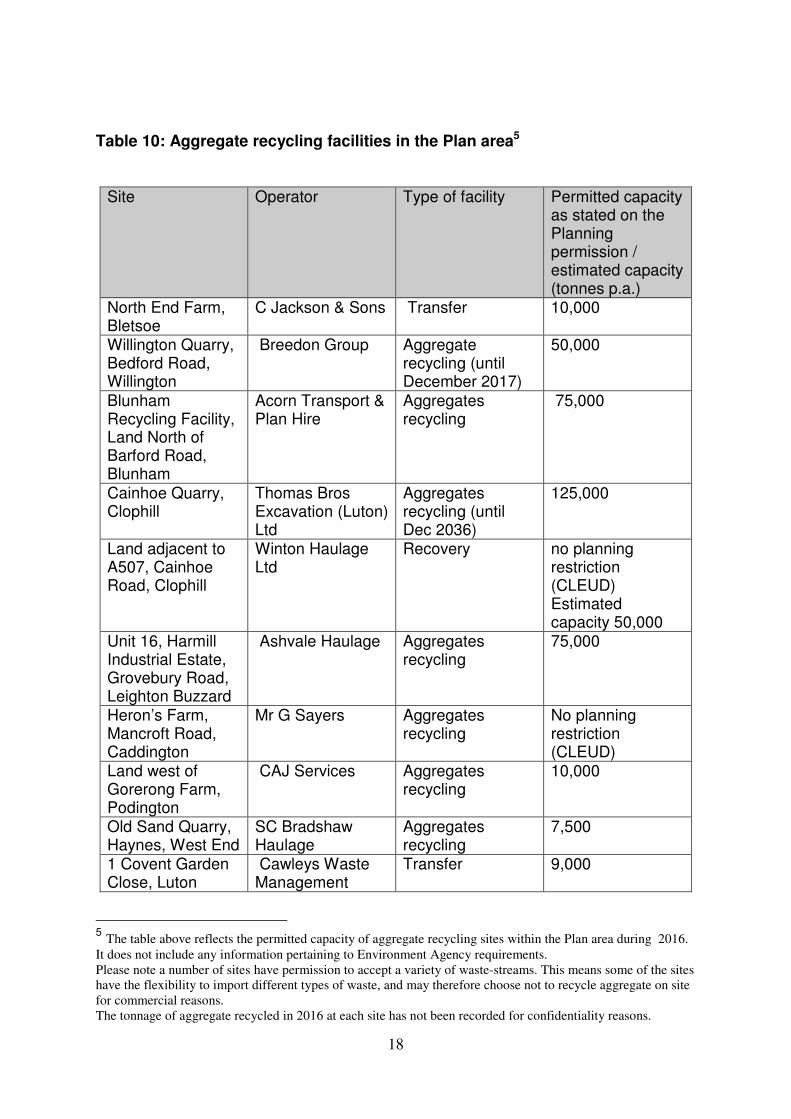
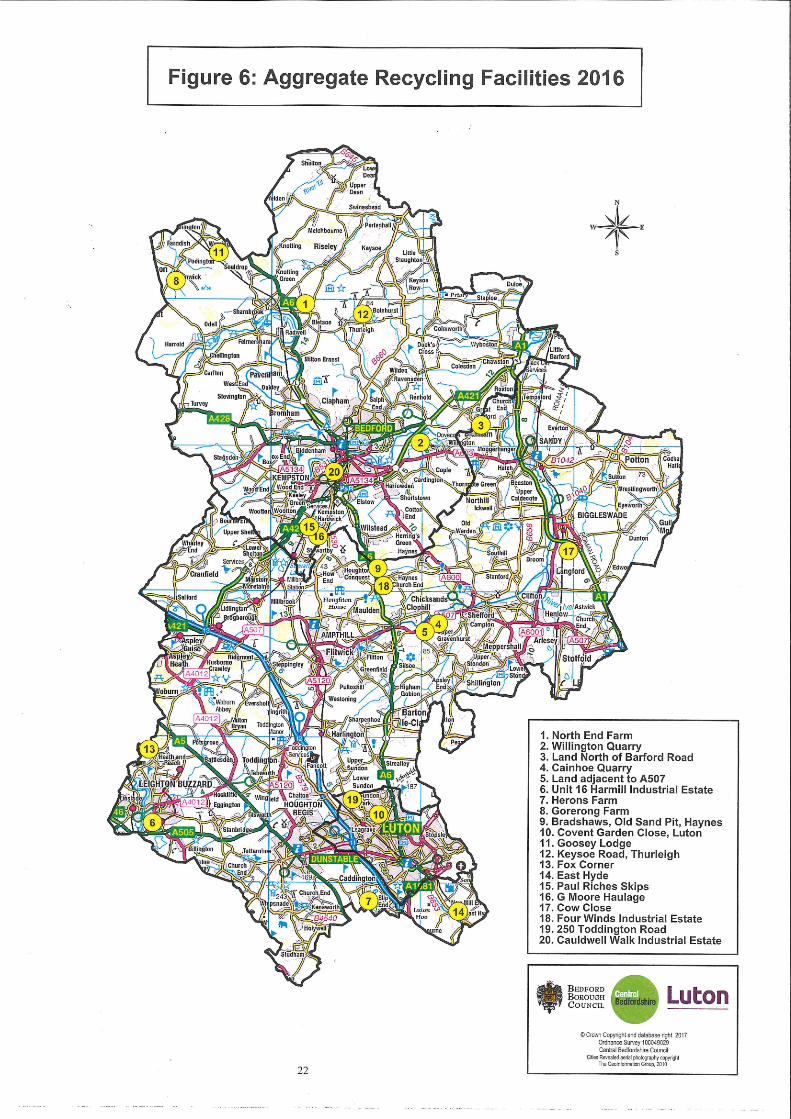
Recycled aggregates Recycled aggregates are sourced from construction, demolition and excavation (C, D & E) wastes. The Plan area contains a number of sites with planning permission to recycle aggregate waste. Their permitted / estimated capacities and approximate locations are shown Table 10 and Figure 6 below.
4 Based on a table in the June 2009 DCLG document: National and regional guidelines for aggregate provision
in England 2005-2020.
18
Table 10: Aggregate recycling facilities in the Plan area5
Site Operator Type of facility Permitted capacity as stated on the Planning permission / estimated capacity (tonnes p.a.)
North End Farm, Bletsoe
C Jackson & Sons Transfer 10,000
Willington Quarry, Bedford Road, Willington
Breedon Group Aggregate recycling (until December 2017)
50,000
Blunham Recycling Facility, Land North of Barford Road, Blunham
Acorn Transport & Plan Hire
Aggregates recycling
75,000
Cainhoe Quarry, Clophill
Thomas Bros Excavation (Luton) Ltd
Aggregates recycling (until Dec 2036)
125,000
Land adjacent to A507, Cainhoe Road, Clophill
Winton Haulage Ltd
Recovery no planning restriction (CLEUD) Estimated capacity 50,000
Unit 16, Harmill Industrial Estate, Grovebury Road, Leighton Buzzard
Ashvale Haulage Aggregates recycling
75,000
Heron’s Farm, Mancroft Road, Caddington
Mr G Sayers Aggregates recycling
No planning restriction (CLEUD)
Land west of Gorerong Farm, Podington
CAJ Services Aggregates recycling
10,000
Old Sand Quarry, Haynes, West End
SC Bradshaw Haulage
Aggregates recycling
7,500
1 Covent Garden Close, Luton
Cawleys Waste Management
Transfer 9,000
5 The table above reflects the permitted capacity of aggregate recycling sites within the Plan area during 2016.
It does not include any information pertaining to Environment Agency requirements.
Please note a number of sites have permission to accept a variety of waste-streams. This means some of the sites
have the flexibility to import different types of waste, and may therefore choose not to recycle aggregate on site
for commercial reasons.
The tonnage of aggregate recycled in 2016 at each site has not been recorded for confidentiality reasons.

19
Goosey Lodge Ind Est,, Wymington, Rushden
Wykes Engineering
EfW and Aggregates recycling
105,000
Keysoe Road, Thurleigh
C Jackson & Sons Transfer 3,500
Fox Corner, Heath and Reach
DB Standing & Sons
Aggregates recycling (until March 2030).
7,000
Chiltern Green Road, East Hyde
Holywell Haulage Transfer 48,000
Unit 1, Manor Road, Kempston Hardwick, Bedford
Paul Riches Skips Transfer 75,000 (mixed waste)
G Moore Haulage, Manor Road, Kempston Hardwick, Bedford
G Moore Haulage Transfer 90,000 (mixed waste)
Cow Close, Biggleswade
FD O’Dell & Sons Ltd
Transfer 7,500
Four Winds Industrial Estate, West End, Haynes
Wilstead Skips Transfer 2,000
Unit 2, 250 Toddington Road, Luton
Three Shires Waste Recycling Ltd
Transfer 16,000
Compound A, Unit 4 Cauldwell Walk Ind Est, Bedford
ABSS Skips (Budget Skips)
Transfer & Treatment
No data available but volumes unlikely to be significant
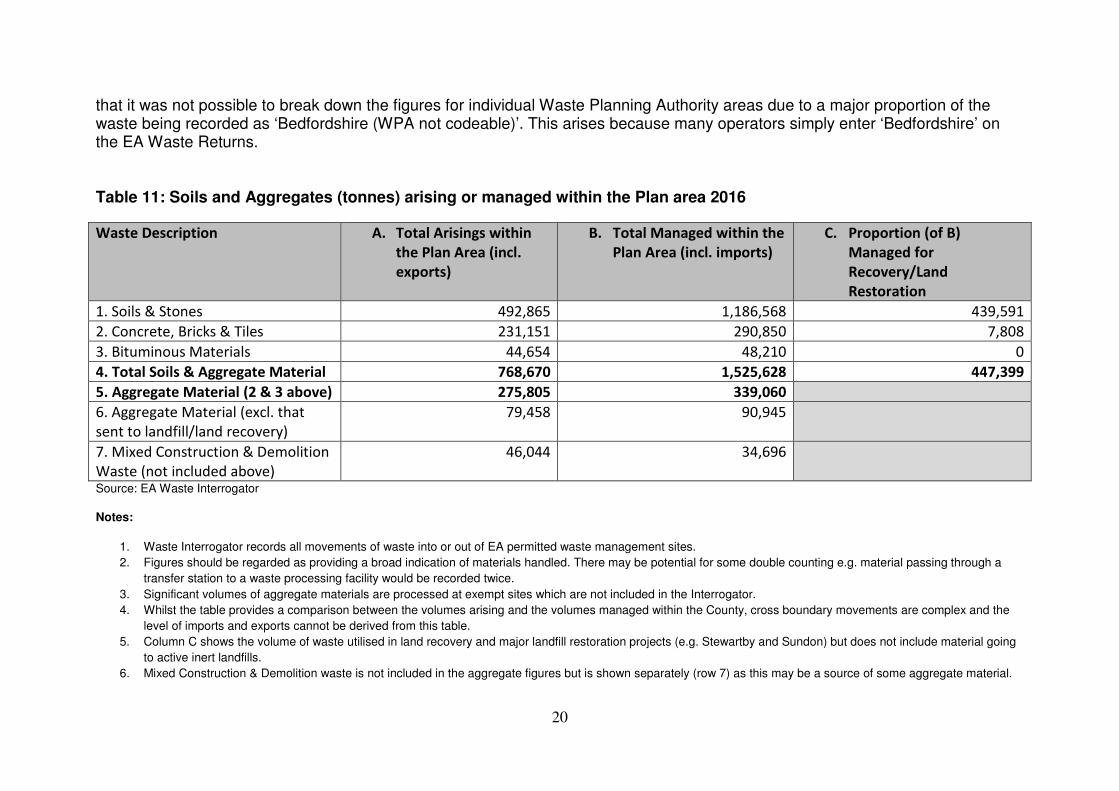
Total capacity (as at the end of 2016) 765,500 Total capacity as at the end of 2016 stood at 765,500 tonnes. This increased by 76,000 tonnes from the figure as at the end of 2015 although principally due the availability of better data in terms of estimated capacity rather than necessarily the grant of new permissions. Information held on the Environment Agency Waste Interrogator has been analysed in order to identify soils and aggregates arising or managed within the Plan Area in 2016. This data is set out in Table 11 below. However, it is crucial to understand that there are limitations in how these figures have been collected and derived and, as such, this data cannot be wholly relied upon and instead should be seen as indicative of the broader picture. Attention is therefore drawn to the Notes beneath the table which highlight, for example, the fact that significant volumes of aggregate materials are processed at exempt sites which are excluded from the Interrogator. It should be noted that exports from Bedfordshire only identifies materials exported from a permitted waste management site and would not, therefore, include waste going directly out of County from construction sites. Consequently it was considered necessary to identify all imports from Bedfordshire to any permitted waste management site which inevitably involves a lot of variables. It should also be noted
20
that it was not possible to break down the figures for individual Waste Planning Authority areas due to a major proportion of the waste being recorded as ‘Bedfordshire (WPA not codeable)’. This arises because many operators simply enter ‘Bedfordshire’ on the EA Waste Returns. Table 11: Soils and Aggregates (tonnes) arising or managed within the Plan area 2016
Waste Description A. Total Arisings within
the Plan Area (incl.
exports)
B. Total Managed within the
Plan Area (incl. imports)
C. Proportion (of B)
Managed for
Recovery/Land
Restoration
1. Soils & Stones 492,865 1,186,568 439,591
2. Concrete, Bricks & Tiles 231,151 290,850 7,808
3. Bituminous Materials 44,654 48,210 0
4. Total Soils & Aggregate Material 768,670 1,525,628 447,399
5. Aggregate Material (2 & 3 above) 275,805 339,060
6. Aggregate Material (excl. that
sent to landfill/land recovery)
79,458 90,945
7. Mixed Construction & Demolition
Waste (not included above)
46,044 34,696
Source: EA Waste Interrogator
Notes:
1. Waste Interrogator records all movements of waste into or out of EA permitted waste management sites.
2. Figures should be regarded as providing a broad indication of materials handled. There may be potential for some double counting e.g. material passing through a
transfer station to a waste processing facility would be recorded twice.
3. Significant volumes of aggregate materials are processed at exempt sites which are not included in the Interrogator.
4. Whilst the table provides a comparison between the volumes arising and the volumes managed within the County, cross boundary movements are complex and the
level of imports and exports cannot be derived from this table.
5. Column C shows the volume of waste utilised in land recovery and major landfill restoration projects (e.g. Stewartby and Sundon) but does not include material going
to active inert landfills.
6. Mixed Construction & Demolition waste is not included in the aggregate figures but is shown separately (row 7) as this may be a source of some aggregate material.
21
As noted above the reliability limitations of this data can only provide an indication of the volumes of materials handled and does not detail the end use with some material, for example, having gone to inert landfill. It should also be noted that significant volumes of aggregate materials are processed at exempt sites not included in the Interrogator. It should be noted that the aggregate figures exclude mixed demolition and construction waste which may be a source of aggregate materials and consequently this has been identified as a separate row in Table 11. Issues of data availability and reliability for recycled aggregates does not aid collection of precise figures for the local contribution of this source of aggregate but it is reasonable to assume that it will continue to provide an important contribution to local aggregate needs. Secondary aggregates Secondary aggregates are sourced from industrial wastes, such as glass, ash, railway ballast, fine ceramic waste and scrap tyres; and industrial and minerals by-products, notably waste from china clay, coal and slate extraction and spent foundry sand. The Plan area contains no china clay, coal or foundries and is not industrial in nature. Its ability to produce secondary aggregates is therefore limited. An aggregates railhead facility at Stewartby offers a potential source of secondary aggregates but this facility is used for the removal of worn ballast from the rail network and the importation of fresh ballast. As such, none of this material enters the local aggregate market.
23
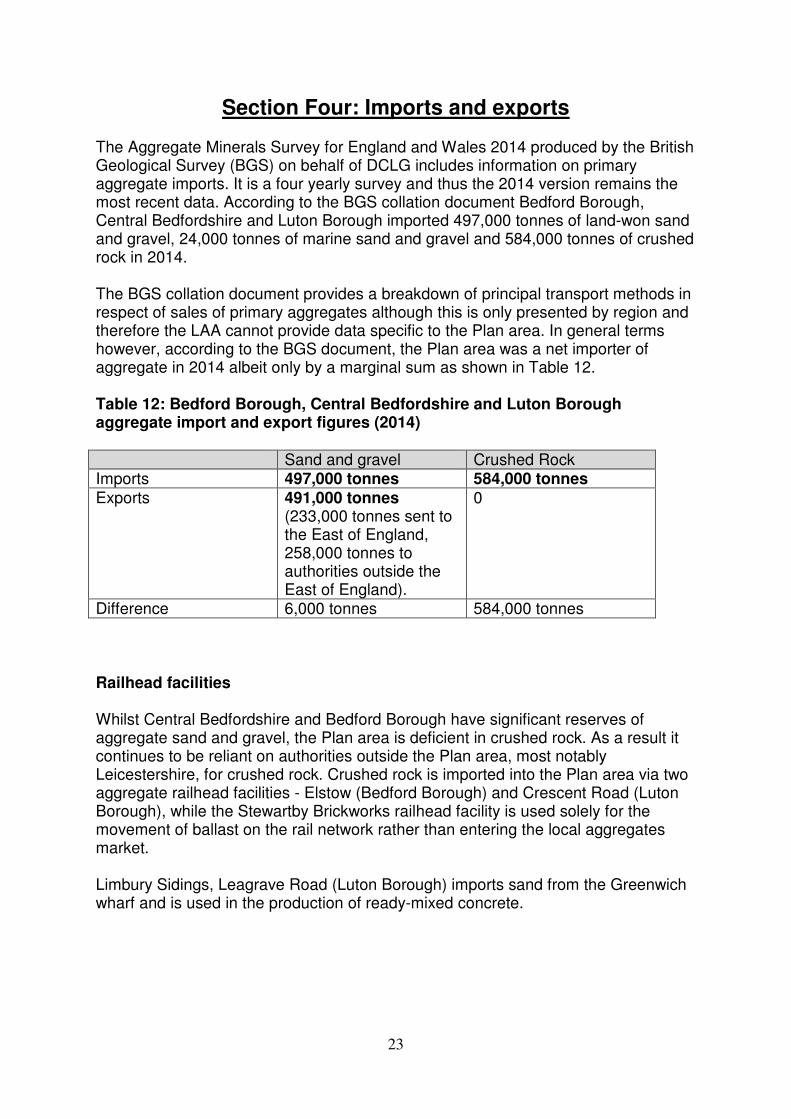
Section Four: Imports and exports The Aggregate Minerals Survey for England and Wales 2014 produced by the British Geological Survey (BGS) on behalf of DCLG includes information on primary aggregate imports. It is a four yearly survey and thus the 2014 version remains the most recent data. According to the BGS collation document Bedford Borough, Central Bedfordshire and Luton Borough imported 497,000 tonnes of land-won sand and gravel, 24,000 tonnes of marine sand and gravel and 584,000 tonnes of crushed rock in 2014. The BGS collation document provides a breakdown of principal transport methods in respect of sales of primary aggregates although this is only presented by region and therefore the LAA cannot provide data specific to the Plan area. In general terms however, according to the BGS document, the Plan area was a net importer of aggregate in 2014 albeit only by a marginal sum as shown in Table 12. Table 12: Bedford Borough, Central Bedfordshire and Luton Borough aggregate import and export figures (2014)
Sand and gravel Crushed Rock Imports 497,000 tonnes 584,000 tonnes
Exports 491,000 tonnes (233,000 tonnes sent to the East of England, 258,000 tonnes to authorities outside the East of England).
0
Difference 6,000 tonnes 584,000 tonnes Railhead facilities Whilst Central Bedfordshire and Bedford Borough have significant reserves of aggregate sand and gravel, the Plan area is deficient in crushed rock. As a result it continues to be reliant on authorities outside the Plan area, most notably Leicestershire, for crushed rock. Crushed rock is imported into the Plan area via two aggregate railhead facilities - Elstow (Bedford Borough) and Crescent Road (Luton Borough), while the Stewartby Brickworks railhead facility is used solely for the movement of ballast on the rail network rather than entering the local aggregates market. Limbury Sidings, Leagrave Road (Luton Borough) imports sand from the Greenwich wharf and is used in the production of ready-mixed concrete.

24
Table 13: Aggregate railhead facilities Site Handling activity OS Grid reference Source of material Elstow, Bedford (Tarmac)
Receiving depot TL041 457 Leicestershire
Crescent Road, Luton (Tarmac)
Receiving depot TL 097 215 Leicestershire
Limbury Sidings, 519 Leagrave Road, Luton (Breedon Group)6
Receiving depot TL 075 229 Greenwich wharf (London)
Stewartby Brickworks Rail Depot (Network Rail)
Used solely for the movement of ballast on the rail network & not within the wider market
TL 01252 42750 Rail ballast
Section Five: Conclusions Land–won aggregates The Plan area contains significant deposits of aggregate sand and gravel. As at 31 December 2016 estimates of permitted reserves totalled 18,341,000 tonnes. The aggregate sand and gravel landbank for Bedford Borough, Central Bedfordshire and Luton equates to 10.0 years (based on the agreed apportionment figure of 1,840,000 tonnes p.a) or 14.3 years if based on the 10 year average sales. The 3 year sales average for aggregate sand and gravel stands at 1,545,000 tonnes (December 2016). If the MPAs adopt the 3 year sales average to calculate the landbank, it would total 11.8 years. The three MPAs (Bedford Borough Council, Central Bedfordshire Council and Luton Borough Council) are therefore confident that the at least 7 year aggregate sand and gravel landbank required by the NPPF has been met. The adopted Minerals and Waste Local Plan: Strategic Sites and Policies includes a number of strategic mineral policies and six strategic aggregate sand and gravel sites which together help to ensure that the 7 year landbank will continue to be maintained over the plan period. Planning permission was granted during 2016 for the extraction of some 650,000 tonnes of sand and gravel as an extension to the Black Cat Quarry, Chawston, Bedford. This is one of the allocated strategic aggregate sand and gravel sites within the Plan demonstrating that such allocated reserves are coming forward.
6 Breedon Group took over Hope Construction Materials in August 2016
25
Given the level of the landbank, and the reserves contained in the strategic mineral sites identified in the Plan, the three authorities are assessed as remaining in a satisfactory position in respect of aggregate supply. Marine dredged aggregates The Plan area contains no deposits of marine dredged or marine borne aggregates. There are currently no sites from which crushed rock can be sourced and consequently it remains necessary to continue to rely on sites outside the Plan area for these minerals. Secondary and recycled aggregates At the end of the calendar year 2016, twenty permitted aggregate recycling sites existed in the plan area, a small increase on the number recorded in 2015. It is not likely that secondary aggregate is produced from the Plan area. Data sources
• National Planning Policy Framework
• Planning Practice Guidance
• 2014 BGS National Survey and 2016 East England AWP Survey
• SE AWP Annual Monitoring Reports 1997-99
• Goodquarry.com Quarry Fines and Waste British Geological Survey
• DCLG Mineral extraction in Great Britain 2011: Business Monitor PA1007
• DCLG National and regional guidelines for aggregates provision in England 2005-2020 2009 Guidelines
• Local Plan Minerals Technical Evidence Papers.
• POS & MPA Practice Guidance on the Production and Use of Local Aggregate Assessments (Living Document)
• Environment Agency Waste Interrogator