aggregate report on the greek banks' comprehensive assessment 2015
DESCRIPTION
Aggregate report on the Greek banks' comprehensive assessment 2015 - ECB's Single Supervision Mechanism, 31/10/2015TRANSCRIPT

AGGREGATE REPORT ON THEGREEK COMPREHENSIVE
ASSESSMENT 2015

The document at hand constitutes an analysis of the disclosure data published on 31 October
2015 conducted by the ECB. In case of discrepancies, the disclosure data supersedes this report.
© European Central Bank, 2015
Address Sonnemannstrasse 20, 60314 Frankfurt am Main, Germany
Postal address 60640 Frankfurt am Main, Germany
Telephone +49 69 1344 0
Internet http://www.ecb.europa.eu All rights reserved. Reproduction for educational and non-commercial purposes is permitted provided that the source is acknowledged.
ISBN has been ordered
EU catalogue number has been ordered

Contents 1 Executive summary 1
1.1 Greek Comprehensive Assessment 2015 1
1.2 Outcomes 3
2 Nature and methodology of the Greek Comprehensive Assessment 2015 6
2.1 Rationale 6
2.2 Scope 6
2.3 Overview of the methodology 6
2.4 Execution 13
2.5 Characteristics of the comprehensive assessment 15
2.6 Quality assurance 16
3 Aggregate outcomes of the Greek Comprehensive Assessment 2015 19
3.1 Projected capital change 19
3.2 Shortfall identified 24
4 AQR outcomes 26
4.1 Total adjustment and capital impact 26
4.2 Individually assessed provisions 29
4.3 Collectively assessed provisions 38
4.4 CVA challenger model adjustments 43
5 Stress test 45
5.1 Methodology of the stress test 45
5.2 Scenarios 56
5.3 Aggregate impact by risk drivers under the baseline and adverse scenarios 58
6 Appendices 61
6.1 Detailed results 61
6.2 List of acronyms and abbreviations 62
6.3 Bibliography 64
6.4 Definitions and explanations 65
List of figures Figure 1 Macroeconomic environment in Greece: Real GDP growth 7
Figure 2 Coverage of Greek legal entity cRWA in the AQR 8
Figure 3 Selected exposures by asset segments in the AQR (Greek legal entities) 9
Figure 4 Schematic of AQR workblocks 10
Figure 5 Illustrative high level modelling approach for stress test 13
Figure 6 Project governance 14
Figure 7 Quality assurance correction process 18
Figure 8 Comprehensive assessment CET1 % impact 19
Figure 9 Impact of the AQR by component 20
Figure 10 Stress test impact on capital for base case 21
Figure 11 Stress test impact on capital for adverse case 22
Figure 12 RWA impact from AQR and stress test 23
Figure 13 Comprehensive assessment shortfall by main components 25
Figure 14 Gross AQR adjustment by bank 27
Figure 15 Impact of the AQR by component 28
Figure 16 Summary of impact of provisions by asset class 30
Figure 17 Number of reclassified NPE by bank in the sample 31
Figure 18 Change in provisions by asset class for non-retail reclassified NPE (in the sample)32
Figure 19 Change in provisions by asset class for non-retail existing NPE (in the sample) 33
Figure 20 Collateral valuation adjustments throughout the AQR 34
Figure 21 Collateral value reduction for selected collateral types 35
Figure 22 Impact of projection of findings on non-retail provisioning 36
Figure 23 NPE ratios pre and post-CFR 38
Figure 24 Additional collectively assessed provisions by type of provision 39
Figure 25 Additional specific retail provisions by asset class 40
Figure 26 Additional IBNR by AQR asset class 42
Figure 27 AQR impact of the CVA review grouped by RWA of participating banks 44
Figure 28 Illustrative modelling approach – P&L and Balance Sheet projections 47
Figure 29 Front vs. Back Book & PE vs. NPE 49
Figure 30 Illustrative NPE migration matrix 52
Figure 31 Illustrative Merton model approach 54

Figure 32 Illustrative impairment flow calculation 55
Figure 33 Cumulative stress test impact on the CET1 % by risk driver under the baseline scenario 59
Figure 34 Cumulative stress test impact on CET1% by risk driver under the adverse scenario60
List of tables Table 1 CET1 % and capital shortfall following AQR and stress test 5
Table 2 Overview of key metrics Group vs. Greece for baseline scenario 24
Table 3 Overview of key metrics Group vs. Greece for adverse scenario 24
Table 4 Breakdown of impact by AQR components 27
Table 5 Summary of AQR adjustment by component 29
Table 6 Distribution of impairment triggers for non-retail reclassified NPE 32
Table 7 Illustration of provisioning impact of the projection of findings split by portfolio type 37
Table 8 Spreads for performing and non-performing assets and liabilities 49
Table 9 IBNR stock calculation parameters 55
Table 10 Key macrofinancial variables for the Greek economy 56
Table 11 Financial market shocks in Greece under the adverse scenario 57
Table 12 CET1 % for participating banks 61
Table 13 Buffer (+) / shortfalls (-) for participating banks (€ million) 61
Table 14 AQR adjustment by bank and asset class (€ million) 62

Aggregate report on the Greek Comprehensive Assessment, October 2015
1
1 EXECUTIVE SUMMARY One of the main objectives of the Memorandum of Understanding (MoU) signed by the
European Stability Mechanism, the Hellenic Republic and the Bank of Greece on 19 August
2015 is to implement all necessary policy actions to preserve financial stability and strengthen
the viability of the banking system in Greece. In particular, solvency and liquidity of the
banking sector is to be preserved. Against this backdrop, “a buffer of up to €25billion has been
envisaged under the Programme to address potential bank recapitalisation needs of viable
banks and resolution costs of non-viable banks, in full compliance with EU competition and
state aid rules”. A forward-looking evaluation of each of the four core banks’ capital needs has
thus been requested of the ECB in its supervisory function. As a result, a Comprehensive
Assessment (CA) has been conducted by the ECB, based on end of June 2015 data and
comprising both an asset quality review (AQR) and a stress test with baseline and adverse
scenarios.
The exercise is based on updated macroeconomic data and scenarios that reflect the changed
market environment in Greece and has resulted in aggregate AQR-adjustments of €9.2 billion to
participating banks' asset carrying value. Overall, the assessment has identified capital needs
totalling, post AQR, €4.4 billion in the base scenario and €14.4 billion in the adverse scenario.
Covering the shortfalls by raising capital would then result in the creation of prudential buffers
in the four Greek banks, which will facilitate their capacity to address potential adverse
macroeconomic shocks in the short and medium term and their capacity to improve the
resilience of their balance sheet, keeping an adequate level of solvency.
Banks have to propose remedial actions (capital plans) in order to cover the entire shortfall
(€14.4 billion), out of which a minimum of € 4.4 billion (corresponding to the AQR plus
baseline shortfall) is expected to be covered by private means.
The recapitalisation process under the Programme will follow this exercise. The forthcoming
capital planning and recapitalisation process are not covered in this report.
1.1 GREEK COMPREHENSIVE ASSESSMENT 2015
Following the 19 August 2015 agreement between the European Stability Mechanism, the
Hellenic Republic and the Bank of Greece, the ECB was requested to provide a forward-looking
view of the capital needs of the four Greek systemic banks (Alpha Bank, Eurobank, National
Bank of Greece and Piraeus Bank). The key objective was to review the status of the banks
under a given set of macroeconomic scenarios. This report provides an overview of the
approach taken and presents the results of the exercise.
Aggregate report on the Greek Comprehensive Assessment, October 2015
2
The comprehensive assessment of the Greek banks was broad in scope: the participating banks
have total group assets of €296 billion which account for approximately 90% of the assets of
credit institutions in Greece. Substantially, the comprehensive assessment followed the
methodology of the 2014 exercise of the 130 banks. However, further specifications to the
methodology were required given the specificities of the Greek banking system and the current
macroeconomic situation. These specifications are explained in detail in Chapters 4 and 5.
The comprehensive assessment of the Greek banks consisted of two components.
1. The asset quality review was a point-in-time assessment of the accuracy of the
carrying value of banks’ assets as of 30 June 2015 and provided a starting point
for the stress test. The AQR was undertaken centrally by the ECB, and was based on a
uniform methodology and harmonised definitions. Under the AQR, banks were required
to have a minimum Common Equity Tier 1 (CET1) ratio of 9.5%.
2. The stress test provided a forward-looking examination of the resilience of banks’
solvency to two hypothetical scenarios, also reflecting new information arising
from the AQR. In contrast to the 2014 exercise, this stress test was undertaken
centrally by the ECB based on data templates and loan tapes provided by the four
banks. Under the baseline scenario, banks are required to maintain a minimum CET1
ratio of 9.5%; under the adverse scenario, they are required to maintain a minimum
CET1 ratio of 8%.
The AQR respected current accounting and prudential regulation, including the Capital
Requirements Regulation (CRR) / Capital Requirements Directive IV (CRD IV) rules. The
Greek comprehensive assessment 2015 was in line with the AQR methodology applied in the
comprehensive assessment 2014 as outlined in the AQR Phase 2 manual1. In some areas, the
ECB’s methodology involved additional prudential prescription to accounting concepts; the
results are thus of a prudential nature. Consequently, AQR-adjustments were made in cases
where banks were not breaching accounting rules. However, it is expected that many banks will
reflect many of these adjustments in their accounts in agreement with their statutory auditors.
Examples of areas in which additional prescription was provided include impairment triggers,
the calculation of individual specific provisions, and collateral valuations.
Given the constrained timeline of the exercise, prioritisation of portfolios based on their size and
materiality was required, while applying appropriate rigour to the wider process. Within the
1 https://www.bankingsupervision.europa.eu/ecb/pub/pdf/assetqualityreviewphase2manual201403en.pdf
Aggregate report on the Greek Comprehensive Assessment, October 2015
3
AQR, a detailed asset-level review was performed for over 26 specific portfolios making up
92% of the banks' risk-weighted assets in Greece.
The stress test is not a forecast of future events, but a prudential exercise to assess banks’ ability
to withstand weaker economic conditions. In the Greek comprehensive assessment 2015, the
stress test was undertaken centrally based on data templates and loan tapes provided by the
banks. The projections were produced by the ECB following a centrally agreed methodology.
Throughout the exercise, there has been an appropriate level of interaction with the banks’
technical teams in order for the ECB to understand the banks’ submissions.
In order to maintain consistency and equal treatment across both the AQR and stress test, Single
Supervisory Mechanism (SSM) teams independently performed quality assurance on the data
provided by the banks and work of external auditors. On the AQR side, the ECB was in close
contact with the external auditors, responding to over 150 methodology and process questions.
The ECB reviewed and challenged outcomes from an SSM-wide perspective using comparative
benchmarking, as well as engaging SSM on-site teams to investigate specific issues that arose.
Over 300 experts (including external auditors, appraisers, consultants, and SSM staff) were
involved in the AQR. On the stress test side, the ECB has followed a pre-approved quality
assurance process including benchmarking of the results and comparing all projections with
banks’ own projections, with the material differences having been understood in detail. For the
avoidance of doubt, the ECB’s centrally calculated projections were always applied, however
the banks’ projections were used extensively in order to identify material differences and justify
the rationale for those.
1.2 OUTCOMES
Significant AQR findings have been found in this exercise, despite the already material AQR
findings from 2014 being captured in banks accounts. This has primarily been driven by the
deterioration in the macro-economic environment in Greece which has led to higher NPE
volumes as well as lower collateral values and cashflow valuations which has led to material
reductions in carrying values. Additionally, further standardization of the definition of key
metrics across the EU has led to further NPE and impairment recognition in the AQR. As an
example the full implementation of the EBA ITS on NPE has meant that forborne cases could
be better identified and tested for impairment. Finally, the fact that tax offsets were not allowed
from the AQR has amplified the findings of the AQR vis a vis 2014.

Aggregate report on the Greek Comprehensive Assessment, October 2015
4
The AQR resulted in direct aggregate adjustments of €9.2 billion to participating banks'
asset carrying values as of 30 June 20152. Including indirect impacts on CET1%, post
AQR, the average CET1% for the system was 7.9%. The direct adjustments originated
primarily from accrual accounted assets, particularly adjustments to specific provisions on non-
retail exposures and retail mortgages. Additionally, non-performing exposure (NPE) stocks
were increased by €7 billion across the in-scope institutions, as NPE definitions were moved
onto a harmonised and comparable basis, including the examination of forbearance as a trigger
of NPE status.
In the base scenario of the stress test, this capital impact leads to a decrease of the CET1 ratio
for the system of 0.3 percentage points from 7.9% (post AQR) to 7.6% in 2017. In the adverse
scenario, the impact is a decrease of the CET1 ratio for the system of 7.8 percentage points from
7.9% (post AQR) to 0.1%.
Overall, the comprehensive assessment identified a capital shortfall of €4.4 billion and
€14.4 billion in the baseline and adverse scenario, respectively, across the four
participating banks after comparing these projected solvency ratios against the thresholds
defined for the exercise.
The results of the exercise, including the reduction in the CET1 ratio projected as of December
2017 for each bank in both the base and adverse scenarios are shown in Table 13.
2 The direct impact of AQR on provisions and CVA is equal to €9.2 billion. The indirect impact of AQR on CET1
(e.g. DTA deductions) and RWA is equal to € 401 million and €8.8 billion, respectively. 3 The shortfall shown in the table reflects the lowest capital level over the 2.5 year period. In the baseline scenario
this is not necessarily December 2017, for which the projected CET 1 ratio is indicated.

Aggregate report on the Greek Comprehensive Assessment, October 2015
5
Table 1 CET1 % and capital shortfall following AQR and stress test
The remainder of this report is structured as follows:
Nature and methodology of the exercise: Objectives and guiding principles, a high-level
view of its approach and the execution of the project
Aggregate outcomes of the comprehensive assessment
Outcomes of the AQR and further analysis: review of the detailed drivers of the AQR
results and details on the methodology applied
Outcomes of the stress test and further analysis: review of the detailed drivers of the
stress test results and details on the methodology applied
Bank Name
CET1 ratio starting point pre AQR
CET1 ratio starting point post AQR
CET1 ratio baseline scenario
CET1 ratio adverse scenario
Capital shortfall baseline scenario (€ billion)
Capital shortfall adverse scenario (€ billion)
Alpha Bank, S.A. 12.7% 9.6% 9.6% 2.1% 0.26 2.74
Eurobank
Ergasias, S.A.13.7% 8.6% 8.7% 1.3% 0.34 2.12
National Bank of
Greece, S.A.11.6% 8.1% 7.3% -0.2% 1.58 4.60
Piraeus Bank,
S.A.10.8% 5.5% 5.2% -2.3% 2.21 4.93
System wide 12.1% 7.9% 7.6% 0.1% 4.39 14.40

Aggregate report on the Greek Comprehensive Assessment, October 2015
6
2 NATURE AND METHODOLOGY OF THE GREEK COMPREHENSIVE ASSESSMENT 2015
This chapter explains the rationale for the Greek comprehensive assessment, its components,
provides a high-level overview of the methodology and describes how it was executed. Finally
this chapter introduces some key features of the exercise that the reader should be aware of
when interpreting the results.
2.1 RATIONALE
Following the agreement from 19 August 2015 between the European Stability Mechanism, the
Hellenic Republic and the Bank of Greece, the ECB was requested to provide a forward looking
view of the capital needs of the four Greek systemic banks (Alpha Bank, Eurobank, National
Bank of Greece and Piraeus Bank). The key objective was to review the status of the banks,
under given new macroeconomic scenarios and measure the capital needs for a subsequent
recapitalisation exercise.
2.2 SCOPE
The ECB has undertaken a comprehensive assessment of the four Greek significant institutions
with total group assets of €296 billion at the end of June 2015, accounting for approximately
90% of total banking assets in Greece. These banks were identified based on significance
criteria referred to in Article 6(4) of the SSM Regulation. The four banks in scope were the
following:
Alpha Bank, S.A.
Eurobank Ergasias, S.A.
National Bank of Greece, S.A.
Piraeus Bank, S.A.
2.3 OVERVIEW OF THE METHODOLOGY
The exercise comprised two pillars, namely the AQR and the stress test.
The AQR aimed to review the carrying value of assets on the participating banks' balance sheets
as of 30 June 2015. The result was an indication of the need for additional provisions for losses
on exposures on banks' balance sheets, leading to prudently calculated AQR-adjusted capital
Aggregate report on the Greek Comprehensive Assessment, October 2015
7
ratios, which allowed for the meaningful comparison of all participating banks on a like-for-like
basis.
Based on the AQR-adjusted balance sheet, the stress test examined the resilience of banks
against two separate scenarios – a baseline and adverse scenario – starting in H2 2015 and
running to the end of 2017. Under both scenarios, the solvency ratio of each bank was analysed
over that period to understand bank sensitivities given prescribed stressed economic conditions.
The baseline scenario was provided by the European Commission and reflected then-prevailing
official macroeconomic forecasts while the adverse scenario represented a severe economic
downturn triggered by a materialisation of the main economic risks as provided by the ECB.
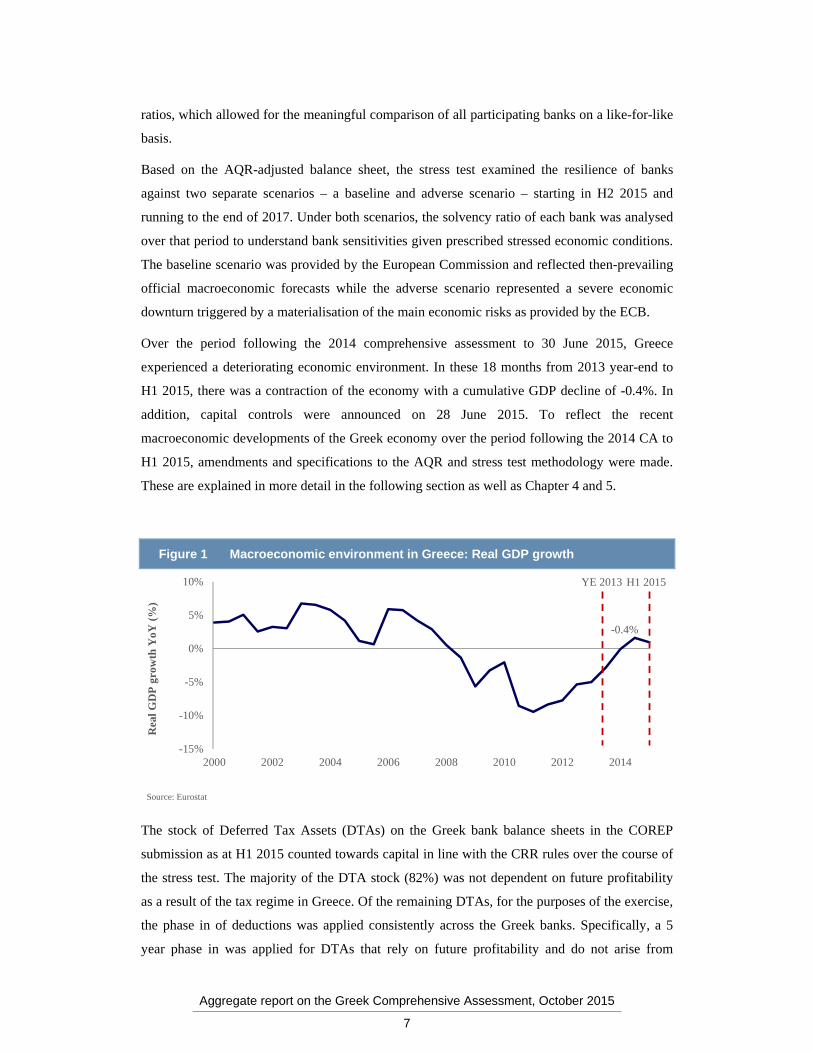
Over the period following the 2014 comprehensive assessment to 30 June 2015, Greece
experienced a deteriorating economic environment. In these 18 months from 2013 year-end to
H1 2015, there was a contraction of the economy with a cumulative GDP decline of -0.4%. In
addition, capital controls were announced on 28 June 2015. To reflect the recent
macroeconomic developments of the Greek economy over the period following the 2014 CA to
H1 2015, amendments and specifications to the AQR and stress test methodology were made.
These are explained in more detail in the following section as well as Chapter 4 and 5.
Figure 1 Macroeconomic environment in Greece: Real GDP growth
The stock of Deferred Tax Assets (DTAs) on the Greek bank balance sheets in the COREP
submission as at H1 2015 counted towards capital in line with the CRR rules over the course of
the stress test. The majority of the DTA stock (82%) was not dependent on future profitability
as a result of the tax regime in Greece. Of the remaining DTAs, for the purposes of the exercise,
the phase in of deductions was applied consistently across the Greek banks. Specifically, a 5
year phase in was applied for DTAs that rely on future profitability and do not arise from
-15%
-10%
-5%
0%
5%
10%
2000 2002 2004 2006 2008 2010 2012 2014
Source: Eurostat
YE 2013 H1 2015
Rea
l GD
P g
row
th Y
oY(%
)
-0.4%

Aggregate report on the Greek Comprehensive Assessment, October 2015
8
temporary differences (12% of stock), whilst DTAs that rely on future profitability and arise
from temporary differences had either a 10 year or a 5 year phase in, depending on whether they
existed prior to year-end 2013 or not (4% of stock take a 10 year phase in, whilst 2% takes a 5
year phase in). No further DTA accumulation was allowed for the purposes of the exercise from
either the AQR or the stress test.
2.3.1 AQR METHODOLOGY
The Greek comprehensive assessment 2015 followed the same methodology applied in the
comprehensive assessment 2014 as outlined in the AQR Phase 2 manual. Given the constrained
timeline of the exercise, prioritisation of portfolios based on their size and materiality was
required, while applying appropriate rigour to the wider process.
For the purpose of this exercise, the portfolio selection from the 2014 AQR was taken as the
starting point, though the focus was put solely on exposures booked in Greek legal entities. In
total 92% of Greek legal entity credit Risk-Weighted Assets (cRWA) were reviewed as part of
the AQR.
Figure 2 Coverage of Greek legal entity cRWA in the AQR4
4 For Alpha Bank, additional coverage with granular data (i.e. loan tapes) was achieved for adequate treatment in the
stress test.
92%85%
95% 94% 94%
12%
0%
10%
20%
30%
40%
50%
60%
70%
80%
90%
100%
Average Alpha Bank Eurobank NBG Piraeus Bank
cRW
Aco
vera
ge (
%)
by
ban
k
cRWA coverage % Additional cRWA covered under ST
Note: cRWA coverage by bank refers to total Greek legal entity cRWA covered within the AQR exercise per bank
Aggregate report on the Greek Comprehensive Assessment, October 2015
9
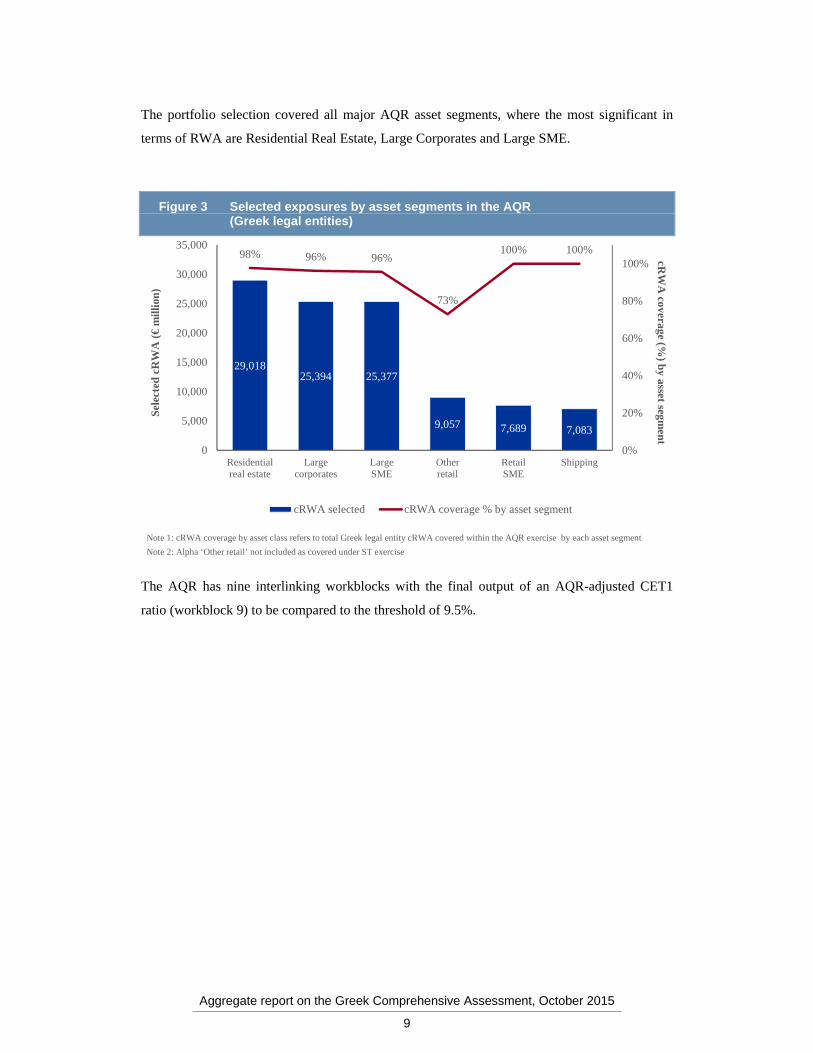
The portfolio selection covered all major AQR asset segments, where the most significant in
terms of RWA are Residential Real Estate, Large Corporates and Large SME.
Figure 3 Selected exposures by asset segments in the AQR (Greek legal entities)
The AQR has nine interlinking workblocks with the final output of an AQR-adjusted CET1
ratio (workblock 9) to be compared to the threshold of 9.5%.
29,01825,394 25,377
9,057 7,689 7,083
98% 96% 96%
73%
100% 100%
0%
20%
40%
60%
80%
100%
0
5,000
10,000
15,000
20,000
25,000
30,000
35,000
Residentialreal estate
Largecorporates
LargeSME
Otherretail
RetailSME
Shipping
cRW
Acoverage (%
) by asset segm
entSe
lect
ed c
RW
A (
€m
illio
n)
cRWA selected cRWA coverage % by asset segment
Note 1: cRWA coverage by asset class refers to total Greek legal entity cRWA covered within the AQR exercise by each asset segment
Note 2: Alpha ‘Other retail’ not included as covered under ST exercise

Aggregate report on the Greek Comprehensive Assessment, October 2015
10
Figure 4 Schematic of AQR workblocks
Each workblock is described in more detail below:
1. Processes, Policies and Accounting review (PP&A) / Credit Valuation Adjustment
(CVA): A challenger model was used to assess the banks' CVA calculation in detail.
The challenger model was based on the bank internal exposure projections (or Basel
Exposure at Default (EAD) for derivatives where these did not exist). The challenger
model was segmented and calibrated to reflect current market conditions.
2. Loan tape creation and data integrity validation (DIV): The credit analysis (sample
selection and collective provisioning challenger model creation) was based on a "loan
tape" provided by the bank. This loan tape included basic account information such as
segment classification, missed payments status and identifiers of the loan / entity. The
data was required to be of sufficient quality to perform the required analysis, which
necessitated automated checks of the data set and a review of consistency across
internal IT systems.
3. Sampling: Given the volume of analysis involved it was neither possible nor
appropriate to review all exposures in every portfolio within the scope of the credit file
Loan tape creation and data integrity
validation (DIV)
Sampling Creditfile review
(CFR)
Determination of AQR-
adjusted CET1 for use in ECBstress test and definition ofremediation activities for
banks following the CA
Processes, policies and accounting
review (PP&A)
[Note: notrelevant for this exerciseapart from
CVA workblock]
Level 3 fair value exposures review[Note: not relevant for this exercise]
Level 3revaluation
of non-derivative assets
Core processes review
Derivative pricing
model review
Collective provisioning
Projection of findingsof credit file review
Collateral and real estate valuation
Portfolio selection
1 2 3 4 6
7
5
9
8
i. ii. iii.CVA
challenger modeladjust-ments
Phase 1
Phase 2

Aggregate report on the Greek Comprehensive Assessment, October 2015
11
review. Therefore, risk-based sampling was conducted in a manner that meant the
sample chosen was both large enough, and representative enough, to allow for robust
analysis and later projection back to cover the entire portfolio. The size of the sample
depended on: the homogeneity of the portfolio, the risk of the portfolio, the total
number of debtors and the level of debtor concentration. Portfolios were stratified based
on the riskiness and exposure size of debtors. The approach to sampling was consistent
with best practice as defined by adherence to ISA 530.
To achieve a timely completion of this exercise, the sample for the 2014 CA has been
taken as the starting point. In addition, “fresh” files were selected amounting to at least
10% for each portfolio.
4. Credit file review (CFR): The credit file review involved external auditors working on
an exposure by exposure basis to verify that each credit exposure had been correctly
classified in the bank’s systems (e.g. correct regulatory segment, NPE status,
impairment status) and that, if a specific provision was required, it had been set at an
appropriate level. The CFR covered all loans, advances, financial leases and other off
balance sheet items in the selected portfolios.
To account for the current market environment, a number of additional elements were
included: in particular external auditors needed to make sure that information on
companies and collateral reflected the current market conditions. Quality assurance
findings from the 2014 CA were taken into account from the start. The credit file review
was also extended in order to capture any effects from the capital controls as an input to
the stress test. In addition minimum haircuts were applied across all major asset classes.
5. Collateral and real estate valuation: A key input to determine appropriate carrying
amounts is the valuation of collateral. The results of these valuations were used as
inputs to credit file review and collective provisioning.
For the exercise to be feasible in the tight timeline available, the valuation of collateral
was limited to the areas deemed most important: All shipping collaterals were reviewed;
for residential mortgages, collateral values were updated from 2014 using an index with
a sample of 20% of properties being reappraised to verify the results of indexing; for
real estate related debtors, revaluation criteria as per the Manual were followed; for
other non-retail exposures reappraisals were conducted where deemed required by the
bank team.
6. Projection of findings of credit file review: Findings of the credit file review were
then projected to the unsampled part of the portfolio. Specifically, projected metrics

Aggregate report on the Greek Comprehensive Assessment, October 2015
12
were mainly provisions and NPE reclassifications. Projection of findings was applied to
homogeneous pools of exposure within each portfolio called "strata" (in line with audit
guidelines, see Sampling). In order to prevent overstating the projection of single credit
file review findings, a number of safeguards were implemented in the projection
methodology (e.g. flagging of anomalies, common risk stratum based projection – using
results from the whole risk bucket rather than just from the stratum, and overrides – in
rare cases where results from the sample were felt to be unrepresentative which had to
be approved centrally by the ECB).
7. Collective provisioning analysis: Smaller, homogeneous, impaired exposures are
typically provisioned using a collective provisioning approach – that is, a point-in-time
statistical model of incurred loss. Similarly, incurred but not reported (IBNR5) and other
general provisions are usually set using collective models. Therefore, in order to verify
that provisioning levels were appropriate, it was important that collective provisioning
models were fully aligned with the letter and spirit of accounting rules (IAS6 39). This
was performed using a comparison of banks’ practices to provisioning levels suggested
by a unified, simplified challenger model. In this exercise, the challenger model
calibration was tailored to the current environment by calculating parameters for three
time windows (2013, 2014, H1 2015) and subsequently selecting the most appropriate.
9. Determination of AQR-adjusted CET1 ratio for use in ECB stress test: In order to
correctly account for all AQR adjustments, an “AQR-adjusted CET1 ratio” was
calculated for each bank. This AQR-adjusted CET1 ratio was calculated according to
the Single Rulebook, reflecting the implementation of the CRR / CRD IV rules (taking
into account transitional arrangements) as of year-end 2015 – the main difference being
that no formation of new DTAs will be allowed, associated to the AQR adjustments
beyond those already booked by June 2015.
2.3.2 STRESS TEST METHODOLOGY
The stress test model projected CET1 ratios for each bank according to a baseline and adverse
scenario. The output projection of CET1 ratios was compared to the CET1 ratio thresholds
designed for the exercise and a shortfall calculated as the maximum CET1 shortfall in absolute
terms at June 2015 and December 2015, 2016 and 2017.
The high level modelling approach for the projection was as per the diagram below.
5 Provisions set aside for future expected losses on currently performing debtors. 6 International Accounting Standards.

Aggregate report on the Greek Comprehensive Assessment, October 2015
13
Figure 5 Illustrative high level modelling approach for stress test
A projection of the P&L and balance sheet was produced based on the underlying performance
of each bank. The CET1 ratio projection then considered the roll forward of capital in a
mechanical manner, fully reflecting CRD IV phase in and other assumptions defined by the
relevant stakeholders. Detailed “drill down” analysis was performed on Net Interest Income
(NII), Other Operating Income and Expenses, RWA and provisions. The drill down analysis fed
the P&L and balance sheet projection. More details on the stress test methodology applied are
provided in Chapter 5.
2.4 EXECUTION
A number of parties were involved in the execution of the Greek comprehensive assessment:
The Steering Committee of the comprehensive assessment was the main decision and
steering body at the ECB / SSM level
The Operational Project Management Meeting performed project management on an
operational level, was responsible for progress control and coordination and prepared
decision making for the Steering Committee
At the ECB, the comprehensive assessment was conducted and coordinated under the
lead of a Central Programme Management Office
P&L + Balance Sheet projection
H1 2015 H2 2015 2016 2017
CET 1% XX XX XX XX
RWA XX XX XX XX
Balance Sheet
Assets XX XX XX XX
Liabilities XX XX XX XX
Equity XX XX XX XX
P&L
Income XX XX XX XX
Expenses XX XX XX XX
Retained earnings XX XX XX XX
RWA projection module
Credit loss module
Net interest income and volumes module
Other income and expenses module
2016 2017
CET1 %
P&L and balance sheet projection

Aggregate report on the Greek Comprehensive Assessment, October 2015
14
The ECB SSM Technical and Quality Assurance (QA) team performed central and on-
site quality assurance on data provided by the banks and external auditors, prepared the
models and templates used and developed the methodology applied in the exercise
The Bank of Greece as the national supervisor has been closely involved in the process
(including the QA mentioned above), contributing with its local expertise about the
banks under review
External auditors, property appraisers and valuation advisers were involved in the
completion of the bank’s AQR, acted as a first line of defence in the quality assurance
and reported to the ECB. Note – the auditor for each bank was not the statutory auditor
of the bank. Overall, more than 200 audit and valuation experts where involved in the
exercise, reviewing about 4,000 credit files and 12,000 collateral items
Participating banks were responsible for fulfilling their obligations to the ECB,
providing data for the AQR and the stress test
Figure 6 Project governance
The two components of the comprehensive assessment, AQR and stress test, were executed by
these bodies in different ways, reflecting the nature of each exercise:
The AQR was executed by the external auditors, following a methodology designed and
published by the ECB. Central quality assurance was performed and requests were
made by the ECB and the external auditors to investigate certain results – further details
of this process can be found in Chapter 2.6. Both the ECB and external auditors were
ECB QA & Technical Team
Bank Teams (AQR) / Banks (Stress Test)
Steering Committee
Operational Project Management Meeting
Bank of Greece
CPMO

Aggregate report on the Greek Comprehensive Assessment, October 2015
15
supported by external advisors (including consultants and appraisers) who brought
expertise and independence to the review
In this year’s comprehensive assessment, the stress test was a centrally led top-down
ECB exercise, following a methodology designed and published by the ECB. Banks
provided the ECB with data on their baseline projections, while the adverse scenario
projections were centrally performed by the ECB
Following completion and finalisation of the comprehensive assessment result, a
"supervisory dialogue" process was conducted between the participating banks and their
Joint Supervisory Teams (JSTs). During the supervisory dialogue meetings, partial and
preliminary results of the comprehensive assessment were shared and discussed. The
banks were given 24 hours following the meeting to provide comments and questions to
the ECB which assessed their materiality and incorporated where deemed appropriate
2.5 CHARACTERISTICS OF THE COMPREHENSIVE ASSESSMENT
A number of characteristics of the comprehensive assessment should be borne in mind when
considering the results.
The comprehensive assessment was a prudential rather than accounting exercise. Although
the exercise was conducted with regard to current accounting standards (IFRS), the prudential
rules were considered as binding and were observed strictly and used to support the appropriate
interpretation of the IFRS rules. The outcomes of the comprehensive assessment will
consequently not necessarily be reflected directly in banks' accounts following the exercise, as
alternative accounting interpretations may be possible, but not prudential.
The comprehensive assessment sought to maintain a level playing field across the four Greek
banks by providing guidance on a range of important inputs such as impairment triggers,
provisioning approaches for going concern NPE, collateral valuation and collateral haircuts for
gone concern NPE, point-in-time collective provisioning, and credit valuation adjustment
calculation where possible.
External auditors were aided by the published methodology7 prepared for the comprehensive
assessment 2014, which was complemented by additional guidance on the specifics of the
Greek exercise. Furthermore, external auditors were supported by a central frequently asked
7 AQR Phase 2 Manual, published on
https://www.bankingsupervision.europa.eu/ecb/pub/pdf/assetqualityreviewphase2manual201403en.pdf

Aggregate report on the Greek Comprehensive Assessment, October 2015
16
questions (FAQ) and helpdesk process, as well as the thorough review of any outliers or
anomalies during the central quality assurance process.
The comprehensive assessment involved central oversight in both methodology definition
and quality assurance for consistency and transparency. This included the preparation of the
methodological manual and providing additional clarifying support.
The teams were aided in their work as both the external auditors and the Central Project
Management Office (CPMO) had experience of the QA process in 2014 and thus had the tools
and techniques to identify and achieve compliance with the manual.
The AQR was conducted using a general principle that an approach would be adopted
only where objective data was available to justify it. Whenever such data was not available a
conservative fall-back assumption was used and applied consistently across the Greek system.
An example of this is the use of loss emergence periods in the collective provisioning
workblock. Loss emergence periods have a direct impact in provisions required for performing
loans. A rebuttable assumption of 12 months was employed, which could only be lowered
where granular, objective data was analysed by the bank team and approved by the ECB to
show that a shorter period was appropriate.
The stress test is a forward-looking exercise that provides insight into the ability of a bank
to withstand pre-defined adverse economic conditions. It should be noted that the stress test
is not a forecast of future events, but rather a prudential gauge of participating banks’ resilience
under severe but plausible macroeconomic conditions. For example, a number of restrictive
rules were imposed by the stress test methodology that constrict the responses of the
participating banks to stress. These rules enhance the prudential nature of the exercise.
2.6 QUALITY ASSURANCE
This sub-section outlines the process of quality assurance conducted on the AQR and stress test,
including an overview of the types of checks conducted.
To ensure an accurate and timely delivery of the AQR and stress test results, a thorough QA
process has been put in place, involving ad hoc central and onsite ECB / SSM teams composed
of experts from different business areas of ECB and SSM. Those teams were regularly reporting
to the Operational Project Management Meeting and to the Steering Committee. In addition, the
banks themselves made significant efforts to supply data and other requested information to the
necessary standard on time.

Aggregate report on the Greek Comprehensive Assessment, October 2015
17
The ECB Central QA team was mainly responsible for methodological oversight, cross-
bank benchmarking as well as performing automated QA checks on the data provided by
the external auditors (AQR) or the banks (stress test).
The SSM on-site QA team (especially devoted to the AQR) contributed heavily to the QA
by performing a file by file review in parallel to external auditors to challenge their work
by performing spot checks and liaising with the auditors on-site.
JST’s contributed with their supervisory experience and engaged with the central and on-
site QA teams in the investigation of specific issues
In particular, regarding the AQR:
The quality of results was improved by providing detailed feedback on unexpected data items,
unfilled fields and outlier submissions, as well as reviewing issues escalated by external
auditors.
Granular analysis allowed the ECB to scrutinise the results of each workblock on a bank, asset
class and system level. Areas where expert judgement was provided by external auditors or
where there could be potential errors in the implementation of the methodology were challenged
on a line-by-line basis by the ECB. Areas in which calculated parameters were outside of
expected ranges (e.g. probability of impairment and loss given impairment within collective
provisioning) were identified for future analysis.
Where more contentious issues arose, the ECB presented recommendations based on its
understanding of the situation, and could open a bilateral discussion in the event of a
disagreement. Additional analysis could then be presented by external auditors to justify the
results. In cases of continued disagreement, the ECB decided upon implementation. The
following diagram outlines the process by which the more contentious issues were resolved,
always with the aim of reaching consensus between the ECB and
external auditors.

Aggregate report on the Greek Comprehensive Assessment, October 2015
18
Figure 7 Quality assurance correction process
The combined work of the off-site and on-site team gave the ECB a reasonably complete picture
of the work of the external auditors, and the ECB was thus able to be effective in QA despite the
short time-frame.
There were 4 critical elements to the Quality Assurance of the stress test analysis: (1) Basic data
quality checks on all of the input data (2) Comparison of ECB centrally led projections with
bank projections (3) Sense checks on projections based on benchmarking analysis and (4) ECB
expert review. The four elements are discussed more fully below:
1. Basic data quality checks were performed on all the input data templates. This involved
basic tests e.g. check for segment volumes that don’t add up to total; totals on different
templates that should match, do match; no missing data etc. Issues that were identified
were resolved or other prudent adjustments made in ECB projections.
2. Once the input data set from the banks was verified, the ECB produced its own stress test
projections. To ensure that there were no issues around interpretation of input data in the
calculations the projections were compared to the banks projections. Where there were
divergences between bank and ECB projections that had a material impact on the CET1%,
investigations were carried out with the relevant bank.
3. A peer benchmarking was carried of the four banks across a wide range of factors.
Unintuitive findings from a relative or absolute perspective were verified. If issues were
confirmed, inputs were revised or other prudent adjustments were made in ECB
projections.
4. Finally, the stress test projection models were reviewed by a range of different experts
from the ECB not directly involved in the calculations. These ECB staff identified any
issues or concerns and highlighted them to the team managing the models. Any issues were
discussed and errors were fixed. Any alternative propositions on assumptions were
forwarded to the steering committee for decision.
Identification of QA issue
• ECB QA team identifies a number of anomalies and outliers and form a recommended course of action for anomalous datapoints on the basis of evidence available to them
Desired action communicated to bank team
Further bank team analysis and ECB
consideration
• In case of disagreement on the issue from the bank team, the ECB is willing to consider further evidence and the process would “loop” back to step 2
1
3
2 • The recommendation is provided to bank teams for action

Aggregate report on the Greek Comprehensive Assessment, October 2015
19
3 AGGREGATE OUTCOMES OF THE GREEK COMPREHENSIVE ASSESSMENT 2015
This chapter first shows the aggregate change in available and required capital that was
projected by the comprehensive assessment under the base and adverse scenario, covering both
the AQR and stress test impact. Subsequently, it details the capital shortfall that arises after
comparing the capital impacts against the relevant thresholds.
3.1 PROJECTED CAPITAL CHANGE
The comprehensive assessment capital impact across the four Greek significant institutions is
€10.6 billion in the base case and €25.6 billion in the adverse scenario. €9.6 billion represents
that AQR impact (€9.2 billion relate to adjustments in the carrying value of assets and €0.4
billion to the additional indirect impact on capital deductions), while the capital impact from the
stress test was €1.0 billion in the base case and €16.0 billion in the adverse, as can be seen in
Figure 8 below.
Figure 8 Comprehensive assessment CET1 % impact
Significant AQR findings have been found in this exercise, despite the already material AQR
findings from 2014 being captured in banks accounts. This has primarily been driven by the
deterioration in the macro-economic environment in Greece which has led to higher NPE
volumes as well as lower collateral values and cashflow valuations which has led to material
reductions in carrying values. Additionally, further standardization of the definition of key
12.1%
7.9%
0.1%
0.1%
-4.2%
-7.8%
0%
2%
4%
6%
8%
10%
12%
14%
Starting pointCET1
Capitaldepletion from
AQR
Capitaldepletion inStress Test
Final CET1
Baseline scenario Adverse scenario
12.1%
7.9% 7.6% 7.6%
-4.2%
-0.3%
0%
2%
4%
6%
8%
10%
12%
14%
Starting pointCET1
Capitaldepletion from
AQR
Capitaldepletion inStress Test
Final CET1

Aggregate report on the Greek Comprehensive Assessment, October 2015
20
metrics across the EU has led to further NPE and impairment recognition in the AQR. As an
example the full implementation of the EBA ITS on NPE has meant that forborne cases could
be better identified and tested for impairment. Finally, the fact that tax offsets were not allowed
from the AQR has amplified the findings of the AQR vis a vis 2014.
The AQR part of the comprehensive assessment required changes to asset carrying values of
€9.2 billion. This led to an adjustment of the aggregate June 2015 CET1 ratio from 12.1% pre
AQR to 7.8% post AQR (before adjustments to RWA, DTAs and Internal Ratings Based (IRB)
provisioning shortfall). Additionally, RWA was decreased by €8.8 billion, due to the additional
provisions and other appropriate adjustments were made to DTA and other deductions as well
as the IRB provisioning shortfall for banks that are IRB. Post the necessary adjustments
mentioned, the final post AQR CET1 ratio, which also represents the stress test starting point,
has been adjusted to 7.9%. The main drivers of the AQR impact can be seen in Figure 9 below
and are discussed in detail in Chapter 4.
Figure 9 Impact of the AQR by component
The stress test base scenario capital impact across the four Greek significant institutions is 0.3
percentage points. This includes projected capital depletion of €1.0 billion, representing 6.3% of
total post AQR CET1 capital held by the banks at 30 June 2015, and a decrease in RWA of €5.3
billion. The stress test adverse scenario capital impact across the four Greek significant
institutions is 7.8 percentage points. This includes projected capital depletion of €16.0 billion,
1. Additional DTAs (tax offsetting impact) as a result of additional AQR provisions have not been recognised. As a result, additional provisions identified through the AQR exercise have a direct impact on AQR-adjusted CET1 ratio
2,717
4,665
9,069
1,949
4,404
133
9,202
0
1,000
2,000
3,000
4,000
5,000
6,000
7,000
8,000
9,000
10,000
Individually assessedprovisions
Collective provisioning CVA AQR capital impact
AQ
R a
dju
stm
ent/
ca
pit
al im
pac
t (€
mil
lion
)
Additional provisions Other adjustments
Projection of findings
Individually assessed during credit file review
1

Aggregate report on the Greek Comprehensive Assessment, October 2015
21
representing 99.1% of total post AQR CET1 capital held by the banks at 30 June 2015, and a
decrease in RWA of €23.1 billion.
The main drivers of the stress test results can be seen in Figures 10 and 11 below and are
discussed in more detail in Chapter 5.
Figure 10 Stress test impact on capital for base case
15,159
- 8,485
- 2,694
8,958
1,202
16,179
0
5,000
10,000
15,000
20,000
25,000
30,000
Jun-15 post-AQR capital
position
Cumulative pre-provision profits
(Jun-15 -Dec-17)
Cumulativeimpairments
(Jun-15 -Dec-17)
Otherextraordinaryitems & tax
CRR deductionsand other
capital effects
Dec-17 finalcapital position
Syst
em w
ide
CE
T1
(€m
illio
n)
1. Other extraordinary items & tax is defined as adjustments of REO carrying values, impairments on goodwill, profits of participations & methodological adjustments of participations carrying values, and tax2. CRR deductions and other capital effects is defined as the values which must be deducted from the bank‘s tangible equity in order to arrive at CET1
1 2

Aggregate report on the Greek Comprehensive Assessment, October 2015
22
Figure 11 Stress test impact on capital for adverse case
The detailed RWA impact decomposed into the impact from the AQR and the stress test is
shown in Figure 12 below.
- 17,118
- 1,926 -726
3,735
16,179
0
5,000
10,000
15,000
20,000
25,000
Jun-15 post-AQR capital
position
Cumulative pre-provision profits
(Jun-15 - Dec-17)
Cumulativeimpairments
(Jun-15 -Dec-17)
Otherextraordinaryitems & tax
CRR deductionsand other
capital effects
Dec-17 finalcapital position
Sys
tem
wid
e C
ET
1 (€
mill
ion
)
15,159
144
1. Other extraordinary items & tax is defined as adjustments of REO carrying values, impairments on goodwill, profits of participations & methodological adjustments of participations carrying values, and tax2. CRR deductions and other capital effects is defined as the values which must be deducted from the bank‘s tangible equity in order to arrive at CET1
1 2

Aggregate report on the Greek Comprehensive Assessment, October 2015
23
Figure 12 RWA impact from AQR and stress test
The figures illustrated above are consolidated Group figures, including international
subsidiaries. In the figures below, a set of aggregate projections of key metrics is provided for
the Group and Greece, both for the baseline and adverse scenario. Note – only Greek legal
entities were included in the AQR. Also, NPE levels are stated in terms of Basel EAD classified
as non-performing applying a simplified European Banking Authority (EBA) definition, divided
by total EAD (i.e. total loans and receivables and Hold-to-Maturity instruments, including
Sovereign exposures).
204,882181,802
- 8,835 -5,340
-17,739
213,717
0
50,000
100,000
150,000
200,000
250,000
Jun-15 pre-AQR RWA
position
AQR impact Jun-15 post-AQR
Stress test(base) impact
Additionalstress test(adverse)
impact
Dec-17 finalRWA position
Sys
tem
wid
e R
WA
(€
mil
lion
)
Aggregate report on the Greek Comprehensive Assessment, October 2015
24
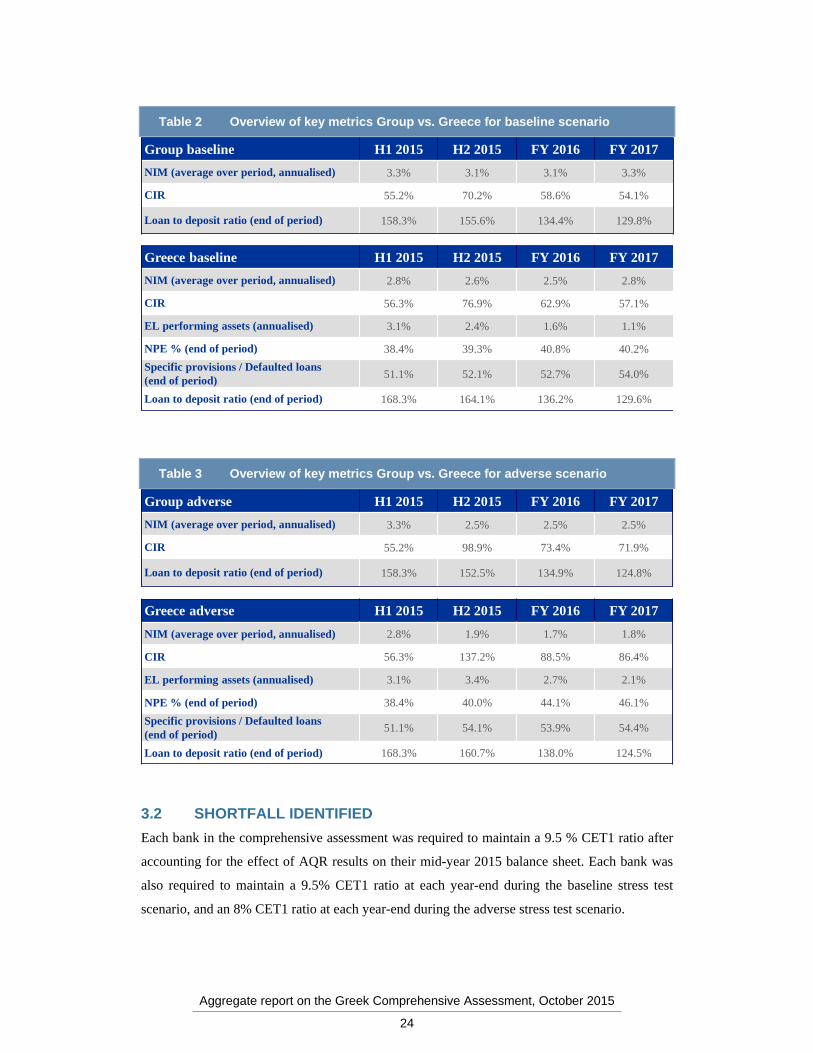
Table 2 Overview of key metrics Group vs. Greece for baseline scenario
Table 3 Overview of key metrics Group vs. Greece for adverse scenario
3.2 SHORTFALL IDENTIFIED
Each bank in the comprehensive assessment was required to maintain a 9.5 % CET1 ratio after
accounting for the effect of AQR results on their mid-year 2015 balance sheet. Each bank was
also required to maintain a 9.5% CET1 ratio at each year-end during the baseline stress test
scenario, and an 8% CET1 ratio at each year-end during the adverse stress test scenario.
Group baseline H1 2015 H2 2015 FY 2016 FY 2017
NIM (average over period, annualised) 3.3% 3.1% 3.1% 3.3%
CIR 55.2% 70.2% 58.6% 54.1%
Loan to deposit ratio (end of period) 158.3% 155.6% 134.4% 129.8%
Greece baseline H1 2015 H2 2015 FY 2016 FY 2017
NIM (average over period, annualised) 2.8% 2.6% 2.5% 2.8%
CIR 56.3% 76.9% 62.9% 57.1%
EL performing assets (annualised) 3.1% 2.4% 1.6% 1.1%
NPE % (end of period) 38.4% 39.3% 40.8% 40.2%
Specific provisions / Defaulted loans (end of period)
51.1% 52.1% 52.7% 54.0%
Loan to deposit ratio (end of period) 168.3% 164.1% 136.2% 129.6%
Group adverse H1 2015 H2 2015 FY 2016 FY 2017
NIM (average over period, annualised) 3.3% 2.5% 2.5% 2.5%
CIR 55.2% 98.9% 73.4% 71.9%
Loan to deposit ratio (end of period) 158.3% 152.5% 134.9% 124.8%
Greece adverse H1 2015 H2 2015 FY 2016 FY 2017
NIM (average over period, annualised) 2.8% 1.9% 1.7% 1.8%
CIR 56.3% 137.2% 88.5% 86.4%
EL performing assets (annualised) 3.1% 3.4% 2.7% 2.1%
NPE % (end of period) 38.4% 40.0% 44.1% 46.1%
Specific provisions / Defaulted loans (end of period)
51.1% 54.1% 53.9% 54.4%
Loan to deposit ratio (end of period) 168.3% 160.7% 138.0% 124.5%

Aggregate report on the Greek Comprehensive Assessment, October 2015
25
As discussed in the previous chapter, the total projected change in CET1 from the
comprehensive assessment in the adverse scenario is €25.6 billion (including AQR
adjustments). Moreover, the RWA decreased by €31.9 billion in the adverse scenario to 2017
(as a result of deleveraging and provisioning, including also AQR adjustments), decreasing the
capital requirements. Offsetting this impact is the excess capital held by the participating banks.
Figure 13 Comprehensive assessment shortfall by main components
As shown above the total shortfall can be disaggregated into the main components of the
comprehensive assessment by identifying:
Shortfall from the AQR– this is the aggregate shortfall due to the AQR adjustments
applied to the June 2015 capital positions of the banks
Shortfall from the stress test – this is the aggregate shortfall (under the baseline and
adverse scenarios, measured against their respective thresholds) using the stress test
results, applied to the post AQR capital positions of the banks
3.44.4
14.4
0
2
4
6
8
10
12
14
16
Shortfall 9.5% post AQRbaseline (Jun-15)
Max. shortfall 9.5% over periodin ST baseline (incl. AQR)
Max. shortfall 8.0% over periodin ST adverse (incl. AQR)
Sh
ortf
all (
€b
illio
n)
+1.0
+10.0

Aggregate report on the Greek Comprehensive Assessment, October 2015
26
4 AQR OUTCOMES This chapter provides detail on the key results of the AQR and the AQR total impact for each
individual workblock and across the four Greek significant banks.
The AQR component of the comprehensive assessment involved performing a detailed asset-
level review of the in-scope portfolios, in line with current accounting and prudential regulation
set out in CRR / CRD IV capital rules. In some areas the ECB’s methodology involved
additional prudential prescription to accounting concepts in order to achieve consistency and
adequate conservatism. AQR adjustments should therefore not be interpreted as breaches to
accounting rules.
As described in Chapter 1 and 2 in this report, the comprehensive assessment of the Greek
banking system in 2015 was primarily a response to the market environment in Greece upon the
3rd MoU between Greece and the Institutions. The results are of a prudential nature, in order to
assess the banks’ ability to withstand the weak economic environment.
Additionally, it should be noted that, while the banks reflected an important part of the AQR
adjustments from the comprehensive assessment 2014 in their accounts, the worsening of the
market conditions meant that additional AQR findings were not unexpected, particularly given
the prudential nature of the exercise.
The detailed outcomes of the 2015 AQR on the Greek significant banks is presented in the
following sub-chapter.
4.1 TOTAL ADJUSTMENT AND CAPITAL IMPACT
The total adjustment to the carrying amount of loan portfolios and fair values of derivatives
(CVA) was €9,202 million. This is shown by participating bank in the chart below:

Aggregate report on the Greek Comprehensive Assessment, October 2015
27
Figure 14 Gross AQR adjustment by bank
Table 4 Breakdown of impact by AQR components
The following chapters provide further information on the drivers of AQR adjustments,
disaggregating the result into its three major components:
2,3001,746 1,906
2,337
3,213
3%
5%
4%
6%
4%
0%
1%
2%
3%
4%
5%
6%
0
500
1,000
1,500
2,000
2,500
3,000
3,500
4,000
4,500
Ave
rage
Alp
ha B
ank
Eur
oban
k
NB
G
Pira
eus
Ban
k
Total ad
justm
ent in%
of starting RW
AT
otal
ad
just
men
t (€
mil
lion
)
Total gross adjustment (€ million) Total gross adjustment in % of starting RWA
Average gross adjustment in % of starting RWA
Note: Gross adjustment excludes any offsetting tax and risk protection effects. Adjustments include both additional provisions and CVA adjustment
Bank name
Pre-AQR CET1
Credit File Review
Pro-jection of Findings
Collective Provi-sioning
CVA adjust-ments
Total AQR CET1 adjustments
Tax/Risk Protection adjust-ments1
Post AQR CET1 before adjustments to RWA, DTAs and IRB provisioning shortfall (Jun-15)
in €MM in €MM in €MM in €MM in €MM in €MM in €MM in €MM
Alpha Bank 6,792 -531 -290 -904 -22 -1,746 0 5,045
Eurobank 5,389 -403 -286 -1,187 -30 -1,906 0 3,483
NBG 7,412 -692 -334 -1,311 0 -2,337 0 5,075
Piraeus Bank 6,189 -1,091 -1,039 -1,002 -81 -3,213 0 2,976
Totals 25,781 -2,717 -1,949 -4,404 -133 -9,202 0 16,579
1. Offsetting impact is zero given no DTAs from AQR were allowed to be recognised

Aggregate report on the Greek Comprehensive Assessment, October 2015
28
1. Additional provisions resulting from the non-performing non-retail debtors from the
risk-based sample that were individually assessed and then projected to the rest of the
portfolio.
2. Additional provisions identified through the collective provisioning assessment of all
performing exposures and non-performing retail exposures.
3. Additional adjustments of CET1 capital through the CVA challenger model impact.
Figure 15 Impact of the AQR by component
Each component of the AQR had several drivers which are discussed in more detail in the
following chapters – first the individual specific provisioning assessment (credit file review,
collateral valuation and projection of findings) is discussed in Chapter 4.2, followed by the
collective provisioning assessment in Chapter 4.3 and the CVA challenger model adjustments in
Chapter 4.4.
As part of the credit file review the adjustment to provisions for non-performing debtors can be
assessed under two approaches: Gone concern which relies on a final sale value of collateral
exposures and going concern where operating cash flows are used to assess a prudent net
present value (NPV) of future cash flows. In the majority of cases the gone concern approach is
implemented given it is a more robust and prudent perspective. It is important to note that the
rationale for implementing these approaches is based on a means to measure a prudent
provisioning adjustment only and not a recommendation for bank strategy. Specifically, gone
Additional provisions Other adjustments
1. Addit ional DTAs (tax offsetting impact) as a result of additional AQR provisions have not been recognised. As a result, additional provisions identified through the AQR exercise have a direct impact on AQR-adjusted CET1 ratio
2,717
4,665
9,069
1,949
4,404
133
9,202
0
1,000
2,000
3,000
4,000
5,000
6,000
7,000
8,000
9,000
10,000
Individually assessedprovisions
Collective provisioning CVA AQR capital impact1
AQ
R a
djus
tmen
t/
capi
tal
impa
ct (
€m
illi
on)
Projection of findings
Individually assessed during credit file review

Aggregate report on the Greek Comprehensive Assessment, October 2015
29
concern represents a view that the prudent provision is based on the realisable collateral values,
but it may be that the bank shareholders continue to believe that better returns are available
through restructuring and subsequent sale of the business or curing of the loan. The percentage
of gone concern debtors should not be seen therefore as an estimate of the percentage of
companies or individuals to be liquidated – but the percentage of companies or individuals who
should be provisioned down to a level based on the available collateral.
Table 5 Summary of AQR adjustment by component
4.2 INDIVIDUALLY ASSESSED PROVISIONS
This chapter provides a detailed view on additional provisions identified for individually
assessed non-retail debtors from the credit file review, collateral valuation and projection of
findings workblocks. The credit file review assessed the chosen samples of non-retail debtors
mainly in terms of (a) performing classification status and (b) need for additional provisions
(Chapter 4.2.1 below), with findings being projected to the remaining unsampled debtors per
portfolio according to pre-defined criteria (Chapter 4.2.3). Residential Real Estate facilities were
assessed for their performing status only as an input to collective provisioning (Chapter 4.3).
AQR component Adjustment Section
Individually assessed provisions €4,665 million 4.2
Credit File Review €2,717 million 4.2.1
CFR - reclassified NPE (going concern) €232 million
CFR - reclassified NPE (gone concern) €770 million
CFR - existing NPE treated under gone concern €1,585 million
CFR - existing NPE treated under going concern €130 million
Projection of Findings €1,949 million 4.2.2
Collectively assessed provisions €4,404 million 4.3
Collective Provisioning - specific provisions €3,516 million
Collective Provisioning - IBNR €888 million
CVA €133 million 4.4
CVA Challenger model €133 million
Total AQR adjustment €9,202 million
Note: Numbers may not fully reconcile due to rounding

Aggregate report on the Greek Comprehensive Assessment, October 2015
30
4.2.1 CREDIT FILE REVIEW
Following the review of all 2,528 sampled non-retail debtors across the Greek significant
institutions, the overall impact of the credit file review was an increase in provisions in the
sample of €2,717 million from €7,513 million to €10,229 million. Given that provisions relate
to NPE (existing or reclassified), all provisioning adjustments under the credit file review were
specific.
This increase in provisions by asset class is shown below.
Figure 16 Summary of impact of provisions by asset class
Reclassified NPE
€1,003 million of additional provisions in the credit file review was due to the reclassification of
240 debtors in the sample representing 16% of total non-retail debtors that were originally
classified as performing. As shown in Figure 17, across the Greek system, the participating
banks average proportion of non-retail reclassified debtors ranged from 8% to 22% (in the
sample). For residential real estate (RRE), the proportion of reclassified debtors ranged between
2% and 43% (in the sample). Please note that the sample has been selected on a risk-based
approach, i.e. simple averages across the sample are shown for illustrative purposes only but do
not necessarily reflect projection effects. See the relevant sections in this chapter for details.
3,268 3,037
605 603
4,4544,110
930 738
5% 4%
13%
2%
0%
2%
4%
6%
8%
10%
12%
14%
16%
18%
20%
0
500
1,000
1,500
2,000
2,500
3,000
3,500
4,000
4,500
5,000
Large corporates Large SME Real estate related Shipping
Add
itional p
rovisions in
percent of cR
WA
Tot
al p
rovi
sion
s (€
mil
lion
)
Pre-AQR provisions
Post-AQR provisions
Total provisions adjustments in % starting cRWA

Aggregate report on the Greek Comprehensive Assessment, October 2015
31
Figure 17 Number of reclassified NPE by bank in the sample
The performing / nonperforming classification status of a debtor is assessed through a
comparison of objective performance criteria as defined in the AQR manual. These criteria
define whether a debtor is impaired and its subsequent performing / non-performing
classification. A review of the impairment triggers hit for reclassified NPE shows that for non-
retail the most common triggers were debt service coverage ratio (70%) and forborne NPE
(55%). The importance of these two triggers reflects the Greek macroeconomic environment:
Deterioration in operating cash flows of debtors and subsequent need for forbearance measures.
16%
8%12%
22% 20%22%
43%
2%
22%
11%
0%
5%
10%
15%
20%
25%
30%
35%
40%
45%
50%
Average Alpha Bank Eurobank NBG Piraeus Bank
Rec
lass
ifie
d N
PE
s as
% o
f or
igin
ally
pe
rfor
min
g de
bto
rs r
evie
wed
Non-retail RRE

Aggregate report on the Greek Comprehensive Assessment, October 2015
32
Table 6 Distribution of impairment triggers for non-retail reclassified NPE
Within the non-retail reclassified debtors, 63% of the debtors were treated under the gone
concern approach and 37% were assessed as going concern. Additionally, for the RRE portfolio
further reclassifications were primarily due to forbearance triggers.
The total change in provisions that were found for reclassified debtors is shown below by AQR
asset segment:
Figure 18 Change in provisions by asset class for non-retail reclassified NPE (in the sample)
Trigger Times hit % of reclassified debtors
Debt Service Coverage Ratio 169 70.4%
Forborne NPE 132 55.0%
Change in EBITDA 59 24.6%
Connected Client impaired 38 15.8%
Change in equity 30 12.5%
Loan-to-Value 16 6.7%
Emergency funding 15 6.3%
Probability of Default 7 2.9%
Note: In a number of cases debtors will hit more than one trigger. The assessment whether a reclassification to NPE is required is based on aholistic view of all triggers that impact a debtor simultaneously
424 431
60 86
24%
34%36%
17%
0%
5%
10%
15%
20%
25%
30%
35%
40%
0
100
200
300
400
500
600
Large corporates Large SME Real estate related Shipping
Coverage ratio (%
)C
olla
tera
l val
ue
adju
stm
ents
(€
mil
lion)
Change in provisions in portfolio (in the sample) Coverage ratio (%)
Aggregate report on the Greek Comprehensive Assessment, October 2015
33
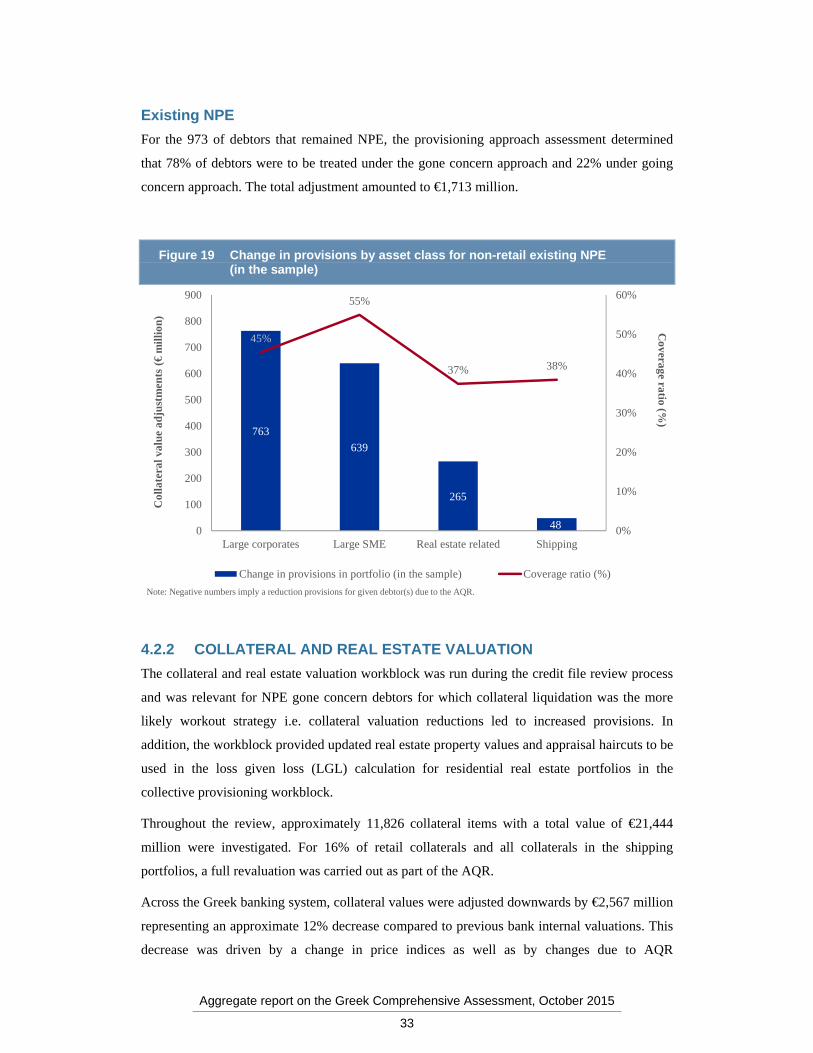
Existing NPE
For the 973 of debtors that remained NPE, the provisioning approach assessment determined
that 78% of debtors were to be treated under the gone concern approach and 22% under going
concern approach. The total adjustment amounted to €1,713 million.
Figure 19 Change in provisions by asset class for non-retail existing NPE (in the sample)
4.2.2 COLLATERAL AND REAL ESTATE VALUATION
The collateral and real estate valuation workblock was run during the credit file review process
and was relevant for NPE gone concern debtors for which collateral liquidation was the more
likely workout strategy i.e. collateral valuation reductions led to increased provisions. In
addition, the workblock provided updated real estate property values and appraisal haircuts to be
used in the loss given loss (LGL) calculation for residential real estate portfolios in the
collective provisioning workblock.
Throughout the review, approximately 11,826 collateral items with a total value of €21,444
million were investigated. For 16% of retail collaterals and all collaterals in the shipping
portfolios, a full revaluation was carried out as part of the AQR.
Across the Greek banking system, collateral values were adjusted downwards by €2,567 million
representing an approximate 12% decrease compared to previous bank internal valuations. This
decrease was driven by a change in price indices as well as by changes due to AQR
Note: Negative numbers imply a reduction provisions for given debtor(s) due to the AQR.
763
639
265
48
45%
55%
37% 38%
0%
10%
20%
30%
40%
50%
60%
0
100
200
300
400
500
600
700
800
900
Large corporates Large SME Real estate related Shipping
Coverage ratio (%
)C
olla
tera
l val
ue a
dju
stm
ents
(€
mil
lion)
Change in provisions in portfolio (in the sample) Coverage ratio (%)

Aggregate report on the Greek Comprehensive Assessment, October 2015
34
revaluations. Figure 20 illustrates the impact of both effects on the aggregated collateral value.
For collateral items that required a reappraisal, the total adjustment can be split into a change in
property value due to indexation and an incremental change as a result of the revaluation.
Figure 20 Collateral valuation adjustments throughout the AQR
The collateral value reduction most severely affected commercial real estate (CRE) in absolute
terms while land and residential real estate in relative terms.
21,444
20,568
18,877
17,500
18,000
18,500
19,000
19,500
20,000
20,500
21,000
21,500
22,000
Aggregate collateral valuepre-AQR
Aggregate collateral valueindexed
to 30 June 2015
Aggregate collateral valuepost-AQR following
revaluations
Col
late
ral v
alu
e (€
mil
lion)
-4%
-8%

Aggregate report on the Greek Comprehensive Assessment, October 2015
35
Figure 21 Collateral value reduction for selected collateral types
4.2.3 PROJECTION OF FINDINGS
The findings of the sample from the credit file review were extrapolated to the unsampled
population of each portfolio, which led to additional €1,949 million of provisions. Findings
were extrapolated both on NPE classification and required provisions. The effect of projection
to the provisioning adjustments made during the credit file review can be seen below.
654
364 356291
125
8%
29%
22%
9% 8%
0%
5%
10%
15%
20%
25%
30%
35%
0
100
200
300
400
500
600
700
CRE Land RRE Shipping Other RE
Collateral valu
e adju
stmen
ts (%)
Col
late
ral v
alue
ad
just
men
ts (
€m
illi
on)
Collateral value adjustments (€ million) Collateral value adjustments (%)
Note: Positive numbers imply a collateral value reduction. Numbers in this chart do not include ‘other collateral’ outside of ‘other RE’

Aggregate report on the Greek Comprehensive Assessment, October 2015
36
Figure 22 Impact of projection of findings on non-retail provisioning
The amount of additional provisions from the credit file review of the sample compared to the
projection of the sample varied widely by portfolio for two main reasons:
Sample coverage variation – portfolios with a large number of debtors naturally had a
lower coverage rate (e.g. Large SME portfolios), and hence a proportionally larger
exposure on which to project
Different levels of prudence in existing provisions – certain portfolio types were
found in general to be less prudently provisioned against than others (see credit file
review for details on the fundamental drivers)
The relative increase of additional provisions due to projection of findings vs. credit file review
(sample) was relatively stable when compared with the 2014 CA (€2.1 billion on the sample and
€1.8 billion projected over the remaining portfolio in the 2014 CA vs. €2.7 billion and €1.95
billion respectively as per Figure 22 above).
The following shows the absolute contribution from the sample and projection by type:
7,513
2,717
1,949
12,178
0
2,000
4,000
6,000
8,000
10,000
12,000
14,000
Total provisions pre-AQR
Additional provisionsCFR
Projected additionalprovisions CFR
Total provisions post-AQR
Pro
visi
ons
(€m
illio
n)

Aggregate report on the Greek Comprehensive Assessment, October 2015
37
Table 7 Illustration of provisioning impact of the projection of findings split by portfolio type
NPE classification adjustments
The incidences of change in performance status found during the credit file review were also
projected for both non-retail and RRE portfolios.
Overall, projection of findings identified an extra €3,146 million of NPE non-retail exposure
compared to that originally reported by the banks. On top of €3,823 million from the credit file
review, this totals €6,969 million. This was factored into the collective provisioning calculations
as explained in further detail in the next chapter.
Ratios of NPE EAD increases following CFR increased consistently across portfolios (ranging
from 3-7%), as shown in the following figure. Largest increases came from Shipping (7%) and
Large Corporates (6%).
Asset segment
Sampling exposure coverage rate (% )
Additional provisions CFR (€ million)
Projected additional provisions CFR (€ million)
Total additional provisions (€ million)
Large SME 20-40% 1,072 1,472 2,544
Real estate related 70-90% 326 122 448
Large corporates 70-90% 1,186 340 1,526
Shipping 70-100% 132 15 148
Total 2,717 1,949 4,665
Note: Sampling exposurecoverage rate is applied to the total exposure ofall four banks

Aggregate report on the Greek Comprehensive Assessment, October 2015
38
Figure 23 NPE ratios pre and post-CFR
4.3 COLLECTIVELY ASSESSED PROVISIONS
The collective provisioning workblock involved a review of participating banks' collective
provisioning models, both qualitatively and quantitatively. This review applied to non-
performing retail exposures (for which specific provisions are calculated) as well as to all
performing exposures (for which incurred but not reported losses, IBNR, is calculated). In total,
26 portfolios across most AQR asset classes were in-scope for this workblock.
As part of the qualitative review, external auditors assessed the compliance of collective
provisioning models employed by participating banks with relevant accounting standards.
For the purpose of the quantitative review, external auditors developed a "challenger model"
which was applied to all portfolios in-scope for this workblock. For each portfolio, the outcome
of the challenger model was compared to the provisions recognised by the bank. For 27% of the
in-scope portfolios, the challenger model resulted in provisions below participating banks'
provisions, whereas for 73% of the portfolios, the challenger model outcome exceeded the
significant banks' provisions. Where the challenger model outcome significantly exceeded8 the
bank's provisions, further investigation was required and in many cases this resulted in
additional collective provisions to be recognised for the purpose of the AQR.
8 If the bank team's estimate was 5-10% higher than the bank's estimate, the bank team investigated reasons across
data or methodology to explain the differences and applied discretion in selecting challenger model estimate vs. bank’s estimate
70%
35%
61%
33%
22%
5%
6%
5%
3%
7%
0%
10%
20%
30%
40%
50%
60%
70%
80%
Real estate related Large corporates(non real estate)
Large SME (nonreal estate)
Residential realestate (RRE)
Shipping
Rat
io o
f N
PE
EAD
to
tota
l EA
D
by p
ortf
olio
pre
and
pos
t-A
QR
, %
NPE EAD pre-AQR Additional NPE as a result of the AQR

Aggregate report on the Greek Comprehensive Assessment, October 2015
39
Across all participating banks and portfolios, the collective provisioning workblock identified
the need for additional collective provisions of €4,404 million, €3,516 million of which
represent additional specific provisions for retail debtors and €888 million of which represent
additional IBNR. In relative terms, across the participating banks, this translates into an increase
in IBNR of roughly 47% and an increase in specific provisions of about 18%. The main drivers
of the increases due to cases of significant deviation are explained later in this chapter.
Figure 24 Additional collectively assessed provisions by type of provision
Retail NPE: Additional specific provisions resulting from collective assessment
Specific provisions account for a significant part of participating banks' collectively assessed
provisions. Across the Greek system, six retail portfolios held by the four participating banks
were found to have insufficient levels of specific provisions. In total this led to an increase in
specific provisions of €3,516 million. A significant majority of these additional provisions
stemmed from residential real estate portfolios (88%) followed by retail SME (7%) and other
retail (5%). This pattern still largely holds when taking into account the relative size of the asset
classes (as measured by credit RWA) – the most significant relative adjustment was made to
residential real estate portfolios with an adjustment of about 10.6% of credit RWA. Figure 25
illustrates aggregated additional specific provisions, both in absolute terms and relative to credit
RWA for retail asset classes.
1,892888
2,7790
5,000
10,000
15,000
20,000
Pre-AQRIBNR
AdditionalIBNR
Post-AQRIBNR
IBNR
19,169
3,516
22,685
0
5,000
10,000
15,000
20,000
Pre-AQRspecific
provisions
Additionalspecific
provisions
Post-AQRspecific
provisions
Pro
visi
ons
(€m
illi
on)
Specific provisions
47%
18%

Aggregate report on the Greek Comprehensive Assessment, October 2015
40
Figure 25 Additional specific retail provisions by asset class
The challenger model provisions on non-performing exposures and, hence, additional specific
provisions revealed by this workblock are significantly impacted by a number of key drivers.
NPE identification: As outlined in Chapter 4.2.1, the stock of NPE was significantly
increased by the AQR, through the credit file review. Also, cure rates were adjusted
based on CFR findings. As a result, the basis for the calculation of specific provisions
on residential real estate increased, ultimately leading to an increase in specific
challenger model provisions and, in many cases, to additional specific provisions to be
recognised for the purpose of the AQR. As a result, the cure rate on the defaulted
population was adjusted down due to NPE reclassification.
Adjustment of RRE collateral: For residential real estate portfolios, property values
are an essential part of the loss given loss calculation, as the expected loss is calculated
using projected proceeds from a foreclosure of the underlying property. As part of the
collateral valuation workblock, properties were reappraised and indexed forward in
order to adjust the collective provisioning LGL directly. For properties that were not
reappraised, the average appraisal discount of the portfolio was applied. In addition,
expected proceeds from collateral were calculated based on assumptions representative
of the current conditions. Two key parameters used in the LGL calculation, sales ratio
and time to sale were harmonised across the banks in order to reflect current conditions
and to prudently account for obsolete / biased data. Specifically, these required the use
of the fall back value for the sales ratio of 75% - implying a haircut on collateral values
of 25%
3,087
250 179
11%
3%
2%
0%
2%
4%
6%
8%
10%
12%
0
500
1,000
1,500
2,000
2,500
3,000
3,500
4,000
Residential real estate Retail SME Other retail
Ad
dition
al specific
provisions as % of cR
WA
Add
itio
nal s
peci
fic
prov
isio
ns (
€m
illio
n)
Additional specific provisions Additional specific provisions as % of cRWA

Aggregate report on the Greek Comprehensive Assessment, October 2015
41
Parameters that are not point-in-time: In a number of cases, the banks’ models were
smoothing the impact of recent events, for example, through the use of long term
parameters. Due to its point-in-time nature, the challenger model reflects the current
conditions.
All performing exposures: Additional IBNR resulting from collective provisioning
This chapter provides more detail on the €888 million of additional IBNR identified as a result
of the AQR as well as the most significant factors driving this result.
Across the Greek system, for 19 portfolios held by the four participating banks the challenger
model revealed insufficient levels of IBNR, which led to an aggregated increase in IBNR of
€888 million9. The majority of the additional IBNR stems from large SME (42%) and large
corporate (26%) portfolios. Taking into account the size of each asset class (determined by
credit RWA), however, the most significant adjustment was made to large SME (144 basis
points), large corporates (91 basis points) and shipping (80 basis points) portfolios. Figure 26
illustrates the aggregated additional IBNR, both in absolute terms and relative to credit RWA
for AQR asset classes.
9 The IBNR increase is attributable to 16 of these 19 portfolios. For the remaining 3 portfolios, the insufficient
levels of IBNR were absorbed by a surplus identified in specific provisions for these portfolios

Aggregate report on the Greek Comprehensive Assessment, October 2015
42
Figure 26 Additional IBNR by AQR asset class
The challenger model provisions on performing exposures and, hence, additional IBNR
revealed by this workblock is significantly impacted by a number of key drivers.
Credit file review: For all sampled debtors / facilities a classification review was
conducted during the credit file review. This review had an impact on the parameters
for both retail and non-retail portfolios.
- Where debtors / facilities were stated to be performing in the bank’s loan tape were
found to have defaulted in the credit file review, this increased the probability of
impairment applied in the challenger model and additional NPE were projected;
also cure rates were adjusted for retail portfolios.
- An increase in the loss given impairment (LGI) was applied to reflect increased
provisioning levels for debtors that had LGI is calculated as the coverage ratio of
the defaulted asset applied in the challenger model
Both of these effects led to an increase in the IBNR determined by this workblock.
Probabilities of impairment (PI) that are not point-in-time: As for retail cure rates,
in a number of cases the banks' models use long term parameters whereas the challenger
model is fully point-in-time. Where banks exhibited a large number of defaults in the
period examined, this led to higher probabilities of impairment and, ultimately, in an
increase in IBNR.
Loss emergence period (LEP): In the majority of cases the LEP employed in the
challenger model exceeds the one applied by participating banks. This is partly driven
365
232
21 20
182
57
1.4%
0.9%
0.3%0.2%
0.6%
0.8%
0.0%
0.2%
0.4%
0.6%
0.8%
1.0%
1.2%
1.4%
0
100
200
300
400
500
600
Large SME Largecorporates
Retail SME Other retail Residentialreal estate
Shipping
Ad
ditional IB
NR
as % of cR
WA
Add
itio
nal I
BN
R (
€m
illio
n)
Additional IBNR Additional IBNR as % of cRWA

Aggregate report on the Greek Comprehensive Assessment, October 2015
43
by the prudential nature of the exercise and partly by the fact that in many cases an
analysis of the bank's LEP revealed a high volatility of observed LEPs as well as loss
events, i.e. the beginning of the LEP, not being identified correctly. As raising the LEP
has a one-to-one impact on IBNR, this was an important driver of the additional IBNR
resulting from this workblock.
Adjustment of RRE collateral values: The reduction in residential real estate property
values due to forward indexing, sales ratio and time to sale raised LGL and led to an
increase in IBNR.
Provisioning of non-zero provisioning of selected subportfolios: In some cases,
banks had excluded certain exposures that they considered of high-quality from the
calculation of IBNR by setting the corresponding LGL to zero. Inclusion of such
exposures in the challenger model with appropriate non-zero LGLs led to challenger
model provisions in excess of banks' provisions and, hence, to additional IBNR.
4.4 CVA CHALLENGER MODEL ADJUSTMENTS
The four participating banks in the AQR were included in the CVA challenger model review
(one model per bank was reviewed), given the size of their derivative exposures (fair value:
€2.725 million), 65% of which relates to sovereign counterparties. The process included a
template, which identified potential issues in the calculation methodology, parameters and
portfolio coverage.
The AQR impact from the CVA challenger model was €133 million, corresponding to a 32%
increase of an initial CVA amount of €412 million. A majority of this adjustment related to the
use of inappropriate PD and LGD parameters specifically for the Greek Sovereign, where banks
used lower LGD assumption and PDs that were not market implied. Additional adjustments
occurred due to exposures excluded by the banks from their CVA calculation.
The distribution of CVA adjustments across entity groups is shown in Figure 27.

Aggregate report on the Greek Comprehensive Assessment, October 2015
44
Figure 27 AQR impact of the CVA review grouped by RWA of participating banks
87
165
64
22
30
81
26%18%
0%
126%
0%
20%
40%
60%
80%
100%
120%
140%
0
50
100
150
200
250
Alpha Bank Eurobank NBG Piraeus Bank
Relative adju
stmen
t in %
of initial CV
AC
VA
(€
mil
lion)
Original bank CVA AQR adjustment AQR adjustment in % of original bank CVA
Note: No CVA adjustment impact for NBG
96

Aggregate report on the Greek Comprehensive Assessment, October 2015
45
5 STRESS TEST This chapter discusses the methodology, underlying scenarios and outcomes of the stress test.
The stress test results are analysed in detail, mainly structured around the key drivers that
impacted the outcome.
5.1 METHODOLOGY OF THE STRESS TEST
This chapter captures the methodology for the 2015 stress test of Greek banks. The chapter lays
out the high level structure of the modelling approach and then drills down into all of the key
components. The drill downs cover the detailed approach; the key assumptions and their source.
5.1.1 CONTEXT
The 2015 stress test of Greek banks follows a centrally led top-down approach based on banks’
data and considers baseline and adverse scenarios spanning from 30 June 2015 to 31 December
2017 for a total of 2.5 years. The stress test methodology combined system-level and bank-level
parameters to project balance sheet, profit and loss, and solvency position in annual increments
(6 months for 2015). The stress test involved a constrained dynamic balance sheet approach –
that is to say the balance sheet evolves allowing for new lending, deposit evolution, asset sales
included in the DG Competition restructuring plans etc. Constraints were set by the ECB,
consistent with the assumptions underlying the wider Greek programme. The constraints were
differentiated between the baseline and adverse scenario.
The projections used to set the capital need were produced in a way that is consistent with the
prevailing accounting and prudential rules. This means that provisions were projected in a way
consistent with IAS 39; RWA projections reflected the standardised or IRB approach –
whichever was used by the bank; capital projections were consistent with CRD IV, including
phase in rules; and other financial projections were consistent with prevailing accounting rules.
5.1.2 KEY HIGH LEVEL ASSUMPTIONS
The key high level assumptions for the exercise were defined as follows:
Macroeconomic series for Greece and other relevant countries were set by the ECB and
are included in Chapter 5.2
The CRD IV CET1 capital definition has been used with phase-in rules. The
minimum capital hurdles for the baseline and adverse scenarios are 9.5% and
8%, respectively

Aggregate report on the Greek Comprehensive Assessment, October 2015
46
Loan volume projections were defined at a system level by the ECB down to a bank-
level using fixed market shares as per June 2015
Bank level deposits were projected based on system level projections set by the ECB
and allocated to banks based on fixed market shares as per June 2015
The eligibility of relevant collateral for Monetary Policy Operations (MPO) was
assumed to be restored from 31 December, 2015. Use of MPO was limited to the
amount of available collateral
Sovereign debt holdings were assumed to remain flat over the stress test horizon; T-Bill
holdings assumed to roll over at current levels
The valuation of participations was adjusted in line with the Greek market index
(excluding Greek banks)
Foreign subsidiaries were assumed to be disposed of in line with the existing
restructuring plans at a valuation consistent with current market multiples. If a foreign
subsidiary was held throughout the period of the projection, its net income was stressed
accordingly
DTAs: No new DTA formation was allowed in either stress test scenario
5.1.3 HIGH LEVEL MODELLING APPROACH
The high level modelling approach was as per the diagram below

Aggregate report on the Greek Comprehensive Assessment, October 2015
47
Figure 28 Illustrative modelling approach – P&L and Balance Sheet projections
A projection of the P&L and balance sheet was produced based on the domestic business of the
Greek banks. The projection is consistent with the assumptions described above. A projection of
the marginal impact on the capital position of the foreign subsidiaries was also included,
reflecting current agreed restructuring plan commitments. The CET1 ratio projection considered
the roll forward of capital at the Group level in a mechanical manner, fully reflecting CRD IV
phase in and other assumptions defined by the ECB. Detailed “drill down” analysis was
performed on Net Interest Income, Other Operating Income and Expenses, RWA and
provisions. The drill down analysis fed the P&L and balance sheet projection.
In the following sub-chapters, detail is provided on the approach to projecting NII, volumes,
credit losses and RWA for the Greek portfolios.
5.1.4 NET INTEREST INCOME AND ASSET AND LIABILITY VOLUME PROJECTIONS10
The high level approach to projecting Net interest income involved the following steps:
1. Project loans and deposits based on system level loan and deposit assumptions (as
described previously). 10 This approach only applies to the Greek-legal entities
P&L + Balance Sheet projection
H1 2015 H2 2015 2016 2017
CET 1% XX XX XX XX
RWA XX XX XX XX
Balance Sheet
Assets XX XX XX XX
Liabilities XX XX XX XX
Equity XX XX XX XX
P&L
Income XX XX XX XX
Expenses XX XX XX XX
Retained earnings XX XX XX XX
RWA projection module
Credit loss module
Net interest income and volumes module
Other income and expenses module
2016 2017
CET1 %
P&L and balance sheet projection

Aggregate report on the Greek Comprehensive Assessment, October 2015
48
2. Split lending into front book and back book and performing and non-performing
projections (NPE rates coming from the credit loss module).
3. Project the composition of the remainder of the liability side (wholesale and Eurosystem
funding).
4. Project Net Interest Income by multiplying rates by volumes.
5. Calculate an adjustment for movements in income due to the structural interest rate risk-
position.
5.1.4.1 Project the total loans and deposits
The first step was to project total loans and deposits by segment for each bank. Total loans for
the system were projected by the ECB in consultation with the Institutions, having taken bank
plans as an input. The projections were differentiated by segment as appropriate. Each relevant
sub-segment of the bank’s portfolio was then projected by assuming market share and sub-
segment mix to remain constant as per June 2015.
5.1.4.2 Split the lending book into front and back book and performing and non-performing
Next, the migration rates to NPE from the credit loss module (described in Sub-chapter 5.1.5)
were used to project the percentage of the portfolio that was back book and NPE. The total
exposure was also reduced in line with recent observed amortisation and prepayment.
The gap between the projected total exposure and the projected back book net of amortisation
and prepayment was filled with new lending. New lending was assumed to be “Normal Risk”
according to the AQR definition (as stated in the AQR Manual). NPE migration and
amortisation and prepayment for new lending were projected in line with what was observed for
Normal Risk customers on the back book.
A percentage of NPE was moved to write-off, so that in the baseline, income from non-
performing exposures was not overestimated.

Aggregate report on the Greek Comprehensive Assessment, October 2015
49
This is illustrated in the chart below:
Figure 29 Front vs. Back Book & PE vs. NPE
5.1.4.3 Project the composition of the remainder of the liability side
The balance sheet was closed by assuming the gap between total assets and total deposits and
equity was filled with a mixture of Eurosystem and wholesale funding. Eurosystem funding was
split into MPO and emergency liquidity assistance (ELA) with associated differences in pricing.
Note that in the baseline scenario, there is no use of ELA in 2017.
5.1.4.4 Project average spreads on the performing and non-performing assets and the liabilities
Spreads were set for each type of asset as follows:
Table 8 Spreads for performing and non-performing assets and liabilities
Type of asset Spread assumption
Performing
Credit
exposure
Back book: Spreads remain unchanged from current contractual rates.
Front book: The lower of bank plans and the observed recent front book spreads
NPE Baseline: Interest income only assumed on portion of exposure that is unprovisioned
Adverse: Interest income only assumed on portion of exposure that is unprovisioned
for exposures with limited arrears (0-6 months). Exception to this is for retail
2015Jun-15 2016 2017 2015Jun-15 2016 2017
Retail mortgages Large SMEs
Total lending
Write-offs
New book
Back book
Total lending
Write-offs
Back book
New bookPerforming
Non-performing(NPE)
NPE
Performing
Performing
Non-performing(NPE)
NPE
Performing

Aggregate report on the Greek Comprehensive Assessment, October 2015
50
Type of asset Spread assumption
mortgages (where moderate discount unwind is included on exposures with greater
than 6 months in arrears)
Deposits Back book: Spreads remain unchanged
Front book: The lower of bank plans and the recent observed front book spreads
Wholesale Back book: Unchanged.
Front book: Spread set by the ECB for each type of wholesale funding.
MPO In line with ECB policy.
5.1.4.5 Calculate an adjustment for movements in income due to the structural interest rate risk position
A shift to the yield curve was defined in the scenario. Therefore it was necessary to include the
impact of the shift in the yield curve on the interest income of each bank.
The banks were asked to provide projections of the behavioural and contractual interest rate
maturity profile for their balance sheet. The net interest income was then adjusted in each period
of the baseline and adverse scenario for the impact of the shift in the yield curve on assets and
liabilities that repriced during the scenario horizon. Foreign exchange (FX) balance sheet
mismatches were also considered and an adjustment made accordingly.
The shift in the yield curve is assumed to be instantaneous and permanent over the horizon of
the exercise. Therefore, there is no impact on structural interest rate risk from new lending.
5.1.5 APPROACH TO PROJECTING FEES AND COMMISSIONS, OTHER INCOME AND EXPENSES FOR GREEK LEGAL ENTITIES
Fees and commissions, other income and administrative expenses were projected using recent
historic experience as the starting point. The starting point was projected forward, adjusting
levels based on relevant drivers that have a direct influence on the level of fees and
commissions, other income and expenses. For instance, expenses are clearly driven by full-time
equivalent (FTE) staffing numbers. Drivers were defined in the restructuring plan (e.g.
branches) or were calculated directly in the model elsewhere (e.g. new lending volumes). The
sensitivity of fees and commissions, other income and expenses to the drivers was set based on
expert judgment informed by historical experience of the banks and the banks’ plans.
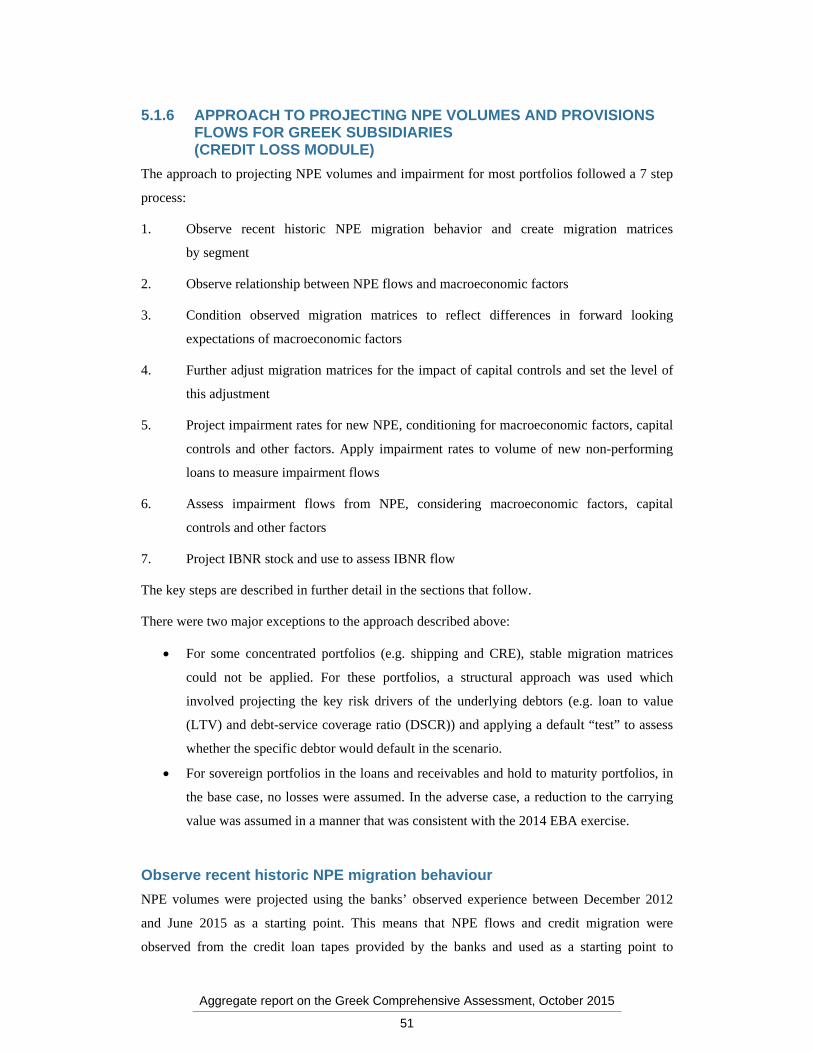
Aggregate report on the Greek Comprehensive Assessment, October 2015
51
5.1.6 APPROACH TO PROJECTING NPE VOLUMES AND PROVISIONS FLOWS FOR GREEK SUBSIDIARIES (CREDIT LOSS MODULE)
The approach to projecting NPE volumes and impairment for most portfolios followed a 7 step
process:
1. Observe recent historic NPE migration behavior and create migration matrices
by segment
2. Observe relationship between NPE flows and macroeconomic factors
3. Condition observed migration matrices to reflect differences in forward looking
expectations of macroeconomic factors
4. Further adjust migration matrices for the impact of capital controls and set the level of
this adjustment
5. Project impairment rates for new NPE, conditioning for macroeconomic factors, capital
controls and other factors. Apply impairment rates to volume of new non-performing
loans to measure impairment flows
6. Assess impairment flows from NPE, considering macroeconomic factors, capital
controls and other factors
7. Project IBNR stock and use to assess IBNR flow
The key steps are described in further detail in the sections that follow.
There were two major exceptions to the approach described above:
For some concentrated portfolios (e.g. shipping and CRE), stable migration matrices
could not be applied. For these portfolios, a structural approach was used which
involved projecting the key risk drivers of the underlying debtors (e.g. loan to value
(LTV) and debt-service coverage ratio (DSCR)) and applying a default “test” to assess
whether the specific debtor would default in the scenario.
For sovereign portfolios in the loans and receivables and hold to maturity portfolios, in
the base case, no losses were assumed. In the adverse case, a reduction to the carrying
value was assumed in a manner that was consistent with the 2014 EBA exercise.
Observe recent historic NPE migration behaviour
NPE volumes were projected using the banks’ observed experience between December 2012
and June 2015 as a starting point. This means that NPE flows and credit migration were
observed from the credit loan tapes provided by the banks and used as a starting point to

Aggregate report on the Greek Comprehensive Assessment, October 2015
52
calibrate the projection. The analysis involved measuring the migration behaviour of each
exposure and using it to assess the probability of an exposure migrating in the future. The
analysis was differentiated by segment – i.e. migration rates were analysed separately for retail
mortgages, corporate SME etc. Where appropriate, further segmentation was applied (e.g.
differentiating retail mortgages by LTV).
The output was a set of migration matrices that aligned with the risk classifications for the
AQR. This allowed for a pragmatic analysis (i.e. the granularity was not excessive). An
illustration of the output is shown below.
Figure 30 Illustrative NPE migration matrix
December 2013
December 2012 1 2 3 4 5 6 7 8 9
1 Very low risk (excluded from AQR) 90% 8% 1% 1%2 Normal risk 90% 7% 2% 1%3 Normal risk (previously cured) 70% 19% 10% 1%4 High risk 10% 60% 25% 5%5 High risk (previously cured) 5% 50% 40% 5%6 NPE (less than 6 months arrears 5% 45% 40% 10%7 NPE (6-12 months arrears) 2% 3% 4% 6% 15% 60% 10%8 NPE (12-24 months arrears 3% 2% 4% 6% 15% 70%9 NPE (24+ months arrears) 5% 10% 15% 70%
December 2014
December 2013 1 2 3 4 5 6 7 8 9
1 Very low risk (excluded from AQR)2 Normal risk3 Normal risk (previously cured)4 High risk5 High risk (previously cured)6 NPE (less than 6 months arrears7 NPE (6-12 months arrears)8 NPE (12-24 months arrears9 NPE (24+ months arrears)
December 2015
December 2014 1 2 3 4 5 6 7 8 9
1 Very low risk (excluded from AQR)2 Normal risk3 Normal risk (previously cured)4 High risk5 High risk (previously cured)6 NPE (less than 6 months arrears7 NPE (6-12 months arrears)8 NPE (12-24 months arrears9 NPE (24+ months arrears)

Aggregate report on the Greek Comprehensive Assessment, October 2015
53
Observe relationship between NPE flows and macroeconomic factors
A regression of macroeconomic data against long term historical default metrics was performed
to assess the sensitivity of NPE flows to macroeconomic factors. The resulting macroeconomic
model was used to adjust the migration matrices described above in line with the
macroeconomic scenario defined by the ECB.
The regression approach involved 5 steps:
1. Transforming the default rate metric into a “credit quality indicator” by taking the
normal inverse of the default rate
2. Performing a linear regression of macroeconomic factors against the credit quality
indicator
3. Comparing the models that are most predictive and exclude those which have
unintuitive relationships between the relevant macroeconomic factors and default rates
4. Comparing the resulting set of models based on expert knowledge and existing
benchmarks
5. Testing that the macroeconomic model results were consistent with the default rates
observed in the granular loan tape data between December 2012 and June 2015 and
adjust accordingly.
Condition observed migration behaviour to reflect differences in forward looking expectations of macroeconomic factors
The observed migration matrices between December 2012 and June 2015 were adjusted to
reflect the macroeconomic outlook with the objective to consider both portfolio improvement
effects and credit migration effects in a consistent manner.

Aggregate report on the Greek Comprehensive Assessment, October 2015
54
Adjustments were done based on the Merton model as illustrated in the diagram below:
Figure 31 Illustrative Merton model approach
Compare conditioned migration behaviour to latest information on impact of Capital controls to assess the need for a further adjustment to migration and set the overlay
A further overlay was applied to the migration matrices to reflect the one-off impact of
administrative measures (i.e. capital controls). This was calibrated based on four sources of
information: (1) credit related Management Information for July and August 2015 provided by
the banks; (2) the results of the credit file review conducted by bank teams as part of the AQR;
(3) the views of bank management on the impact and (4) the views of ECB experts.
Define impairment rates and apply to new NPE flows
Specific impairment flows were projected by multiplying the new NPE flows by the impairment
rate that would be expected following loss occurrence. This was based on AQR-adjusted
impairment rates (i.e. Loss Given Impairment (LGI’s) referred to in the AQR Manual), adjusted
for the macroeconomic scenario.
This is illustrated in the diagram below. Performing exposure by rating was multiplied by the
migration matrix and the resulting amount of exposure that transitions to default was multiplied
by the LGI to arrive at an impairment flow for the period.

Aggregate report on the Greek Comprehensive Assessment, October 2015
55
Figure 32 Illustrative impairment flow calculation
Assess impairment flows from existing NPE
The adjustments to LGI described in the previous chapter apply equally to NPE. As such in the
adverse case, LGIs on NPE were adjusted to reflect the macroeconomic outlook and impact of
administrative measures (i.e. capital controls). The impairment flow was then be defined as the
change in LGI multiplied by the gross exposure:
Impairment flow = (LGIscenario - LGI0) x gross NPE
Include impact of IBNR
IBNR stock was projected as PDPIT,t x PEt x LGIt. Any changes to the impairment stock
influenced the P&L and capital position accordingly. The calculation is illustrated in the
table below:
Table 9 IBNR stock calculation parameters
Jun-15 Dec-15 Dec-16 Dec-17
PE 100 90 80 75
NPE 10 15 17 20
PD PIT 2% 4% 3% 2%
LGI PIT 45% 50% 45% 40%
Performing exposure of portfolio by risk rating
(t-1)
Migration matrix
Performing exposure of portfolio by risk rating
(t)
New defaults (t)
LGI (t)Impairment
flow
x =
x =

Aggregate report on the Greek Comprehensive Assessment, October 2015
56
IBNR stock 0.9 1.8 1.08 0.6
IBNR flow 0.9 -0.72 -0.48
Adjust NPE stock for write-offs (in order to feed the interest income from NPE calculation)
As described above, income from NPE was calculated based on the NPE stock. Clearly, the
NPE stock reduced over time with write-offs. Therefore, it was important that the NPE stock
was reduced appropriately so that the income from non-performing exposures was reduced
appropriately.
5.1.7 APPROACH TO PROJECTING RWA FOR GREEK LEGAL ENTITIES (RWA MODULE)
Credit RWA was projected for all portfolios included in the AQR for the exercise reflecting key
dynamics:
RWA density (RWA / assets) was assumed to be constant as a percentage of net
exposure for PE and NPE for both IRB and standardised methodologies
EL parameters were updated and the IRB provisioning shortfall adjusted in line with
movements in provisions as described in the previous chapter
RWA for operational risk was projected so that it is proportional with the average of
gross income over the last 3 years
RWA for market risk was held constant
5.2 SCENARIOS
The following chapters provide details on the baseline and adverse scenarios underlying the
stress test in the Greek comprehensive assessment 2015, which were defined and / or agreed
under the third Financial Assistance Programme for Greece. Key macrofinancial variables for
the Greek economy as well as financial market shocks in Greece under the adverse scenario for
the years 2015 to 2017 that were used in the exercise are displayed in the tables below.
Table 10 Key macrofinancial variables for the Greek economy
Baseline scenario Adverse scenario Level
deviation

Aggregate report on the Greek Comprehensive Assessment, October 2015
57
2015 2016 2017 2015 2016 2017
from baseline (2017)
Real GDP annual growth -2.3 -1.3 2.7 -3.3 -3.9 0.3 -5.9
HICP inflation – annual rate (%) -0.4 1.5 0.9 -0.7 0.6 -1.0 -3.0
Unemployment rate (end-of-year, %) 26.9 27.1 25.7 27.3 28.1 27.5 1.8
House price growth (annual average, %) -7.5 -5.0 -1.0 -7.8 -8.8 -7.8 -10.9
Prime commercial property price growth (%) -3.4 -1.2 1.1 -3.6 -3.4 -2.1 -5.5
Note: Level deviation from baseline (2017) for unemployment rate (end-of-year,%) is given in percentage points, otherwise level deviation from baseline (2017) is given in percent relative to baseline.
Table 11 Financial market shocks in Greece under the adverse scenario
Average annual deviation from baseline level 2015 2016 2017
Short-term interest rate (3-month Euribor) 40 80 80
10-year Greek government bond yield 204 390 170
Greek stock prices (ASE Composite Index) -10.5 -20.1 -8.8
Note: Interest rate differentials are in basis points, stock prices are in percent
5.2.1 BASELINE SCENARIO
The baseline scenario is consistent with the assumptions of the third economic adjustment
programme for Greece. As such it is assumed to capture the expected impact of the recent
developments in Greece, in particular of the June-July 2015 bank holiday, the introduction of
the capital controls, and the fiscal measures introduced under the agreed programme.
5.2.2 ADVERSE SCENARIO
The adverse scenario is based on the premise that downside risks materialise in the external
environment of the Greek economy, as well as recent political and economic developments in
Greece triggering a shock to consumer and business confidence.
Specifically within the Greek economy, consumer and business confidence would sharply drop
in response to the imposition of deposit withdrawal and cross-border payment restrictions
(beyond expected impact already included in the baseline scenario), turbulent conclusion of the

Aggregate report on the Greek Comprehensive Assessment, October 2015
58
financial assistance programme, as well as to the increased political uncertainty. This would
manifest itself through a reduction in private consumption and fixed investment. It is however
assumed that, due to timely programme implementation, domestic aggregate demand would
stabilise, at the lower level, in the final year of the scenario horizon. Impaired confidence would
propagate to the property market, leading to a reduction in demand for residential and
commercial property, which would drive the property prices lower with respect to the baseline
scenario.
As for the external factors, the scenarios are based on assumptions such as an exogenous global
shock originated in the US, leading to deteriorating economic conditions in the rest of the world
through credit spread increases (on sovereigns, financial and non-financial firms), and a stock
price shock in developed economies, and capital outflows in emerging markets. EU countries
other than Greece are affected via trade and financial market spill overs.
The resulting impact on the Greek economy would be sizeable. By 2017, GDP would be lower
by 5.9% compared to the baseline projection and unemployment rate would stand at 1.8
percentage points above the baseline level.
5.3 AGGREGATE IMPACT BY RISK DRIVERS UNDER THE BASELINE AND ADVERSE SCENARIOS
The aggregate impact of the stress test in terms of percentage point changes between June 2015
(post AQR) and year-end 2017 in the average CET1 ratio of participating banks is a decrease of
0.3 percentage points under the baseline and a decrease of 7.8 percentage points under the
adverse scenario.
Overall, the impact on CET1 capital over the two and a half years stress test horizon amounts to
a decrease of €1 billion under the baseline and of €16 billion under the adverse scenario.
The aggregate impact of the stress test by risk driver under the baseline scenario is shown in
Figure 33. In the baseline, the four Greek banks’ average CET1 ratio is projected to decrease
from 7.9% in the second quarter of 2015 (post AQR), to 7.6% by the end of 2017. The solvency
position under the baseline decreases mainly due to the projected loan losses (the 4.8 percentage
point total impairments effect shown in the chart below) and other operating expenses (6.6
percentage point contribution to the change in the CET1 ratio). The average development of
participating banks’ solvency positions, however, masks variations across individual
institutions.

Aggregate report on the Greek Comprehensive Assessment, October 2015
59
Figure 33 Cumulative stress test impact on the CET1 % by risk driver under the baseline scenario
Under the adverse scenario, participating banks' average CET1 ratio is projected to decrease
from 7.9% in the second quarter of 2015 (post AQR), to 0.1% by the end of 2017. This
corresponds to a decline of the average CET1 ratio between H1 2015 (post AQR) and year-end
2017 of 7.8 percentage points (see Figure 34).
The key driver of the CET1 ratio impact is the increase in loan losses (8.4 percentage point
contribution). Furthermore pre-provision profits are also lower compared to the baseline,
primarily driven by NII (contribution to CET1 ratio is reduced from 9.6 percentage points under
base to 7.1 percentage points under adverse). The ‘Net Trading Income’ and 'Administrative and
other expenses' risk driver also impacts the overall results; however, they remain largely
unchanged between the baseline and adverse scenario. The mark to market of Sovereign
exposures in the available-for-sale (AFS) and fair value option (FVO) portfolios contributes to
the capital depletion, albeit the impact is less material than the impairment of held-to-maturity
Greek Sovereign exposures. Note – in the adverse case, an adjustment to carry values of Greek
sovereign loans and receivables and hold to maturity exposures is included consistent with a
writedown of 14% over 2.5 years.
-0.3%-0.9% 0.6% 0.2%
9.6%
1.7%
-2%
0%
2%
4%
6%
8%
10%
12%
Net interestincome
Non-interestincome
Operatingexpenses
Impairments Other P&LImpacts
Other CET1elements
RWAs Overallcumulative
impact on CET1ratio
Ave
rage
imp
act o
n C
ET
1 ra
tio
(%)
-4.8%
-6.6%
1
2
3
Bank-by-bank cumulative H2 2015-2017 impact on CET1% (%) by driver Alpha Bank 7.7% 2.1% -5.4% -4.1% -0.4% -0.4% 0.4% -0.1%NBG 12.4% 1.3% -8.3% -6.9% -1.7% 2.5% -0.1% -0.8%Eurobank 9.4% 2.1% -6.4% -4.3% -1.1% 0.2% 0.3% 0.2%Piraeus 8.3% 1.5% -6.1% -3.6% -0.4% -0.4% 0.3% -0.3%
1. Impairments include financial as well as non-financial impairments2. Other CET1 elements include the impact of capital actions as per existing commitments (restructuring plans)3. RWA impact is negligible because CET1 ratios are close to zero or even negativeNote: This chart shows cumulative results as of the end of the projection period

Aggregate report on the Greek Comprehensive Assessment, October 2015
60
Figure 34 Cumulative stress test impact on CET1% by risk driver under the adverse scenario
-7.8%
- 6.6%
-9.1%
-0.3% -0.4%
0.0%
7.1%
1.4%
-10%
-8%
-6%
-4%
-2%
0%
2%
4%
6%
8%
10%
12%
Net interestincome
Non-interestincome
Operatingexpenses
Impairments Other P&LImpacts
Other CET1elements
RWAs Overallcumulative
impact on CET1ratio
Ave
rage
imp
act o
n C
ET
1 ra
tio
(%
)
2
1
Bank-by-bank cumulative H2 2015-2017 impact on CET1% (%) by driver Alpha Bank 5.1% 2.0% -5.3% -8.3% 0.2% -1.4% 0.2% -7.5%NBG 10.9% 1.0% -8.2% -12.1% -0.9% 1.0% 0.0% -8.4%Eurobank 6.8% 1.8% -6.4% -8.5% -0.5% -0.7% 0.2% -7.3%Piraeus 5.0% 1.2% -6.1% -7.0% 0.0% -0.6% -0.3% -7.8%
1. Impairments include financial as well as non-financial impairments2. Other CET1 elements include the impact of capital actions as per existing commitments (restructuring plans)3. RWA impact is negligible because CET1 ratios are close to zero or even negativeNote: This chart shows cumulative results as of the end of the projection period
3

Aggregate report on the Greek Comprehensive Assessment, October 2015
61
6 APPENDICES
6.1 DETAILED RESULTS
Table 12 CET1 % for participating banks
Table 13 Buffer (+) / shortfalls (-) for participating banks (€ million)
Name Ban
k re
por
ted
H
1 20
15
AQ
R a
dj.
H
1 20
15
Pos
t C
A 2
015
Bas
elin
e
Pos
t C
A 2
016
Bas
elin
e
Pos
t C
A 2
017
Bas
elin
e
Pos
t C
A 2
015
Ad
vers
e
Pos
t C
A 2
016
Ad
vers
e
Pos
t C
A 2
017
Ad
vers
e
Alpha Bank 12.7% 9.6% 9.0% 9.3% 9.6% 5.1% 3.8% 2.1%
Eurobank 13.7% 8.6% 8.8% 9.1% 8.7% 5.7% 4.1% 1.3%
NBG 11.6% 8.1% 6.8% 7.6% 7.3% 2.6% 1.3% -0.2%
Piraeus Bank 10.8% 5.5% 5.6% 5.3% 5.2% 2.3% -0.1% -2.3%
System wide 12.1% 7.9% 7.4% 7.7% 7.6% 3.8% 2.1% 0.1%
Name Ban
k re
port
ed
H1
2015
AQ
R a
dj.
H1
2015
Pos
t C
A 2
015
Bas
elin
e
Pos
t C
A 2
016
Bas
elin
e
Pos
t C
A 2
017
Bas
elin
e
Pos
t C
A 2
015
Adv
erse
Pos
t C
A 2
016
Adv
erse
Pos
t C
A 2
017
Adv
erse
Alpha Bank 1,708 73 -263 -113 31 -1,408 -1,980 -2,743
Eurobank 1,663 -339 -253 -158 -270 -796 -1,279 -2,122
NBG 1,344 -831 -1,576 -1,069 -1,344 -2,932 -3,449 -4,602
Piraeus Bank 763 -2,188 -2,034 -2,133 -2,213 -2,853 -3,937 -4,933
Note: Columns highlighted in grey are worst case year

Aggregate report on the Greek Comprehensive Assessment, October 2015
62
Table 14 AQR adjustment by bank and asset class (€ million)
6.2 LIST OF ACRONYMS AND ABBREVIATIONS
Other acronyms and abbreviations used in this document:
Term Description
A
AQR Asset quality review
AFS Available-for-sale
B
bps Basis points
C
CA Comprehensive assessment
CET1 Common Equity Tier 1
CFR Credit file review
CIR Cost income ratio
CPMO Central Project Management Office
CRD Capital requirements directive
CRE Corporate real estate
CRR Capital requirements regulation
cRWA Credit Risk-Weighted Assets
CSA Credit support annex
CVA Credit valuation adjustment
D
DIV Data integrity validation
DSCR Debt-service coverage ratio
NameRetail SME
Residential real estate
Other retail Corporates CVATotal AQR adjustment
Alpha Bank 0 816 n/a1 908 22 1,746
Eurobank 271 700 200 705 30 1,906
NBG 0 966 0 1371 0 2,337
Piraeus Bank 0 787 0 2346 81 3,213
Total 271 3269 200 5330 133 9202
1: Alpha Bank’s other retail was not in scope

Aggregate report on the Greek Comprehensive Assessment, October 2015
63
Term Description
DTA Deferred tax asset
E
EAD Exposure at default
EBA European Banking Authority
ECB European Central Bank
EL Expected loss
ELA Emergency liquidity assistance
ESM European Stability Mechanism
ESRB European Systemic Risk Board
F
FAQ Frequently asked question
FTE Full-time equivalent
FVO Fair value option
FX Foreign exchange
G
GDP Gross domestic product
H
HICP Harmonised Index of Consumer Prices
I
IAS International Accounting Standards
IBNR Incurred but not reported
IFRS International Financial Reporting Standards
IRB Internal Ratings Based
ISA International Standards on Auditing
J
JST Joint Supervisory Team
L
LGD Loss given default
LGI Loss given impairment
LGI PIT Loss given impairment point in time
LGL Loss given loss
LTD Loan-to-deposit ratio
LTV Loan to value

Aggregate report on the Greek Comprehensive Assessment, October 2015
64
Term Description
M
MoU Memorandum of Understanding
MPO Monetary Policy Operations
N
NCA National competent authority
NII Net Interest Income
NIM Net Interest Margin
NPE Non-performing exposure
NPV Net present value
P
P&L Profit and loss statement
PD Probability of default – may refer to either the point-in-time or regulatory parameter
PD PIT Probability of default point in time
PE Performing
PI Probability of impairment
PP&A Processes, policies and accounting review
Q
QA Quality assurance
R
RRE Residential real estate
RWA Risk-weighted assets
S
SME Small and medium enterprise
SSM Single Supervisory Mechanism
ST Stress test
6.3 BIBLIOGRAPHY
Source Reference
AQR Phase 2 Manual http://www.ecb.europa.eu/pub/pdf/other/assetqualityreviewphase2manual201403en.pdf
ECB stress test manual http://www.ecb.europa.eu/pub/pdf/other/castmanual201408en.pdf
CRR / CRD IV http://ec.europa.eu/internal_market/bank/regcapital/legislation-in-force/index_en.htm

Aggregate report on the Greek Comprehensive Assessment, October 2015
65
6.4 DEFINITIONS AND EXPLANATIONS
Name Definition
Administrative expenses
Personnel (e.g. salaries and benefits), physical property, sales &
marketing, integration & restructuring, and other general administrative
expenses
Common Equity Tier 1
capital
CET1 capital according to CRD IV / CRR definition including
transitional arrangements
Common Equity Tier 1
ratio
CET1 ratio according to CRD IV / CRR definition including transitional
arrangements
Cost-income ratio (end of
period)
Cost-income ratio is equal to the sum of administrative expenses and
depreciation divided by the sum of net interest income, dividend income,
net fee and commission income, net trading income and other operating
income
Credit Risk Weighted
Assets
Credit RWA including off-balance sheet items (in accordance with CRD
IV / CRR)
Credit Valuation
Adjustment
An adjustment to the valuation of the portfolio of transactions with a
counterparty to reflect the market value of the credit risk of the
counterparty
Debt Service Coverage
Ratio
EBITDA / (Debt principal repayments + Net Interest expense)
Debtor Debtor is defined as an obligor within the meaning of CRR
Deferred tax assets
adjustments to Common
Equity Tier 1
The change to CET1 capital due to changing the amount of DTAs
deducted from CET1 through a) changing DTA volumes and b) changing
the threshold for exclusion from deduction
Dividend income Dividend income is equal to the total income earned through dividends
paid by participations
Expected loss The loss that is expected to be incurred in the next 12 months as a result of
lending to a debtor that may default.
Forbearance Concessions towards a debtor facing or about to face difficulties in
meeting its financial commitments consistent with Implementing
Regulation (EU) No 680 / 2014

Aggregate report on the Greek Comprehensive Assessment, October 2015
66
Loans and receivables Balance of loans and receivables at the end of the period. Refers to
balances net of provisions and on balance sheet
Loss emergence period The length of time between the specific “event of loss” for an exposure
(eg, a retail client losing their job, a corporate losing a large customer) and
the bank’s observation of loss.
Loss given impairment The level of impairment that can be expected at the point of impairment.
Term used for non-retail exposures in the context of the AQR collective
provisioning challenger model. See Chapter 7.8 of the AQR Phase 2
Manual for details
Loss given loss The level of loss (after discounted recoveries) that can be expected if the
facility does not cure. Term used for retail exposures in the context of the
AQR collective provisioning challenger model. See Chapter 7.7 of the
AQR Phase 2 Manual for details
Net fees & commissions Credit related, transaction & insurance related, and investment related
fees, for retail, SME and commercial, minus brokerage and insurance
deductions
Net interest income Net interest income is equal to total interest income minus total interest
expense
Net interest margin
(average over period,
annualised)
Net interest income (annualised if for half year) divided by the average
volume of Loans and Receivables over the time period
Net trading income Net trading income is equal to the total gains or losses made through
trading activities
Pre-provision profits Pre-tax income from the bank’s activities, measured before impairments
are taken
Probability of impairment Point in time probability of exposure being impaired within a 12 month
emergence period. Term used in the context of the AQR collective
provisioning challenger model. See Chapter 7.5 of the AQR Phase 2
Manual for details
Return on equity (based on
RWA * 9.5%) (average over
period, annualised)
Return on equity is equal to net income attributable to owners of the
parent net of estimated dividends excluding impairments on financial
assets and other income and expenses (annualised if for half year) divided
by 9.5% of the average volume of Risk-Weighted Assets over the time

Aggregate report on the Greek Comprehensive Assessment, October 2015
67
period
Shortfall A shortfall occurs if the bank‘s CET1% falls below the CET1% hurdle
rate at any point in the scenario. The capital shortfall is equal to the
difference between the bank‘s CET1 capital and the amount of CET1
capital required (CET1% hurdle rate * Risk-Weighted Assets). The year
where the maximum shortfall appears is used
Specific provisions /
Defaulted loans (end of
period)
The ratio of specific provisions over the non performing exposure (EAD),
figures include write-offs