loading dependence of the diffusion coefficient of …€¦ · loading dependence of the diffusion...
TRANSCRIPT

Loading Dependence of the Diffusion Coefficient of Methane in Nanoporous Materials
E. Beerdsen,*,† D. Dubbeldam,† and B. Smit†,‡
Department of Chemical Engineering, UniVersity of Amsterdam, Nieuwe Achtergracht 166,1018 WV Amsterdam, The Netherlands, and Centre Europe´en de Calcul Atomique et Mole´culaire (CECAM),Ecole Normale Supe´rieure 46, Allee d’Italie, 69007 Lyon, France
ReceiVed: June 30, 2006; In Final Form: August 28, 2006
In this work, we use molecular simulations to study the loading dependence of the self-and collective diffusioncoefficients of methane in various zeolite structures. To arrive at a microscopic interpretation of the loadingdependence, we interpret the diffusion behavior in terms of hopping rates over a free-energy barrier. Thesefree-energy barriers are computed directly from a molecular simulation. We show that these free-energyprofiles are a convenient starting point to explain a particular loading dependence of the diffusion coefficient.On the basis of these observations, we present a classification of zeolite structures for the diffusion of methaneas a function of loading: three-dimensional cagelike structures, one-dimensional channels, and intersectingchannels. Structures in each of these classes have their loading dependence of the free-energy profiles incommon. An important conclusion of this work is that diffusion in nanoporous materials can never be describedby one single effect so that we need to distinguish different loading regimes to describe the diffusion over theentire loading range.
I. Introduction
Membranes function because of differences in diffusion andadsorption of the molecules that are adsorbed in these materials.Many different materials are used as membranes. Lipid bilayersin cell membranes and molecular sieves such as zeolites inindustrial separation are just a few examples. These nanoporousmaterials contain pores that have sizes similar to the dimensionsof the adsorbed molecules and therefore impose a tight confine-ment. This makes the diffusion behavior of adsorbed moleculesin these materials very different from diffusion in a bulkfluid.1-10
Although these systems are well-studied, their diffusionproperties remain poorly understood. An intensive research effortto measure diffusion rates in nanoporous materials augmentedthe possibilities of determining diffusion rates in nanoporousmaterials, such as zeolites, metal-organic frameworks, ionchannels, etc. However, while it is often possible to determinethe diffusion as a function of adsorbate loading rather accurately,a proper understanding of diffusion behavior is still lacking.For a given structure, it is usually impossible to predict whetherthe diffusion will decrease, increase, or remain constant whenthe loading is increased.
Molecular dynamics simulations have often been used toobtain the diffusion coefficients.1,2,11-18 However, the resultsof a molecular dynamics, diffusion coefficients as a functionof loading or temperature, are equally difficult to rationalize atthe molecular level as the results of experiments, whereas animportant part of diffusion research is to relate the observedtrends in the diffusion coefficients to the behavior of themolecules at the molecular level. Some groups have usedtransition-state theory, to gain insight in the diffusion propertiesin zeolites.3,19-28 However, these studies were often limited to
the infinite dilution limit, whereas most experimental valueswere obtained at nonzero loading.29-31 Only recently, a dynami-cally corrected transition-state theory method (dcTST) has beendeveloped that can be applied to study diffusion in confinedsystems beyond the infinite dilution limit.32 This method canprovide a molecular explanation for diffusion behavior in termsof free energy.33,34 Armed with this method, we can now takea more generalized look on diffusion in confined systems.
In this paper, we combine molecular dynamics simulationswith calculations using the new dcTST method to gain insightin the diffusion of methane in twelve different types of zeolites.We calculate self and corrected diffusivities as a function ofloading and find an explanation by studying the free-energychanges as the loading is increased. Following the work ofSkoulidas and Sholl,1 who published MD results for fourdifferent zeolite structures, we analyze a representative set oftwelve zeolite structures for this study. We can divide the twelvezeolites in four different groups, that each have their owndiffusion behavior. We have chosen methane for this studybecause it simplifies the interpretation of free-energy profilesand the explanation of our results. But the method is by nomeans limited to methane. A similar study could be made forany other molecule.
The remainder of the paper is organized as follows. We beginin the next section with diffusion theory, the Darken approxima-tion, lattice approaches, and the Reed-Ehrlich model. SectionIII summarizes the methods used, molecular dynamics, anddynamically corrected transition state theory; section IV intro-duces the zeolites used for this study. The diffusion results forthe four zeolite groups are presented in section V. In sectionVI, we evaluate the results and compare them to the Reed-Ehrlich method, and section VIII contains the conclusions.
II. Diffusion Theory
Diffusion can be expressed by a diffusion coefficient inseveral ways. In practical experiments, such as measurements
* Corresponding author e-mail: [email protected].† University of Amsterdam.‡ Centre Europe´en de Calcul Atomique et Mole´culaire (CECAM).
22754 J. Phys. Chem. B2006,110,22754-22772
10.1021/jp0641278 CCC: $33.50 © 2006 American Chemical SocietyPublished on Web 10/17/2006

of the uptake and permeation rate, the diffusion measured isusually the transport diffusion coefficient,Dt. This coefficientis defined by Fick’s law
whereJ is the sorbate flux when a concentration gradient,∇c,is applied.
To obtain a diffusion coefficient that is presumably lessdependent on loading,Dt is often converted to the correcteddiffusion, Dc. This is also known as the Maxwell-Stefan orDarken diffusion coefficient and can be obtained from
whereq is the loading in the sorbent,θ the fractional occupancy,and f the fugacity.4 The corrected diffusivity is the collectivediffusion behavior of all adsorbate particles, including inter-particle correlations and can be interpreted as the movement ofthe center of mass of all particles together
One other common measure of diffusion is the self-diffusioncoefficient, Ds. It is the diffusion of a single tagged particlemoving around in a sea of other particles. It is defined as
where∆ri is the displacement of particlei at timet with respectto time 0 andN is the number of particles. This is the diffusioncoefficient that can be obtained by microscopic methods, suchas pulsed-field gradient NMR (PFG-NMR).
In general, the corrected diffusion is higher than the selfdiffusion because the corrected diffusion contains interparticlecorrelations, which have a positive contribution or, vieweddifferently, the self diffusion is lowered by single-particle back-correlations (the increased probability of a particle jumping backto its previous position because this position has a higherprobability of being empty).
A. Darken Approximation. At the infinite dilution limit,Ds and Dc are strictly equivalent. This observation has oftenbeen used to approximate eq 2 by replacingDc with Ds. This iscalled the Darken approximation, and eq 2, under theseconditions, is called the Darken equation.5 For reasons ofconvenience, the corrected diffusivity has been assumed to berelatively insensitive to changes in concentration, thus makingit possible to use the Darken equation at arbitrary loading. Ithas for instance been used to relate macroscopic and microscopicdiffusion processes. Although many deviations have been found,where the corrected diffusivity was concentration dependent,they were seen as exceptions to the general rule. For methanein MFI-type zeolite, support for the concentration independencewas found almost up to high, but not maximum loading.1,33
B. Lattice Models and Correlations. Diffusion is oftenstudied by considering particles’ movements as a hoppingprocess on a lattice. When the hopping rates between thedifferent lattice points are known, the diffusion can be computedby using the formula
whereDs is the self-diffusion coefficient,d the dimensionalityof the system, andk the hopping rate from a lattice site to anyof its neighboring lattice sites. It is often possible to coarse-grain a system for computation on a lattice, but care should betaken when diffusion coefficients are calculated in this way.Particles diffusing in a “real” system might be inclined to hoponward in the same direction (so-called multijumps) or back inthe direction from which they came (vacancy correlations).Particles that jump to a new position can attract other particlesto jump after them. To obtain a correct diffusion coefficient,all these effects should be taken into account. For a moreelaborate discussion on interparticle and time correlations, werefer to the paper of Ala-Nissila et al.35
C. Diffusion Regimes and the Reed-Ehrlich Model. Thestarting point for our explanation of diffusion on a molecularscale is the Reed-Ehrlich model, which is often used to describediffusion phenomena.36 In this model, diffusion in a nanoporousmaterial is considered as a hopping process on a lattice ofadsorption sites, in which all sites have equal adsorptionenergies. The only restriction is that a particle cannot move toa site that is occupied by another particle. In such a system, thecorrected diffusion decreases linearly with loading
whereq is the loading,Dc(0) is the corrected diffusion at infinitedilution, qmax is the maximum loading, andθ is the fractionalloading or occupancy.
The Reed-Ehrlich method was originally introduced forsurface diffusion, but the model has recently been transferredto zeolites by Krishna and co-workers37 and has been usedsuccessfully in several studies.9,38-40
The model works well for materials in which all adsorptionsites are equal (in other words, diffusional barriers do not changeas a function of loading orf ) 1 in the Reed-Ehrlichformulation) and for which the adsorption can thus be describedby a single Langmuir isotherm.
However, most nanoporous materials have several types ofadsorption sites, mutually differing in adsorption energy, andadsorption in such materials is described by ann-site Langmuirisotherm. For this type of material, eq 7 cannot be used, andwe have to use eq 8 instead
wheref is the adsorbate fugacity and 1/γ gives the fraction ofempty sites as a function of loading for ann-site Langmuirisotherm.37,41-43 For a single Langmuir isotherm, eq 8 reducesto eq 7. The isotherms and 1/γ as a function of loading for asingle-site and dual-site system are shown in Figure 1.
Diffusion in systems for which the energy of the differentadsorption sites is not influenced by loading (for example,because there are no specific adsorption sites or the sites arevery far apart) can be very well described by eq 8. It is in thenature of a Langmuir isotherm that 1/γ is never constant overloading. This leaves us with two possible diffusion regimes:
A1. As the structure fills up, the diffusiondecreaseswithloading. As adsorption sites are being filled up, less space isavailable for molecules to move around. For single-Langmuirsystems, we see a linear decrease of diffusion as a function of
Ds ) 12d
kλ2, (6)
Dc(q) ) Dc(0) × (qmax - q)
qmax) Dc(0) × (1 - θ) (7)
Dc(q) ) Dc(0) × ∂ ln q∂ ln f
) Dc(0) × 1γ
(8)
J ) -D(c)t∇c (1)
Dt(θ) ) Dc∂ ln f∂ ln q
) Dc × γ(θ) (2)
Dc ) limtf∞
1
6Nt∑i)1
N
∑j)1
N
ri(0)rj(t) (3)
) limtf∞
1
6Nt(∑
i)1
N
∆ri(t))2 (4)
Ds ) limtf∞
1
6Nt∑i)1
N
∆ri(t)2 (5)
Diffusion Coefficient of Methane in Nanoporous Materials J. Phys. Chem. B, Vol. 110, No. 45, 200622755

loading (see Figure 1 (bottom)). For multiple-site Langmuirsystems, a decrease in the adsorption is only observed in partof the loading range: the parts where the derivative of theadsorption isotherm decreases, or in other words, where thenumber of available adsorption sites diminishes. This decreasecan be linear (as in Figure 1 (bottom) for a dual-site Langmuirisotherm, up to a loading of 40), but it can also have a morecomplex form. In any nanoporous system, this behavior isobserved at very high loadings. When the available space isalmost filled up completely, the molecules move ever moreslowly, until their movement comes to a complete halt and thediffusion plunges to zero. The loading at which this happensdefines the maximum loading of the material.
A2. At an inflection in the adsorption isotherm, the numberof effective adsorption sites increases; the diffusionincreaseswith loading. In systems with multiple-Langmuir adsorptionbehavior, not all adsorption sites are filled at the same time. Ata certain loading, new adsorption sites become available, or areordering of the adsorbed molecules takes place. This isobserved as an inflection in the adsorption isotherm and,correspondingly, an increase in the diffusion.
Most system’s diffusion behavior cannot be captured com-pletely by the adsorption isotherm. It is not uncommon for theenergy of adsorption sites to be dependent on whether theneighboring adsorption sites are occupied. In the Reed-Ehrlichmodel, this change in the free energy can be captured byincluding a parameterf that is dependent on the loading.37,39,40
This, however, requires a reasonably detailed prior knowledgeabout the system under study. We can calculate free-energyprofiles of periodic nanoporous structures by plotting the freeenergy as a function of the position. These profiles can change
significantly over loading, following the energy changes of theadsorption sites. This gives rise to two additional diffusionregimes:
B1. Free-energy barriers decrease; the diffusionincreaseswithloading. Favorable interaction of particles with the “wall” ofthe nanoporous material is replaced by less favorable interactionswith neighboring adsorbed particles. This increases the freeenergy of adsorption regions and decreases the net free-energybarriers that have to be overcome to move to a next adsorptionregion. A decrease in the effective free-energy barrier acceleratesthe diffusion. This is also the underlying cause of the so-calledwindow effect.27,28,44-47
B2. Free-energy barriers increase; the diffusiondecreaseswithloading. Likewise, it is possible that the addition of extramolecules causes an increase in the free-energy barriers thatmolecules must overcome to move around. For example, thiscould be the case for polar molecules, for which the interactionwith other adsorbed molecules is more favorable than theinteraction with the wall of the porous material. In such systems,when the loading is increased, the adsorbed molecules will stickmore and more to each other and to their preferred positions,causing a decrease in the diffusion. A similar behavior isobserved for any molecule in any nanoporous material, at veryhigh loadings, when the structure is almost completely full. Themolecules inside the material are packed tightly, and movementfrom one position to the next involves crossing increasinglyhigh free-energy barriers.
In real systems, diffusion is a complex interplay of all foureffects. To demonstrate this, in this paper we will turn ourattention to diffusion in zeolites.
III. Methods
The zeolites were modeled as rigid frameworks for whichthe interactions with the alkane molecules are dominated bythe oxygen atoms.48 For the guest molecules, a united-atommodel was used,49 in which we consider the CH4 group as asingle reaction center with its own effective potential. Thepotential parameters are optimized to reproduce adsorptionproperties in pure silica confinements.50,51
A. Molecular Dynamics.The diffusion was calculated usingmolecular dynamics (MD) calculations. In an MD calculation,Newton’s equations are being solved to study particle positionsas a function of time and thus obtain a mean square displacementas a function of time. This mean square displacement can easilybe converted into a self-diffusion coefficient with
and subsequently
In a similar fashion, the corrected diffusivity can be obtainedby calculating the mean square displacement of the center ofmass
and subsequently
Figure 1. Isotherm and 1/γ for a single-site Langmuir and a dual-siteLangmuir system. Loading and pressures are given in arbitrary units.
Ds,x ) limtf∞
1
2Nt∑i)1
N
(∆xi(t))2 (9)
Ds )Ds,x + Ds,y + Ds,z
3(10)
Dc,x ) limtf∞
1
2Nt< (∑
i)1
N
ri,x(t))2 > (11)
22756 J. Phys. Chem. B, Vol. 110, No. 45, 2006 Beerdsen et al.

B. Dynamically Corrected Transition State Theory. Al-ternatively, self-diffusion coefficients can be computed using adynamically corrected transition state theory method. In additionto diffusion coefficients, such a method can yield an explanationof the diffusion behavior in terms of free-energy differences.Transition state theory regards diffusion as a hopping processon a lattice, where the hopping from some state A to anotherstate B is limited by a free-energy barrier between the two states.When the hopping rates between the different lattice points areknown, the self-diffusion coefficient can be obtained using theformula
whereDs is the self-diffusion coefficient,kAfB is the hoppingrate from A to B,λ is the lattice distance (i.e., the distancebetween statesA and B), andk is the hopping rate from A toany of its neighboring lattice sites. Equation 13 gives theconversion from hopping rates to diffusion coefficients for acubic lattice, but a similar equation can be derived for any otherlattice topology.
When diffusion is considered to be a hopping process on alattice, it is convenient to split the hopping ratek into two parts
wherekTST is the trial hopping rate, determined from transitionstate theory (i.e., the frequency with which a particle attemptsto jump to a neighboring lattice site) andκ is the dynamicalcorrection factor or, in other words, the probability that theparticle will be accepted at the next lattice point. In this paper,we will make use of this concept because it allows us to splitthe diffusion into a free-energy contribution, arising from thestructure of the confinement and the ordering of the adsorbatesinside, contained inkTST, and an interparticle collision contribu-tion, κ.
In the Bennett-Chandler approach,52-54 one computes thehopping ratekAfB over the barrier in two steps. First, the relativeprobability P(q*) is computed to find a particle on top of thebarrier, given that it is in state A, and subsequently, the averagedvelocity at the top of the barrierxkBT/2πm (assuming that theparticle velocities follow a Maxwell-Boltzmann distribution)and the probability,κ, that the system ends up in state B. Thetransmission ratekAfB from cage A to cage B is then given by
where â ) 1/(kBT), kB is the Boltzmann constant,T is thetemperature,m is the mass involved in the reaction coordinate,and F(q) is the free energy as a function ofq. In first-orderapproximation, TST assumes that all particles that reach thebarrier with a velocity toward B do eventually end up in B (i.e.,κ ) 1). For soft-potential lattice models at nonzero loading,κ
will be smaller than 1.We can choose the reaction coordinateq as the position of
one of the atoms of the diffusing molecules.27 In dynamicallycorrected TST (dcTST), the transmission coefficient,κ, correctsfor recrossing events (i.e., it corrects for trajectories which crossthe transition state from A but fail to end up in B). The returnof particles to cage A can be attributed to various causes. If thereaction coordinate is chosen in a nonoptimal way, this choiceof order parameter underestimates the free energy of the truetransition state, but the dynamic correctionκ is the exactcorrection compensating for our choice of reaction coordinate.53
Furthermore,κ can be smaller than one, because of interparticlecollisions: particles coming off the barrier and colliding withother particles before reaching equilibrium in stateB, therebyreturning to stateA. If one manages to find a “perfect” reactioncoordinate (i.e.,κ ) 1 at zero loading), one can regardκ as acorrelation and collision frequency parameter: the lower thevalue ofκ, the higher the number of collisions. In such cases itis possible to consider diffusion as a product of two contributions
In this equationDSTST is the free-energy contribution to the self
diffusion, the part of the diffusion that is governed by freeenergy barriers: effects of the topology of the confinement andthe changes in the effective topology as a function of loading.κ is the contribution to the diffusion of interparticle collisions,which in general have a lowering effect on the diffusion. Formore details about the dcTST method, we refer the reader toref 35.
By calculating diffusion in this way, we can distinguishbetween topology contributions (included inDS
TST) and particlecollision contributions (included inκ). This leads to a betterunderstanding of diffusion behavior as a function of loading,as we will show in the Results section.
Figure 2. Structure of the unit cells of four cage-type zeolites (LTA, CHA, ERI, and FAU).
Dc )Dc,x + Dc,y + Dc,z
3(12)
Ds ) kAfBλ2 ) 16kλ2, (13)
k ) kTST × κ, (14)
kAfB ) κ × x kBT
2πm× P(q*) (15)
P(q*) ) e-âF(q*)
∫cageAe-âF(q) dq
(16)
DS ) kAfB × λ2 ) κ × x kBT
2πm× P(q*) × λ2 (17)
) κ × DSTST (18)
Diffusion Coefficient of Methane in Nanoporous Materials J. Phys. Chem. B, Vol. 110, No. 45, 200622757

C. Computational Details. We used the Verlet integrationalgorithm with a time step of 0.5 fs and, depending on thediffusion speed, a total simulation time of between 1.5 and 1000ns, so that the error bars were smaller than the symbol size.The NVT ensemble was imposed using a Nose´-Hooverthermostat. Free-energy profiles were obtained from MonteCarlo simulations using the “histogram method” described inref 32. The simulation box sizes for the various simulatedsystems are given in Table 1.
IV. Zeolite Structures
Zeolites are nanoporous solids, very suitable for and usedfrequently as model systems for understanding moleculardiffusivity in porous media, because of their well-definedcrystalline structure with highly ordered, periodic confine-ments.1,2,5,6,24,55,56
Zeolites exist in a wide variety of structures. Currently, over130 different topologies are known.57 These structures arecommonly divided in three types. Channel-type zeolites consistof more or less linear channels that run in one direction only.Therefore, diffusion in such structures occurs in one dimensiononly. Intersecting channel-type zeolites consist of channels indifferent directions, that cross each other at so-called intersec-tions. Three-dimensional cage-type zeolites consist of cages,connected by narrow windows.
We analyze a representative set of zeolite structures. We havetried to make our set of zeolites as broad as possible, bychoosing twelve different, widely varying topologies. Wecalculated loading-dependent diffusion in four different cage-type zeolites (LTA, ERI, CHA, and FAU), four channel-typezeolites (AFI, MTW, LTL, and SAS) and four intersectingchannel-type zeolites (MFI, BOG, BEC, and ISV). In thissection, we give a short overview of the different topologies.The structure coordinates for the twelve zeolites were taken fromrefs 58-69.
A. Three-Dimensional Cage-Type Zeolites.Figure 2 showsthe structures of the cage-type zeolites we used in this study.In Table 1 we summarize some geometric data on these fourstructures. For each zeolite, the table lists the window ring sizein number of oxygen atoms per ring, the window diameter andthe cage diameter, the cage-to-window ratio,Rctw, which isdefined asRctw ) cage diameter/window diameter, the unit-
cell dimensions, the unit-cell form, and the size of the simulationbox.Rctw can be used as a measure of confinement by the cage-type structure; the larger the value ofRctw, the larger thedifference between the cage width and the window diameterand the larger the free-energy barrier at the window is expectedto be.
Of the four cage-type zeolites, erionite-type (ERI-type) zeolitehas the largestRctw. ERI-type zeolites have long cages, elongatedin the c direction, that are each connected to six other cages,three on each side of the long cages. The windows connectingthese cages are elliptical, their diameter varies from 3.6 Å inthe b direction to 5.1 Å in thec direction. In our simulations,we used a rectangular version of the unit cell, where one unitcell of erionite contains 4 cages.
Zeolite types LTA and CHA have comparable values forRctw,2.43 and 2.24 respectively, smaller than ERI-type zeolite. Thestructure of LTA-type zeolite consists of almost spherical cagesof about 10 Å in diameter, connected by narrow windows ofabout 4 Å in diameter. One unit cell consists of 8 cubicallyarranged cages and the windows formentropic, not energeticbarriers. Zeolite A, Linde Type-A (LTA), is a microporouscrystalline material widely used in the detergent industry. Itssupercage structure is useful in spatiospecific catalysis, typicallyof n-paraffins and olefins. One use is in paraffin cracking. Thesmall entry pore is selective toward linear paraffins, and crackingcan occur on sites within the supercage to produce smaller chainalkanes.70 Zeolite A is also widely used in in ion-exchangeseparation.71
We find a slightly smaller value forRctw in chabazite-type(CHA) zeolite. It consists of slightly elongated cages that areeach connected to six other cages in a near-cubic fashion: theanglesR, â, andγ in the trigonal unit cell are all 94°. For oursimulations, a rectangular unit cell was constructed. The CHA-type zeolite is industrially used in the formation of light olefinsfrom methanol and in xylene isomerization.
The smallest value ofRctw is that of faujasite-type (FAU)zeolite. This zeolite both has large cages and large windows.One unit cell of FAU-type zeolite contains eight cages with ashape similar to those in LTA-type zeolite, but arranged in atetrahedral manner. Depending on the atomic composition, FAU-type zeolites include zeolites X and Y. The most important useof zeolite Y is as a cracking catalyst.71-73
TABLE 1: Data of Four Cage-Type Zeolites (LTA, ERI, CHA, and FAU), Four Channel-Type Zeolites (SAS, LTL, MTW, andAFI), and Four Intersecting Channel-Type Zeolites (BOG, BEC, ISV, and MFI)a
unit cell dimensions (Å)ringsize
windowdiameter (Å)
cagediameter (Å) Rctw a b c unit-cell type simulation box
LTA 8 4.1 10 2.44 24.555 24.555 24.555 cubic 2× 2 × 2ERI 8 3.6-5.1 11 3.06 22.953 13.252 14.810 orthorhombic 2× 3 × 3CHA 8 3.8 8.5 2.24 15.075 23.907 13.803 orthorhombic 2× 2 × 3FAU 12 7.4 9 1.22 25.028 25.028 25.028 cubic 1× 1 × 1SAS 8 4.2 10 2.38 14.322 14.322 10.424 tetragonal 2× 2 × 3LTL 12 7.1 13 1.83 31.984 18.466 7.476 orthorhombic 1× 2 × 4MTW 12 5.6-6.0 8 1.42 24.863 5.012 24.326 monoclinic,â ) 107.722° 1 × 16× 1AFI 12 7.3 10 1.37 23.774 13.726 8.484 orthorhombic 2× 2 × 8BOG 12/10 7.0/5.5-5.8 b - 20.236 23.798 12.798 orthorhombic 2× 2 × 3BEC 12/12 6.6-7.7/5.6 b - 13.100 13.100 13.800 tetragonal 3× 3 × 3ISV 12/12 6.1-6.5/5.9-6.6 b - 12.853 12.853 25.214 tetragonal 2× 2 × 1MFI 10/10 5.1-5.5/5.3-5.6 b - 20.022 19.899 13.383 orthorhombic 2× 2 × 4
a For each zeolite type, the table lists the window ring size in number of oxygen atoms per ring, the window diameter and the cage diameter (Å),the cage-to-window ratio,Rctw, the unit cell dimensions in the three directions (Å), the unit cell form, and the size of the simulation box (the numberof unit cells in thex, y, andz directions). The cage and window data (left and right) for intersecting channel-type zeolites are the values for thechannels in the different directions. Where the window diameter is given as a range (e.g., 3.6-5.1 for the ERI-type zeolite), this signifies that thewindows have an oval shape. The values forRwtc in these cases are calculated as the ratio of the smallest diameter of the oval to the diameter ofthe cage.b For the intersecting channel-type zeolites, it is not practical to assign cage widths and window-to-cage ratios for reasons given in thetext.
22758 J. Phys. Chem. B, Vol. 110, No. 45, 2006 Beerdsen et al.

B. Channel-Type Zeolites.The class of channel-type zeolitesis very diverse. All zeolites whose diffusion occurs in onedirection only, in straight channels that are not interconnected,fall under this category. Thus, channel-type zeolites can consistof one-dimensionally connected cages, but they can also consistof very smooth straight tubes or channels with any degree ofsmoothness in between. Therefore, we cannot pick a singlezeolite to represent the entire class of channel-type zeolites. Togain insight in the diffusion behavior in this class, we willtherefore turn our attention to four different channel-typezeolites: AFI, MTW, LTL, and SAS. In this work, we onlyconsider channels that are sufficiently big or molecules that aresufficiently small such that two molecules can pass each other.In these one-dimensional channels, one can observe an interest-ing case of geometry correlations if the molecules cannot passeach other. In such a system one does not observe diffusivebehavior but single-file diffusion. Single-file diffusion has beenextensively investigated in experiments74-77 and in simula-tions.78-83
Figure 3 shows the structures of these four zeolites. Theaccompanying geometric data are given in Table 1. For channel-type zeolites, the cage-to-window ratio,Rctw, can be used as ameasure of “cagelikeness”: the larger the value ofRctw, thelarger the difference in width between the widest parts and thenarrowest parts of the channels, and the larger, again, the free-energy barriers are expected to be.
One of the smoothest tubelike zeolites is AFI-type zeolite. Itconsists of straight channels that are not interconnected.Diffusion occurs in thez direction only. As shown in Figure 3,a unit cell of AFI contains two channels, and the diameter ofthe channels varies between about 7.3 and 10 Å (aRctw of 1.37).AFI-type zeolites are used in the so-called Fischer-Tropschsynthesis, for the production of clean fuels and chemicalproducts from natural gas and coal.84,85 Other applicationsinclude the use in a zeolite-dye microlaser.86
Another relatively smooth channel-type zeolite is MTW-typezeolite. Like AFI, this zeolite consists of straight channels, butin the MTW-type zeolite, they range between 5.6 and 8 Å in
diameter (aRctw of 1.42) and run in they direction. MTW isamong the smallest 12-membered ring zeolite structures.87 Acommonly used zeolite with MTW-topology is ZSM-12. It isknown for its exceptional time stability and is used in acid-catalyzed reactions.87
An intermediate channel-type zeolite is LTL-type zeolite. Itconsists of disklike cavities, whose widths range from about7.1 Å in the circular 12-membered ring windows to about 13Å in the broadest regions of the channels (Rctw ) 1.83). Thecavities are connected in thex direction only. although thewindows connecting the cages are similar in size to those inAFI-type zeolite, the difference between the narrow parts andthe broad parts of the channels is relatively large, and the systemcan be considered slightly cagelike, where one unit cell containstwo LTL “cages”. Industrially, LTL-type zeolites are used inaromatization reactions.88
On the cagelike side of the channel zeolites, we find SAS-type zeolite. This zeolite is a one-dimensional version of thecage-type zeolite LTA. The cages (of about 10 Å in diameter)are similar to LTA-cages, but they are connected in onedimension only, by eight-membered ring windows of about 4.2Å in diameter, makingRctw ) 2.38. One unit cell of SAS-typezeolite contains two SAS cages. As the SAS topology has onlyrecently been discovered, we are not aware of any industrialprocesses where zeolites of this type have found applications.65
Simulation of one-dimensional channels requires specialattention. Here, diffusion results are very much dependent onthe length of the channel, and surprisingly long channels areneeded to reliably extrapolate to macroscopic diffusion coef-ficients.18
C. Intersecting Channel-Type Zeolites.The class of inter-secting channel-type zeolites is also very diverse. Thesestructures not only exist with a wide range of channel widthsand window-to-cage ratios but also differ largely in the waythe channels intersect. The channels not only intersect at variousangles, frequencies, and channel numbers (either two or threechannels can intersect at one point) but also intersect in different“amounts”. The intersection can be “complete” (i.e., two (or
Figure 3. Structure of the unit cells of channel-type structures SAS, LTL, MTW, and AFI.
Figure 4. Structure of the unit cells of intersecting channel-type structures MFI, BOG, BEC, and ISV.
Diffusion Coefficient of Methane in Nanoporous Materials J. Phys. Chem. B, Vol. 110, No. 45, 200622759

three) channel axes intersect), or it can be “partial”, meaningthere is a hole large enough for a molecule to pass from oneaxis to the next, without the two channel axes intersectingexactly.
In this study, we look at four intersecting channel structures:MFI-, BOG-, BEC-, and ISV-type zeolites, of which the unitcell structures are depicted in Figure 4. The unit cell data aresummarized in Table 1. For the intersecting channel-type zeolitesit is not practical to talk about “cage” widths and window-to-cage ratios. Usually the widest parts of the channels are regionswhere they are intersected by a perpendicular channel.
MFI-type zeolite is perhaps the most famous zeolite of thisclass. It is widely used industrially (as ZSM-5) because of itsability to promote hydrocarbon reactions. It consists of straight10-ring channels, running in they direction, intersected (incomplete intersections) by so-called zigzag channels that runin the x and z directions which also consist of 10-memberedring windows.
Boggsite (BOG-topology) is a naturally occurring mineral.Its channels run in thex andy directions only and intersect inpartial intersections. Thex-direction channels consist of 12-membered rings, while those running iny direction contain 10-membered rings.
BEC-type zeolite is one of the zeolite BETA polymorphs. Ithas 12-membered ring channels in thex, y, andz directions.The channels in thex andy directions are equivalent, althoughthe z channels only intersect the channels running in thexdirection, in very broad complete intersections.
As a BEC-type zeolite, ISV consists of straight 12-memberedring channels in thex, y, andz directions. Again, the channelsin thex andy directions are equivalent, and thez channels onlyintersect the channels running in thex direction in broadcomplete intersections. However, in ISV-type zeolites, thechannels running in thezdirection are merely short cross-links:they only connect twox direction channels without continuingafter the intersection.
D. Lattice Models in Zeolites.To be able to study diffusionusing dcTST, it is necessary to choose a lattice to map on thezeolite structure. As shown in Figure 5, this is often straight-forward, as it follows from the zeolite topology or from thefree-energy profiles calculated from it. The lattices shown forAFI- and SAS-type zeolites are one-dimensional simple lattices,
the lattice shown for CHA-type zeolite is a near-cubic lattice.It can be thought of as a cubic lattice that is slightly sheared inthree directions to form angles of 94°. For all the other zeolitesstudied, a lattice can be constructed in a similar fashion.
We stress that the dcTST method we used is not a coarse-graining method. Knowledge of adsorption-site locations is notnecessary to perform the simulation. The profiles are automati-cally averaged over all possible configurations of the systemby calculating the free-energy profiles during a MD or MC run.Making use of the periodicity of nanoporous materials, we usea lattice point only as the integration region in the dcTST methodto obtain a diffusion coefficient.32
V. Results
We calculated loading-dependent diffusion in cage-typezeolites (LTA, ERI, CHA, and FAU), channel-type zeolites(AFI, MTW, LTL, and SAS) and intersecting channel typezeolites (MFI, BOG, BEC and ISV). Free-energy profiles werecalculated at different loadings, to help us understand the loadingdependence of the diffusion. Free-energy differences play a rolein both self and corrected diffusion. In this section, we discussthe self and corrected diffusion of methane in the three classesof zeolites. We show that whileDs can be computed directlyfrom the free energy profiles in combination with the recrossingκ, all the details in the behavior ofDc as a function of loadingcan be explained very well by looking at these two parameters.
A. Self Diffusion. Self diffusion is a particle property. Theself diffusion as a function of loading reflects the way in whichthe particle’s diffusion is hampered by collisions or enhancedby the presence of other particles in favorable adsorption sites.We show the diffusion behavior in the three different zeoliteclasses.
1. Cage-Type Zeolites.We take LTA-type zeolite as arepresentative example of diffusion in cage-type zeolites, andwe treat the diffusion of methane in LTA-type zeolite in detail.Although diffusion in this type of zeolite has been studiedextensively, the diffusion behavior as a function of loadingremains poorly understood.2,19,21-23,25It has been shown to causea maximum in the diffusion as a function of loading for anumber of different molecules.
Figure 5. Lattice spanned by the wide parts of the tubes in AFI- and SAS-type zeolites and the cage centers of CHA-type zeolite.q* is the positionof the barrier, perpendicular to the reaction coordinate. In the computation ofκ, the particle starts in this plane.
22760 J. Phys. Chem. B, Vol. 110, No. 45, 2006 Beerdsen et al.
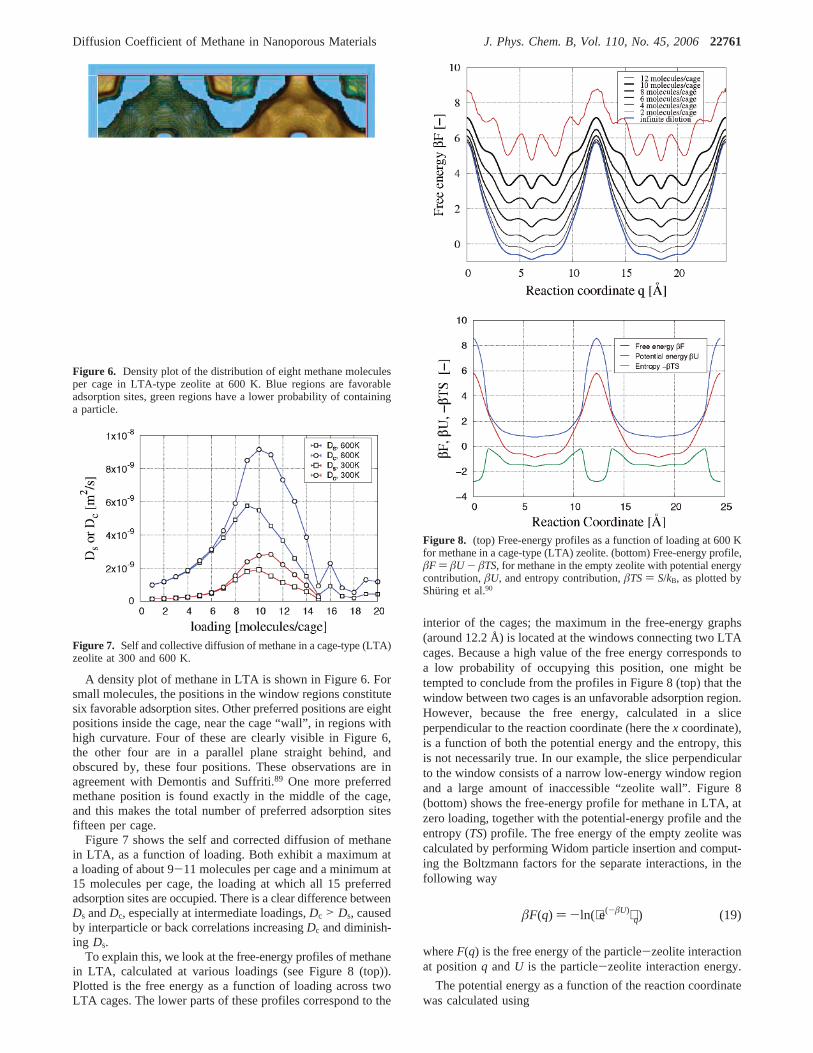
A density plot of methane in LTA is shown in Figure 6. Forsmall molecules, the positions in the window regions constitutesix favorable adsorption sites. Other preferred positions are eightpositions inside the cage, near the cage “wall”, in regions withhigh curvature. Four of these are clearly visible in Figure 6,the other four are in a parallel plane straight behind, andobscured by, these four positions. These observations are inagreement with Demontis and Suffriti.89 One more preferredmethane position is found exactly in the middle of the cage,and this makes the total number of preferred adsorption sitesfifteen per cage.
Figure 7 shows the self and corrected diffusion of methanein LTA, as a function of loading. Both exhibit a maximum ata loading of about 9-11 molecules per cage and a minimum at15 molecules per cage, the loading at which all 15 preferredadsorption sites are occupied. There is a clear difference betweenDs andDc, especially at intermediate loadings,Dc > Ds, causedby interparticle or back correlations increasingDc and diminish-ing Ds.
To explain this, we look at the free-energy profiles of methanein LTA, calculated at various loadings (see Figure 8 (top)).Plotted is the free energy as a function of loading across twoLTA cages. The lower parts of these profiles correspond to the
interior of the cages; the maximum in the free-energy graphs(around 12.2 Å) is located at the windows connecting two LTAcages. Because a high value of the free energy corresponds toa low probability of occupying this position, one might betempted to conclude from the profiles in Figure 8 (top) that thewindow between two cages is an unfavorable adsorption region.However, because the free energy, calculated in a sliceperpendicular to the reaction coordinate (here thex coordinate),is a function of both the potential energy and the entropy, thisis not necessarily true. In our example, the slice perpendicularto the window consists of a narrow low-energy window regionand a large amount of inaccessible “zeolite wall”. Figure 8(bottom) shows the free-energy profile for methane in LTA, atzero loading, together with the potential-energy profile and theentropy (TS) profile. The free energy of the empty zeolite wascalculated by performing Widom particle insertion and comput-ing the Boltzmann factors for the separate interactions, in thefollowing way
whereF(q) is the free energy of the particle-zeolite interactionat positionq andU is the particle-zeolite interaction energy.
The potential energy as a function of the reaction coordinatewas calculated using
Figure 6. Density plot of the distribution of eight methane moleculesper cage in LTA-type zeolite at 600 K. Blue regions are favorableadsorption sites, green regions have a lower probability of containinga particle.
Figure 7. Self and collective diffusion of methane in a cage-type (LTA)zeolite at 300 and 600 K.
Figure 8. (top) Free-energy profiles as a function of loading at 600 Kfor methane in a cage-type (LTA) zeolite. (bottom) Free-energy profile,âF ) âU - âTS, for methane in the empty zeolite with potential energycontribution,âU, and entropy contribution,âTS) S/kB, as plotted byShuring et al.90
âF(q) ) -ln(⟨e(-âU)⟩q) (19)
Diffusion Coefficient of Methane in Nanoporous Materials J. Phys. Chem. B, Vol. 110, No. 45, 200622761

(i.e.,⟨U⟩q is the average energy at a certain value of the reactioncoordinateq, calculated in a plane perpendicular to the reactioncoordinate). The entropy, expressed asTS(q), was obtained fromF(q) ) U(q) - TS(q).
When the minimum in the potential energy is considered, itis clear that the window between the two cages is a favorableadsorption position. However, since this region is so narrow,the window is an entropic barrier, as expressed by a high valueof -TS in the barrier region.
As the loading increases, more and more particles enter thecages. The surface of the LTA cage is adsorbophilic: adding amolecule causes a decrease in the interaction with the walls.This favorable interaction is being replaced by a less favorableinteraction with other particles, and hence, in Figure 8 (top)we observe an increase of the free energy in the bottom of thewell. Meanwhile, the free energy in the window region barelychanges, so that while the zeolite is being filled up, the net free-energy barrier decreases, causing an increase in the diffusioncoefficient.
At about 10 molecules per unit cell, the free-energy barrierstarts to decrease again because of packing effects. As the zeolitefills up, the molecules inside the cages become increasinglyordered. New free-energy barriers arise, and the diffusion slowsdown. At a loading of 15 molecules per unit cell, the methanemolecules follow a highly ordered pattern inside the cages, everypreferable position that is indicated in Figure 6 is now occupied.The addition of another molecule means that this orderedstructure has to be disturbed and a new ordering has to beformed. This new ordering changes the shape of the free-energyprofile, and the diffusion increases again. Again, the moleculepositions in the new ordering fill up, the diffusion increases abit and afterward decreases again, causing a second, smaller,maximum in Figure 7.
We note that the new ordering at high loading and the secondmaximum in the diffusion graph will be very difficult to observeexperimentally, because it would require very high pressures.
As explained in the Methods section, transition state theorycan be used to calculate a hopping rate,kTST, for the diffusionfrom cage to cage from the free-energy profiles. The truehopping rate,k, is then obtained by multiplying thiskTST valuewith a factorκ that contains corrections for a nonideal choiceof reaction coordinate and collisions and correlations with otherparticles. Since LTA-type cages are highly symmetric, it ispossible to define a perfect reaction coordinate (i.e., at zero-loading,κ equals 1). At higher loadings, the deviations inκ arecaused solely by interparticle collisions and correlations. It istherefore possible to split the diffusion of methane in LTA-type zeolite in a free-energy part and a collision part. The free-energy part is given by the transition state hopping rate fromcage to cage, which is calculated directly from the free-energyprofiles. The collision part can be obtained by calculation ofκ.Figure 9 shows the two contributions as a function of loading.As the loading increases the transition state hopping rate at firstincreases to reach a maximum at around 11 molecules per unitcell. It is at this loading that we observe a sharper increase ofthe free energy at the barrier and the creation of new free-energybarriers inside the cage, caused by an increased ordering of theparticles. While the free-energy part of the diffusion thus shows
a maximum as a function of loading, the collision term,represented byκ is a continuously decreasing function of theloading because, as the number of particles in the systemincreases, collisions become ever more frequent events. Figure9 clearly shows that the self diffusion coefficient follows thetrend ofkTST. In other words, the qualitative diffusion behavioris determined by the change in free energy profiles. The collisionfactor κ has a quantitative effect on the diffusion coefficientand shifts the maximum in the diffusion curve slightly towardlower loadings.
Simulations of methane diffusion in different cage/window-type zeolites show that the observed diffusion behavior is notspecific for LTA-type zeolites but is typical of this class ofzeolite structures. Figure 10 shows diffusion as a function ofloading in LTA, ERI, CHA, and FAU. The loading at whichthe maximum in the diffusion coefficient is observed isdependent on the cage size. Clearly, if we increase the size ofthe cage, the position of the maximum in the diffusioncoefficient will change accordingly. This is exactly what weobserve for CHA, ERI, and LTA: CHA has the smallest cagesof the three, and LTA has the largest. We note that this fact isalso reflected in the value for the diffusion at zero loading (givenin Figure 10): of these three zeolite types, the highest diffusionin the infinite dilution limit is observed in LTA, followed byERI, and subsequently CHA. Theincreasein self diffusion
U(q) ) ⟨U⟩q )
∑x,y
(U(x, y, q)e(-âU(x,y,q)))
∑x,y
e(-âU(x,y,q))
(20)
Figure 9. Diffusion of methane in LTA-type zeolite as a function ofloading at 300 K (left axis) and the two contributions to this diffusion:the free-energy part, given by the transition state self-diffusioncoefficient, DTST (left axis), and the collision part, given by thetransmission coefficient,κ (right axis).
Figure 10. Normalized self diffusion of methane in cage-type zeolitesERI, LTA, CHA, and FAU, as a function of loading at 300 K. Theinset shows the normalized self diffusion in FAU.
22762 J. Phys. Chem. B, Vol. 110, No. 45, 2006 Beerdsen et al.

compared to the infinite dilution limit can be very large,depending mainly on the size of the window and thus the heightof the free-energy barrier. Especially in the case of ERI-typezeolite (whose 3.6 Å windows are the narrowest of the three),we observe an increase in the self diffusion by a factor of 60.CHA and LTA have slightly wider windows, of 3.8 and 4.1 Å,respectively, and accordingly, the maximum in the normalizedself diffusion is smaller than that in ERI-type zeolite.
The diffusion in FAU type (Figure 10 (inset)) is quite differentfrom that in the other three cage-type zeolites. While the initialslope is positive in the case of ERI, CHA, and LTA, the selfdiffusion of methane in FAU-type zeolites is a continuouslydecreasing function of loading. The reason for this is the largesize of the windows that connect the FAU cages. The diameterof these windows, about 7.1 Å, does not differ much from thediameter of the cages, about 9 Å, and thus the windows hardlyform a barrier for the diffusion. Since both the cages and thewindows are large, the FAU zeolite structure forms a very weakconfinement, the free-energy profiles barely change when theloading is increased, and the diffusion as a function of loadingis as expected in a system of particles hopping on a lattice wherethe lattice does not change with loading. Since the diffusion inFAU-type zeolite is so much different from that in other cage-type zeolites, we will treat it in more detail in section V.C.
2. Channel-Type Zeolites.The diffusion behavior of methanein these systems is highly dependent on the ratio of the widestparts of the channels to the narrowest parts of the channels, thewindow-to-cage diameter ratio orRwtc.
The qualitative behavior is very different compared to thatin cage-type zeolites. Whereas in the LTA-type zeolite, weobserve a maximum in the diffusion as a function of loading,in the smooth channels of this class of zeolites, the diffusionslows down when the loading is increased.
An explanation of this behavior can be found in the free-energy profiles of methane in the AFI-type zeolite (Figure 12).The minimums and maximums in the profiles correspond tothe broader and narrower parts of the AFI tubes, respectively.At zero loading, the height of the effective free-energy barriersis about 1.5kBT. Such a low value implies that the diffusion inz direction is barely hampered by the zeolite structure. Unlikein the cage-type zeolites, up to a loading of about 12 moleculesper unit cell, the free-energy barrier increases, rather thandecreases, when the loading is increased. Apparently, at higherloading, a larger portion of the particles is located in the widerregions of the AFI channels. At a loading of about 12 moleculesper unit cell, however, the form of the free-energy profiles
changes. This is in agreement with Maris et al.91 who found areordering of methane molecules in AFI-type zeolites at higherloadings. In the altered form of the free-energy profile, the free-energy barrier is much lower, and this produces an accelerationof the diffusion, as is indeed observed at loadings higher than12 molecules per unit cell.
When we compare the diffusion of methane in AFI-typezeolite with that in a one-dimensional channel-type structurewith a similarRwtc (e.g., MTW-type zeolite), we observe similardiffusion behavior (see Figure 11). Common to these twosystems is their preference for a fixed ordering at lower loadings(while this particle arrangement fills up when the loading isincreased, the diffusion decreases) and a sudden change ofparticle positions at higher loadings, which gives rise to a peakin the diffusion as a function of loading. BecauseRctw in MTW-type zeolite is a bit higher than that in AFI-type zeolite, thefree-energy barriers in MTW-type zeolite (shown in Figure 12)are higher and the low-loading behavior of the diffusion isslightly more cagelike in nature, which is expressed in a slightlyconvex initial slope of the corrected diffusion as a function ofloading, as will be discussed in section V.B. However, sincethe distance between two consecutive free-energy barriers inMTW-type zeolite is much smaller than in AFI-type (5.012 vs8.484 Å), the back-correlations are much higher, as evidencedby a very low self diffusion.
In LTL-type zeolite, because the windows are quite broad,the dominant behavior of methane diffusion is that of methanein smooth linear tubes, such as AFI-type zeolite. However, sincethe difference in width between the windows and the cageregions is large (i.e., the cages are even broader), at lowerloadings, we still observe some cagelike behavior: the selfdiffusion of methane is a slightly convex function of loading.The cagelike behavior becomes more evident in the correcteddiffusion, in section V.B.
On the cagelike side of the channel zeolites, we find SAS-type zeolite. When the topology, which consists of one-dimensionally connected LTA-cages, is considered, it is notsurprising that the diffusion of methane in the SAS-type zeolitefollows a trend similar to that in three-dimensional cage-typezeolites such as LTA, CHA, and ERI: an increase in thediffusion up to a loading of about half the maximum loading,caused by an increase in the free energy inside the cages (seeFigure 12 (bottom, right)), followed by a decrease that ap-proaches zero at the maximum loading. Note that, although thecages of SAS-type zeolite are comparable to those in LTA-type zeolite, the maximum loading is a bit lower than in LTA-
Figure 11. Normalized self diffusion of methane in channel-typezeolites AFI, MTW, LTL, and SAS (inset), as a function of loading at300 K.
Figure 12. Free-energy profiles at 300 K at different loadings ofmethane for AFI- (top left), MTW- (top right), LTL- (bottom left),and SAS-type zeolites (bottom right).
Diffusion Coefficient of Methane in Nanoporous Materials J. Phys. Chem. B, Vol. 110, No. 45, 200622763
type zeolite. The particles are arranged differently because ofthe lack of windows in four directions (out of the six availablein LTA-type zeolite) and the fact that the connection betweenthe cages is different than that in LTA-type zeolite.
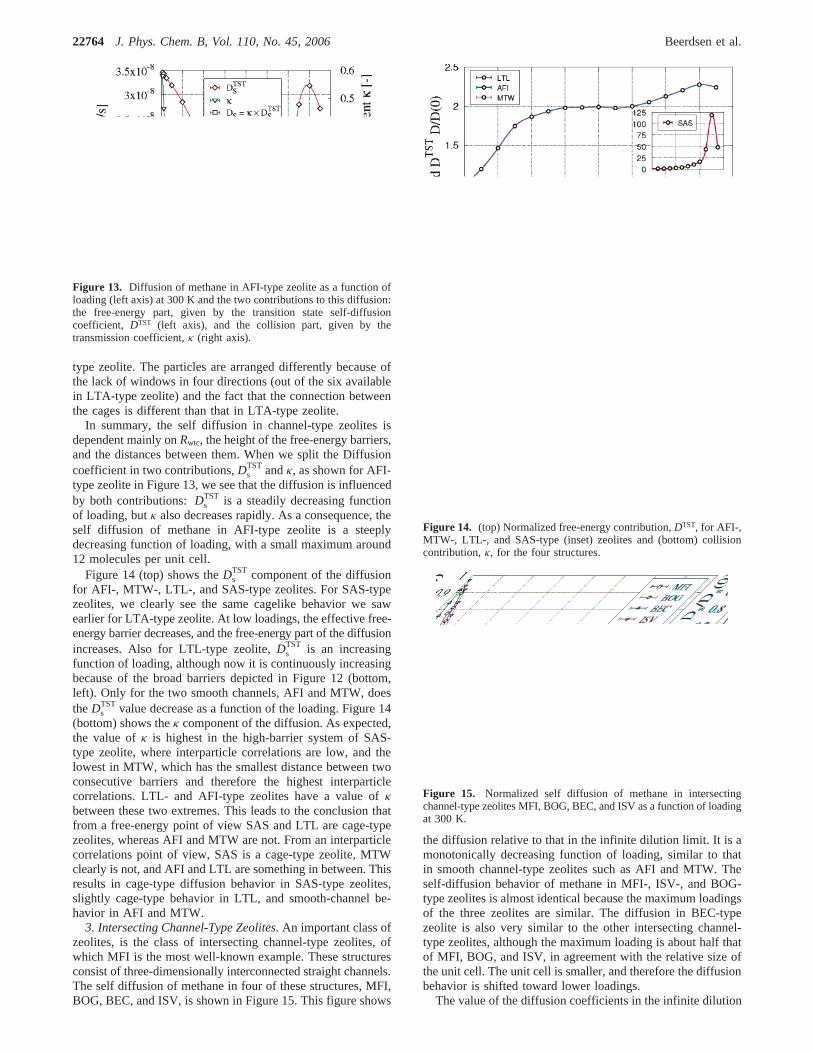
In summary, the self diffusion in channel-type zeolites isdependent mainly onRwtc, the height of the free-energy barriers,and the distances between them. When we split the Diffusioncoefficient in two contributions,Ds
TST andκ, as shown for AFI-type zeolite in Figure 13, we see that the diffusion is influencedby both contributions:Ds
TST is a steadily decreasing functionof loading, butκ also decreases rapidly. As a consequence, theself diffusion of methane in AFI-type zeolite is a steeplydecreasing function of loading, with a small maximum around12 molecules per unit cell.
Figure 14 (top) shows theDsTST component of the diffusion
for AFI-, MTW-, LTL-, and SAS-type zeolites. For SAS-typezeolites, we clearly see the same cagelike behavior we sawearlier for LTA-type zeolite. At low loadings, the effective free-energy barrier decreases, and the free-energy part of the diffusionincreases. Also for LTL-type zeolite,Ds
TST is an increasingfunction of loading, although now it is continuously increasingbecause of the broad barriers depicted in Figure 12 (bottom,left). Only for the two smooth channels, AFI and MTW, doestheDs
TST value decrease as a function of the loading. Figure 14(bottom) shows theκ component of the diffusion. As expected,the value ofκ is highest in the high-barrier system of SAS-type zeolite, where interparticle correlations are low, and thelowest in MTW, which has the smallest distance between twoconsecutive barriers and therefore the highest interparticlecorrelations. LTL- and AFI-type zeolites have a value ofκ
between these two extremes. This leads to the conclusion thatfrom a free-energy point of view SAS and LTL are cage-typezeolites, whereas AFI and MTW are not. From an interparticlecorrelations point of view, SAS is a cage-type zeolite, MTWclearly is not, and AFI and LTL are something in between. Thisresults in cage-type diffusion behavior in SAS-type zeolites,slightly cage-type behavior in LTL, and smooth-channel be-havior in AFI and MTW.
3. Intersecting Channel-Type Zeolites.An important class ofzeolites, is the class of intersecting channel-type zeolites, ofwhich MFI is the most well-known example. These structuresconsist of three-dimensionally interconnected straight channels.The self diffusion of methane in four of these structures, MFI,BOG, BEC, and ISV, is shown in Figure 15. This figure shows
the diffusion relative to that in the infinite dilution limit. It is amonotonically decreasing function of loading, similar to thatin smooth channel-type zeolites such as AFI and MTW. Theself-diffusion behavior of methane in MFI-, ISV-, and BOG-type zeolites is almost identical because the maximum loadingsof the three zeolites are similar. The diffusion in BEC-typezeolite is also very similar to the other intersecting channel-type zeolites, although the maximum loading is about half thatof MFI, BOG, and ISV, in agreement with the relative size ofthe unit cell. The unit cell is smaller, and therefore the diffusionbehavior is shifted toward lower loadings.
The value of the diffusion coefficients in the infinite dilution
Figure 13. Diffusion of methane in AFI-type zeolite as a function ofloading (left axis) at 300 K and the two contributions to this diffusion:the free-energy part, given by the transition state self-diffusioncoefficient, DTST (left axis), and the collision part, given by thetransmission coefficient,κ (right axis).
Figure 14. (top) Normalized free-energy contribution,DTST, for AFI-,MTW-, LTL-, and SAS-type (inset) zeolites and (bottom) collisioncontribution,κ, for the four structures.
Figure 15. Normalized self diffusion of methane in intersectingchannel-type zeolites MFI, BOG, BEC, and ISV as a function of loadingat 300 K.
22764 J. Phys. Chem. B, Vol. 110, No. 45, 2006 Beerdsen et al.

limit is dependent mainly on the smallest ring-size of the zeolitechannels.D0
BEC > D0ISV > D0
BOG > D0MFI, while BEC- and ISV-
type zeolites have a smallest ring size of 12 in both the straightchannels and the perpendicular channels; BOG-type zeoliteshave 12-membered rings in thex direction and 10-memberedrings in the narrowery direction channels. MFI-type zeoliteshave 10-membered rings in both the straight and the zigzagchannels. However, the exact value ofD0 depends on the exacttopology and cannot be determined a priori by the ring sizealone.
As an example, we splitDsTST into DTST andκ for diffusion
in MFI-type zeolite along they direction (see Figure 16). Fromthe behavior ofDs
TST, one could expect a cagelike behavior ofthe diffusion. However, it is clear that the diffusion is completelydominated byκ, which is a measure of the correlations in thesystem and the collision frequency.κ decreases more rapidlythanDTST decreases, so the net effect is that the self diffusionin MFI-type zeolite is a decreasing function of loading. Thecage-type suggested by the maximum inDs
TST is more visiblein the loading behavior of the corrected diffusion. We note thatthe figure shows thatκ is not equal to 1 at zero loading, whichimplies thatκ also contains some corrections for a nonidealchoice of reaction coordinate.
B. Corrected Diffusivity. The corrected diffusion behavioris a system property. It is the collective diffusion of all particlesthrough the zeolite and includes interparticle correlations. As itturns out, corrected diffusion as a function of loading can bedescribed accurately by looking at the free-energy profiles as afunction of loading. Again, each of the three zeolite classes hasa very distinct loading-dependent diffusion behavior.
1. Cage-Type Zeolites.Figure 17 shows the correcteddiffusion of methane in LTA, CHA, ERI, and FAU, normalizedwith respect to the diffusion in the infinite dilution limit. ForLTA-, CHA-, and ERI-type zeolites, the qualitative diffusionbehavior is similar to the self diffusion: a maximum as afunction of loading at about 2/3 of the maximum loading. Asexpected, the corrected diffusion is higher than the self diffusionbecause of interparticle and back correlations. Since at zeroloading the self diffusion is equal to the corrected diffusion,D0
FAU > D0LTA > D0
ERI > D0CHA also holds for the corrected
diffusion.The increase in the corrected diffusion compared to the
infinite dilution limit is even higher than that in the selfdiffusion. In ERI- and CHA-type zeolites, the increase in thediffusion is almost 2 orders of magnitude.
Again, the diffusion in FAU-type zeolite is completelydifferent from the diffusion in the other cage-type zeolites. It isan almost linearly decreasing function of loading, as expectedof corrected diffusion in a system where the barriers do notchange as a function of the loading. The corrected diffusion ofthe FAU-type zeolite will be treated in more detail in sectionV.C.
2. Channel-Type Zeolites.As in the case of self diffusion,the diffusion behavior as a function of loading is highlydependent on the amount of cagelikeness, for whichRwtc is agood indicator. For our four-channel-type zeolites,Rwtc
SAS >Rwtc
LTL > RwtcMTW > Rwtc
AFI, and this is clearly reflected in thediffusion curves in Figure 18. The diffusion of methane in AFI-and MTW-type zeolites is a continuously decreasing functionof loading. The curve is more convex for MTW because of thehigherRwtc. As in the case of self diffusion, a small maximumis found at about 10 and 13 molecules per unit cell, in MTWand AFI, respectively, because of a reordering of adsorbedmolecules inside the zeolite.
In LTL, the difference in width between the windows andthe cage regions is quite large, and therefore, at low loadings,we still observe some cagelike behavior in the correcteddiffusion. There is a small peak in the diffusion at a loading ofabout 3 molecules per unit cell. When the loading is furtherincreased, the diffusion slows down, as is expected in a tubelikestructure. As in the case of self diffusion, SAS-type zeoliteclearly exhibits cage-type behavior.
The corrected diffusion of methane in channel-type zeolitesSAS, LTL, MTW, and AFI is shown in Figure 18.
Figure 16. Ds,y of methane in the MFI-type zeolite at 300 K as afunction of loading (left axis) and the two contributions to this diffusionin the y direction: the free energy part, given by the transition stateself-diffusion coefficient,Dy
TST (left axis), and the collision part, givenby the transmission coefficient,κy (right axis).
Figure 17. Normalized corrected diffusion of methane in cage-typezeolites LTA, CHA, ERI, and FAU as a function of loading at 300 K.
Figure 18. Normalized corrected diffusion of methane in channel-type zeolites AFI, MTW, LTL, and SAS (inset) as a function of loadingat 300 K.
Diffusion Coefficient of Methane in Nanoporous Materials J. Phys. Chem. B, Vol. 110, No. 45, 200622765

3. Intersecting Channel-Type Zeolites.As an example of howthe free-energy profiles can contain a lot of detail about diffusionbehavior, we treat the diffusion in MFI-type zeolite in detail.The structure of MFI consists of two straight channels per unitcell, intersected by two zigzag channels. At low loadings, thereare four favorable positions per straight channel and fourfavorable positions per zigzag channel, making the total numberof preferential adsorption sites per unit cell 16.
Pascual et al. found that at low loadings, methane in the MFI-type zeolite does not have any preference for either of thesepositions and is located everywhere inside the zeolite.92 Whenthe loading exceeds 16 molecules per unit cell, all these positionsare filled, and new adsorption sites have to be formed toaccommodate more molecules.
Again, our explanation of the diffusion behavior comes fromfree-energy profiles, shown in Figure 21. Thex, y, and zdirections in MFI-type zeolite are inequivalent; therefore wehave to consider them separately.
The fastest diffusion occurs along they direction in thestraight channels. At low loadings (up to about 13 moleculesper unit cell), the particles are so far apart that they hardlyinfluence each other’s diffusion.Dc,y is approximately constant,and the free-energy profiles remain the same. The highest free-energy barrier is located at B. The minima in the free-energyprofiles (at about 5 and 15 Å) correspond to the positions ofthe intersections and zigzag channels (all mapped onto the samey-coordinate); the region of 5-15 Å and the region of 15-20and 0-5 Å correspond to the interior of the straight channels.Apart from the intersections, there are four minima in the free-
energy profiles along the direction of the straight channels,which correspond with four favorable adsorption positions.
When the loading exceeds 13 molecules per unit cell, thefree-energy profile changes slightly (see Figure 22 (top)): thebarrier at B is lowered, and the smaller barrier at D is raised abit. This indicates that, while the “most common” configurationis still four adsorption sites per straight channel, the averageloading of the straight channels increases, and some moleculesare located at nonstandard positions inside the straight channel.The observed free-energy profile is an average over all theseconfigurations, and as the net barrier decreases, we see a slightincrease in the diffusion in they direction, between 13 and 17molecules per unit cell. At a loading of 17 molecules per unitcell and higher, the dominant change in the free-energy profiles
Figure 19. Normalized corrected diffusion of methane in intersectingchannel-type zeolites MFI, BOG, BEC, and ISV as a function of loadingat 300 K.
Figure 20. Ds andDc of methane in MFI-type zeolite, as a functionof loading,Dc in the x, y, andz directions.
Figure 21. Free-energy profiles, 300 K, at different loadings formethane in MFI-type zeolite along thex, y, and z directions,respectively. The straight channels run in they direction and the zigzagchannels run in thex andz directions.
22766 J. Phys. Chem. B, Vol. 110, No. 45, 2006 Beerdsen et al.

is the sharp increase of the peak at D, causing a fast decreaseof the Dc,y value as a function of loading (see Figure 22(middle)), until it reaches zero at the maximum loading, whichis about 30 molecules per unit cell. The decrease is onlyinterrupted by a small peak inDc,y at 23 molecules per unitcell. At a loading between 22 and 25 molecules per unit cell,the free-energy profiles change significantly (see Figure 22(bottom)): the peaks at A and E increase, the peak at D vanishes,and a new peak appears at C. This change signifies a transitionfrom four to eight adsorption sites per straight channel. Theappearance and disappearance of peaks does not occur simul-taneously. At first, the dominating effect is the increase in the
peak at A, and the diffusion continues to decrease. The suddendisappearance of the peak at D causes a maximum in thediffusion at 23 molecules per unit cell, which immediatelyvanishes at higher loadings, when the peak at C appears.
In a similar way, the diffusion in thex direction,Dc,x, can beexplained. Up to a loading of about 16 molecules per unit cell,the free-energy profiles do not change much. Only the peak atC slightly increases, causing a very slow decrease in thediffusion. At a loading of 16 molecules per unit cell, whichcorresponds to four molecules per straight channel and fourmolecules per zigzag channel, a reordering of the adsorbatesinside the zeolite takes place. Similar to the change in the straightchannels, a transition takes place from four to eight moleculesper zigzag channel. This transition gives rise to a new free-energy profile: first the free energy at B decreases, producinga small increase in the diffusion at 18-19 molecules per unitcell, followed soon after by an increase of the free energy at Aand C. This increase is so significant that the diffusion rapidlyslows down until it reaches zero at the maximum loading. Asis shown in Figure 21, at very high loadings, from 29 moleculesper unit cell, another transition takes place. The peak at Abroadens to encompass B, and simultaneously, a new peakappears at D. This indicates that at higher-loading particles insidethe straight channels are inclined to arrange in two rows (leftand right of peak D).
The diffusion in thez direction (Dc,z) finally, proceedssimilarly to that in thex direction. At low loadings, the diffusiondecreases as a function of loading. At a loading of 17 moleculesper unit cell, the free-energy profiles reflect the transition fromfour to eight molecules per zigzag channel. This transition causesa slight acceleration of the diffusion at 18-19 molecules perunit cell after which the diffusion slows down to zero. As inthe x direction profiles, at very high loadings, we see anothertransition: the peak at B vanishes, and new peaks appear at Aand C.
The total corrected diffusion of methane in MFI-type zeoliteis dominated by the diffusion in they direction. It is a slowlydecreasing function of loading up to about 15 molecules perunit cell. There is a maximum in the diffusion at a loading of16-17 molecules per unit cell, after which the diffusion rapidlydecreases to reach zero at the maximum loading of 32 moleculesper unit cell, interrupted by a small increase in the diffusion at23 molecules per unit cell. This is in agreement with Skoulidasand Sholl, who simulated the corrected diffusion of methane inMFI-type zeolite up to a loading of 18.5 molecules per unitcell.1
In other intersecting channel-type zeolites, such as the BEC-,ISV-, and BOG-type zeolites, we observe a very similarbehavior, shown in Figure 23.
This figure shows the diffusion relative to that in the infinitedilution limit. The diffusion behavior of methane in BOG-typezeolite is almost identical to that in MFI. The maximum loadingof the two zeolites is similar and the free-energy profiles (andthus the particle distributions) show a similar loading depen-dence. However, the diffusion in BOG-type zeolite does nothave maxima at 17 and 23 molecules per unit cell. The diffusionin BEC-type zeolite is also very similar to the other intersectingchannel-type zeolites, although the maximum loading is abouthalf that of MFI and BOG, in agreement with the relative sizeof the unit cell, and therefore the diffusion behavior is shiftedto lower loadings. The loading dependence in ISV-type zeoliteis, for the most part, in agreement with that in the otherintersecting channel-type zeolites. However, the low-loadingbehavior, where the diffusion slightly increases as a function
Figure 22. Selected parts from free-energy profiles, at 300 K, ofmethane in the MFI-type zeolite mapped along they direction, atloadings of 13 to 19 (top), 18 to 21 (middle), and 20 to 25 (bottom)molecules per unit cell. Loadings that correspond to a peak in thediffusion are displayed in blue, lower loadings in red, and higherloadings in green.
Diffusion Coefficient of Methane in Nanoporous Materials J. Phys. Chem. B, Vol. 110, No. 45, 200622767

of loading, is slightly different and could even be consideredslightly cagelike.
In summary, the trends in the behavior of the correcteddiffusion as a function of loading are very similar for all studiedtypes of intersecting-channel type zeolites: at low loading, itis a slowly diminishing function of loading, and at intermediateloadings, it decreases faster, until the diffusion comes to a haltat the maximum loading of the structure. There are smalldeviations from this behavior, small peaks and valleys, and thesecan be accurately explained in the same manner as shown forMFI.
C. Diffusion in FAU-Type Zeolite. In the discussion of thediffusion of methane in cage-type zeolites, FAU-type zeoliteclearly differed from other cage-type zeolites such as ERI, CHA,and LTA, in the behavior of both the self and the correcteddiffusion. Whereas the diffusion of the other cage-type zeolitesexhibits a maximum, for FAU, bothDs andDc are a decreasingfunction of loading (see Figures 10 and 17). The self diffusionseems to behave in a way similar to that in the channel- andintersecting channel-type systems, while the corrected diffusionis almost linear, up to a loading of about 9 molecules per cage.In Figure 24, we split the self diffusion in the two contributions,DTST andκ. The free-energy profiles from which the values ofDTST were calculated are shown in Figure 25. These profileswere obtained by choosing one of the body diagonals of the
cubic unit cell as the reaction coordinate: the body diagonalfrom coordinate (0, 0, 0) to (1, 1, 1). In this way, the reactioncoordinate passes through two FAU cages, and crosses thewindow dividing the two perpendicularly. Figure 24 proves thatthis is a perfect reaction coordinate because the value ofκ atzero loading is 1.
Surprisingly, while the free energy of the system does changewhen the loading is increased, the value ofDTST remainsapproximately constant, up to a loading of 8 molecules per cage(see Figure 25). It appears that, while the value of the free energyincreases with loading, this change is more or less uniform overthe entire reaction coordinate, resulting in a constant value ofDTST. Therefore, the behavior of the self diffusion is completelydetermined byκ. This can be explained by the fact that FAU-type zeolite not only consists of very large cages but also itswindows are very large (Rwtc ) 1.22), and up to intermediateloadings, the zeolite does not form a very strong confinement.Only at loadings of higher than 8 molecules per unit cell, wesee a maximum in the diffusion. By now, the zeolite has filledup enough for the particles to experience the confinement as acage/window-type system and exhibit the associated diffusionbehavior. However, at these loadings, the diffusion is very lowin comparison to that at the infinite dilution limit and the cage-type behavior is hardly distinguishable.
The corrected diffusion at low loadings is equally unaffectedby free-energy differences and follows approximately (1- θ)behavior: a linear decrease of the corrected diffusion coefficientas a function of loading, as we would expect for particlesperforming a random walk on a lattice. Again, at loadings higherthan 8 molecules per cage, the corrected diffusion coefficientincreases, in accordance withDTST, and goes through amaximum at about 11 molecules per cage. We can concludethat FAU-type zeolite forms a very weak confinement up to aloading of 8 molecules per cage. At higher loadings, it can beregarded as a cage-type zeolite.
VI. Discussion
In the previous sections, we have divided the zeolites in fourgroups, that all have their own specific diffusion behavior. Inthis section, we will compare the results with those predictedby the Reed-Ehrlich model. We calculated adsorption isothermsat 300 K for each of the zeolite types and obtained 1/γ bycomputing the derivative of the isotherm with respect to thefugacity, as a function of the loading
Figure 23. Relative self and corrected diffusivity of methane inintersecting channel-type zeolites BEC, ISV, BOG and MFI as afunction of loading at 300 K.
Figure 24. Diffusion of methane in FAU-type zeolite as a function ofloading and the two contributions to this diffusion: the free-energypart, given by the transition state self-diffusion coefficient, and thecollision part, given by the transmission coefficient.
Figure 25. Free-energy profiles for methane in FAU at 300 K, mappedon the body diagonal (1,1,1).
(1γ)(q) ) (∂ ln q∂ ln f )(q) (21)
22768 J. Phys. Chem. B, Vol. 110, No. 45, 2006 Beerdsen et al.

If adsorbed molecules do not change the energy of neighboringsites, we expect that the free-energy profiles will not change asa function of loading, and the corrected diffusion will behaveas 1/γ, as follows from eq 8. However, if adsorbed moleculesdo have an effect on the energy inside the zeolite, we expectthe behavior ofDc to deviate from 1/γ behavior. The Reed-Ehrlich model does not predict the value of the self-diffusioncoefficient as a function of loading.
Figure 26 once more showsDs andDc as a function of loadingfor one representative of each zeolite class, LTA, AFI, MFI,and FAU. To compare the diffusion behavior at finite loadingat that at the infinite dilution limit, the plotted diffusioncoefficients have been normalized with respect to the diffusionat zero loading, except for LTA. The two components of theself diffusion,DTST (also normalized with respect toD0
TST) andκ, and the Reed-Ehrlich prediction for the diffusion, 1/γ, arealso plotted. The diffusion coefficients shown for MFI-typezeolite are for they direction.
In LTA-type zeolite, the diffusion is clearly governed by thebehavior ofDTST; κ only has a quantitative influence. Both theself diffusion and the corrected diffusion exhibit a maximumas a function of loading. Especially in the case of the correcteddiffusion, the difference in the diffusion at the maximum withrespect to the infinite dilution limit is almost 2 orders ofmagnitude. This sheds a new light on the order of magnitudedifferences found experimentally in different diffusion measure-ments.7 Macroscopic methods typically measure collectivediffusivities (corrected and transport diffusion coefficients),while microscopic methods measure self-diffusion coefficients.
When the loading dependence of both types of diffusion is takeninto consideration, it is not surprising that large deviations occurbetween different measurements.
It is clear that for cage-type zeolites, such as LTA, the Reed-Ehrlich method requires modification. The adsorbed moleculeshave a strong influence on the energy of neighboring adsorptionsites, and the free-energy barriers change significantly when theloading is increased, thereby increasing the values ofDTST. Thecorrelations in a high-barrier system, such as LTA, containedin κ are relatively low, and furthermore, their decrease is slowerthan the rapid increase inDTST. The result is that bothDs andDc show a qualitative behavior similar to that ofDTST and verymuch unlike the behavior expected from the Reed-Ehrlichmodel.
In AFI-type zeolite, the behavior is altogether different.Ds,Dc, andDTST are all decreasing functions of loading. Up to aloading of 8 molecules per unit cell,DTST decreases ap-proximately linearly, andκ is a rapidly decreasing function ofloading. Although the adsorbed molecules do change the energyof their environment, and thusDTST, the behavior ofDs isgoverned byκ: the higher the loading, the more interparticlecollisions occur, and these are the limiting factor for thediffusion in smooth channel-type zeolites. When we comparethe corrected diffusion as a function of loading with 1/γ, theform of the two functions is quite similar. The overlap with theReed-Ehrlich prediction is not perfect, but it shows that theloading-dependent diffusion behavior in AFI-type zeolite isdetermined for a large part by the presence of other particles,by way of vacancy correlations. The adsorption isotherm for
Figure 26. Compiled data for one representative zeolite from each of the four zeolite classes (all at 300 K): cage-type zeolite LTA (top, left),channel-type zeolite AFI (top, right), intersecting channel-type zeolite MFI (bottom, left), and weak-confinement-type zeolite FAU (bottom, right).Diffusion coefficients,Ds, Dc, DTST (normalized for AFI-, MFI-, and FAU-type zeolites, not for LTA),κ, and 1/γ are given. The values ofDs, Dc,DTST, andκ for MFI are for they direction only.
Diffusion Coefficient of Methane in Nanoporous Materials J. Phys. Chem. B, Vol. 110, No. 45, 200622769

AFI has a near-Langmuir form up to a loading of about 8molecules per unit cell. At this loading there is a clear inflection.A second inflection is visible at 12 molecules per unit cell. Bothinflections are reflected in the value of 1/γ, and even inDTST:a reordering of the molecules results in a new form of the free-energy profile. 1/γ gives a reasonable estimate ofDc. However,the use of the Reed-Ehrlich model to compute the exact valueof Dc would require 1/γ and additional terms describing theenergetic influence of adsorbed particles.
Figure 26 shows the diffusion data for MFI in they directiononly. On the basis of this figure, we can state that, because thevalue of DTST increases only slowly at low loadings, the selfdiffusion is, for a large part, determined by the behavior ofκ.
In the corrected diffusion behavior, we can recognize theeffect of the free-energy changes. WhileDc does not exactlyfollow DTST, the trends are similar. However, to understand thefull behavior ofDc, one needs to look at the separate free-energyprofiles and analyze them carefully. BothDTST andDc suggestthat something is happening at 16 molecules per unit cell, whichcorresponds to the loading where all 16 favorable adsorptionsites (four per straight channel and four per zigzag channel)have been occupied. To increase the loading any further, newless-favorable positions have to be occupied, or the moleculeshave to reorganize. The latter is happening, as is visible in thefree-energy profiles. Interestingly, while 1/γ does not give areasonable estimate of the corrected diffusion behavior, it doeshave a subtle bend at 16 molecules per unit cell.
We stress that MFI-type zeolite is a complicated system.While the diffusion is highest in they direction, the other twodirections do have their influence on the total diffusioncoefficient, and to understand the diffusion behavior, all channeldirections need to be taken into consideration.
For FAU, up to a loading of about 8 molecules per unit cage,the loading-dependent diffusion behavior is completely deter-mined by interparticle collisions. Since the free-energy profilesbarely change when the loading is increased,Ds has the exactlysame form asκ andDc exhibits the typical behavior of a particlejumping randomly on a lattice. One would expect that theDc
value in such a case would follow 1/γ exactly, but Figure 26makes clear that this is not the case. From four molecules percage onward, the behavior ofDc and 1/γ are alike, but 1/γ goesthrough a large minimum at one molecule per cage, which isnot reflected inDc. Why 1/γ shows this behavior is unclearand would require additional research.
In summary, the diffusion of none of the zeolites studied herecan be explained by a Reed-Ehrlich model only. In each ofthe cage-type, channel-type, and intersecting channel-typezeolites, adsorbed particles influence the energy of theirsurroundings, thus rendering the Reed-Ehrlich theory, which,in its basic form, assumes constant energy-adsorption sites,invalid. Even in the case of FAU, where the loading-dependenceof the net free-energy barriers can be considered negligible, theReed-Ehrlich model cannot be used to describe the correcteddiffusion over the entire loading range.
The Reed-Ehrlich model can be adjusted to contain a termthat changes as a function of the loading in the system,37 butthis requires prior knowledge about the system. This term couldbe determined by calculating free-energy profiles, but when onehas obtained these free-energy profiles, it is relatively easy andquick to compute a diffusion coefficient from them using dcTSTinstead of the Reed-Ehrlich model. However, the Reed-Ehrlichmodel could perhaps be used to estimate the height of free-energy barriers by using it in combination with MD.
Another remarkable observation can be made from the
comparison of the four zeolite groups. Whereas the specificloading-dependence of the diffusion is different in each group,we observe that neither the self diffusion nor the correcteddiffusion is ever constant over the entire loading range. In everyzeolite topology, we can assign regimes where the diffusionincreases or decreases. At high loadings, it is imperative thatboth Ds andDc approach zero because of the packing effectsthat halt the diffusion, regardless of the type of zeolite. Theloading at which the final decrease sets in is determined by thezeolite type, topology, and size. Even in MFI-type zeolite, whereDc was hitherto believed to be constant,1 the diffusion eventuallygoes down to zero. This implies that the Darken approximation,which states that the corrected diffusion can be assumed to beconstant over loading, generally is not valid, outside of a smallrange near the infinite dilution limit whereDs andDc are equal.
VII. Comparison with Experimental Data
To validate our method, we compare our simulation resultswith experimental results for the two most commonly usedzeolites: MFI and FAU.
Figure 27 shows our simulation results for the diffusion ofmethane in MFI-type silica as a function of the adsorbateloading,33 together with results obtained by several other groups,through simulation13-17 and experiment.29-31,93,94The experi-mental data (black symbols) are self-diffusion coefficients,except those obtained by single-crystal membrane (SCM)measurements, which should be corrected for transport diffu-sivities. The results have been plotted against the loading asreported in the original papers, wherever possible. Unspecifiedloadings have been estimated from the reported pressures withthe aid of a calculated adsorption isotherm.
Although some results show a marked deviation, both single-crystal membrane studies,93,94 carried out at the zero-loadinglimit, yielded a diffusion that is much slower than that foundby other methods, the overall correlation between differentexperimental and simulation results is good. We can concludethat the methane force field of ref 50 predicts the diffusioncoefficient accurately.
The deviation observed between the single-crystal studies andmost other studies is probably the result of the existence of bothinternal and external diffusional barriers. The more macroscopica measurement method is, the larger the influence of the internalbarriers. QENS is the experimental technique which is leastaffected by the existence of internal barriers.95,96As the internal
Figure 27. Simulation results for the diffusion of methane in MFI-type silica as a function of the adsorbate loading, together with resultsobtained by several other groups, through simulation13-17 andexperiment.29-31,93,94Data were obtained at 300 K, except for the resultsof Jobic et al., which were obtained at 250 K.
22770 J. Phys. Chem. B, Vol. 110, No. 45, 2006 Beerdsen et al.

barriers are relatively small for methane in MFI, it is expectedthat the diffusivities obtained by macroscopic and microscopicmethods will be further apart for longer alkanes.
As faujasite (FAU) is an important zeolite in practicalapplications, many experimental and simulation studies havebeen published. Most of these studies focus on the diffusion ofaromatics,97-101 but some groups have also considered hydro-carbons.102-108
It is interesting to compare our results with the simulationsof Chempath et al.103 The molecular dynamics simulations ofChempath et al. were interpreted assuming a linear decrease ofthe MS diffusion coefficient as a function of loading.37 At afractional loading of 0.8, a single simulation point was reportedthat deviated from this line. Comparison with our results showthat this deviation is significant.
For benzene in FAU, Auerbach and co-workers101and Snyderet al.109 found in their kinetic Monte Carlo simulations anincrease of the corrected diffusion coefficient at high loading,which was attributed to the repulsive adsorbate-adsorbateinteractions. We can add now that, as benzene is a much largermolecule than methane, the adsorbate experiences the cages ofY much more like cages, and hence this system behaves muchmore like a cage-type zeolite than methane. For hexane and2-methyl pentane, Van Baten and Krishna110 observed abehavior similar to that of methane. It would be interesting toinvestigate the behavior for longer chains, as one could arguethat for the longer alkanes, the window of FAU might be anentropic barrier, and this would show cagelike behavior again.
VIII. Conclusion
We have compared the loading-dependent behavior of theself diffusion and corrected diffusion for methane in twelvedifferent zeolite topologies. On the basis of their characteristics,we can divide these twelve topologies into four zeolite groups.Each of the four zeolite groups shows very distinct diffusionbehavior as a function of loading.
In cage-type zeolites, we observe a maximum in both theself and corrected diffusion caused by decreased free-energybarriers, after which both slow to zero. Diffusion behavior inchannel-type zeolites is highly dependent on the ratio betweenthe narrowest and widest part of the channels,Rctw. In thesmoothest channels, bothDs and Dc are a steeply decreasingfunction of loading. In the most cagelike channels, those withthe highest value ofRctw, Ds, andDc behave as true cage-typesystems. The zeolites with an intermediate value ofRctw behavein an intermediate way. Generally,Ds is still monotonicallydecreasing, although the curve is less steep than in the smoothestchannels. Dependent on the exact value ofRctw, Dc can have aslight cagelike behavior, resulting in a small maximum at lowloadings. In intersecting channel-type zeolites,Ds generallybehaves similar to that in channel-type zeolites of intermediatesmoothness.Dc has two consecutive diffusion regimes:111 firsta slow linear decrease, until at least one of the channels hasreached its maximal loading, and then a sharper plunge to reachzero at the saturation loading of the zeolite.
In any zeolite type, at high loadings, bothDs andDc drop tozero. This observation implies that the Darken approximationcannot be used outside a small region near zero loading. Wenote that in simulations one can apply pressures that are higherthan those used in experiments, where full saturation is oftendefined as the loading at which there is an equilibrium with asurrounding liquid phase. The maximum loading in simulationsis often higher than this full-saturation capacity. Experimentallyis has been shown that the self diffusion can slow more than 2
orders of magnitude at these higher loadings (see, for example,Karger et al.112 for n-alkanes in NaX), but this diffusion wasstill nonzero.
We stress that the ordering of molecular sieve structures inclasses depends strictly on the combination of adsorbate andadsorbent. For example, a cage that appears very large formethane molecules can in fact be a very tight confinement forbenzene. When applying this classification to larger molecules,sieve structures can therefore switch class, but the generalbehavior will be the same: when the cages are large (withrespect to the adsorbed molecule) and the windows are narrow,the diffusion as a function of loading will go through amaximum; when the confinement is experienced as a smoothchannel, the diffusion is a decreasing function of loading (thishas also been observed for small alkanes in carbon-nano-tubes113); and when the confinement consists of intersectingchannels,DS will be monotonically decreasing as a function ofloading, andDC will show a kink. The method employed inthis study can be used to make a classification of pore structuresfor any given adsorbate molecule.
Acknowledgment. This work is supported by the DeutscheForschungsgemeinschaft (DFG, priority program SPP 1155), theEC though the Marie Curie EXT project MEXT-CT-2005-023311, and The Netherlands Research Council (CW). We thankR. Krishna and H. Jobic for stimulating discussions, and NWO/NCF for computational resources.
References and Notes
(1) Skoulidas, A. I.; Sholl, D. S.J. Phys. Chem. A2003, 107, 10132-10141.
(2) Fritzsche, S.; Gaub, M.; Haberlandt, R.; Hofmann, G.J. Mol. Model.1996, 2, 286-292.
(3) Snurr, R. Q.; Bell, A. T.; Theodorou, D. N.J. Phys. Chem.1994,98, 11948-11961.
(4) Auerbach, S. M.Int. ReV. Phys. Chem.2000, 19, 155-198.(5) Ramanan, H.; Auerbach, S. M. InFluid Transport in Nanopores;
Fraissard, J., Conner, W. C., Eds.; NATO-ASI Series C; Kluwer AcademicPublishers: Dordrecht, The Netherlands, 2004.
(6) Jobic, H.; Karger, J.; Bee, M.Phys. ReV. Lett. 1999, 82, 4260-4263.
(7) Kaerger, J.; Ruthven, D. M.Diffusion in Zeolites and OtherMicroporous Solids; John Wiley & Sons: New York, 1992.
(8) Maginn, E. J.; Bell, A. T.; Theodorou, D. N.J. Phys. Chem.1996,100, 7155-7173.
(9) Krishna, R.; Baten, J. M.; van Dubbeldam, D.J. Phys. Chem. B2004, 108, 14820.
(10) Xiao, J.; Wei, J.Chem. Eng. Sci.1992, 47, 1123.(11) Fritzche, S.; Wolfsberg, M.; Haberlandt, R.; Demontis, P.; Suffritti,
G. B.; Tilocca, A.Chem. Phys. Lett.1998, 296, 253.(12) Saravanan, C.; Jousse, F.; Auerbach, S. M.Phys. ReV. Lett.1998,
80, 5754-5757.(13) Goodbody, S. J.; Watanabe, J. K.; Gowan, D. M.; Walton, J. P. R.
B.; Quirke, N.J. Chem. Soc., Faraday Trans.1991, 87, 1951.(14) Catlow, C. R. A.; Freeman, C. M.; Vessal, B.; Tomlinson, S. M.;
Leslie, M. J. Chem. Soc., Faraday Trans.1991, 87, 1947.(15) Nicholas, J. B.; Trouw, F. R.; Mertz, J. E.; Iton, L. E.; Hopfinger,
A. J. J. Phys. Chem.1993, 97, 4149.(16) Kar, S.; Chakravarty, C.J. Phys. Chem. A2001, 105, 5785-5793.(17) June, R. L.; Bell, A. T.; Theodorou, D. N.J. Phys. Chem.1990,
94, 8232-8240.(18) Tepper, H. L.; Briels, W. J.J. Chem. Phys.2002, 116, 9464-
9474.(19) Schu¨ring, A.; Auerbach, S. M.; Fritzsche, S.; Haberlandt, R.J.
Chem. Phys.2002, 116, 10890-10894.(20) Jousse, F.; Auerbach, S. M.J. Chem. Phys.1997, 107, 9629-9639.(21) Tunca, C.; Ford, D. M.J. Chem. Phys.1999, 111, 2751-2760.(22) Tunca, C.; Ford, D. M.J. Phys. Chem. B2002, 106, 10982-10990.(23) Tunca, C.; Ford, D. M.Chem. Eng. Sci.2003, 58, 3373-3383.(24) Ghorai, P. Kr.; Yashonath, S.J. Chem. Phys.2004, 120, 5315-
5321.(25) Heink, W.; Karger, J.; Pfeifer, H.; Salverda, P.; Datema, K. P.;
Nowak, A. J. Chem. Soc., Faraday Trans.1992, 88, 515-519.
Diffusion Coefficient of Methane in Nanoporous Materials J. Phys. Chem. B, Vol. 110, No. 45, 200622771

(26) June, R. L.; Bell, A. T.; Theodorou, D. N.J. Phys. Chem.1991,95, 8866-8878.
(27) Dubbeldam, D.; Calero, S.; Maesen, T. L. M.; Smit, B.Phys. ReV.Lett. 2003, 90, 245901.
(28) Dubbeldam, D.; Calero, S.; Maesen, T. L. M.; Smit, B.Angew.Chem., Int. Ed.2003, 42, 3624-3626.
(29) Caro, J.; Bulow, M.; Schirmer, W.; Karger, J.; Heink, W.; Pfeifer,H. J. Chem. Soc., Faraday Trans.1985, 81, 2541.
(30) Jobic, H.; Bee, M.; Caro, J.; Bulow, M.; Karger, J.J. Chem. Soc.,Faraday Trans.1989, 85, 4201.
(31) Kapteyn, F.; Bakker, W. J. W.; Zheng, G.; Moulijn, J. A.Chem.Eng. J.1995, 57, 145-153.
(32) Beerdsen, E.; Smit, B.; Dubbeldam, D.Phys. ReV. Lett.2004, 93,248301.
(33) Beerdsen, E.; Dubbeldam, D.; Smit, B.Phys. ReV. Lett.2005, 95,164505.
(34) Beerdsen, E.; Dubbeldam, D.; Smit, B.Phys. ReV. Lett.2006, 96,044501.
(35) Dubbeldam, D.; Beerdsen, E.; Vlugt, T. J. H.; Smit, B.J. Chem.Phys.2005, 122, 224712.
(36) Reed, D. A.; Ehrlich, G.Surf. Sci.1981, 102, 588-609.(37) Krishna, R.; Paschek, D.; Baur, R.Microporous Mesoporous Mater.
2004, 76, 233-246.(38) Papadopoulos, G. K.; Jobic, H.; Papadopoulos, D. N.J. Phys. Chem.
B 2004, 108, 12748-12756.(39) Krishna, R.; van Baten, J. M.Chem. Phys. Lett.2006, 420, 545-
549.(40) Krishna, R.; van Baten, J. M.Ind. Eng. Chem. Res.2006, 45, 2084-
2093.(41) Krishna, R.; Paschek, D.Chem. Phys. Lett.2001, 33, 278-284.(42) Krishna, R.; Smit, B.; Calero, S.Chem. Soc. ReV. 2002, 31, 185-
194.(43) Vlugt, T. J. H.; Krishna, R.; Smit, B.J. Phys. Chem. B1999, 103,
1102-1118.(44) Gorring, R. L.J. Catal.1973, 31, 13-26.(45) Nitsche, J. M.; Wei, J.AIChE. J.1991, 37, 661-670.(46) Runnebaum, R. C.; Maginn, E. J.J. Phys. Chem. B1997, 101,
6394-6408.(47) Talu, O.; Sun, M. S.; Shah, D. B.AIChE. J.1998, 44, 681-694.(48) Bezus, A. G.; Kiselev, A. V.; Lopatkin, A. A.; Du, P. Q. J.J. Chem.
Soc., Faraday Trans. 21978, 74, 367-379.(49) Ryckaert, J. P.; Bellemans, A.Faraday Dicuss.1978, 66, 95-106.(50) Dubbeldam, D.; Calero, S.; Vlugt, T. J. H.; Krishna, R.; Maesen,
T. L. M.; Beerdsen, E.; Smit, B.Phys. ReV. Lett. 2004, 93, 088302-1.(51) Dubbeldam, D.; Calero, S.; Vlugt, T. J. H.; Krishna, R.; Maesen,
T. L. M.; Smit, B. J. Phys. Chem. B2004, 108, 12301-12313.(52) Bennett, C. H. InDiffusion in Solids: Recent DeVelopments;
Nowick, A. S., Burton, J. J., Eds.; Academic Press; New York, 1975; pp73-113.
(53) Chandler, D.J. Chem. Phys.1978, 68, 2959.(54) Frenkel, D.; Smit, B.Understanding Molecular Simulation, 2nd
ed.; Academic Press: London, U.K., 2002.(55) Auerbach, S. M. InFluid Transport in Nanopores; Fraissard, J.,
Conner, W. C., Eds.; NATO-ASI Series C; Kluwer Academic Publishers;Dordrecht, The Netherlands, 2004.
(56) Maesen, T. L. M.; Schenk, M.; Vlugt, T. J. H.; de Jonge, J. P.;Smit, B. J. Catal.1999, 188, 403-412.
(57) http://www.iza-structure.org/databases/.(58) Pluth, J. J.; Smith, J. V.J. Am. Chem. Soc.1980, 102, 4704-
4708.(59) Gard, J. A.; Tait, J. M. InProceedings of the Third International
Conference on Molecular SieVes, Recent Progress Reports; Uytterhoven,J. B., Ed.; Leuven University Press: Zurich, Switzerland, 1973; pp 94-99.
(60) Calligaris, M.; Nardin, G.; Randaccio, L.Zeolites1986, 3, 205-208.
(61) Hriljac, J. J.; Eddy, M. M.; Cheetham, A. K.; Donohue, J. A.J.Solid State Chem.1993, 106, 66-72.
(62) Qiu, S.; Pang, W.; Kessler, H.; Guth, J. L.Zeolites1989, 9, 440-444.
(63) Fyfe, C. A.; Gies, H.; Kokotailo, G. T.; Marler, B.; Cox, D. E.J.Phys. Chem.1990, 94, 3718-3721.
(64) Barrer, R. M.; Villiger, H.Z. Kristallogr. 1969, 128, 352-270.(65) Patinec, V.; Wright, P. A.; Lightfoot, P.; Aitken, R. A.; Cox, P. A.
J. Chem. Soc., Dalton Trans.1999, 3909-3911.(66) van Koningsveld, H.; van Bekkum, H.; Jansen, J. C.Acta
Crystallogr.1987, B43, 127-132.(67) Pluth, J. J.; Smith, J. V.Am. Mineral.1990, 75, 501-507.(68) Liu, Z.; Ohsuna, T.; Terasaki, O.; Camblor, M. A.; Diaz-Cabanas,
M.; Hiraga, K.J. Am. Chem. Soc.2001, 123, 5370-5371.(69) Villaescusa, L. A.; Barrett, P. A.; Camblor, M. A.Angew. Chem.,
Int. Ed. 1999, 38, 1997-2000.
(70) Maesen, T. L. M.; Beerdsen, E.; Calero, S.; Dubbeldam, D.; Smit,B. J. Catal.2006, 237, 278-290.
(71) Ribeiro, F. R.; Rodriguez, A.; Rollmann, D.; Naccache, C. InZeolites: Science and Technology; Ribeiro, F. R., Ed.; Martinus NijhoffPublishers: The Hague, The Netherlands, 1984.
(72) Calero, S.; Schenk, M.; Dubbeldam, D.; Maesen, T. L. M.; Smit,B. J. Catal.2004, 228, 121-129.
(73) Bhatia, S.Zeolite Catalysis: Principles and Applications; CRCPress Inc.: Boca Raton, FL, 1990.
(74) Gupta, V.; Nivarthi, S. S.; Keffer, D.; McCormick, A. V.; Davis,H. T. Science1996, 274, 164-164.
(75) Gupta, V.; Nivarthi, S. S.; McCormick, A. V.; Davis, H. T.Chem.Phys. Lett.1995, 247, 596-600.
(76) Hahn, K.; Karger, J.J. Phys. Chem. B1998, 102, 5766-5771.(77) Jobic, H.; Hahn, K.; Karger, J.; Bee, M.; Tuel, A.; Noack, M.;
Girnus, I.; Kearley, G. J.J. Phys. Chem. B1997, 101, 5834-5841.(78) Demontis, P.; Gonzalez, J. G.; Suffritti, G. B.; Tilocca, A.J. Am.
Chem. Soc.2001, 123, 5069-5074.(79) Tepper, H. L.; Hoogenboom, J. P.; van der Vegt, N. F. A.; Briels,
W. J. J. Chem. Phys.1999, 110, 11511-11516.(80) MacElroy, J. M. D.; Suh, S. H.J. Chem. Phys.1997, 106, 8595-
8597.(81) Nelson, P. H.; Auerbach, S. M.Chem. Eng. J.1999, 74, 43-56.(82) Nelson, P. H.; Auerbach, S. M.J. Chem. Phys.1999, 110, 9235-
9243.(83) Sholl, D. S.; Fichthorn, K. A.J. Chem. Phys.1997, 107, 4384-
4389.(84) Dume, C.; Holderick, W. F.Appl. Catal., A1999, 167, 183-193.(85) Schenk, M.; Calero, S.; Maesen, T. L. M.; van Benthem, L.;
Verbeek, M. G.; Smit, B.Angew. Chem., Int. Ed.2002, 41, 2500-2502.(86) Davis, M. E.Nature (London)2002, 417, 813-821.(87) Zhang, W.; Smirniotis, P. G.Catal. Lett.1999, 60, 223-228.(88) Triantafillou, N. D.; Miller, J. T.; Gates, B. C.J. Catal.1995, 155,
131-140.(89) Demontis, P.; Suffritti, G. B.J. Phys. Chem. B1997, 101, 5789-
5793.(90) Schu¨ring, A.; Auerbach, S. M.; Fritzsche, S.; Haberlandt, R.J.
Chem. Phys.2002, 116, 10890-10894.(91) Maris, T.; Vlugt, T. J. H.; Smit, B.J. Phys. Chem. B1998, 102,
7183-7189.(92) Pascual, P.; Ungerer, P.; Tavitian, B.; Pernot, P.; Boutin, A.Phys.
Chem. Chem. Phys.2003, 5, 3684-3693.(93) Sun, M. S.; Talu, O.; Shah, D. B.AIChE. J.1996, 42, 3001.(94) Talu, O.; Sun, M. S.; Shah, D. B.AIChE. J.1998, 44, 681-694.(95) Vasenkov, S.; Ka¨rger, J.Microporous Mesoporous Mater.2002,
55, 139-145.(96) Vasenkov, S.; Bo¨hlmann, W.; Galvosas, P.; Geier, O.; Liu, H.;
Karger, J.J. Phys. Chem. B2001, 105, 5922-5927.(97) Mosell, T.; Schrimpf, G.; Brickmann, J.J. Phys. Chem. B1997,
101, 9476-9484.(98) Mosell, T.; Schrimpf, G.; Brickmann, J.J. Phys. Chem. B1997,
101, 9485-9494.(99) Saravanan, C.; Auerbach, S. M.J. Chem. Phys.1997, 107, 8120-
8131.(100) Saravanan, C.; Auerbach, S. M.J. Chem. Phys.1997, 107, 8132-
8137.(101) Saravanan, C.; Jousse, F.; Auerbach, S. M.J. Chem. Phys.1998,
108, 2162-2169.(102) Bandyopadhyay, S.; Yashonath, S.Chem. Phys. Lett.1994, 223,
363-368.(103) Chempath, S.; Krishna, R.; Snurr, R. Q.J. Phys. Chem. B2004,
108, 13481-13491.(104) Clark, L. A.; Ye, G. T.; Gupta, A.; Hall, L. L.; Snurr, R. Q.J.
Chem. Phys.1999, 111, 1209-1222.(105) Sanborn, M. J.; Snurr, R. Q.Sep. Purif. Technol.2000, 20, 1-13.(106) Sanborn, M. J.; Snurr, R. Q.AIChE J.2001, 47, 2032-2041.(107) Yashonath, S.; Demontis, P.; Klein, M. L.Chem. Phys. Lett.1988,
153, 551-555.(108) Yashonath, S.; Thomas, J. M.; Nowak, A. K.; Cheetham, A. K.
Nature1988, 331, 601-604.(109) Snyder, M. A.; Vlachos, D. G.J. Chem. Phys.2005, 123, 184708.(110) van Baten, J. M.; Krishna, R.Microporous Mesoporous Mater.
2005, 84, 179-191.(111) Krishna, R.; Vlugt, T. J. H.; Smit, B.Chem. Eng. Sci.1999, 54,
1751-1757.(112) Karger, J.; Pfeifer, H.; Rauscher, M.; Walter, A.J. Chem. Soc.,
Faraday1980, 76, 717-737.(113) Skoulidas, A. I.; Ackerman, D. M.; Johnson, J. K.; Sholl, D. S.
Phys. ReV. Lett. 2002, 89, 185901.
22772 J. Phys. Chem. B, Vol. 110, No. 45, 2006 Beerdsen et al.