load bearing steel intensive basement - giken · load bearing steel intensive basement - press-in...
TRANSCRIPT
LOAD BEARING STEEL INTENSIVE BASEMENT - Press-in Method and Thorough Inspection Technique -
Case Study
Table of Contents
Chapter1 Design Criteria ············································································································ 1
Chapter2 General Layout of Basement and Ground Conditions ···················································· 2
Chapter3 PPT (Pile Penetration Testing) Process for Bearing Capacity Assurance ··························· 3
Chapter4 Test Piling and Static Load Testing (Sheet Pile) ································································ 5
4-1 Installation of Test Piles (unclutched piles): T1-T8 ···················································· 5
4-2 Extraction of Test Pile T1 and T6 (7 days after their installation) ······························· 6
4-3 Calculation of Maximum Test Load in Static Load Testing ········································· 6
4-4 Static Load Testing Results ····················································································· 7
4-5 Analysis by Fleming Method ·················································································· 8
4-6 Back Analysis ······································································································ 11
4-7 Conclusion ········································································································· 12
Chapter5 Test Piling and Static Load Testing (Tubular Pile)···························································· 12
5-1 Installation of Test Piles: W28 and W86 ································································ 12
5-2 Calculation of Maximum Test Load in Static Load Testing ······································· 12
5-3 Static Load Testing Results ··················································································· 13
5-4 Analysis by Fleming Method ················································································ 14
5-5 Back Analysis ······································································································ 17
5-6 Conclusion ········································································································· 17
Chapter 6 Quality Control Procedure for Pile Installation ·························································· 18
6-1 Sheet Pile ········································································································· 18
6-2 Tubular Pile ······································································································ 19
Chapter 7 Slab Connection ····································································································· 21
7-1 Sheet Pile Wall ································································································· 21
7-2 Tubular Pile Wall ······························································································· 22
Chapter 8 Waterproofing ······································································································· 23

1
Design Criteria
Design Life of Retaining Wall 100 years
Basement Grade (BS 8102:2009) Grade 1 (Car Park) and Grade 3 (Other area)
Working Load on Retaining Wall 500kN/m run (300kN/pile) on U sheet pile wall and 1,100kN/m run
(1,075kN/pile) on tubular pile wall
Surcharge Loading behind Retaining Wall 10kN/m2
Movement under Lateral Loads Limit of vertical movement of wall elements; 25mm
Limit of horizontal movement of wall elements; 20mm
Limit of differential movement between adjacent columns and basement;
1 in 500
Piling Tolerances Deviation in plan normal to the wall line at the top of the pile; ±25mm
Deviation of verticality along line of piles; 1 in 100
Table 1
Note : Basement Grade (BS 8102:2009) Grade Example of use of structureA) Performance level
1 Car parking; plant rooms (excluding Electrical
equipment); workshops
Some seepage and damp areas tolerable, dependent on
the intended useB)
Local drainage might be necessary to deal with seepage
2 Plant rooms and workshops requiring a drier
environment (than Grade 1); storage areas
No water penetration acceptable
Damp areas tolerable; ventilation might be required
3 Ventilated residential and commercial areas,
including office restaurant etc.; leisure centres
No water penetration acceptable
Ventilation, dehumidification or air conditioning
necessary, appropriate to the intended use A) The previous edition of this standard referred to Grade 4 environments. However, this grade retained as its only
difference from Grade 3 is the performance level related to ventilation, dehumidification or air conditioning (see
BS5454 for recommendations for the storage and exhibition of archival documents). The structural form for Grade 4
could be the same or similar to Grade 3.
B) Seepage and damp areas for some forms of construction can be quantified by reference to industry standards, such as
the ICE’s Specification for piling and embedded retaining walls.
Table 2

2
General Layout of Basement and Ground Conditions
Figure 1
U SHEET PILE PU22-1 L=12.8m
MADE GROUND
MUDSTONE
sandy GRAVEL
gravelly CLAY
SILTSTONE
UCS=26-35MPa
TUBULAR PILE Ø914xt22 L=15.755m
SPT N Value
LEVEL B1
LEVEL B1
LEVEL B2
LEVEL B2
3
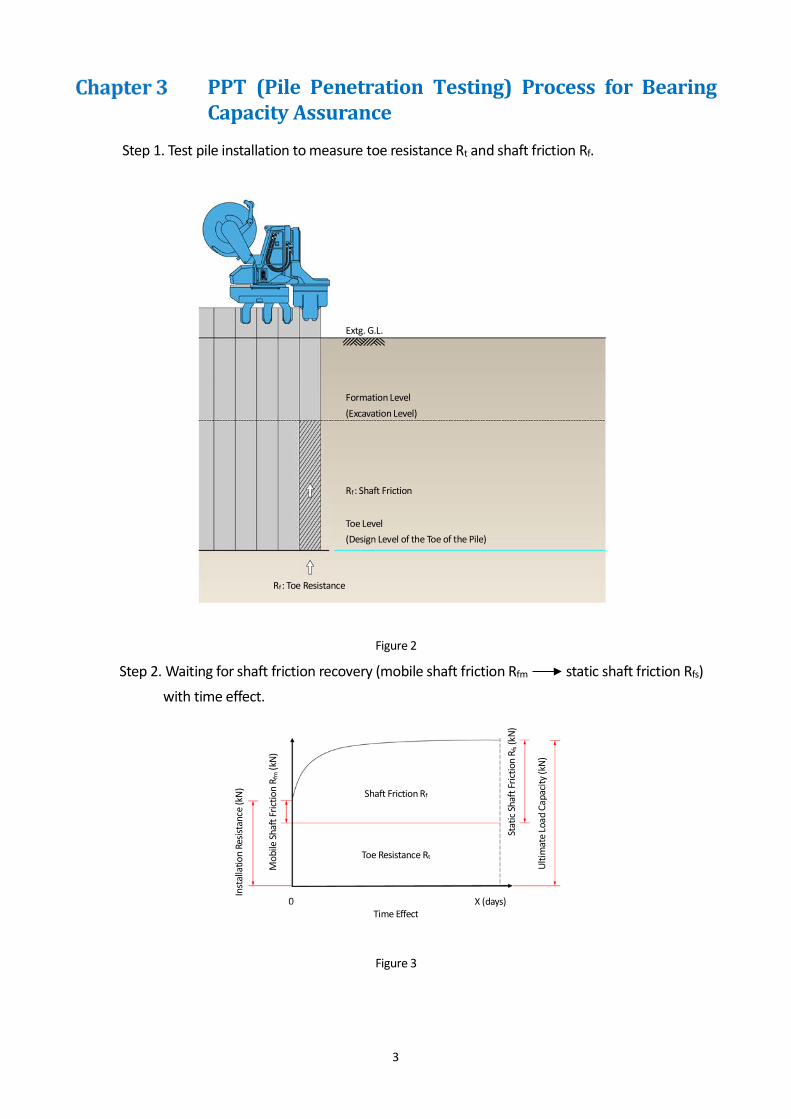
PPT (Pile Penetration Testing) Process for Bearing Capacity Assurance
Step 1. Test pile installation to measure toe resistance Rt and shaft friction Rf.
Figure 2
Step 2. Waiting for shaft friction recovery (mobile shaft friction Rfm static shaft friction Rfs) with time effect.
Figure 3
Shaft Friction Rf
Toe Resistance Rt
Time Effect
Inst
alla
tion
Resis
tanc
e (k
N)
Mob
ile S
haft
Frict
ion
R fm
(kN)
Extg. G.L.
Formation Level (Excavation Level)
Rf : Shaft Friction
Toe Level (Design Level of the Toe of the Pile)
Rf : Toe Resistance
Stat
ic Sh
aft F
rictio
n R f
s (kN
)
Ultim
ate
Load
Cap
acity
(kN)
X (days)
4
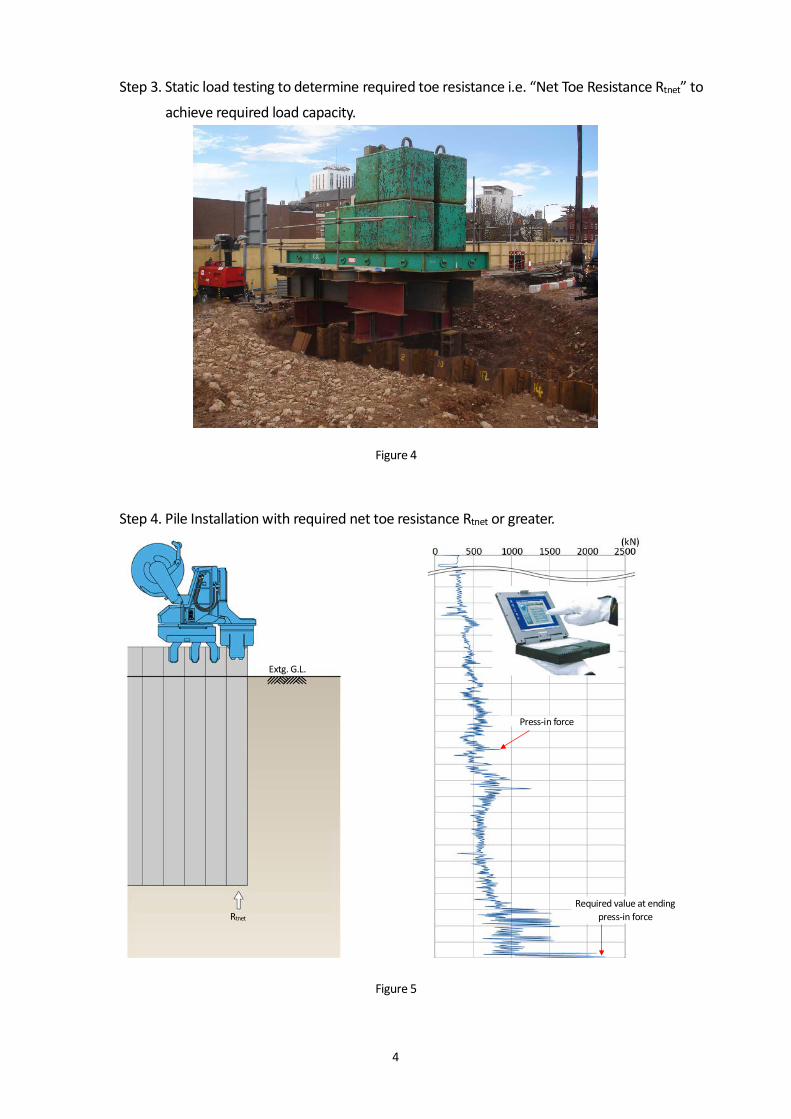
Step 3. Static load testing to determine required toe resistance i.e. “Net Toe Resistance Rtnet” to
achieve required load capacity.
Figure 4
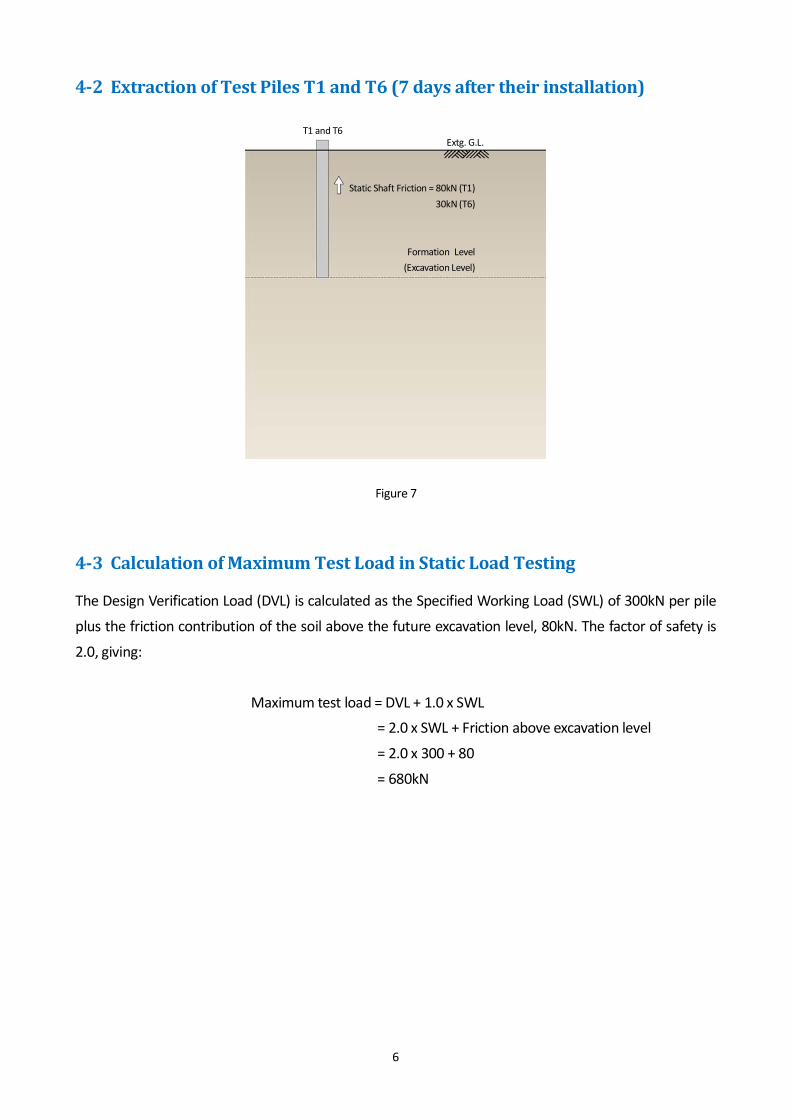
Step 4. Pile Installation with required net toe resistance Rtnet or greater.
Figure 5
Extg. G.L.
Rtnet
Press-in force
Required value at ending
press-in force

5
Table 3
Test Piling and Static Load Testing (Sheet Pile)
Installation of Test Piles (unclutched piles) : T1-T8
Figure 6
T1 T2 T3 T4 T5 T6 T7 T8
Net Toe Resistance N/A 90 kN 290 kN 400 kN 480 kN N/A 190 kN 180 kN
Table 4
Type of Pile Ultimate Load
(kN/pile)
Specified
Working Load
(kN/pile)
FOS Required Net Toe Resistance (Rtnet) to achieve
specified load capacity (kN/pile)
Sheet Pile 600 300 2.0 230 Tubular Pile 2,150 1,075 2.0 650
T1 and T6 T2 - T5,
T7 and T8
Extg. G.L.
Formation Level (Excavation Level)
Toe Level (Design Level of
the Toe of the Pile)
Net Toe Resistance
Net Toe Resistance
6
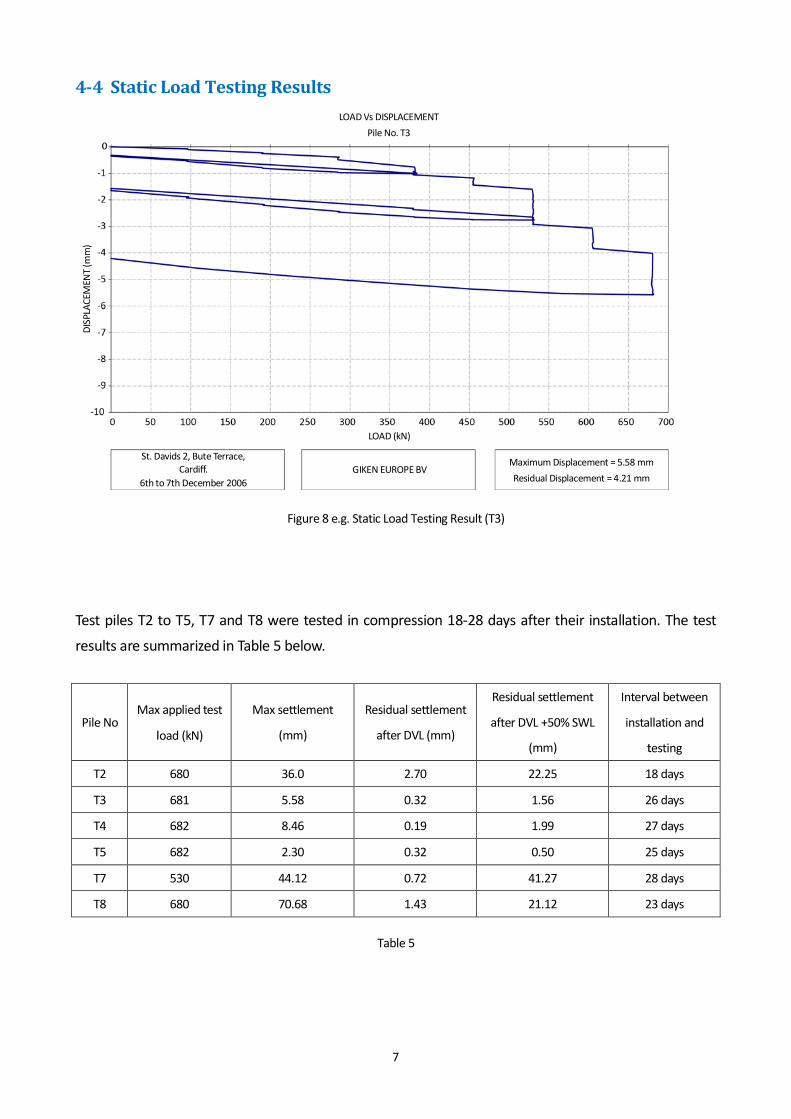
Extraction of Test Piles T1 and T6 (7 days after their installation)
Figure 7
Calculation of Maximum Test Load in Static Load Testing
The Design Verification Load (DVL) is calculated as the Specified Working Load (SWL) of 300kN per pile
plus the friction contribution of the soil above the future excavation level, 80kN. The factor of safety is
2.0, giving:
Maximum test load = DVL + 1.0 x SWL = 2.0 x SWL + Friction above excavation level
= 2.0 x 300 + 80
= 680kN
T1 and T6 Extg. G.L.
Static Shaft Friction = 80kN (T1) 30kN (T6)
Formation Level (Excavation Level)
7
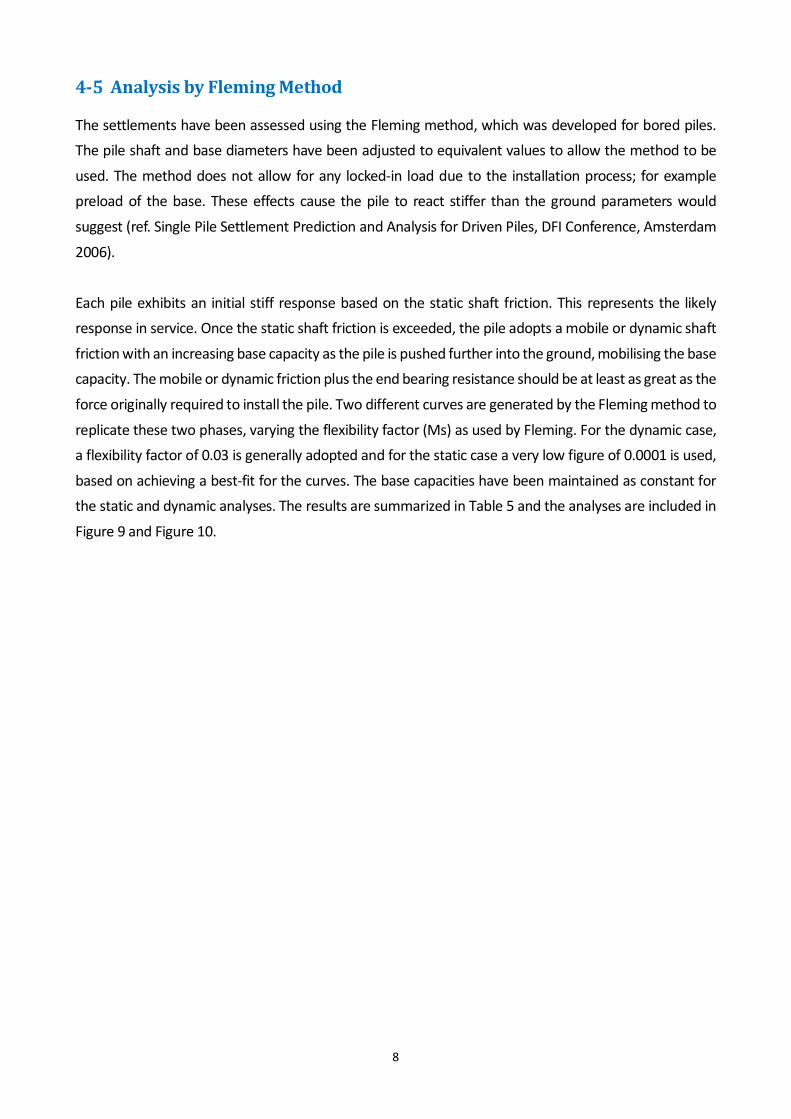
Static Load Testing Results
Figure 8 e.g. Static Load Testing Result (T3)
Test piles T2 to T5, T7 and T8 were tested in compression 18-28 days after their installation. The test
results are summarized in Table 5 below.
Pile No Max applied test
load (kN)
Max settlement
(mm)
Residual settlement
after DVL (mm)
Residual settlement
after DVL +50% SWL
(mm)
Interval between
installation and
testing
T2 680 36.0 2.70 22.25 18 days
T3 681 5.58 0.32 1.56 26 days
T4 682 8.46 0.19 1.99 27 days
T5 682 2.30 0.32 0.50 25 days
T7 530 44.12 0.72 41.27 28 days
T8 680 70.68 1.43 21.12 23 days
Table 5
LOAD Vs DISPLACEMENT Pile No. T3
GIKEN EUROPE BV St. Davids 2, Bute Terrace,
Cardiff. 6th to 7th December 2006
Maximum Displacement = 5.58 mm Residual Displacement = 4.21 mm
DISP
LACE
MEN
T (m
m)
LOAD (kN)
8
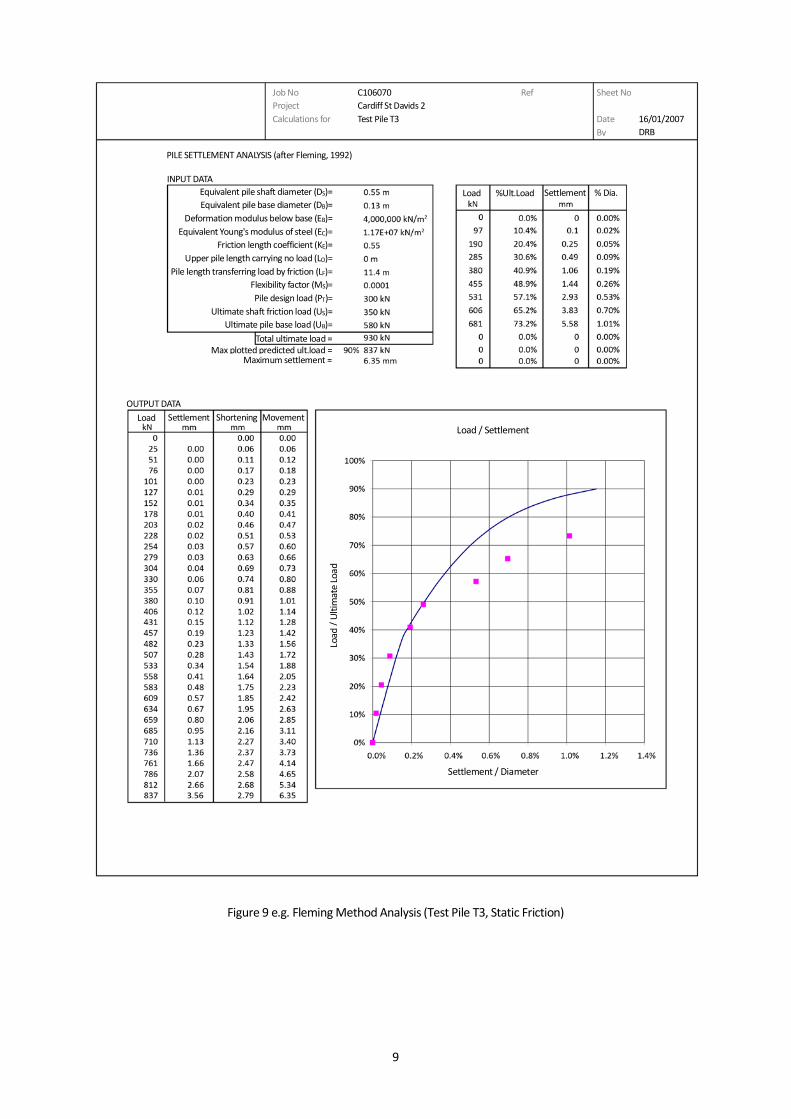
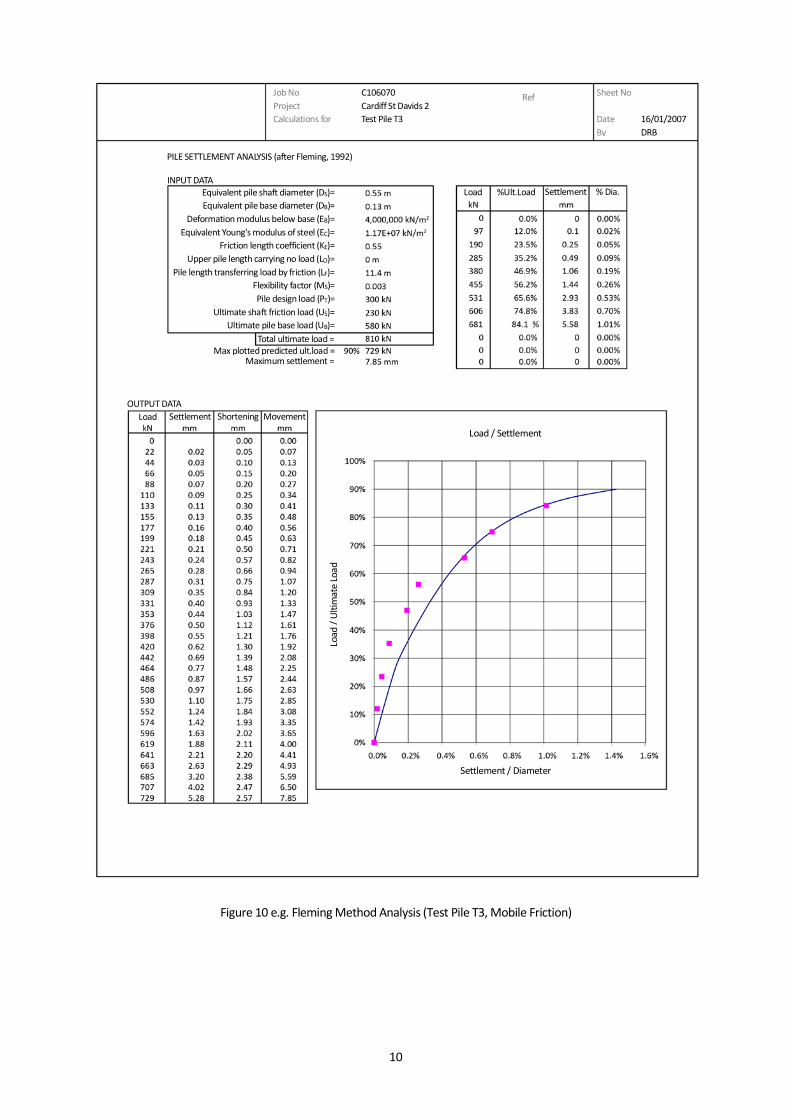
Analysis by Fleming Method
The settlements have been assessed using the Fleming method, which was developed for bored piles.
The pile shaft and base diameters have been adjusted to equivalent values to allow the method to be
used. The method does not allow for any locked-in load due to the installation process; for example
preload of the base. These effects cause the pile to react stiffer than the ground parameters would
suggest (ref. Single Pile Settlement Prediction and Analysis for Driven Piles, DFI Conference, Amsterdam
2006).
Each pile exhibits an initial stiff response based on the static shaft friction. This represents the likely
response in service. Once the static shaft friction is exceeded, the pile adopts a mobile or dynamic shaft
friction with an increasing base capacity as the pile is pushed further into the ground, mobilising the base
capacity. The mobile or dynamic friction plus the end bearing resistance should be at least as great as the
force originally required to install the pile. Two different curves are generated by the Fleming method to
replicate these two phases, varying the flexibility factor (Ms) as used by Fleming. For the dynamic case, a flexibility factor of 0.03 is generally adopted and for the static case a very low figure of 0.0001 is used,
based on achieving a best-fit for the curves. The base capacities have been maintained as constant for the static and dynamic analyses. The results are summarized in Table 5 and the analyses are included in
Figure 9 and Figure 10.
9
Figure 9 e.g. Fleming Method Analysis (Test Pile T3, Static Friction)
Job No Project Calculations for
C106070 Cardiff St Davids 2 Test Pile T3
Ref Sheet No Date By
16/01/2007 DRB
Equivalent pile shaft diameter (DS)= Equivalent pile base diameter (DB)=
Deformation modulus below base (EB)= Equivalent Young's modulus of steel (EC)=
Friction length coefficient (KE)= Upper pile length carrying no load (LO)=
Pile length transferring load by friction (LF)= Flexibility factor (MS)= Pile design load (PT)=
Ultimate shaft friction load (US)= Ultimate pile base load (UB)=
Total ultimate load = Max plotted predicted ult.load =
Maximum settlement =
Load %Ult.Load Settlement % Dia.
Load Settlement Shortening Movement Load / Settlement
Load
/ Ul
timat
e Lo
ad
Settlement / Diameter
PILE SETTLEMENT ANALYSIS (after Fleming, 1992)
INPUT DATA
OUTPUT DATA
10
Figure 10 e.g. Fleming Method Analysis (Test Pile T3, Mobile Friction)
Job No Project Calculations for
C106070 Cardiff St Davids 2 Test Pile T3
Ref
16/01/2007 DRB
Sheet No Date By
PILE SETTLEMENT ANALYSIS (after Fleming, 1992)
INPUT DATA Equivalent pile shaft diameter (DS)= Equivalent pile base diameter (DB)=
Deformation modulus below base (EB)= Equivalent Young's modulus of steel (EC)=
Friction length coefficient (KE)= Upper pile length carrying no load (LO)=
Pile length transferring load by friction (LF)= Flexibility factor (MS)= Pile design load (PT)=
Ultimate shaft friction load (US)= Ultimate pile base load (UB)=
Maximum settlement = Max plotted predicted ult.load =
Total ultimate load =
Settlement / Diameter
OUTPUT DATA
Load / Settlement
Load %Ult.Load Settlement % Dia.
Load Settlement Shortening Movement
Load
/ Ul
timat
e Lo
ad
11
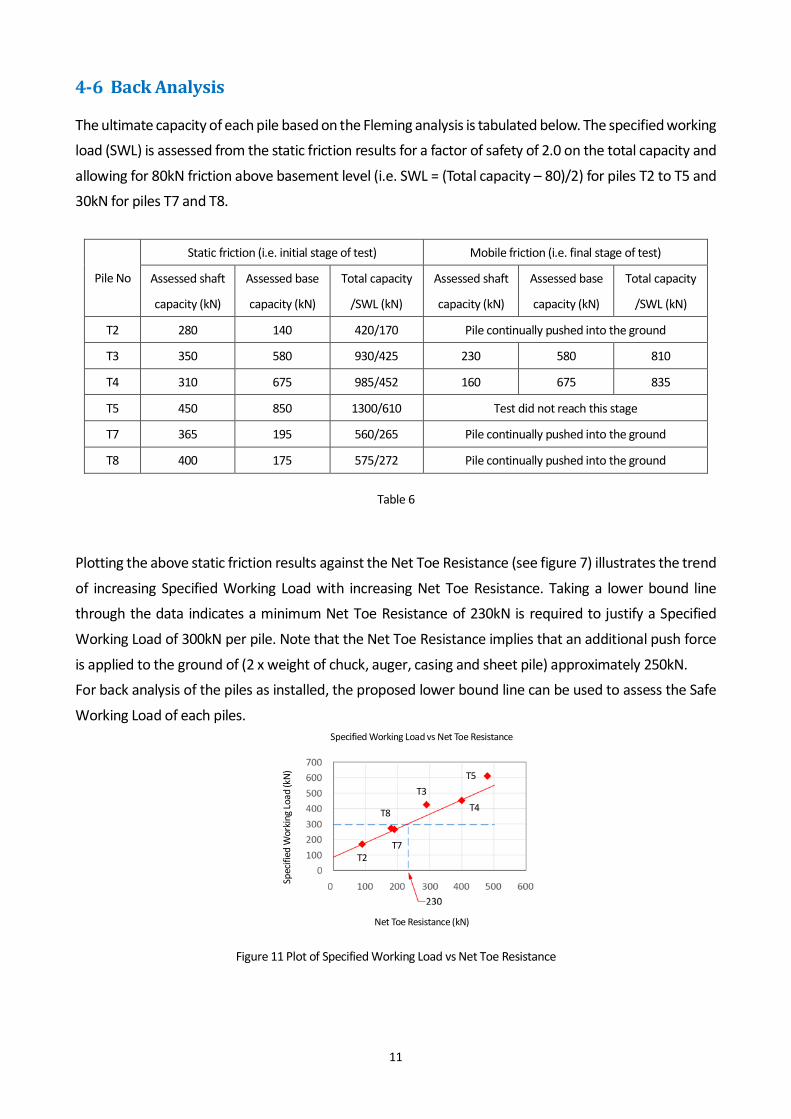
Back Analysis
The ultimate capacity of each pile based on the Fleming analysis is tabulated below. The specified working
load (SWL) is assessed from the static friction results for a factor of safety of 2.0 on the total capacity and
allowing for 80kN friction above basement level (i.e. SWL = (Total capacity – 80)/2) for piles T2 to T5 and
30kN for piles T7 and T8.
Pile No
Static friction (i.e. initial stage of test) Mobile friction (i.e. final stage of test)
Assessed shaft
capacity (kN)
Assessed base
capacity (kN)
Total capacity
/SWL (kN)
Assessed shaft
capacity (kN)
Assessed base
capacity (kN)
Total capacity
/SWL (kN)
T2 280 140 420/170 Pile continually pushed into the ground
T3 350 580 930/425 230 580 810
T4 310 675 985/452 160 675 835
T5 450 850 1300/610 Test did not reach this stage
T7 365 195 560/265 Pile continually pushed into the ground
T8 400 175 575/272 Pile continually pushed into the ground
Table 6
Plotting the above static friction results against the Net Toe Resistance (see figure 7) illustrates the trend
of increasing Specified Working Load with increasing Net Toe Resistance. Taking a lower bound line through the data indicates a minimum Net Toe Resistance of 230kN is required to justify a Specified
Working Load of 300kN per pile. Note that the Net Toe Resistance implies that an additional push force
is applied to the ground of (2 x weight of chuck, auger, casing and sheet pile) approximately 250kN. For back analysis of the piles as installed, the proposed lower bound line can be used to assess the Safe
Working Load of each piles.
Figure 11 Plot of Specified Working Load vs Net Toe Resistance
Specified Working Load vs Net Toe Resistance
Spec
ified
Wor
king
Load
(kN)
Net Toe Resistance (kN)
T2
T8
T7
T3 T4
T5
12
Conclusion
All the test piles illustrate that the ground is capable of supporting the required ultimate load. The
settlement at working load is approximately 1mm for all piles except T2, T7 and T8, which settle up to 4
mm.
The predicted ultimate capacity is satisfactory for all piles except for T2, T7 and T8 (the Net Toe Resistance
applied to these piles is less than the recommended 230 kN). Plotting the data indicates a lower bound
design line for the relationship between Net Toe Resistance and Specified Working Load, giving a
minimum Net Toe Resistance of 230kN for a specified working load of 300kN per pile (with a factor of
safety of 2.0)
Test Piling and Static Load Testing (Tubular Pile)
Installation of Test Piles : W28 and W86
The test piles, W28 and W86, were installed at the initial stage of the tubular pile installation works. They
have already been used as a part of the proposed basement wall. The status of the test piles is as follows.
Pile No. Profile Top of Pile
(mOD)
Toe Level
(mOD)
Pile Length
(m)
Formation Level
(mOD)
W28 φ 914mm O.D. x 20mm 8.755 - 4.1 12.855 2.055
W86 φ 914mm O.D. x 20mm 9.255 - 3.0 12.255 1.605
Table 7
Calculation of Maximum Test Load in Static Load Testing
The Design Verification Load (DVL) is calculated as the Specified Working Load (SWL) of 1,075kN per pile plus the friction contribution of the soil above the future excavation level, 414kN*. The factor of safety is
2.0, giving:
Maximum test load = DVL + 1.0 x SWL
= 2.0 x SWL + Friction above excavation level
= 2.0 x 1,075 + 414
= 2,564kN
13
* The calculation method for static skin friction, assuming cohesionless material is based on the effective
vertical stress and a conversion factor to horizontal shaft friction of Ks.tanδ. Taking ground water level at
a conservatively low level of 6m below ground level and assuming a range of values for Ks.tanδ
calculation sheets gives a static skin friction from ground level to excavation level of between 207kN and
414kN. The lower values compare well with the measured dynamic friction. It is proposed to adopt the
higher value as the value of skin friction and allow for this value in the pile test, such that it is not necessary
to undertake a separate test to determine the value of the skin friction.
Static Load Testing Results
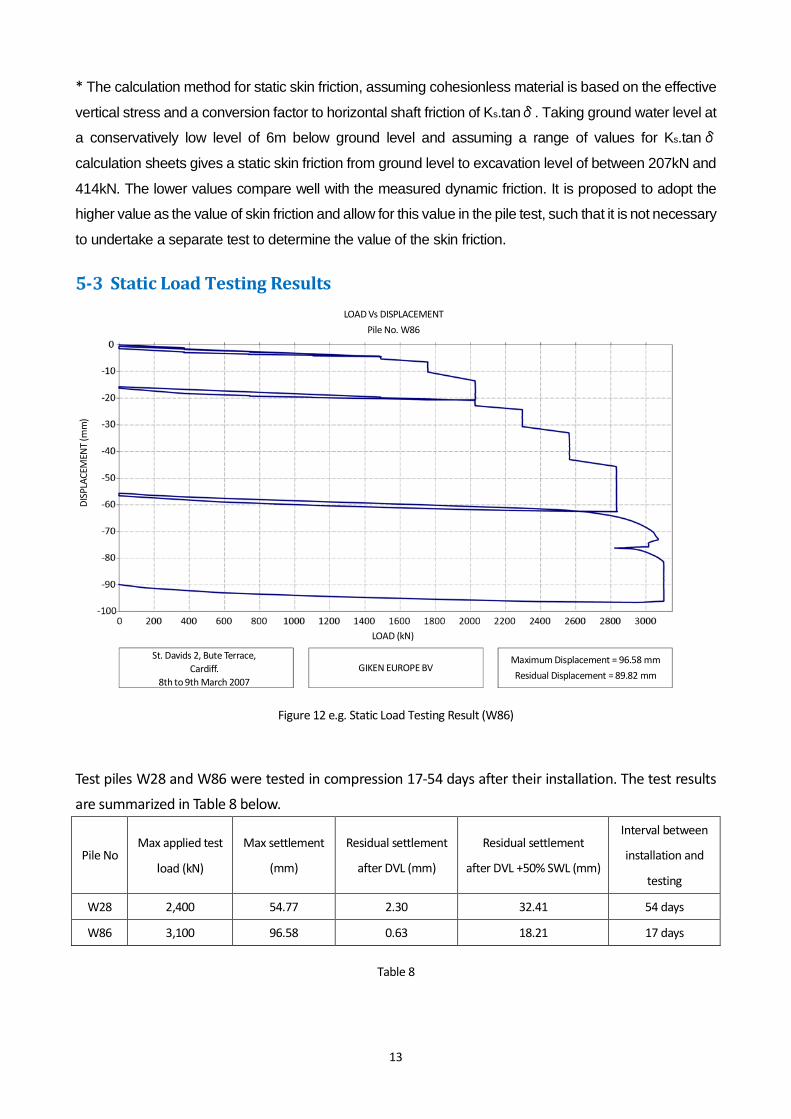
Figure 12 e.g. Static Load Testing Result (W86)
Test piles W28 and W86 were tested in compression 17-54 days after their installation. The test results are summarized in Table 8 below.
Pile No Max applied test
load (kN)
Max settlement
(mm)
Residual settlement
after DVL (mm)
Residual settlement
after DVL +50% SWL (mm)
Interval between
installation and
testing
W28 2,400 54.77 2.30 32.41 54 days
W86 3,100 96.58 0.63 18.21 17 days
Table 8
LOAD Vs DISPLACEMENT Pile No. W86
DISP
LACE
MEN
T (m
m)
St. Davids 2, Bute Terrace, Cardiff.
8th to 9th March 2007
GIKEN EUROPE BV Maximum Displacement = 96.58 mm Residual Displacement = 89.82 mm
LOAD (kN)
14
Analysis by Fleming Method
Pile W28 The analysis using the Fleming method indicates that the pile behaved normally up to about 2,000kN.
The Fleming curve fits the data up to 1,758kN, but not for 2,028kN and 2,300kN. Beyond about 2,000kN,
the pile is pushed further into the ground, replicating the installation process and further load is sustained
at greater depth. The back analysis indicates an ultimate shaft friction of 650kN and ultimate base
capacity of 1,400kN, giving a total capacity of 2,050kN.
Pile W86 The initial settlement readings are rather high, suggesting that perhaps there is a “bedding-in” settlement
for this pile of the order of 1mm. The analysis using the Fleming method indicates that the pile behaved
normally up to about 2,000kN. The back analysis of the initial stages of the test, when static friction
conditions exist, indicates an ultimate shaft friction of 800kN and ultimate base capacity of 1,250kN,
giving a total capacity of 2,050kN. Once the initial static friction is exceeded, the friction reduces to a dynamic value (350kN) and as the pile is pushed into the ground, the end bearing capacity increases to
2,875kN, using the Fleming curve-fitting procedure.
Pile No
Static friction (i.e. initial stage of test) Mobile friction (i.e. final stage of test)
Assessed shaft
capacity (kN)
Assessed base
capacity (kN)
Total
capacity(kN)
Assessed shaft
capacity (kN)
Assessed base
capacity (kN)
Total
capacity (kN)
W28 650 1400 2050 Pile continually pushed into the ground
W86 800 1250 2050 350 2875 3225
Table 9

15
Figure 13
Equivalent pile shaft diameter (DS)= Equivalent pile base diameter (DB)=
Deformation modulus below base (EB)= Equivalent Young's modulus of steel (EC)=
Friction length coefficient (KE)= Upper pile length carrying no load (LO)=
Pile length transferring load by friction (LF)= Flexibility factor (MS)= Pile design load (PT)=
Ultimate shaft friction load (US)= Ultimate pile base load (UB)=
Maximum settlement = Max plotted predicted ult.load =
Total ultimate load =
Load
Load
%Ult.Load Settlement
Settlement
% Dia.
Shortening Movement Load / Settlement
Load
/ Ul
timat
e Lo
ad
Settlement / Diameter
Job No Project Calculations for
C106070 Cardiff St Davids 2 Tubular Test Pile W28
Ref Sheet No Date By
12/03/2007 DRB
TONY GEE and PARTNERS Consulting Engineers
Cobham Surrey Ashford Kent
Halesowen W.Midlands
PILE SETTLEMENT ANALYSIS (after Fleming, 1992)
INPUT DATA
OUTPUT DATA

16
Figure 14
Job No Project Calculations for
C106070 Cardiff St Davids 2 Tubular test pile W86
Ref Sheet No Date By
12/03/2007 DRB
TONY GEE and PARTNERS Consulting Engineers
Cobham Surrey Ashford Kent
Halesowen W.Midlands
Equivalent pile shaft diameter (DS)= Equivalent pile base diameter (DB)=
Deformation modulus below base (EB)= Equivalent Young's modulus of steel (EC)=
Friction length coefficient (KE)= Upper pile length carrying no load (LO)=
Pile length transferring load by friction (LF)= Flexibility factor (MS)= Pile design load (PT)=
Ultimate shaft friction load (US)= Ultimate pile base load (UB)=
Maximum settlement = Max plotted predicted ult.load =
Total ultimate load =
Load
Load
%Ult.Load Settlement
Settlement
% Dia.
Shortening Movement Load / Settlement
Load
/ Ul
timat
e Lo
ad
Settlement / Diameter
PILE SETTLEMENT ANALYSIS (after Fleming, 1992)
INPUT DATA
OUTPUT DATA
Assessed settlement at zero load = 1.20 mm
17
Back Analysis
For the purposes of back analysis of the as-built piles, the recorded net push force can be compared to
the pile capacity. To determine the skin friction from ground level to basement level, take the average of
the uplift force measured for piles W1 to W97 (498kN) and deduct the weight of the pile, chuck and auger
(258kN) to give 240kN as the average skin friction down to basement level.
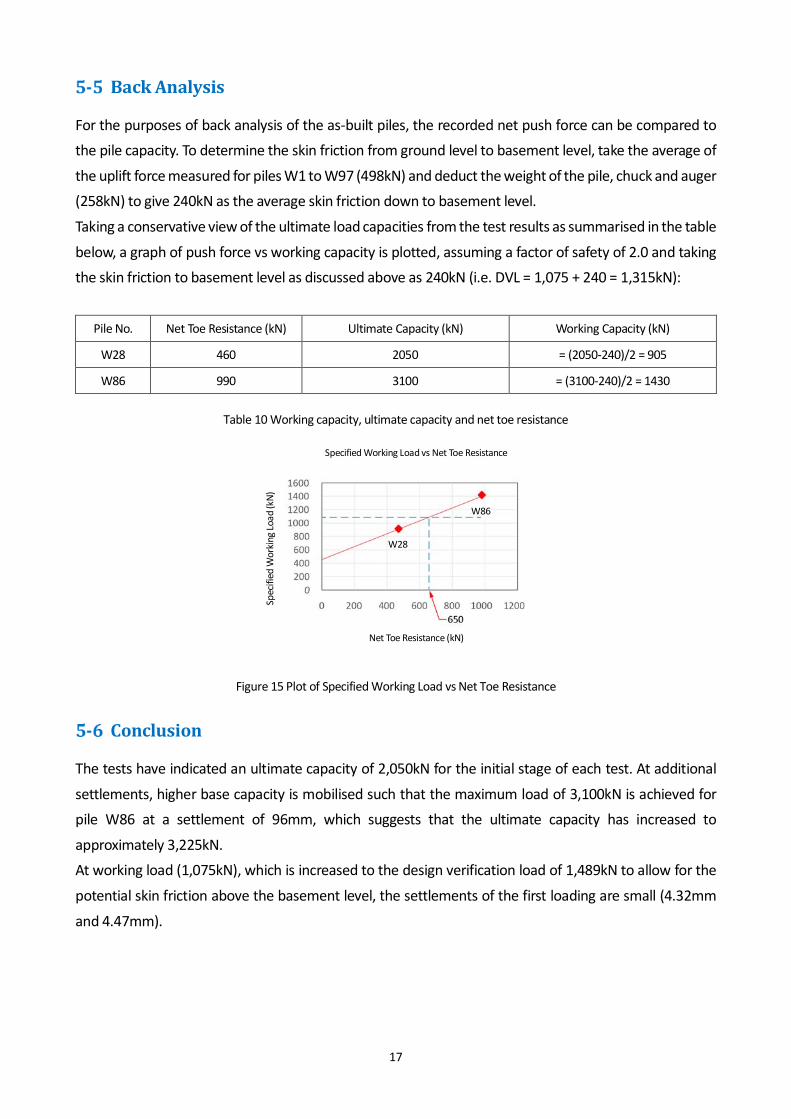
Taking a conservative view of the ultimate load capacities from the test results as summarised in the table
below, a graph of push force vs working capacity is plotted, assuming a factor of safety of 2.0 and taking
the skin friction to basement level as discussed above as 240kN (i.e. DVL = 1,075 + 240 = 1,315kN):
Pile No. Net Toe Resistance (kN) Ultimate Capacity (kN) Working Capacity (kN)
W28 460 2050 = (2050-240)/2 = 905
W86 990 3100 = (3100-240)/2 = 1430
Table 10 Working capacity, ultimate capacity and net toe resistance
Figure 15 Plot of Specified Working Load vs Net Toe Resistance
Conclusion
The tests have indicated an ultimate capacity of 2,050kN for the initial stage of each test. At additional
settlements, higher base capacity is mobilised such that the maximum load of 3,100kN is achieved for
pile W86 at a settlement of 96mm, which suggests that the ultimate capacity has increased to
approximately 3,225kN.
At working load (1,075kN), which is increased to the design verification load of 1,489kN to allow for the
potential skin friction above the basement level, the settlements of the first loading are small (4.32mm
and 4.47mm).
Specified Working Load vs Net Toe Resistance
Spec
ified
Wor
king
Load
(kN)
Net Toe Resistance (kN)
W28
W86
18
Quality Control Procedure for Pile Installation
Sheet Pile
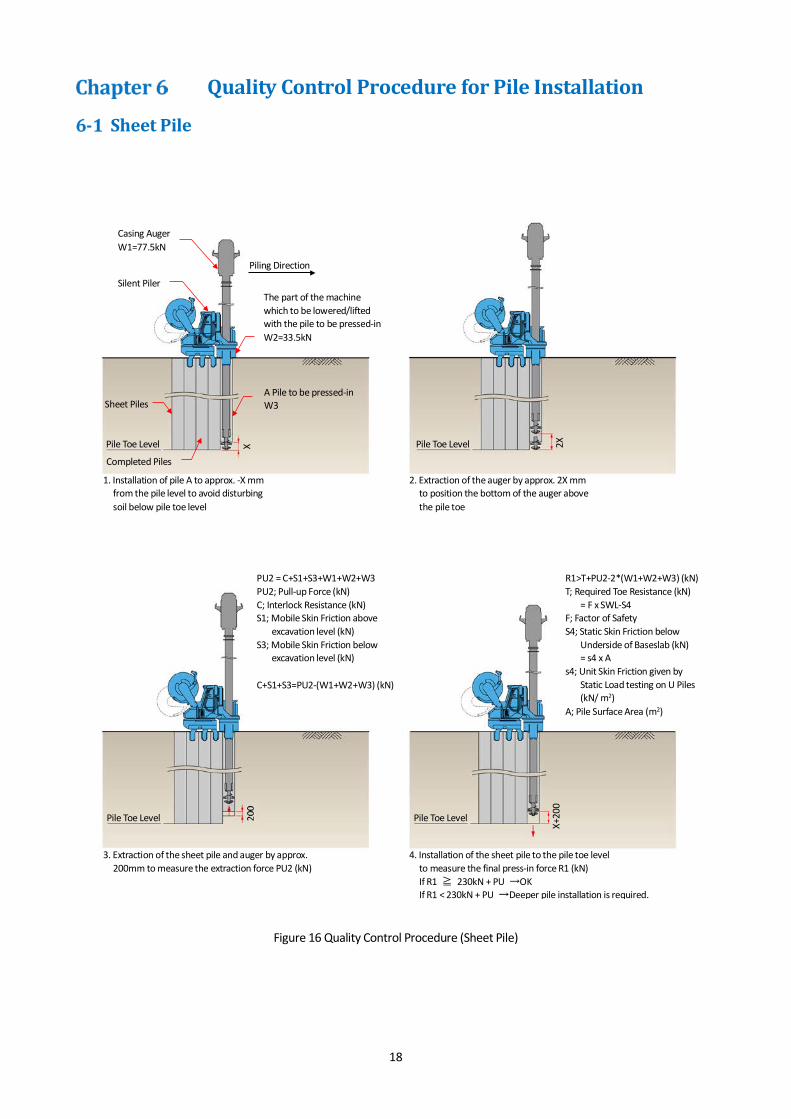
Figure 16 Quality Control Procedure (Sheet Pile)
Piling Direction
The part of the machine which to be lowered/lifted with the pile to be pressed-in W2=33.5kN
Casing Auger W1=77.5kN
Silent Piler
A Pile to be pressed-in W3
Pile Toe Level X
Pile Toe Level
Pile Toe Level 2X
1. Installation of pile A to approx. -X mm from the pile level to avoid disturbing soil below pile toe level
2. Extraction of the auger by approx. 2X mm to position the bottom of the auger above the pile toe
3. Extraction of the sheet pile and auger by approx. 200mm to measure the extraction force PU2 (kN)
4. Installation of the sheet pile to the pile toe level to measure the final press-in force R1 (kN) If R1 ≧ 230kN + PU →OK If R1 < 230kN + PU →Deeper pile installation is required.
X+20
0
PU2 = C+S1+S3+W1+W2+W3 PU2; Pull-up Force (kN) C; Interlock Resistance (kN) S1; Mobile Skin Friction above
excavation level (kN) S3; Mobile Skin Friction below
excavation level (kN) C+S1+S3=PU2-(W1+W2+W3) (kN)
R1>T+PU2-2*(W1+W2+W3) (kN) T; Required Toe Resistance (kN)
= F x SWL-S4 F; Factor of Safety S4; Static Skin Friction below
Underside of Baseslab (kN) = s4 x A
s4; Unit Skin Friction given by Static Load testing on U Piles (kN/ m2)
A; Pile Surface Area (m2)
Sheet Piles
Completed Piles
Pile Toe Level
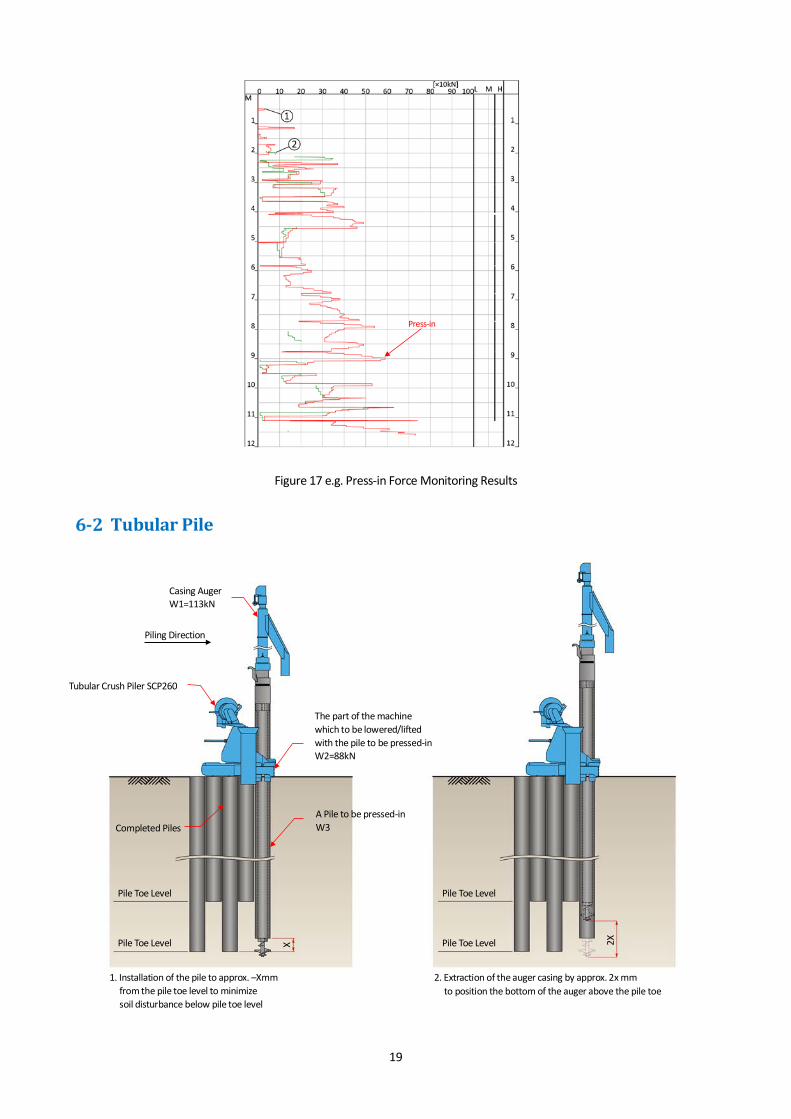
19
Figure 17 e.g. Press-in Force Monitoring Results
Tubular Pile
Press-in
The part of the machine which to be lowered/lifted with the pile to be pressed-in W2=88kN
Tubular Crush Piler SCP260
Pile Toe Level Pile Toe Level
Pile Toe Level Pile Toe Level
Piling Direction
Casing Auger W1=113kN
A Pile to be pressed-in W3
X 2X
1. Installation of the pile to approx. –Xmm from the pile toe level to minimize soil disturbance below pile toe level
2. Extraction of the auger casing by approx. 2x mm to position the bottom of the auger above the pile toe
Completed Piles
20
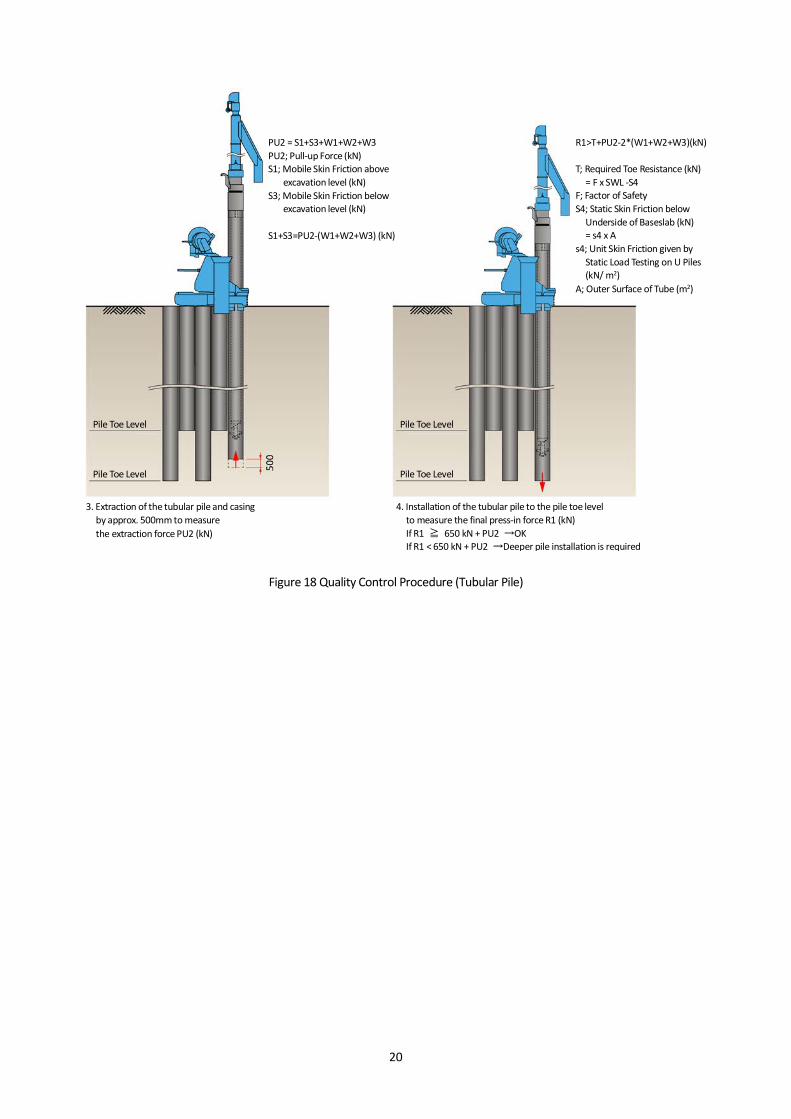
-19-
Figure 18 Quality Control Procedure (Tubular Pile)
Pile Toe Level Pile Toe Level
Pile Toe Level Pile Toe Level
4. Installation of the tubular pile to the pile toe level to measure the final press-in force R1 (kN) If R1 ≧ 650 kN + PU2 →OK If R1 < 650 kN + PU2 →Deeper pile installation is required
PU2 = S1+S3+W1+W2+W3 PU2; Pull-up Force (kN) S1; Mobile Skin Friction above
excavation level (kN) S3; Mobile Skin Friction below
excavation level (kN) S1+S3=PU2-(W1+W2+W3) (kN)
3. Extraction of the tubular pile and casing by approx. 500mm to measure the extraction force PU2 (kN)
R1>T+PU2-2*(W1+W2+W3)(kN) T; Required Toe Resistance (kN)
= F x SWL -S4 F; Factor of Safety S4; Static Skin Friction below
Underside of Baseslab (kN) = s4 x A
s4; Unit Skin Friction given by Static Load Testing on U Piles (kN/ m2)
A; Outer Surface of Tube (m2)
21
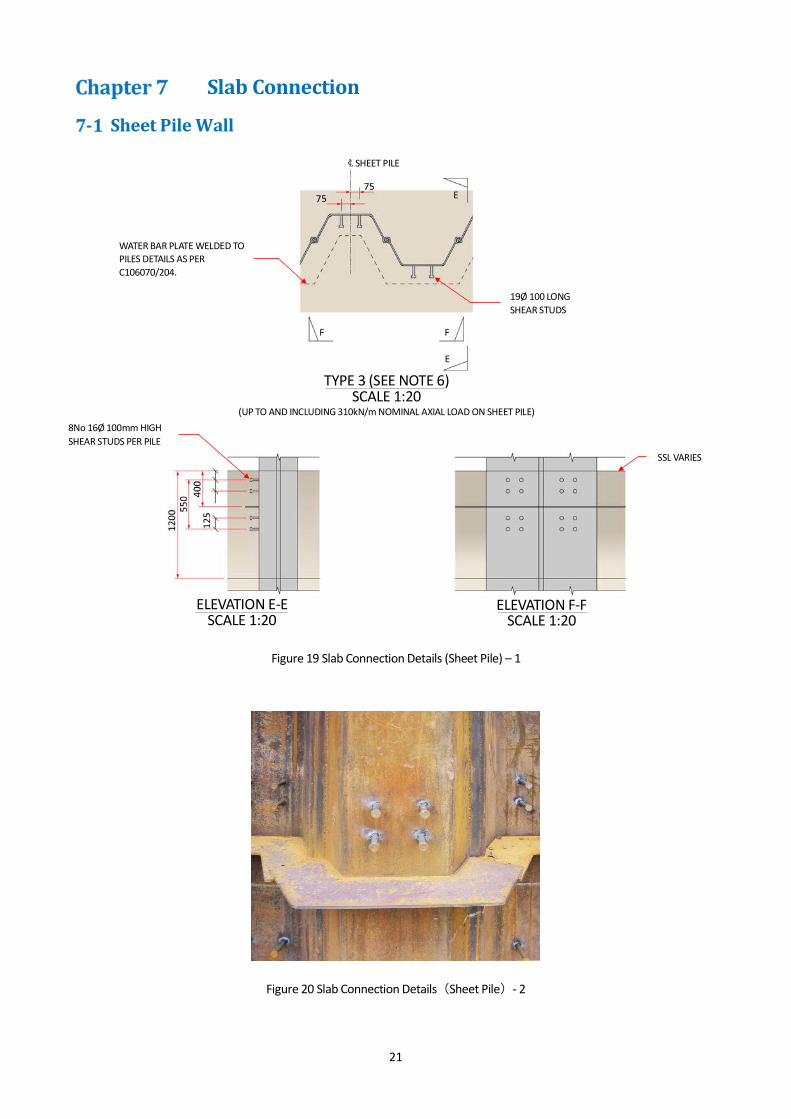
Slab Connection
Sheet Pile Wall
Figure 19 Slab Connection Details (Sheet Pile) – 1
Figure 20 Slab Connection Details (Sheet Pile) - 2
WATER BAR PLATE WELDED TO PILES DETAILS AS PER C106070/204.
8No 16Ø 100mm HIGH SHEAR STUDS PER PILE
19Ø 100 LONG SHEAR STUDS
SSL VARIES
℄ SHEET PILE
TYPE 3 (SEE NOTE 6) SCALE 1:20
(UP TO AND INCLUDING 310kN/m NOMINAL AXIAL LOAD ON SHEET PILE)
ELEVATION E-E SCALE 1:20
ELEVATION F-F SCALE 1:20
22
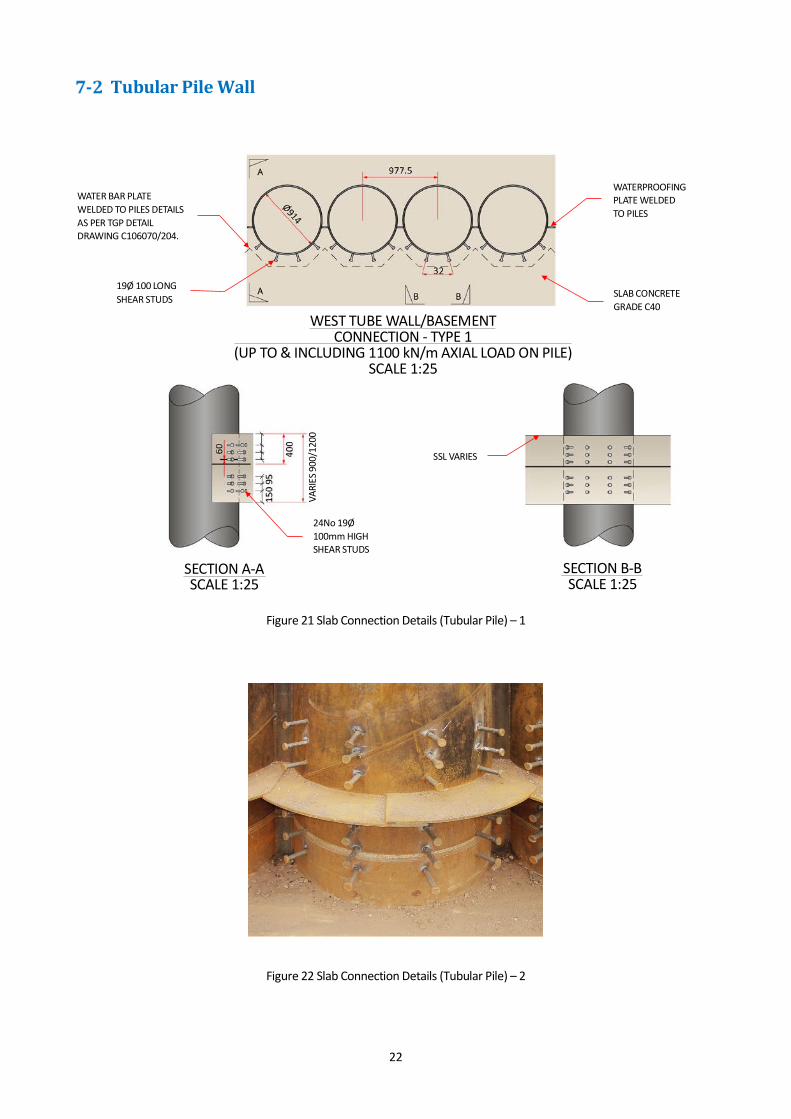
Tubular Pile Wall
Figure 21 Slab Connection Details (Tubular Pile) – 1
Figure 22 Slab Connection Details (Tubular Pile) – 2
SECTION B-B SCALE 1:25
SECTION A-A SCALE 1:25
WATER BAR PLATE WELDED TO PILES DETAILS AS PER TGP DETAIL DRAWING C106070/204.
19Ø 100 LONG SHEAR STUDS
WEST TUBE WALL/BASEMENT CONNECTION - TYPE 1
(UP TO & INCLUDING 1100 kN/m AXIAL LOAD ON PILE) SCALE 1:25
WATERPROOFING PLATE WELDED TO PILES
24No 19Ø 100mm HIGH SHEAR STUDS
SLAB CONCRETE GRADE C40
SSL VARIES
VARI
ES 9
00/1
200
23
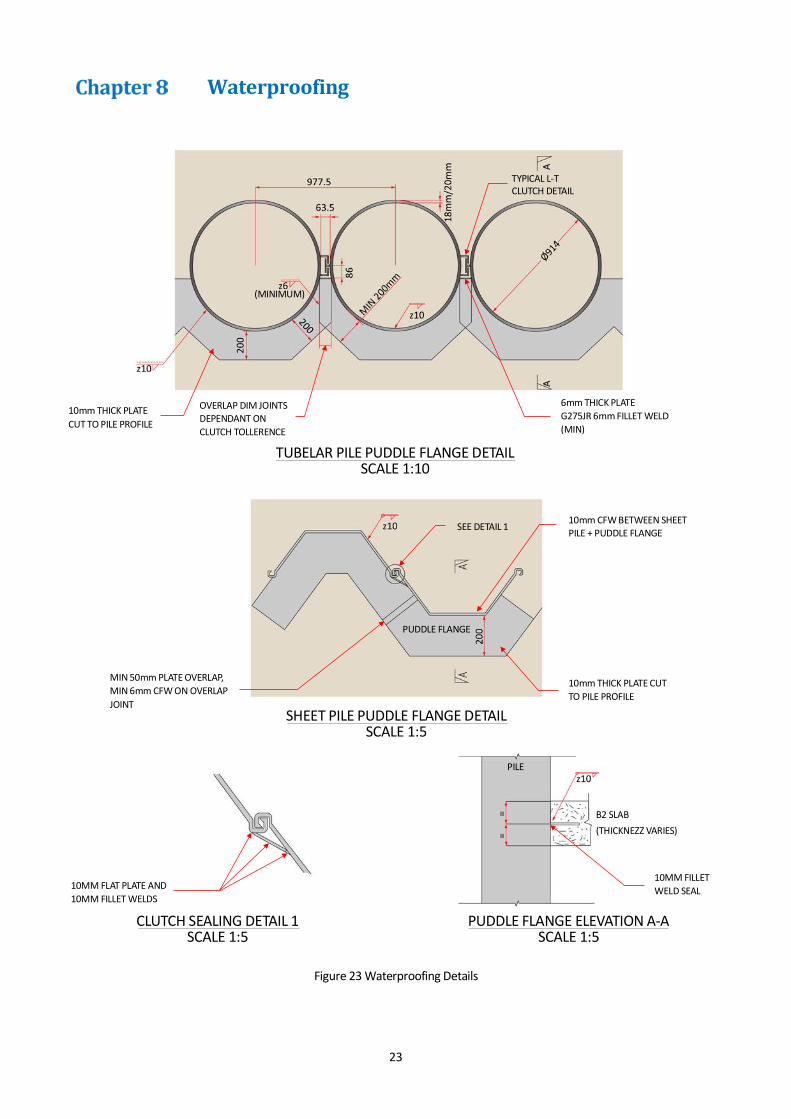
Waterproofing
Figure 23 Waterproofing Details
CLUTCH SEALING DETAIL 1 SCALE 1:5
PUDDLE FLANGE ELEVATION A-A SCALE 1:5
10mm THICK PLATE CUT TO PILE PROFILE
OVERLAP DIM JOINTS DEPENDANT ON CLUTCH TOLLERENCE
MIN 50mm PLATE OVERLAP, MIN 6mm CFW ON OVERLAP JOINT
10mm CFW BETWEEN SHEET PILE + PUDDLE FLANGE
TYPICAL L-T CLUTCH DETAIL
6mm THICK PLATE G275JR 6mm FILLET WELD (MIN)
10mm THICK PLATE CUT TO PILE PROFILE
10MM FILLET WELD SEAL
SEE DETAIL 1
B2 SLAB (THICKNEZZ VARIES)
PILE
TUBELAR PILE PUDDLE FLANGE DETAIL SCALE 1:10
SHEET PILE PUDDLE FLANGE DETAIL SCALE 1:5
PUDDLE FLANGE
10MM FLAT PLATE AND 10MM FILLET WELDS
(MINIMUM)

Care has been taken to ensure that the contents of this publication are accurate at the time of printing, but GIKEN LTD. and its subsidiaries do not accept responsibility for error or for information which is found to be misleading. Suggested applications in this technical publication are for information purpose only and GIKEN LTD. and its subsidiaries accept no liability in respect of individual work applications.

GIKEN LTD. 1-3-28 Ariake, Koto-ku, Tokyo, 135-0063, Japan Email: [email protected] TEL+81(0)3-3528-1633 Offices: Japan, USA, UK, Germany, Singapore, China ©2016 GIKEN LTD. All Rights Reserved. Ver1.1EN01 / 06 Sep 2016
Construction Solutions Company