lng markets in transition the great...
TRANSCRIPT

OX
FOR
D I
NST
ITU
TE F
OR
EN
ERG
Y S
TUD
IES
Nat
ura
l Gas
Re
sear
ch P
rogr
amm
e
LNG Markets in TransitionThe Great reconfiguration
Anne-Sophie Corbeau
David Ledesma

OX
FOR
D I
NST
ITU
TE F
OR
EN
ERG
Y S
TUD
IES
Nat
ura
l Gas
Re
sear
ch P
rogr
amm
e
OIES and KAPSARC brought together international experts from the
industry and academia to create this book
INTRODUCTION
Anne-Sophie Corbeau David Ledesma Jonathan Stern
Chris Lefevre Sylvie D’Apote Anouk Honore Chris Caswell Brian SonghurstJim Henderson
Howard Rogers Ken Koyama Jim Jensen
The authors
Andy Flower

OX
FOR
D I
NST
ITU
TE F
OR
EN
ERG
Y S
TUD
IES
Nat
ura
l Gas
Re
sear
ch P
rogr
amm
e
• Mid 2014: we started thinking about the LNG book
– ‘Only’ 100 mtpa under construction, including 1 US project
– Asia still considered as the bottomless premium market for LNG
– Oil prices at ~$100/bbl
– Many planned projects ready to take FID
How is the LNG business going to be affected by these changes?
• May 2016: we finalize the book
– 150 mtpa to come over 2015-20 (64 mtpa in the US)
– Asian LNG demand growth uncertain (down by 2 percent in 2015), buyers in search of flexibility
– Sellers looking at new markets
– Oil prices at around $40-50/bbl, gas spot prices at ~$4-6/MMBtu
– Who will take FID?
Towards a reconfiguration?
INTRODUCTION
Looking back at the past 2 years
OX
FOR
D I
NST
ITU
TE F
OR
EN
ERG
Y S
TUD
IES
Nat
ura
l Gas
Re
sear
ch P
rogr
amm
e
Moving away from the “cosy” club
INTRODUCTION
• Multiplication and diversification of players in the liquefaction, shipping and
regasification businesses
• Aggregators are increasing their role, buyers are going upstream, traders want to
participate, and new entrants to take market shares (even in Asia)
• More companies alliances on the buyer side
OX
FOR
D I
NST
ITU
TE F
OR
EN
ERG
Y S
TUD
IES
Nat
ura
l Gas
Re
sear
ch P
rogr
amm
e
DEMAND
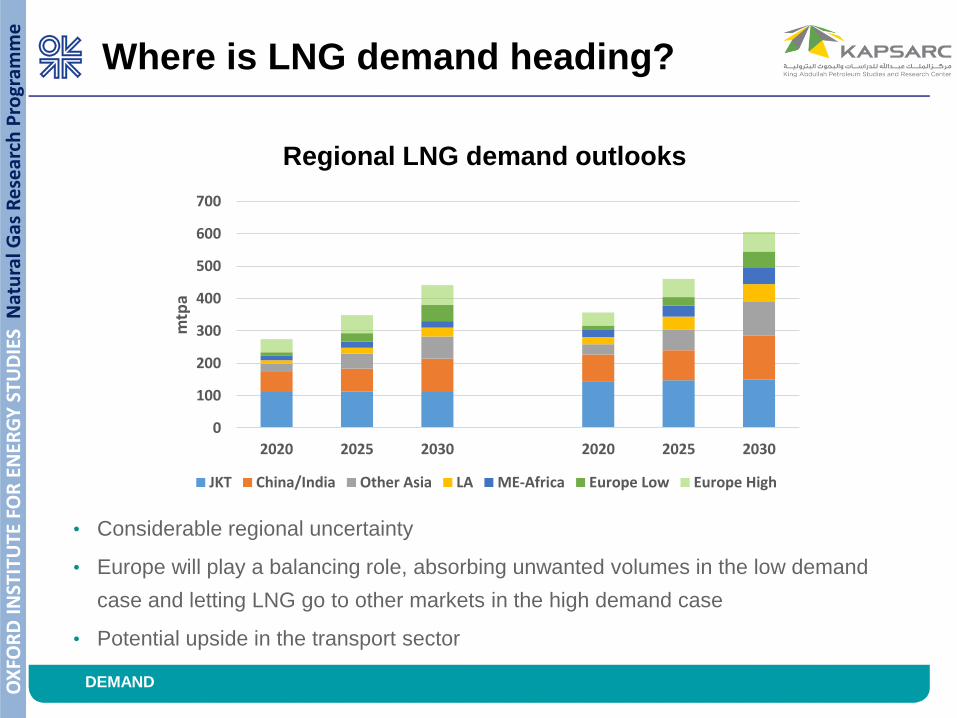
Where is LNG demand heading?
• Considerable regional uncertainty
• Europe will play a balancing role, absorbing unwanted volumes in the low demand
case and letting LNG go to other markets in the high demand case
• Potential upside in the transport sector
Regional LNG demand outlooks
0
100
200
300
400
500
600
700
2020 2025 2030 2020 2025 2030
mtp
a
JKT China/India Other Asia LA ME-Africa Europe Low Europe High

OX
FOR
D I
NST
ITU
TE F
OR
EN
ERG
Y S
TUD
IES
Nat
ura
l Gas
Re
sear
ch P
rogr
amm
e
Focus on Asian LNG demand
0
50
100
150
200
250
300
350
400
450
2010 2015 2020 2025 2030
Mtp
a
Vietnam
Bangladesh
Pakistan
Malaysia
Indonesia
Thailand
Singapore
India
China
Taiwan
South Korea
Japan
0
50
100
150
200
250
300
350
400
450
2010 2015 2020 2025 2030M
tpa
Vietnam
Bangladesh
Pakistan
Malaysia
Indonesia
Thailand
Singapore
India
China
Taiwan
South Korea
Japan
DEMAND
Low case High case
• Asia will remain the largest LNG importing region
• Evolution of domestic production, policies on nuclear, coal and renewables and levels
of domestic gas prices can result in very different outlooks for Asian countries
OX
FOR
D I
NST
ITU
TE F
OR
EN
ERG
Y S
TUD
IES
Nat
ura
l Gas
Re
sear
ch P
rogr
amm
e
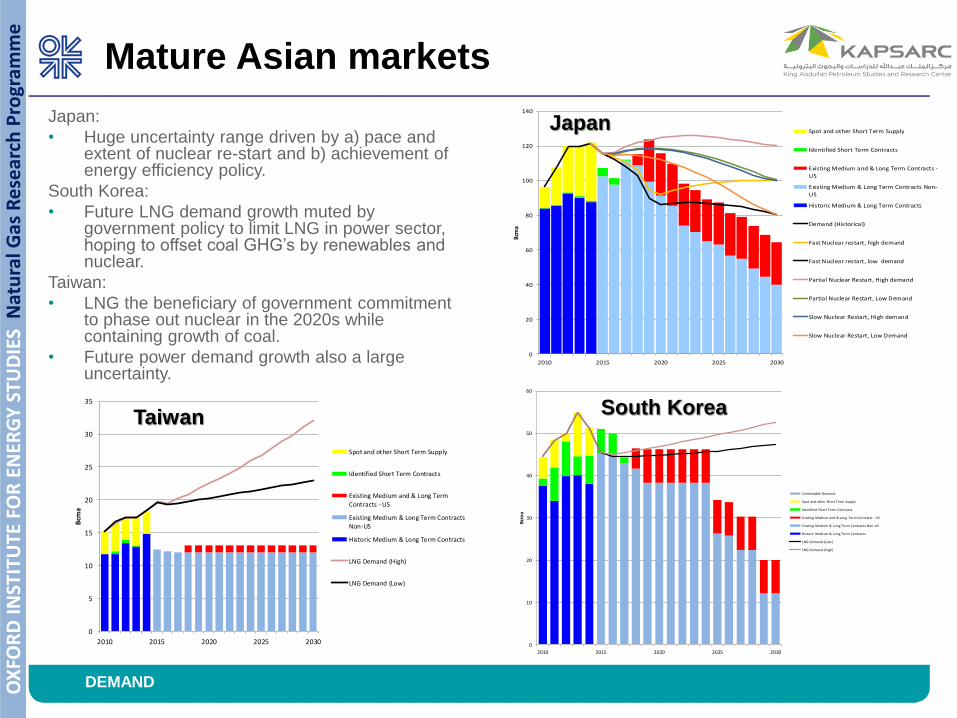
Japan:
• Huge uncertainty range driven by a) pace and extent of nuclear re-start and b) achievement of energy efficiency policy.
South Korea:
• Future LNG demand growth muted by government policy to limit LNG in power sector, hoping to offset coal GHG’s by renewables and nuclear.
Taiwan:
• LNG the beneficiary of government commitment to phase out nuclear in the 2020s while containing growth of coal.
• Future power demand growth also a large uncertainty.
Mature Asian markets
0
20
40
60
80
100
120
140
2010 2015 2020 2025 2030
Bcm
a
Spot and other Short Term Supply
Identified Short Term Contracts
Existing Medium and & Long Term Contracts -
US
Existing Medium & Long Term Contracts Non-
US
Historic Medium & Long Term Contracts
Demand (Historical)
Fast Nuclear restart, high demand
Fast Nuclear restart, low demand
Partial Nuclear Restart, High demand
Partial Nuclear Restart, Low Demand
Slow Nuclear Restart, High demand
Slow Nuclear Restart, Low Demand
0
10
20
30
40
50
60
2010 2015 2020 2025 2030
Bcm
a
Contestable Demand
Spot and other Short Term Supply
Identified Short Term Contracts
Existing Medium and & Long Term Contracts - US
Existing Medium & Long Term Contracts Non-US
Historic Medium & Long Term Contracts
LNG Demand (Low)
LNG Demand (High)
0
5
10
15
20
25
30
35
2010 2015 2020 2025 2030
Bcm
a
Spot and other Short Term Supply
Identified Short Term Contracts
Existing Medium and & Long TermContracts - US
Existing Medium & Long Term ContractsNon-US
Historic Medium & Long Term Contracts
LNG Demand (High)
LNG Demand (Low)
Japan
South KoreaTaiwan
DEMAND

OX
FOR
D I
NST
ITU
TE F
OR
EN
ERG
Y S
TUD
IES
Nat
ura
l Gas
Re
sear
ch P
rogr
amm
e
China
0
100
200
300
400
500
600
2000 2005 2010 2015 2020 2025 2030
Bcm
/y
LNG Imports
Pipeline Imports - West Siberia
Pipeline Imports - East Siberia
Pipeline Imports - Turkmensitan & Central Asia
Pipeline Imports - Myanmar
Domestic Production
Demand
0
100
200
300
400
500
600
2000 2005 2010 2015 2020 2025 2030
Bcm
/y
LNG Imports
Pipeline Imports - West Siberia
Pipeline Imports - East Siberia
Pipeline Imports - Turkmensitan & Central Asia
Pipeline Imports - Myanmar
Domestic Production
Demand
0
20
40
60
80
100
120
2010 2015 2020 2025 2030
Bcm
/y
Spot Transactions
Short Term Contracts
Existing M & LT Contracts - JCC
Historic M & LT Contract Imports
High Demand
Low Demand
Low Case High Case
LNG DemandChina:
• Gas demand growth subject to:– Changed patterns in the ‘New Normal’.
– Success of policy to displace coal with gas in power generation, space heating in Industry – 100 bcma in 5 years ?
• Growth of domestic production dependent on shale gas success.
• Scale of Central Asian imports expandable and timing and number of Russian pipeline projects uncertain.
• LNG imports therefore lie in a wide range: 75 to 105 bcma by 2030.
DEMAND

OX
FOR
D I
NST
ITU
TE F
OR
EN
ERG
Y S
TUD
IES
Nat
ura
l Gas
Re
sear
ch P
rogr
amm
e
Europe is acting as the swing market for LNG: the region is expected to help absorb the LNG surplus coming to the market in the second half of the 2010s and early 2020s
But the region is facing major uncertainties: – The future role of natural gas in the whole energy system is in question,
primarily as a result of greater governmental support for renewables– The region will face a decline of its indigenous (conventional) production.
Increasing unconventional gas and biogas production will have little impact on the decline.
Despite low demand growth, declining indigenous production means that Europe will have to increase its gas imports, but how much and from which sources is unclear
– In 2015, most of the gas imported arrived in the form of pipeline gas (88% of total demand) with a predominant role of Russia (33% of total demand), the main competitor to LNG
“Europe” = EU28 + Albania, Bosnia and Herzegovina, Macedonia, Norway, Serbia, Switzerland, and Turkey
The role of LNG in Europe
DEMAND

OX
FOR
D I
NST
ITU
TE F
OR
EN
ERG
Y S
TUD
IES
Nat
ura
l Gas
Re
sear
ch P
rogr
amm
e Latin America: substantial potential for
additional LNG imports
• Energy demand (and in particular power demand) is growing • The development of local resources is taking more time than expected• Natural gas has a role to play as a clean and efficient complementary
source of firm energy to hydropower and intermittent renewable sources, but flexibility of supply will be an important element
• In 2030, the region is expected to need 37-103 bcm of LNG (including a great variability of LNG demand in Brazil)
DEMAND

OX
FOR
D I
NST
ITU
TE F
OR
EN
ERG
Y S
TUD
IES
Nat
ura
l Gas
Re
sear
ch P
rogr
amm
e Middle East and Africa: more than a
niche market?
• Currently a very small market representing 10 mtpa
• Both regions are overall exporters, but intraregional pipeline trade has proven difficult to put in place or expand
• Middle East– Many countries facing gas shortages struggle to develop new generation of gas fields– Currently four countries importing, more looking at LNG imports– Most ME countries have low – but increasing – wholesale gas prices
• Africa– Egypt started importing in 2015, but scale and duration highly depends on future
domestic production – At least 8 other countries are looking at importing LNG for variable durations– Most of them opt for FSRUs (except for Morocco)– Many issues related to financing, need to provide regulatory certainty to prospective
sellers, affordability and payment issues
DEMAND

OX
FOR
D I
NST
ITU
TE F
OR
EN
ERG
Y S
TUD
IES
Nat
ura
l Gas
Re
sear
ch P
rogr
amm
e
• Low oil prices make the financial case harder
• The environmental case is primarily driven by legislation.
• The benefits from reduced GHGs are less than other emissions
though methane slip can be reduced/eliminated through technical
enhancements
• Initial prospects are stronger in marine than in road apart from China
– Already established for LNG tankers
– Greater scale (1 ferry ≅ 1,300 buses)
– Legislation in place
– “LNG ready” a no regrets step for some new build
– Easier to establish refuelling facilities
– Norway has demonstrated what is possible
• Could be a significant market by 2030
LNG IN TRANSPORT
Prospects for LNG use in transport
OX
FOR
D I
NST
ITU
TE F
OR
EN
ERG
Y S
TUD
IES
Nat
ura
l Gas
Re
sear
ch P
rogr
amm
e
• Well documented upsurge in output underway (+150 mtpa)
• Some declines in existing producers
• Qatar a continuing constant
• Economics of new projects very challenged – will there be new FIDs
in the US, Australia, Russia, East Africa before 2020?
• Canada has missed the short-term window – no output until well into
2020s
• Opportunities for new producers are politically as well as commercially
difficult
• Portfolio aggregation can help to support some projects
• Brownfield expansion in politically stable areas the most likely source
of new LNG post 2020
SUPPLY
Who will provide new LNG supply?
OX
FOR
D I
NST
ITU
TE F
OR
EN
ERG
Y S
TUD
IES
Nat
ura
l Gas
Re
sear
ch P
rogr
amm
e
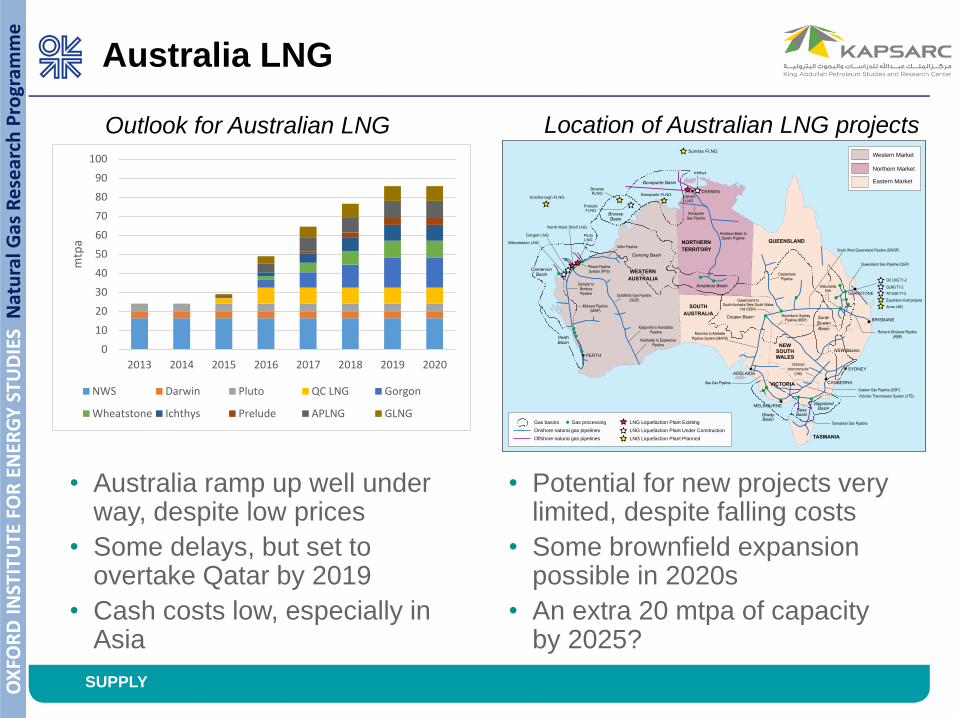
• Australia ramp up well under way, despite low prices
• Some delays, but set to overtake Qatar by 2019
• Cash costs low, especially in Asia
SUPPLY
• Potential for new projects very limited, despite falling costs
• Some brownfield expansion possible in 2020s
• An extra 20 mtpa of capacity by 2025?
0
10
20
30
40
50
60
70
80
90
100
2013 2014 2015 2016 2017 2018 2019 2020
mtp
a
NWS Darwin Pluto QC LNG Gorgon
Wheatstone Ichthys Prelude APLNG GLNG
North West Shelf LNG
PlutoLNG
Gorgon LNG
Wheatstone LNG
Scarborough FLNG
BrowseFLNG Bonaparte FLNG
PreludeFLNG
Sunrise FLNG
Ichthys
DarwinLNG
Gas basins
Onshore natural gas pipelines
Offshore natural gas pipelines
LNG Liquefaction Plant Existing
LNG Liquefaction Plant Under Construction
LNG Liquefaction Plant Planned
Gas processing
Western Market
Northern Market
Eastern Market
Moomba to SydneyPipeline (MSP)
Queensland toSouth Australia /New South Wales
link (QSN)
CarpentariaPipeline
Victorian Transmission System (VTS)
Roma to Brisbane Pipeline
(RBP)
South West Queensland Pipeline (SWQP)
VictorianInterconnector
(VNI)
Moomba to Adelaide
Pipeline System (MAPS)
Amadeus Basin toDarwin Pipeline
Goldfields Gas Pipeline(GGP)
Dampier toBunburyPipeline
Eastern Gas Pipeline (EGP)
Sea Gas Pipeline
Tasmanian Gas Pipeline
Queensland Gas Pipeline (QGP)
QC LNG T1-2
GLADSTONE
GLNG T1-2
AP LNG T1-2
Expansion at all projects
Arrow LNG
WallumbillaHub
Pibara PipelineSystem (PPS)
Telfer Pipeline
BonaparteGas Pipeline
Kalgoorlie to KambaldaPipeline
Kambalda to EsperencePipeline
Midwest Pipeline(MWP)
WESTERN
AUSTRALIA
NORTHERN
TERRITORY
QUEENSLAND
SOUTH
AUSTRALIA
VICTORIA
NEWSOUTHWALES
TASMANIA
PerthBasin
CarnarvonBasin
BrowseBasin
Bonaparte Basin
SYDNEY
BRISBANE
DARWIN
CANBERRA
MELBOURNE
ADELAIDE
PERTH
GippslandBasinBass
BasinOtwayBasin
Cooper Basin Surat-
Bowen
Basin
NSW Basins
Amadeus Basin
Canning Basin
Outlook for Australian LNG Location of Australian LNG projects
Australia LNG

OX
FOR
D I
NST
ITU
TE F
OR
EN
ERG
Y S
TUD
IES
Nat
ura
l Gas
Re
sear
ch P
rogr
amm
e
• US project output ramping up towards end of decade, but impact
being felt in global LNG market
• Is there any incentive for new project development, or could current
projects default?
• Will there be any Canadian LNG projects within the next decade?
SUPPLY
Region Total number of
projects
Total capacity
Including under
construction
(mtpa)
Number of
projects under
construction
Capacity (mtpa)
United States
US Gulf and East
Coasts
35 364 5 64
Oregon 2 16.6 0 0
Alaska 1 18 0 0
Canada
British Columbia 18 301 0 0
Eastern Canada 5 52 0 0
Summary of North American LNG projects
North American LNG

OX
FOR
D I
NST
ITU
TE F
OR
EN
ERG
Y S
TUD
IES
Nat
ura
l Gas
Re
sear
ch P
rogr
amm
e
SUPPLY
0
10
20
30
40
50
60
70
80
90
2015 2020 2025 2030
mtp
a
Sakhalin 2 Yamal LNG Baltic LNG
Sakhalin 2 Expansion Vladivostok LNG Far East LNG
Arctic LNG Pechora LNG Shtokman
• Yamal LNG to start up in 2017, fully online by 2020
• Sakhalin 2 expansion logical but (politically difficult so) and not before 2021
• Baltic LNG – 5-10 mt or a limited project for bunker market and Kaliningrad?
• Other projects significantly delayed
Outlook for Russian LNG
Russian LNG

OX
FOR
D I
NST
ITU
TE F
OR
EN
ERG
Y S
TUD
IES
Nat
ura
l Gas
Re
sear
ch P
rogr
amm
e
SUPPLY
0
5
10
15
20
25
30
35
mtp
a
Mozambique High Mozambique Low
Tanzania High Tanzania Low
• Prospects for Eastern Africa undermined by low prices
• Regulatory, legislative and fiscal issues also major hurdles
• Tanzania could fail altogether
• Mozambique reserves very large, but timing of output in doubt
Scenarios for Eastern Africa LNG developments
Eastern Africa LNG

OX
FOR
D I
NST
ITU
TE F
OR
EN
ERG
Y S
TUD
IES
Nat
ura
l Gas
Re
sear
ch P
rogr
amm
e
• Prospects– In addition to 7 in
construction - 17 mtpa
– 17 in study phase –56 mtpa
– If 50% of these proceed then 45 mtpa
– 18% of 245 mtpa global production in 2015 – significant market share
FLNG
• Outlook – First FLNG in production late 2016
– More in construction – some on speculative basis – new builds and conversions
– Option to lease reducing capital outlay
– Opportunity to deliver lower cost plants (similar to US Gulf Coast) to high cost areas e.g. Australia, Eastern Africa, Canada in under 3 years –enabling earlier and higher revenue stream
– More major offshore leasing companies looking to enter the market increasing competition
Prospects for FLNG
OX
FOR
D I
NST
ITU
TE F
OR
EN
ERG
Y S
TUD
IES
Nat
ura
l Gas
Re
sear
ch P
rogr
amm
e
SUPPLY
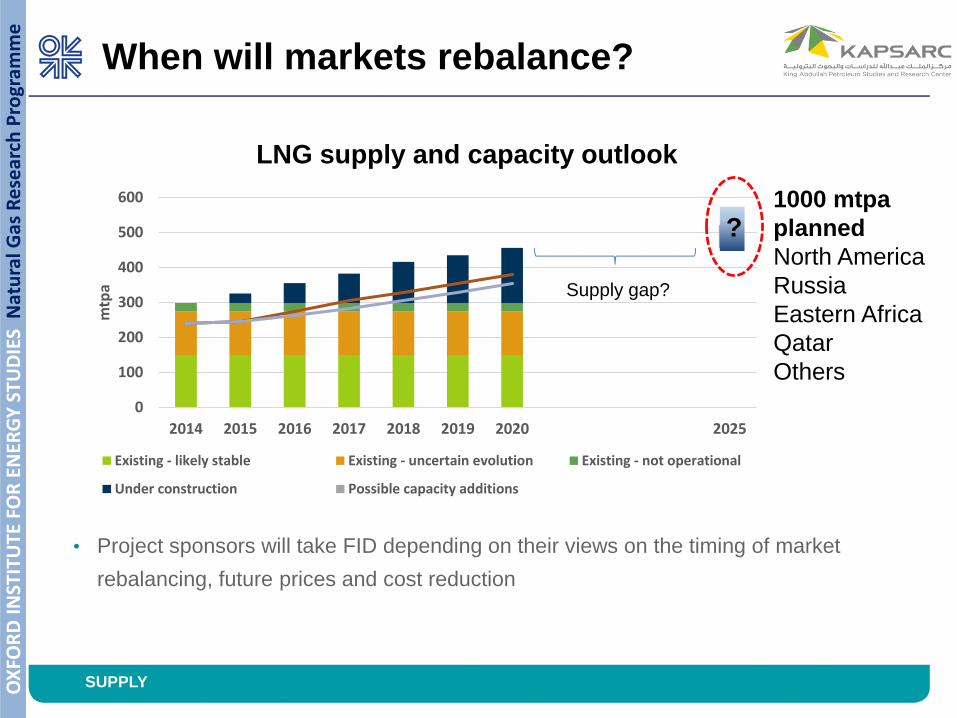
When will markets rebalance?
0
100
200
300
400
500
600
2014 2015 2016 2017 2018 2019 2020 2025
mtp
a
Existing - likely stable Existing - uncertain evolution Existing - not operational
Under construction Possible capacity additions
1000 mtpa
planned
North America
Russia
Eastern Africa
Qatar
Others
?
Supply gap?
LNG supply and capacity outlook
• Project sponsors will take FID depending on their views on the timing of market
rebalancing, future prices and cost reduction
OX
FOR
D I
NST
ITU
TE F
OR
EN
ERG
Y S
TUD
IES
Nat
ura
l Gas
Re
sear
ch P
rogr
amm
e
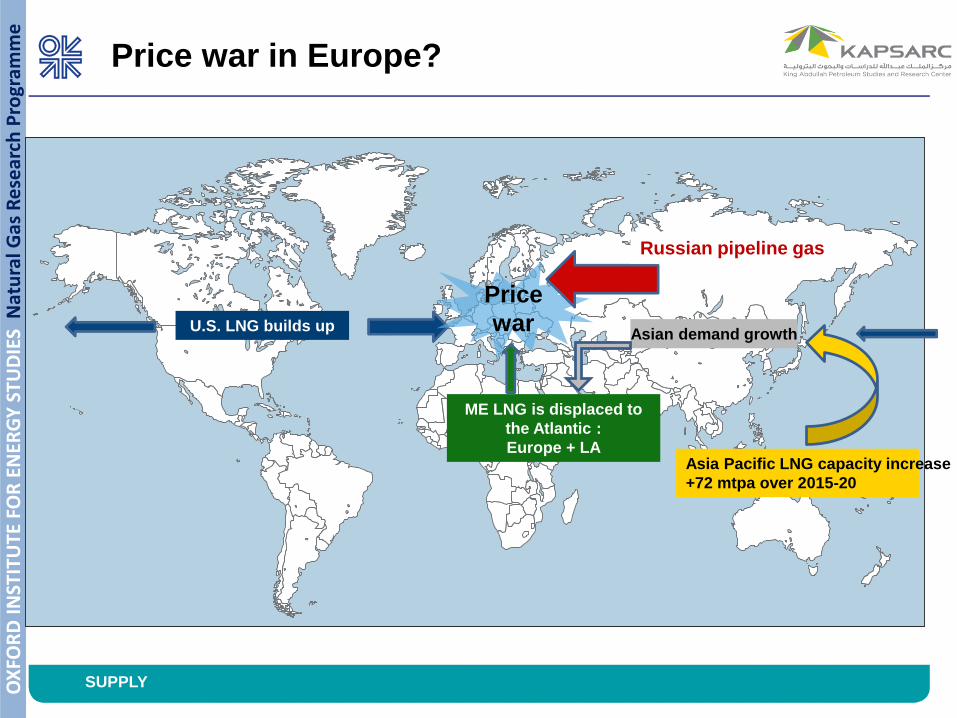
Price war in Europe?
Asia Pacific LNG capacity increase
+72 mtpa over 2015-20
Asian demand growth
ME LNG is displaced to
the Atlantic :
Europe + LA
U.S. LNG builds up
Price
war
Russian pipeline gas
SUPPLY

OX
FOR
D I
NST
ITU
TE F
OR
EN
ERG
Y S
TUD
IES
Nat
ura
l Gas
Re
sear
ch P
rogr
amm
e
• Drivers behind the growth of spot and short-term LNG trade
– Supply side developments (uncommitted LNG capacity, ramp-up volumes, volumes
redirected and portfolio LNG)
– Demand side developments (demand shocks, creation of liquid hubs, TPA to
infrastructure, end of final destination clauses (Europe) and change in the nature of
buyers)
The evolution of spot and short-term
LNG trade
Spot and short-term LNG trade, 1999-2015
0
10
20
30
40
50
60
70
80
0%
20%
40%
60%
80%
100%
mtp
a
Algeria Egypt E. Guinea Nigeria
Norway Qatar Oman Yemen
Australia Malaysia Indonesia Russia
Peru Trinidad Others Trade (right)
CONTRACTS AND FLEXIBILITY

OX
FOR
D I
NST
ITU
TE F
OR
EN
ERG
Y S
TUD
IES
Nat
ura
l Gas
Re
sear
ch P
rogr
amm
e
• Future gas demand over the next 10-20 years is uncertain
– Economic growth
– Competitiveness of gas against coal
– Development of renewables and
– Evolution of nuclear policy
• Liberalisation processes in Asia means higher competition on the
markets
• Difficulties to pass through LNG costs to end-users in periods of
high(er) prices
• How to commit for 20 years?
The buyers’ dilemma
CONTRACTS AND FLEXIBILITY

OX
FOR
D I
NST
ITU
TE F
OR
EN
ERG
Y S
TUD
IES
Nat
ura
l Gas
Re
sear
ch P
rogr
amm
e
Towards 43% of total LNG trade by 2020
Evolution of spot and short-term LNG trade
0%
10%
20%
30%
40%
50%
0
50
100
150
200m
tpa
Low case High case Share of LNG Trade (low) Share of LNG Trade (high)
• Further growth of spot and short-term LNG trade will be supported by uncommitted
LNG, limited contracts extension and renegotiation at lower volumes, portfolio LNG
and the role of Qatar and US LNG
• Potentially some upside in the short term depending on ramp-up volumes
CONTRACTS AND FLEXIBILITY

OX
FOR
D I
NST
ITU
TE F
OR
EN
ERG
Y S
TUD
IES
Nat
ura
l Gas
Re
sear
ch P
rogr
amm
e
Tackling a $2bn/y inefficiency
Optimising shipping
• If we were to optimize shipping based on the shortest route, we
could save $2bn/y
• Unrealistic? Margins are low! It is time for collaboration…
CONTRACTS AND FLEXIBILITY

OX
FOR
D I
NST
ITU
TE F
OR
EN
ERG
Y S
TUD
IES
Nat
ura
l Gas
Re
sear
ch P
rogr
amm
e
• Existing LT contracts:
– Increased pressure on price and flexibility terms
– This could be exacerbated by discontinuity between term and spot prices, financial distress of buyers
• LT contracts supporting new LNG plants:
– Moving without the support of LT contracts seems a bridge too far at this stage
– For that to happen, we would need
• Spot LNG trade to become the norm
• Reliable price benchmarks
• Support/agreement from banks
• And a substantial drop in LNG costs for project sponsors to take that risk
Implications for long-term contracts
CONTRACTS AND FLEXIBILITY

OX
FOR
D I
NST
ITU
TE F
OR
EN
ERG
Y S
TUD
IES
Nat
ura
l Gas
Re
sear
ch P
rogr
amm
e
• North America and Europe price gas at hubs
• Asian LNG prices are still largely JCC-based but this has diminishing
market logic
• By early 2016, important status quo players (eg JERA) begin to
openly speak about the need for transition to market prices – recalls
start of the transition in Europe
• May 2016: METI LNG Strategy makes transition to hub pricing
`official policy’
• Asian hubs may evolve over the next decade and this could be
accelerated by:
– Over-supply of LNG up to 2020
– Increasing spread between JCC and spot prices (if oil prices increase beyond $50/bbl)
Evolution of pricing mechanisms
26PRICING

OX
FOR
D I
NST
ITU
TE F
OR
EN
ERG
Y S
TUD
IES
Nat
ura
l Gas
Re
sear
ch P
rogr
amm
e
PRICING
Henry Hub or European (NBP/TTF) hub prices
Asian spot price Index (eg JKM, RIM, Argus, JOE): too few cargos (at
least currently) on which to base long term contracts
Prices at an Asian hub or hubs
Average Japanese/Korean LNG import prices – JLC/KLC
`Hybrid pricing’ – a mixture of all of these + JCC/oil+ electricity +……
Which of these mechanisms best reflects gas
supply/demand conditions in Asian countries
Price formation mechanisms
which could replace JCC

OX
FOR
D I
NST
ITU
TE F
OR
EN
ERG
Y S
TUD
IES
Nat
ura
l Gas
Re
sear
ch P
rogr
amm
e Establishing a liquid hub takes time
and commitment
Third Party Access to Pipelines/Regas Terminals
Balancing Rules & Standardised Trading
Contracts
Price Discovery and Disclosure
OTC Brokered Trading
Futures Exchange
Liquid Forward Curve
Develops
Non – Physical Players enter
Indices derived for
LT Contracts
Bi-Lateral Trades
10 + years ?
Based on Experience in US, UK and Continental Europe:
• This could take 10 years in Asia
• It requires the commitment of government, suppliers and system operators
• An over-supplied market with strong competition accelerates the process
PRICING

OX
FOR
D I
NST
ITU
TE F
OR
EN
ERG
Y S
TUD
IES
Nat
ura
l Gas
Re
sear
ch P
rogr
amm
e
SINGAPORE:
• 2015 the SGX LNG Index Group creates the `Sling’ price, first derivative
contract reported in early 2016
SHANGHAI:
• Petroleum Exchange trades small volumes of LNG but
• is overly dominated by Chinese market players and hence not a neutral
body for market trading
TOKYO:
• TOCOM and Ginga Energy – created the JOE LNG forward platform in
2014 to become a futures market
• Has traded very little LNG since creation (first contract August 2015)
Progress still very much in early stages
The Exchanges: how much progress?
9PRICING
OX
FOR
D I
NST
ITU
TE F
OR
EN
ERG
Y S
TUD
IES
Nat
ura
l Gas
Re
sear
ch P
rogr
amm
e
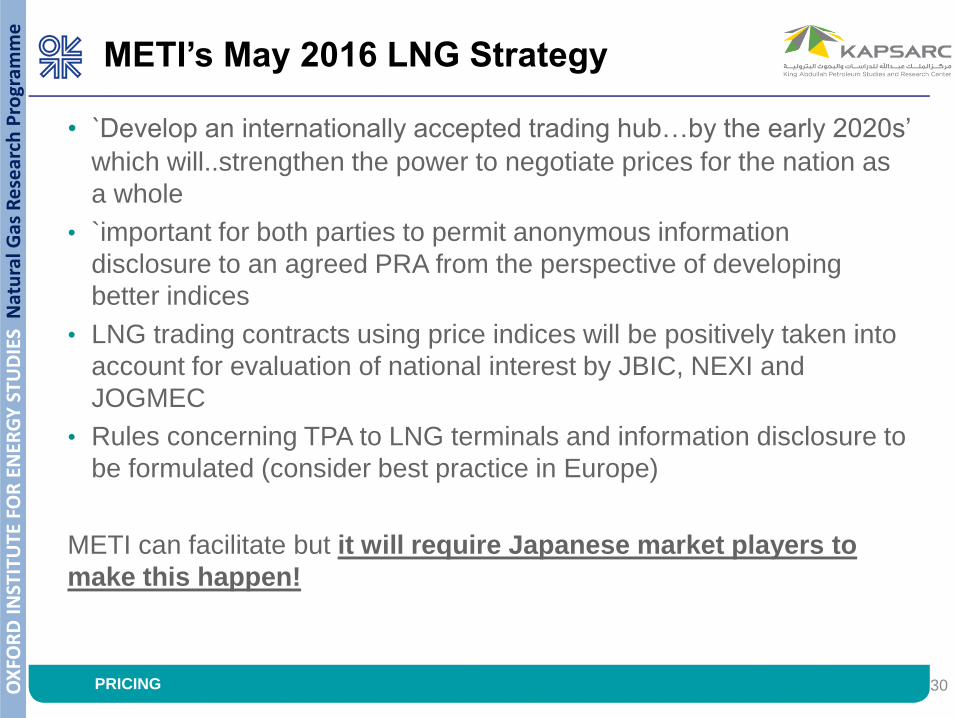
• `Develop an internationally accepted trading hub…by the early 2020s’
which will..strengthen the power to negotiate prices for the nation as
a whole
• `important for both parties to permit anonymous information
disclosure to an agreed PRA from the perspective of developing
better indices
• LNG trading contracts using price indices will be positively taken into
account for evaluation of national interest by JBIC, NEXI and
JOGMEC
• Rules concerning TPA to LNG terminals and information disclosure to
be formulated (consider best practice in Europe)
METI can facilitate but it will require Japanese market players to
make this happen!
METI’s May 2016 LNG Strategy
30PRICING
OX
FOR
D I
NST
ITU
TE F
OR
EN
ERG
Y S
TUD
IES
Nat
ura
l Gas
Re
sear
ch P
rogr
amm
e Asian markets do not need to adopt
the same price mechanism
• SINGAPORE: an LNG trading location which develops a regional
price for South East Asia
• CHINA: a Shanghai citygate benchmark price reflecting
domestic/international gas prices, and prices of competing fuels
(fuel oil and LPG)
• JAPAN: a hybrid/spot JCC/JKM/HH/NBP price developed by
competition which could evolve into a hub
These prices will have a relationship with each other and
in time will create a “messy transition” to a converged
Asian composite price; meanwhile expansion of spot
pricing will put continued pressure on JCC-based long
term contracts, especially if oil prices increase
PRICING

OX
FOR
D I
NST
ITU
TE F
OR
EN
ERG
Y S
TUD
IES
Nat
ura
l Gas
Re
sear
ch P
rogr
amm
e
• The supply/demand balance will look significantly different in 5
years from now and there is great uncertainty about the future
supply
• There is increasing pressure from the buyer’s side for more
flexibility and a change in price formation, from oil indexation
to hub indexation, to address:
– Uncertainties around future gas demand growth
– Market liberalization in Asia
– Maintaining gas competitiveness versus coal
• Long-term contracts under threat from flexible LNG supply
– Buyers looking for shorter-term commitments
– Share of spot trade to increase from 28% in 2015 to about 43% by 2020
INTRO
Why a reconfiguration?
CONCLUSIONS

OX
FOR
D I
NST
ITU
TE F
OR
EN
ERG
Y S
TUD
IES
Nat
ura
l Gas
Re
sear
ch P
rogr
amm
e
CONCLUSIONS
So where does this leave us?
• Companies realizing that they have to adapt to the new market
environment
• Companies have to change the way they operate
– Cost is king; innovative and cost-competitive projects could proceed
– Lots of potential in new markets … as long as LNG is ‘affordable’ and competitive
– Changes in pricing formation are coming, but there is resistance
– Collaboration necessary
– Existing projects to accept more flexible contract structure,
– New projects will require some form of LT commitments unless conditions are fundamentally different
– Contract sanctity?

OX
FOR
D I
NST
ITU
TE F
OR
EN
ERG
Y S
TUD
IES
Nat
ura
l Gas
Re
sear
ch P
rogr
amm
e
Thank you for your attention