lng fuels our future - pure - aanmelden · lng fuels our future 5 this lecture now focuses on the...
TRANSCRIPT

LNG fuels our future
Dam, J.A.M.
Published: 01/01/2013
Document VersionPublisher’s PDF, also known as Version of Record (includes final page, issue and volume numbers)
Please check the document version of this publication:
• A submitted manuscript is the author's version of the article upon submission and before peer-review. There can be important differencesbetween the submitted version and the official published version of record. People interested in the research are advised to contact theauthor for the final version of the publication, or visit the DOI to the publisher's website.• The final author version and the galley proof are versions of the publication after peer review.• The final published version features the final layout of the paper including the volume, issue and page numbers.
Link to publication
Citation for published version (APA):Dam, J. A. M. (2013). LNG fuels our future. Eindhoven: Technische Universiteit Eindhoven.
General rightsCopyright and moral rights for the publications made accessible in the public portal are retained by the authors and/or other copyright ownersand it is a condition of accessing publications that users recognise and abide by the legal requirements associated with these rights.
• Users may download and print one copy of any publication from the public portal for the purpose of private study or research. • You may not further distribute the material or use it for any profit-making activity or commercial gain • You may freely distribute the URL identifying the publication in the public portal ?
Take down policyIf you believe that this document breaches copyright please contact us providing details, and we will remove access to the work immediatelyand investigate your claim.
Download date: 01. Jun. 2018

Visiting addressDen Dolech 25612 AZ EindhovenThe Netherlands
Postal addressP.O.Box 5135600 MB Eindhoven The Netherlands
Tel. +31 40 247 91 11www.tue.nl
Where innovation starts
/ Department of Mechanical Engineering
Inaugural lecture
Prof. Jacques Dam
March 1, 2013
LNG fuels our future

Presented on March 1, 2013at Eindhoven University of Technology
Inaugural lecture prof. Jacques Dam
LNG fuels our future


3
Every aspect of life on Earth is driven by energy. The evolution of the human raceespecially is closely related to the availability of energy and the development ofthe technology to harness and control this energy. One early “fuel” was obtainedby harnessing the energy of the wind, which brought about the development ofwindmills and sailing ships. The unpredictability of the wind made it inevitable tosearch for an independent source of energy, energy that could be stored andutilized at will. Coal became that first dense energy source available on a largescale. From 1700 onwards it fueled the early steam engines that drove theindustrial revolution initiated and supported by the strongly emergingdevelopment of the technical sciences. From the 20th century on, it has beenmainly coal, oil, natural gas and nuclear energy that has powered the ever-growing industrial revolution and transformed the world from a semi-stationarysociety into the mobile, energy-hungry society of today. However, we have alsobecome aware of how vulnerable we are to the availability of energy, long takenas granted, and the consequences that using them on such a vast scale has forthe environment; alleviating this situation has become a principal driver in thefurther development of durable energy sources.
This is where natural gas in both its gaseous and liquid state can play animportant role in the future global energy mix. The use of natural gas wasmentioned in China as early as 900BC, was re-discovered in America in 1626 byFrench explorers but was unknown in Europe until its discovery in England in1659. From 1720, natural gas became the fuel to illuminate streets and houses.From 1920 on, natural gas has been used for domestic and industrial heating onan ever-growing scale as the technology for engineering long-distance distributionpipe networks became available.
Introduction

4 prof. Jacques Dam
The liquefaction of natural gas dates back to the 19th century when Britishchemist and physicist Michael Faraday experimented with liquefying differenttypes of gases, including natural gas. However, the development of the firstpractical compression refrigeration machine in Munich in 1873 by Karl von Linde(see figure 1) (for a Bavarian brewery) and the air liquefier, invented in 1895 butnot patented till 1903(!), paved the way for the large-scale, LNG production plantsthat are in operation today (see figure 2).
Liquefied Natural Gas (LNG) began its commercial life in 1914 with a patent on LNG handling and shipping followed by the first commercial LNG liquefaction plant in1917 but it took till 1964 before serious LNG trade developed between Algeria andthe UK. After the first oil crisis in 1973 there was a rapid increase in the trade ofnatural gas and LNG while the growing availability of natural gas (current reservesestimated at 275 years) underlined the environmental advantages of LNG as fuel:15% lower CO2 emission, 90% reduction in fine-particles emission and NOxemissions and the possibility to blend in bio-based hydrocarbons and hydrogen.Figure 3 shows the growth of the fossil fuel market since 1850 and related to that,figure 4 shows the expected growth of the European LNG market.
Figure 1 (left): Carl Paul Gottfried von Linde.
Figure 2 (right): Linde cycle patent 12 may 1903.

5LNG fuels our future
This lecture now focuses on the key challenges and opportunities of LNGtechnology in a future green LNG fuel supply chain.
Why is the development of LNG technology important for the Netherlands?
This is why!
Figure 3: The historic growth of the fossil fuel market since 1850 and its expecteddevelopment in the future. (Source: Texas State Technical College, 2008)
Figure 4: The growth of the European LNG market. (Source: “Strategy implications ofWorld Gas market Dynamics”, R. Weijdermars, 20127])

6
Let us first define what natural gas is. Traditionally, natural gas is a fossil fuel likeoil and coal, and this means that it is, essentially, the remains of organic materialsfrom millions and millions of years ago. But natural gas can also be harvestedfrom the breakdown of recent organic material, or biomass. But how do theseorganic materials become an inanimate mixture of gases?
Fossil Natural GasThe most widely accepted theory says that fossil fuels, oil and natural gas were formed when organic matter (such as the remains of plants or animals) was compresseddeep under the Earth, at very high pressure and temperature (deep deposits) fora very long time. It is referred to as thermogenic methane. The high temperaturebreaks down the carbon bonds, and this forms methane, as opposed to oil. At lower temperature (shallower deposits), more oil is produced relative to natural gas.
Durable Natural GasNatural gas formed through the breakdown of organic matter by tinymicroorganisms is referred to as biogenic methane. These microorganisms arecommonly found in areas near the surface of the Earth that are void of oxygen.Methane produced in that way is usually lost into the atmosphere.
In the period 2003-2005 the Envisat satellite measured the methane concentration in the Earth’s atmosphere, generating the following map (see figure 5) that looksspectacular but actually the measured concentrations are very low.
In certain circumstances, however, methane can be trapped underground or in acontrolled way in a biomass reactor vessel, and can be harvested as natural gas.The composition of fossil natural gas differs from the bio-based natural gas as thefollowing table 1 shows.
The Natural Gas Economy

7LNG fuels our future
Figure 5: The distribution of Methane in the Earths atmosphere. (Source: University ofBremen, http://www.iup.uni-bremen.de)
Table 1: Overview of the composition of several Natural gas sources and the requiredNatural gas composition before liquefaction to LNG.
Natural gas components Fossil1,3) Before liquefaction Landfil2) Biogas2) Groningen2)
Methane CH4 70-98% 98% 35-65% 45-60% 81.3%
Ethane C2H6 2.85%
Propane C3H8 0-20% 1-10ppm 0.37%
Butane C4H10 0.14%
Carbon Dioxide CO2 0-8% 50-100ppm 30-40% 40-60% 0.89%
Oxygen O2 0-0.2% 0-2% 0.1-1% 0.01%
Nitrogen N2 0-5% 0-10% 2-5% 14.35%
Hydrogen Sulphide H2S 0-5% 4ppm 0-3% 0-1% 0-3%
Mercury Hg 0.01µg/Nm3
Ammoniac CH3 5ppm 100ppm
Various Ar, He, Ne, Xe H2, NH3, H2O CO, H2, NH3, NMOC’s H12C5, H14C6
1) http://www.naturalgas.org 2) Source: SGC, 2005; Energinet, 2 3) Volume percentage
8 prof. Jacques Dam
Looking at table 1, I now want to make three statements:
1. Independent of its source, natural gas has to be pre-processed to make itsuitable for particular end users.
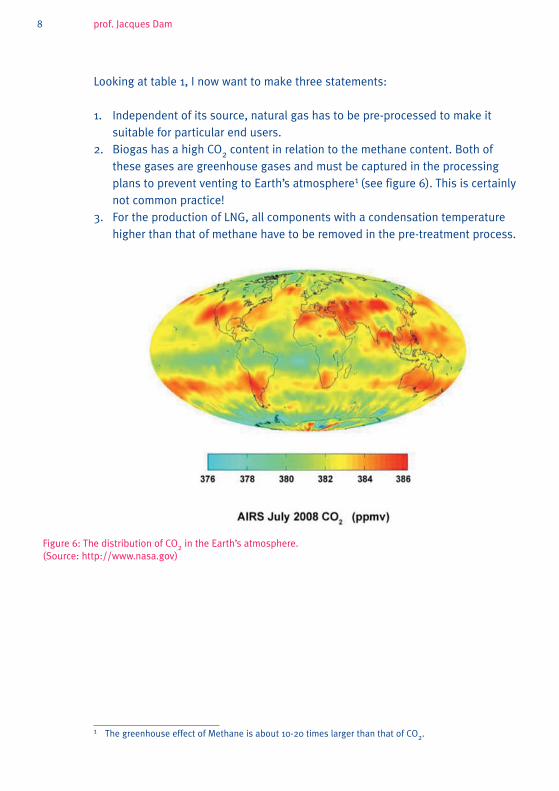
2. Biogas has a high CO2 content in relation to the methane content. Both ofthese gases are greenhouse gases and must be captured in the processingplans to prevent venting to Earth’s atmosphere1 (see figure 6). This is certainlynot common practice!
3. For the production of LNG, all components with a condensation temperaturehigher than that of methane have to be removed in the pre-treatment process.
1 The greenhouse effect of Methane is about 10-20 times larger than that of CO2.
Figure 6: The distribution of CO2 in the Earth’s atmosphere. (Source: http://www.nasa.gov)

9
We will continue this lecture following the natural gas flow in what is called theLNG supply chain starting with the upstream or base-load LNG production asshown in figure 7.
In this lecture I will not go into detail on the traditional natural gas pre-treatmentprocesses such as the amine, membrane, PSA, molecular sieve, refrigeration orglycol process each of which is an extensive system on its own, but focus here onthe cryogenic gas pre-treatment technique.
Cryogenic Natural Gas Pre-treatmentAll components with a condensation temperature above that of methane (criticalpoint 190.5K @ 46bara) will condense and/or crystallize somewhere in theprocess during cool-down and must be separated from the natural gas feedstream as part of the liquefaction cycle as these components are undesirable in the LNG composition mixture. This requires physical and mathematical models on:1. Condensation and crystallization initiation in a sub-cooled forced flow
(molecular dynamics modeling).2. Growth or collaps of droplets or crystals (diffusion driven models). 3. Fluid wall interaction (inducing spatial separation of the multiphase flow
allowing twister or rotating separation techniques).4. An adequate equation of state for the natural gas mixture.It also requires experiments that supports and validated these models.
Base-load, upstream LNG production
Gas Field Gas pre-treatment
CO2/H2S
Heavy Components
Mercury
H2O
Liquefaction Storage
Inhibitor separation
Solid component removal
Pressure reduction
Figure 7: The basis lay-out of the upstream (base load) LNG supply chain.

10 prof. Jacques Dam
The simulation of phase changing flow has to deal with mathematical problems like:• The modeling of flash condensation, evaporation and aggregation in complex
geometries caused by phase transitions. At this moment there are no standard tools for the numerical simulation of these types of flow. It is possible to simulate bubbly flow or mist flow but these simulations do not take shape changes by re-condensation or regasificationinto account. To obtain correct simulations, numerical methods have to bedeveloped that combine discrete Lagrangian particle in a continuous flow withan accurate particle (bubble, crystal or bell) model. An accurate free surfacemodel is required to model the aggregation especially at the edges of the flow.The Lattice Boltzmann method is the preferred approach.
• Molecular dynamic interaction models will be used to simulate the nucleationprocess. The development of the multi-phase mixture flow in time and thusalong the flow path of the feed stream, including fluid wall interaction, will bemodeled using DEM and/or SPH techniques. It will be applied to componentsas heat exchangers and separators.
Using an existing stationary test set-up at the TU/e Department of Engineering where rapid adiabatic expansion will be used to allow components of the methane mixture (CO2 and higher Hydro-Carbons) to be brought into a non-equilibrium state, whereby condensation or crystallization facilitate very controlled growth. This opens the possibility to determine Wilson points, crystallization points and nucleation rates for multi-component methane mixtures. Two stationary experimental set-ups, the Pulse Expansion Wave Tube (PEWT) and the Expansion Cloud Chamber (ECC),are already available and will be modified to allow a starting temperature down to the condensation temperature of the methane itself and the addition of a (cryogenic) forced flow loop allowing the study of nucleation and growth under forced flowconditions. These experimental devices are shown diagrammatically in figure 8.
Figure 8: Schematics of the TU/e, Mechanical Engineering department, Pulse ExpansionWave Tube and Expansion Cloud Chamber experimental setups.
Pulse Expansion Wave Tube (PWET) creates a mono-disperse cloud of droplets.
Expansion Cloud Chamber (ECC) creates droplets with disperse size distribution.

11LNG fuels our future
When successful, cryogenic separation as part of the liquefaction cycle cangreatly reduce the number of process steps (and thus components) in the gas pre-treatment.
I will now focus on the LNG liquefaction technology. This is not only advantageousfor the CAPEX of the upstream LNG plant but will also reduce its footprint and weight that is certainly important for the offshore LNG production using FPSO’s but also mid- and downstream, small-scale, (Bio-) LNG plants for which much smallerproduction volume makes the traditional natural gas pre-treatment too costly.
LNG Liquefaction Technology BasicsAs mentioned in the introduction, the technological basis for the liquefaction ofair and gases derives from the 1898 Linde-Hampson system, where highlycompressed gas is cooled down in a recuperative counter-flow heat exchangerand isenthalpic expanded and thus cooled-down by means of a Joule-Thomsonvalve3]. After expansion, the gas becomes a two-phase liquid-gas mixture. Theliquid is separated and collected in the liquid receiver, and the cold vapor isreturned through the heat exchanger providing cooling for the incomingcompressed, warm gas stream. The Linde-Hampson liquefier, shown in figure 9, iswhat is called an open liquefaction system.
CH 4
HEX
JT
LNG x
x
1 1 -x a
b’
d
c
c
a d
b’’
b
b’
Figure 9: Schematics and cycle diagram of the Linde-Thomson liquefaction cycle for Methane.

12 prof. Jacques Dam
Let us look more closely at evaluating this process and its components. In the ideal
case, the expansion process is isenthalpic (Joule-Thomson coefficient )
and, as an example, when expanded from 200bara, 155K (point b) to 111.5K, 1bara (point b’), approximately 80% of the feed gas is converted into cold methane gasat this saturation temperature and 20% of the feed gas is converted into LNG.
That looks promising however; even in the ideal case of isothermal compressionand 100% effectiveness of the heat exchanger (no temperature differencebetween the feed and return streams at the entrance of the heat exchanger), theexegetic efficiency of this process is only 27.8% and the work of liquefaction is1.1kWh/kg LNG. This energy requirement is much too high for cost-effective,industrial production of LNG. The three main causes of this low efficiency are:1. The thermal imbalance between the warm product feed with the cold product
return stream. 2. The poor isentropic efficiency of the J-T throttling process.3. The efficiency of the compressor.
Most of the modern base-load LNG liquefaction plants are therefore of thecascade type or, to be more precise, of the mixed refrigerant type. These cyclesare much more efficient because they use multiple, secondary, closed coolingcycles to cool down the feed methane stream in a much more efficient way andthe use of expanders with a higher isentropic efficiency. The schematics of a basicmixed refrigerant process, of which the more complex processes are derived from,is given in figure 10.
Figure 10: Basic schematic drawing of the Mixed Refrigerant liquefaction cycle.
=,
µJ–T p h x
T
Methane LNG
MR
C3
Aero-derivative gas-turbine driver for LNG applications, Ëth = 45%.Source: www.ge.com.

13LNG fuels our future
The penalty of secondary closed liquefaction cycle over the open liquefactioncycle is obviously the complex heat exchanger arrangement and, as for anyprocess or component, its design coal is a minimum entropy generation within agiven volume. For the heat exchanger, this minimum entropy generation is,amongst others, achieved if the temperature difference between the refrigerantand the methane feed gas is designed to be minimal. This is where the secondarycycle approach shows its strength.
Let us take one step back and define the energetic framework for the natural gasliquefaction cycles and remember that the minimum, reversible liquefaction workof a gas from the first and second laws of thermodynamics reads:
For a typical natural gas composition, shown in figure 11, with T0=285K and P=50bara, the minimum liquefaction work is LNG at 1bara is approximately0.15kWh/kg LNG produced.
The common C3MR cycle cools down the methane feed gas to -350C by a multistage propane (C3) Joule-Thomson (JT) cycle and is then liquefied and sub-cooled to -1500C by a Mixed Refrigerant (MR) cycle through a large spiral-wound heat exchanger.
– l rev
P xl l0 0 0
W
m,
,= (h – h s sT) – ( – )
Figure 11: Minimum Liquefaction Work for a mixture composition: 0.85% CH4, 0.13% C2H6, 0.02% N2. (Data: RefProp)

14 prof. Jacques Dam
Apen Hysys® simulations (using a feed pressure 50bara) for a similar natural gascomposition give the following efficiencies for the base-load LNG plants mostused cycles4]:SMR cycle: 0.476kWh/kgCascade: 0.444kWh/kgC3MR: 0.295kWh/kg
Best practice numbers for producing LNG are currently 0.23kWh/kg for theSnøhvit LNG plant in Norway and 0.29kWh/kg for a typical base-load LNG plant.
LNG Liquefaction AlternativesIt is clear that LNG production is a very energy-intensive process and designs forbase-load LNG plants therefore have an obvious focus on optimizing the driverand compressor area. On a component level, design trends are firstly to utilizeadapted, highly efficient aero-derivative gas turbines instead of heavy-dutyindustrial turbines to increase LNG production efficiency. Furthermore, varioustypes of isentropic cryogenic liquid expander engines have been used or proposedfor use in LNG facilities instead of the throttling process and, lastly, integration ofthe Natural Gas Liquids (NGL) recovery processes which, with the liquefactionsection of the LNG facility, can significantly reduce the specific power required toproduce LNG. On an LNG plant design level, the Mixed Refrigerant composition,the number of single or multi-stage Mixed Refrigerant and/or Single RefrigerantCycles in combination with heat exchanger optimization and energy recoverytechniques are used to minimize the plant CAPEX and OPEX in relation to the plantefficiency.
Is this the end of the story and are further efficiency improvements for a specificcooling cycle (see figure 12) a task of skilled engineers only? Well no, safetyregulations, available footprint and weight are important, for example, on boardan FPSO and a slightly less efficient reversed Nitrogen Turbo-Brayton Cycle, ornitrogen cycle for short, that is both simple, safe (since the refrigerant isinflammable) and robust might be preferred. In the nitrogen cycle the primerefrigeration medium – pressurized nitrogen – is always kept in the gaseousphase that makes it also insensible to the ship’s motion. Also, nitrogen is found inabundance and is simple and cheap to produce from the surrounding air byseparation. Consequently, no extra hold-up system is required to store severalhydrocarbons, i.e. pentane, butane, propane, ethylene to obtain the proper mix(Mixed Refrigerants). The disadvantage is, as stated, its lower efficieny ofapproximately 0.45-0.8kWh/kg LNG produced (cycle dependent, see figure 12).

15LNG fuels our future
Another new possibility on a system level lies with the reversed Stirling cycle (seefigure 13). This well known regenerative, closed cooling cycle has a higher efficiency than the single Turbo-Brayton Nitrogen Cycle but is, however, much more complex to build as the required flow characteristics inside a large regeneratorrequired for a high thermal efficiency are diminished by thermal streaming andlarge pressure drop. The cycle also uses a warm reciprocating compressor andcold reciprocating expander. Another drawback is that in a single stage Stirlingrefrigerator all heat from the natural gas feed stream is adsorbed at the lowest
temperature which considerably lowers the process efficiency since .
Mid-Scale LNG Base-load LNG
Cascade Precooled MR C
Dual/Cascade MRC
< 0.3-0.4 kWh/kg
Single Mixed Refrigerant
~ 0.4 kWh/kg
Dual Expander N2 cycle
0.55-0.65 kWh/kg
Single Expander N2 cycle
~ 0.8 kWh/kg
Pre-cooled Double Expander N2 cycle
~ 0.45 kWh/kg
Spe
cifi
c P
ower
[kW
h/kg
LN
G]
Relative Plant complexity (capacity)
Figure 12: Specific power for several production cycles for LNG liquefaction.
Figure 13: Efficiency overview of Stirling-cycle refrigerators and liquefiers showing itsthe relation with the cooling capacity.
∆ = Q
TS
16 prof. Jacques Dam
Nevertheless, the use of a Stirling refrigerator in an LNG liquefaction plant might be interesting as the power, even with the disadvantages mentioned, is still high,as the graphs shows, mainly due to the use of the regenerator and an isotropicpiston expander. Also, as in the nitrogen expansion cycle, the refrigerationmedium (helium) is always kept in the gaseous phase. The last large Stirlingrefrigerators were built by Philips some 50 years ago and research on smallrefrigerators has proven that there are possibilities to improve the efficiency ofthe reversed Stirling cycle refrigeration cycle. One option brings the regeneratorentirely in thermal contact with the natural gas feed stream (making in effect acounterflow heat exchanger of which one of the branches is the Stirling cycleregenerator)1,6]. Another option is to use a helium mixed refrigerant as therefrigeration medium2]. The use of carbon nano-fibers in the regenerator can bothlower the pressure drop and increase the heat transfer coefficient between therefrigerant and the regenerator material. A first cycle evaluation shows that itmust be possible to replace the mixed refrigerant cycle by a reversed Stirling cycleleading to 10-15% higher LNG plant efficiency with fewer components. Also, theStirling cycle is in theory reversible, which makes it possible to use, with equalefficiency, a similar cycle design for cold energy recovery.
In the near future we will focus, first on the flow simulation and optimization ofsuch a LNG liquefier and will, in a later phase, include the cryogenic natural gaspre-treatment in the simulations. It is the intention to build a low-powerdemonstrator. A full-size pilot is limited by the maximum size of the reciprocatingcompressor currently available, about 40MW. which makes its technique onlysuitable for mid- and downstream, small-size (Bio-) LNG liquefaction or FPSO’s.
The flow simulation of large Stirling engines then has to deal with mathematicalproblems like:• The multi-scale aspects of (mixed refrigerant) forced flow.
To make it possible to maximize the efficiency of a component as aregenerator, optimization is required on both the small scale (a regenerator isnormally filled with porous material, a fine mesh or grains of some material) aswell as on the large scale to find thermal streaming or model the flow entranceor exit. We will have to use an Effective Medium Approximation (EMA) fromflow calculations on the small scale by means of homogenization andpercolation-theory to combine them in a set of efficient numerical tools.

17LNG fuels our future
• Nano-structures in oscillating flows.The thermal efficiency of heat exchanges and regenerators can often only beimproved by maximizing the path length of the flow. Unfortunately thedownside is an increased pressure drop that lowers the efficiency. There isevidence that the use of nano-structures like carbon nano-tubes on the heatexchange surface increases the heat exchange coefficient and, at the sametime, lowers the pressure drop as it reduces drag. Unfortunately, is difficult toperform experiments on the complex geometries as required so we will use aDiscrete Element Method (DEM) model of a nano-structure and its behavior inreal flow conditions. If we look at the interaction of a large amount of thesenano-structures it is essential that they can be shifted from the relativelysimple time integration solvers to solvers for Differential Algebraic Equations(DAE), where the algebraic relations between the nano-structure elements andbetween the these elements and their surroundings can be explicitly solved.By applying this mathematical technique, it is possible to determine for thesenano-structures where and how, in which density, with what geometricalproperties these structures must be applied for optimal results in heatexchange and thus improved efficiency.
Apart from the Stirling refrigerator active, refrigerated heat exchangers can alsoprove to be very advantageous for both liquefaction and storage systems as thefollowing discussion point shows.
Active Cryogenic Containment SystemsAnother area of interest is the use of thermo-electric materials in the LNG supplychain although presently there is zero interest in them due to their very low COP,which at best is up to 5%2.
In classical textbooks, the maximum COP for thermo-electric materials depends
on their Figure of Merit, ZT, as
Here, S is the Seebeck coefficient, T the absolute temperature and Û and Î the electrical and thermal conductivity where the suffix e and p refer to the electron and proton contribution to the thermal conductivity. It is clear that if a thermo-electricmaterial were available with a ZT=2 @ 300K, it would compete with vapor-compression cooling.
= in which ZTCOPmax T
T 1+ZT
1+ZT +1cold T cold
TTS
k ke p
2hot
=
2 The Stirling refrigerator SPC-04 of Stirling Cryogenics and Refrigeration B.V. has a COP of 30% @ 150K.
18 prof. Jacques Dam
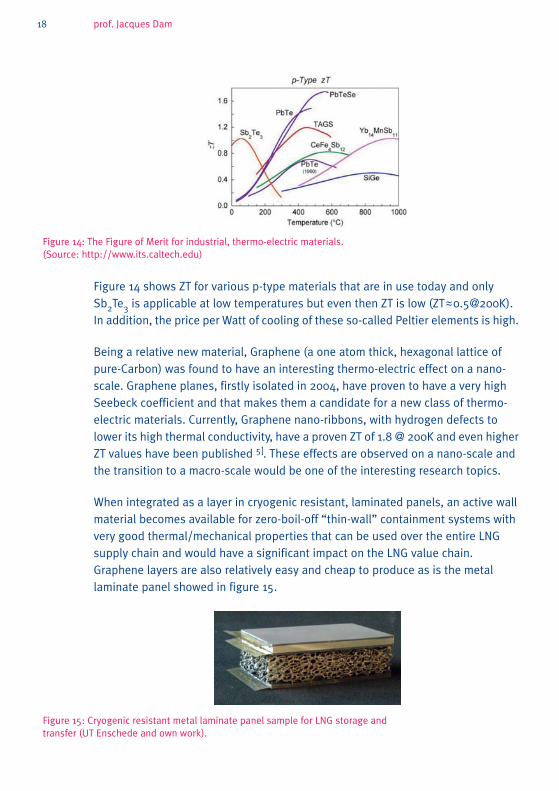
Figure 14 shows ZT for various p-type materials that are in use today and onlySb2Te3 is applicable at low temperatures but even then ZT is low (ZT~~0.5@200K). In addition, the price per Watt of cooling of these so-called Peltier elements is high.
Being a relative new material, Graphene (a one atom thick, hexagonal lattice ofpure-Carbon) was found to have an interesting thermo-electric effect on a nano-scale. Graphene planes, firstly isolated in 2004, have proven to have a very highSeebeck coefficient and that makes them a candidate for a new class of thermo-electric materials. Currently, Graphene nano-ribbons, with hydrogen defects to lower its high thermal conductivity, have a proven ZT of 1.8 @ 200K and even higher ZT values have been published 5]. These effects are observed on a nano-scale andthe transition to a macro-scale would be one of the interesting research topics.
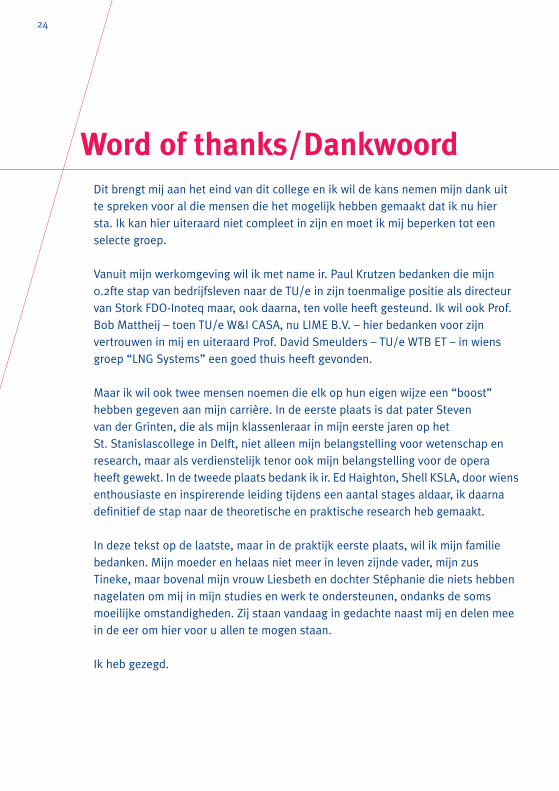
When integrated as a layer in cryogenic resistant, laminated panels, an active wallmaterial becomes available for zero-boil-off “thin-wall” containment systems withvery good thermal/mechanical properties that can be used over the entire LNGsupply chain and would have a significant impact on the LNG value chain.Graphene layers are also relatively easy and cheap to produce as is the metallaminate panel showed in figure 15.
Figure 14: The Figure of Merit for industrial, thermo-electric materials.(Source: http://www.its.caltech.edu)
Figure 15: Cryogenic resistant metal laminate panel sample for LNG storage andtransfer (UT Enschede and own work).

19
The last item I want to discuss in this lecture is the downstream or small-scaleLNG supply chain, part of which is known as the LNG fuel supply chain.
The generally accepted, traditional downstream LNG supply chain is shown infigure 16. Apart from the traditional flow of LNG, being regassed and fed to thegas grid, the LNG fuel delivery structure is also shown.
LNG as a Green Fuel for PropulsionThere is a growing interest in the use of natural gas as fuel for the propulsion oftrucks, trains and ships. Natural gas is, in relation to already existing and futureemission legislation, an excellent fuel and LNG is the most practical way of storinga large quantity of this gas.
Downstream LNG and theLNG fuel supply chain
Figure 16: The down stream (small-scale) LNG (fuel) supply chain. (Source: http://www.nrgbattle.com/cases-and-innovation/)

20 prof. Jacques Dam
All that has been said so far on present and future LNG technology can also beenapplied to the downstream LNG market. However, a coherent fuel systemapproach will reveal possibilities that ensure a more sustainable and possibly“green” use of LNG as a transport fuel. By combining Bio-LNG and hydrogen fromsurplus (windmill) generated electricity as components of the LNG fuel mixturecomposition, it is possible to define the LNG methane number and Wobbe-indexrelatively independent from the mainstream LNG import and with goodopportunities for combustion optimization. This uses a “stabilized” LNG fuelquality definition within a narrow bandwidth, a minimum energy intake for theLNG fuel supply chain and a maximum contribution in achieving the government’senvironmental goals. It is good to summarize them here because thegovernment’s involvement is also an important factor for success.• 20% CO2 emission reduction by 2020, reference year 1990.• 20% renewable energy by 2020.• 20% improvement of energy-efficiency by 2020, reference year 1990.The layout for such a sustainable LNG fuel production chain is shown in figure 17.The reduction in emissions between diesel and LNG fuel is shown in figure 18.
Figure 17: The sustainable LNG fuel production chain. (Source: Energy Valley, Groningen)

21LNG fuels our future
For LNG fuel this can be translated as:• Zero unburned methane emission from any process.• CO2 neutral production of LNG fuel (can only be achieved by adding
sustainable components).• Maximum use of cold energy recovery processes. • Minimum number of components and/or processes in the LNG supply chain.
It is the intention to start with the development of multi-discipline, multi-scalesimulation models that combine mass and energy balances of both physical andchemical processes with economic optimization models for the sustainable fuelchain including wind and bio processes. Simultaneous optimization of theparameters of all processes ensures that the solution of this “smart fuel chain”approach does not only fulfill the environmental requirements but is also aneconomically sound solution that does not depend on subsidy or a special tax orlegal climate.
Cold Energy Recovery The second area of interest is a cold energy recovery process using thermalengines for the LNG fuel chain that transfer heat into electricity. The problem isthat the available temperature difference between LNG and the environment is 160 degrees at best, which is low for efficiently driving a thermal engine. An interesting candidate here is the Stirling engine for the largest types still in production, run as already indicated at 30% of the Carnot efficiency.
Figure 18: A comparison between diesel and LNG fueled truck emissions.

22 prof. Jacques Dam
This efficiency can be increased as result of the research mentioned earlier. As anexample I will show here the basic layout of an energy neutral LNG fuel stationconcept that uses such a thermal engine to make the thermodynamic transitionfrom saturated LNG stored at 1bara and saturated LNG at 8 or 18bara that isdelivered to a truck (see figure 19).
Both the normal Stirling cycle (motor) and the reversed Stirling cycle (refrigerator)can be developed using a similar development program.
In the future, the use of LNG as a fuel also opens the way for an efficient gasturbine-electric drive solutions using HTS superconducting engines, but we willnot go into detail today on this concept. It is subject in the general goal of findinginteresting technology solutions for the LNG fuel chain, including end-users.
LP LNG pump
LNG storage 1bara, 111.5K
Ambient-air heat
exchanger
LNG delivery 8 or 18 bara saturated
11/21kWh during delivery
Thermal engine
Figure 19: The basis layout of an energy neutral LNG fuel station with a thermal engine.

23
In energy-intensive LNG there is a never-ending search for more efficient and“green” techniques to clean and liquefy the natural gas. More efficient andtechniques are directly translated into a smaller footprint and less weightespecially in relation to offshore LNG production. Efficient storage is also key asthermal losses directly affect net production capacity. For use of LNG as atransport fuel, the current state-of-the-art containment systems are basically thesame double-wall, vacuum insulated containers that are in use for all cryogenicliquids. These containers are not always compliant with an optimal layout of aship’s infrastructure, are expensive and present possible problems or additionallogistics and infrastructure when the ship is in an idle mode.
For all these challenges, new energy-efficient processes and components have tobe developed in relation to environmental regulations and within a socialaccepted framework.
As has been argued, physical-mathematical models and numerical simulationtechniques are required that make it possible to descend from a systemsimulation approach to a sometimes molecular approach to include certaineffects and thus have a multi-scale simulation capability. Apart from that,thorough experimental validation will always be required.
The research on “LNG fuel” is typically a multi-disciplinary subject that encourages collaboration between universities, knowledge centers and the industry, andfulfills all the requirements for connecting to the Dutch “top sector” policy andEuropean funded projects on (green) energy.
Conclusions
24
Dit brengt mij aan het eind van dit college en ik wil de kans nemen mijn dank uitte spreken voor al die mensen die het mogelijk hebben gemaakt dat ik nu hiersta. Ik kan hier uiteraard niet compleet in zijn en moet ik mij beperken tot eenselecte groep.
Vanuit mijn werkomgeving wil ik met name ir. Paul Krutzen bedanken die mijn0.2fte stap van bedrijfsleven naar de TU/e in zijn toenmalige positie als directeurvan Stork FDO-Inoteq maar, ook daarna, ten volle heeft gesteund. Ik wil ook Prof.Bob Mattheij – toen TU/e W&I CASA, nu LIME B.V. – hier bedanken voor zijnvertrouwen in mij en uiteraard Prof. David Smeulders – TU/e WTB ET – in wiensgroep “LNG Systems” een goed thuis heeft gevonden.
Maar ik wil ook twee mensen noemen die elk op hun eigen wijze een “boost”hebben gegeven aan mijn carrière. In de eerste plaats is dat pater Steven van der Grinten, die als mijn klassenleraar in mijn eerste jaren op het St. Stanislascollege in Delft, niet alleen mijn belangstelling voor wetenschap enresearch, maar als verdienstelijk tenor ook mijn belangstelling voor de opera heeft gewekt. In de tweede plaats bedank ik ir. Ed Haighton, Shell KSLA, door wiens enthousiaste en inspirerende leiding tijdens een aantal stages aldaar, ik daarnadefinitief de stap naar de theoretische en praktische research heb gemaakt.
In deze tekst op de laatste, maar in de praktijk eerste plaats, wil ik mijn familiebedanken. Mijn moeder en helaas niet meer in leven zijnde vader, mijn zusTineke, maar bovenal mijn vrouw Liesbeth en dochter Stéphanie die niets hebbennagelaten om mij in mijn studies en werk te ondersteunen, ondanks de somsmoeilijke omstandigheden. Zij staan vandaag in gedachte naast mij en delen meein de eer om hier voor u allen te mogen staan.
Ik heb gezegd.
Word of thanks/Dankwoord

25
1] Radebough, R, 2000. “Regenerator behavior with heat input or removal atintermediate temperatures”, 11th International Cryocooler Conf, june 20-22.
2] West, C.C., 1982, “Two-phase, two-component Stirling engine with controlledevaporation”, Contract report no. W-7405-eng-26, Oak Ridge NationalLaboratory.
3] Vrabec, J, 2009. “Joule-Thomson inversion curves of mixtures by molecularsimulation in comparison to advanced equeations of state: natural gas as anexample”, Physics. Chem. Ph, 23 april 2009.
4] Yoon, J, 2009. “Characteristics of Cascade and C3MR cycle on Natural gasliquefaction process”, World Academy of Science, Engineering andTechnology, 35, 185-189.
5] Ni, X, 2009. “Disorder enhances thermoelectric figure of metit in armchairgraphane nanoribbons”, Applied Physics Letters, 95, 192114.
6] Will, M.E., 2005. “Counterflow pulse-tube refrigerators”, Thesis TU/e.7] Weijermars, R., 2012, “Strategy implications of world gas market dynamics”,
Energy Strategy Reviews, Vol. 1, march 2012, 66-70.
References

26 prof. Jacques Dam

27
Jacques Dam (1954) graduated in Applied Physics at the Technische HogeschoolDelft where he also obtained his PhD in 1989 then named the Technical UniversityDelft. He then joined the design team of the superconducting AGOR cyclotron, nowin operation at the University of Groningen (RUG). From 1996 to 2001, he workedfor Stirling Cryogenics, and from 2001 to 2006, for ESA and Thales Cryogenics. In2006, he joined Stork Inoteq, working to develop cryogenic systems andcomponents for the LNG industry. In 2009, he was appointed associate professorin the TU/e CASA group, developing efficient numerical calculation methods forthe LNG industry. In 2011, he became the science director of the LNG TR&DFoundation, and in 2012, he was appointed LNG Senior Manager at the EnergyValley Foundation, where he is working to develop a European LNG fuel supplychain.
Curriculum vitaeProf. Jacques Dam was appointed part-time professor of LNG Systems in the
Department of Mechanical Engineering at Eindhoven University of Technology (TU/e)on 1 September 2012.

28 prof. Jacques Dam
Colophon
ProductionCommunicatie Expertise Centrum TU/e
Cover photographyRob Stork, Eindhoven
DesignGrefo Prepress,Sint-Oedenrode
PrintDrukkerij Snep, Eindhoven
ISBN 978-90-444-3346-6NUR 978
Digital version:www.tue.nl/bib/

Visiting addressDen Dolech 25612 AZ EindhovenThe Netherlands
Postal addressP.O.Box 5135600 MB Eindhoven The Netherlands
Tel. +31 40 247 91 11www.tue.nl
Where innovation starts
/ Department of Mechanical Engineering
Inaugural lecture
Prof. Jacques Dam
March 1, 2013
LNG fuels our future