lncrnas as novel indicators of patients' prognosis in stage i
TRANSCRIPT

1
lncRNAs as novel indicators of patients’ prognosis in stage I epithelial ovarian
cancer: a retrospective and multicentric study
Paolo Martini°, Lara Paracchini°, Giulia Caratti2, Maurizia Mello-Grand3, Robert Fruscio4, Luca Beltrame2, Enrica Calura1, Gabriele Sales1, Antonella Ravaggi5, Eliana Bignotti5, Franco E. Odicino6, Enrico Sartori6, Patrizia Perego7, Dionyssios Katsaros8, Ilaria Craparotta2, Giovanna Chiorino3, Stefano Cagnin1,9, Laura Mannarino2, Lorenzo Ceppi4, Costantino Mangioni10, Chiara Ghimenti3, Maurizio D’Incalci2*, Sergio Marchini2$, Chiara Romualdi1$ Authors’ Affiliation 1Department of Biology, University of Padova, Italy.2Department of Oncology, IRCCS Istituto “Mario Negri” Milano, Italy.3Cancer Genomics Laboratory, Edo and Elvo Tempia Valenta Foundation, Biella, Italy.4Clinic of Obstetrics and Gynaecology, University of Milano-Bicocca, San Gerardo Hospital, Monza, Italy.5 Division of Gynaecologic Oncology, “Angelo Nocivelli” Institute of Molecular Medicine, University of Brescia, Brescia, Italy.6Department of Obstetrics and Gynecology, University of Brescia, Italy.7Pathology Unit University of Milan-Bicocca, San Gerardo Hospital, Monza, Italy.8Azienda Ospedaliero-Universitaria Città della Salute, Presidio S Anna e Department of Surgical Science, Gynecology, University of Torino, Torino, Italy9C.R.I.B.I. Biotechnology Centre, University of Padova, Italy. 10A.O. della Provincia di Lecco -P.O.A Manzoni, Lecco, Italy ° equally contributed $ co-last * corresponding Running title: lncRNA signature with prognostic relevance in stage I EOC
Disclosure of Potential Conflicts of Interest The authors declare no potential conflicts of interest Number of tables: 3 Number of figures: 3 Word count: 4853 words Correspondence to: Dr. Maurizio D’Incalci, Department of Oncology IRCCS “Mario Negri” Institute for Pharmacological Research. Via La Masa 19, 20156 Milano Italy +39-02-39014-473 [email protected]
Research. on March 15, 2018. © 2016 American Association for Cancerclincancerres.aacrjournals.org Downloaded from
Author manuscripts have been peer reviewed and accepted for publication but have not yet been edited. Author Manuscript Published OnlineFirst on November 8, 2016; DOI: 10.1158/1078-0432.CCR-16-1402
2
Statement of translational relevance
The present study shows that in stage I epithelial ovarian cancer, defects in lncRNA transcription regulation of lnc-SERTAD2-3, lnc-SOX4-1 lnc-HRCT1-1 and PVT1 are independent prognostic markers of relapse and poor prognosis. These findings corroborate the idea that the expression levels of the transcripts can be used to stratify stage I ovarian cancer patients more accurately, thus selecting the most appropriate therapies according to their risk of relapse. In addition the findings provide the rationale to investigate novel therapies in the selected stage I ovarian cancer patients' cohorts.
Key words: lncRNA; stage I EOC; lnc-SERTAD2-3, lnc-SOX4-1, lnc-HRCT1-1 and PVT1 Grant support We acknowledge the Nerina and Mario Mattioli Foundation, Alleanza Contro il Tumore Ovarico (ACTO), the Italian Association for Cancer Research (AIRC IG11673 and IG: 15177 to S. Marchini; IG 2015 Id 17185 to C. Romualdi), CARIPLO Foundation (Grant Number, x2013-0815 to S. Marchini, C. Romualdi, and E. Sartori; Grant Number, 2015-0848 to L. Beltrame and E. Calura), CARIPLO Foundation Project for Excellence 2012 (The Role of coding and non-coding RNA in chronic myeloproliferative neoplasms: from bioinformatics to translational research), CRIBI Center for high performance computing resources funded by the Regione Veneto (grant number RISIB project SMUPR no. 4145). List of abbreviations CI, confidence interval HR, hazard ratio IQR, inter-quantile range KM, Kaplan-Meier OR, odd ratio CI, confidence interval ISC, integrated signature classifier lncRNA, long non coding RNA OS, overall survival PFS, progression free survival Pt, platinum
Research. on March 15, 2018. © 2016 American Association for Cancerclincancerres.aacrjournals.org Downloaded from
Author manuscripts have been peer reviewed and accepted for publication but have not yet been edited. Author Manuscript Published OnlineFirst on November 8, 2016; DOI: 10.1158/1078-0432.CCR-16-1402
3
Abstract 1 Purpose: Stage I epithelial ovarian cancer (EOC) represents about 10% of all EOCs 2 and is characterized by good prognosis with fewer than 20% of patients relapsing. As 3 it occurs less frequently than advanced stage EOC, its molecular features have not 4 been thoroughly investigated. We have demonstrated that in stage I EOC hsa-miR-5 200c-3p can predict patients’ outcome. In the present study, we analyzed the 6 expression of long non-coding RNAs (lncRNAs) to enable potential definition of a 7 non coding transcriptional signature with prognostic relevance for stage I EOC. 8 Experimental Design: 202 snap-frozen stage I EOC tumor biopsies, 47 of which 9 relapsed, were gathered together from three independent tumor tissue collections and 10 subdivided into a training set (n=73) and a validation set (n=129). Median follow up 11 was 9 years. LncRNAs’ expression profiles were correlated in univariate and 12 multivariate analysis with overall survival (OS) and progression free survival (PFS). 13 Results: The expression of lnc-SERTAD2-3, lnc-SOX4-1, lnc-HRCT1-1 and PVT1 are 14 associated in univariate and multivariate analyses with relapse and poor outcome in 15 both training and validation sets (p<0.001). Using the expression profiles of PVT1, 16 lnc-SERTAD2-3 and hsa-miR-200c-3p simultaneously, it was possible to stratify 17 patients into high and low risk. The OS for high and low risk individuals are 36 and 18 123 months respectively (OR=15.55 3.81-63.36 CI 95%). 19 Conclusions: We have identified a non-coding transcriptional signature predictor of 20 survival and biomarker of relapse for stage I EOC. 21 22
Research. on March 15, 2018. © 2016 American Association for Cancerclincancerres.aacrjournals.org Downloaded from
Author manuscripts have been peer reviewed and accepted for publication but have not yet been edited. Author Manuscript Published OnlineFirst on November 8, 2016; DOI: 10.1158/1078-0432.CCR-16-1402
4
Introduction. 23 Patients diagnosed with stage I epithelial ovarian cancer (EOC) tend to have a good 24 prognosis, with more than 80% surviving five years from the diagnosis. This situation 25 differs significantly from patients with the more commonly diagnosed EOCs of stage 26 III/IV. Stage I EOC is a rare disease, which is diagnosed in less than 10% of EOC 27 patients (1,2). The clinical management of stage I EOC is confounded by the 28 difficulty to identify at diagnosis, the small fraction of patients (almost 20%) who will 29 not respond to platinum (Pt) based therapy and will relapse with progressively 30 resistant and fatal disease (1,3). 31 Tumor grade is currently the most common prognostic parameter for stage I disease. 32 Routinely used histological and clinical classifiers are unable to efficiently predict 33 those patients who will eventually relapse and thus could immediately benefit from 34 different therapeutic approaches. Thus, it is of utmost importance to identify 35 molecular biomarkers able to predict the outcome of patients with stage I EOC and/or 36 to stratify such patients’ risk of relapse (4). 37 We have recently identified genetic and epigenetic defects in the control of 38 transcriptional regulation which correlate with prognosis of stage I EOC (5–7). 39 Specifically, we have shown that miR-200c-3p is a predictor of survival and a 40 biomarker of relapse in stage I EOC, independent of clinical covariates (6). Further 41 analysis based on integration of miRNAs and gene expression signatures, defined that 42 miR-200c-3p is an element of an integrated signature classifier (ISC) based on 16 43 miRNAs and 10 coding genes that control cell cycle progression, Activin/Inhibin 44 pathways and Hedgehog signaling (5). The expression levels of the ISC stratified 45 patients’ risk of relapse into high and low risk better than conventional clinical and 46 histological based classifiers (5). 47
Research. on March 15, 2018. © 2016 American Association for Cancerclincancerres.aacrjournals.org Downloaded from
Author manuscripts have been peer reviewed and accepted for publication but have not yet been edited. Author Manuscript Published OnlineFirst on November 8, 2016; DOI: 10.1158/1078-0432.CCR-16-1402
5
To allow dissection of detailed mechanisms of transcriptional regulation associated 48 with poor prognosis and relapse in stage I EOC, we focused our attention on another 49 type of non coding RNAs with regulatory functions: the long non-coding RNAs 50 (lncRNAs). lncRNAs are broadly classified as transcripts longer than 200 nucleotides 51 without coding potential but with essential biological properties. lncRNA genes are 52 evolutionarily conserved and often expressed in a tissue-specific manner (8). 53 Although their functions have been poorly characterized to date, evidence suggests 54 that lncRNAs contribute to the dynamic regulation of gene expression programs by 55 several mechanisms (9–12). lncRNA expression patterns correlated with various 56 cellular processes (13), and deregulation of lncRNA expression emerges as an 57 important determinant of tumor development, progression, and therapy response 58 (10,14,15). Therefore, the elucidation of the roles of lncRNAs in tumors might allow 59 deeper insights into the molecular biology of cancer and improve response to therapy. 60 The aim of this work was to correlate for the first time the clinical outcome of patients 61 with EOC stage I with expression of lncRNAs. Correlations of this kind might help 62 reveal biological mechanisms that determine the response of patients with stage I 63 EOC to Pt based chemotherapy, and they might suggest novel therapeutic strategies 64 for stage I EOC. 65 66
Research. on March 15, 2018. © 2016 American Association for Cancerclincancerres.aacrjournals.org Downloaded from
Author manuscripts have been peer reviewed and accepted for publication but have not yet been edited. Author Manuscript Published OnlineFirst on November 8, 2016; DOI: 10.1158/1078-0432.CCR-16-1402
6
Material and Methods 67 Tissue sample collection and experimental design 68 A cohort of 202 snap-frozen tumor biopsies was collected from three independent 69 Italian tumor tissue collections, as previously described (5,16). Written informed 70 consent was obtained from all patients enrolled in the study according to the 71 Declaration of Helsinki principles. Patient information pertaining to anatomy and 72 pathology was registered, and follow-up data were obtained from regular 73 gynecological and oncological check-ups. The ethical committees of the centers 74 taking part in the study approved the collection and the use of the samples. A detailed 75 description of the three cohorts is described in Table 1 and Supplementary Section 1. 76 Concerning the experimental design, patients were randomly split into a 73-patient 77 training set and a 129-patient validation set. In the random selection histotype and 78 grade annotations were taken into account in order to achieve a homogeneous 79 distribution of these variables in both datasets. Except for endometrioid histotype (test 80 of proportion p value = 0.0276), all the other categories were equally distributed. The 81 sample size in the training set was estimated with the powerSurvEpi ver. 0.0.9 – 82 CRAN R package. We wanted the sample size to be the minimal one required to 83 allow a statistical power greater than 0.8 to detect a statistically significant hazard 84 ratio (HR) greater than 1.6 (with alpha level set to 0.05) using a Cox proportional 85 hazard model. The present study was carried out following the REMARK guidelines 86 (17) (see Supplementary Section 1, Table S1.1). 87 lncRNA expression profile data analysis and signature validation 88 lncRNA and gene expression profiles were established according to well-standardized 89 protocols (6,16). Details are reported in Supplementary Section 2. The raw data are 90 available at Array Express E-MTAB-1814. lncRNA expression levels were validated 91 by RT-qPCR as previously described (detailed in Supplementary Section 2 and 92
Research. on March 15, 2018. © 2016 American Association for Cancerclincancerres.aacrjournals.org Downloaded from
Author manuscripts have been peer reviewed and accepted for publication but have not yet been edited. Author Manuscript Published OnlineFirst on November 8, 2016; DOI: 10.1158/1078-0432.CCR-16-1402
7
references (6,16)). hsa-miR-200c-3p expression levels were measured with 93 commercial available reagents (Qiagen) following protocols previously described (6). 94 lncRNA subcellular localization 95 lncRNAs subcellular localization enrichment was measured by microarray and RT-96 qPCR analyses in nuclear and cytoplasmic extracts from 5 well-known ovarian cancer 97 cell lines (OVCAR8, OVCAR3, A2780, OVCA432 and CAOV3). Microarray and 98 RT-qPCR experiments were performed as described for lncRNAs and mRNA 99 expression profiles (for details see Supplementary Section 3). The five ovarian cancer 100 cell lines (OVCAR8, OVCAR3, A2780, OVCA432 and CAOV3) were tested and 101 authenticated before their ultimate storage (October 2014) in cell growth medium 102 supplemented with an equal volume of FBS and a double volume of “cryoprotective 103 medium” (Lonza). Cells were stored in liquid nitrogen. 104 Network and pathway analysis 105 lncRNA-target co-expression was identified using a network reconstruction approach 106 called ARACNE (upgraded with Package parmigene ver. 1.0.2 for R-language) (18). 107 Briefly, we computed the mutual information (MI) between all mRNAs, lncRNAs and 108 miRNAs. Significant interactions (MI >= 99th percentile of a null distribution 109 obtained by permutations of the dataset) were identified through the ARACNE 110 algorithm. The co-expression network was used to derive co-expressed interactors 111 with the lncRNAs. A hypergeometric test was used to select those pathways showing 112 a significant enrichment in lncRNA co-expressed interactors (see Supplementary 113 Section 4). 114 For each lncRNA, we performed pathway analysis using the microGraphite pipeline 115 (19–21) comparing the expression profiles of patients with good and bad prognoses 116
Research. on March 15, 2018. © 2016 American Association for Cancerclincancerres.aacrjournals.org Downloaded from
Author manuscripts have been peer reviewed and accepted for publication but have not yet been edited. Author Manuscript Published OnlineFirst on November 8, 2016; DOI: 10.1158/1078-0432.CCR-16-1402
8
according to the selected lncRNA expression profile (median value as threshold – see 117 Supplementary Section 4). 118 Statistical analysis. 119 All statistical analyses were carried out in R language environment (R ver. 3.3.1) 120 unless otherwise stated. Sam-paired T-test was performed using TMEV 121 (www.tm4.org - ver. 4.8). Univariate and multivariate survival analyses were 122 performed using respectively Kaplan-Meier (KM) curves with log-rank test and the 123 Cox model with grade, histotype and chemotherapy as covariates. Expression values 124 were converted into classes High and Low for values above and below the median, 125 respectively. The Wilcoxon test (two-sided) was used to compare median expression 126 levels of relapsers versus non-relapsers. A hypergeometric test (phyper R function) 127 was used to compute the enrichment of first neighbors of lncRNAs in KEGG 128 pathways. Test for equal proportion was carried out using pro.test R function. 129 130
Research. on March 15, 2018. © 2016 American Association for Cancerclincancerres.aacrjournals.org Downloaded from
Author manuscripts have been peer reviewed and accepted for publication but have not yet been edited. Author Manuscript Published OnlineFirst on November 8, 2016; DOI: 10.1158/1078-0432.CCR-16-1402
9
Results 131 Patient characteristics 132 Table 1 shows the histopathology of the tumor samples and the number of patients 133 who received post surgical chemotherapy. All biopsies were from patients naïve to 134 chemotherapy at the time of primary surgery. Histopathological features have been 135 investigated, by independent pathologists according to FIGO guidelines (22). 136 Subtypes and grades were evenly distributed across patients, i.e. they occurred in 137 equal proportions between the training set (n=73) and the validation set (n=129) as 138 described under Methods. The mean follow-up time was nine years (1-18 years) for 139 the training set and six years (0-18 years) for the validation set. At the last follow-up 140 76.7% of patients were still alive (n=54, 74.0% of patients in the training set and 141 n=101, 78.3% of patients in the validation set), and 76.7% were progression free 142 (n=52, 71.2% of patients in the training set and n=101, 78.3% of patients in the 143 validation set). As to the chemotherapy regimens used, 56.2% of patients (n=41) in 144 the training set and 73.6% of patients (n=95) in the validation set received Pt-based 145 adjuvant chemotherapy (overall 67.3%, n=136). Twenty-one of the 73 samples in the 146 training set (28.7%) and 26 of the 129 samples in the validation set (20.2%) 147 originated from patients who relapsed after Pt based chemotherapy. These are referred 148 to in the following as relapsers (overall, 23.3%, n=47). The Univariate Cox 149 proportional hazards model (Table 1) indicates that grade ‘G3’, sub-stage ‘c’ and 150 chemotherapy were significantly associated with Progression Free Survival (PFS). No 151 association was observed for Overall Survival (OS). As detailed in Supplementary 152 Section 1 and as published previously (16), survival models show that this cohort is 153 representative of stage I EOC, as PFS and OS are similar to those reported in the 154 literature with respect to sub-stage, grading and histotype (23). 155
Research. on March 15, 2018. © 2016 American Association for Cancerclincancerres.aacrjournals.org Downloaded from
Author manuscripts have been peer reviewed and accepted for publication but have not yet been edited. Author Manuscript Published OnlineFirst on November 8, 2016; DOI: 10.1158/1078-0432.CCR-16-1402
10
Overall study design 156 We developed a multidisciplinary approach summarized in Supplementary Section 1 157 (Figure S1.1) Briefly, in the training set we screened more than 5000 lncRNAs for 158 association with OS and PFS using microarray based expression levels. Orthogonal 159 multivariate analysis of both training and validation sets by RT-qPCR identified four 160 lncRNAs the expression levels of which were associated with OS and PFS 161 independent of clinical covariates. In order to obtain deeper insights of biological 162 functions of selected lncRNAs, in vitro ovarian cancer cell lines were used as a model 163 to investigate subcellular localization Three out of four lncRNAs with prognostic 164 relevance were clearly localized in the nuclei allowing prediction of their roles in 165 transcriptional regulation. Based on this assumption and using microGraphite 166 pipeline (19), we derived a subnet of a biological network (defined from now 167 onwards as regulatory circuit ) with prognostic relevance, tightly associated with 168 the lncRNAs expression. To conclude, we combined the expression signatures of 169 both lncRNAs and miRNAs. 170 171 Identification of lncRNAs associated with clinical parameters 172 lncRNAs expression profiles were obtained by microarray experiments on the training 173 set (Supplementary Section 2). To identify lncRNA with potential prognostic value 174 for stage I EOC, we searched for lncRNAs related to disease progression. To that end 175 the univariate survival model was used to individually test all 5156 lncRNA probes 176 for their association with OS and PFS. This strategy resulted in 67 lncRNA probes 177 (corresponding to 63 different lncRNAs) which correlated significantly with patients’ 178 survival, either in terms of OS or PFS. Using grades and histotypes as covariates, we 179 evaluated the effects of lncRNA expression levels on PFS or OS. Multivariate Cox 180
Research. on March 15, 2018. © 2016 American Association for Cancerclincancerres.aacrjournals.org Downloaded from
Author manuscripts have been peer reviewed and accepted for publication but have not yet been edited. Author Manuscript Published OnlineFirst on November 8, 2016; DOI: 10.1158/1078-0432.CCR-16-1402
11
proportional hazards model selected 26 out of the 67 probes (corresponding to 25 181 lncRNA genes) the expression levels of which correlated significantly with either OS 182 or PFS (Supplementary Section 2, Table S2.2). 183 Since the above analyses were based on array probe measures obtained within a 184 complex mixture of transcripts, orthogonal validation of lncRNAs’ expression by RT-185 qPCR was performed to confirm their clinical relevance. To correct for a potential 186 batch effect, RNA for RT-qPCR experiments was purified from a second aliquot of 187 snap frozen material from the same patients selected for the training set. We were able 188 to design primer pairs for only 10 out of 25 selected lncRNAs (see Supplementary 189 Section 2, Table S2.1), as the necessity to test for specific isoforms of lncRNAs 190 constituted a considerable challenge in the design of primers compatible with RT-191 qPCR parameters. 192 193 Influence of lncRNAs expression on survival in the training set 194 RT-qPCR data obtained in the training set were used to i) investigate the potential 195 correlation of selected lncRNAs with clinical variables and ii) stratify, at diagnosis, 196 patients for risk of relapse. 197 Table 2 shows that the expression levels of four lncRNAs, namely lnc-SERTAD2-3, 198 lnc-SOX4-1, lnc-HRCT1-1 and lnc-MYC-2 (also known as PVT1) were associated in 199 both univariate and multivariate analyses with OS and PFS (p<0.05). Univariate 200 model analysis suggests that patients with low expression levels of lnc-SERTAD2-3, 201 lnc-SOX4-1, lnc-HRCT1-1 and PVT1 had longer survival and longer PFS than those 202 with high levels. 203 Figure 1a shows survival plots for the prognostic groups identified by these four 204 lncRNAs. KM curves plotting OS or PFS against median expression values of each of 205
Research. on March 15, 2018. © 2016 American Association for Cancerclincancerres.aacrjournals.org Downloaded from
Author manuscripts have been peer reviewed and accepted for publication but have not yet been edited. Author Manuscript Published OnlineFirst on November 8, 2016; DOI: 10.1158/1078-0432.CCR-16-1402

12
the four selected lncRNAs confirmed these inferences. For example, patients with 206 high levels of lnc-SERTAD2-3 had shorter OS and PFS than those with low levels. 207 The respective OS medians were 35 months versus 138 months with odds-ratio 208 (OR)=9.32, confidence interval (CI)=1.91-45.32. The respective PFS medians were 209 45 months versus 135 months with OR=14.76, CI = 3.07-70.97. KM plots for 210 lncRNAs that did not show such correlations, and median PFS and OS values for each 211 lncRNA, are shown in Supplementary Section 2 (Figure S2.2 and Table S2.3, 212 respectively). 213 lncRNA expression signature and survival in term of OS/PFS including clinical 214 features (histotypes, grades and chemotherapy) were subjected to multivariate 215 analysis using the Cox proportional hazards model. Expression levels of lnc-216 SERTAD2-3, lnc-SOX4-1, lnc-HRCT1-1 and PVT1 are independent prognostic 217 markers of survival (Table 2). Lnc-ABCB4-1 variant 1 was associated only with PFS 218 (p=0.048 and p=0.3 for PFS and OS, respectively) in multivariate analysis. It was 219 therefore excluded from downstream analysis (Table 2). No association was observed 220 for any of the other lncRNAs analyzed. 221 As for potential stratification for risk of relapse (point ii), the median distribution 222 levels of normalized fluorescence intensity and the inter-quantile range (IQR) of each 223 lncRNA in relapsers (n=21) were compared with non–relapsers (n=52). Analysis by 224 Wilcoxon test shows significant differences in the expression level between relapsers 225 and non-relapsers for five of the ten selected lncRNAs (Table 2). Both variants of lnc-226 ABCB4-1 were under-expressed in relapsers compared to non-relapsers, while lnc-227 SERTAD2-3, lnc-SOX4-1, lnc-HCT1-1 and PVT1 were over-expressed in relapsers. 228
Research. on March 15, 2018. © 2016 American Association for Cancerclincancerres.aacrjournals.org Downloaded from
Author manuscripts have been peer reviewed and accepted for publication but have not yet been edited. Author Manuscript Published OnlineFirst on November 8, 2016; DOI: 10.1158/1078-0432.CCR-16-1402
13
In conclusion, the results suggest a lncRNA-based prognostic signature for stage I 229 EOC whose expression stratifies patient risk of relapse and is an independent 230 prognostic marker of poor outcome. 231 232 lncRNA signature analysis in the validation set 233 To demonstrate the reproducibility and the robustness of the identified lncRNA-based 234 prognostic signature, we validated our results in an independent set of patients. 235 Data reported in Table 2 confirms that the expression levels of lnc-SERTAD2-3, lnc-236 SOX4-1, lnc-HRCT1-1 and PVT1 affect survival also in this set of patients. 237 Analysis by univariate model suggests that patients with high expression levels of 238 these four lncRNAs had a shorter survival both in terms of OS and PFS than those 239 with low expression levels. Figure 1b shows the KM curves and results of the log-240 rank test for the four lncRNAs both for OS (lnc-SERTAD-2 p-value=0.00776; lnc-241 SOX4-1 p-value=0.0577; lnc-HRCT1-1 p-value=0.000587; PVT1 p-value=0.000108) 242 and PFS (lnc-SERTAD-2 p-value=0.000429; lnc-SOX4-1 p-value=0.0197; lnc-243 HRCT1-1 p-value=5.92e-06; PVT1 p-value=2.67e-07). For each lncRNA, the 244 complete median values for PFS and OS with relative OR and CI are shown in Table 245 S2.4 (Supplementary Section 2). 246 Analysis by the Cox proportional hazard model revealed that lnc-SERTAD2-3, lnc-247 SOX4-1, lnc-HRCT1-1 and PVT1 are significant prognostic factors for OS and PFS 248 even when corrected for grade, histotypes and chemotherapy (Table 2). 249 Comparing the median expression value of selected lncRNAs between relapsers (n= 250 26) and non relapsers (n=101), we observed that lnc-SERTAD2-3, lnc-SOX4-1, lnc-251 HRCT1-1 and PVT1 were significantly over-expressed in tumor biopsies of the 252 relapsers compared to non relapsers (Table 2). Stage I EOC is not one single disease 253
Research. on March 15, 2018. © 2016 American Association for Cancerclincancerres.aacrjournals.org Downloaded from
Author manuscripts have been peer reviewed and accepted for publication but have not yet been edited. Author Manuscript Published OnlineFirst on November 8, 2016; DOI: 10.1158/1078-0432.CCR-16-1402
14
and patient characteristics differ in terms of histotype. Therefore we questioned 254 whether the prognostic value of selected lncRNA signatures is maintained across 255 different histotypes (Table 3). Multivariate analysis performed on the entire cohort of 256 patients (n=202) suggests that the predictive value of lnc-SERTAD2-3, lnc-SOX4-1 257 lnc-HRCT1-1 and PVT1 is independent of histological covariates (Table 3). 258 259 Subcellular localization of lncRNA 260 Understanding how lncRNAs give rise to specific patterns of gene expression requires 261 the knowledge of their cellular localization. Although the knowledge of the 262 mechanisms of action of lncRNAs is still rudimentary, it is reasonable to assume 263 that the cellular localization of lncRNAs affects their function. Nuclear lncRNAs 264 seem to control transcriptional regulation, while cytoplasmic lncRNAs act mainly 265 at the post-transcriptional level. In order to characterize more accurately the 266 functions of our lncRNAs-based prognostic signature, genome-wide sub-cellular 267 localization studies were performed in five different in vitro cellular models of 268 EOC (OVCAR-3, OVCAR-8, A2780, OVCA432 and CAOV3). Abundance of lncRNAs 269 was analyzed in nuclear- and cytoplasmic-enriched fractions. Focusing only on those 270 probes with shared signals across the five cell lines, the analysis identified 513 and 271 480 lncRNAs probes enriched, respectively, in the nucleus or in cytoplasm 272 (Supplementary Section 3, Figure S3.1 and S3.2, respectively). Robustness of the 273 nuclear and cytoplasmic separation protocols and analyses is supported by 274 confirmation of the nuclear localization of MALAT1, NEAT1, TUG1 and 275 XLOC_005764, and the cytoplasmic localization DANCR/KIAA0114 and SNHG, 276 consistent with the literature (24–29). 277
Research. on March 15, 2018. © 2016 American Association for Cancerclincancerres.aacrjournals.org Downloaded from
Author manuscripts have been peer reviewed and accepted for publication but have not yet been edited. Author Manuscript Published OnlineFirst on November 8, 2016; DOI: 10.1158/1078-0432.CCR-16-1402
15
Expression of lnc-SOX4-1, lnc-SERTAD2-3 and PVT1 was higher in the nuclear 278 fraction than in the cytoplasm. lnc-HRCT-1 was not differentially localized in the cell 279 lines. It was excluded from downstream experiments. The nuclear enrichment of 280 selected lncRNAs was confirmed in all cell lines by RT-qPCR validation (see 281 supplementary Figure S3.3). These results are consistent with the hypothesis that the 282 investigated genes regulate genome wide transcription regulation, either stabilizing 283 interactions between different proteins or targeting transcription factors to the site of 284 action. 285 286 Network analysis: lnc-SOX4-1, lnc-SERTAD2-3 and PVT1 287 Based on the hypothesis that the selected lncRNAs regulate transcription, we 288 generated a co-expression network using matched protein coding genes with 289 expression profiles of lncRNAs and miRNAs (28), to identify genes that are 290 potentially co-regulated with lncRNAs (see Supplementary Section 4). Matched 291 miRNAs expression profiles were extracted from 183 patients previously profiled by 292 our group (16) (Array Express E-MTAB-1067). 293 For each of the three prognostic lncRNAs we isolated the most highly correlated 294 genes and computed pathway enrichment. We used the microGraphite pipeline to 295 identify circuits associated with lncRNAs (19). The term circuit refers to a subnet of a 296 biological network closely related to lncRNAs expression profile. Circuits associated 297 with the expression of PVT1 and lnc-SOX4-1 were highly inter-connected, while no 298 circuits could be identified for lnc-SERTAD2-3, probably due to the small number of 299 first neighbors identified (see Supplementary section 4, figure S4.1 and S4.2). 300 Figure 2 shows the main genes that in patients with poor prognosis are up-301 regulated and potentially affected by the altered expression of PVT1 and lnc-302
Research. on March 15, 2018. © 2016 American Association for Cancerclincancerres.aacrjournals.org Downloaded from
Author manuscripts have been peer reviewed and accepted for publication but have not yet been edited. Author Manuscript Published OnlineFirst on November 8, 2016; DOI: 10.1158/1078-0432.CCR-16-1402
16
SOX4-1 genes. Our data suggests that patients with poor prognosis, i.e. those with 303 high levels of PVT1 or lnc-SOX4-1, presented at least two altered signal paths known 304 to be involved in tumor development (29–31). The first one involves TNFRSF1A – 305 TRAF2 – PIK3/AKT. The second one starts from TGFB and proceeds through 306 MAPK8/9/10 involving FOS/JUN. Both signals sustain processes related to cell cycle, 307 proliferation, anti-apoptosis, inflammation and metastasis. These results need to be 308 interpreted in the light of the fact that WASF1/2 (also known as WAVE1) is actively 309 transcribed and co-expressed with PVT1 in relapsers and in patients with poor 310 prognosis (Figure 3). WAVE1 has been reported to induce proliferation by inducing 311 PIK3/AKT. The silencing of this gene has been suggested to reduce malignant 312 behavior (32). 313 314 Identification of a non coding signature with prognostic relevance 315 In order to evaluate the prognostic performance of the combination of the three 316 selected prognostic lncRNAs, we performed a multivariate survival analysis using 317 both clinical variables (grade, histotypes and chemotherapy treatment regimens) and 318 expression of PVT1, lnc-SOX4-1 and lnc-SERTAD2-3. The model identified as 319 significant the grade (OS, p=0.0418 and PFS p=0.00382), and the expression of PVT1 320 (OS p=0.0043 and PFS p=0.00372) and lnc-SERTAD2-3 (OS p=0.0214 and PFS 321 p=0.00045). The presence of lnc-SERTAD2-3 rather than lnc-SOX4-1 in the final 322 model was expected given the strong correlation between lnc-SERTAD2-3 and lnc-323 SOX4-1. Using a stratification based on PTV1 and lnc-SERTAD2-3 expression 324 simultaneously, we achieved better prediction of patients’ relapse and survival than 325 when each biomarker was employed alone. 326
Research. on March 15, 2018. © 2016 American Association for Cancerclincancerres.aacrjournals.org Downloaded from
Author manuscripts have been peer reviewed and accepted for publication but have not yet been edited. Author Manuscript Published OnlineFirst on November 8, 2016; DOI: 10.1158/1078-0432.CCR-16-1402
17
hsa-miR-200c-3p was previously identified by our group as a predictor of survival 327 and a biomarker of relapse in stage I EOC (6). Close inspection of the network with 328 the microGraphite pipeline showed that hsa-miR200c-3p is an element of the PVT1 329 circuit (Figure S4.1). To improve further on the definition of an epigenetic non-330 coding signature with prognostic relevance for stage I EOC, patients’ risk of relapse 331 was analyzed using the expression of hsa-miR-200c-3p, lnc-SERTAD2-3 and PVT1. 332 hsa-miR-200c-3p expression values in the entire cohort of patients were newly 333 generated and differences in expression levels between relapsers and non relapsers 334 were confirmed to be significant (see Supplementary Section 2, Table S2.5). 335 We defined a “triple high risk” group of patients on the basis of gene expression 336 levels in their tumor biopsies, where expression levels of PVT1 and lnc-SERTAD2-3 337 were elevated above their median, whilst levels of hsa-miR-200c-3p were decreased 338 below its median. Likewise there was a “triple low risk” group of patients consisting 339 of those whose tumor biopsies were characterized by expression levels of PVT1 and 340 lnc-SERTAD2-3 which were reduced below their median and those of hsa-miR-200c-341 3p which were increased above its median. The remaining combinations of risks (2 342 high and 1 low, 2 low 1 high) were combined into the “mixed risk” group. 343 Figure 3 shows KM survival curves of these three groups. Stratification was 344 statistically more significant than that observed when PFS was plotted against any 345 single biomarker (PFS p-value= 1e-20). Using all 202 stage I EOC patients, patients 346 in the “triple high risk” group had median PFS of 41 months. Patients belonging to 347 the “triple low risk” group had a median PFS of 131 months (OR= 359.22 18.47-348 6986.51 CI 95%). Differences in OS were similar; “triple high” and “triple low risk” 349 patients presented with median OS values of 36 and 123 months respectively 350 (OR=15.55 3.81-63.36 CI 95%). 351
Research. on March 15, 2018. © 2016 American Association for Cancerclincancerres.aacrjournals.org Downloaded from
Author manuscripts have been peer reviewed and accepted for publication but have not yet been edited. Author Manuscript Published OnlineFirst on November 8, 2016; DOI: 10.1158/1078-0432.CCR-16-1402
18
Discussion. 352 The results presented in this study pinpoint a prognostic role for transcriptional-based 353 classifiers in the prediction of relapse and outcome of patients with stage I EOC. Two 354 main findings emerge from data. Firstly, the expression levels of the four lncRNAs 355 lnc-SERTAD2-3, lnc-SOX4-1, lnc-HRCT1-1 and PVT1 are independent prognostic 356 markers of relapse and survival. Secondly, the combined analysis of the expression 357 profile of PVT1, lnc-SERTAD2-3 and hsa-miR-200c-3p can stratify patients’ risk of 358 relapse into three discrete classes, high risk, mixed and low risk. This provides for the 359 first time a non coding signature with prognostic relevance for stage I EOC. 360 361 In the clinical management of stage I EOC, histo-pathological based classifiers, such 362 as FIGO sub-stage and tumor grade, have been hitherto the benchmarks to guide 363 therapeutic decisions. Patients with grade 2 and 3, sub-stage c are routinely treated 364 with adjuvant Pt based chemotherapy, whilst patients with grade 1, sub-stage a, do not 365 receive any chemotherapy after surgery. It is now recognized that differences within 366 stage I EOC are based on histotype i.e., high and low grade serous, endometrioid, 367 mucinous and clear cells. Each histotype is characterized by different cell morphology, 368 biological behaviour and response to therapy (16). Pt-based therapy is the standard of 369 care shared by these different histologic subtypes. Although the vast majority of stage 370 I EOC patients respond to standard treatment, about 20% of tumors recur and patients 371 ultimately die of resistant disease. The current challenge is to identify those molecular 372 features with prognostic significance which are able to identify at diagnosis those 373 patients at high risk of relapse who would benefit from different treatments, since 374 they benefit little or not at all from standard protocols. 375 376
Research. on March 15, 2018. © 2016 American Association for Cancerclincancerres.aacrjournals.org Downloaded from
Author manuscripts have been peer reviewed and accepted for publication but have not yet been edited. Author Manuscript Published OnlineFirst on November 8, 2016; DOI: 10.1158/1078-0432.CCR-16-1402
19
A lot of the research into ovarian cancer focused on the role of protein-coding genes 377 and miRNAs in high grade serous disease, the most common histotypes (33). This 378 focus neglected the biological and clinical issues associated with stage I EOC, 379 probably because of the rarity of this disease. Less than 10% of EOC are diagnosed as 380 stage I confounding statistical and clinical interpretations. Another reason may be the 381 controversial relationship between stage I and stage III. In contrast to models applied 382 to other solid tumors such as colon cancer, stage I disease is no longer being 383 considered an “early” phase of advanced EOCs. A recent revision of the FIGO 384 classification and results pertaining to the possible pathogenesis of EOC suggest that 385 stage I, especially in the case of non-relapsers, might be a disease completely different 386 from stage III-IV (22). 387 388 Previous studies have identified coding and non coding transcriptional based 389 classifiers, with prognostic relevance for stage I EOC (5–7). Specifically, hsa-miR-390 200c-3p was found to be a biomarker of survival and relapse in stage I EOC being a 391 part of a complex prognostic network consisting of ten coding genes and 16 miRNAs. 392 This integrated signature classifier (ISC) was used to stratify patients into classes of 393 risk. The ISC performance was better than conventional clinic pathological based 394 classifiers in terms of sensitivity and specificity, and it was independent of all clinical 395 and histological covariates (5). 396 397 The present study further corroborates the prognostic importance of epigenetic 398 mechanisms. It is becoming clear that the vast majority of the genome is transcribed 399 into complex families of non-coding RNAs, of which miRNAs are only a small 400 fraction. Non-coding RNAs can be grouped into 2 major classes: short RNAs, less 401
Research. on March 15, 2018. © 2016 American Association for Cancerclincancerres.aacrjournals.org Downloaded from
Author manuscripts have been peer reviewed and accepted for publication but have not yet been edited. Author Manuscript Published OnlineFirst on November 8, 2016; DOI: 10.1158/1078-0432.CCR-16-1402
20
than 200 bp long, (e.g., miRNAs, small nuclear RNAs, PIWI-interacting RNAs) and 402 lncRNAs, ranging from approximately 200bp to 100kb. The mammalian genome 403 encodes thousands of lncRNA genes, but only few of them have to date been 404 functionally characterized. Many lncRNAs exert interesting biological functions, 405 including evolutionary conservation (8), disease and tissue-specific expression (13), 406 chromatin remodeling (34), and reprogramming of induced pluripotent stem cells (35). 407 It has also been reported that lncRNAs modulate apoptosis and invasion (34), and 408 reflect cell fate (36). For these reasons lncRNAs are nowadays considered to be major 409 regulatory components of the eukaryotic genome. 410 Although a detailed biological and functional characterization the lncRNAs identified 411 here was not the goal of this work, there are some key issues that deserve to be 412 highlighted. PVT1, one of the best functionally characterized lncRNAs, is known to 413 act as an oncogene. Consistent with currently known mechanisms of action of PVT1, 414 we found that PVT1 was overexpressed in tumor biopsies of stage I EOC patients 415 with poor prognosis. PVT1 is located near the MYC locus on human chromosome 416 8q24, and forms a cluster of MYC-activating chromosomal translocation breakpoints 417 in different solid and haematological malignancies (37). Co-amplification of human 418 MYC and PVT1 was reported to correlate with rapid progression of breast cancer and 419 with poor survival of post-menopausal or HER2-positive breast cancer patients (38). 420 In multiple myeloma, rearrangements of the PVT1 region have been shown to 421 correlate with patients’ resistance against therapy (39). The recent discovery of a 422 miRNA cluster (miR-1204, miR-1205, miR-1206, miR-1207 and miR-1208) within the 423 PVT1 genomic DNA region suggests complex regulation networks within the MYC-424 PVT1 locus (40). In our cohort of patients, genomic analysis failed to identify any co-425 amplification of PVT1 or MYC locus genes, suggesting that increased expression of 426
Research. on March 15, 2018. © 2016 American Association for Cancerclincancerres.aacrjournals.org Downloaded from
Author manuscripts have been peer reviewed and accepted for publication but have not yet been edited. Author Manuscript Published OnlineFirst on November 8, 2016; DOI: 10.1158/1078-0432.CCR-16-1402
21
the PVT1 gene cannot be due to structural changes in DNA, like copy number 427 variation (Supplementary Section 5). 428 Up-regulation of PVT1, mediated by TGFß1, has been demonstrated to control 429 cellular proliferation and stem cell properties in hepatocellular carcinoma (41). In the 430 lnc-SOX4-1 circuits, TGFß1 is up-regulated in patients with poor prognosis. These 431 facts suggest a functional link between PVT1 and lnc-SOX4-1 that deserve future 432 investigation. As summarized in Figure 2, our data suggest that the network engaged 433 by the PVT1 and lnc-SOX4-1 circuits share some important genes, like AKT, PIK3 434 family and the MAPK family. As mediators of cell proliferation and cell cycle 435 progression, they may play a key role in driving tumor relapse in stage I EOC. 436 It has recently been demonstrated that among the different pathways leading to 437 AKT/PIK3 activation, IGF-1R and EGFR/ERBB2 are directly involved in Pt-438 resistance of breast and ovarian cancer cell lines (42). Our results are consistent with 439 this notion suggesting that IGF-1R and EGFR/ERBB2 were up-regulated in patients 440 with poor prognosis leading to the activation of AKT/PIK3 and MAPK. Moreover we 441 found the up-regulation of WASF1 (also known as WAVE1) a strong promoter of 442 invasiveness and metastasis acting via AKT/PIK3 and MAPK signaling pathways (32). 443 Relapsing patients presented with up-regulated genes that sustained AKT/PIK3 444 pathways, where AKT is a hub. This finding provides the rational for the use of AKT 445 inhibitors in those patients with a prognostically negative gene signature (29). 446 447 448
Research. on March 15, 2018. © 2016 American Association for Cancerclincancerres.aacrjournals.org Downloaded from
Author manuscripts have been peer reviewed and accepted for publication but have not yet been edited. Author Manuscript Published OnlineFirst on November 8, 2016; DOI: 10.1158/1078-0432.CCR-16-1402
22
Acknowledgments 449 We would like to thank Professor Andreas Gescher (Leicester, UK) for critical 450 revision and editing of the manuscript. We are grateful to “Cloud4CARE” project for 451 providing computational resources for data analysis. 452 Authors' Contributions 453 Conception and Design: S. Marchini, C. Romualdi and M. D’Incalci 454 Development of methodology: C. Romualdi, P. Martini, E. Calura, G. Sales 455 Acquisition of data (provided biopsies, provided patients clinical data and 456 facilities): R. Fruscio, D. Katzaros, G. Sartori, E. Bignotti, A. Ravaggi, F.E. Odicino, 457 L. Ceppi, C. Mangioni. 458 Histological analysis: P. Perego 459 Biological Experiments: L. Paracchini, G. Caratti, I. Craparotta, S. Cagnin 460 Microarray Experiments: M. Mello-Grand, G. Chiorino, C. Ghimenti, L. Paracchini 461 Data analysis: P. Martini, L. Beltrame, L. Mannarino, E. Calura, G. Sales 462 Interpretation of data: P. Martini, L. Paracchini 463 Study Supervision: S. Marchini, C. Romualdi, C. Mangioni and M. D’Incalci 464
465 466
467
Research. on March 15, 2018. © 2016 American Association for Cancerclincancerres.aacrjournals.org Downloaded from
Author manuscripts have been peer reviewed and accepted for publication but have not yet been edited. Author Manuscript Published OnlineFirst on November 8, 2016; DOI: 10.1158/1078-0432.CCR-16-1402
23
Legend of Figures and Tables 468 Figure 1. Kaplan-Meier curves for lncRNA signature. Figure shows the Kaplan-469 Meier curves of OS and PFS for lnc-SERTAD2-3, lnc-SOX4-1 lnc-HRCT1-1 and 470 PVT1 in the cohort of 73 stage I EOC patients of the training set (left side) and on the 471 129 stage I EOC patients of the validation set (right side). lncRNAs expression levels 472 were converted into discrete variables by dividing the samples into two classes (High, 473 red; Low, green), under or over the median. Survival is reported in months (x axis) 474 Figure 2. Integrated model of transcriptional based classifier associated to poor 475 prognosis in stage I EOC. Reconstructed regulatory circuit obtained by the 476 combination of lnc-SOX4-1 and PVT1 transcriptional networks associated to poor 477 prognosis. All the genes represented are highly expressed in patients with poor 478 prognosis. MAPK8 and ACTB gene products interact with MYC protein according to 479 BioGrid database. The orange arrows have been inferred by data (lnc-SOX4-1 to 480 TGFβ) or derived from literature (TGFβ to PVT1). Blue arrows represent nuclear 481 translocations and pink arrows represent indirect interactions. Red arrows describe 482 genuine interaction represented in KEGG pathways. 483 Figure 3. Kaplan-Meier curves stratifying patients according to PVT1, lnc-484 SERTAD2-3 and hsa-miR-200c-3p combined expression. Three classes were built: 485 class “triple high risk” (3 High risk - red) contains patients with both lncRNAs’ 486 expression above their median and hsa-miR-200c-3p below its median; class “triple 487 low risk” (3 Low risk - green) contains patients with both lncRNAs’ expression below 488 their median and hsa-miR-200c-3p above the median; class ‘Mixed’ (orange) contains 489 all other patients. 490 491
Research. on March 15, 2018. © 2016 American Association for Cancerclincancerres.aacrjournals.org Downloaded from
Author manuscripts have been peer reviewed and accepted for publication but have not yet been edited. Author Manuscript Published OnlineFirst on November 8, 2016; DOI: 10.1158/1078-0432.CCR-16-1402
24
1 Clinical Type Training
N (%) Validation N (%) OS - CI OS pvalue PFS – CI PFS pvalue
Histotypes Clear cell 16 (21.9%) 21 (16.3%) - - - - Endometrioid 19(26.0%) 55(42.6%) 0.48(0.19-1.25) 0.1336 0.8(0.34-1.9) 0.6202 Mucinous 15 (20.5%) 20 (15.5%) 0.82 (0.31-2.14) 0.6852 0.44 (0.14-1.36) 0.1555
Serous High grade 16 (21.9%) 26 (20.2%) 0.86 (0.34-2.19) 0.7553 1.33 (0.57-3.12) 0.5086 Serous Low grade 7 (9.6%) 7 (5.4%) 0.2 (0.03-1.62 0.1329 0.62 (0.16-2.34) 0.4785
Grades G1 17(23.3%) 38(29.5%) - - - - G2 23 (31.5%) 40 (31.0%) 0.86 (0.33-2.23) 0.7533 1.04 (0.44-2.44) 0.9348 G3 33 (45.2%) 51 (39.5%) 1.91 (0.87-4.2) 0.109 2.21 (1.06-4.6) 0.0333 Type
I 53(72.6%) 88(68.2%) - - - - II 20(27.4%) 41(31.8%) 1.09(0.55-2.18) 0.801 1.66(0.93-2.96) 0.087 FIGO substage a 23 (31.5%) 46 (35.7%) - - - - b 4 (5.5%) 11 (8.5%) 1.7 (0.47-6.21) 0.42 1.52 (0.42-5.46) 0.5226 c 46 (63.0%) 72 (55.8%) 1.69 (0.81-3.55) 0.1634 2.11 (1.07-4.19) 0.0321 Chemotherapy no 16(21.9%) 27(20.9%) - - - - yes 41 (56.2%) 95 (73.6%) 0.98 (0.45-2.15) 0.9619 2.99 (1.17-7.65) 0.0225 missing 16 (21.9%) 7 (5.4%) - - - -
Research.
on March 15, 2018. ©
2016 Am
erican Association for C
ancerclincancerres.aacrjournals.org
Dow
nloaded from
Author m
anuscripts have been peer reviewed and accepted for publication but have not yet been edited.
Author M
anuscript Published O
nlineFirst on N
ovember 8, 2016; D
OI: 10.1158/1078-0432.C
CR
-16-1402
25
Mean Age [min-max] years 62[30-87] 61[25-88] 1.02(1-1.05) 0.0769 1.01(0.99-1.04) 0.3231 Relapsing N 52(71.2%) 101(78.3%) - - - - Y 21 (28.8%) 26 (20.2%) - - - - NA 0 (0) 2 (1.5%) - - - -
Vital status at the last follow-up
AWD 2(2.7%) 4(3.1%) - - - - DOC 2 (2.7%) 5 (3.9%) - - - - DOD 15 (20.5%) 15 (11.6%) - - - - NED 54(74.0%) 101(78.3%) - - - - UNK 0 (0) 4 (3.1%) - - - - Mean follow-up [min-max] years 9 [1-18] 6 [0-18] - - - -
Total number of patiens 73 129 - - - - 2 Table 1. Clinical and histological annotations. Table summarizes the main clinical and histopatological features of 202 patients enrolled in the 3 study and their correlation in univariate model with OS and PFS. Patients were randomized into a training set (n=73) and a validation set 4 (n=129). G1= Grade 1, G2= Grade 2, G3= Grade 3, AWD= Awaiting Decision, DOC= Dead of Other Cause, DOD= Dead of EOC, NED= No 5 Evidence of Disease, FIGO= Federation Internationale des Gynaecologistes et Obstetristes. 6 7 8 9 10
Research.
on March 15, 2018. ©
2016 Am
erican Association for C
ancerclincancerres.aacrjournals.org
Dow
nloaded from
Author m
anuscripts have been peer reviewed and accepted for publication but have not yet been edited.
Author M
anuscript Published O
nlineFirst on N
ovember 8, 2016; D
OI: 10.1158/1078-0432.C
CR
-16-1402
26
Overall Survival Progression Free Survival Relapsers versus non relapsers
Univariate analysis Multivariate analysis Univari
ate analysis Multivariate analysis Relapsers Non Relapsers
p HR high vs low
(95% CI) p* p HR high vs low (95%
CI) p* Median (IQR)
Median (IQR) Ratio p**
TRAINING SET
lnc-VSTM2B-9 0.57 1.3 (1-1.8) 0.07 0.77 1.3 (1.0-1.7) 0.05 66.3 ( 30.1 - 148.4 )
56.4 ( 28.4 - 163.4 ) 4.1 0.80
lnc-SERTAD2-3 1.24e-03 2.0 (1.3-3.1) 0.0014 9.31e-05 1.9 (1.3-2.6) 4e-04 150.1 ( 63.5 - 365.4 )
18.6 ( 3.3 - 58.9 ) 10.3 1.21e-07
lnc-SOX4-1 9.13-e04 1.8 (1.3-2.4) 4e-04 1.14e-04 1.6 (1.3-2.1) 2e-04 287.3 ( 159.9 - 795.2 )
57.3 ( 19.6 - 114.7 ) 11.3 1.73e-07
lnc-ST3GAL1-1 0.58 1.1 (0.9-1.4) 0.19 0.91 1.1 (0.9-1.4) 0.16 15.1 ( 3.6 - 85.2 )
15.3 ( 4.0 - 60.1 ) 2.1 0.89
lnc-HRCT1-1 7.13e-04 1.5 (1.2-1.9) 2e-04 2.6e-04 1.54 (1.3-1.9) 2.1e-05 96.4 ( 56.3 - 258.9 )
15.7 ( 4.1 - 38.9 ) 12.1 3.41e-07
lnc-PHF15-2 0.80 1.1 (0.8-1.4) 0.57 0.85 1.1 (0.9-1.3) 0.29 16.9 ( 2.0 - 76.0 )
19.9 ( 4.3 - 82.6 ) 6.1 0.80
lnc-ABCB4-1 var1 0.17 0.8 (0.6-1.2) 0.30 6.71e-03 0.7 (0.5-1.0) 0.05 151.4 ( 67.6 - 390.8 )
492.6 ( 294.9 - 955.6 ) 0.2 5.02e-03
lnc-ABCB4-1 var2 0.54 0.9 (0.6-1.4) 0.70 0.09 0.8 (0.5-1.1) 0.19 230.9 ( 89.9 - 427.1 )
438.3 ( 201.4 - 800.2 ) 0.3 0.01
lnc-LRIG2-4 0.94 1.2 (1.0-1.5) 0.08 0.77 1.1 (0.9-1.3) 0.33 4.4 ( 2.3 - 24.7 )
6.9 ( 2.0 - 13.8 ) 1.4 0.93
PVT1 1.23e-03 2.1 (1.4-3.3) 4e-04 8.83e-04 1.7 (1.3-2.2) 3e-04 563.7 ( 237.3 – 1295.1 )
26.8 ( 4.6 - 65.8 ) 87.3 7e-09
lnc-RAB40AL-2 0.12 1.3 (1.1-1.6) 0.01 0.23 1.3 (1.0-1.5) 0.02 9.2 ( 4.1 - 29.6 )
6.1 ( 1.7 - 18.9 ) 1.1 0.23
VALIDATION SET
lnc-SERTAD2-3 7.76e-03 1.4 (1.1-1.7) 3.1e-03 4.29e-04 1.6 (1.3-2.0) 2.2e-05 237.7
( 86.0 - 549.8 ) 14
( 1.8 - 84.3 ) 8.4 6e-07
lnc-SOX4-1 0.06 1.4 (1.0-1.8) 0.02 0.02 1.7 (1.3-2.2) 2e-04 274.7 ( 117.9 - 660.4 )
113.01 ( 39.3 - 299.6 ) 3.5 5.29e-03
lnc-HRCT1-1 5.87e-03 1.4 (1.1-1.7) 1.5e-03 5.92e-06 1.5 (1.3-1.9) 2.09e-05 131.2 ( 66.6 - 327.7 )
10.1 ( 3.1 - 50.7 ) 26.5 2.1e-06
PVT1 1.08e-03 1.3 (1.1-1.6) 4.2e-03 2.67e-07 1.6 (1.3-1.9) 1.24e-05 551.2 ( 207.8 - 2375.9 )
58.7 ( 15.2 - 184.8 ) 5.5 1e-07
Research.
on March 15, 2018. ©
2016 Am
erican Association for C
ancerclincancerres.aacrjournals.org
Dow
nloaded from
Author m
anuscripts have been peer reviewed and accepted for publication but have not yet been edited.
Author M
anuscript Published O
nlineFirst on N
ovember 8, 2016; D
OI: 10.1158/1078-0432.C
CR
-16-1402
27
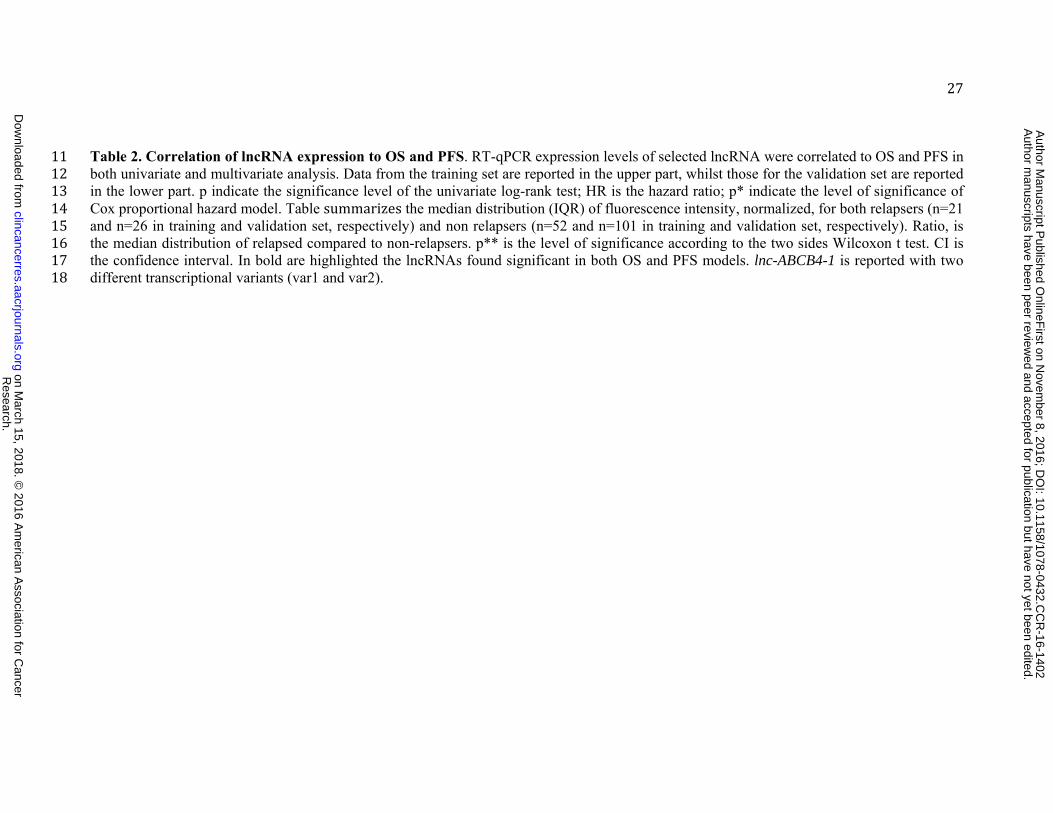
Table 2. Correlation of lncRNA expression to OS and PFS. RT-qPCR expression levels of selected lncRNA were correlated to OS and PFS in 11 both univariate and multivariate analysis. Data from the training set are reported in the upper part, whilst those for the validation set are reported 12 in the lower part. p indicate the significance level of the univariate log-rank test; HR is the hazard ratio; p* indicate the level of significance of 13 Cox proportional hazard model. Table summarizes the median distribution (IQR) of fluorescence intensity, normalized, for both relapsers (n=21 14 and n=26 in training and validation set, respectively) and non relapsers (n=52 and n=101 in training and validation set, respectively). Ratio, is 15 the median distribution of relapsed compared to non-relapsers. p** is the level of significance according to the two sides Wilcoxon t test. CI is 16 the confidence interval. In bold are highlighted the lncRNAs found significant in both OS and PFS models. lnc-ABCB4-1 is reported with two 17 different transcriptional variants (var1 and var2). 18
Research.
on March 15, 2018. ©
2016 Am
erican Association for C
ancerclincancerres.aacrjournals.org
Dow
nloaded from
Author m
anuscripts have been peer reviewed and accepted for publication but have not yet been edited.
Author M
anuscript Published O
nlineFirst on N
ovember 8, 2016; D
OI: 10.1158/1078-0432.C
CR
-16-1402
28
1 Multivariate Overall Survival (lncRNA Exp + histotypes)
Multivariate Progression Free Survival (lncRNA Exp + histotypes)
HR p HR p Clear cell - - - -
Endometrioid 0.28 (0.1-0.77) 0.013 0.36 (0.14-0.92) 0.032 Mucinous 0.34 (0.12-0.98) 0.045 0.13 (0.03-0.52) 0.003
Serous High grade 0.42 (0.15-1.14) 0.089 0.55 (0.22-1.41) 0.215 Serous Low grade 0.15 (0.02-1.18) 0.071 0.44 (0.12-1.71) 0.237
lnc-SOX4-1 Exp 1.57 (1.32-1.85) 1.997e-07 1.62 (1.39-1.88) 4.863e-10 2 Multivariate Overall Survival (lncRNA Exp + histotypes)
Multivariate Progression Free Survival (lncRNA Exp + histotypes)
HR p HR p Clear cell - - - -
Endometrioid 0.34 (0.13-0.94) 0.037 0.41 (0.16-1.06) 0.066 Mucinous 0.5 (0.18-1.41) 0.19 0.19 (0.05-0.73) 0.015
Serous High grade 0.59 (0.22-1.55) 0.284 0.76 (0.31-1.86) 0.543 Serous Low grade 0.16 (0.02-1.27) 0.082 0.44 (0.11-1.69) 0.229
lnc-SERTAD2-3 Exp 1.48 (1.26-1.73) 9.357e-07 1.67 (1.43-1.94) 7.654e-11 3 Multivariate Overall Survival(lncRNA Exp + histotypes)
Multivariate Progression Free Survival (lncRNA Exp + histotypes)
HR p HR p Clear cell - - - -
Endometrioid 0.3 (0.11-0.81) 0.017 0.33 (0.13-0.86) 0.023 Mucinous 0.34 (0.12-0.99) 0.046 0.11 (0.03-0.43) 0.0017
Serous High grade 0.49 (0.19-1.31) 0.154 0.63 (0.26-1.55) 0.311 Serous Low grade 0.14 (0.02-1.11) 0.062 0.35 (0.09-1.39) 0.135
lnc-HRCT-1 Exp 1.4 (1.24-1.58) 4.418e-08 1.5 (1.35-1.68) 1.625e-13 4 Multivariate Overall Survival (lncRNA Exp + histotypes)
Multivariate Progression Free Survival (lncRNA Exp + histotypes)
HR p HR p Clear cell - - - -
Endometrioid 0.19 (0.06-0.58) 0.0032 0.18 (0.06-0.53) 0.0019 Mucinous 0.48 (0.17-1.34) 0.161 0.18 (0.05-0.7) 0.0131
Serous High grade 0.41 (0.15-1.13) 0.085 0.48 (0.19-1.24) 0.1303 Serous Low grade 0.1 (0.01-0.82) 0.031 0.27 (0.07-1.07) 0.062
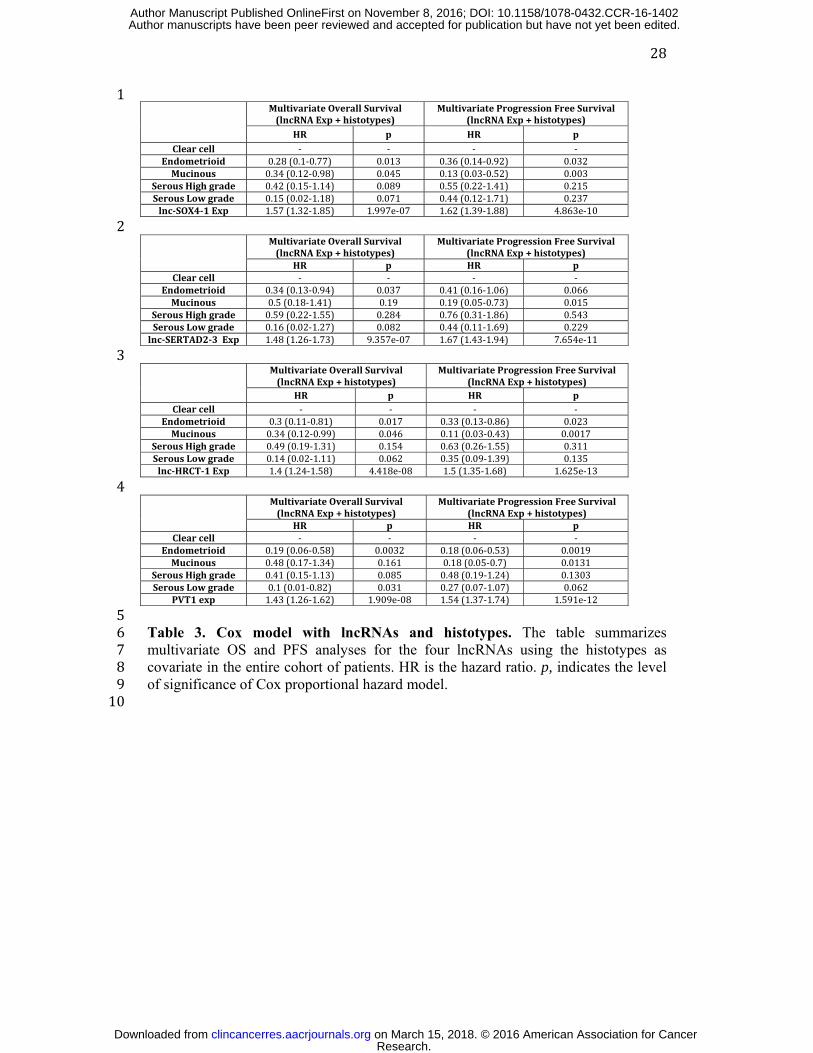
PVT1 exp 1.43 (1.26-1.62) 1.909e-08 1.54 (1.37-1.74) 1.591e-12 5 Table 3. Cox model with lncRNAs and histotypes. The table summarizes 6 multivariate OS and PFS analyses for the four lncRNAs using the histotypes as 7 covariate in the entire cohort of patients. HR is the hazard ratio. p, indicates the level 8 of significance of Cox proportional hazard model. 9 10
Research. on March 15, 2018. © 2016 American Association for Cancerclincancerres.aacrjournals.org Downloaded from
Author manuscripts have been peer reviewed and accepted for publication but have not yet been edited. Author Manuscript Published OnlineFirst on November 8, 2016; DOI: 10.1158/1078-0432.CCR-16-1402
29
References 1. Kurman RJ, Shih I-M. The Origin and pathogenesis of epithelial ovarian cancer-a proposed unifying theory. Am J Surg Pathol. 2010;34:433. 2. Sood A, Matsuo K, Gershenson D. Management of early-stage ovarian cancer. Bristow RE Karlan Surg Ovarian Cancer Princ Pract 2nd Ed N Y NY Inf Healthc. 2010;37–60. 3. Vaughan S, Coward JI, Bast RC, Berchuck A, Berek JS, Brenton JD, et al. Rethinking ovarian cancer: recommendations for improving outcomes. Nat Rev Cancer. 2011;11:719–25. 4. Chan JK, Tian C, Teoh D, Monk BJ, Herzog T, Kapp DS, et al. Survival after recurrence in early-stage high-risk epithelial ovarian cancer: a Gynecologic Oncology Group study. Gynecol Oncol. 2010;116:307–11. 5. Calura E, Paracchini L, Fruscio R, Di Feo A, Ravaggi A, Peronne J, et al. A prognostic regulatory pathway in stage I Epithelial Ovarian Cancer: new hints for the poor prognosis assessment. Ann Oncol. 2016;mdw210. 6. Marchini S, Cavalieri D, Fruscio R, Calura E, Garavaglia D, Nerini IF, et al. Association between miR-200c and the survival of patients with stage I epithelial ovarian cancer: a retrospective study of two independent tumour tissue collections. Lancet Oncol. 2011;12:273–85. 7. Marchini S, Mariani P, Chiorino G, Marrazzo E, Bonomi R, Fruscio R, et al. Analysis of gene expression in early-stage ovarian cancer. Clin Cancer Res. 2008;14:7850–60. 8. Guttman M, Amit I, Garber M, French C, Lin MF, Feldser D, et al. Chromatin signature reveals over a thousand highly conserved large non-coding RNAs in mammals. Nature. 2009;458:223–7. 9. Hu W, Alvarez-Dominguez JR, Lodish HF. Regulation of mammalian cell differentiation by long non-coding RNAs. EMBO Rep. 2012;13:971–83. 10. Mercer TR, Dinger ME, Mattick JS. Long non-coding RNAs: insights into functions. Nat Rev Genet. 2009;10:155–9. 11. Ponting CP, Oliver PL, Reik W. Evolution and functions of long noncoding RNAs. Cell. 2009;136:629–41. 12. Rinn JL, Chang HY. Genome regulation by long noncoding RNAs. Annu Rev Biochem. 2012;81. 13. Mattick JS, others. The genetic signatures of noncoding RNAs. PLoS Genet. 2009;5:e1000459. 14. Huarte M, Rinn JL. Large non-coding RNAs: missing links in cancer? Hum Mol Genet. 2010;19:R152–61. 15. Iyer MK, Niknafs YS, Malik R, Singhal U, Sahu A, Hosono Y, et al. The landscape of long noncoding RNAs in the human transcriptome. Nat Genet. 2015; 16. Calura E, Fruscio R, Paracchini L, Bignotti E, Ravaggi A, Martini P, et al. miRNA landscape in stage I epithelial ovarian cancer defines the histotype specificities. Clin Cancer Res. 2013;19:4114–23. 17. McShane LM, Altman DG, Sauerbrei W, Taube SE, Gion M, Clark GM. REporting recommendations for tumour MARKer prognostic studies (REMARK). Br J Cancer. 2005;93:387–91. 18. Sales G, Romualdi C. parmigene—a parallel R package for mutual information estimation and gene network reconstruction. Bioinformatics. 2011;27:1876–7. 19. Calura E, Martini P, Sales G, Beltrame L, Chiorino G, D’Incalci M, et al. Research. on March 15, 2018. © 2016 American Association for Cancerclincancerres.aacrjournals.org Downloaded from
Author manuscripts have been peer reviewed and accepted for publication but have not yet been edited. Author Manuscript Published OnlineFirst on November 8, 2016; DOI: 10.1158/1078-0432.CCR-16-1402
30
Wiring miRNAs to pathways: a topological approach to integrate miRNA and mRNA expression profiles. Nucleic Acids Res. 2014;gku354. 20. Sales G, Calura E, Cavalieri D, Romualdi C. graphite-a Bioconductor package to convert pathway topology to gene network. BMC Bioinformatics. 2012;13:20. 21. Martini P, Sales G, Massa MS, Chiogna M, Romualdi C. Along signal paths: an empirical gene set approach exploiting pathway topology. Nucleic Acids Res. 2013;41:e19–e19. 22. Prat J, others. Staging classification for cancer of the ovary, fallopian tube, and peritoneum. Int J Gynecol Obstet. 2014;124:1–5. 23. Cannistra SA. Cancer of the ovary. N Engl J Med. 2004;351:2519–29. 24. Bernard D, Prasanth KV, Tripathi V, Colasse S, Nakamura T, Xuan Z, et al. A long nuclear-retained non-coding RNA regulates synaptogenesis by modulating gene expression. EMBO J. 2010;29:3082–93. 25. Cabili MN, Dunagin MC, McClanahan PD, Biaesch A, Padovan-Merhar O, Regev A, et al. Localization and abundance analysis of human lncRNAs at single-cell and single-molecule resolution. Genome Biol. 2015;16:20. 26. Clemson CM, Hutchinson JN, Sara SA, Ensminger AW, Fox AH, Chess A, et al. An architectural role for a nuclear noncoding RNA: NEAT1 RNA is essential for the structure of paraspeckles. Mol Cell. 2009;33:717–26. 27. van Heesch S, van Iterson M, Jacobi J, Boymans S, Essers PB, de Bruijn E, et al. Extensive localization of long noncoding RNAs to the cytosol and mono-and polyribosomal complexes. Genome Biol. 2014;15:R6. 28. Margolin AA, Nemenman I, Basso K, Wiggins C, Stolovitzky G, Favera RD, et al. ARACNE: an algorithm for the reconstruction of gene regulatory networks in a mammalian cellular context. BMC Bioinformatics. 2006;7:S7. 29. LoPiccolo J, Blumenthal GM, Bernstein WB, Dennis PA. Targeting the PI3K/Akt/mTOR pathway: effective combinations and clinical considerations. Drug Resist Updat. 2008;11:32–50. 30. Hers I, Vincent EE, Tavaré JM. Akt signalling in health and disease. Cell Signal. 2011;23:1515–27. 31. Martelli AM, Tabellini G, Bressanin D, Ognibene A, Goto K, Cocco L, et al. The emerging multiple roles of nuclear Akt. Biochim Biophys Acta BBA-Mol Cell Res. 2012;1823:2168–78. 32. Zhang J, Zhou S, Tang L, Shen L, Xiao L, Duan Z, et al. WAVE1 gene silencing via RNA interference reduces ovarian cancer cell invasion, migration and proliferation. Gynecol Oncol. 2013;130:354–61. 33. Weinstein JN, Collisson EA, Mills GB, Shaw KRM, Ozenberger BA, Ellrott K, et al. The cancer genome atlas pan-cancer analysis project. Nat Genet. 2013;45:1113–20. 34. Khalil AM, Guttman M, Huarte M, Garber M, Raj A, Morales DR, et al. Many human large intergenic noncoding RNAs associate with chromatin-modifying complexes and affect gene expression. Proc Natl Acad Sci. 2009;106:11667–72. 35. Loewer S, Cabili MN, Guttman M, Loh Y-H, Thomas K, Park IH, et al. Large intergenic non-coding RNA-RoR modulates reprogramming of human induced pluripotent stem cells. Nat Genet. 2010;42:1113–7. 36. Ginger MR, Shore AN, Contreras A, Rijnkels M, Miller J, Gonzalez-Rimbau MF, et al. A noncoding RNA is a potential marker of cell fate during mammary gland development. Proc Natl Acad Sci. 2006;103:5781–6. Research. on March 15, 2018. © 2016 American Association for Cancerclincancerres.aacrjournals.org Downloaded from
Author manuscripts have been peer reviewed and accepted for publication but have not yet been edited. Author Manuscript Published OnlineFirst on November 8, 2016; DOI: 10.1158/1078-0432.CCR-16-1402
31
37. Shtivelman E, Bishop JM. The PVT gene frequently amplifies with MYC in tumor cells. Mol Cell Biol. 1989;9:1148–54. 38. Borg \AAke, Baldetorp B, Fernö M arten, Olsson H akan, Sigurdsson H. c-myc amplification is an independent prognostic factor in postmenopausal breast cancer. Int J Cancer. 1992;51:687–91. 39. Palumbo AP, Boccadoro M, Battaglio S, Corradini P, Tsichlis PN, Huebner K, et al. Human homologue of Moloney leukemia virus integration-4 locus (MLVI-4), located 20 kilobases 3′ of the myc gene, is rearranged in multiple myelomas. Cancer Res. 1990;50:6478–82. 40. Huppi K, Volfovsky N, Runfola T, Jones TL, Mackiewicz M, Martin SE, et al. The identification of microRNAs in a genomically unstable region of human chromosome 8q24. Mol Cancer Res. 2008;6:212–21. 41. Wang F, Yuan J-H, Wang S-B, Yang F, Yuan S-X, Ye C, et al. Oncofetal long noncoding RNA PVT1 promotes proliferation and stem cell-like property of hepatocellular carcinoma cells by stabilizing NOP2. Hepatology. 2014;60:1278–90. 42. Eckstein N. Platinum resistance in breast and ovarian cancer cell lines. J Exp Clin Cancer Res. 2011;30:91.
Research. on March 15, 2018. © 2016 American Association for Cancerclincancerres.aacrjournals.org Downloaded from
Author manuscripts have been peer reviewed and accepted for publication but have not yet been edited. Author Manuscript Published OnlineFirst on November 8, 2016; DOI: 10.1158/1078-0432.CCR-16-1402
Published OnlineFirst November 8, 2016.Clin Cancer Res Paolo Martini, Lara Paracchini, Giulia Caratti, et al. epithelial ovarian cancer: a retrospective and multicentric studylncRNAs as novel indicators of patients' prognosis in stage I
Updated version
10.1158/1078-0432.CCR-16-1402doi:
Access the most recent version of this article at:
Material
Supplementary
http://clincancerres.aacrjournals.org/content/suppl/2016/12/30/1078-0432.CCR-16-1402.DC2
Access the most recent supplemental material at:
Manuscript
Authoredited. Author manuscripts have been peer reviewed and accepted for publication but have not yet been
E-mail alerts related to this article or journal.Sign up to receive free email-alerts
Subscriptions
Reprints and
To order reprints of this article or to subscribe to the journal, contact the AACR Publications
Permissions
Rightslink site. Click on "Request Permissions" which will take you to the Copyright Clearance Center's (CCC)
.http://clincancerres.aacrjournals.org/content/early/2016/11/08/1078-0432.CCR-16-1402To request permission to re-use all or part of this article, use this link
Research. on March 15, 2018. © 2016 American Association for Cancerclincancerres.aacrjournals.org Downloaded from
Author manuscripts have been peer reviewed and accepted for publication but have not yet been edited. Author Manuscript Published OnlineFirst on November 8, 2016; DOI: 10.1158/1078-0432.CCR-16-1402