epigenetic study of colorectal cancer: lncrnas and cimp ... · biologia do cancro, do ipo-porto. a...
TRANSCRIPT
Epigenetic Study of Colorectal Cancer: lncRNAs and CIMP Profiling.Fábio Miguel Tavares FerreiraMaster Degree in BiochemistryChemistry and Biochemistry Department2016
SupervisorsCarmen Jerónimo, PhD,Guest Associate Professor with Habilitation at ICBASAssistant Investigator and Coordinator of the Cancer Biology and Epigenetics Group at IPO-Porto
Pavel Vodička, MD, PhD, Senior Scientist and Coordinator of the Department of the Molecular Biology of Cancer at IEM ASCR, v.v.i.
Co-SupervisorAlena Opattová, PhD, Post-Doctoral Researcher at IEM ASCR, v.v.i.


Todas as correções determinadas pelo júri, e só essas, foram efetuadas.
O Presidente do Júri,
Porto, ______/______/_________


“And so gentlemen, I learned. Oh, if you have to learn, you
learn; if you’re desperate for a way out, you learn; you learn
pitilessly. You stand over yourself with a whip in your hand;
if there’s the least resistance, you lash yourself.”
― Franz Kafka, The Metamorphosis and Other Stories

FCUP Epigenetic Study of Colorectal Cancer: lncRNAs and CIMP Profiling.
I
AGRADECIMENTOS Agradeço a todos aqueles que, direta ou indiretamente, contribuíram não só para a
elaboração desta Dissertação, mas também para a experiência que tive e conhecimento que
adquiri ao realizar estes dois projetos. Um enorme obrigado dedicado em particular às
pessoas que me motivaram e auxiliaram durante a experiência de ERASMUS+Estágio.
Começo por agradecer aos membros da Comissão Científica do Mestrado pela
disponibilidade e o apoio a que se predispuseram, não só a mim, mas a todos os meus
colegas. Principalmente ao meu tutor, Professor Pedro Alexandrino, pelas muitas palavras
de apoio e pelos valiosos conselhos que foram chave nos momentos mais difíceis.
I’d like to thank my supervisor in Prague, Dr. Pavel Vodička, and Dr. Ludmila
Vodičková for their kindness and comprehension, and for having accepted me in their lab,
otherwise I would never live the bright side of the experience that Erasmus represented. A
special “thank you” to Dr. Ludmila Vodičková for being always worried about my situation
and ready to help me out. In addition, I’d also like to thank all the people in the laboratory for
being constantly so friendly, honest, worried and funny. To Alena and Andrea, I owe all the
accomplished in the first project exposed herein, and all that I have learned from that. My
special gratitude is for them.
À minha orientadora, Professora Cármen Jerónimo, pelo enorme profissionalismo,
disponibilidade, orientação e ensinamentos que me transmitiu neste estágio que
proporcionou e no qual me integrou. É sobretudo a ela que se deve a existência desta
Dissertação e a realização do segundo e maior projeto aqui apresentado. Pela paciência e
compressão, pelas críticas, mas também pela confiança. Por tudo, um franco Obrigado.
Gostaria também de agradecer aos restantes membros do grupo de Epigenética &
Biologia do Cancro, do IPO-Porto. A todos eles estou grato por proporcionarem um ambiente
profissional, mas também bastante agradável, pela simpatia e pelo espírito de entreajuda e
integração. Um especial agradecimento à Micaela Freitas e à Catarina Barbosa pela sua
enorme contribuição, sacrifício, simpatia e instrução; e ao Eng. Luís Antunes do Serviço de
Epidemiologia IPO-Porto por toda a valiosa ajuda estatística.
Finalmente, agradeço à minha família pelo apoio sempre presente: aos meus
pais (Maria Olinda e Fernando) e aos meus avós (Arlindo, Cipriano, Júlia e Leopoldina), e
especialmente às minhas irmãs Cláudia e Marlene (que fez um grande esforço). A eles
dedico esta Dissertação. Sem dúvida que também os meus amigos foram o motor de todo
este processo. Um especial obrigado ao Ricardo, à Joana Marques, à Joana, à Rita e à
Susana. Também à Verónica e à Ana Freitas, à Bárbara, ao Nuno, ao Henrique, ao Tiago e
ao Márcio, e sobretudo ao Carlos. A todos os meus restantes amigos e colegas de curso
também dedico o meu apreço.
Este estudo foi parcialmente financiado por uma bolsa do Centro de Investigação do
Instituto Português de Oncologia do Porto (CI-IPOP-74-2016).

II FCUP Epigenetic Study of Colorectal Cancer: lncRNAs and CIMP Profiling.
FCUP Epigenetic Study of Colorectal Cancer: lncRNAs and CIMP Profiling.
III
ABSTRACT PROJECT I: Role of lncRNAs in the regulation of DNA repair.
DNA damage is a lethal and common event during the lifetime of a cell, and in
view of its repair, some specific pathways have evolved, integrating the general DNA
damage response (DDR). As expected, DNA repair alterations have been extensively
correlated with cancer; and in particular colorectal cancer (CRC), which often presents
genome instability due to DNA mismatch repair (MMR) deficiency. In contrast with MMR,
the role played by other DNA repair pathways in CRC are not so well reviewed. In a
comprehensive study by Slyskova et al (2012)1, base and nucleotide excision repair
pathways (BER and NER, respectively) were found not to be considerably altered in
CRC. However, to further investigate the possible involvement of excision repair in CRC,
an epigenetic analysis considering the biggest and less studied class of transcripts was
proposed. Long non-coding RNAs (lncRNAs) are a miscellaneous class of multi-
functional RNA molecules that has been recently correlated with CRC and also with
DDR. Therefore, the purpose of this project was the discovery of BER-related lncRNAs,
which could represent new biomarkers or treatment-targets in CRC.
The same CRC tissue samples from Slyskova et al (2012) were used along with
the obtained data to generate four distinct groups with five elements each, divided
according to lower and higher DNA repair capacity (DRC) measurements in both cancer
and adjacent healthy tissues. Using a LncProfiler qPCR Array®, the levels of ninety
lncRNAs were measured for each of the twenty selected samples, and next analysed for
statistically significant expression differences.
This analysis revealed the inexistence of significant differences: neither between
each pair of groups compared, nor between all tumour versus normal mucosa samples
or lower DRC versus higher DRC; due to the small size of the series and high inter-
variability. Hence, although these results indicate that no possible role exists for the
tested lncRNAs in CRC tumourigenesis in association with BER functionality, no solid
conclusions can be stated.
PROJECT II: Evaluation of CIMP status in colorectal cancer and correlation with prognosis.
Colorectal cancer (CRC) is one of the major causes of cancer-related morbidity
and mortality worldwide. Despite of recent advances in treatment approaches, cancer
IV FCUP Epigenetic Study of Colorectal Cancer: lncRNAs and CIMP Profiling.
progression and metastization still remains a major concern. This heterogeneous
disease is currently classified according to global genomic or epigenomic status, which
have been linked to different clinicopathologic characteristics, prognosis and treatment
response. Therefore, segregation of CRC patients by their molecular phenotype is
essential to predict those who will benefit from a specific therapy. A subset of CRC
patients has been shown to exhibit widespread promoter CpG island methylation, termed
CpG Island Methylator Phenotype (CIMP). For instance, CIMP has been increasingly
referred as a promising prognostic factor. However, it is the less understood molecular
subtype in CRC and various methods and definitions have been used to categorize CIMP
status, leading to discrepancies. To further assess this issue, new integrative studies are
required. Thus, the main goal of this project was CIMP profiling and the analysis of a
series of 211 patients diagnosed with sporadic CRC.
DNA extracted from 211 CRC and 43 healthy mucosa samples, formalin fixed
paraffin embedded, was bisulfite converted, and promoter methylation of five genes/loci
was then assessed by real-time qMSP (SYBR® Green-based), for CIMP frequency.
Further statistical analysis to disclose associations with clinicopathological parameters,
and survival analyses to evaluate CIMP prognostic value were conducted.
CIMP was found in 8.5% of all CRC cases and did not associate with any of the
studied clinicopathological and molecular variables. Furthermore, CIMP did not
associate with patients’ prognosis, both for disease-specific survival (DSS) (HR 1.192
95% CI 0.732-1.941, P=0.481) or disease-free-survival (DFS) (HR 0.554 95% CI 0.241-
1.275, P=0.161). However, aberrant methylation of one of the five markers constituting
the selected panel, CDKN2A(p16), associated with shorter DSS, but only in univariable
analysis (HR 1.578 95% CI 1.016-2.450, P=0.042).
CIMP status did not associate with patients’ survival, which is in accordance with
previous studies by others. However, the laboratory technique or its application with the
specific panel selected may not be adequate to evaluate CIMP status, yielding lower
CIMP frequencies and further lack of significant associations between CIMP and any of
the recorded variables. Additional studies are needed to further confirm these preliminary
results.
Keywords: Epigenetics, colorectal cancer, lncRNAs, base-excision repair, methylation,
CIMP, prognosis.
FCUP Epigenetic Study of Colorectal Cancer: lncRNAs and CIMP Profiling.
V
RESUMO
PROJETO I: Papel dos lncRNAs na regulação da reparação do ADN.
Os danos no ADN são um evento letal e comum durante o tempo de vida de uma
célula, e tendo em vista a sua reparação, algumas vias específicas evoluíram,
integrando no geral a resposta a danos no ADN (DNA damage response – DDR). Como
esperado, alterações na reparação do ADN têm sido extensivamente correlacionadas
com o cancro; e, em particular o cancro colorectal (CCR), que muitas vezes apresenta
instabilidade genómica devido a defeitos na via de reparação de desemparelhamentos
(mismatch repair – MMR). Em contraste com a via MMR, o papel desempenhado por
outros mecanismos de reparação do DNA no CCR não está tão bem revisto. Num
estudo abrangente por Slyskova et al (2012)1, as vias de reparação por excisão de bases
ou nucleótidos (base-excision repair – BER e nucleotide-excision repair – NER,
respetivamente) não foram consideradas notavelmente alteradas no CCR. No entanto,
para investigar o possível envolvimento da reparação por excisão no CCR, foi proposta
uma análise epigenética tendo em conta a maior e menos estudada classe de
transcritos. ARNs não-codificantes longos (long non-coding RNAs – lncRNAs) são uma
classe variada de moléculas de ARN multifuncionais que foi recentemente
correlacionada com o CCR e também com DDR. Portanto, o objetivo deste projeto foi a
descoberta de lncRNAs relacionadas com a via BER, que poderão representar novos
biomarcadores ou alvos de tratamento para o CCR.
As mesmas amostras de tecido de CCR estudadas em Slyskova et al (2012),
juntamente com a respetiva informação obtida, foram utilizadas para criar quatro grupos
distintos, com cinco elementos cada, divididos de acordo com uma menor ou maior
capacidade de reparação do ADN (DNA repair capacity – DRC) – determinada tanto no
tecido tumoral como da mucosa normal adjacente. Usando LncProfiler qPCR Array®,
os níveis de noventa lncRNAs foram medidos para cada uma das vinte amostras
selecionadas, e em seguida analisados relativamente à existência de diferenças
estatisticamente significativas na expressão.
Esta análise revelou a inexistência de diferenças significativas: nem entre cada
par de grupos comparados, nem entre todas as amostras tumorais versus amostras de
mucosa normal, ou menor DRC versus maior DRC, devido ao reduzido tamanho
amostral e à elevada inter-variabilidade. Assim, embora estes resultados indiquem que
não existe qualquer papel para os lncRNAs testados na tumorigénese do CCR em
VI FCUP Epigenetic Study of Colorectal Cancer: lncRNAs and CIMP Profiling.
associação com a funcionalidade da via BER, não podem ser apontadas conclusões
sólidas.
PROJECT II: Avaliação do perfil CIMP no cancro colorectal e correlação com prognóstico.
O cancro colorectal (CCR) é uma das principais causas de morbidade e
mortalidade relativas a cancro no mundo. Apesar dos recentes avanços de abordagens
terapêuticas, progressão do cancro e metastização ainda persistem como a principal
preocupação. Esta doença heterogênea é atualmente classificada em função do estado
genético e epigenético global, o que tem sido associado com diferentes características
clinicopatológicas, prognóstico e tratamento. Assim, a segregação de pacientes com
CCR pelo seu fenótipo molecular é essencial para prever aqueles que irão beneficiar de
uma terapia específica. Um subconjunto de pacientes com CCR demonstrou exibir
metilação generalizada em ilhas CpG de promotores, o que foi denominado Fenótipo
Metilador de Ilhas CpG (CpG Island Methylator Phenotype – CIMP). Efetivamente, CIMP
tem sido, cada vez mais, referido como um promissor fator de prognóstico. No entanto,
é o subtipo molecular menos compreendido no CCR, e várias definições e métodos têm
sido utilizados para categorizar o perfil CIMP, conduzindo a discrepâncias. Para avaliar
mais profundadamente esta questão, novos estudos integrativos são necessários.
Assim, o objetivo principal deste projeto foi o profiling de CIMP numa série de 211
pacientes diagnosticados com CCR esporádico.
ADN extraído a partir de 211 CCRs e 43 amostras de mucosa saudável, fixados
em formol e embebidos em parafina, foi convertido pela técnica de bissulfito, e a
metilação dos promotores de cinco genes/loci foi então determinada por qMSP em
tempo real (baseada em SYBR® Green), para avaliar a frequência de CIMP. Foram
então realizadas análises estatísticas para revelar associações com parâmetros clínico-
patológicos, e análises de sobrevivência para avaliar o valor prognóstico de CIMP.
CIMP foi encontrado em 8,5% de todos os casos de CCR e não foi associado
com qualquer dos parâmetros clinicopatológicos e moleculares analisados. Além disso,
CIMP não foi também associado com o prognóstico dos pacientes, tanto no caso da
sobrevivência específica de doença (HR 1,192; CI 95% 0,732-1,941; P = 0,481), como
da sobrevivência livre de doença (HR 0,554; CI 95% 0.241-1,275; P=0,161). No entanto,
metilação aberrante de um dos cinco marcadores que constituem o painel selecionado,
FCUP Epigenetic Study of Colorectal Cancer: lncRNAs and CIMP Profiling.
VII
CDKN2A(p16), foi associada com menor sobrevivência específica de doença, mas
apenas em análise univariável (HR 1,578; CI 95% 1,016-2,450; P=0,042).
O fenótipo CIMP não foi associado com a sobrevivência dos pacientes, o que
está de acordo com outros estudos anteriores. Contudo, a técnica de laboratório ou a
sua aplicação com o painel específico selecionado podem não ser adequadas para
avaliar o perfil CIMP, levando a frequências de CIMP mais baixas e à ausência de
associação entre CIMP e qualquer um dos parâmetros testados. Estudos adicionais são
precisos para confirmar estes resultados preliminares.
Palavras-chave: Epigenética, cancro colorectal, lncRNAs, reparação por excisão de
bases, metilação, CIMP, prognóstico.

VIII FCUP Epigenetic Study of Colorectal Cancer: lncRNAs and CIMP Profiling.
FCUP Epigenetic Study of Colorectal Cancer: lncRNAs and CIMP Profiling.
IX
TABLE OF CONTENTS
FIGURE INDEX......................................................................................................XI
TABLE INDEX......................................................................................................XIII
LIST OF ABREVIATIONS....................................................................................XV
INTRODUCTION...................................................................................................21COLORECTAL CANCER: GENERAL ASPECTS.....................................................21
Epidemiology and risk factors...................................................................................21Methods of diagnosis...................................................................................................22Histology and molecular etiology.............................................................................22Prognosis and treatment.............................................................................................26
COLORECTAL CANCER EPIGENETICS..................................................................27General aspects, and chromatin and histone modifications.............................27MicroRNAs......................................................................................................................29
LONG NONCODING RNAS & DNA REPAIR.............................................................29LncRNAs involved in colorectal cancer development.........................................29LncRNAs involved in DNA repair..............................................................................32
CpG ISLAND METHYLATOR PHENOTYPE (CIMP) & PROGNOSIS.....................34DNA methylation............................................................................................................34CIMP involvement in colorectal cancer...................................................................34Molecular pathways according to genetic and epigenetic aspects.................37Methods of DNA methylation analysis.....................................................................38DNA methylation as diagnostic biomarker.............................................................38DNA Methylation and CIMP in prognosis and treatment.....................................39
AIMS......................................................................................................................41
PROJECT I............................................................................................................41
PROJECT II...........................................................................................................41
MATERIALS AND METHODS.............................................................................43PROJECT I....................................................................................................................43
Study patients and sample collection......................................................................43Selection of samples and DNA repair assays........................................................43RNA extraction...............................................................................................................44LncRNAs profiling.........................................................................................................44Statistical analysis........................................................................................................45
PROJECT II...................................................................................................................45Study patients and sample collection......................................................................45DNA extraction from paraffinized tissues sections..............................................45Bisulfite conversion......................................................................................................46Primers design and selection.....................................................................................47

X FCUP Epigenetic Study of Colorectal Cancer: lncRNAs and CIMP Profiling.
Quantitative methylation-specific polymerase chain reaction (qMSP)...........48Statistical analysis........................................................................................................49
RESULTS..............................................................................................................50PROJECT I....................................................................................................................51PROJECT II...................................................................................................................54
Patients’ characteristics and CpG island methylation at specific loci............54Prognostic factors for survival: disease-specific survival.................................59Prognostic factors for survival: disease-free survival.........................................64
DISCUSSION........................................................................................................67PROJECT I....................................................................................................................67PROJECT II...................................................................................................................69
REFERENCES......................................................................................................75
APPENDIX I..........................................................................................................81
APPENDIX II.........................................................................................................82
APPENDIX III........................................................................................................83
APPENDIX IV........................................................................................................84
APPENDIX V.........................................................................................................85
APPENDIX VI........................................................................................................86
APPENDIX VII.......................................................................................................87
APPENDIX VIII......................................................................................................87

FCUP Epigenetic Study of Colorectal Cancer: lncRNAs and CIMP Profiling.
XI
FIGURE INDEX
Fig.1: Distribution of CRC by anatomical site; illustrative CRC staging, and large intestine wall histological layers................................................................................23
Fig.2: Genetic and epigenetic marks in three proposed pathways to sporadic CRC development................................................................................................................25
Fig.3: Model for DNA repair regulation in CRC by lncRNAs DDSR1, PCAT-1 and HOTAIR.........................................................................................................................33
Fig.4: Estimated distribution of CIN, CIMP and MSI subtypes, and a six-group classification according to MSI and CIMP status in CRC..........................................38
Fig.5: Performance of the classic CIMP panel............................................................56
Fig.6: Comparison between the classic CIMP panel, MINT31 methylation and KRAS mutation status............................................................................................................59
Fig.7: Kaplan-Meier curves analysis for disease-specific survival according to age at diagnosis, AJCC tumour stage, neoadjuvant therapy, CIMP panel and CDKN2A(p16) methylation status...............................................................................63
Fig.8: Kaplan-Meier curves analysis for disease-free survival according to gender, CIMP panel and CDKN2A(p16) methylation status....................................................66

XII FCUP Epigenetic Study of Colorectal Cancer: lncRNAs and CIMP Profiling.

FCUP Epigenetic Study of Colorectal Cancer: lncRNAs and CIMP Profiling.
XIII
TABLE INDEX
Table 1: TNM staging system for Colorectal Cancer along with corresponding criteria and anatomic stage (AJCC stage)..................................................................26 Table 2: List of some of the most representative and studied lncRNAs in CRC and associated mechanisms so far described in CRC and other diseases, expression patterns and functions in CRC development............................................................ 31 Table 3: List of primers’ sequences used and respective chromosomal location, size of the generated amplicon, temperature of annealing, GenBank Accession number and specific location in the accessed sequence.........................................50 Table 4: Long noncoding RNAs differentially expressed between the four groups of samples formed HH, HL, TH and TL, before Holm-Šídák correction....................52 Table 5: Long noncoding RNAs differentially expressed between Healthy mucosa and Tumour samples, and samples with Lower and High BER repair capacity, before Holm-Šídák correction.....................................................................................53 Table 6: P-values for the differential expression of long noncoding RNAs between the four groups of samples formed HH, HL, TH and TL, and between Healthy mucosa and Tumour samples or samples with Lower and High BER repair capacity, after Holm-Šídák correction........................................................................53 Table 7: Distribution of clinicopathological and molecular variables for all CRC patients and association with CIMP status................................................................57 Table 8: Association between clinicopathological and molecular variables and each of the five genes/loci constituting the classic CIMP panel...............................58 Table 9: Univariable and multivariable prognostic analyses: disease-specific survival analysis of CRC patients according to represented variables and CIMP panel/markers methylation.........................................................................................61 Table 10: Univariable prognostic analyses: disease-free survival analysis for CRC patients according to represented variables and CIMP panel/markers methylation..................................................................................................................64

XIV FCUP Epigenetic Study of Colorectal Cancer: lncRNAs and CIMP Profiling.
FCUP Epigenetic Study of Colorectal Cancer: lncRNAs and CIMP Profiling.
XV
LIST OF ABREVIATIONS 17p – Short Arm of Chromosome 17 18q – Long Arm of Chromosome 18 3’UTR – 3’ Untranslated Regions 5-FU – 5-Fluorouracil 5-mC – 5’-Methylcytosine A – Adenosine ACTB – Beta Actin ACVR2A/1B – Activin A Receptor Type 2A/1B ADP – Adenosine Diphosphate AJCC – American Joint Committee on Cancer AKT – Protein Kinase B ALX4 – Homeobox Protein Aristaless-Like 4 ANRIL – Antisense NcRNA in the INK4 Locus Anti-NOS2A – Anti Nitric Oxide Synthase 2A APC – Adenomatous Polyposis Coli APEX1 – Apurinic/Apyrimidinic Andodeoxyribonuclease 1 ARID1A – AT-Rich Interaction Domain 1A ATM – Ataxia Telangiectasia Mutated ATP – Adenosine Triphosphate AXIN2 – Axis Inhibition Protein 2 BACE1AS – BACE1 Antisense BAX – BCL2-Associated X Protein BER – Base Excision Repair BMP3 – Bone Morphogenetic Protein 3 BOKAS – Natural Antisense Transcript of Bok BRAF – Serine/Threonine-Protein Kinase B-Raf (V-Raf Murine Sarcoma Viral Oncogene Homolog B1) BRCA1/2 – Breast Cancer 1/2 BRG1 – Brahma-Related Gene-1 C – Cytosine c-MYC – Myc Proto-Oncogene Protein (V-Myc Myelocytomatosis Viral Oncogene Homolog) CACNA1G – Calcium Voltage-Gated Channel Subunit Alpha1 G CAP – College of American Pathologists; CapeOX – Capecitabine plus Oxaliplatin CBR/p300 – CREB Binding Protein/EP300 CCAT1-L – CRC-Associated Transcript 1, the Long Isoform CCAT1/2 – CRC-Associated Transcript 1/2 CCE – Colon Capsule Endoscopy CD119 – Cluster of Differentiation 109 CDH1 – Cadherin 1 (E-cadherin) CDK4/6 – Cyclin-Dependent Kinase 4/6 CDKN1A – Cyclin-Dependent Kinase Inhibitor 1A/P21 CDKN1B – Cyclin-Dependent Kinase Inhibitor 1B/P27 CDKN2A – Cyclin-Dependent Kinase Inhibitor 2a/P16 or P14 cDNA – Complementary DNA CDX1 – Caudal Type Homeobox-1 CeRNA – Competing-Endogenous RNA CI – Confidence Interval

XVI FCUP Epigenetic Study of Colorectal Cancer: lncRNAs and CIMP Profiling.
CIMP – CpG Island Methylator Phenotype CIMP-0 – CpG Island Methylator Phenotype-Negative CIMP-H – CpG Island Methylator Phenotype-High CIMP-L – CpG Island Methylator Phenotype-Low CIMP(–) – CpG Island Methylator Phenotype-Negative CIMP(+) – CpG Island Methylator Phenotype-Positive CIN – Chromosomal Instability COX-2 – Cyclooxygenase-2 CpG – Cytosine-Phosphate-Guanine CRABP1 – Cellular Retinoic Acid-Binding Protein 1 CRC – Colorectal Cancer CREB – Camp Response Element Binding Protein CRNDE – Colorectal Neoplasia Differentially Expressed CT – Chemotherapy CTC – Computed Tomographic Colonography CTCF – CCCTC-Binding Factor CTNNB1 – Catenin Beta 1 DAPK – Death Associated Protein Kinase 1 DCC – Deleted in Colorectal Cancer DDR – DNA Damage Response DDSR1 – DNA Damage-Sensitive RNA 1 DFS – Disease-Free Survival DNA – Deoxyribonucleic Acid DNMTs – DNA Methyltransferases DRC – DNA Repair Capacity DSBs – Double-Strand Breaks DSS – Disease-Specific Survival E2F4 antisense – E2F Transcription Factor 4 Antisense EGFR – Epidermal Growth Factor Receptor ERBB2/3 –Erb-b2 Receptor Tyrosine Kinase 2/3 EVL –Enah/Vasp-like EXO1 – Exonuclease 1 EZH2 – Enhancer of Zeste Homolog 2 FAM123B – APC Membrane Recruitment Protein 1 FAP – Familial Adenomatous Polyposis FBN1 – Fibrillin 1 FBXW7 – FBXW7 F-Box and WD Repeat Domain Containing 7 FDA – Food and Drug Administration FIT – Faecal Immunochemical Test FLNC – Filamin C FOLFIRI – Folinic Acid (Leucovorin) plus Fluorouracil plus Irinotecan FOLFOX – Folinic Acid (Leucovorin) plus Fluorouracil plus Oxaliplatin FOLFOXIRI – Folinic Acid (Leucovorin) plus Fluorouracil and Oxaliplatin plus Irinotecan FS – Flexible Sigmoidoscopy FZD10 – Frizzled Class Receptor 10 G – Guanine G9a – Euchromatic Histone-Lysine N-Methyltransferase 2 (EHMT2) GAS5 – Growth Arrest Specific 5 GATA4/5 – GATA Binding Protein 4/5 gFOBT – guaiac Faecal Occult Blood Test
FCUP Epigenetic Study of Colorectal Cancer: lncRNAs and CIMP Profiling.
XVII
GR – Glucocorticoid Receptor GSTP1 – GSTP1 Glutathione S-Transferase pi 1 H2A/2B/3/4 – Histone 2A/2B/3/4 H3KX me2/3 – Di/tri-methylation of Lysines X in Histone H3 HAT – Histone Acetyltransferase HCT116 – Human Colon Cancer Cells HDACs – Histone Deacetylases HDMTs – Histone Demethylases HH – Healthy Mucosa with Higher Levels of BER Repair Capacity HIC1 – Hypermethylated In Cancer 1 HL – Healthy Mucosa with Lower Levels of BER Repair Capacity HLTF – Helicase Like Transcription Factor HMTs – Histone Methyltransferases HNPCC – Hereditary Nonpolyposis Colorectal Cancer hnRNPUL1 – Heterogeneous Nuclear Ribonucleoprotein U-like Protein 1 hOGG1 – Human 8-Oxoguanine DNA N-Glycosylase 1 HOPX – HOP Homeobox HOTAIR – HOX Transcript Antisense RNA HOTAIRM1 – HOX Antisense Intergenic RNA Myeloid 1 HR – Hazard Ratio HR – Homologous Recombination HULC – Highly Upregulated in Liver Cancer IBD – Inflammatory Bowel Disease IDLs – Insertion/Deletion Loops IGF2 – Insulin-Like Growth Factor 2 IGF2AS – Insulin-Like Growth Factor 2 Antisense IGFBP3 – Insulin-Like Growth Factor-Binding Protein 3 IGFR – Insulin-Like Growth Factor 1 Receptor IHC – Immunohistochemistry INK4 – Family of Inhibitors of Cyclin-Dependent Kinase 4 Jpx – JPX Transcript, XIST Activator (Non-Protein Coding) KRAS – Gtpase KRAS (V-Ki-Ras2 Kirsten Rat Sarcoma Viral Oncogene Homolog) LET – Low Expression in Tumour LIG3 – DNA Ligase 3 LincRNA – Long Intergenic Non-coding RNA LINE-1 – Long Interspersed Element-1 LncRNA-DDSR1 – Long non-coding RNA-DNA Damage-Sensitive RNA1 LncRNA-JADE – Long non-coding RNA- Jade Family PHD Finger 1 LncRNAs – Long non-coding RNAs LOH – Loss of Heterozygosity LOI – Loss of Imprinting LSD1 – Lysine-Specific Demethylase 1 LUST – LUCA-15-Specific Transcript M – Methylated MALAT1 – Metastasis-Associated Lung Adenocarcinoma Transcript 1 MAP – MUTYH-Associated Polyposis MAPK – Mitogen-Activated Protein Kinase mascRNA – MALAT1-Associated Small Cytoplasmic RNA MBD4 – Methyl-CpG-binding domain protein 4 MDM2 – Mouse Double Minute 2
XVIII FCUP Epigenetic Study of Colorectal Cancer: lncRNAs and CIMP Profiling.
MEG3 – Maternally-Expressed Gene 3 MEG9 – Maternally Expressed 9 MEK – Map Kinase Kinase MGMT – O6-Methylguanine DNA Methyltransferase MINT– Methylated-in-Tumor miRNA – MicroRNAs MLH1 – MutL Homolog 1 MMR – Mismatch Repair MRC – Magnetic Resonance Colonography mRNA – Messenger RNA MSH2/6 – MutS Protein Homolog 2/6 MSI – Microsatellite Instability MSI-H – Microsatellite Instability-High MSI-L – Microsatellite Instability-Low MSP – Methylation-Specific Polymerase Chain reaction MSS – Microsatellite Stable MTOR – Mechanistic Target of Rapamycin MUTYH – MutY DNA Glycosylase MYLKP1 – Myosin Light Chain Kinase Pseudogene 1 MYOD1 – Myogenic Differentiation 1 NcRNAs – Non-coding RNAs NDRG4 – N-Myc Downstream-Regulated Gene 4 Protein NEIL1 – Nei Endonuclease VIII-Like 1 NER – Nucleotide Excision Repair NEUROG1 – Neurogenin 1 NF-KB – Nuclear Factor Kappa B) NGFR – Nerve Growth Factor Receptor NHEJ – Non-Homologous End-joining NRAS – Neuroblastoma RAS Viral (V-Ras) Oncogene Homolog NSAIDS – Nonsteroidal Anti-Inflammatory Drugs NuRD – Nucleosome Remodelling and Histone Deacetylase ORFs – Open-reading Frames OS – Overall Survival P400 – EP400 E1A Binding Protein P400 PALB2 – Partner and Localizer of BRCA2 PARP – Poly (ADP-ribose) Polymerase PBMCs – Peripheral Blood Mononuclear Cells PCAT-1 – Prostate Cancer-Associated Transcript 1 PI3K – Phosphoinositide 3-kinase PIK3CA – Phosphatidylinositol-4,5-Bisphosphate 3-Kinase, Catalytic Subunit Alpha PMS2 – PMS1 Homolog 2, Mismatch Repair System Component PRCs – Polycomb Repressive Complexes PTBP2 – Polypyrimidine Tract Binding Protein 2 PTEN – Phosphatase and Tensin Homolog PTENP1 – Phosphatase and Tensin Homolog Pseudogene 1 PTGS2 – Prostaglandin-Endoperoxide Synthase 2 PVT1 – Plasmacytoma Variant Translocation 1 qMSP – Quantitative Methylation-Specific Polymerase Chain reaction qPCR – Quantitative Polymerase Chain Reaction RAD51 – RAD51 Recombinase
FCUP Epigenetic Study of Colorectal Cancer: lncRNAs and CIMP Profiling.
XIX
RAP80 – Receptor-Associated Protein 80 RASSF1A – Ras Association Domain-Containing Protein 1Isoform A/B RET – Ret Proto-Oncogene RFS – Recurrence-free Survival RISC – RNA-Induced Silencing Complex RNA – Ribonucleic Acid RNCR3 – Retinal Noncoding RNA 3 RT – Radiotherapy RTK – Receptor Tyrosine Kinase RUNX3 – Runt Related Transcription Factor 3 SAF – LncRNA Fas-Antisense 1 (Fas-AS1) SEPT9 – Septin 9 SETD2 – SET Domain Containing 2 SFPQ – Splicing Factor Proline/Glutamine-Rich SFRP1 – Secreted Frizzled-Related Protein 1/2 SIRT1 – Sirtuin 1 SLIT2 – Slit Guidance Ligand 2 Smad – Mothers Against Decapentaplegic SMARCC2 – SWI/SNF Related, Matrix Associated, Actin Dependent Regulator Of Chromatin Subfamily C Member 2 SNHG4 – Small Nucleolar RNA Host Gene 4 snoRNAs – Small Nucleolar RNAs SNPs – Single-Nucleotide Polymorfisms SOCS1 – Suppressor of Cytokine Signaling 1 SOX9 – SRY-Box 9 Transcription Factor ssDNA –Single Strand DNA STAT – Signal Transducer and Activator of Transcription SV2C – Synaptic Vesicle Glycoprotein 2C SWI/SNF – SWItch/Sucrose Non-Fermentable T – Thymine TCF7L2 – Transcription Factor 7-Like 2 TFPI2 – Tissue Factor Pathway Inhibitor 2 TGF-β – Transforming Growth Factor-Beta TGFBR – Transforming Growth Factor-Beta Receptor TH – Tumour with Higher Levels of BER Repair Capacity TL – Tumour with Lower Levels of BER Repair Capacity TMEFF2 – Transmembrane Protein with EGF Like and Two Follistatin Like Domains 2 TODRA – Transcribed in the Opposite Direction of RAD51 TP53 – Tumour Protein P53 TUSC7 – Tumour Suppressor Candidate 7 U – Uracil UM – Unmethylated VEGF – Vascular Endothelial Growth Factor VIM – Vimentin WHO – World Health Organization WIF – WNT Inhibitory Factor WNT – Wingless/Integrated WT – Wild-Type XRCC1 – X-Ray Repair Cross-Complementing Protein 1 Zfas1 – Zinc Finger Antisense 1

XX FCUP Epigenetic Study of Colorectal Cancer: lncRNAs and CIMP Profiling.
FCUP Epigenetic Study of Colorectal Cancer: lncRNAs and CIMP Profiling.
21
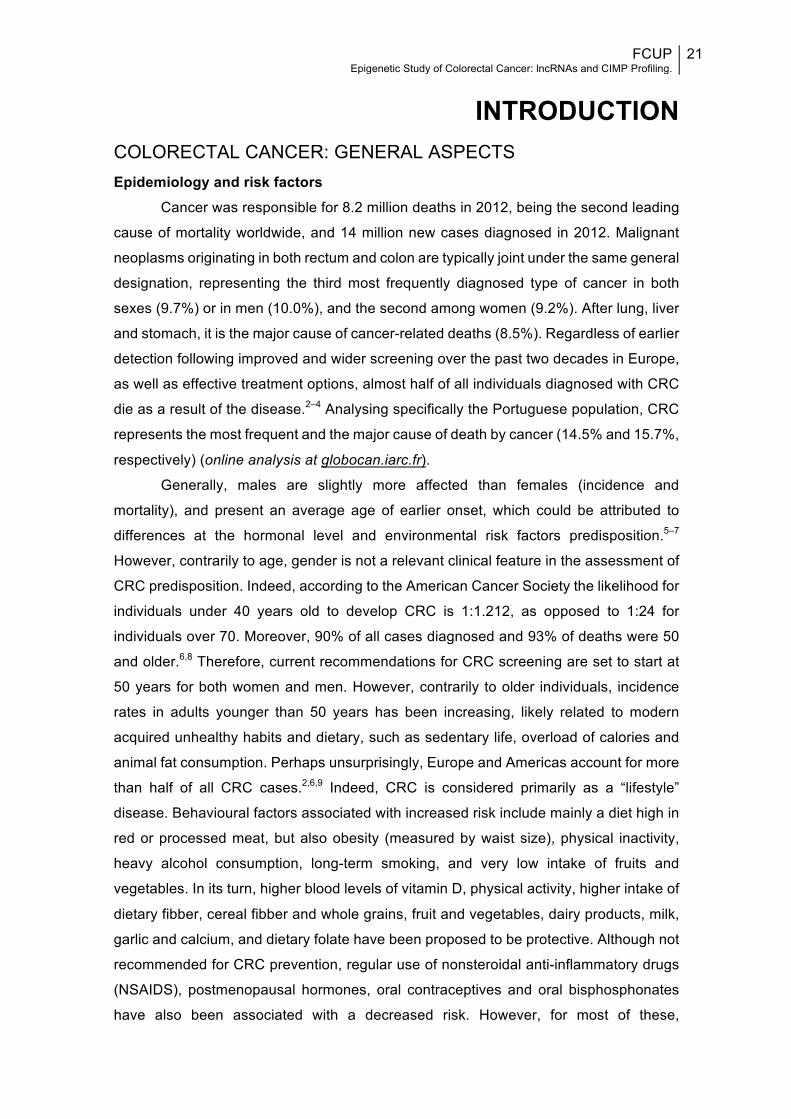
INTRODUCTION COLORECTAL CANCER: GENERAL ASPECTS Epidemiology and risk factors
Cancer was responsible for 8.2 million deaths in 2012, being the second leading
cause of mortality worldwide, and 14 million new cases diagnosed in 2012. Malignant
neoplasms originating in both rectum and colon are typically joint under the same general
designation, representing the third most frequently diagnosed type of cancer in both
sexes (9.7%) or in men (10.0%), and the second among women (9.2%). After lung, liver
and stomach, it is the major cause of cancer-related deaths (8.5%). Regardless of earlier
detection following improved and wider screening over the past two decades in Europe,
as well as effective treatment options, almost half of all individuals diagnosed with CRC
die as a result of the disease.2–4 Analysing specifically the Portuguese population, CRC
represents the most frequent and the major cause of death by cancer (14.5% and 15.7%,
respectively) (online analysis at globocan.iarc.fr).
Generally, males are slightly more affected than females (incidence and
mortality), and present an average age of earlier onset, which could be attributed to
differences at the hormonal level and environmental risk factors predisposition.5–7
However, contrarily to age, gender is not a relevant clinical feature in the assessment of
CRC predisposition. Indeed, according to the American Cancer Society the likelihood for
individuals under 40 years old to develop CRC is 1:1.212, as opposed to 1:24 for
individuals over 70. Moreover, 90% of all cases diagnosed and 93% of deaths were 50
and older.6,8 Therefore, current recommendations for CRC screening are set to start at
50 years for both women and men. However, contrarily to older individuals, incidence
rates in adults younger than 50 years has been increasing, likely related to modern
acquired unhealthy habits and dietary, such as sedentary life, overload of calories and
animal fat consumption. Perhaps unsurprisingly, Europe and Americas account for more
than half of all CRC cases.2,6,9 Indeed, CRC is considered primarily as a “lifestyle”
disease. Behavioural factors associated with increased risk include mainly a diet high in
red or processed meat, but also obesity (measured by waist size), physical inactivity,
heavy alcohol consumption, long-term smoking, and very low intake of fruits and
vegetables. In its turn, higher blood levels of vitamin D, physical activity, higher intake of
dietary fibber, cereal fibber and whole grains, fruit and vegetables, dairy products, milk,
garlic and calcium, and dietary folate have been proposed to be protective. Although not
recommended for CRC prevention, regular use of nonsteroidal anti-inflammatory drugs
(NSAIDS), postmenopausal hormones, oral contraceptives and oral bisphosphonates
have also been associated with a decreased risk. However, for most of these,

22 FCUP Epigenetic Study of Colorectal Cancer: lncRNAs and CIMP Profiling.
contradictory results published or lack of strong evidence and molecular explanation
limits their applicability.2,6,10 For example, folate deficiency was shown to result in
aberrant DNA methylation, mutations and chromosomal aberrations, but some studies
failed to prove a positive correlation, while some others attributed a negative effect to
folic acid fortification/supplementation.10,11
Methods of diagnosis
An early detection of the lesion is fundamental. A significant proportion of CRC
patients are diagnosed with a regional or metastatic stage of the disease.6 Screening
programmes are increasing and include both invasive and non-invasive tests. guaiac
Faecal Occult Blood Test (gFOBT) and Faecal Immunochemical Test for haemoglobin
(FIT) are based on stool analysis and therefore usually more tolerable, with
demonstrated mortality reduction.3 However, their sensitivity for advanced adenomas
and cancer is low to moderate (worse in the case of gFOBT), and their effectiveness is
highly dependent on positivity cut-off level.3,12 Both techniques have been used as initial
screening followed by colonoscopy to confirm positive cases. Such approach appears to
be more costly-effective than colonoscopy only. Although highly invasive and costly,
colonoscopy is still the preferable option due to a high sensitivity coupled with immediate
polyp resection, ampler test time intervals and better outcomes.6 Other less extensively
explored procedures such as Flexible Sigmoidoscopy (FS), Colon Capsule Endoscopy
(CCE), Computed Tomographic Colonography (CTC) and Magnetic Resonance
Colonography (MRC) are predicted to be important alternatives to colonoscopy
screening. Future research will focus on DNA, RNA and protein biomarkers in blood and
stool based tests with higher sensitivity.3,6
Histology and molecular etiology
Before focusing on CRC prognosis and treatment, it is important to pathologically
characterize CRC and describe its classification and diverse etiology. In fact, CRC is a
heterogeneous disease in terms of clinical behaviour and response to therapy, which
correlates with distinct underlying molecular mechanisms and origin.13 The colon (large
intestine) measures almost 150 cm and consists of 4 segments: cecum and vermiform
appendix, colon (ascending, transverse, and descending portions), rectum, and anus. It
is commonly divided in proximal or right-sided colon (cecum, ascending colon, hepatic
flexure, transverse colon, splenic flexure), distal or left-sided colon (descending colon
and sigmoid colon), and rectum (rectosigmoid junction and rectum) [Fig.1].14
Increasingly, it is being recognized that CRC risk factors, tumour characteristics, and
response to treatment may vary across anatomic subsites, mainly between rectum and
FCUP Epigenetic Study of Colorectal Cancer: lncRNAs and CIMP Profiling.
23
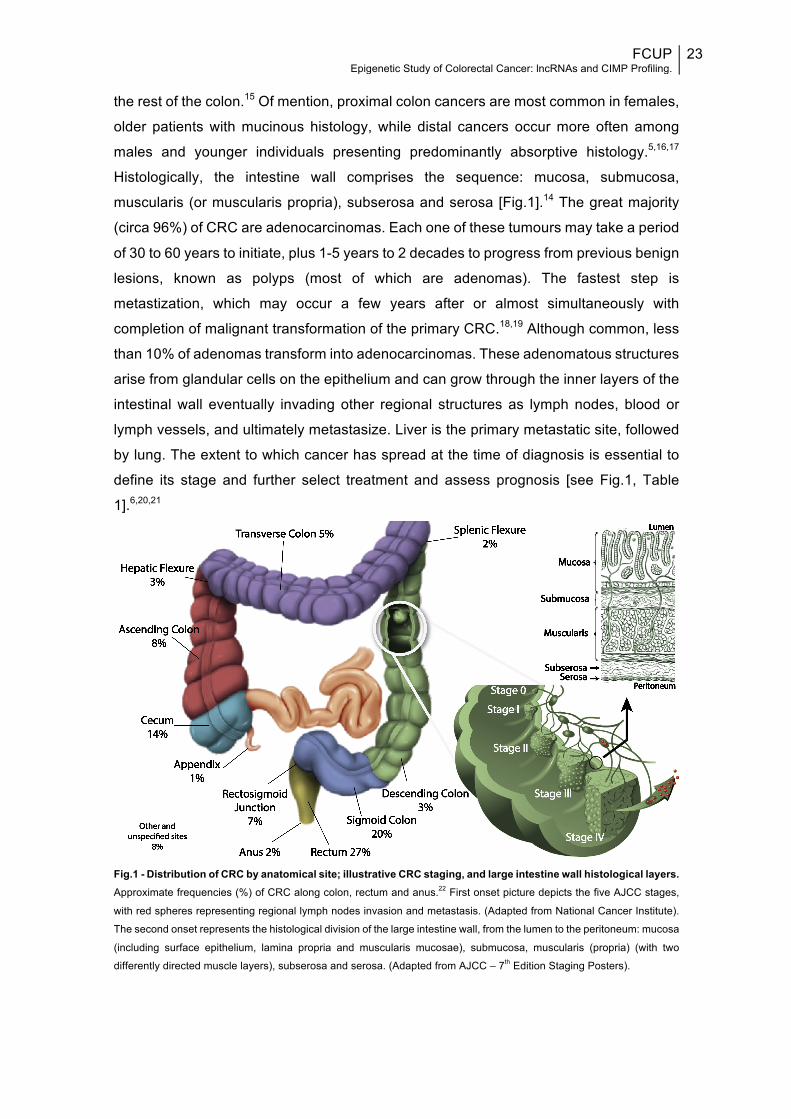
the rest of the colon.15 Of mention, proximal colon cancers are most common in females,
older patients with mucinous histology, while distal cancers occur more often among
males and younger individuals presenting predominantly absorptive histology.5,16,17
Histologically, the intestine wall comprises the sequence: mucosa, submucosa,
muscularis (or muscularis propria), subserosa and serosa [Fig.1].14 The great majority
(circa 96%) of CRC are adenocarcinomas. Each one of these tumours may take a period
of 30 to 60 years to initiate, plus 1-5 years to 2 decades to progress from previous benign
lesions, known as polyps (most of which are adenomas). The fastest step is
metastization, which may occur a few years after or almost simultaneously with
completion of malignant transformation of the primary CRC.18,19 Although common, less
than 10% of adenomas transform into adenocarcinomas. These adenomatous structures
arise from glandular cells on the epithelium and can grow through the inner layers of the
intestinal wall eventually invading other regional structures as lymph nodes, blood or
lymph vessels, and ultimately metastasize. Liver is the primary metastatic site, followed
by lung. The extent to which cancer has spread at the time of diagnosis is essential to
define its stage and further select treatment and assess prognosis [see Fig.1, Table
1].6,20,21
Fig.1 - Distribution of CRC by anatomical site; illustrative CRC staging, and large intestine wall histological layers. Approximate frequencies (%) of CRC along colon, rectum and anus.22 First onset picture depicts the five AJCC stages,
with red spheres representing regional lymph nodes invasion and metastasis. (Adapted from National Cancer Institute).
The second onset represents the histological division of the large intestine wall, from the lumen to the peritoneum: mucosa
(including surface epithelium, lamina propria and muscularis mucosae), submucosa, muscularis (propria) (with two
differently directed muscle layers), subserosa and serosa. (Adapted from AJCC – 7th Edition Staging Posters).
24 FCUP Epigenetic Study of Colorectal Cancer: lncRNAs and CIMP Profiling.
About 75% of all CRC cases have no apparent predisposing etiology, whereas
the remaining cases are related to familial/hereditary syndromes and Inflammatory
Bowel Disease (IBD). Familial CRC includes known hereditary forms, such as Familial
Adenomatous Polyposis (FAP), Hereditary Nonpolyposis Colorectal Cancer (HNPCC –
also known as Lynch syndrome), MUTYH-Associated Polyposis (MAP), and the
hamartomatous polyposis syndromes. The majority of familial cases have no clearly
identifiable genetic etiology, but it likely comprises less penetrant variations or Single-
Nucleotide Polymorfisms (SNPs).23,24The approximate percentage of distribution for
each condition is as follows: sporadic, ~75%; familial (not known), ~15%; HNPCC, <5%;
FAP, ~1%; IBD, ~1%; MAP, ~1%; hamartomas, <1%.24 Focusing on sporadic CRC, it
can be divided in hypermutated (16%) and non-hypermutated (84%). Particularly,
tumours from the right/ascending colon are more prone to be hypermethylated and to
display elevated mutation rates.25
Almost 30 years ago, Fearon and Vogelstein described a simplified multistep
model for the formation of adenocarcinomas from normal mucosa. The model was based
on the total accumulation of multiple genetic mutations leading to a selective growth
advantage of those cells, with a minimum number of different mutations required –
affecting mostly cell proliferation or DNA damage response (DDR).26 Adenomatous
polyposis coli (APC) inactivation,which is responsible for FAP and approximately 85%
of sporadic CRC mutations, represents the initiating event in adenoma formation, which
is followed by accumulation of multiple mutations inactivating other tumour suppressors
and activating particular oncogenes. Loss of APC or, rarely, mutational activation of β-
catenin (CTNNB1), leads to an aberrant activation of the Wnt pathway. After this
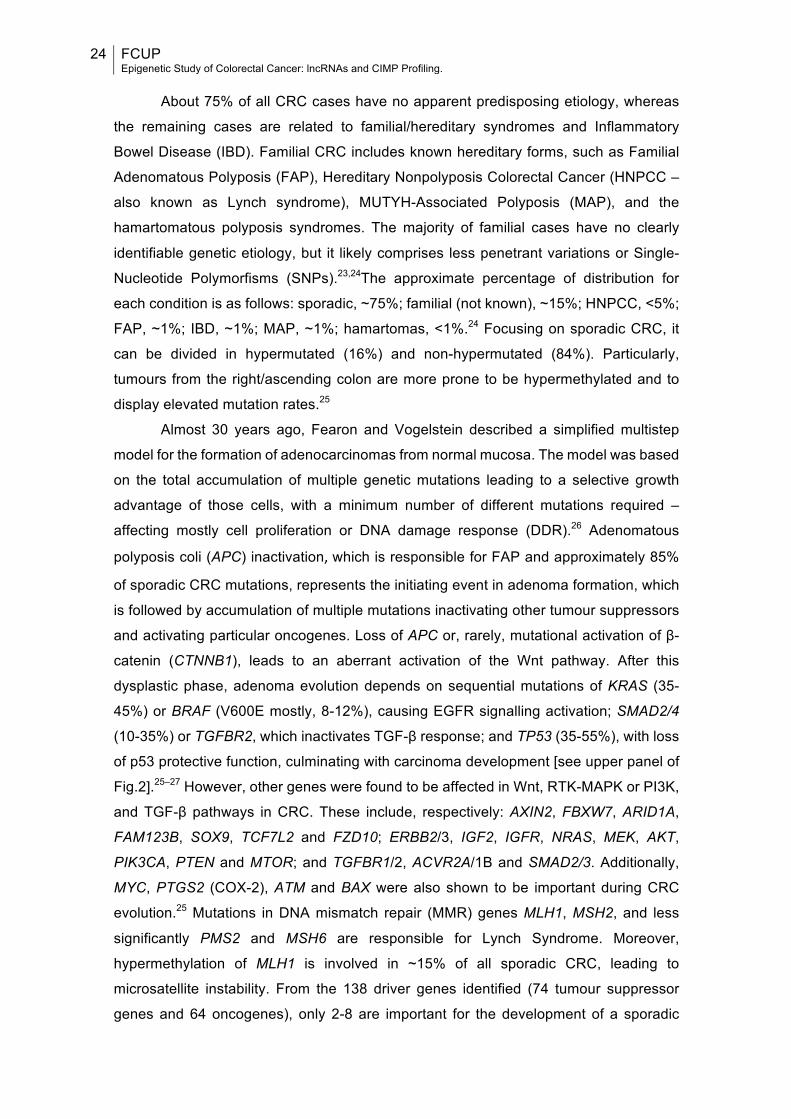
dysplastic phase, adenoma evolution depends on sequential mutations of KRAS (35-
45%) or BRAF (V600E mostly, 8-12%), causing EGFR signalling activation; SMAD2/4
(10-35%) or TGFBR2, which inactivates TGF-β response; and TP53 (35-55%), with loss
of p53 protective function, culminating with carcinoma development [see upper panel of
Fig.2].25–27 However, other genes were found to be affected in Wnt, RTK-MAPK or PI3K,
and TGF-β pathways in CRC. These include, respectively: AXIN2, FBXW7, ARID1A,
FAM123B, SOX9, TCF7L2 and FZD10; ERBB2/3, IGF2, IGFR, NRAS, MEK, AKT,
PIK3CA, PTEN and MTOR; and TGFBR1/2, ACVR2A/1B and SMAD2/3. Additionally,
MYC, PTGS2 (COX-2), ATM and BAX were also shown to be important during CRC
evolution.25 Mutations in DNA mismatch repair (MMR) genes MLH1, MSH2, and less
significantly PMS2 and MSH6 are responsible for Lynch Syndrome. Moreover,
hypermethylation of MLH1 is involved in ~15% of all sporadic CRC, leading to
microsatellite instability. From the 138 driver genes identified (74 tumour suppressor
genes and 64 oncogenes), only 2-8 are important for the development of a sporadic
FCUP Epigenetic Study of Colorectal Cancer: lncRNAs and CIMP Profiling.
25
CRC. The rest accounts for “passenger” alterations arising as aftereffect of the process.
Transcriptional regulation, chromatin modification, STAT, Hedgehog, Notch and cell
cycle/apoptosis complete the known list of pathways mutated by driver genes
defects.19,28 However, further explanation and detailing of such cascades goes beyond
the subject of this dissertation.
Fig.2 - Genetic and epigenetic marks in three proposed pathways to sporadic CRC development. At the top:
Fearon-Vogelstein diagram depicting key genes that are inactivated or activated upon mutation (less representative,
inside parenthesis) and/or LOH (18q for DCC and SMAD2/4, and 17p for TP53); and their corresponding pathways (bold)
found to be altered in CRC progression from normal epithelium to carcinoma, encompassing different phases of adenoma
maturation. More recently, three pathways leading to CRC where proposed: traditional (50-70%), alternative (10-30%)
and serrated (10-20%). Each is associated with a particular group of genetic and epigenetic alterations and polyp histology
(respectively, tubular, villous and serrated).
Amongst CRC classifications, one is commonly accepted and considers the
existence of at least three molecular pathways conducting CRC pathogenesis coupled
with genomic instability. Microsatellite instability (MSI; mostly hypermutated tumours),
chromosomal instability (CIN; mostly non-hypermutated tumours), and CpG island
methylator phenotype (CIMP; within both the hypermutated and non-hypermutated
categories) differently affect tumour progression, metastization and treatment response.
A particular etiology behind each pathway explains mutational status, immune response
and other molecular disparities, contributing to a differential prognosis.19
CIN, the most common pathway, is present in 70-85% of all sporadic CRC, and
was also the first to be characterized. However, no consensual explanation for its origin
has been yet reported. It may partly result from defects in chromosomal segregation,
telomere stability, and DDR. CIN tumours frequently display imbalance in chromosome
number (aneuploidy), sub-chromosomal genomic amplifications, loss of heterozygosity
26 FCUP Epigenetic Study of Colorectal Cancer: lncRNAs and CIMP Profiling.
(LOH), chromosome rearrangements, and base substitutions and deletions. Along with
typical karyotypic abnormalities, a specific pattern of altered genes that drive oncogenic
pathways is observed in CIN.19,29 However, it is not clear whether CIN arises from the
evolution of such mutational status or vice-versa. The overall prevalence of genetic
alterations in CIN follows the initial model, described here before, in line with CIN being
observed in adenomas and increasing in tandem with tumour progression. Although
disruption of APC has been proposed to establish a CIN phenotype, it is still
controversial. Nonetheless, CIN was found to be correlated with most cell pathways
altered in CRC.29
Prognosis and treatment
The 1-, 5- and 10-years relative survival rates for CRC are 83%, 65% and 58%,
respectively. When detected at a localized stage, it is highly curable, with 5-year survival
of 90%, in contrast with 70% when spread regionally or 13% in a metastatic stage.7
Colon cancer treatment is greatly dependent on tumour stage. For stages 0 to III,
and some cases of stage IV or recurrence, the primary approach is wide surgical
resection of the lesion, including local excision or polypectomy. Adjuvant chemotherapy
(CT) or radiotherapy (RT) are typically administrated to recurrence cases, stage III-IV
patients, and stage II patients presenting any clinical high-risk features. CT includes
several options, selected according to various factors such as tumour stage and clinical
history/condition of the patient. Generally, 5-FU (5-Fluorouracil) is the basic approach,
to which Leucovorin or a cytotoxic agent (often Irinotecan, Capecitabine or Oxaliplatin)
are coadministered, potentiating 5-FU activity or treatment efficacy.30 Thus, available
treatments include: FOLFOX (Leucovorin, 5-FU, and Oxaliplatin), FOLFIRI (Leucovorin,
5-FU, and Irinotecan), CapeOX (Capecitabine and Oxaliplatin) and FOLFOXIRI
(FOLFOX plus Irinotecan). Biological agents targeting VEGF (Bevacizumab, Ziv-
aflibercept, or Ramucirumab) or EGFR (Cetuximab or Panitumumab) are usually added
to one of the previous therapies, ameliorating the outcome. EGFR inhibitors are only
applicable in tumours without KRAS mutations. Both RT and/or CT can also be used as
neoadjuvant therapy when the tumour is difficult/impossible to resect, as it happens in
most stage IV or recurrence cases. Ablation or embolization techniques might also be
an option to treat some metastasis or recurrent liver tumours. Rectal cancers, more
prone to local recurrence, present a somewhat different treatment, in which neoadjuvant
RT/CT is also proposed for most stage III and some stage II cases.31–33
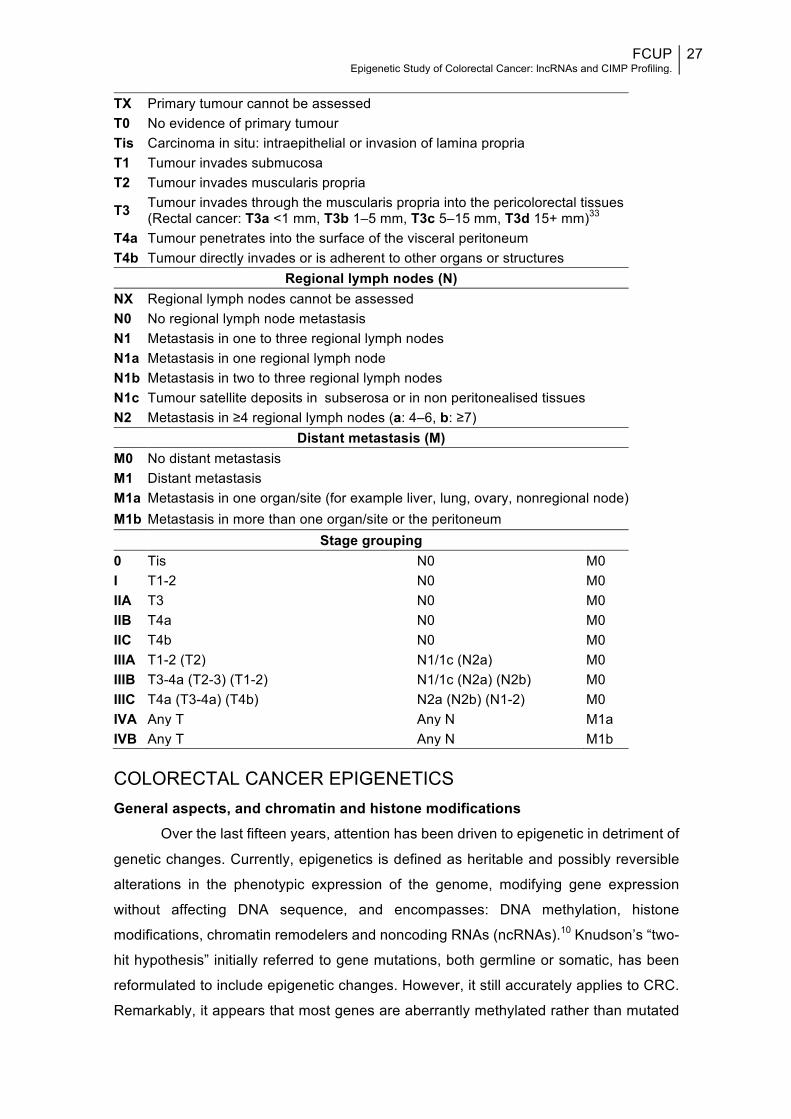
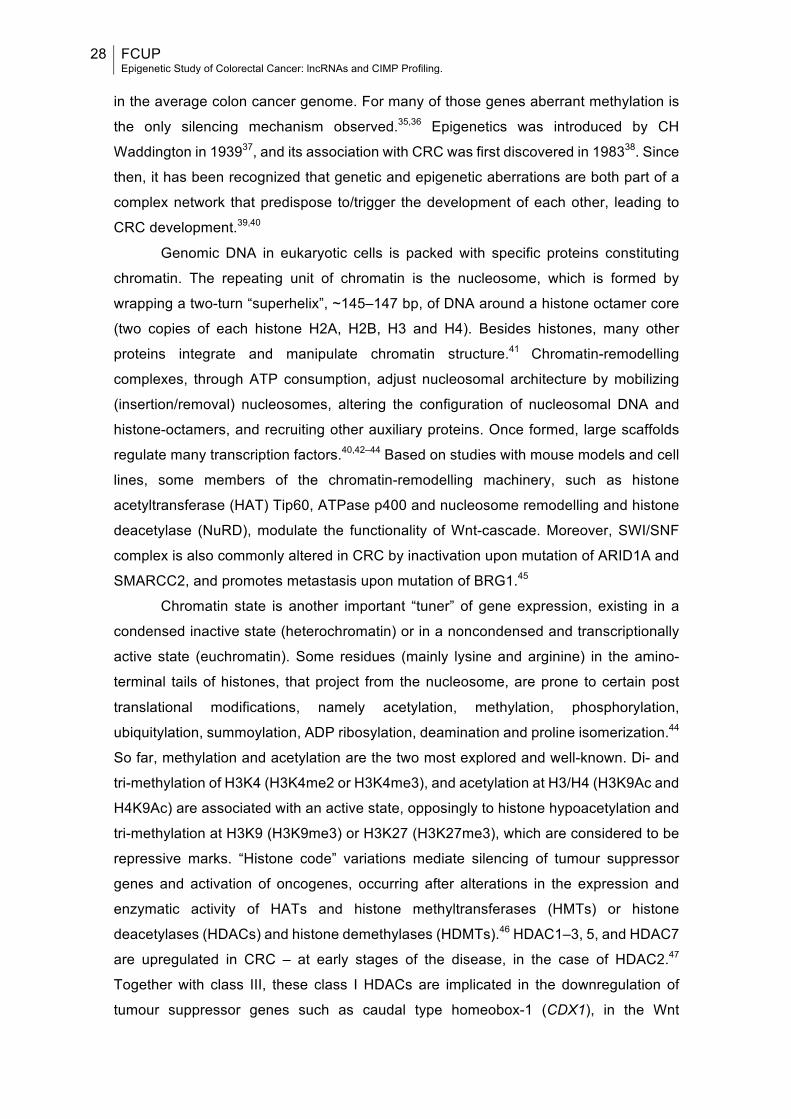
Table 1 - TNM staging system for CRC along with corresponding criteria and anatomical stage (AJCC stage).33,34
Primary tumour (T)
FCUP Epigenetic Study of Colorectal Cancer: lncRNAs and CIMP Profiling.
27
COLORECTAL CANCER EPIGENETICS General aspects, and chromatin and histone modifications
Over the last fifteen years, attention has been driven to epigenetic in detriment of
genetic changes. Currently, epigenetics is defined as heritable and possibly reversible
alterations in the phenotypic expression of the genome, modifying gene expression
without affecting DNA sequence, and encompasses: DNA methylation, histone
modifications, chromatin remodelers and noncoding RNAs (ncRNAs).10 Knudson’s “two-
hit hypothesis” initially referred to gene mutations, both germline or somatic, has been
reformulated to include epigenetic changes. However, it still accurately applies to CRC.
Remarkably, it appears that most genes are aberrantly methylated rather than mutated
TX Primary tumour cannot be assessed T0 No evidence of primary tumour Tis Carcinoma in situ: intraepithelial or invasion of lamina propria T1 Tumour invades submucosa T2 Tumour invades muscularis propria
T3 Tumour invades through the muscularis propria into the pericolorectal tissues (Rectal cancer: T3a <1 mm, T3b 1–5 mm, T3c 5–15 mm, T3d 15+ mm)33
T4a Tumour penetrates into the surface of the visceral peritoneum T4b Tumour directly invades or is adherent to other organs or structures
Regional lymph nodes (N) NX Regional lymph nodes cannot be assessed N0 No regional lymph node metastasis N1 Metastasis in one to three regional lymph nodes N1a Metastasis in one regional lymph node N1b Metastasis in two to three regional lymph nodes N1c Tumour satellite deposits in subserosa or in non peritonealised tissues N2 Metastasis in ≥4 regional lymph nodes (a: 4–6, b: ≥7)
Distant metastasis (M) M0 No distant metastasis M1 Distant metastasis M1a Metastasis in one organ/site (for example liver, lung, ovary, nonregional node) M1b Metastasis in more than one organ/site or the peritoneum
Stage grouping 0 Tis N0 M0 I T1-2 N0 M0 IIA T3 N0 M0 IIB T4a N0 M0 IIC T4b N0 M0 IIIA T1-2 (T2) N1/1c (N2a) M0 IIIB T3-4a (T2-3) (T1-2) N1/1c (N2a) (N2b) M0 IIIC T4a (T3-4a) (T4b) N2a (N2b) (N1-2) M0 IVA Any T Any N M1a IVB Any T Any N M1b
28 FCUP Epigenetic Study of Colorectal Cancer: lncRNAs and CIMP Profiling.
in the average colon cancer genome. For many of those genes aberrant methylation is
the only silencing mechanism observed.35,36 Epigenetics was introduced by CH
Waddington in 193937, and its association with CRC was first discovered in 198338. Since
then, it has been recognized that genetic and epigenetic aberrations are both part of a
complex network that predispose to/trigger the development of each other, leading to
CRC development.39,40
Genomic DNA in eukaryotic cells is packed with specific proteins constituting
chromatin. The repeating unit of chromatin is the nucleosome, which is formed by
wrapping a two-turn “superhelix”, ~145–147 bp, of DNA around a histone octamer core
(two copies of each histone H2A, H2B, H3 and H4). Besides histones, many other
proteins integrate and manipulate chromatin structure.41 Chromatin-remodelling
complexes, through ATP consumption, adjust nucleosomal architecture by mobilizing
(insertion/removal) nucleosomes, altering the configuration of nucleosomal DNA and
histone-octamers, and recruiting other auxiliary proteins. Once formed, large scaffolds
regulate many transcription factors.40,42–44 Based on studies with mouse models and cell
lines, some members of the chromatin-remodelling machinery, such as histone
acetyltransferase (HAT) Tip60, ATPase p400 and nucleosome remodelling and histone
deacetylase (NuRD), modulate the functionality of Wnt-cascade. Moreover, SWI/SNF
complex is also commonly altered in CRC by inactivation upon mutation of ARID1A and
SMARCC2, and promotes metastasis upon mutation of BRG1.45
Chromatin state is another important “tuner” of gene expression, existing in a
condensed inactive state (heterochromatin) or in a noncondensed and transcriptionally
active state (euchromatin). Some residues (mainly lysine and arginine) in the amino-
terminal tails of histones, that project from the nucleosome, are prone to certain post
translational modifications, namely acetylation, methylation, phosphorylation,
ubiquitylation, summoylation, ADP ribosylation, deamination and proline isomerization.44
So far, methylation and acetylation are the two most explored and well-known. Di- and
tri-methylation of H3K4 (H3K4me2 or H3K4me3), and acetylation at H3/H4 (H3K9Ac and
H4K9Ac) are associated with an active state, opposingly to histone hypoacetylation and
tri-methylation at H3K9 (H3K9me3) or H3K27 (H3K27me3), which are considered to be
repressive marks. “Histone code” variations mediate silencing of tumour suppressor
genes and activation of oncogenes, occurring after alterations in the expression and
enzymatic activity of HATs and histone methyltransferases (HMTs) or histone
deacetylases (HDACs) and histone demethylases (HDMTs).46 HDAC1–3, 5, and HDAC7
are upregulated in CRC – at early stages of the disease, in the case of HDAC2.47
Together with class III, these class I HDACs are implicated in the downregulation of
tumour suppressor genes such as caudal type homeobox-1 (CDX1), in the Wnt
FCUP Epigenetic Study of Colorectal Cancer: lncRNAs and CIMP Profiling.
29
pathway.48 Lysine specific demethylase 1 (LSD1) is a HDMT, which demethylates H3K4
and H3K9 and has been positively correlated with TNM stage, lymph node infiltration
and metastatic disease in CRC patients.49 Moreover, two multimeric polycomb
repressive complexes (PRCs), PRC1 and PRC2, are transcendent epigenetic regulators
that are able to silence genes either independently or synergistically through its histone
methylation capacity, initiating and maintaining H3K27me2/3, respectively. Also, EZH2
(PRC1 component) and BMI1 are frequently overexpressed in CRC. The former predicts
better recurrence-free survival (RFS) in those patients.45,50
MicroRNAs
From the two thirds of transcripts at some point transcribed from the mammalian
genome only <2% codify any protein, the rest representing noncoding RNA molecules
erroneously believed to present no function.51 MicroRNAs (miRNA, miR) are short RNA
molecules (19–25 ribonucleotides) that mediate posttranscriptional gene repression or
mRNA degradation of target mRNAs, while within RNA-induced silencing complex
(RISC).52 miRNAs are the most widely studied class of ncRNAs, and translationally
control over 60% of protein-coding genes. However, expression of ncRNAs is itself
regulated by numerous proteins, DNA methylation and histone modifications, evidencing
a highly complex network of interactions, which are often deregulated in cancer.53 In fact,
many studies found hundreds of differently expressed miRNAs in CRC, and particularly
connected with every important pathway of the multistep conventional CRC
carcinogenesis.54 Both miRNA122a and miR135a/b downregulate expression levels and
activity of APC and MSH2, mediating adenoma formation. let-7 miRNA family, miR-18a,
-96 and -143 regulate expression of KRAS, while miR-21 and miR-126 are associated
with PI3K pathway. Together with miRNAs regulating c-MYC (miR-17, -18a, -19a/b, -
20a, and -92a), they all play significant roles in an early to advanced adenoma
transition.55 Additional altered miRNAs are implied in pre-malignant to malignant
transformation (p53 regulators miR-16, -143 and -145, and downstream target miR-34a)
or invasion/metastatic phenotype (miR-21, -625, -200 and -126). Moreover,
downregulation of miR-378 and upregulation of miR-127-3p, -92a and -486-3p are
associated with KRAS mutations, while upregulation of miR-31 is instead associated with
BRAF mutations.46,54,55
LONG NONCODING RNAS & DNA REPAIR LncRNAs involved in colorectal cancer development
LncRNAs are simply defined as a class of ncRNAs transcripts longer than 200 nt
and the most representative group among those, usually with no significant open-reading

30 FCUP Epigenetic Study of Colorectal Cancer: lncRNAs and CIMP Profiling.
frames (ORFs) in its sequence.56,57 These poorly conserved RNA molecules present
tissue/cell, disease and spatiotemporal specificity, which supports their superior
applicability as potential biomarkers and treatment-target molecules.57,58 Due to their
inherent proneness to mutations, and hence structural diversity, fast evolutionary
changes come easier to lncRNAs. In line with this, it is not surprising the existence of so
many different functions and classifications attributed to these molecules. They are now
thought to rival the impact of coding-transcripts, being involved in the regulation of most
cellular mechanisms.59
lncRNAs classification is diverse and an ever-changing task. The most varied
classification is based on their function. Genes, proteins, mRNAs, microRNAs are all
targets of regulation by lncRNAs. By interacting with specific proteins, lncRNAs can
either repress, activate, recruit or serve as a scaffold for the assemble of protein
complexes involved in transcription. A common way for lncRNAs to control transcription
is through chromatin-based gene regulation.60 Indeed, several lncRNAs have been
shown to interact with histone modifiers and chromatin remodelling complexes histone
methyltranferases, such as PRCs and G9a protein.61 Although the main regulatory
effects of lncRNAs occur in a pre-translational manner, they are capable of regulating all
processes from gene to protein by different mechanisms. Additionally, lncRNAs are able
to originate miRNAs and snoRNAs, act as molecular decoys or compete for common
binding sites.62
Overall, and particularly in CRC, lncRNAs have successfully helped to clarify
previously unexplainable questions.63,64 Many arrays spotted a differential expression of
numerous lncRNAs between normal and transformed mucosa; according to CRC
development, invasion and metastatic stage63,65; and also in response to treatment, such
as 5-FU66 and radiation67. Additionally, profiles include p53-related68 and MYC repressed
transcripts69, as weel as hypermethylation of genes coding for lncRNAs70. CRC-
associated transcript 1(CCAT1) is upregulated in pre-malignant conditions and all
disease stages in CRC, but not in normal tissues. Therefore, this MYC-regulated lncRNA
has potential to be used for CRC screening, diagnosis, staging and development of novel
therapies.71,72 Another CRC-associated lncRNA, from the same family, is CCAT2, which
is also upregulated only in CRC – involved in cancer progression by promoting its
invasion and metastasis. Also, CCAT2 is correlated with microsatellite stable cancers,
higher expression levels of MYC and potentiation of Wnt signalling pathway.65,73 CCAT1-
L (CCAT1, the long isoform) upregulation in CRC mediates chromatin looping between
the MYC promoter and its enhancers in coordination with CCCTC-binding factor
(CTCF).74 Colorectal neoplasia differentially expressed (CRNDE) is detected in early
adenomas but not in normal mucosa, fostering cell proliferation, migration and invasion.
FCUP Epigenetic Study of Colorectal Cancer: lncRNAs and CIMP Profiling.
31
CRNDE promotes Warbug effect and is upregulated in plasma of CRC patients, possibly
being highly valuable for an early diagnosis.63,75 However, many additional lncRNAs are
non-specific to CRC and they include transcripts differently expressed also in other
malignancies.65 As the number of lncRNAs altered in CRC keeps increasing, the
comprehension of the related molecular mechanisms is not parallelly evolving, and only
a small group of transcripts is currently better studied.64 Little of them are implied in early
detection of CRC and fewer in its risk assessment. Nonetheless, lncRNAs often play an
important role in CRC progression, mainly through local invasion and distant metastasis,
which renders them important prognostic biomarkers and treatment options.65,72 Their
underlying mechanisms, expression patterns and functions are described in Table 2.
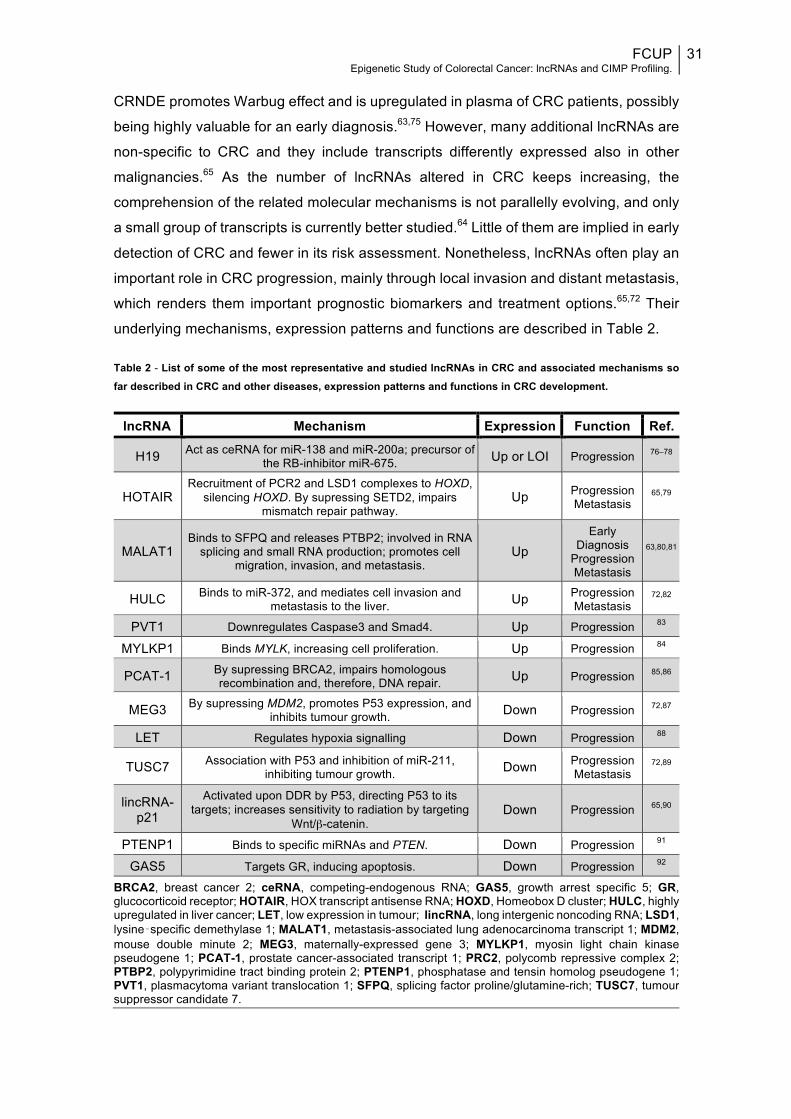
Table 2 - List of some of the most representative and studied lncRNAs in CRC and associated mechanisms so far described in CRC and other diseases, expression patterns and functions in CRC development.
lncRNA Mechanism Expression Function Ref.
H19 Act as ceRNA for miR-138 and miR-200a; precursor of the RB-inhibitor miR-675. Up or LOI Progression 76–78
HOTAIR Recruitment of PCR2 and LSD1 complexes to HOXD,
silencing HOXD. By supressing SETD2, impairs mismatch repair pathway.
Up Progression Metastasis
65,79
MALAT1 Binds to SFPQ and releases PTBP2; involved in RNA
splicing and small RNA production; promotes cell migration, invasion, and metastasis.
Up Early
Diagnosis Progression Metastasis
63,80,81
HULC Binds to miR-372, and mediates cell invasion and metastasis to the liver. Up Progression
Metastasis 72,82
PVT1 Downregulates Caspase3 and Smad4. Up Progression 83
MYLKP1 Binds MYLK, increasing cell proliferation. Up Progression 84
PCAT-1 By supressing BRCA2, impairs homologous recombination and, therefore, DNA repair. Up Progression 85,86
MEG3 By supressing MDM2, promotes P53 expression, and inhibits tumour growth. Down Progression 72,87
LET Regulates hypoxia signalling Down Progression 88
TUSC7 Association with P53 and inhibition of miR-211, inhibiting tumour growth. Down Progression
Metastasis 72,89
lincRNA-p21
Activated upon DDR by P53, directing P53 to its targets; increases sensitivity to radiation by targeting
Wnt/β-catenin. Down Progression 65,90
PTENP1 Binds to specific miRNAs and PTEN. Down Progression 91
GAS5 Targets GR, inducing apoptosis. Down Progression 92
BRCA2, breast cancer 2; ceRNA, competing-endogenous RNA; GAS5, growth arrest specific 5; GR, glucocorticoid receptor; HOTAIR, HOX transcript antisense RNA; HOXD, Homeobox D cluster; HULC, highly upregulated in liver cancer; LET, low expression in tumour; lincRNA, long intergenic noncoding RNA; LSD1, lysine‑specific demethylase 1; MALAT1, metastasis-associated lung adenocarcinoma transcript 1; MDM2, mouse double minute 2; MEG3, maternally-expressed gene 3; MYLKP1, myosin light chain kinase pseudogene 1; PCAT-1, prostate cancer-associated transcript 1; PRC2, polycomb repressive complex 2; PTBP2, polypyrimidine tract binding protein 2; PTENP1, phosphatase and tensin homolog pseudogene 1; PVT1, plasmacytoma variant translocation 1; SFPQ, splicing factor proline/glutamine-rich; TUSC7, tumour suppressor candidate 7.

32 FCUP Epigenetic Study of Colorectal Cancer: lncRNAs and CIMP Profiling.
LncRNAs involved in DNA repair
Tens of thousands of DNA lesions that each cell experiences per day would
immediately lead to its death if no mechanism of repair was present. DNA damage
response (DDR) is a broad term that includes different molecular responses responsible
for DNA integrity maintenance, and includes DNA damage recognition, recruiting of
mediators, transducers and effectors, culminating in DNA damage repair, activation of
cell cycle checkpoints or even apoptosis.93,94 DNA repair is promptly ignited after the
injury, but it is also highly regulated during the whole process, trying to avoid the ultimate
fate: apoptosis. Evolution has been whittling a limited set of mechanisms, each
responsible for repairing one or few specific DNA detrimental alterations.94 Double-strand
breaks (DSBs) are the less frequent and most toxic DNA lesions, being commonly a
consequence of exposure to UV radiation. DSBs repair is a difficult task for the cell and
consists of two different main pathways: non-homologous end-joining (NHEJ) and
homologous recombination (HR).93,95 Despite of so scarce examples, DSBs repair largely
represents the most studied repair mechanism in light of lncRNAs. DSBs repair-related
transcripts include PCAT-185, HOTAIR96, lncRNA-JADE97, DNA damage-sensitive RNA
1 (DDSR1)98, transcribed in the opposite direction of RAD51 (TODRA)99, antisense
ncRNA in the INK4 locus (ANRIL)100, or natural antisense transcript of Bok (BOKAS)101. The number of lncRNAs simultaneously associated with DNA repair and CRC is
even smaller. DDSR1 was found to be upregulated in different cell lines including colon
cancer cell line HCT116, and regulates early to late phases of DSBs repair response,
starting to mediate the sequester of BRCA1-RAP80 complex away from DNA damage
site, favouring HR. Upon induction by ATM-NF-κB, DDSR1 also mediates repression of
p53 targets, and, at a later stage, greater levels of DDSR1 sequester hnRNPUL1.98 Both
PCAT-1 and HOTAIR are upregulated in CRC, but their DNA-repair associated
mechanisms have not been only described specifically for CRC. While PCAT-1 post-
transcriptionally binds to the BRCA2 mRNA 3ʹUTR, supressing HR pathway85, HOTAIR
represses SETD2 by inhibiting the recruitment of the transcriptional machinery to SETD2
promoter, which reduces H3K36 methylation and consequent recruitment of MSH6-
MSH2 protein heterodimer, culminating with impaired MMR [Fig.3].102 This pathway is
responsible for identifying and excising single-base mismatches and insertion/deletion
loops (IDLs), and is intimately connected with CRC.103 A defective MMR response leads
to the accumulation of DNA errors throughout the genome, more frequently in short
sequences of nucleotide repeats, more prone to these errors, called microsatellites. MSI
is responsible for approximately 15-20% of all CRC cases.104 Tumours with high levels
of microsatellite instability (MSI-H)/unstable are defined as having ≥30% instable loci,
through a reference panel of 5 to 10 microsatellite loci, in opposition to tumours with low
FCUP Epigenetic Study of Colorectal Cancer: lncRNAs and CIMP Profiling.
33
levels of microsatellite instability (MSI-L) or microsatellite stable (MSS).105 MSI-H
phenotype is characterized by a proximal location, poor differentiation, mucinous
histology, and dense lymphocytic infiltration, compared to the conventional CIN pathway.
Loss of protein expression of 4 MMR genes (MLH1, MSH2, MSH6, and PMS2) is a test
often verified through immunohistochemistry (IHC) in clinical care. Indeed, MSI-H is a
CRC biomarker with prognosis and treatment prediction value. MSI-H, as hypermutated
tumours progress at a faster pace to malignancy, and usually do not respond to 5-FU
treatment. Moreover, over 40% of MSI-H tumours present mutation of BRAF (V600E).
Overall, however, MSI-H tumours present a better long-term prognosis.19,106
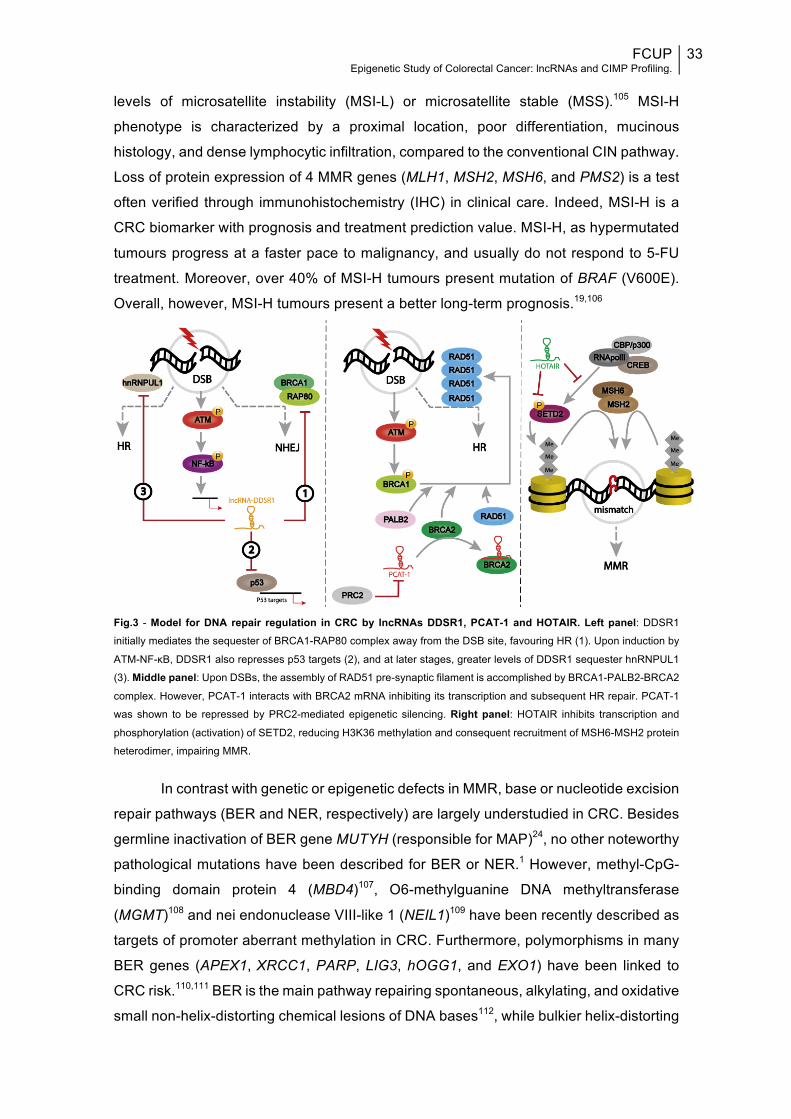
Fig.3 - Model for DNA repair regulation in CRC by lncRNAs DDSR1, PCAT-1 and HOTAIR. Left panel: DDSR1
initially mediates the sequester of BRCA1-RAP80 complex away from the DSB site, favouring HR (1). Upon induction by
ATM-NF-κB, DDSR1 also represses p53 targets (2), and at later stages, greater levels of DDSR1 sequester hnRNPUL1
(3). Middle panel: Upon DSBs, the assembly of RAD51 pre-synaptic filament is accomplished by BRCA1-PALB2-BRCA2
complex. However, PCAT-1 interacts with BRCA2 mRNA inhibiting its transcription and subsequent HR repair. PCAT-1
was shown to be repressed by PRC2-mediated epigenetic silencing. Right panel: HOTAIR inhibits transcription and
phosphorylation (activation) of SETD2, reducing H3K36 methylation and consequent recruitment of MSH6-MSH2 protein
heterodimer, impairing MMR.
In contrast with genetic or epigenetic defects in MMR, base or nucleotide excision
repair pathways (BER and NER, respectively) are largely understudied in CRC. Besides
germline inactivation of BER gene MUTYH (responsible for MAP)24, no other noteworthy
pathological mutations have been described for BER or NER.1 However, methyl-CpG-
binding domain protein 4 (MBD4)107, O6-methylguanine DNA methyltransferase
(MGMT)108 and nei endonuclease VIII-like 1 (NEIL1)109 have been recently described as
targets of promoter aberrant methylation in CRC. Furthermore, polymorphisms in many
BER genes (APEX1,XRCC1, PARP, LIG3, hOGG1, and EXO1) have been linked to
CRC risk.110,111 BER is the main pathway repairing spontaneous, alkylating, and oxidative
small non-helix-distorting chemical lesions of DNA bases112, while bulkier helix-distorting

34 FCUP Epigenetic Study of Colorectal Cancer: lncRNAs and CIMP Profiling.
and more complex lesions, such as pyrimidine dimers and intra-strand crosslinks, are
corrected by NER.113 BER also removes uracil (or its analogues) misincorporated into
the DNA as a result of 5-FU, further linking DNA repair and CRC sensitivity to
treatment.114 Through a functional analysis of the overall DNA repair capacity (DRC) for
BER and NER in a subset of CRC patients, as well as genetic and epigenetic aspects,
Slyskova et al (2012) found no meaningful alterations, indicating that excision repair is
not a major driving factor in malignant transformation, which is consistent with previous
studies.1
CpG ISLAND METHYLATOR PHENOTYPE (CIMP) & PROGNOSIS
DNA methylation
DNA methylation represents the most studied epigenetic area in CRC.115 In fact,
the first epigenetic alteration reported in cancer was global loss of DNA methylation,
represented by 5’-methylcytosine (5-mC), in CRC, and affecting mostly repetitive
transposable sequences, such as LINE-1 and Alu elements.36,38 This is an age-
dependent and early event in CRC development, predisposing to genomic instability,
including loss of imprinting (LOI) and CIN. Accordingly, LINE-1 hypomethylation
inversely associates with MSI and/or CIMP.115 DNA methylation occurs at cytosine bases
preceding guanines, called CpG dinucleotides (C-phosphodiester-G bond), most of
which are methylated in a healthy state. However, there are also unmethylated CpG rich
sequences, called CpG islands, and generally located in the 5’ region of approximately
half of all human gene promoters. CpG islands are 200-2000 bps long, with a CG content
>50% and a ratio of observed to expected CpGs >60%, and are involved in the regulation
of gene expression.54,115,116 When methylated they may induce chromatin conformational
changes, through MBD proteins, hindering promoter assessment and repressing
transcription. In CRC, both hypermethylation and hypomethylation abnormalities are
present, but in a reversed pattern from normal mucosa.46
The addition of a methyl group (-CH3) to a cytosine is catalysed by DNA
methyltransferases (DNMTs) using S-adenosylmethione as the methyl donor compound,
in either a de novo (DNMT3A and DNMT3B) or maintenance fashion (DNMT1).36,46 In
CRC, both DNMT1 and DNMT3B were shown to contribute to CpG methylation and
aberrant gene silencing. Moreover, mutations in DNMT1 and SNPs in DNMT3B have
also been linked with CRC risk.10,39
CIMP involvement in colorectal cancer
It has been increasingly recognized that a distinct methylation pattern appears as
a “function of age”, the so-called “epigenetic drift”, which also affects methylation of
FCUP Epigenetic Study of Colorectal Cancer: lncRNAs and CIMP Profiling.
35
promoters.115 Throughout the rest of this text the term “methylation” will be applied in the
sense of gene promoter hypermethylation unless otherwise stated. DNA methylation in
both normal-appearing mucosa and CRCs (age-related methylation, type A methylated
genes) may precede tumour formation, arising in close relation with epigenetic
microenvironment and external factors, whilst DNA methylation specifically in CRCs
(cancer-specific methylation, type C methylated genes) seems to be a less random
process, and is associated with a more limited number of genes and a subset of CRCs
– which then evolve along a CIMP pathway.117 The molecular causes underlying such
methylation are not well-understood, but there are multiple models for cancer-related
aberrant methylation, encompassing mechanisms such as overexpressed, hyperactive,
or misdirected DNMTs, dysregulation of associated ncRNAs, unrepaired halogenated
DNA damage products mimicking 5-mC, and impaired barrier elements.36
Hundreds to thousands of genes are aberrantly methylated in the average CRC
genome, and although no sharp distinction between type A and type C genes has been
made, many of the CRC-specific hypermethylation events have been linked to the same
important pathways targeted by mutational events.36,39,54 The term “CpG island
methylator phenotype,” or CIMP, was first coined in 1999 by Toyota, with Baylin, Issa
and others to characterize some tumours presenting a distinct phenotype of
simultaneous and intense promoter hypermethylation of some tumour suppressor genes,
leading to progressive genetic silencing and tumourigenesis, even in the absence of any
genetic mutations. According to the same study, CRCs can be divided in CIMP− (CIMP-
negative) or CIMP+ (CIMP-positive), respectively displaying rare methylation or
simultaneous aberrant methylation of several genes.117 One of the first and best studied
alterations was biallelic promoter CpG island methylation of MLH1, which unveiled a
strong link between CIMP and MSI-H tumours.39 Indeed, CIMP+ tumours have been not
only associated with MSI-H phenotype, but also with older age, female sex, mucinous
cell differentiation, smoking, BRAF and less often KRAS mutations.39 Approximately 20%
of CRCs are CIMP tumours36,118, rarely occurring in rectal cancer and increasing linearly
up to the ascending colon.119
To define CIMP, promoter methylation of a panel of specific genes is evaluated,
with some of them being more valuable than others. However, which specific methylated
loci should be used to describe CIMP is not standardized.54,120 The so-called “classic”
panel of Park et al., later described by Issa117, comprises CpG islands in MLH1,
CDKN2A(p16), and methylated in tumours (MINTs) 1, 2, and 31 loci, and provides a
simplified and representative approach to define CIMP. The five methylation markers
have distinct functions. MINT markers correspond to the promoters of unique genes
except MINT2; MINT1 corresponds to synaptic vesicle glycoprotein 2C gene (SV2C),

36 FCUP Epigenetic Study of Colorectal Cancer: lncRNAs and CIMP Profiling.
and MINT31 corresponds to a CpG island upstream of the calcium channel CACNA1G
gene.121,122 P16 is an inhibitor of cyclin-dependent kinase 4 (CDK4) and CDK6, which is
associated with aging and functions as a tumour suppressor, leading to unrestrained cell
proliferation upon genetic or epigenetic inactivation.123 In Park’s work, the selected
technique to analyse methylation was methylation-specific PCR (MSP).124 These 5
genes/loci were tested first in 1999 by Toyota et al. along with other 25 newly cloned
differentially methylated DNA sequences, and were later selected based on their
frequent methylation.117,124 In 2006, using MethyLight technology, Weisenberger et al.
proposed a new robust 5-gene panel (CACNA1G, IGF2, NEUROG1, RUNX3, and
SOCS1), further supporting CIMP as a distinct molecular trait of CRC.125 Nevertheless,
it does not seem to outperform the “classic” one.116 Both studies classified tumours as
CIMP+ when more than 1 marker was methylated. The dichotomized CIMP classification
adopted in those articles, while being the first defined and the most common, is not the
most informative. This bimodal distribution failed to explain CIMP+/MSS tumours for
example, which were then shown to be better clarified in a tri-modal partition of CIMP-
High (H), CIMP-Low (L) and CIMP-0.116,118,126,127 In fact, Ogino et al. quantified DNA
methylation (MethyLight) also in 5 CIMP-specific gene promoters (CACNA1G,
CDKN2A(p16), CRABP1, MLH1, and NEUROG1), defining tumours presenting 4-5/5
methylated markers as CIMP-H, 1-3/5 methylated markers as CIMP-L, and 0/5
methylated markers as CIMP-0 tumours.127 Using another large cohort, the same author
tested the prior markers plus IGF2, RUNX3, and SOCS1 to classify CRC as CIMP-H
when 6-8/8 markers were methylated, CIMP-L when only 1-5/8 were methylated, and
CIMP-0 if no promoter was found to be methylated.128 Moreover, both “classic” and “new”
panels have also been applied in a tri-model classification, and they may be further
developed to contain additional loci.118
The characteristics of the three CIMP groups are not well defined, but they do
present independent associated features. Regardless of MSI status, CIMP-H tumours
correlate with proximal tumour location, serrated pathway, older age, female gender,
poor differentiation,signet ring cells, high BRAF and low TP53 mutation rates, loss of
nuclear p27 (CDKN1B), LINE-1 methylation, inactive CTNNB1 and PTGS2, and
expression of DNMT3B, p21 (CDKN1A), TGFBR2 and SIRT1.11,120 CIMP-H represents
~15-20% of all CIMP tumours, and although it is more related to MSI-H, both MSI-H
CIMP-H and MSI-L/MSS CIMP-H tumours exist.120 CIMP-L tumours are usually MSS or
MSI-L, characterized by CIN, and associated with male gender and KRAS mutations. In
fact, KRAS and BRAF mutations are mutually exclusive and seem to play an important,
yet still unclarified, role in CIMP development.46 By its turn, CIMP-0 tumours are
associated with CIN, wild-type KRAS/BRAF, distal colon and show no sex predilection.120
FCUP Epigenetic Study of Colorectal Cancer: lncRNAs and CIMP Profiling.
37
Furthermore, CIMP-negative tumours have been occasionally split into two different
subtypes, one associated with TP53 mutations and distal location, and the other one
showing a low frequency of hypermethylation or cancer-specific gene mutation, while
mostly located in the rectum.46
Distinctive molecular subclasses of MSI/CIMP tumours have been proposed
when classifying CRCs. However, because of subtle differences between CIMP-L and
CIMP-0 or MSI-L and MSS, only 6 groups are comfortably distinguished. The main
disparities described between MSI-H CIMP-H (10%) and MSI-L/MSS CIMP-H (5-10%)
tumours are MLH1 promoter methylation (MSI-H CIMP-H) and their respective
association with good or poor prognosis. MSI-H CIMP-L/0 (5%) includes mainly Lynch
syndrome, but also sporadic CRC. Unlike MSI-L CIMP-L tumours (~5%), this subtype is
preferably located in proximal colon and is not correlated with MGMT methylation and
loss. In addition, MGMT methylation is also the main difference between MSI-L CIMP-L
and MSS CIMP-L (30-35%) tumours. The characteristics of the remaining and biggest
group, MSI-L/MSS CIMP-0 (40%), greatly overlap with those described above in light of
the first CIMP-negative group [Fig.4].120
Molecular pathways according to genetic and epigenetic aspects
The statement that epigenetic changes take place at early stages of adenoma
formation inspired the division of sporadic CRC formation into three pathways, firstly by
Issa and later by Coppedè.46,129 The majority of sporadic CRCs originate in conventional
villous and/or tubular adenomas, following the classic adenoma-carcinoma sequence130,
and are further divided according to its association with KRAS (alternative pathway) or
APC (most traditional pathway) mutations and CIMP-L or CIMP-0, respectively. Common
features between them include CIN, MSI-L/MSS status and TP53 mutations (specifically
in the distal colon, for the KRAS-mutated pathway).46 Moreover, while the APC-mutated
pathway is the most typical (50-70%), the KRAS-mutated pathway (10-30%) is correlated
with poor prognosis and unresponsiveness to 5-FU and Cetuximab.46,129 More recently,
another new “alternative” to the conventional adenoma-CRC pathway with unique
features has been described (10-20%), involving instead serrated polyps as the
precursor lesion and evolving through suppressive methylation of many key genes. This
is the route through which many CIMP tumours arise, and is also associated with BRAF
and KRAS mutations (but not APC or CTNNB1), proximal location, and MSI
[Fig.2].46,115,129 Importantly, CIN, MSI and CIMP are not mutually exclusive. Indeed, up to
25% of MSI and 33% of CIMP+ tumours can exhibit chromosomal abnormalities, while
most MSI/CIN– CRCs are also CIMP+, and up to 12% of CIN+ tumours are MSI-H
[Fig.4].131–133
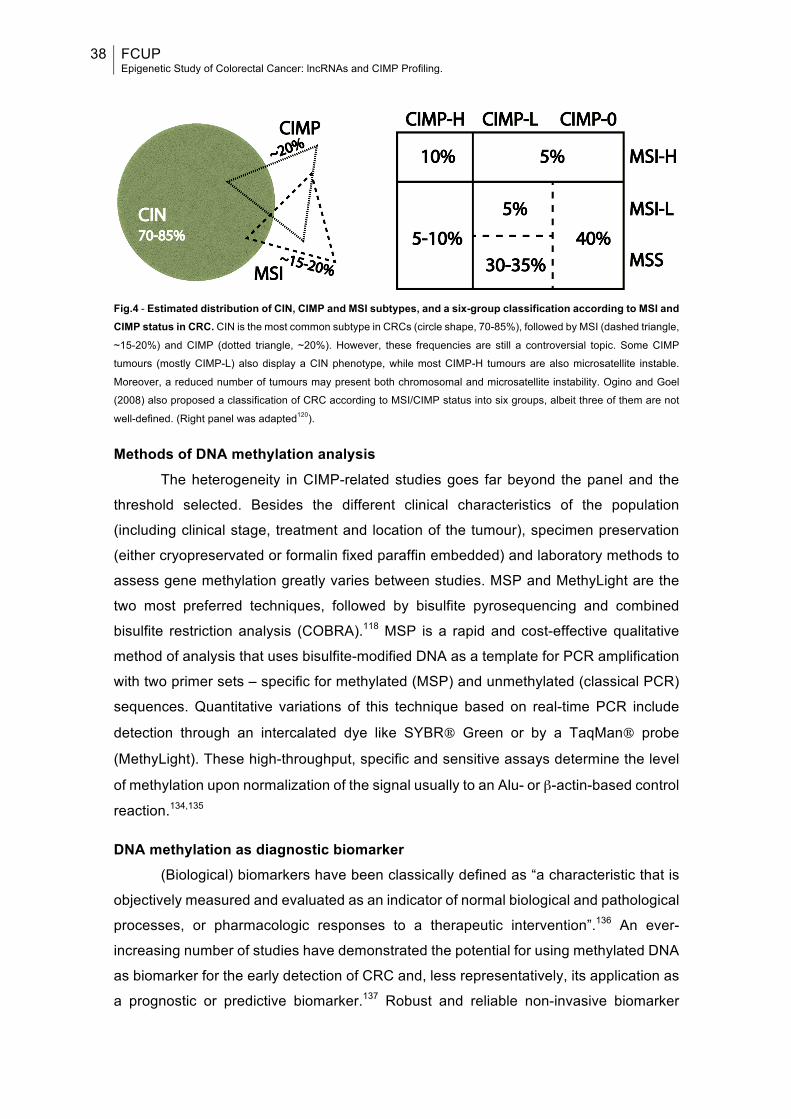
38 FCUP Epigenetic Study of Colorectal Cancer: lncRNAs and CIMP Profiling.
Fig.4 - Estimated distribution of CIN, CIMP and MSI subtypes, and a six-group classification according to MSI and CIMP status in CRC. CIN is the most common subtype in CRCs (circle shape, 70-85%), followed by MSI (dashed triangle,
~15-20%) and CIMP (dotted triangle, ~20%). However, these frequencies are still a controversial topic. Some CIMP
tumours (mostly CIMP-L) also display a CIN phenotype, while most CIMP-H tumours are also microsatellite instable.
Moreover, a reduced number of tumours may present both chromosomal and microsatellite instability. Ogino and Goel
(2008) also proposed a classification of CRC according to MSI/CIMP status into six groups, albeit three of them are not
well-defined. (Right panel was adapted120).
Methods of DNA methylation analysis The heterogeneity in CIMP-related studies goes far beyond the panel and the
threshold selected. Besides the different clinical characteristics of the population
(including clinical stage, treatment and location of the tumour), specimen preservation
(either cryopreservated or formalin fixed paraffin embedded) and laboratory methods to
assess gene methylation greatly varies between studies. MSP and MethyLight are the
two most preferred techniques, followed by bisulfite pyrosequencing and combined
bisulfite restriction analysis (COBRA).118 MSP is a rapid and cost-effective qualitative
method of analysis that uses bisulfite-modified DNA as a template for PCR amplification
with two primer sets – specific for methylated (MSP) and unmethylated (classical PCR)
sequences. Quantitative variations of this technique based on real-time PCR include
detection through an intercalated dye like SYBR® Green or by a TaqMan® probe
(MethyLight). These high-throughput, specific and sensitive assays determine the level
of methylation upon normalization of the signal usually to an Alu- or β-actin-based control
reaction.134,135
DNA methylation as diagnostic biomarker (Biological) biomarkers have been classically defined as “a characteristic that is
objectively measured and evaluated as an indicator of normal biological and pathological
processes, or pharmacologic responses to a therapeutic intervention”.136 An ever-
increasing number of studies have demonstrated the potential for using methylated DNA
as biomarker for the early detection of CRC and, less representatively, its application as
a prognostic or predictive biomarker.137 Robust and reliable non-invasive biomarker
FCUP Epigenetic Study of Colorectal Cancer: lncRNAs and CIMP Profiling.
39
assays for the detection of early CRC are needed, as currently it represents the most
effective strategy to reduce mortality. In fact, somatic mutations are relatively rare
compared to DNA methylation alterations in the early stages of CRC tumourigenesis.115
Both blood- or stool-based biomarkers have been proposed. Commercially available
tests include FDA approved analysis of Vimentin (VIM) gene methylation (ColoSure™)
and plasma-based test of aberrantly methylated Septin 9 gene (SEPT9), in Europe
(EpiproColon® 1.0, ColoVantage® and RealTime mS9).115 Other methylated biomarkers
in “circulating DNA” (ALX4, DAPK, NGFR, HPP1, NEUROG1, RUNX3 and TMEFF2),
stool (ATM, BMP3, FBN1, GATA4/5, GSTP1, NDRG4, SFRP1 and TFPI2) or in both
(APC, CDKN2A(p16), HLTF, MLH1, MGMT, RASSF2A, SFRP2 and WIF) were
proposed for CRC screening.115,137,138 Moreover, methylated BMP3, methylated NDRG4,
and mutant KRAS combined test (Cologuard®) was also FDA approved as a stool DNA-
based assay, and showed a greater overall sensitivity than FIT test for CRC or early
adenoma detection.139 Notably, multitarget DNA tests and/or combination with
conventional approaches are likely to improve the sensitivity to detect the lesion.140
DNA Methylation and CIMP in prognosis and treatment Clinical decisions following prognosis in CRC are currently based on tumour
staging and histopathologic characteristics – categories I and II of prognostic factors,
respectively, according to the College of American Pathologists (CAP).115,141 However,
such approach is fallible, as illustrated by numerous patients with the same stage, which
progress differently, surviving shorter or longer periods. Selection of specific methylated
DNA signatures seems to be highly feasible for the development of prognostic
markers.115 Methylation of APC, CDKN2A(p14) or RASSF1A was associated with poor
prognosis in a subset of patients independently of tumour stage or differentiation142, while
HOPX and RET were correlated with worse prognosis of stage II and III CRC,
respectively. Other genes whose aberrant methylation has been associated with poor
prognosis include CDKN2A(p16), IGF2 and extracellular matrix remodelling pathway-
associated genes (IGFBP3, EVL, CD109 and FLNC).46 Methylation of HLTF and
TMEFF2 in serum was independently associated with poor outcome.143 In opposition,
methylation of MGMT or MLH1 was linked to a more favourable prognosis.142,144
Moreover, methylation of genes targeted by the polycomb group of proteins (SFRP1,
MYOD1, HIC1 and SLIT2) was also associated with good prognosis in CIMP– male
patients.115 Because different pathways are commonly affected in CRC, selecting a panel
of different biomarkers will potentiate the accuracy of the test. Therefore, among all
biomarker candidates, CIMP status is by far the most promising indicator for
prognosticating CRC patients in terms of phenotypic presentation, therapeutic response

40 FCUP Epigenetic Study of Colorectal Cancer: lncRNAs and CIMP Profiling.
and survival outcomes.115,145 CIMP+ tumours have been independently associated with
shorter survival in many studies, irrespective of MSI status, particularly in patients with
early and locally advanced CRC. Moreover, CIMP status was also shown to be a
negative prognostic factor in patients with metastatic colorectal cancer treated with CT.146
However, conflicting results have been reported as well, with some studies describing a
null association between CIMP-H and CRC prognosis, or even noticing a better
prognosis after CT.118,147 Since most of CIMP-H-related clinicopathological and
molecular features overlap with those for MSI cancers, CIMP status is believed to
influence the good prognosis of CRC that is attributed to MSI. Therefore, evaluation of
both CIMP and MSI is highly recommended when stablishing prognosis.145 Additionally,
such analysis has been proved to depend also on the specific location of the tumour.145
Bae et al. found that CIMP+ tumours correlated with shorter disease-free survival (DFS)
and overall survival (OS) in distally but not in proximally located tumours, while MSI was
correlated with better survival only in proximal tumours.148 Given that most CIMP+
tumours present BRAF mutations, then CIMP biomarker is also predictive for mutational
profile in CRCs.125 In fact, BRAF mutated CRCs may contribute to shorter survival time
in CIMP+ MSS tumours.149
Although plenty of studies have been evaluating the predictive value of CIMP in
treatment response mainly to 5-FU, no solid conclusion has been reached. Some studies
agreed that adjuvant CT conferred a DFS and OS benefit among CIMP+ stage II and III
CRC patients, while others concluded to the contrary or found no significant predictive
valour.118 Nonetheless, the administration of 5-FU to treat CIMP tumours is not currently
recommended. One interesting study showed the benefits to stage III CIMP+ MSS
patients after the addition of Irinotecan to 5-FU/Leucovorin therapy (FOLFIRI). CIMP was
more strongly associated with a better response to the addition of Irinotecan than MMR
status.150
Besides being an appealing diagnostic, prognostic, and predictive biomarker,
alterations of methylation status are also potential pharmacologic targets, as they are
reversible, stable and early-in-development events. Agents inhibiting DNMTs and
HDACs can be applied to reactivate epigenetically silenced tumour suppressors. DNA
demethylating drugs 5-Azacitidine and 5-Aza-2′deoxycitidine (Decitabine), and HDAC
inhibitors Vorinostat and Valproic acid are currently approved for the treatment of some
malignancies. The combination of both groups of inhibitors has been suggested to be a
better strategy due to a more synergistic effect, as well as its coadministration with
chemotherapeutic drugs. Despite their low specificity and high toxicity, further preclinical
investigations and several clinical trials, in order to establish the applicability of these
and other related agents in CRC treatment.30,54
FCUP Epigenetic Study of Colorectal Cancer: lncRNAs and CIMP Profiling.
41
AIMS
The overall aim of the present dissertation is the epigenetic characterization of
sporadic CRC in light of lncRNAs (Project I) and DNA methylation (Project II),
respectively in two independent population-based sets. Particularly, the first project
encompassing the discovery of new transcripts altered in CRC and associated with DNA
excision repair pathways, and the former focused on the analysis of promoter CpG
islands hypermethylation pattern (CIMP tumours) and further determination of CIMP
prognostic value.
PROJECT I
The objective of this work was primarily to stablish the expression profile of ninety
disease-related lncRNAs in twenty tissue samples, which were equally divided into four
groups according to being either healthy mucosa or CRC lesions, and presenting either
lower or higher DNA repair capacity for BER DNA repair pathway; in order to find a
possible role for lncRNAs in sporadic CRC tumourigenesis in association with BER
functionality, and ultimately finding new biomarkers or treatment-targets.
PROJECT II
The main goal of this second project was the profiling of CIMP status in tissue
samples from a subset of 211 CRC patients and 43 controls, by measuring the promoter
methylation of the “classic panel” of five genes/loci, through real-time qMSP (SYBR®
Green-based) with bisulfite converted DNA; and further study the possible association
with other molecular and clinicopathological features and patients’ prognosis.

42 FCUP Epigenetic Study of Colorectal Cancer: lncRNAs and CIMP Profiling.
FCUP Epigenetic Study of Colorectal Cancer: lncRNAs and CIMP Profiling.
43
MATERIALS AND METHODS
PROJECT I
Study patients and sample collection The study included twenty tissue specimens isolated from seventeen patients
with sporadic primary CRC who underwent surgical resection, selected from a previous
subset of 70 patients included in Slyskova’s work.1 Patients were recruited between 2009
and 2011 at the Thomayer Hospital (Prague, Czech Republic), the General University
Hospital (Prague, Czech Republic), and Teaching Hospital and Medical School of
Charles University (Pilsen, Czech Republic). All patients signed informed consent. Ethics
approval was granted by the appropriate committees at the 3 hospitals. Tumour tissue
and adjacent healthy colon/rectal tissue (5–10 cm distant from the tumour) were resected
from all patients. All subjects were of the same ethnicity (Caucasian). Tumour and
adjacent normal tissues were deep frozen immediately after extraction and stored at
−80°C.
Selection of samples and DNA repair assays From the 70 paired samples tested by Slyskova and colleagues, 30 samples (24
paired, 3 CRC and 3 from normal mucosa) were selected based on RNA integrity number
(RIN) (≳ 5) measured before, and available expression of BER genes and related DNA
repair capacity data. The samples were then scored according to the values of BER-
DRC, and the median was calculated for each of the two groups of samples (CRC versus
control). The five highest and lowest values were selected, allowing four groups to be
formed, each with five samples, namely: CRC with higher BER-DRC, CRC with lower
BER-DRC, healthy mucosa with higher BER-DRC and healthy mucosa with lower BER-
DRC.
Although the determination of DRC values was not included in the present work,
as it had been already performed, a brief and general explanation of the procedure will
be next attended. Firstly, proteins were extracted from tissueand protein concentration
was measured by a Fluorescamine assay (Sigma-Aldrich Chemie GmbH, Steinheim,
Germany), with a NanoDrop® 3300 (Thermo Scientific, Wilmington, DE, USA). In vitro
repair assays were adopted as previously described150 and implemented using a 12-gel
slide format.105,151 Protein extracts were then incubated with substrate DNA from human
PBMCs treated with Ro 19-8022 (Hoffmann-La Roche, Basel, Switzerland) for 5 min,
and irradiated by a 500 W halogen lamp to induce 8-Oxoguanines, which are known to
be repaired specifically by BER. Levels of DNA strand breaks, generated during removal
44 FCUP Epigenetic Study of Colorectal Cancer: lncRNAs and CIMP Profiling.
of lesions, reflect the repair activity of the extract. After pipetting each extract per agarose
gel and the period of incubation, the protocol followed was the same as described before
for the Comet Assay.153 Each extract was also incubated with DNA from untreated
PBMCs to determine non-specific endonuclease activity of the extract. Finally, slides
were stained with SYBR® Gold (Invitrogen, Carlsbad, CA, EUA), and comets were
scored using a Nikon fluorescence microscope. DRC data were evaluated as tail DNA%
(%T).1
RNA extraction Total RNA was extracted from tissues using AllPrep™ DNA/RNA mini kit (Qiagen,
Hilden, Germany) according to manufacturer’s instruction. Concentration and purity of
all RNA samples were determined spectrophotometrically by measuring their optical
density (A260/280>2.0; A260/230>1.8) using a NanoDrop® ND-2000c (Thermo
Scientific, Wilmington, DE, USA). Additionally, RIN was checked using an Agilent
Bioanalyzer 2100, with a RNA 6000 Nano LabChip® (Agilent Technologies, Palo Alto,
CA, USA), following the protocol provided. The quality of some RNA samples was assed
by electrophoresis using 2.5% Ethidium Bromide (EtBr)-stained agarose gels instead.
LncRNAs profiling The simultaneous expression of 90 lncRNAs, five housekeeping reference
controls and one negative control was determined using the disease-related Human
LncProfiler™ 96-well qPCR Array Kit (cDNA synthesis kit and qPCR array) according to
the instructions of the manufacturers (System Biosciences, Mountain View, CA, USA).
Each kit allows 20 profiles to be performed. Off mention, lncRNA cDNA synthesis
reaction setup includes three different steps, namely polyadenylation, annealing of
adaptor, and conversion to cDNA. The initial step greatly enhances cDNA synthesis
yields of lncRNAs, potentiating the detection by qPCR. 5 µL of total RNA from each
sample (diluted to ~200-400 ng/µL) were cDNA converted and next submitted to real-
time PCR. Briefly, reaction mixtures for each 96-well qPCR plate consisted of 1400 µL
2X SYBR® Green PCR Master Mix (Applied Biosystem, Foster City, CA, USA.), 1400
µL of RNase-free water (QIAGEN GmbH, Hilden, Germany) and 20 µL of cDNA. The kit
provided primers in a plate, which were resuspended with 44 µL of RNase-free water
(QIAGEN GmbH, Hilden, Germany) per well before being use. 2 µL of each primer pair
and 28 µL of reaction mixture were loaded in each well of the qPCR plate. Thermal
cycling conditions consisted of initial incubation at 50°C, a denaturation step of 95˚C for
10 min, followed by 40 cycles of denaturation at 95˚C for 15 sec, and annealing and
extension at 60˚C for 1 min. An additional dissociation stage was included (95°C for 15
FCUP Epigenetic Study of Colorectal Cancer: lncRNAs and CIMP Profiling.
45
seconds, 60°C for 15 seconds, followed by a slow ramp to 95°C). Real-time PCR
analysis was performed with an Applied Biosystems® 7500 Real-Time PCR Sequence
Detection System. Finally, the cycle number at which the reaction crossed a threshold
(CT) was determined for each gene. Analysis of the RT-qPCR data was performed using
SDS version 1.3.1 software (Applied Biosystem, Foster City, CA, USA) as previously
described154. Raw CT data for each lncRNA was normalized to the geometric mean of
the five control genes, per plate (ΔCT = CTlncRNA − CTcontrols). The relative expression
levels of target lncRNAs were determined by the equation 2−∆CT. Fold change values
were calculated between two groups of interest: 2-(∆ CTgroup of interest 1 – ∆CTgroup of interest 2).
Statistical analysis Expression data from lncRNAs profiling were statistically evaluated using
GraphPad prism software version 7.0. P-values of less than 0.05 were considered
statistically significant. P-values were adjusted according to Holm-Šídák correction for
multiple comparisons.
PROJECT II
Study patients and sample collection 213 samples from sporadic and primary CRCs were obtained from a wide series
of patients diagnosed and submitted to tumour removal surgery at the Portuguese
Oncology Institute – Porto, Portugal, between November 1994 to March 2012, with no
previous history of CRC. However, almost 92% of all patients studied were diagnosed
between 2005 and 2012. All CRCs were extracted from primary tumours. Tissues were
routinely fixed and paraffin-embedded for standard pathologic examination, allowing for
tumour classification and World Health Organization (WHO)/American Joint Committee
on Cancer (AJCC) grading and staging.155,156 Additionally, an independent set of 50
paraffin-embedded normal colorectal mucosa from patients not diagnosed with CRC or
IBD was used as control. Relevant clinical data were collected from clinical charts [see
Results section – Table 7]. The study was approved by the institutional review board
(CESIPOFG-EPE 120/015).
DNA extraction from paraffinized tissues sections A representative paraffin block from each patient was selected and 12 serial 8-
micrometres thick sections were cut and placed on glass slides, from which two were
H&E stained (initial and final slides). Next, an experienced pathologist delimited the area
of tumour to be macrodissected, in the corresponding H&E stained slides. Other six non-

46 FCUP Epigenetic Study of Colorectal Cancer: lncRNAs and CIMP Profiling.
stained slides were deparaffinised using Xilol and Ethanol 100%, 90%, 70% and 50%,
following initial incubation at 55 ºC for 30-60 min to melt paraffin. A disposable sterile
scalpel blade was then used to macrodissect the selected tumour areas from the slides
with the addition of some drops of digestion buffer (Tris-HCl 1M, EDTA 0.1M, Tween 20
and sterile bi-distilled water (B.Braun, Melsungen, Germany)), by superposition to the
proper H&E stained slide. The removed portions were subsequently placed in labelled
1.5 mL tubes, with 1000 μL of digestion buffer plus Proteinase K (20 mg/mL, 25 μL)
(Zymo Research Corp., Irvine, CA, USA), and left incubating at least overnight at 55ºC,
until total digestion was accomplished. An extra 15 μL volume of Proteinase K was added
to facilitate complete digestion of some samples.
DNA was extracted from tissue according to the standard Phenol-Chloroform
procedure157, using 500 μL of Phenol-Chloroform solution at pH 8 (Sigma-Aldrich and
Merck KGaA, Darmstadt, Germany) in Phase Lock Gel Light tubes (5 Prime, Hamburg,
Germany). After centrifuging the tubes for 15 min at 13 000 rpm, the upper aqueous
phase containing DNA was transferred to a new tube, and then precipitated at -20ºC
overnight using chilled Ethanol 100% (twice the volume of the aqueous phase) (Merck
KGaA, Darmstadt, Germany), Ammonium Acetate 7.5 M (1/3 volume) (Sigma-Aldrich
Chemie GmbH, Steinheim, Germany) and Glycogen (2 μL) (Ambion, Austin, TX, USA).
This step was followed by two centrifugations at 13 000 rpm for 20 min with 70% Ethanol,
and the pellets were then air dried and eluted with bi-distilled water (B.Braun, Melsungen,
Germany). After DNA elution, concentrations were determined using NanoDrop™ Lite
Spectrophotometer (Thermo Scientific, Wilmington, DE, USA).
Two of the total 213 sporadic CRC cases and seven control samples lacked
enough material to be extracted, or re-extracted due to low amounts of DNA yielded.
These were excluded from this work. The next procedures were conducted for the
remaining 211 CRC cases and 43 controls.
Bisulfite conversion First introduced by Frommer et al (1992), bisulfite conversion is the gold-standard
technology for detection of DNA methylation; grounded on the finding that Sodium
Bisulfite treatment of cytosine and 5-methylcytosine has different consequences,
originating different DNA sequences for methylated and unmethylated DNA. In this
regard, cytosines in single-stranded DNA are converted into uracil residues and
recognized as thymine in subsequent PCR amplification and sequencing, while 5mCs
are immune to this conversion and remain as cytosines allowing them to be distinguished
from unmethylated cytosines. The procedure includes initial denaturation of DNA double-
strand, followed by sulfonation of unmethylated cytosines, giving origin to a cytosine
FCUP Epigenetic Study of Colorectal Cancer: lncRNAs and CIMP Profiling.
47
sulfonate, then deamination and finally desulfonation, thus losing the bisulfite group and,
finally, becoming uracils. Converted DNA strands are no longer self-complementary,
permitting the evaluation of DNA methylation along the DNA single strand (ssDNA).158,159 The required volume of DNA to achieve the final quantity of 1000 ng of DNA was
diluted in sterile double-distilled water to a total volume of 20 μL in a PCR tube, according
to the specified concentration of each sample. Due to the low concentration of some
samples, the quantity of DNA extracted from those samples was instead adjusted to 500
ng, 600 ng or 750 ng, and equalized at the last step of the conversion procedure.
DNA denaturation and bisulfite conversion were processed into one-step using
the EZ DNA Methylation-Gold™ Kit (Zymo Research Corp., Irvine, CA, USA) according
to manufacturer’s instructions. Briefly, 130 μL of the CT conversion reagent were added
to 20 μL of each DNA sample tube. The samples were then transferred to a Veriti® 96-
Well Thermal Cycler (Applied Biosystems Inc, Foster City, CA, USA) running under the
following steps: 98 ̊C for 10 min, 64 ̊C for 3 h, and storage at 4 ̊C. 600 μL of M-Binding
Buffer were added to a Zymo-Spin IC™ column, followed by the samples, and after 10
min the mixture was centrifuged at 10 000 rpm for 30 sec. Each column was washed
using 100 μL of M-wash buffer, with a new centrifugation. 200 μL of M-Desulphonation
buffer were then added and the plate was left at room temperature during 20 min,
followed by another centrifugation. Two consecutive steps including washing (200 μL of
M-wash Buffer) and centrifugation were performed. Each column was then transferred
to a new tube and 30 μL of bi-distilled water were directly added to the centre of each
column. 5 min later, the samples were centrifuged at 12 000 rpm for 30 sec to elute the
DNA. This step was repeated with an additional 30 μL volume of double-distilled water,
completing a total volume of 60 μL added. For those samples with lower amounts of
DNA, the total elution volumes applied were respectively 30 μL, 36 μL and 45 μL.
Universal Methylated Human DNA Standard (Zymo Research Corp., Irvine, CA, USA)
was used as DNA methylation control, in which case 10 μL were used to prepare the
initial dilution, and a total volume of 20 μL (10 μL + 10 μL) of bi-distilled water was added
to elute DNA.
Primers design and selection A subsequent PCR process is necessary to determine the methylation status of
targeted loci by using specific methylation primers after the bisulfite treatment. Therefore,
new primers specific for methylation were design using Methyl Primer Express®
Software v1.0 (Applied Biosystems Inc. Foster City, CA, USA). After copying the specific
gene/locus sequence from GenBank® (NCBI) to the program, the proper CpG island
was selected, and suggested primer sequences were scored by the program. According
48 FCUP Epigenetic Study of Colorectal Cancer: lncRNAs and CIMP Profiling.
to the characteristics of each primer pair analysed with NetPrimer (Premier BioSoft, Palo
Alto, CA, USA), and the pretended location, one of the proposed pairs was selected per
gene/locus. To design the new primers each gene/locus CpG islands were investigated
first. The studies by Toyota and colleagues (1999)117,160 and Kondo et al (2003)161 were
used as reference to selected the proper (region of) CpG island upstream of each of the
five genes/loci CDKN2A(p16), MLH1, MINT1, MINT2 and MINT31; as these articles
represent pilot reports and the basis for many other studies characterizing the same
genes/gene panel, regarding the selection of CpG island and primer sequences.
Therefore, in addition to the new primers designed in this work, the same primer
sequences used in those articles were purchased. Since these primers mentioned before
were used in MSP techniques, they were considered as a possible alternative if the newly
designed primers could not be used. In fact, this was the case of CDKN2A(p16), for
which previously mentioned primer sequences were used instead. Moreover, both newly
design and Issa’s primer sequences for MINT31 failed to amplify correctly, and therefore,
new primer sequences were selected for this locus, based on the work by Weisenberger
et al (2006)125. The final primer sequences employed to test all samples by qMSP, and
their associated characteristics are summarized in Table 3.
Quantitative methylation-specific polymerase chain reaction (qMSP) Quantitative real-time methylation specific PCR was performed using
NZYSpeedy qPCR Green Master Mix with ROX (2X) (NZYTech, Lda., Lisbon, Portugal),
and β‑actin (ACTB) as the reference gene, to analyse CpG islands methylation levels of
CDKN2A(p16), MLH1 and MINT1, 2 and 31 promoters, in all tissue samples. Reactions
were carried out in 384-well plates using a LightCycler 480 instrument II (Roche,
Mannheim, Germany). Briefly, per each well 2 μL of modified DNA, 5 μL of Master Mix
and 0.3 μL of working primers’ solution 10 μM were added. Double-distilled water was
also added to complete the final volume (10 μL). To prepare working primers’ solutions,
10 μL of each front (F) and respective reverse (R) primer’s solution (100 μM) were diluted
in 180 μL of double-distilled water. The PCR program comprised a period of 3 minutes
at 95°C to activate the enzyme, followed by 45 cycles with 3 seconds at 95°C (for DNA
denaturation) and 30 seconds at a specific annealing temperature for each gene (for
annealing, extension and data acquisition) [see Table 3 for annealing temperature data].
An additional dissociation stage was included. All samples were run in triplicates and in
each plate five negative template controls were also run. Universal Methylated Human
DNA Standard (Zymo Research Corp., Irvine, CA, USA) was used to generate five serial
dilutions by a 5X dilution factor. These serial dilutions were run in each plate and were
used to generate a standard curve, thus allowing for absolute quantification and

FCUP Epigenetic Study of Colorectal Cancer: lncRNAs and CIMP Profiling.
49
determination of PCR efficiency. A run was considered valid when the slope of each
standard curve was above -3.60, corresponding to PCR efficiencies of > 90%, and R2
value of at least 5 relevant data points exceeded 0.96. The relative level of methylated
DNA for each gene/locus in each sample was determined using the formula: [(target
gene/(β-actin) x 1000]. Analysis of the qMSP data was performed using LightCycler®
480 software 1.5.0 SP3 (Roche, Mannheim, Germany).
To confirm the amplification of the specific product in standards and samples, the
melting curve and melting temperature data were analysed and only those samples
amplifying the specific product for each gene/locus were selected. For each of the
selected tumour samples, a specific gene/locus was proposed to be methylated if the
value of the previously described ratio was superior to any of the ratio values for the
selected control samples, considering the same gene/locus. When none of the control
samples amplified the specific product, all the selected tumour samples were proposed
to be methylated. However, only those samples with a ratio value greater than the
correspondent 25th percentile were considered to be methylated.
Statistical analysis Statistical analyses were performed using the statistical program SPSS software
(IBM SPSS® Statistics version 24.0, Chicago, IL, USA). All P-values were two-sided,
and statistical significance was set at P <0.05. Methylation of MLH1 was excluded from
all statistical analysis due to the small number of methylated cases. Categorical
clinicopathological and molecular variables were compared to CIMP status and
methylation of each marker using the Chi-square test or the Fisher’s exact test, as
applicable. Age was considered a categorical variable, and was further divided in two
groups according to median age, which was highly similar to mean age value. In addition,
the Chi-square analysis for N stage in MINT1 methylated tumours was replaced by
Fisher’s exact test because of the small number of methylated cases. For that purpose,
N3 and N4 stage groups were merged. Likewise, AJCC stage and specifically T stage
variables were clustered in two groups (lower and higher stages) to avoid small groups
to be analysed. Nonetheless, the analysis of some variables originated groups with less
than 5 elements, when analysing either the panel or the methylation of each marker.
Moreover, the clinicopathological factor tumour grade (G) was excluded from this initial
analysis, since almost all of the tumours were G2 (moderately differentiated), precluding
a correct statistical analysis for most of the studied groups.
Disease-specific survival time was measured from the date of diagnosis to the
date of death due to the progression of the disease, or the last clinical follow-up time for
surviving patients (censored). No patient from this cohort has died from other causes

50 FCUP Epigenetic Study of Colorectal Cancer: lncRNAs and CIMP Profiling.
apart from CRC. Disease-free survival time was measured from the date of surgery or
the last treatment performed (considering the patient was cured) to the date of
recurrence or the last clinical follow-up time (censored). In the case of multiple
recurrences, only the time elapsed by the first event was considered. Disease-specific
survival (DSS) and DFS were evaluated using log-rank statistic P-values for differences
in survival based on Kaplan-Meier’s approach (including graphical representations). Cox
proportional hazard regression model was used to calculate hazard ratios (HRs) of death
or recurrence according to clinical and molecular (KRAS, CIMP, methylation of markers)
features; and multivariable analysis was used to determine independent prognostic
factors. Due to the lack of enough representative cases, tumour grade was excluded
from the DFS analysis, and T3 and T4 tumours were joint in the same group. Likewise,
T1 and T2, as well as stage I and stage II or G1 and G2 tumours were combined in the
same group for all statistical tests. Moreover, throughout the descriptive text, P-values
mentioned correspond to Cox proportional hazard regression model.
Table 3 - List of primers’ sequences used and respective chromosomal location, size of the generated amplicon, temperature of annealing, GenBank Accession number and specific location in the accessed sequence.
Gene or locus
Chrom. location Sequence (5’–3’) Size,
bp T
Annealing, ºC
GenBank Accession
No. Location, bp
ACTB-F ACTB-R 7p22.1 TGGTGATGGAGGAGGTTTAGTAAGT
AACCAATAAAACCTACTCCTCCCTTAA 133 60 Y00474 390–522
CDKN2A-F CDKN2A-R 9p21 TTATTAGAGGGTGGGGCGGATCGC
GACCCCGAACCGCGACCGTAA 150 65 AF527803 19906–20056
MINT1-F MINT1-R 5q13-14 GGAGAGTAGGGGAGTTCGC
CTTCGCCTAACCTAACGC 119 62 AF135501 212-331
MINT2-F MINT2-R 2p22-21 TTTAGTATTTAAGTTCGTTGGC
ACGATTCCGTACGCCTTT 117 60 AF135502 431–548
MINT31-F MINT31-R 17q22 GTCGTCGGCGTTATTTTAGAAAGTT
CACCGACGCCCAACACA 72 60 AC021491 50059-50131
MLH1-F MLH1-R 3p21.3 GTAGTCGTTTTAGGGAGGGAC
TCAATACCTCGTACTCACGTTC 156 64 AY217549 1750-1906
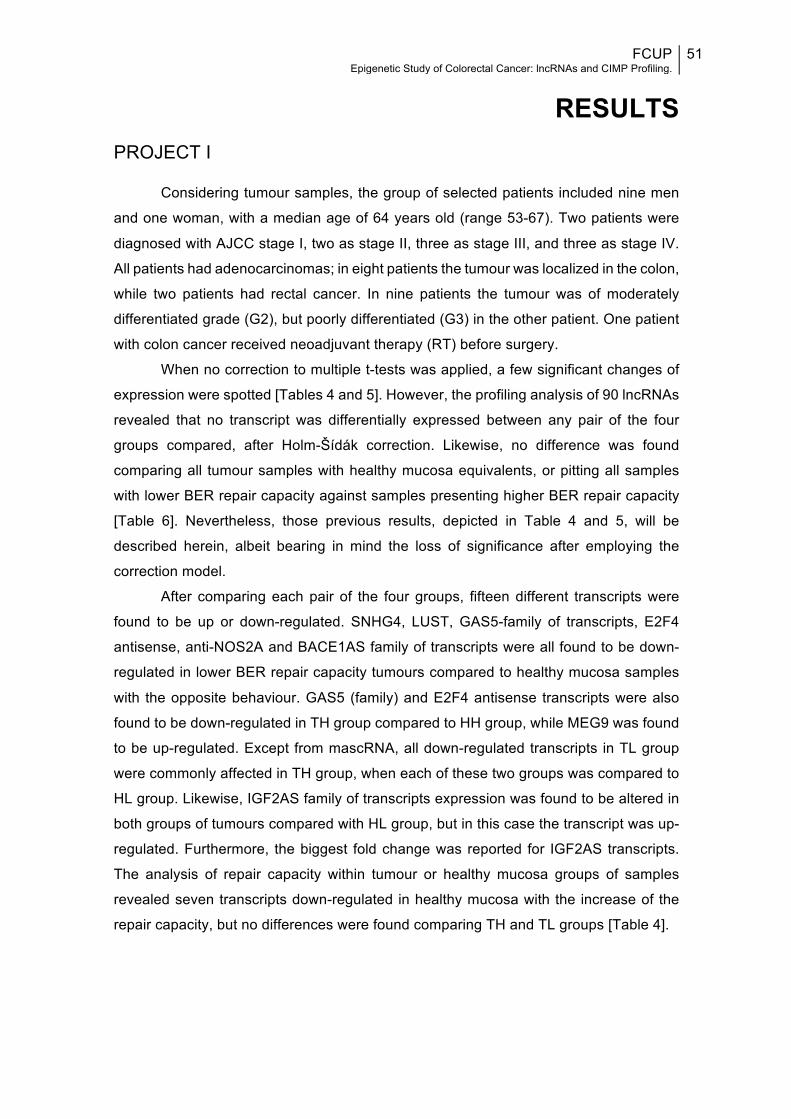
FCUP Epigenetic Study of Colorectal Cancer: lncRNAs and CIMP Profiling.
51
RESULTS
PROJECT I
Considering tumour samples, the group of selected patients included nine men
and one woman, with a median age of 64 years old (range 53-67). Two patients were
diagnosed with AJCC stage I, two as stage II, three as stage III, and three as stage IV.
All patients had adenocarcinomas; in eight patients the tumour was localized in the colon,
while two patients had rectal cancer. In nine patients the tumour was of moderately
differentiated grade (G2), but poorly differentiated (G3) in the other patient. One patient
with colon cancer received neoadjuvant therapy (RT) before surgery.
When no correction to multiple t-tests was applied, a few significant changes of
expression were spotted [Tables 4 and 5]. However, the profiling analysis of 90 lncRNAs
revealed that no transcript was differentially expressed between any pair of the four
groups compared, after Holm-Šídák correction. Likewise, no difference was found
comparing all tumour samples with healthy mucosa equivalents, or pitting all samples
with lower BER repair capacity against samples presenting higher BER repair capacity
[Table 6]. Nevertheless, those previous results, depicted in Table 4 and 5, will be
described herein, albeit bearing in mind the loss of significance after employing the
correction model.
After comparing each pair of the four groups, fifteen different transcripts were
found to be up or down-regulated. SNHG4, LUST, GAS5-family of transcripts, E2F4
antisense, anti-NOS2A and BACE1AS family of transcripts were all found to be down-
regulated in lower BER repair capacity tumours compared to healthy mucosa samples
with the opposite behaviour. GAS5 (family) and E2F4 antisense transcripts were also
found to be down-regulated in TH group compared to HH group, while MEG9 was found
to be up-regulated. Except from mascRNA, all down-regulated transcripts in TL group
were commonly affected in TH group, when each of these two groups was compared to
HL group. Likewise, IGF2AS family of transcripts expression was found to be altered in
both groups of tumours compared with HL group, but in this case the transcript was up-
regulated. Furthermore, the biggest fold change was reported for IGF2AS transcripts.
The analysis of repair capacity within tumour or healthy mucosa groups of samples
revealed seven transcripts down-regulated in healthy mucosa with the increase of the
repair capacity, but no differences were found comparing TH and TL groups [Table 4].
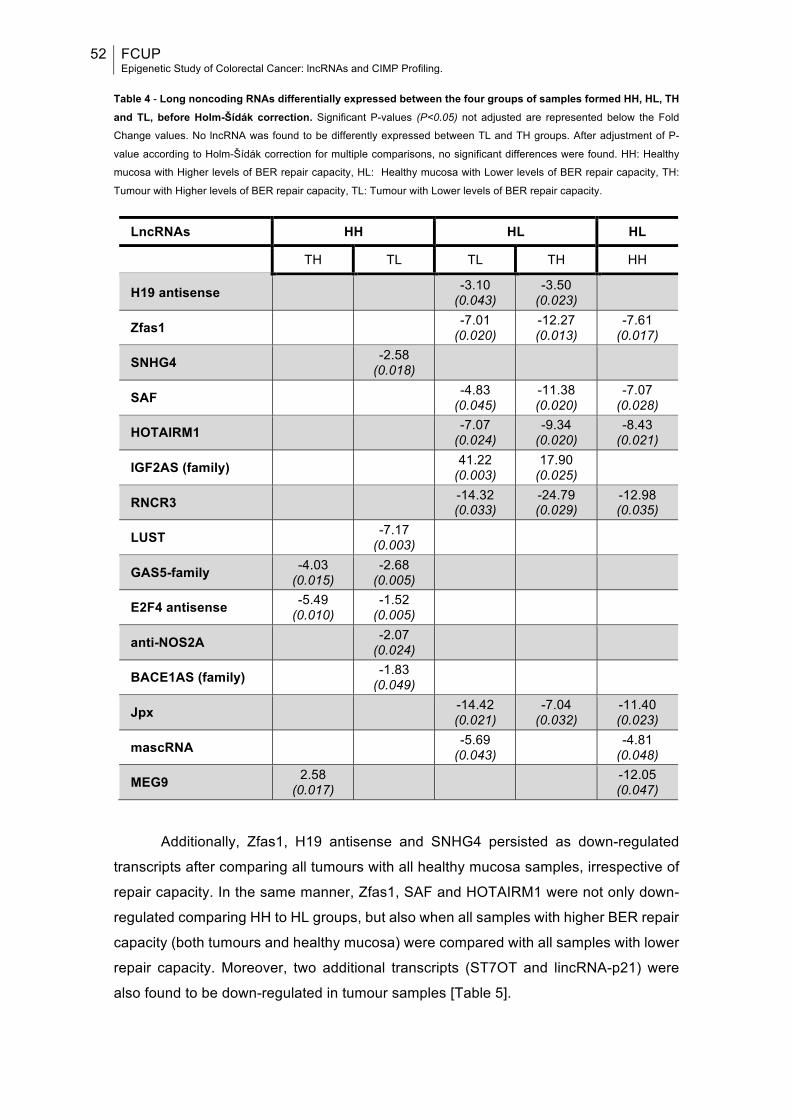
52 FCUP Epigenetic Study of Colorectal Cancer: lncRNAs and CIMP Profiling.
Table 4 - Long noncoding RNAs differentially expressed between the four groups of samples formed HH, HL, TH and TL, before Holm-Šídák correction. Significant P-values (P<0.05) not adjusted are represented below the Fold
Change values. No lncRNA was found to be differently expressed between TL and TH groups. After adjustment of P-
value according to Holm-Šídák correction for multiple comparisons, no significant differences were found. HH: Healthy
mucosa with Higher levels of BER repair capacity, HL: Healthy mucosa with Lower levels of BER repair capacity, TH:
Tumour with Higher levels of BER repair capacity, TL: Tumour with Lower levels of BER repair capacity.
LncRNAs HH HL HL
TH TL TL TH HH
H19 antisense -3.10 (0.043)
-3.50 (0.023)
Zfas1 -7.01 (0.020)
-12.27 (0.013)
-7.61 (0.017)
SNHG4 -2.58 (0.018)
SAF -4.83 (0.045)
-11.38 (0.020)
-7.07 (0.028)
HOTAIRM1 -7.07 (0.024)
-9.34 (0.020)
-8.43 (0.021)
IGF2AS (family) 41.22 (0.003)
17.90 (0.025)
RNCR3 -14.32 (0.033)
-24.79 (0.029)
-12.98 (0.035)
LUST -7.17 (0.003)
GAS5-family -4.03 (0.015)
-2.68 (0.005)
E2F4 antisense -5.49 (0.010)
-1.52 (0.005)
anti-NOS2A -2.07 (0.024)
BACE1AS (family) -1.83 (0.049)
Jpx -14.42 (0.021)
-7.04 (0.032)
-11.40 (0.023)
mascRNA -5.69 (0.043) -4.81
(0.048)
MEG9 2.58 (0.017) -12.05
(0.047)
Additionally, Zfas1, H19 antisense and SNHG4 persisted as down-regulated
transcripts after comparing all tumours with all healthy mucosa samples, irrespective of
repair capacity. In the same manner, Zfas1, SAF and HOTAIRM1 were not only down-
regulated comparing HH to HL groups, but also when all samples with higher BER repair
capacity (both tumours and healthy mucosa) were compared with all samples with lower
repair capacity. Moreover, two additional transcripts (ST7OT and lincRNA-p21) were
also found to be down-regulated in tumour samples [Table 5].
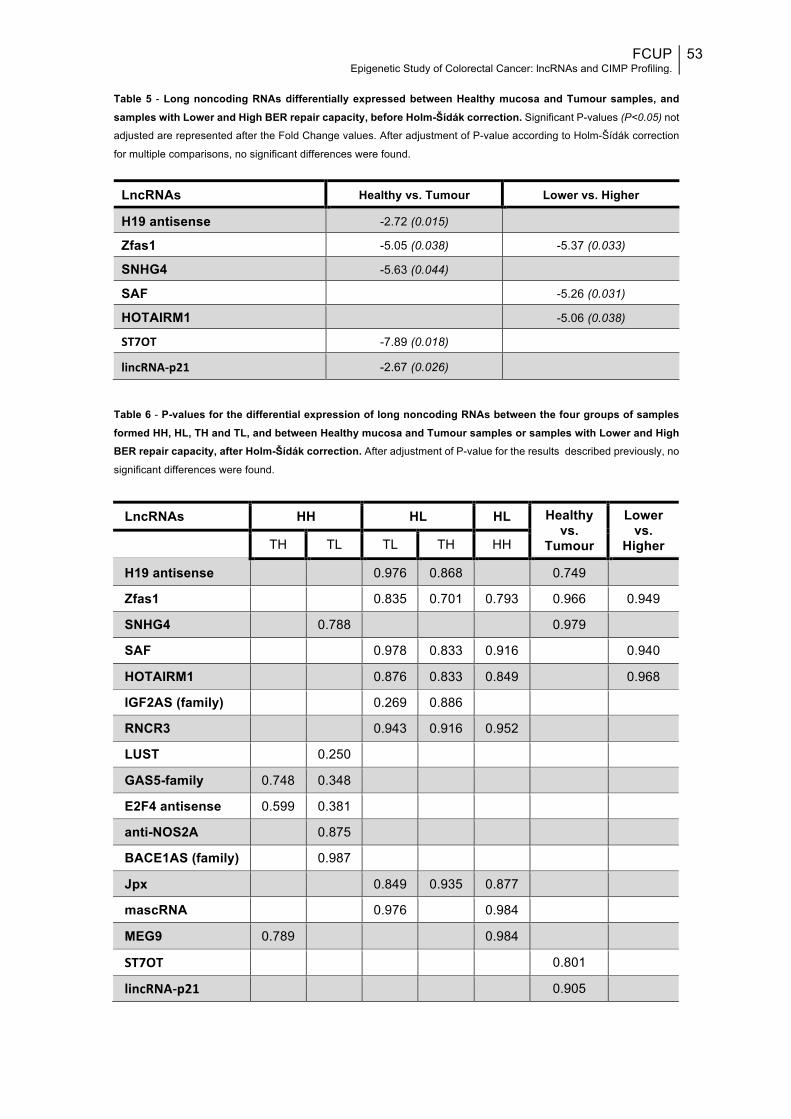
FCUP Epigenetic Study of Colorectal Cancer: lncRNAs and CIMP Profiling.
53
Table 5 - Long noncoding RNAs differentially expressed between Healthy mucosa and Tumour samples, and samples with Lower and High BER repair capacity, before Holm-Šídák correction. Significant P-values (P<0.05) not
adjusted are represented after the Fold Change values. After adjustment of P-value according to Holm-Šídák correction
for multiple comparisons, no significant differences were found.
LncRNAs Healthy vs. Tumour Lower vs. Higher
H19 antisense -2.72 (0.015)
Zfas1 -5.05 (0.038) -5.37 (0.033)
SNHG4 -5.63 (0.044)
SAF -5.26 (0.031)
HOTAIRM1 -5.06 (0.038)
ST7OT -7.89 (0.018)
lincRNA-p21 -2.67 (0.026)
Table 6 - P-values for the differential expression of long noncoding RNAs between the four groups of samples formed HH, HL, TH and TL, and between Healthy mucosa and Tumour samples or samples with Lower and High BER repair capacity, after Holm-Šídák correction. After adjustment of P-value for the results described previously, no
significant differences were found.
LncRNAs HH HL HL Healthy vs.
Tumour
Lower vs.
Higher TH TL TL TH HH
H19 antisense 0.976 0.868 0.749
Zfas1 0.835 0.701 0.793 0.966 0.949
SNHG4 0.788 0.979
SAF 0.978 0.833 0.916 0.940
HOTAIRM1 0.876 0.833 0.849 0.968
IGF2AS (family) 0.269 0.886
RNCR3 0.943 0.916 0.952
LUST 0.250
GAS5-family 0.748 0.348
E2F4 antisense 0.599 0.381
anti-NOS2A 0.875
BACE1AS (family) 0.987
Jpx 0.849 0.935 0.877
mascRNA 0.976 0.984
MEG9 0.789 0.984
ST7OT 0.801
lincRNA-p21 0.905
54 FCUP Epigenetic Study of Colorectal Cancer: lncRNAs and CIMP Profiling.
PROJECT II
Patients’ characteristics and CpG island methylation at specific loci Of the 211 CRC cases, 34.1% (n=72) were females and 65.9% (n=139) were
males, with a median age at diagnosis of 61 years (61.5 years for women and 60.0 years
for men). Almost half of all cases (49.3%) were identified in the rectum (n=104), while
34.1% were found in the distal colon (n=72) and 16.6% in the proximal colon (n=35).
Moreover, 39.3% of all tumours were KRAS mutated (n=83). Regarding stage, one CRC
case was T1, 21 cases were T2, 170 were T3 stage and 16 were T4 staged. Therefore,
88.2% of all cases were in a locally advanced stage (T3&T4). Most of the cases displayed
lymph node metastasis, 30.4% at a N1 stage (n=64) and 31.3% at a N2 stage (n=66);
and 50.7% (n=107) displayed distant metastasis at the time of diagnosis. Accordingly,
most patients were also diagnosed with advanced AJCC stages of the disease. In fact,
more than half of all patients (n=107) were diagnosed with stage IV, 24.6% with stage III
and the remaining 23.7% with stages I or II. In addition, a fraction of all patients (32.7%)
was submitted to neoadjuvant therapy, whereas the majority of the studied patients
received adjuvant therapy at some point during the follow-up (80.1%). The main
clinicopathological and molecular variables of the 211 selected CRC cases are depicted
in Table 7.
CIMP status was evaluated by the quantitative method SYBR® Green-based
qMSP of a five genes/loci panel previously reported. MINT31 showed the highest
methylation frequency, whereas MLH1 displayed the lowest, with 15.2% and 0.9%,
respectively. Methylation frequencies of the remaining genes were 6.6% for MINT1,
14.7% for MINT2 and 11.4% for CDKN2A(p16). Significant positive associations were
found among MINT1, MINT2, MINT31, and CDKN2A(p16) methylation levels, suggestive
of a hypermethylator phenotype (CIMP) in a subset of cases [Fig.5]. Since MLH1 was
found to be methylated only in two cases, no statistical analysis was performed. When
methylation of all genes/loci was grouped based on methylation of 0 or 1 marker versus
>1 marker for the CIMP phenotype, 18 patients were defined as CIMP positive (8.5%)
and 193 patients were defined as CIMP negative (91.5%). In a trichotomous
categorization model, 136 patients were classified as CIMP-0, 72 patients as CIMP-L
and three patients as CIMP-H (two patients with 4 methylated markers and one patient
with all 5 markers methylated). Regarding CIMP-L patients, 57 only presented one
methylated gene, while 12 were methylated in 2, and 3 patients displayed methylation in
3 genes [Fig.5].
Two of all patients had no information regarding tumour invasion depth (T), lymph
node metastasis (N) and distant metastasis (M). Therefore, those patients had no AJCC

FCUP Epigenetic Study of Colorectal Cancer: lncRNAs and CIMP Profiling.
55
stage information. Additionally, four other patients had no N stage information, and for
14 of all patients KRAS mutation status was not determined. In 211 patients with
clinicopathological and molecular characteristics available for analyses, no statistically
significant differences were found between CIMP+ and CIMP– tumours. However, CIMP-
L cases were more likely to present ≥4 regional lymph nodes metastasis (P=0.018), and
strongly associated with mutated KRAS (P<0.001) [Fig.6][Table 7]. Similarly to CIMP+/–
status, individual methylation status of MINT2 and CDKN2A(p16) did not associate with
any of the studied variables. However, MINT31 methylation associated with mutated
KRAS (P=0.004) [Fig.6], while MINT1 methylation associated with the absence of
regional lymph nodes metastasis (P=0.017) [Table 8] [Appendix I].
Due to the small number of CIMP-H cases, this category was excluded from the
statistical analysis. However, worth of mention, two of the CIMP-H tumours were
biopsied from female patients and were IIA (T3N0M0) staged, while the male patient was
diagnosed with a IVA (T3N0M1a) stage tumour. All three patients were older than 61.
Moreover, none of the three tumours were located in the rectum – two tumours were
found in the distal colon and one in the proximal colon –, and only one tumour presented
mutated KRAS (data not shown).
The same statistical analysis performed excluding all patients receiving
neoadjuvant therapy revealed no major differences. Indeed, CIMP-L continued to be
significantly associated with mutated KRAS (P=0.009) and N2 stage (P=0.002).
Likewise, MINT31 methylated cases presented a strong tendency towards KRAS
mutated (P=0.054). However, neither MINT1 nor MINT2 methylation displayed a
significant association with N1&2 stage after Fisher’s exact test was performed,
considering only those 141 patients who did not receive any neoadjuvant treatment
[Appendix II and III]. Of mention, no information concerning neoadjuvant therapy was
available for one of the 211 patients.
The analysis of KRAS mutations revealed that almost all of these were located in
the second exon of the gene – one was located in exon 3 and another sample presented
a mutation in exon 4 of the KRAS gene. Furthermore, one mutated KRAS sample had
no further information regarding the specific exon altered. Considering only mutations in
the second exon of the gene, nine different single mutations affecting mostly Glycine 12
or Glycine 13 were found. However, none of the described substitutions of Glycine by
another residue were correlated with any of the two CIMP categorizations or methylation
of any marker, particularly CIMP-L and methylation of MINT31 (data not shown).
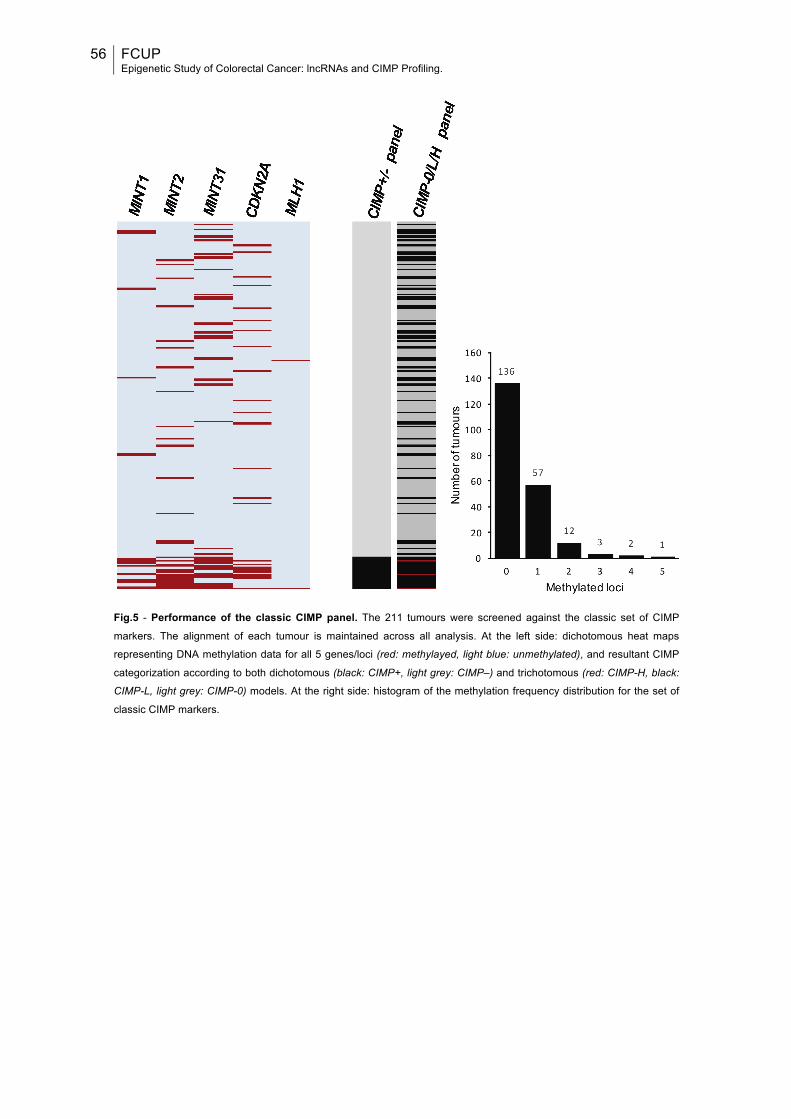
56 FCUP Epigenetic Study of Colorectal Cancer: lncRNAs and CIMP Profiling.
Fig.5 - Performance of the classic CIMP panel. The 211 tumours were screened against the classic set of CIMP
markers. The alignment of each tumour is maintained across all analysis. At the left side: dichotomous heat maps
representing DNA methylation data for all 5 genes/loci (red: methylayed, light blue: unmethylated), and resultant CIMP
categorization according to both dichotomous (black: CIMP+, light grey: CIMP–) and trichotomous (red: CIMP-H, black:
CIMP-L, light grey: CIMP-0) models. At the right side: histogram of the methylation frequency distribution for the set of
classic CIMP markers.
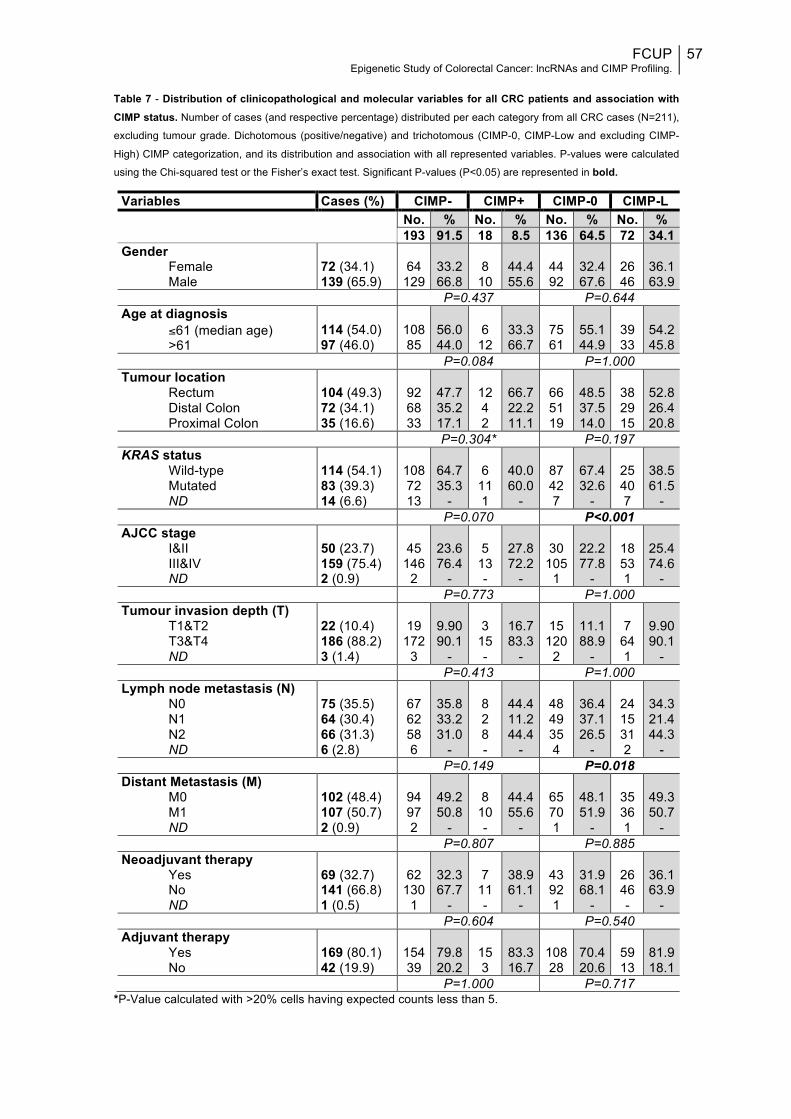
FCUP Epigenetic Study of Colorectal Cancer: lncRNAs and CIMP Profiling.
57
Table 7 - Distribution of clinicopathological and molecular variables for all CRC patients and association with CIMP status. Number of cases (and respective percentage) distributed per each category from all CRC cases (N=211),
excluding tumour grade. Dichotomous (positive/negative) and trichotomous (CIMP-0, CIMP-Low and excluding CIMP-
High) CIMP categorization, and its distribution and association with all represented variables. P-values were calculated
using the Chi-squared test or the Fisher’s exact test. Significant P-values (P<0.05) are represented in bold.
*P-Value calculated with >20% cells having expected counts less than 5.
Variables Cases (%) CIMP- CIMP+ CIMP-0 CIMP-L No. % No. % No. % No. % 193 91.5 18 8.5 136 64.5 72 34.1 Gender
Female Male
72 (34.1) 139 (65.9)
64
129
33.2 66.8
8
10
44.4 55.6
44 92
32.4 67.6
26 46
36.1 63.9
P=0.437 P=0.644 Age at diagnosis
≤61 (median age) >61
114 (54.0) 97 (46.0)
108 85
56.0 44.0
6
12
33.3 66.7
75 61
55.1 44.9
39 33
54.2 45.8
P=0.084 P=1.000 Tumour location
Rectum Distal Colon Proximal Colon
104 (49.3) 72 (34.1) 35 (16.6)
92 68 33
47.7 35.2 17.1
12 4 2
66.7 22.2 11.1
66 51 19
48.5 37.5 14.0
38 29 15
52.8 26.4 20.8
P=0.304* P=0.197 KRAS status
Wild-type Mutated ND
114 (54.1) 83 (39.3) 14 (6.6)
108 72 13
64.7 35.3
-
6
11 1
40.0 60.0
-
87 42 7
67.4 32.6
-
25 40 7
38.5 61.5
- P=0.070 P<0.001 AJCC stage
I&II III&IV ND
50 (23.7) 159 (75.4) 2 (0.9)
45
146 2
23.6 76.4
-
5
13 -
27.8 72.2
-
30
105 1
22.2 77.8
-
18 53 1
25.4 74.6
- P=0.773 P=1.000 Tumour invasion depth (T)
T1&T2 T3&T4 ND
22 (10.4) 186 (88.2) 3 (1.4)
19
172 3
9.90 90.1
-
3
15 -
16.7 83.3
-
15
120 2
11.1 88.9
-
7
64 1
9.90 90.1
- P=0.413 P=1.000 Lymph node metastasis (N)
N0 N1 N2 ND
75 (35.5) 64 (30.4) 66 (31.3) 6 (2.8)
67 62 58 6
35.8 33.2 31.0
-
8 2 8 -
44.4 11.2 44.4
-
48 49 35 4
36.4 37.1 26.5
-
24 15 31 2
34.3 21.4 44.3
- P=0.149 P=0.018 Distant Metastasis (M)
M0 M1 ND
102 (48.4) 107 (50.7) 2 (0.9)
94 97 2
49.2 50.8
-
8
10 -
44.4 55.6
-
65 70 1
48.1 51.9
-
35 36 1
49.3 50.7
- P=0.807 P=0.885 Neoadjuvant therapy
Yes No ND
69 (32.7) 141 (66.8) 1 (0.5)
62
130 1
32.3 67.7
-
7
11 -
38.9 61.1
-
43 92 1
31.9 68.1
-
26 46 -
36.1 63.9
- P=0.604 P=0.540 Adjuvant therapy
Yes No
169 (80.1) 42 (19.9)
154 39
79.8 20.2
15 3
83.3 16.7
108 28
70.4 20.6
59 13
81.9 18.1
P=1.000 P=0.717
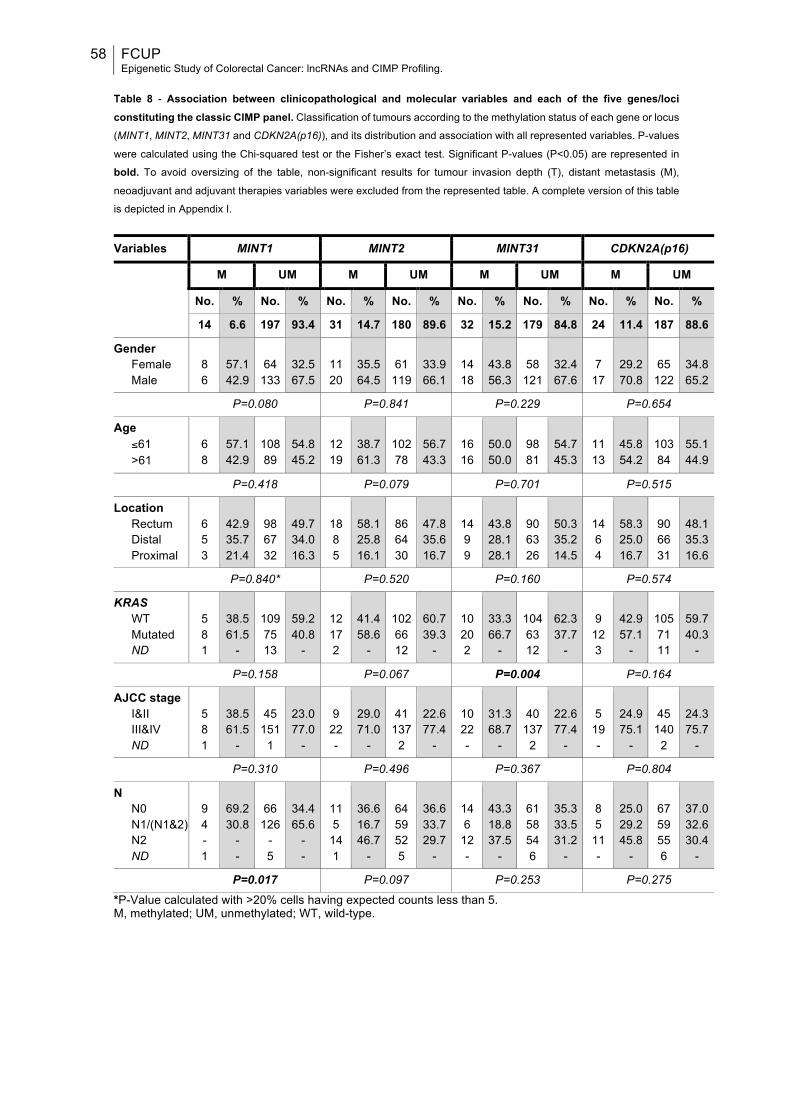
58 FCUP Epigenetic Study of Colorectal Cancer: lncRNAs and CIMP Profiling.
Table 8 - Association between clinicopathological and molecular variables and each of the five genes/loci constituting the classic CIMP panel. Classification of tumours according to the methylation status of each gene or locus
(MINT1, MINT2, MINT31 and CDKN2A(p16)), and its distribution and association with all represented variables. P-values
were calculated using the Chi-squared test or the Fisher’s exact test. Significant P-values (P<0.05) are represented in
bold. To avoid oversizing of the table, non-significant results for tumour invasion depth (T), distant metastasis (M),
neoadjuvant and adjuvant therapies variables were excluded from the represented table. A complete version of this table
is depicted in Appendix I.
Variables MINT1 MINT2 MINT31 CDKN2A(p16)
M UM M UM M UM M UM
No. % No. % No. % No. % No. % No. % No. % No. %
14 6.6 197 93.4 31 14.7 180 89.6 32 15.2 179 84.8 24 11.4 187 88.6
Gender Female Male
8 6
57.1 42.9
64
133
32.5 67.5
11 20
35.5 64.5
61
119
33.9 66.1
14 18
43.8 56.3
58
121
32.4 67.6
7
17
29.2 70.8
65
122
34.8 65.2
P=0.080 P=0.841 P=0.229 P=0.654
Age ≤61 >61
6 8
57.1 42.9
108 89
54.8 45.2
12 19
38.7 61.3
102 78
56.7 43.3
16 16
50.0 50.0
98 81
54.7 45.3
11 13
45.8 54.2
103 84
55.1 44.9
P=0.418 P=0.079 P=0.701 P=0.515
Location Rectum Distal Proximal
6 5 3
42.9 35.7 21.4
98 67 32
49.7 34.0 16.3
18 8 5
58.1 25.8 16.1
86 64 30
47.8 35.6 16.7
14 9 9
43.8 28.1 28.1
90 63 26
50.3 35.2 14.5
14 6 4
58.3 25.0 16.7
90 66 31
48.1 35.3 16.6
P=0.840* P=0.520 P=0.160 P=0.574
KRAS WT Mutated ND
5 8 1
38.5 61.5
-
109 75 13
59.2 40.8
-
12 17 2
41.4 58.6
-
102 66 12
60.7 39.3
-
10 20 2
33.3 66.7
-
104 63 12
62.3 37.7
-
9
12 3
42.9 57.1
-
105 71 11
59.7 40.3
-
P=0.158 P=0.067 P=0.004 P=0.164
AJCC stage I&II III&IV ND
5 8 1
38.5 61.5
-
45
151 1
23.0 77.0
-
9
22 -
29.0 71.0
-
41
137 2
22.6 77.4
-
10 22 -
31.3 68.7
-
40
137 2
22.6 77.4
-
5
19 -
24.9 75.1
-
45
140 2
24.3 75.7
-
P=0.310 P=0.496 P=0.367 P=0.804
N N0 N1/(N1&2) N2 ND
9 4 - 1
69.2 30.8
- -
66
126 - 5
34.4 65.6
- -
11 5
14 1
36.6 16.7 46.7
-
64 59 52 5
36.6 33.7 29.7
-
14 6
12 -
43.3 18.8 37.5
-
61 58 54 6
35.3 33.5 31.2
-
8 5
11 -
25.0 29.2 45.8
-
67 59 55 6
37.0 32.6 30.4
-
P=0.017 P=0.097 P=0.253 P=0.275
*P-Value calculated with >20% cells having expected counts less than 5. M, methylated; UM, unmethylated; WT, wild-type.
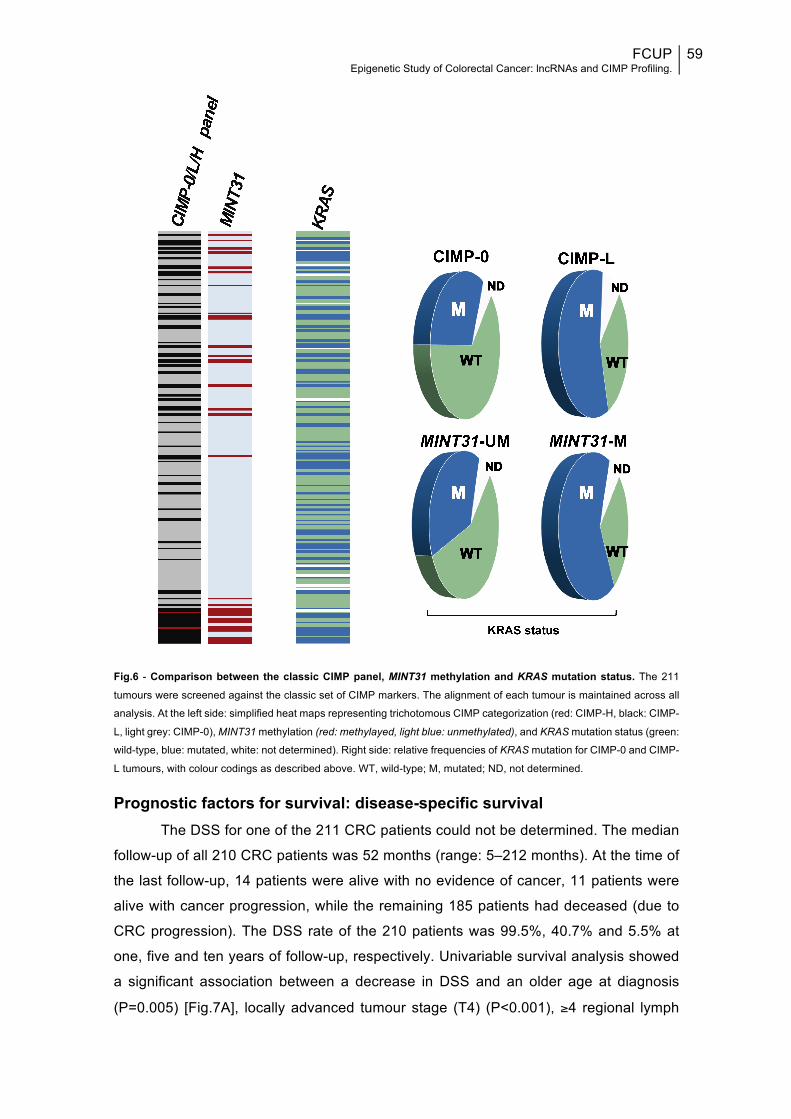
FCUP Epigenetic Study of Colorectal Cancer: lncRNAs and CIMP Profiling.
59
Fig.6 - Comparison between the classic CIMP panel, MINT31 methylation and KRAS mutation status. The 211
tumours were screened against the classic set of CIMP markers. The alignment of each tumour is maintained across all
analysis. At the left side: simplified heat maps representing trichotomous CIMP categorization (red: CIMP-H, black: CIMP-
L, light grey: CIMP-0), MINT31 methylation (red: methylayed, light blue: unmethylated), and KRAS mutation status (green:
wild-type, blue: mutated, white: not determined). Right side: relative frequencies of KRAS mutation for CIMP-0 and CIMP-
L tumours, with colour codings as described above. WT, wild-type; M, mutated; ND, not determined.
Prognostic factors for survival: disease-specific survival The DSS for one of the 211 CRC patients could not be determined. The median
follow-up of all 210 CRC patients was 52 months (range: 5–212 months). At the time of
the last follow-up, 14 patients were alive with no evidence of cancer, 11 patients were
alive with cancer progression, while the remaining 185 patients had deceased (due to
CRC progression). The DSS rate of the 210 patients was 99.5%, 40.7% and 5.5% at
one, five and ten years of follow-up, respectively. Univariable survival analysis showed
a significant association between a decrease in DSS and an older age at diagnosis
(P=0.005) [Fig.7A], locally advanced tumour stage (T4) (P<0.001), ≥4 regional lymph
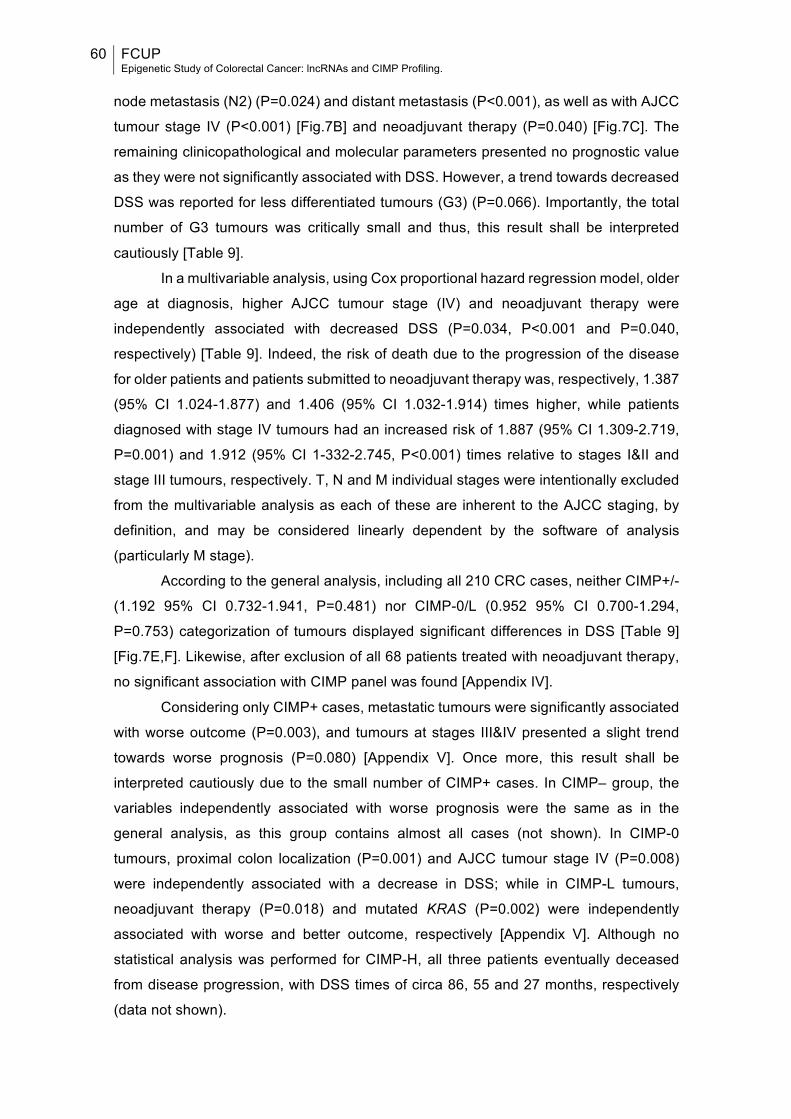
60 FCUP Epigenetic Study of Colorectal Cancer: lncRNAs and CIMP Profiling.
node metastasis (N2) (P=0.024) and distant metastasis (P<0.001), as well as with AJCC
tumour stage IV (P<0.001) [Fig.7B] and neoadjuvant therapy (P=0.040) [Fig.7C]. The
remaining clinicopathological and molecular parameters presented no prognostic value
as they were not significantly associated with DSS. However, a trend towards decreased
DSS was reported for less differentiated tumours (G3) (P=0.066). Importantly, the total
number of G3 tumours was critically small and thus, this result shall be interpreted
cautiously [Table 9].
In a multivariable analysis, using Cox proportional hazard regression model, older
age at diagnosis, higher AJCC tumour stage (IV) and neoadjuvant therapy were
independently associated with decreased DSS (P=0.034, P<0.001 and P=0.040,
respectively) [Table 9]. Indeed, the risk of death due to the progression of the disease
for older patients and patients submitted to neoadjuvant therapy was, respectively, 1.387
(95% CI 1.024-1.877) and 1.406 (95% CI 1.032-1.914) times higher, while patients
diagnosed with stage IV tumours had an increased risk of 1.887 (95% CI 1.309-2.719,
P=0.001) and 1.912 (95% CI 1-332-2.745, P<0.001) times relative to stages I&II and
stage III tumours, respectively. T, N and M individual stages were intentionally excluded
from the multivariable analysis as each of these are inherent to the AJCC staging, by
definition, and may be considered linearly dependent by the software of analysis
(particularly M stage).
According to the general analysis, including all 210 CRC cases, neither CIMP+/-
(1.192 95% CI 0.732-1.941, P=0.481) nor CIMP-0/L (0.952 95% CI 0.700-1.294,
P=0.753) categorization of tumours displayed significant differences in DSS [Table 9]
[Fig.7E,F]. Likewise, after exclusion of all 68 patients treated with neoadjuvant therapy,
no significant association with CIMP panel was found [Appendix IV].
Considering only CIMP+ cases, metastatic tumours were significantly associated
with worse outcome (P=0.003), and tumours at stages III&IV presented a slight trend
towards worse prognosis (P=0.080) [Appendix V]. Once more, this result shall be
interpreted cautiously due to the small number of CIMP+ cases. In CIMP– group, the
variables independently associated with worse prognosis were the same as in the
general analysis, as this group contains almost all cases (not shown). In CIMP-0
tumours, proximal colon localization (P=0.001) and AJCC tumour stage IV (P=0.008)
were independently associated with a decrease in DSS; while in CIMP-L tumours,
neoadjuvant therapy (P=0.018) and mutated KRAS (P=0.002) were independently
associated with worse and better outcome, respectively [Appendix V]. Although no
statistical analysis was performed for CIMP-H, all three patients eventually deceased
from disease progression, with DSS times of circa 86, 55 and 27 months, respectively
(data not shown).
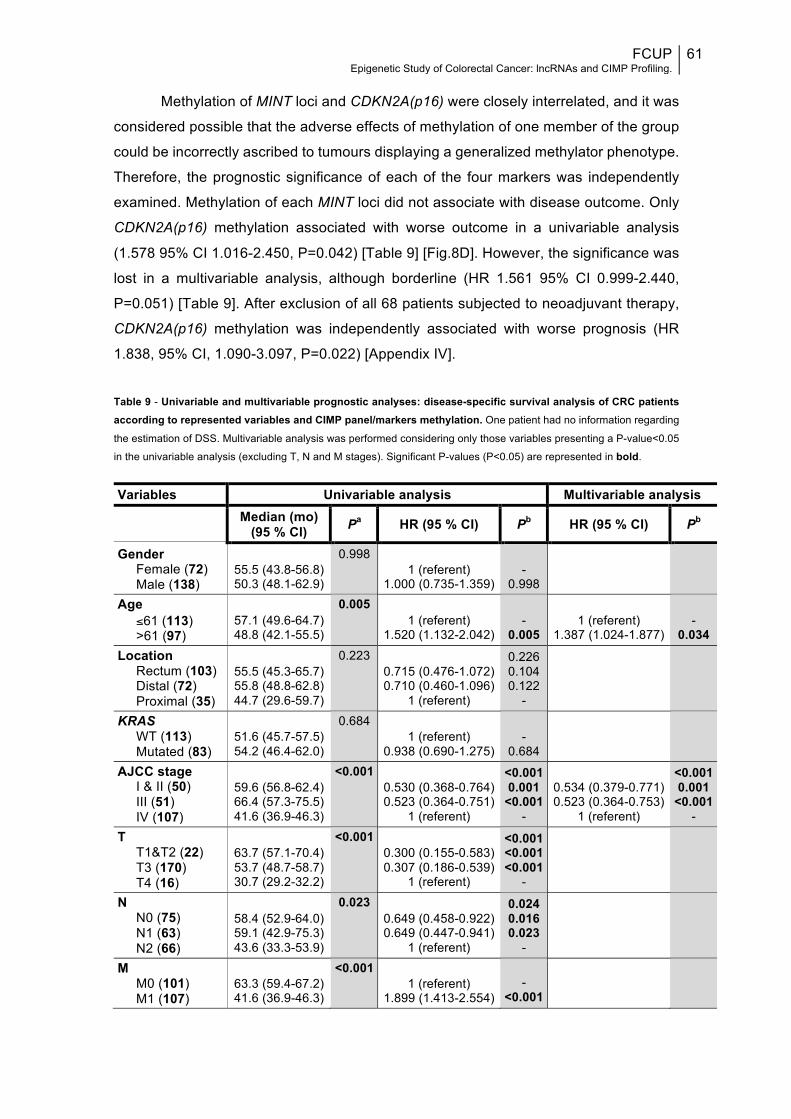
FCUP Epigenetic Study of Colorectal Cancer: lncRNAs and CIMP Profiling.
61
Methylation of MINT loci and CDKN2A(p16) were closely interrelated, and it was
considered possible that the adverse effects of methylation of one member of the group
could be incorrectly ascribed to tumours displaying a generalized methylator phenotype.
Therefore, the prognostic significance of each of the four markers was independently
examined. Methylation of each MINT loci did not associate with disease outcome. Only
CDKN2A(p16) methylation associated with worse outcome in a univariable analysis
(1.578 95% CI 1.016-2.450, P=0.042) [Table 9] [Fig.8D]. However, the significance was
lost in a multivariable analysis, although borderline (HR 1.561 95% CI 0.999-2.440,
P=0.051) [Table 9]. After exclusion of all 68 patients subjected to neoadjuvant therapy,
CDKN2A(p16) methylation was independently associated with worse prognosis (HR
1.838, 95% CI, 1.090-3.097, P=0.022) [Appendix IV].
Table 9 - Univariable and multivariable prognostic analyses: disease-specific survival analysis of CRC patients according to represented variables and CIMP panel/markers methylation. One patient had no information regarding
the estimation of DSS. Multivariable analysis was performed considering only those variables presenting a P-value<0.05
in the univariable analysis (excluding T, N and M stages). Significant P-values (P<0.05) are represented in bold.
Variables Univariable analysis Multivariable analysis
Median (mo) (95 % CI) Pa HR (95 % CI) Pb HR (95 % CI) Pb
Gender Female (72) Male (138)
55.5 (43.8-56.8) 50.3 (48.1-62.9)
0.998 1 (referent)
1.000 (0.735-1.359)
-
0.998
Age ≤61 (113) >61 (97)
57.1 (49.6-64.7) 48.8 (42.1-55.5)
0.005 1 (referent)
1.520 (1.132-2.042)
-
0.005
1 (referent)
1.387 (1.024-1.877)
-
0.034 Location
Rectum (103) Distal (72) Proximal (35)
55.5 (45.3-65.7) 55.8 (48.8-62.8) 44.7 (29.6-59.7)
0.223 0.715 (0.476-1.072) 0.710 (0.460-1.096)
1 (referent)
0.226 0.104 0.122
-
KRAS WT (113) Mutated (83)
51.6 (45.7-57.5) 54.2 (46.4-62.0)
0.684 1 (referent)
0.938 (0.690-1.275)
-
0.684
AJCC stage I & II (50) III (51) IV (107)
59.6 (56.8-62.4) 66.4 (57.3-75.5) 41.6 (36.9-46.3)
<0.001 0.530 (0.368-0.764) 0.523 (0.364-0.751)
1 (referent)
<0.001 0.001
<0.001 -
0.534 (0.379-0.771) 0.523 (0.364-0.753)
1 (referent)
<0.001 0.001
<0.001 -
T T1&T2 (22) T3 (170) T4 (16)
63.7 (57.1-70.4) 53.7 (48.7-58.7) 30.7 (29.2-32.2)
<0.001 0.300 (0.155-0.583) 0.307 (0.186-0.539)
1 (referent)
<0.001 <0.001 <0.001
-
N N0 (75) N1 (63) N2 (66)
58.4 (52.9-64.0) 59.1 (42.9-75.3) 43.6 (33.3-53.9)
0.023 0.649 (0.458-0.922) 0.649 (0.447-0.941)
1 (referent)
0.024 0.016 0.023
-
M M0 (101) M1 (107)
63.3 (59.4-67.2) 41.6 (36.9-46.3)
<0.001 1 (referent)
1.899 (1.413-2.554)
-
<0.001
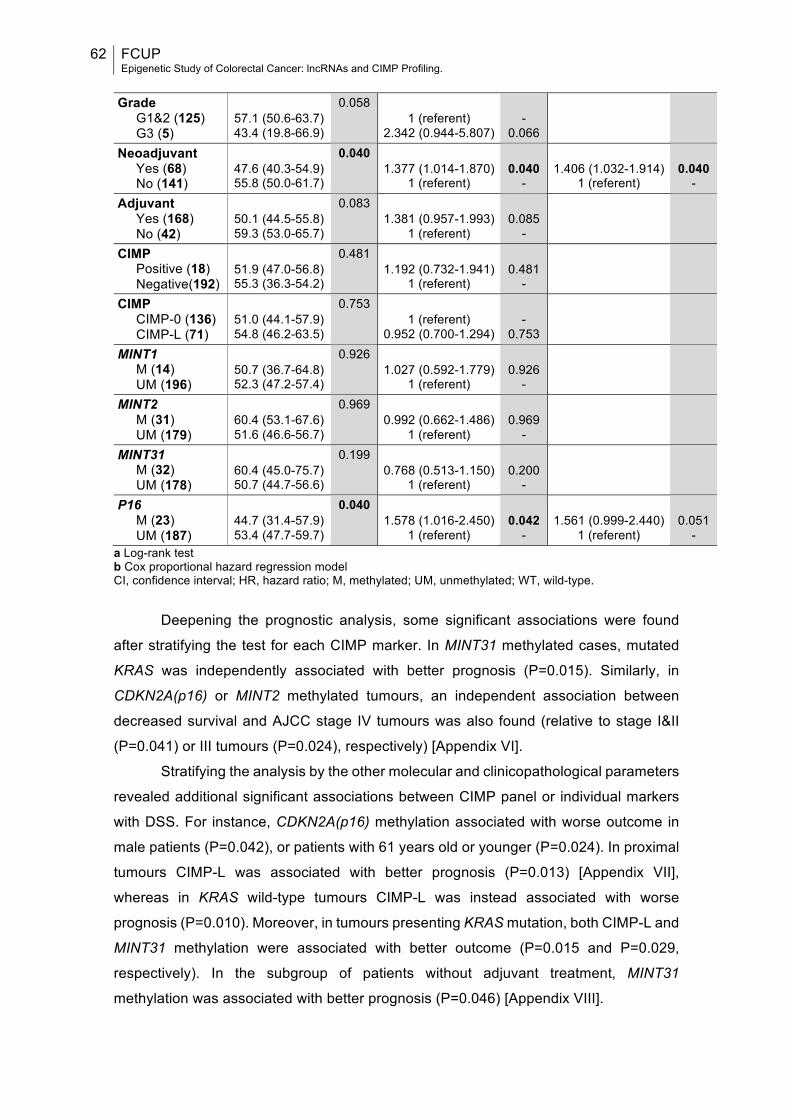
62 FCUP Epigenetic Study of Colorectal Cancer: lncRNAs and CIMP Profiling.
Grade
G1&2 (125) G3 (5)
57.1 (50.6-63.7) 43.4 (19.8-66.9)
0.058 1 (referent)
2.342 (0.944-5.807)
-
0.066
Neoadjuvant Yes (68) No (141)
47.6 (40.3-54.9) 55.8 (50.0-61.7)
0.040 1.377 (1.014-1.870)
1 (referent)
0.040
-
1.406 (1.032-1.914)
1 (referent)
0.040
- Adjuvant
Yes (168) No (42)
50.1 (44.5-55.8) 59.3 (53.0-65.7)
0.083 1.381 (0.957-1.993)
1 (referent)
0.085
-
CIMP Positive (18) Negative(192)
51.9 (47.0-56.8) 55.3 (36.3-54.2)
0.481 1.192 (0.732-1.941)
1 (referent)
0.481
-
CIMP CIMP-0 (136) CIMP-L (71)
51.0 (44.1-57.9) 54.8 (46.2-63.5)
0.753 1 (referent)
0.952 (0.700-1.294)
-
0.753
MINT1 M (14) UM (196)
50.7 (36.7-64.8) 52.3 (47.2-57.4)
0.926 1.027 (0.592-1.779)
1 (referent)
0.926
-
MINT2 M (31) UM (179)
60.4 (53.1-67.6) 51.6 (46.6-56.7)
0.969 0.992 (0.662-1.486)
1 (referent)
0.969
-
MINT31 M (32) UM (178)
60.4 (45.0-75.7) 50.7 (44.7-56.6)
0.199 0.768 (0.513-1.150)
1 (referent)
0.200
-
P16 M (23) UM (187)
44.7 (31.4-57.9) 53.4 (47.7-59.7)
0.040 1.578 (1.016-2.450)
1 (referent)
0.042
-
1.561 (0.999-2.440)
1 (referent)
0.051
- a Log-rank test b Cox proportional hazard regression model CI, confidence interval; HR, hazard ratio; M, methylated; UM, unmethylated; WT, wild-type.
Deepening the prognostic analysis, some significant associations were found
after stratifying the test for each CIMP marker. In MINT31 methylated cases, mutated
KRAS was independently associated with better prognosis (P=0.015). Similarly, in
CDKN2A(p16) or MINT2 methylated tumours, an independent association between
decreased survival and AJCC stage IV tumours was also found (relative to stage I&II
(P=0.041) or III tumours (P=0.024), respectively) [Appendix VI].
Stratifying the analysis by the other molecular and clinicopathological parameters
revealed additional significant associations between CIMP panel or individual markers
with DSS. For instance, CDKN2A(p16) methylation associated with worse outcome in
male patients (P=0.042), or patients with 61 years old or younger (P=0.024). In proximal
tumours CIMP-L was associated with better prognosis (P=0.013) [Appendix VII],
whereas in KRAS wild-type tumours CIMP-L was instead associated with worse
prognosis (P=0.010). Moreover, in tumours presenting KRAS mutation, both CIMP-L and
MINT31 methylation were associated with better outcome (P=0.015 and P=0.029,
respectively). In the subgroup of patients without adjuvant treatment, MINT31
methylation was associated with better prognosis (P=0.046) [Appendix VIII].
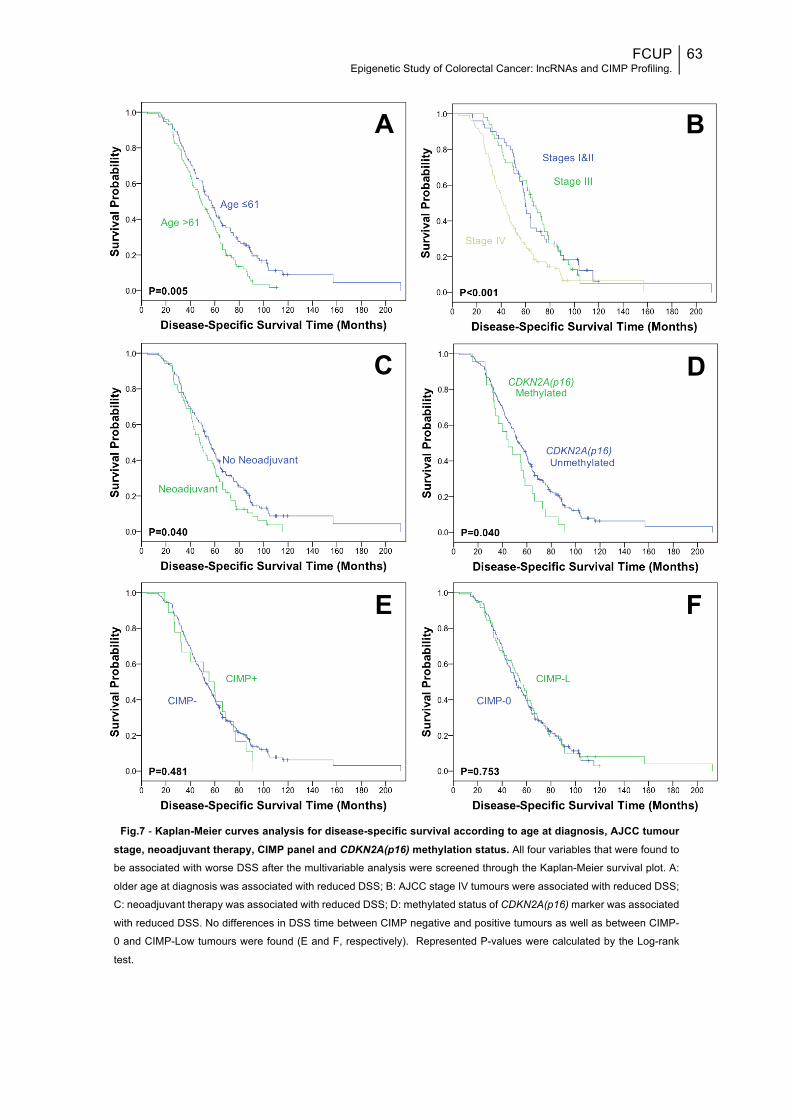
FCUP Epigenetic Study of Colorectal Cancer: lncRNAs and CIMP Profiling.
63
Fig.7 - Kaplan-Meier curves analysis for disease-specific survival according to age at diagnosis, AJCC tumour stage, neoadjuvant therapy, CIMP panel and CDKN2A(p16) methylation status. All four variables that were found to
be associated with worse DSS after the multivariable analysis were screened through the Kaplan-Meier survival plot. A:
older age at diagnosis was associated with reduced DSS; B: AJCC stage IV tumours were associated with reduced DSS;
C: neoadjuvant therapy was associated with reduced DSS; D: methylated status of CDKN2A(p16) marker was associated
with reduced DSS. No differences in DSS time between CIMP negative and positive tumours as well as between CIMP-
0 and CIMP-Low tumours were found (E and F, respectively). Represented P-values were calculated by the Log-rank
test.
A
C
B
D
E F
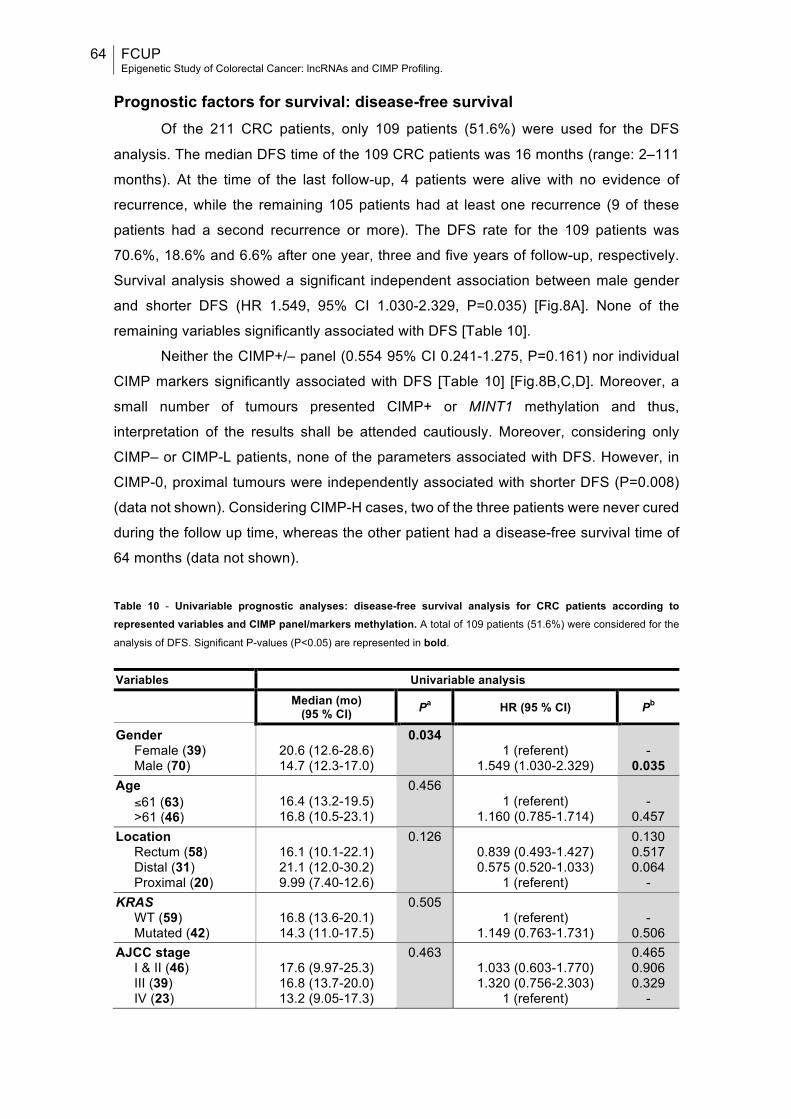
64 FCUP Epigenetic Study of Colorectal Cancer: lncRNAs and CIMP Profiling.
Prognostic factors for survival: disease-free survival
Of the 211 CRC patients, only 109 patients (51.6%) were used for the DFS
analysis. The median DFS time of the 109 CRC patients was 16 months (range: 2–111
months). At the time of the last follow-up, 4 patients were alive with no evidence of
recurrence, while the remaining 105 patients had at least one recurrence (9 of these
patients had a second recurrence or more). The DFS rate for the 109 patients was
70.6%, 18.6% and 6.6% after one year, three and five years of follow-up, respectively.
Survival analysis showed a significant independent association between male gender
and shorter DFS (HR 1.549, 95% CI 1.030-2.329, P=0.035) [Fig.8A]. None of the
remaining variables significantly associated with DFS [Table 10].
Neither the CIMP+/– panel (0.554 95% CI 0.241-1.275, P=0.161) nor individual
CIMP markers significantly associated with DFS [Table 10] [Fig.8B,C,D]. Moreover, a
small number of tumours presented CIMP+ or MINT1 methylation and thus,
interpretation of the results shall be attended cautiously. Moreover, considering only
CIMP– or CIMP-L patients, none of the parameters associated with DFS. However, in
CIMP-0, proximal tumours were independently associated with shorter DFS (P=0.008)
(data not shown). Considering CIMP-H cases, two of the three patients were never cured
during the follow up time, whereas the other patient had a disease-free survival time of
64 months (data not shown).
Table 10 - Univariable prognostic analyses: disease-free survival analysis for CRC patients according to represented variables and CIMP panel/markers methylation. A total of 109 patients (51.6%) were considered for the
analysis of DFS. Significant P-values (P<0.05) are represented in bold.
Variables Univariable analysis
Median (mo) (95 % CI) Pa HR (95 % CI) Pb
Gender Female (39) Male (70)
20.6 (12.6-28.6) 14.7 (12.3-17.0)
0.034 1 (referent)
1.549 (1.030-2.329)
-
0.035 Age
≤61 (63) >61 (46)
16.4 (13.2-19.5) 16.8 (10.5-23.1)
0.456 1 (referent)
1.160 (0.785-1.714)
-
0.457 Location
Rectum (58) Distal (31) Proximal (20)
16.1 (10.1-22.1) 21.1 (12.0-30.2) 9.99 (7.40-12.6)
0.126 0.839 (0.493-1.427) 0.575 (0.520-1.033)
1 (referent)
0.130 0.517 0.064
- KRAS
WT (59) Mutated (42)
16.8 (13.6-20.1) 14.3 (11.0-17.5)
0.505 1 (referent)
1.149 (0.763-1.731)
-
0.506 AJCC stage
I & II (46) III (39) IV (23)
17.6 (9.97-25.3) 16.8 (13.7-20.0) 13.2 (9.05-17.3)
0.463 1.033 (0.603-1.770) 1.320 (0.756-2.303)
1 (referent)
0.465 0.906 0.329
-
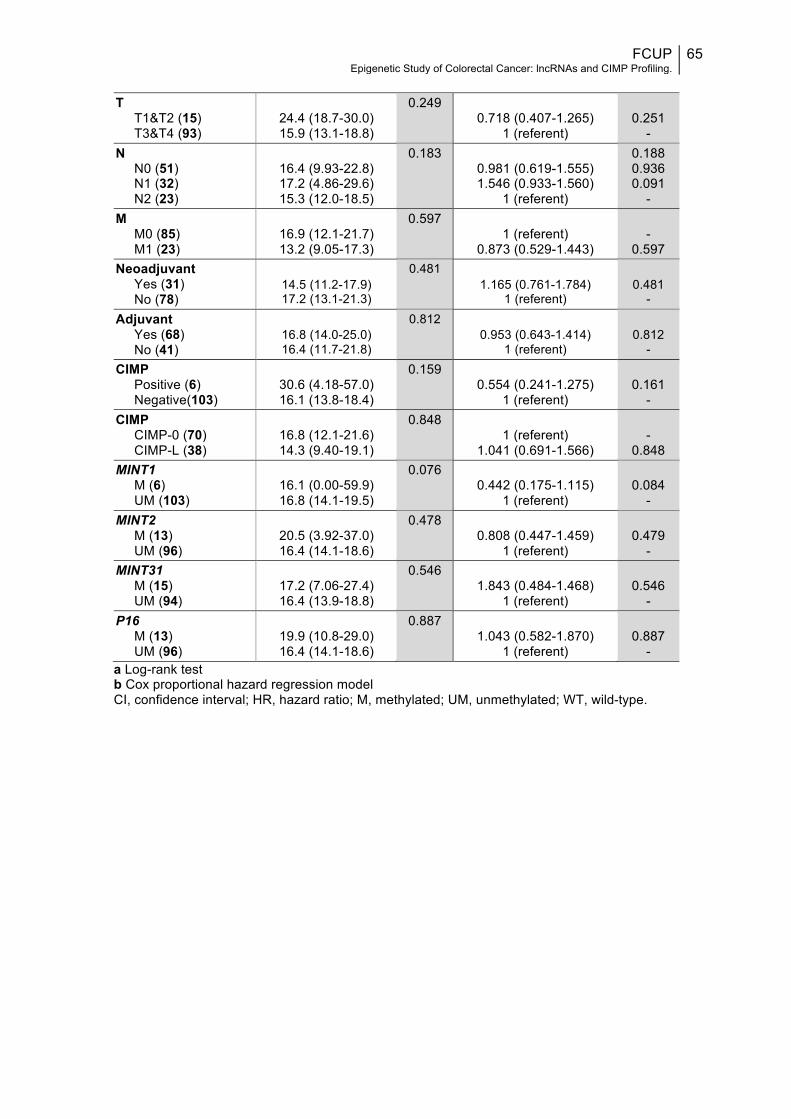
FCUP Epigenetic Study of Colorectal Cancer: lncRNAs and CIMP Profiling.
65
T
T1&T2 (15) T3&T4 (93)
24.4 (18.7-30.0) 15.9 (13.1-18.8)
0.249 0.718 (0.407-1.265)
1 (referent)
0.251
- N
N0 (51) N1 (32) N2 (23)
16.4 (9.93-22.8) 17.2 (4.86-29.6) 15.3 (12.0-18.5)
0.183 0.981 (0.619-1.555) 1.546 (0.933-1.560)
1 (referent)
0.188 0.936 0.091
- M
M0 (85) M1 (23)
16.9 (12.1-21.7) 13.2 (9.05-17.3)
0.597 1 (referent)
0.873 (0.529-1.443)
-
0.597 Neoadjuvant
Yes (31) No (78)
14.5 (11.2-17.9) 17.2 (13.1-21.3)
0.481 1.165 (0.761-1.784)
1 (referent)
0.481
- Adjuvant
Yes (68) No (41)
16.8 (14.0-25.0) 16.4 (11.7-21.8)
0.812 0.953 (0.643-1.414)
1 (referent)
0.812
- CIMP
Positive (6) Negative(103)
30.6 (4.18-57.0) 16.1 (13.8-18.4)
0.159 0.554 (0.241-1.275)
1 (referent)
0.161
- CIMP
CIMP-0 (70) CIMP-L (38)
16.8 (12.1-21.6) 14.3 (9.40-19.1)
0.848 1 (referent)
1.041 (0.691-1.566)
-
0.848 MINT1
M (6) UM (103)
16.1 (0.00-59.9) 16.8 (14.1-19.5)
0.076 0.442 (0.175-1.115)
1 (referent)
0.084
- MINT2
M (13) UM (96)
20.5 (3.92-37.0) 16.4 (14.1-18.6)
0.478 0.808 (0.447-1.459)
1 (referent)
0.479
- MINT31
M (15) UM (94)
17.2 (7.06-27.4) 16.4 (13.9-18.8)
0.546 1.843 (0.484-1.468)
1 (referent)
0.546
- P16
M (13) UM (96)
19.9 (10.8-29.0) 16.4 (14.1-18.6)
0.887 1.043 (0.582-1.870)
1 (referent)
0.887
- a Log-rank test b Cox proportional hazard regression model CI, confidence interval; HR, hazard ratio; M, methylated; UM, unmethylated; WT, wild-type.
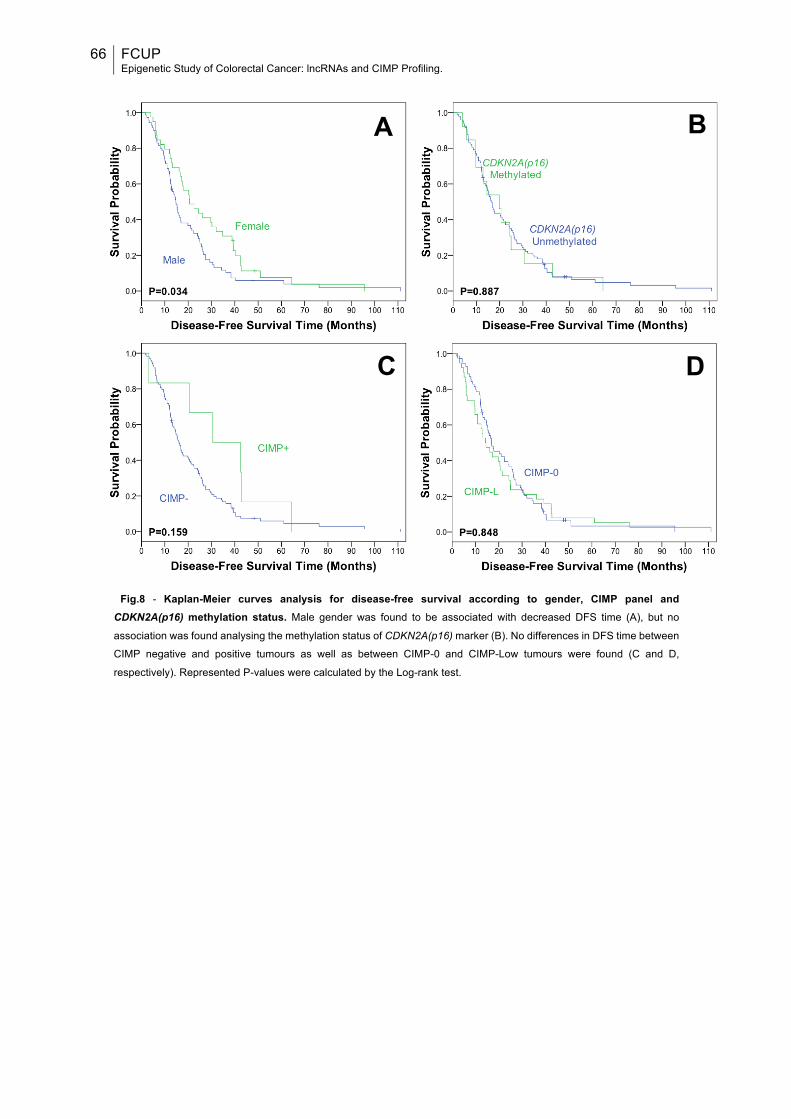
66 FCUP Epigenetic Study of Colorectal Cancer: lncRNAs and CIMP Profiling.
Fig.8 - Kaplan-Meier curves analysis for disease-free survival according to gender, CIMP panel and CDKN2A(p16) methylation status. Male gender was found to be associated with decreased DFS time (A), but no
association was found analysing the methylation status of CDKN2A(p16) marker (B). No differences in DFS time between
CIMP negative and positive tumours as well as between CIMP-0 and CIMP-Low tumours were found (C and D,
respectively). Represented P-values were calculated by the Log-rank test.
A B
C D
FCUP Epigenetic Study of Colorectal Cancer: lncRNAs and CIMP Profiling.
67
DISCUSSION CRC is one of the most common malignancies in the world, and although
screening for early detection of CRC has the potential to reduce both the incidence and
mortality of the disease, still the overall survival rate has not changed dramatically, and
a large number of individuals will develop CRC each year and eventually decease
following disease progression.3 Development of CRC is a complex biological process,
involving multiple genomic and epigenomic alterations.137 In fact, intensive investigation
over the last few decades have focused on the comprehension of genomic mechanisms,
and particularly the role of protein-coding genes in the pathogenesis of CRC.54 It is now
time to explore new horizons that may very well represent the target for future treatment
options or diagnostic tools; and when the subject is not directly the genome, it is
inevitably epigenetics, in its wide and complex web of regulatory processes involving our
genetic material. The last few years have been essential to definitely prove the
importance of epigenetics in cancer development and treatment. Therefore, it was the
selected matter in this work.
PROJECT I
Recent studies of lncRNAs have highlighted the importance of this new class of
the non-coding part of our genome. Enormous amount, diversity of functions and great
flexibility may be the explanation for their commonly deregulated expression, which is
often significantly correlated with carcinogenesis.64
CRC has long been associated with defects in DNA repair, mostly with genetic
alterations and aberrant DNA methylation of MMR genes. In contrast, BER and NER
pathways are not described as significantly related with CRC development and outcome
in most genetic studies published. However, more intense research is needed to achieve
a better understanding of these repair mechanisms in the particular case of CRC, and
completely rule out an important role played by either BER or NER pathways in the
development of the disease. In an effort to help tackling the problem, the first project
presented here was dedicated to the epigenetic study of the BER repair pathway in
sporadic CRC, through the evaluation of differential expression of lncRNAs.
The analysis of expression levels of ninety disease-related lncRNAs revealed that
none of the tested transcripts was differently expressed between any pair of groups
compared. Moreover, when comparing all ten CRC samples with the other ten healthy
mucosa samples no significant differences were also found. One explanation for such
lack of significant results may rely on the high inter-individual expression variability of
lncRNAs, even considering the same cell type,162 which suggests not only different
68 FCUP Epigenetic Study of Colorectal Cancer: lncRNAs and CIMP Profiling.
epigenetic patterns in different tissues, but also potential changes environmentally
induced.163 Indeed, most of the selected samples were not paired and the population
studied presented high variability irrespective of clinicopathological variables, including
one patient that received neoadjuvant therapy. Notably, lncRNA annotations differ not
just between tissues, but also between closely related cell types.163 Therefore, a different
location of the studied cases in the large bowel, extracted either from the tumour or
normal mucosa, and a different content of each cell type in those samples, account for
great discrepancies in expression levels. The fact that each lncRNA is often involved in
a wide range of cellular mechanisms with different functions61 is inevitably related with a
higher susceptibility to expression changes upon certain conditions, such as those
occurring during cancer progression; therefore, another major cause of variability may
be attributed to a more or less advanced state of the tumour. In fact, the distribution of
TNM stage among the ten tumour samples is heterogeneous, with three of them being
classified as stage IV. Increasingly, differential expression of lncRNAs has been
associated with tumour TNM stage, mostly higher stages.164
An important aspect to be considered when extracting samples of normal mucosa
from CRC patients is the possible presence of field cancerization, which may extent as
far as 17 cm from the tumour and is initially characterized by sub-cellular alterations,
affecting primarily labile molecular components, such as lncRNAs.165 Thus, the distance
between the tumour and the sample extracted from an apparently normal mucosa may
not be long enough to exclude field cancerization effect, and skewed differences in the
expression levels of lncRNAs.
The small number of representative samples per group coupled with the
existence of many variability factors may have hampered the establishment of compact
relations between any compared pair of formed groups. Although no other work following
the same approach was published so far, many studies exist reporting differently
expressed lncRNAs in CRC. Part of the ninety tested transcripts were formerly reported
as being repressed or induced in CRC.72 Perhaps the most similar study was conducted
by Thorenoor and co-workers (2015), in which tumour and paired non-tumour colorectal
tissues of twenty CRC patients from Czech Republic were screened for the expression
of lncRNAs using the same commercially available qPCR Array Kit. In this independent
work six up-regulated and four down-regulated transcripts were described.166 The only
common transcript differently altered, attending the results depicted herein without
applying any correction to multiple t-tests, was Zfas1. However, contrarily to Thorenoor’s
work, Zfas1 was found to be down-regulated in this present analysis. Moreover, another
work also reported this lncRNA as being up-regulated in CRC and predicting poor
prognosis167. Again, this contradictory observation, and the fact that the majority of the

FCUP Epigenetic Study of Colorectal Cancer: lncRNAs and CIMP Profiling.
69
transcripts were suspiciously down-regulated when no correction was applied, is likely
the consequence of great variability and small size of the studied population, further
reflected in the absence of significant results after applying Holm-Šídák correction.
In the future, the analysis performed here should be repeated in a larger
population, and reducing the variability factors to better elucidate the relation between
BER pathway and regulation of lncRNAs in CRC. Moreover, it is important to note that
only ninety transcripts were tested, from a universe of more than ninety thousand
possible lncRNAs genes. High-throughput microarrays represent a more complete
approach, while maintaining statistical power. However, to potentially detect or exclude
any relation at all, the best initial approach would be RNA-sequencing.
The results depicted here suggest that no association exists between BER
pathway and CRC development, considering the expression levels of ninety lncRNAs.
Additionally, none of the transcripts was found to be differently expressed between CRC
tissue and normal colorectal tissue. However, previously published contradictory data,
and high variability and small size of the studied population preclude any solid
conclusion.
PROJECT II
Methylation represents the most well known cancer-related epigenetic alteration.
Because DNA methylation begins early in CRC development, it is the only epigenetic
evidence retained in purified genomic DNA isolated from tumours, and is chemically and
biologically stable. In fact, aberrant DNA methylation is well known to play an important
role not only in cancer onset but also during its progression, and CRC is no exception168
In the past fifteen years, promoter CpG island DNA hypermethylation leading to
transcriptional gene silencing has been recognized as a functional alternative to genetic
mutations inactivating tumour suppressor genes in carcinogenesis. Furthermore, it
should be recalled that CIMP status has been pointed out as the most promising indicator
for prognosticating CRC patients.115 Although CIMP is now collectively accepted as a
subtype of CRCs characterized by epigenetic instability, the same does not applies when
selecting the best approach and group of loci used to define CIMP status of a tumour.
Therefore, in this second project the main goal was the characterization of CIMP status
by specific qMSP in a group of CRC patients using one of the most commonly used
panels, the classic CIMP panel (defined by five markers).
The analysis of typical clinicopathologic and molecular variables distribution for
all CRC patients revealed discrepancies from previously published data. Indeed, in our
series a higher percentage of males was enrolled, when only a slight difference favouring

70 FCUP Epigenetic Study of Colorectal Cancer: lncRNAs and CIMP Profiling.
male sex was reported in larger studied populations. Herein, patients were diagnosed at
earlier age (one-decade difference for median age), which may be the consequence of
a higher percentage of rectal cancers also reported, comparatively to colon tumours.
According to the literature, patients with rectal cancer tend to be younger at diagnosis
than those with colon cancer (median age, 63 vs 70 years, respectively). In this study,
almost half of all patients harboured rectal tumours, in opposition to ~30% reported by
other studies that also included consecutive series. The explanation may be in part
related to lesions missed by colonoscopy, which are more frequently located on the right
side of the bowel, due to poor bowel preparation that prevents complete examination.
Moreover, symptoms are usually easier to notice when the tumour is located on the left
side of the bowel.7,169,170 Nonetheless, the frequency of KRAS mutations are in
accordance with the literature.27 Similarly to others, the majority of tumours were
moderately differentiated (G2), but the frequency of G2 tumours was higher than
previously reported, as almost all tumours were moderately differentiated.169,170 The
percentage of tumours diagnosed with AJCC stage IV was much higher in this study
compared to larger series.169,170 In fact, half of the cases were stage IV, which might be
due to the lack of a CRC screening program in our country and region.
Concerning treatment approaches, the majority of stages II and III tumours was
submitted to neoadjuvant therapy, including mainly rectal tumours. Moreover, half of all
stage IV tumours were also submitted to neadjuvant treatment, most probably
representing unresectable/difficult to resect lesions. Most patients enrolled were
submitted to adjuvant therapy after primary treatment, because 2/3 of all tumours were
classified as stage III or IV. Additionally, adjuvant therapy was applied after progression
of some stage I and II cases.
At some extend these described disparities may also arise due to different follow-
up time considered, different health policies between countries, and diverse inherent
characteristics for different populations, even comparing western developed countries.
However, no similar study was conducted in the Portuguese population, precluding a
better clarification of the subject.
Regarding aberrant methylation, MINT loci and CDKN2A(p16) displayed a lower
proportion (roughly half) of methylated cases for each individual marker than the 20-30%
reported by several authors, consequently affecting CIMP+ frequency.126,171–178
Nevertheless, some studies also reported lower MINT1 and CDKN2A(p16) methylation
frequencies.173–175,178 One plausible explanation for these results would be a high
proportion of rectal cancers, known to be less frequently observed in CIMP+ than colon
tumours.119 However, in this analysis no association was found between tumour location
and CIMP status. Importantly, CIMP+ tumours displaying MLH1 methylation and MSI

FCUP Epigenetic Study of Colorectal Cancer: lncRNAs and CIMP Profiling.
71
rarely progress to an advanced stage.178 Indeed, this finding is consistent with the high
proportion of stage IV cases included, the frequency of MLH1 methylation was only
0.95%, in opposition to ~15% usually reported in sporadic colorectal cancers.
Nevertheless, many studies analysing CIMP classic panel also reported methylation
frequencies for MLH1 substantially lower than the other four markers.126,171–173,177–179
Moreover, differences in methodologies may explain some discrepancies. Specifically,
the selected pair of primers and corresponding region of the CpG island in MLH1
promoter may have underrepresented promoter methylation in this gene, as they were
newly designed. In fact, the location of core regions and the density of methylation
required for gene silencing can vary per gene. Thus, to overcome this limitation, a
different pair of primers comprising a more representative region/amplicon may be used
instead.
Similarly, the low frequency of CIMP cases might be due to the quantitative
technique (SYBR® Green-based real-time qMSP) herein performed, since it excludes
most false-positive cases, leading to lower levels of methylation comparatively to non-
quantitative methodology, such as MSP. Moreover, most studies using qMSP prefer
MethyLight as the specific quantitative technique.118,180,181 Since no CIMP studies using
SYBR® Green-based real-time qMSP were found, direct comparisons can not be
performed.
Importantly, one meta-analysis including 33 studies in which CIMP was evaluated
in CRC described a median prevalence of CIMP-positive or CIMP-high status amongst
included studies of 18.2%, ranging from 4.6% to 46.5%.118 Therefore, the frequency of
CIMP+ cases in our study is within the range reported. However, the same is not true
when evaluating a trichotomized categorization of CIMP classic panel – only three cases
were found to be CIMP-H. Nevertheless, the majority of studies testing the classic panel
prefer the dichotomous categorization, which may be related with the specific markers
constituting the panel. Additionally, it was suggested that either a two panel method using
two different sets of CIMP-related markers or an eight-gene panel (such as Ogino’s
panel) are required to properly classify CRC into one of three DNA methylation
epigenotypes.181 Nevertheless, the indicative analysis of frequency for the three cases
was in accordance with the literature, regarding female gender, older age and non-rectal
location.118,120
Interestingly, differences in ethnicity may as well explain why the prevalence of
CIMP differs between study populations, even if the same gene panel and analytic
methods were used in each. Indeed, English et al (2008) found that southern European
origin individuals had lower risk of CRC CIMP+ than people of Anglo-Celtic origin,

72 FCUP Epigenetic Study of Colorectal Cancer: lncRNAs and CIMP Profiling.
possibly owing to genetic factors that are less common in people of southern European
origin.182
In this study no significant associations were apparent between CIMP status and
any of the other molecular and clinicopathological variables. However, according to
published results, CIMP-L and MINT31 methylation were significantly associated with
mutated KRAS. Specifically, KRAS mutation has been associated with CIMP-L tumours,
whereas CIMP+ tumours are associated with BRAF mutation.46,118,120,127 Yet, since part
of CIMP-L tumours are also CIMP+, depending on the proportion of methylated markers
and the threshold used for CIMP panel definition, a trend or even a significant association
between KRAS and CIMP+ tumours may also be reported.104,127 Herein, tumours with
two or three methylated markers were classified as both CIMP-L and CIMP+, which
probably accounts for the trend observed for CIMP+ tumours to be KRAS mutated.
Nonetheless, it has been suggested that BRAF and KRAS oncogene mutation
status may refine CIMP definition.118 Therefore, an important complement to this study
would be the screening for BRAF mutational status.
Surprisingly, CIMP-L significantly associated with a higher number of regional
lymph nodes with metastasis (N2), relatively to N1 tumours. Similarly, MINT1 methylation
significantly associated with lack of lymph nodes metastasis (N0). However, due to the
low number of tumours with methylated MINT1 promoter, N1 and N2 cases were
combined in the same category, which precluded the comparison between N1 and N2
cases and may have negatively affected the statistical value of the test for MINT1 locus.
These differences are most probably due to the population analysed, since lymph node
metastasis (N) status was not previously associated with CIMP-L or the methylation of
this MINT loci. Moreover, CIMP-L tumours, comparatively to CIMP-H, are not as
commonly correlated with poor prognosis120, and thus, no association with higher N stage
is expected.
Concerning survival analysis, several clinicopathological parameters have been
previously described as being associated with CRC prognosis, including age, gender,
tumour grade, depth of tumour growth, lymph node metastasis, distant metastasis and
staging.183 Indeed, in our study, all variables but gender associated with shorter DSS.
Moreover, neoadjuvant therapy was also independently associated with shorter DSS,
which is related with poorer outcome of unresectable metastatic tumours. Still a great
debate exists about the eventual outcome improvement of neoadjuvant therapy in these
patients.184,185 Regarding DFS, only male gender was independently associated with
poorer prognosis. These discrepancies may be at least in part explained by the
substantial reduction of cases considered for DFS analysis.

FCUP Epigenetic Study of Colorectal Cancer: lncRNAs and CIMP Profiling.
73
It should be recalled that our cohort of patients includes a high proportion of
tumours with advanced stages of CRC (metastatic mostly), thus impacting both in DSS
and DFS, which is in line with a poorer prognosis depicted for stage IV tumours, in
DSS.7,186
Although CIMP is generally accepted as a predictor of worse prognosis, in the
present study CIMP status showed no prognostic value both for DSS and DFS. However,
these results follow the same trend as in a recent meta-analysis in which 13 out of 19
studies concluded that CIMP had no significant effect on OS, and 8 of 11 studies found
no significant relationship between CIMP and DFS.118 Moreover, in another meta-
analysis all four studies reporting the effect of CIMP in DSS, without considering any
subgroup of patients, found no significant association between CIMP+ tumours and
survival; and three out of four studies considering exclusively the classic panel showed
no significant association.180 Therefore, the prognostic value of CIMP may not only
depend on the specific population studied and the associated characteristics, but also
according to the panel selected.
Importantly, CIMP tumours have been strongly associated with worse outcome
when considering only MSS and MSI-L tumours.118 However, MSI profiling was not
performed, and therefore, it is not possible to test whether MSI status would alter the
results, which limits the potential of this study.
Of notice, all three CIMP-H patients died from disease progression, and two of
them were never considered cured during the follow-up time, which is in line with the
frequently reported association between CIMP-H and worse prognosis.120
From all individual markers, only CDKN2A(p16) aberrant methylation significantly
associated with poor prognosis in DSS and univariable analysis. However, significance
was lost after multivariable analysis, which is in agreement with a large cohort study
examining the prognostic effect of this gene promoter methylation independent of
CIMP.187 Nevertheless, the prognostic significance of CDKN2A(p16) methylation
independent of CIMP status remains uncertain. Specifically, a recent meta-analysis
suggests that CDKN2A(p16) methylation might be a predictive factor for unfavourable
prognosis of CRC patients.188 In line with this, after analysing only those cases not
submitted to neoadjuvant therapy, an independent association between CDKN2A(p16)
methylation and worse prognosis was found. Even though CDKN2A(p16) methylation is
often included in the CIMP panel and is closely related to CIMP status, the reported age-
related CDKN2A(p16) methylation likely represents a confounding factor in the
assessment of tumour-specific methylation and subsequent correlation with
outcome.117,187 Nevertheless, as mentioned above, no correlation between
74 FCUP Epigenetic Study of Colorectal Cancer: lncRNAs and CIMP Profiling.
CDKN2A(p16) promoter methylation and age at diagnosis was found in the present
study.
Currently, although KRAS mutations are acknowledged as a predictive marker in
anti-EGFR therapy, its value as a prognostic marker is highly questionable.189 In this
dissertation, KRAS mutations did not associate with survival. However, KRAS mutations
predicted worse prognosis in MINT31 methylated cases, whereas in CIMP-L tumours
associated with better outcome. Nonetheless, MINT31 methylation and CIMP-L were
both associated with improved outcome in KRAS mutated tumours. In fact, CIMP-L was
significantly associated with contradictory outcomes in KRAS wild-type and mutated
tumours. These intricate results may be related with the association between MINT31 or
CIMP-L with mutation of KRAS found in our cohort of patients. However, none of these
or other significant associations observed after stratification was described in previous
studies. Therefore, to further clarify or validate these new findings and its possible
implications in CRC prognostication, a new and independent series should be analysed.
Additionally, numerous gene panel definitions, and different marker thresholds
and laboratory methods have been used to study CIMP in CRC, which has been shown
to result in varied CIMP frequencies and different conclusions regarding the prognostic
value of CIMP. This lack of consensus is surely related to the still unknown biological
cause of CIMP tumours. In addition, a difference in the choice of primers and/or the
precise location of the region analysed to determine methylation of the marker may as
well explain discrepancies observed between studies. Therefore, in order to further
determine the relation between CIMP status and survival or treatment response, the
eventual effect of MSI, BRAF, and KRAS status should be taken into consideration.
The fact that qMSP (MethyLight) has been most frequently used alongside with
Weisenberger’s (new) panel may point out a brittleness of the present analysis. However,
using qMSP alongside with the classic panel instead, in fact, adds more information to
the discussion of which is the best approach to profile CIMP in CRC. To complement this
analysis, MSI and BRAF status should be evaluated. Analysing the same population
following an identical approach but with a different panel or method would be of great
importance, allowing for a more direct comparison of the potential of each panel or the
feasibility of each laboratory technique.
In conclusion, the analysis of CIMP status in this set of 211 CRC patients
revealed that CIMP+ phenotype is rare in sporadic CRC and does not have an
independent prognostic value in this malignancy.
FCUP Epigenetic Study of Colorectal Cancer: lncRNAs and CIMP Profiling.
75
REFERENCES 1. Slyskova, J. et al. Functional, genetic, and epigenetic aspects of base and nucleotide excision repair
in colorectal carcinomas. Clin. Cancer Res. 18, 5878–87 (2012). 2. World Health Organization. World Cancer Report 2014. (World Health Organization, 2014). 3. Schreuders, E. H. et al. Colorectal cancer screening: a global overview of existing programmes. Gut
1–13 (2015). doi:10.1136/gutjnl-2014-309086 4. Ait Ouakrim, D. et al. Trends in colorectal cancer mortality in Europe: retrospective analysis of the
WHO mortality database. BMJ 351, h4970 (2015). 5. Murphy, G. et al. Sex disparities in colorectal cancer incidence by anatomic subsite, race and age.
Int. J. Cancer 128, 1668–1675 (2011). 6. American Cancer Society. Colorectal Cancer Facts & Figures 2014-2016. (2014).
doi:10.1101/gad.1593107 7. DeSantis, C. E. et al. Cancer Treatment and Survivorship Statistics, 2014. CA. Cancer J. Clin. 64,
252–271 (2014). 8. Siegel, R., Naishadham, D. & Jemal, A. Cancer statistics, 2013. CA. Cancer J. Clin. 63, 11–30
(2013). 9. Inra, J. A. & Syngal, S. Colorectal Cancer in Young Adults. Dig. Dis. Sci. 60, 722–733 (2015). 10. Coppedè, F. Epigenetic biomarkers of colorectal cancer: Focus on DNA methylation. Cancer Letters
342, 238–247 (2014). 11. Ogino, S., Chan, A. T., Fuchs, C. S. & Giovannucci, E. Molecular pathological epidemiology of
colorectal neoplasia: an emerging transdisciplinary and interdisciplinary field. Gut 60, 397–411 (2011).
12. Hol, L. et al. Screening for colorectal cancer: random comparison of guaiac and immunochemical faecal occult blood testing at different cut-off levels. Br. J. Cancer 100, 1103–1110 (2009).
13. Budinska, E. et al. Gene expression patterns unveil a new level of molecular heterogeneity in colorectal cancer. J. Pathol. 231, 63–76 (2013).
14. Kahn, E. D. F. in Sleisenger and Fordtran’s Gastrointestinal and Liver Disease - 2 Volume Set (ed. Mark Feldman, Lawrence S. Friedman, L. J. B.) 1615–1640 (Saunders, 2010). doi:10.1016/B978-1-4160-6189-2.00096-2
15. Li, F. & Lai, M. Colorectal cancer, one entity or three. J. Zhejiang Univ. Sci. B 10, 219–229 (2009). 16. World Health Organization. International Classification of Diseases for Oncology (ICD-O). (World
Health Organization, 2000). doi:10.1136/jcp.30.8.782-c 17. Schuebel, K., Chen, W. & Baylin, S. B. CIMPle origin for promoter hypermethylation in colorectal
cancer? Nat Genet 38, 738–740 (2006). 18. Stryker, S. J. et al. Natural history of untreated colonic polyps. Gastroenterology 93, 1009–13 (1987). 19. Carethers, J. M. & Jung, B. H. Genetics and Genetic Biomarkers in Sporadic Colorectal Cancer.
Gastroenterology 149, 1177–1190 (2015). 20. Damiens, K. et al. Clinical features and course of brain metastases in colorectal cancer: an
experience from a single institution. Curr. Oncol. 19, 254–8 (2012). 21. Buetow, P. C., Buck, J. L., Carr, N. J. & Pantongrag-Brown, L. From the archives of the AFIP.
Colorectal adenocarcinoma: radiologic-pathologic correlation. RadioGraphics 15, 127–146 (1995). 22. Karim Alwan Al-Jashamy. in Principles and practice of Cancer prevention and control (ed. Al-
Naggar, R. A.) (OMICS Group International, 2014). 23. Hisamuddin, I. M. & Yang, V. W. Molecular Genetics of Colorectal Cancer: An Overview. Curr Color.
Cancer Rep 2, 53–59 (2006). 24. Hisamuddin, I. M. & Yang, V. W. Genetics of Colorectal Cancer. Medscape Gen. Med. 6, 13 (2004). 25. The Cancer Genome Atlas Network. Comprehensive molecular characterization of human colon and
rectal cancer. Nature 487, 330–7 (2012). 26. Fearon, E. R. & Vogelstein, B. A genetic model for colorectal tumorigenesis. Cell 61, 759–767
(1990). 27. Markowitz, S. D. & Bertagnolli, M. M. Molecular basis of colorectal cancer. N. Engl. J. Med. 362,
1246; author reply 1246–1247 (2009). 28. Vogelstein, B. et al. Cancer Genome Landscapes. Science (80-. ). 339, 1546–1558 (2013). 29. Pino, M. S. & Chung, D. C. The Chromosomal Instability Pathway in Colon Cancer. Gastroenterology
138, 2059–2072 (2010). 30. Choong, M. K. & Tsafnat, G. Genetic and epigenetic biomarkers of colorectal cancer. Clinical
Gastroenterology and Hepatology 10, 9–15 (2012). 31. Labianca, R. et al. Early colon cancer: ESMO Clinical Practice Guidelines for diagnosis, treatment
and follow-up. Ann. Oncol. 24 , vi64–vi72 (2013). 32. Van Cutsem, E., Cervantes, A., Nordlinger, B. & Arnold, D. Metastatic colorectal cancer: ESMO
Clinical Practice Guidelines for diagnosis, treatment and follow-up. Ann. Oncol. 25 , iii1–iii9 (2014). 33. Glimelius, B., Tiret, E., Cervantes, A., Arnold, D. & Group, on behalf of the E. G. W. Rectal cancer:
ESMO Clinical Practice Guidelines for diagnosis, treatment and follow-up. Ann. Oncol. 24 , vi81–vi88 (2013).
34. Sobin, L. H., Gospodarowicz, M. K. & Wittekind, C. TNM classification of malignant tumours. Clinical
76 FCUP Epigenetic Study of Colorectal Cancer: lncRNAs and CIMP Profiling.
Oncology 10, (2009).
35. Tsai, H.-C. & Baylin, S. B. Cancer epigenetics: linking basic biology to clinical medicine. Cell Res. 21, 502–517 (2011).
36. Lao, V. V. & Grady, W. M. Epigenetics and colorectal cancer. Nat. Rev. Gastroenterol. Hepatol. 8, 686–700 (2011).
37. Waddington, C. H. Preliminary Notes on the Development of the Wings in Normal and Mutant Strains of Drosophila. Proc. Natl. Acad. Sci. U. S. A. 25, 299–307 (1939).
38. Feinberg, A. P. & Vogelstein, B. Hypomethylation distinguishes genes of some human cancers from their normal counterparts. Nature 301, 89–92 (1983).
39. Van Engeland, M., Derks, S., Smits, K. M., Meijer, G. A. & Herman, J. G. Colorectal cancer epigenetics: Complex simplicity. J. Clin. Oncol. 29, 1382–1391 (2011).
40. You, J. S. & Jones, P. A. Cancer Genetics and Epigenetics: Two Sides of the Same Coin? Cancer Cell 22, 9–20 (2012).
41. Luger, K., Dechassa, M. L. & Tremethick, D. J. New insights into nucleosome and chromatin structure: an ordered state or a disordered affair? Nat. Rev. Mol. Cell Biol. 13, 436–447 (2012).
42. Vaiopoulos, A. G., Kostakis, I. D., Athanasoula, K. C. & Papavassiliou, A. G. Targeting transcription factor corepressors in tumor cells. Cell. Mol. Life Sci. 69, 1745–1753 (2012).
43. Narlikar, G. J., Sundaramoorthy, R. & Owen-Hughes, T. Mechanisms and functions of ATP-dependent chromatin-remodeling enzymes. Cell 154, 490–503 (2013).
44. Dawson, M. A. & Kouzarides, T. Cancer epigenetics: From mechanism to therapy. Cell 150, 12–27 (2012).
45. Vaiopoulos, A. G., Athanasoula, K. C. & Papavassiliou, A. G. Epigenetic modifications in colorectal cancer: molecular insights and therapeutic challenges. Biochim. Biophys. Acta 1842, 971–80 (2014).
46. Coppedè, F. The role of epigenetics in colorectal cancer. Expert Rev. Gastroenterol. Hepatol. 8, 935–948 (2014).
47. Stypula-Cyrus, Y. et al. HDAC Up-Regulation in Early Colon Field Carcinogenesis Is Involved in Cell Tumorigenicity through Regulation of Chromatin Structure. PLoS One 8, (2013).
48. Rönsch, K. et al. Class I and III HDACs and loss of active chromatin features contribute to epigenetic silencing of CDX1 and EPHB tumor suppressor genes in colorectal cancer. Epigenetics 6, 610–622 (2011).
49. Jie, D. et al. Positive Expression of LSD1 and Negative Expression of E-cadherin Correlate with Metastasis and Poor Prognosis of Colon Cancer. Dig. Dis. Sci. 58, 1581–1589 (2013).
50. Simon, J. a & Kingston, R. E. Mechanisms of polycomb gene silencing: knowns and unknowns. Nat. Rev. Mol. Cell Biol. 10, 697–708 (2009).
51. Djebali, S. et al. Landscape of transcription in human cells. Nature 489, 101–8 (2012). 52. Slaby, O., Svoboda, M., Michalek, J. & Vyzula, R. MicroRNAs in colorectal cancer: translation of
molecular biology into clinical application. Mol. Cancer 8, 102 (2009). 53. Sato, F., Tsuchiya, S., Meltzer, S. J. & Shimizu, K. MicroRNAs and epigenetics. FEBS Journal 278,
1598–1609 (2011). 54. Goel, A. & Boland, C. R. Epigenetics of Colorectal Cancer. Gastroenterology 143, 1442–1460.e1
(2012). 55. Aslam, M. I., Patel, M., Singh, B., Jameson, J. S. & Pringle, J. H. MicroRNA manipulation in
colorectal cancer cells: from laboratory to clinical application. J. Transl. Med. 10, 128 (2012). 56. Chen, X. et al. Constructing lncRNA functional similarity network based on lncRNA-disease
associations and disease semantic similarity. Sci. Rep. 5, 11338 (2015). 57. Gutschner, T. & Diederichs, S. The hallmarks of cancer: a long non-coding RNA point of view. RNA
Biol. 9, 703–19 (2012). 58. Wilusz, J. E., Sunwoo, H. & Spector, D. L. Long noncoding RNAs: functional surprises from the RNA
world. Genes Dev. 23, 1494–504 (2009). 59. Schonrock, N., Harvey, R. P. & Mattick, J. S. Long noncoding RNAs in cardiac development and
pathophysiology. Circulation Research 111, 1349–1362 (2012). 60. Guttman, M. & Rinn, J. L. Modular regulatory principles of large non-coding RNAs. Nature 482, 339–
346 (2012). 61. Rinn, J. L. & Chang, H. Y. Genome regulation by long noncoding RNAs. Annu. Rev. Biochem. 81,
145–166 (2012). 62. Li, C. H. & Chen, Y. Targeting long non-coding RNAs in cancers: Progress and prospects.
International Journal of Biochemistry and Cell Biology 45, 1895–1910 (2013). 63. Han, D. et al. Long noncoding RNAs: Novel players in colorectal cancer. Cancer Lett. 361, 13–21
(2015). 64. Huarte, M. The emerging role of lncRNAs in cancer. Nat Med 21, 1253–1261 (2015). 65. Ye, L. C., Zhu, X., Qiu, J. J., Xu, J. & Wei, Y. Involvement of long non-coding RNA in colorectal
cancer: From benchtop to bedside (Review). Oncol Lett 9, 1039–1045 (2015). 66. Lee, H. et al. A Long Non-Coding RNA snaR Contributes to 5-Fluorouracil Resistance in Human
Colon Cancer Cells. Mol Cells (2014). doi:10.14348/molcells.2014.0151 67. Yu, Z. Q. et al. [Long non-coding RNA influences radiosensitivity of colorectal carcinoma cell lines
by regulating cyclin D1 expression]. Zhonghua Wei Chang Wai Ke Za Zhi 15, 288–291 (2012). 68. Sánchez, Y. et al. Genome-wide analysis of the human p53 transcriptional network unveils a lncRNA
FCUP Epigenetic Study of Colorectal Cancer: lncRNAs and CIMP Profiling.
77
tumour suppressor signature. Nat. Commun. 5, 5812 (2014).
69. Kim, T. et al. Role of MYC-Regulated long noncoding RNAs in cell cycle regulation and tumorigenesis. J. Natl. Cancer Inst. 107, (2015).
70. Liao, Q. et al. Identification and functional annotation of lncRNA genes with hypermethylation in colorectal cancer. Gene 572, 259–265 (2015).
71. Nissan, A. et al. Colon cancer associated transcript-1: A novel RNA expressed in malignant and pre-malignant human tissues. Int. J. Cancer 130, 1598–1606 (2012).
72. Xie, X. et al. Long non-coding RNAs in colorectal cancer. Oncotarget 7, (2015). 73. Ling, H. et al. CCAT2, a novel noncoding RNA mapping to 8q24, underlies metastatic progression
and chromosomal instability in colon cancer. Genome Res. 23, 1446–1461 (2013). 74. Xiang, J.-F. et al. Human colorectal cancer-specific CCAT1-L lncRNA regulates long-range
chromatin interactions at the MYC locus. Cell Res. 24, 513–531 (2014). 75. Graham, L. D. et al. Colorectal Neoplasia Differentially Expressed (CRNDE), a Novel Gene with
Elevated Expression in Colorectal Adenomas and Adenocarcinomas. Genes and Cancer 2, 829–840 (2011).
76. Liang, W.-C. et al. The lncRNA H19 promotes epithelial to mesenchymal transition by functioning as miRNA sponges in colorectal cancer. Oncotarget 6, 22513–22525 (2015).
77. Keniry, A. et al. The H19 lincRNA is a developmental reservoir of miR-675 that suppresses growth and Igf1r. Nat. Cell Biol. 14, 659–665 (2012).
78. Xu, M.-D., Qi, P. & Du, X. Long non-coding RNAs in colorectal cancer: implications for pathogenesis and clinical application. Mod. Pathol. 1–11 (2014). doi:10.1038/modpathol.2014.33
79. Kogo, R. et al. Long noncoding RNA HOTAIR regulates polycomb-dependent chromatin modification and is associated with poor prognosis in colorectal cancers. Cancer Res. 71, 6320–6326 (2011).
80. Ji, Q. et al. Long non-coding RNA MALAT1 promotes tumour growth and metastasis in colorectal cancer through binding to SFPQ and releasing oncogene PTBP2 from SFPQ/PTBP2 complex. Br. J. Cancer 111, 736–748 (2014).
81. Xu, C., Yang, M., Tian, J., Wang, X. & Li, Z. MALAT-1: A long non-coding RNA and its important 3??? end functional motif in colorectal cancer metastasis. Int. J. Oncol. 39, 169–175 (2011).
82. Wang, J. et al. CREB up-regulates long non-coding RNA, HULC expression through interaction with microRNA-372 in liver cancer. Nucleic Acids Res. 38, 5366–5383 (2010).
83. Takahashi, Y. et al. Amplification of PVT-1 is involved in poor prognosis via apoptosis inhibition in colorectal cancers. Br. J. Cancer 110, 164–71 (2014).
84. Han, Y. J., Ma, S. F., Yourek, G., Park, Y.-D. & Garcia, J. G. N. A transcribed pseudogene of MYLK promotes cell proliferation. FASEB J. 25, 2305–2312 (2011).
85. Prensner, J. R. et al. PCAT-1, a long noncoding RNA, regulates BRCA2 and controls homologous recombination in cancer. Cancer Res. 74, 1651–1660 (2014).
86. Ge, X. et al. Overexpression of long noncoding RNA PCAT-1 is a novel biomarker of poor prognosis in patients with colorectal cancer. Med. Oncol. 30, 588 (2013).
87. Zhou, Y. et al. Activation of p53 by MEG3 non-coding RNA. J. Biol. Chem. 282, 24731–24742 (2007).
88. Yang, F. et al. Repression of the Long Noncoding RNA-LET by Histone Deacetylase 3 Contributes to Hypoxia-Mediated Metastasis. Mol. Cell 49, 1083–1096 (2016).
89. Liu, Q. et al. LncRNA loc285194 is a p53-regulated tumor suppressor. Nucleic Acids Res. 41, 4976–4987 (2013).
90. Zhai, H. et al. Clinical significance of long intergenic noncoding RNA-p21 in colorectal Cancer. Clin. Colorectal Cancer 12, 261–266 (2013).
91. Poliseno, L. et al. A coding-independent function of gene and pseudogene mRNAs regulates tumour biology. Nature 465, 1033–8 (2010).
92. Yin, D. et al. Long noncoding RNA GAS5 affects cell proliferation and predicts a poor prognosis in patients with colorectal cancer. Med. Oncol. 31, 253 (2014).
93. Jackson, S. P. & Bartek, J. The DNA-damage response in human biology and disease. Nature 461, 1071–1078 (2010).
94. Ciccia, A. & Elledge, S. J. The DNA Damage Response: Making It Safe to Play with Knives. Mol. Cell 40, 179–204 (2010).
95. Khanna, K. K. & Jackson, S. P. DNA double-strand breaks: signaling, repair and the cancer connection. Nat. Genet. 27, 247–254 (2001).
96. Wang, L. et al. BRCA1 is a negative modulator of the PRC2 complex. EMBO J. 32, 1584–1597 (2013).
97. Wan, G. et al. A novel non-coding RNA lncRNA-JADE connects DNA damage signalling to histone H4 acetylation. EMBO J. 32, 2833–47 (2013).
98. Sharma, V. et al. A BRCA1-interacting lncRNA regulates homologous recombination. EMBO Rep. 16, 1520–1534 (2015).
99. Gazy, I. et al. TODRA, a lncRNA at the RAD51 locus, is oppositely regulated to RAD51, and enhances RAD51-dependent DSB (double strand break) repair. PLoS One 10, (2015).
100. Wan, G. et al. Long non-coding RNA ANRIL (CDKN2B-AS) is induced by the ATM-E2F1 signaling pathway. Cell. Signal. 25, 1086–1095 (2013).

78 FCUP Epigenetic Study of Colorectal Cancer: lncRNAs and CIMP Profiling.
101. Zhang, H. et al. Targeting WISP1 to sensitize esophageal squamous cell carcinoma to irradiation.
Oncotarget 6, 6218–6234 (2015). 102. Li, H. et al. LncRNA HOTAIR promotes human liver cancer stem cell malignant growth through
downregulation of SETD2. Oncotarget 6, (2014). 103. Nissar, S., Sameer, A. S., Rasool, R. & Rashid, F. DNA repair gene--XRCC1 in relation to genome
instability and role in colorectal carcinogenesis. Oncol. Res. Treat. 37, 418–22 (2014). 104. Mojarad, E. N., Kuppen, P. J. K., Aghdaei, H. A. & Zali, M. R. The CpG island methylator phenotype
(CIMP) in colorectal cancer. Gastroenterology and Hepatology from Bed to Bench 6, 120–128 (2013).
105. Lee, J. K. & Chan, A. T. Molecular prognostic and predictive markers in colorectal cancer: Current status. Current Colorectal Cancer Reports 7, 136–144 (2011).
106. Pawlik, T. M., Raut, C. P. & Rodriguez-Bigas, M. A. Colorectal carcinogenesis: MSI-H versus MSI-L. Dis. Markers 20, 199–206 (2004).
107. Howard, J. H. et al. Epigenetic downregulation of the DNA repair gene MED1/MBD4 in colorectal and ovarian cancer. Cancer Biol. Ther. 8, 1–7 (2009).
108. Shen, L. et al. MGMT promoter methylation and field defect in sporadic colorectal cancer. J. Natl. Cancer Inst. 97, 1330–1338 (2005).
109. Farkas, S. A., Vymetalkova, V., Vodickova, L., Vodicka, P. & Nilsson, T. K. DNA methylation changes in genes frequently mutated in sporadic colorectal cancer and in the DNA repair and Wnt/β-catenin signaling pathway genes. Epigenomics 6, 179–191 (2014).
110. Santos, J. C. et al. Effect of APE1 T2197G (Asp148Glu) Polymorphism on APE1, XRCC1, PARP1 and OGG1 Expression in Patients with Colorectal Cancer. Int. J. Mol. Sci. 15, 17333–17343 (2014).
111. Kabzinski, J. et al. Efficiency of Base Excision Repair of Oxidative DNA Damage and Its Impact on the Risk of Colorectal Cancer in the Polish Population. Oxid. Med. Cell. Longev. 2016, (2015).
112. Wood, R. D., Mitchell, M., Sgouros, J. & Lindahl, T. Human DNA repair genes. Science 291, 1284–9 (2001).
113. Fuss, J. O. & Cooper, P. K. DNA repair: Dynamic defenders against cancer and aging. PLoS Biol. 4, 0899–0903 (2006).
114. Wyatt, M. D. & Wilson, D. M. Participation of DNA repair in the response to 5-fluorouracil. Cellular and Molecular Life Sciences 66, 788–799 (2009).
115. Okugawa, Y., Grady, W. M. & Goel, A. Epigenetic Alterations in Colorectal Cancer: Emerging Biomarkers. Gastroenterology 149, 1204–1225e12 (2015).
116. Kim, M. S., Lee, J. & Sidransky, D. DNA methylation markers in colorectal cancer. Cancer and Metastasis Reviews 29, 181–206 (2010).
117. Toyota, M. et al. CpG island methylator phenotype in colorectal cancer. Proc. Natl. Acad. Sci. U. S. A. 96, 8681–8686 (1999).
118. Juo, Y. Y. et al. Prognostic value of CpG island methylator phenotype among colorectal cancer patients: a systematic review and meta-analysis. Ann. Oncol. 25, 2314–27 (2014).
119. Yamauchi, M. et al. Assessment of colorectal cancer molecular features along bowel subsites challenges the conception of distinct dichotomy of proximal versus distal colorectum. Gut 61, 847–54 (2012).
120. Ogino, S. & Goel, A. Molecular Classification and Correlates in Colorectal Cancer. J. Mol. Diagn. 10, 13–27 (2008).
121. Curtin, K., Slattery, M. L. & Samowitz, W. S. CpG island methylation in colorectal cancer: past, present and future. Patholog. Res. Int. 2011, 902674 (2011).
122. Issa, J.-P. J. Methylation and Prognosis. Clin. Cancer Res. 9, 2879 LP – 2881 (2003). 123. Collado, M., Blasco, M. A. & Serrano, M. Cellular Senescence in Cancer and Aging. Cell 130, 223–
233 (2007). 124. Park, S.-J. et al. Frequent CpG island methylation in serrated adenomas of the colorectum. Am. J.
Pathol. 162, 815–822 (2003). 125. Weisenberger, D. J. et al. CpG island methylator phenotype underlies sporadic microsatellite
instability and is tightly associated with BRAF mutation in colorectal cancer. Nat. Genet. 38, 787–93 (2006).
126. Barault, L. et al. Hypermethylator phenotype in sporadic colon cancer: Study on a population-based series of 582 cases. Cancer Res. 68, 8541–8546 (2008).
127. Ogino, S., Kawasaki, T., Kirkner, G. J., Loda, M. & Fuchs, C. S. CpG island methylator phenotype-low (CIMP-low) in colorectal cancer: possible associations with male sex and KRAS mutations. J. Mol. Diagn. 8, 582–8 (2006).
128. Ogino, S. et al. Evaluation of Markers for CpG Island Methylator Phenotype (CIMP) in Colorectal Cancer by a Large Population-Based Sample. J. Mol. Diagn. 9, 305–314 (2007).
129. Issa, J.-P. Colon cancer: it’s CIN or CIMP. Clin. Cancer Res. 14, 5939–40 (2008). 130. Fleming, M., Ravula, S., Tatishchev, S. F. & Wang, H. L. Colorectal carcinoma: Pathologic aspects.
J. Gastrointest. Oncol. 3, 153–73 (2012). 131. Cheng, Y. W. et al. CpG island methylator phenotype associates with low-degree chromosomal
abnormalities in colorectal cancer. Clin. Cancer Res. 14, 6005–6013 (2008). 132. Sinicrope, F. A. et al. Prognostic impact of microsatellite instability and DNA ploidy in human colon
carcinoma patients. Gastroenterology 131, 729–737 (2006).
FCUP Epigenetic Study of Colorectal Cancer: lncRNAs and CIMP Profiling.
79
133. Shen, L. et al. Integrated genetic and epigenetic analysis identifies three different subclasses of
colon cancer. Proc. Natl. Acad. Sci. U. S. A. 104, 18654–9 (2007). 134. Hattori, N. & Ushijima, T. in Handbook of Epigenetics 125–134 (2011). doi:10.1016/B978-0-12-
375709-8.00008-3 135. Olkhov-Mitsel, E. & Bapat, B. Strategies for discovery and validation of methylated and
hydroxymethylated DNA biomarkers. Cancer Med. 1, 237–60 (2012). 136. Atkinson A.J., J. et al. Biomarkers and surrogate endpoints: Preferred definitions and conceptual
framework. Clinical Pharmacology and Therapeutics 69, 89–95 (2001). 137. Coppedè, F., Lopomo, A., Spisni, R. & Migliore, L. Genetic and epigenetic biomarkers for diagnosis,
prognosis and treatment of colorectal cancer. World J. Gastroenterol. 20, 943–56 (2014). 138. Gyparaki, M. T., Basdra, E. K. & Papavassiliou, A. G. DNA methylation biomarkers as diagnostic
and prognostic tools in colorectal cancer. Journal of Molecular Medicine 91, 1249–1256 (2013). 139. Imperiale, T. F. et al. Multitarget stool DNA testing for colorectal-cancer screening. N. Engl. J. Med.
370, 1287–97 (2014). 140. Gonzalez-pons, M. & Cruz-correa, M. Colorectal Cancer Biomarkers : Where Are We Now ? Biomed
Res. Int. 2015, 1–14 (2015). 141. Jenab-Wolcott, J. & Giantonio, B. in Molecular Pathology of Neoplastic Gastrointestinal Diseases
(eds. Sepulveda, R. A. & Lynch, P. J.) 141–171 (Springer US, 2013). doi:10.1007/978-1-4614-6015-2_9
142. Nilsson, T. K., Lof-Ohlin, Z. M. & Sun, X.-F. DNA methylation of the p14(ARF), RASSF1A and APC1A genes as an independent prognostic factor in colorectal cancer patients. Int. J. Oncol. 42, 127–133 (2013).
143. Wallner, M. et al. Methylation of serum DNA is an independent prognostic marker in colorectal cancer. Clin. Cancer Res. 12, 7347–7352 (2006).
144. Jensen, L. H. et al. Regulation of MLH1 mRNA and protein expression by promoter methylation in primary colorectal cancer: A descriptive and prognostic cancer marker study. Cell. Oncol. 36, 411–419 (2013).
145. Sharma, A., Abdelfatah, E., Al Eissa, M. & Ahuja, N. in Medical Epigenetics (ed. Tollefsbol, T. O.) 177–195 (Academic Press, 2016). doi:http://dx.doi.org/10.1016/B978-0-12-803239-8.00011-9
146. Cha, Y. et al. Adverse prognostic impact of the CpG island methylator phenotype in metastatic colorectal cancer. Br J Cancer 115, 164–171 (2016).
147. Joo, Y.-E. Prognostic Significance of CpG Island Methylator Phenotype in Colorectal Cancer. Gut Liver 9, 139–140 (2015).
148. Bae, J. M., Kim, J. H., Cho, N.-Y., Kim, T.-Y. & Kang, G. H. Prognostic implication of the CpG island methylator phenotype in colorectal cancers depends on tumour location. Br. J. Cancer 109, 1004–12 (2013).
149. Samowitz, W. S. et al. Association of smoking, CpG island methylator phenotype, and V600E BRAF mutations in colon cancer. J. Natl. Cancer Inst. 98, 1731–1738 (2006).
150. Murcia, O. et al. Serrated colorectal cancer: Molecular classification, prognosis, and response to chemotherapy. World Journal of Gastroenterology 22, 3516–3530 (2016).
151. Langie, S. A. S. et al. Measuring DNA repair incision activity of mouse tissue extracts towards singlet oxygen-induced DNA damage: A comet-based in vitro repair assay. Mutagenesis 26, 461–471 (2011).
152. Shaposhnikov, S. et al. Twelve-gel slide format optimised for comet assay and fluorescent in situ hybridisation. Toxicol. Lett. 195, 31–34 (2010).
153. Olive, P. L. & Banáth, J. P. The comet assay: a method to measure DNA damage in individual cells. Nat. Protoc. 1, 23–29 (2006).
154. Ririe, K. M., Rasmussen, R. P. & Wittwer, C. T. Product Differentiation by Analysis of DNA Melting Curves during the Polymerase Chain Reaction. Anal. Biochem. 245, 154–160 (1997).
155. Hamilton, S. R., Aaltonen, L. a, Kleihues, P. & Cavenee, W. K. World health organization. Classification of tumours. Pathology and genetics of tumours of the digestive system. Parallel Distrib. Process. 2008 IPDPS 2008 IEEE Int. Symp. 1–8 (2000).
156. Egner, J. R. AJCC Cancer Staging Manual. JAMA: The Journal of the American Medical Association 304, 1726 (2010).
157. Pearson, H. & Stirling, D. in PCR Protocols (eds. Bartlett, J. M. S. & Stirling, D.) 33–34 (Humana Press, 2003). doi:10.1385/1-59259-384-4:33
158. Frommer, M. et al. A genomic sequencing protocol that yields a positive display of 5-methylcytosine residues in individual DNA strands. Proc. Natl. Acad. Sci. U. S. A. 89, 1827–31 (1992).
159. Li, Y. & Tollefsbol, T. O. DNA methylation detection: Bisulfite genomic sequencing analysis. Methods Mol. Biol. 791, 11–21 (2011).
160. Toyota, M. et al. Identification of differentially methylated sequences in colorectal cancer by methylated CpG island amplification. Cancer Res. 59, 2307–2312 (1999).
161. Kondo, Y., Shen, L. & Issa, J.-P. J. Critical role of histone methylation in tumor suppressor gene silencing in colorectal cancer. Mol. Cell. Biol. 23, 206–15 (2003).
162. Kornienko, A. E. et al. Long non-coding RNAs display higher natural expression variation than protein-coding genes in healthy humans. Genome Biol. 17, 14 (2016).
163. Amin, V. et al. Epigenomic footprints across 111 reference epigenomes reveal tissue-specific

80 FCUP Epigenetic Study of Colorectal Cancer: lncRNAs and CIMP Profiling.
epigenetic regulation of lincRNAs. Nat. Commun. 6, 6370 (2015).
164. Kladi-Skandali, A., Michaelidou, K., Scorilas, A. & Mavridis, K. Long Noncoding RNAs in Digestive System Malignancies: A Novel Class of Cancer Biomarkers and Therapeutic Targets? Gastroenterol. Res. Pract. 2015, 319861 (2015).
165. Patel, A., Tripathi, G., Gopalakrishnan, K., Williams, N. & Arasaradnam, R. P. Field cancerisation in colorectal cancer: A new frontier or pastures past? World Journal of Gastroenterology 21, 3763–3772 (2015).
166. Thorenoor, N. et al. Long non-coding RNA ZFAS1 interacts with CDK1 and is involved in p53-dependent cell cycle control and apoptosis in colorectal cancer. Oncotarget 7, 622–637 (2016).
167. Wang, W. & Xing, C. Upregulation of long noncoding RNA ZFAS1 predicts poor prognosis and prompts invasion and metastasis in colorectal cancer. Pathol. - Res. Pract. 212, 690–695 (2016).
168. Crider, K. S., Yang, T. P., Berry, R. J. & Bailey, L. B. Folate and DNA Methylation : A Review of Molecular Mechanisms and the Evidence for Folate ’ s Role. Am. Soc. Nutr. 3, 21–38 (2012).
169. Erichsen, R. et al. Characteristics and survival of interval and sporadic colorectal cancer patients: a nationwide population-based cohort study. Am J Gastroenterol 108, 1332–1340 (2013).
170. Derwinger, K., Kodeda, K., Bexe-Lindskog, E. & Taflin, H. Tumour differentiation grade is associated with TNM staging and the risk of node metastasis in colorectal cancer. Acta Oncol. (Madr). 49, 57–62 (2010).
171. Dahlin, A. M. et al. The role of the CpG island methylator phenotype in colorectal cancer prognosis depends on microsatellite instability screening status. Clin. Cancer Res. 16, 1845–1855 (2010).
172. Han, S. W. et al. Methylation and microsatellite status and recurrence following adjuvant FOLFOX in colorectal cancer. Int. J. Cancer 132, 2209–2216 (2013).
173. Ju, H. X. et al. Distinct profiles of epigenetic evolution between colorectal cancers with and without metastasis. Am. J. Pathol. 178, 1835–1846 (2011).
174. Kim, J. C. et al. Promoter methylation of specific genes is associated with the phenotype and progression of colorectal adenocarcinomas. Ann. Surg. Oncol. 17, 1767–76 (2010).
175. Ward, R. L. et al. Adverse Prognostic Effect of Methylation in Colorectal Cancer Is Reversed by Microsatellite Instability. J. Clin. Oncol. 21 , 3729–3736 (2003).
176. Zlobec, I. et al. Stratification and Prognostic Relevance of Jass’s Molecular Classification of Colorectal Cancer. Front. Oncol. 2, 7 (2012).
177. Zanutto, S. et al. Methylation status in patients with early stage colon cancer: A new prognostic marker? Int. J. Cancer 130, 488–489 (2012).
178. Shen, L. et al. Association between DNA Methylation and Shortened Survival in Patients with Advanced Colorectal Cancer Treated with 5-Fluorouracil–Based Chemotherapy. Clin. Cancer Res. 13, 6093–6098 (2007).
179. Ogino, S. et al. CpG island methylation, response to combination chemotherapy, and patient survival in advanced microsatellite stable colorectal carcinoma. Virchows Arch. 450, 529–537 (2007).
180. Jia, M., Gao, X., Zhang, Y., Hoffmeister, M. & Brenner, H. Different definitions of CpG island methylator phenotype and outcomes of colorectal cancer: a systematic review. Clin. Epigenetics 8, 25 (2016).
181. Hughes, L. a E. et al. The CpG island methylator phenotype in colorectal cancer: progress and problems. Biochim. Biophys. Acta 1825, 77–85 (2012).
182. English, D. R. et al. Ethnicity and risk for colorectal cancers showing somatic BRAF V600E mutation or CpG island methylator phenotype. Cancer Epidemiol. Biomarkers Prev. 17, 1774–80 (2008).
183. Sjo, O. H. Prognostic factors in colon cancer. (University of Oslo, 2012). 184. Adam, R. et al. Patients with initially unresectable colorectal liver metastases: Is there a possibility
of cure? J. Clin. Oncol. 27, 1829–1835 (2009). 185. van Dijk, T. H. et al. Evaluation of short-course radiotherapy followed by neoadjuvant bevacizumab,
capecitabine, and oxaliplatin and subsequent radical surgical treatment in primary stage IV rectal cancer. Ann. Oncol. 24 , 1762–1769 (2013).
186. Kanwar, S. S., Poolla, A. & Majumdar, A. P. Regulation of colon cancer recurrence and development of therapeutic strategies. World J. Gastrointest. Pathophysiol. 3, 1–9 (2012).
187. Shima, K. et al. Prognostic Significance of CDKN2A (p16) Promoter Methylation and Loss of Expression in 902 Colorectal Cancers: Cohort Study and Literature Review. Int. J. Cancer 128, 1080–1094 (2011).
188. Xing, X. et al. The prognostic value of CDKN2A hypermethylation in colorectal cancer: a meta-analysis. Br. J. Cancer 108, 2542–8 (2013).
189. Deschoolmeester, V., Baay, M., Specenier, P., Lardon, F. & Vermorken, J. B. A review of the most promising biomarkers in colorectal cancer: one step closer to targeted therapy. Oncologist 15, 699–731 (2010).

FCUP Epigenetic Study of Colorectal Cancer: lncRNAs and CIMP Profiling.
81
APPENDIX I Association between represented variables and each of the five genes/loci constituting the classic CIMP panel. Classification of tumours according to the methylation status of each gene or locus (MINT1, MINT2, MINT31 and
CDKN2A(p16)), and its distribution and association with all represented variables. P-values were calculated using the
Chi-squared test or the Fisher’s exact test. Significant P-values (P<0.05) are represented in bold. Non-significant results
for tumour invasion depth (T), distant metastasis (M), neoadjuvant and adjuvant therapies variables excluded from the
represented table in the section “Results” are coloured in red.
Variables MINT1 MINT2 MINT31 CDKN2A(p16)
M UM M UM M UM M UM
No. % No. % No. % No. % No. % No. % No. % No. %
14 6.6 197 93.4 31 14.7 180 89.6 32 15.2 179 84.8 24 11.4 187 88.6
Gender Female Male
8 6
57.1 42.9
64
133
32.5 67.5
11 20
35.5 64.5
61
119
33.9 66.1
14 18
43.8 56.3
58
121
32.4 67.6
7
17
29.2 70.8
65
122
34.8 65.2
P=0.080 P=0.841 P=0.229 P=0.654
Age ≤61 >61
6 8
57.1 42.9
108 89
54.8 45.2
12 19
38.7 61.3
102 78
56.7 43.3
16 16
50.0 50.0
98 81
54.7 45.3
11 13
45.8 54.2
103 84
55.1 44.9
P=0.418 P=0.079 P=0.701 P=0.515
Location Rectum Distal Proximal
6 5 3
42.9 35.7 21.4
98 67 32
49.7 34.0 16.3
18 8 5
58.1 25.8 16.1
86 64 30
47.8 35.6 16.7
14 9 9
43.8 28.1 28.1
90 63 26
50.3 35.2 14.5
14 6 4
58.3 25.0 16.7
90 66 31
48.1 35.3 16.6
P=0.840* P=0.520 P=0.160 P=0.574
KRAS WT Mutated ND
5 8 1
38.5 61.5
-
109 75 13
59.2 40.8
-
12 17 2
41.4 58.6
-
102 66 12
60.7 39.3
-
10 20 2
33.3 66.7
-
104 63 12
62.3 37.7
-
9
12 3
42.9 57.1
-
105 71 11
59.7 40.3
-
P=0.158 P=0.067 P=0.004 P=0.164
AJCC stage I&II III&IV ND
5 8 1
38.5 61.5
-
45
151 1
23.0 77.0
-
9
22 -
29.0 71.0
-
41
137 2
22.6 77.4
-
10 22 -
31.3 68.7
-
40
137 2
22.6 77.4
-
5
19 -
24.9 75.1
-
45
140 2
24.3 75.7
-
P=0.310 P=0.496 P=0.367 P=0.804
T T1&T2 T3&T4 ND
2
11 1
15.4 84.6
-
20
176 1
10.2 89.8
-
2
29 -
6.50 93.5
-
20
158 2
11.2 88.8
-
4
28 -
12.5 87.5
-
18
159 2
10.2 89.8
-
2
22 -
8.30 91.7
-
20
165 2
10.8 89.2
-
P=0.632 P=0.542 P=0.754 P=1.000
N N0 N1/(N1&2) N2 ND
9 4 - 1
69.2 30.8
- -
66
126 - 5
34.4 65.6
- -
11 5
14 1
36.6 16.7 46.7
-
64 59 52 5
36.6 33.7 29.7
-
14 6
12 -
43.3 18.8 37.5
-
61 58 54 6
35.3 33.5 31.2
-
8 5
11 -
25.0 29.2 45.8
-
67 59 55 6
37.0 32.6 30.4
-
P=0.017 P=0.097 P=0.253 P=0.275
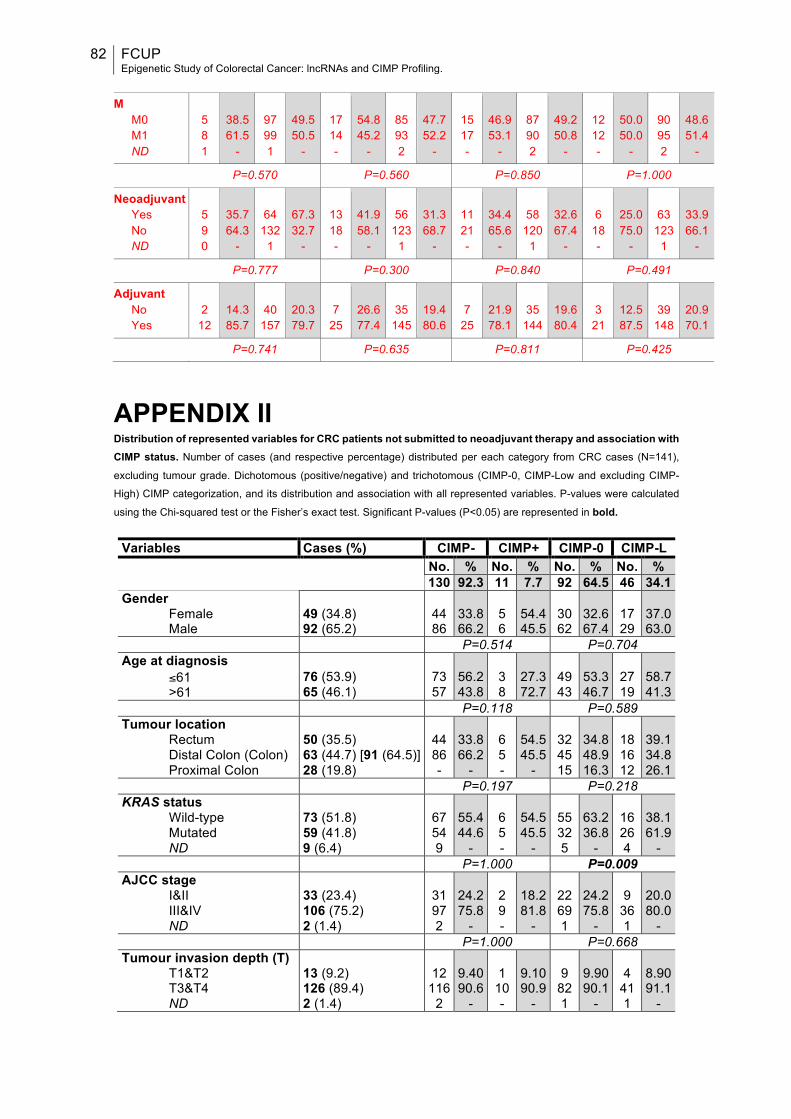
82 FCUP Epigenetic Study of Colorectal Cancer: lncRNAs and CIMP Profiling.
M
M0 M1 ND
5 8 1
38.5 61.5
-
97 99 1
49.5 50.5
-
17 14 -
54.8 45.2
-
85 93 2
47.7 52.2
-
15 17 -
46.9 53.1
-
87 90 2
49.2 50.8
-
12 12 -
50.0 50.0
-
90 95 2
48.6 51.4
-
P=0.570 P=0.560 P=0.850 P=1.000
Neoadjuvant Yes No ND
5 9 0
35.7 64.3
-
64
132 1
67.3 32.7
-
13 18 -
41.9 58.1
-
56
123 1
31.3 68.7
-
11 21 -
34.4 65.6
-
58
120 1
32.6 67.4
-
6
18 -
25.0 75.0
-
63
123 1
33.9 66.1
-
P=0.777 P=0.300 P=0.840 P=0.491
Adjuvant No Yes
2
12
14.3 85.7
40
157
20.3 79.7
7
25
26.6 77.4
35
145
19.4 80.6
7
25
21.9 78.1
35
144
19.6 80.4
3
21
12.5 87.5
39
148
20.9 70.1
P=0.741 P=0.635 P=0.811 P=0.425
APPENDIX II Distribution of represented variables for CRC patients not submitted to neoadjuvant therapy and association with CIMP status. Number of cases (and respective percentage) distributed per each category from CRC cases (N=141),
excluding tumour grade. Dichotomous (positive/negative) and trichotomous (CIMP-0, CIMP-Low and excluding CIMP-
High) CIMP categorization, and its distribution and association with all represented variables. P-values were calculated
using the Chi-squared test or the Fisher’s exact test. Significant P-values (P<0.05) are represented in bold.
Variables Cases (%) CIMP- CIMP+ CIMP-0 CIMP-L No. % No. % No. % No. % 130 92.3 11 7.7 92 64.5 46 34.1 Gender
Female Male
49 (34.8) 92 (65.2)
44 86
33.8 66.2
5 6
54.4 45.5
30 62
32.6 67.4
17 29
37.0 63.0
P=0.514 P=0.704 Age at diagnosis
≤61 >61
76 (53.9) 65 (46.1)
73 57
56.2 43.8
3 8
27.3 72.7
49 43
53.3 46.7
27 19
58.7 41.3
P=0.118 P=0.589 Tumour location
Rectum Distal Colon (Colon) Proximal Colon
50 (35.5) 63 (44.7) [91 (64.5)] 28 (19.8)
44 86 -
33.8 66.2
-
6 5 -
54.5 45.5
-
32 45 15
34.8 48.9 16.3
18 16 12
39.1 34.8 26.1
P=0.197 P=0.218 KRAS status
Wild-type Mutated ND
73 (51.8) 59 (41.8) 9 (6.4)
67 54 9
55.4 44.6
-
6 5 -
54.5 45.5
-
55 32 5
63.2 36.8
-
16 26 4
38.1 61.9
- P=1.000 P=0.009 AJCC stage
I&II III&IV ND
33 (23.4) 106 (75.2) 2 (1.4)
31 97 2
24.2 75.8
-
2 9 -
18.2 81.8
-
22 69 1
24.2 75.8
-
9
36 1
20.0 80.0
- P=1.000 P=0.668 Tumour invasion depth (T)
T1&T2 T3&T4 ND
13 (9.2) 126 (89.4) 2 (1.4)
12
116 2
9.40 90.6
-
1
10 -
9.10 90.9
-
9
82 1
9.90 90.1
-
4
41 1
8.90 91.1
-
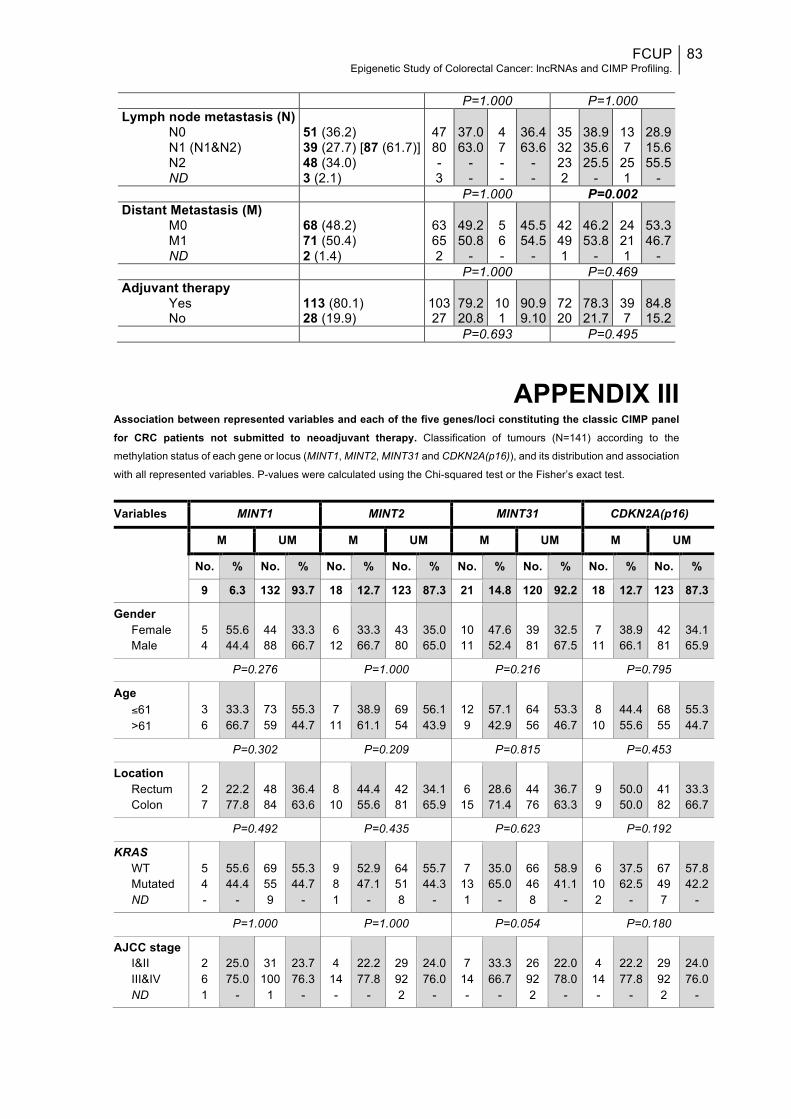
FCUP Epigenetic Study of Colorectal Cancer: lncRNAs and CIMP Profiling.
83
P=1.000 P=1.000 Lymph node metastasis (N)
N0 N1 (N1&N2) N2 ND
51 (36.2) 39 (27.7) [87 (61.7)] 48 (34.0) 3 (2.1)
47 80 - 3
37.0 63.0
- -
4 7 - -
36.4 63.6
- -
35 32 23 2
38.9 35.6 25.5
-
13 7
25 1
28.9 15.6 55.5
- P=1.000 P=0.002 Distant Metastasis (M)
M0 M1 ND
68 (48.2) 71 (50.4) 2 (1.4)
63 65 2
49.2 50.8
-
5 6 -
45.5 54.5
-
42 49 1
46.2 53.8
-
24 21 1
53.3 46.7
- P=1.000 P=0.469 Adjuvant therapy
Yes No
113 (80.1) 28 (19.9)
103 27
79.2 20.8
10 1
90.9 9.10
72 20
78.3 21.7
39 7
84.8 15.2
P=0.693 P=0.495
APPENDIX III Association between represented variables and each of the five genes/loci constituting the classic CIMP panel for CRC patients not submitted to neoadjuvant therapy. Classification of tumours (N=141) according to the
methylation status of each gene or locus (MINT1, MINT2, MINT31 and CDKN2A(p16)), and its distribution and association
with all represented variables. P-values were calculated using the Chi-squared test or the Fisher’s exact test.
Variables MINT1 MINT2 MINT31 CDKN2A(p16)
M UM M UM M UM M UM
No. % No. % No. % No. % No. % No. % No. % No. %
9 6.3 132 93.7 18 12.7 123 87.3 21 14.8 120 92.2 18 12.7 123 87.3
Gender Female Male
5 4
55.6 44.4
44 88
33.3 66.7
6
12
33.3 66.7
43 80
35.0 65.0
10 11
47.6 52.4
39 81
32.5 67.5
7
11
38.9 66.1
42 81
34.1 65.9
P=0.276 P=1.000 P=0.216 P=0.795
Age ≤61 >61
3 6
33.3 66.7
73 59
55.3 44.7
7
11
38.9 61.1
69 54
56.1 43.9
12 9
57.1 42.9
64 56
53.3 46.7
8
10
44.4 55.6
68 55
55.3 44.7
P=0.302 P=0.209 P=0.815 P=0.453
Location Rectum Colon
2 7
22.2 77.8
48 84
36.4 63.6
8
10
44.4 55.6
42 81
34.1 65.9
6
15
28.6 71.4
44 76
36.7 63.3
9 9
50.0 50.0
41 82
33.3 66.7
P=0.492 P=0.435 P=0.623 P=0.192
KRAS WT Mutated ND
5 4 -
55.6 44.4
-
69 55 9
55.3 44.7
-
9 8 1
52.9 47.1
-
64 51 8
55.7 44.3
-
7
13 1
35.0 65.0
-
66 46 8
58.9 41.1
-
6
10 2
37.5 62.5
-
67 49 7
57.8 42.2
-
P=1.000 P=1.000 P=0.054 P=0.180
AJCC stage I&II III&IV ND
2 6 1
25.0 75.0
-
31
100 1
23.7 76.3
-
4
14 -
22.2 77.8
-
29 92 2
24.0 76.0
-
7
14 -
33.3 66.7
-
26 92 2
22.0 78.0
-
4
14 -
22.2 77.8
-
29 92 2
24.0 76.0
-

84 FCUP Epigenetic Study of Colorectal Cancer: lncRNAs and CIMP Profiling.
P=1.000 P=1.000 P=0.274 P=1.000
T T1&T2 T3&T4 ND
1 7 1
12.5 87.5
-
12
119 1
9.20 90.8
-
1
17 -
5.60 94.4
-
12
109 2
9.90 89.3
-
2
19 -
9.50 90.5
-
11
107 2
9.3
90.7 -
1
17 -
5.60 94.4
-
12
109 2
9.90 90.1
-
P=0.554 P=1.000 P=1.000 P=1.000
N N0 N1&2 ND
5 3 1
62.5 37.5
-
46 84 2
35.4 64.6
-
6
12 -
33.3 66.7
-
45 75 3
37.5 62.5
-
9
12 -
42.9 57.1
-
42 75 3
35.9 64.1
-
6
12 -
33.3 66.7
-
45 75 3
37.5 32.5
-
P=0.145 P=0.799 P=0.625 P=0.799
M M0 M1 ND
2 6 1
25.0 75.0
-
66 65 1
50.4 49.6
-
11 7 -
61.1 38.9
-
57 64 2
47.1 52.9
-
12 9 -
57.1 42.9
-
56 63 2
47.5 52.5
-
10 8 -
55.6 44.4
-
58 63 2
47.9 52.1
-
P=0.275 P=0.318 P=0.481 P=0.618
Adjuvant No Yes
1 8
11.1 88.9
27
105
20.5 79.5
3
15
16.7 83.3
25 98
20.3 79.7
5
16
23.8 76.2
23 97
19.2 81.8
2
16
11.1 88.9
26 97
21.1 78.9
P=0.688 P=1.000 P=0.568 P=0.527
APPENDIX IV Univariable and multivariable prognostic analyses: disease-specific survival analysis of CRC patients not submitted to neoadjuvant therapy according to represented variables and CIMP panel/markers methylation.
Multivariable analysis was performed considering only those variables presenting a P-value<0.05 in the univariable
analysis (excluding T, N and M stages). Significant P-values (P<0.05) are represented in bold.
Variables Univariable analysis Multivariable analysis HR (95 % CI) P HR (95 % CI) P Gender
Female (49) Male (92)
1 (referent)
0.877 (0.598-1.286)
-
0.502
Age ≤61 (76) >61 (65)
1 (referent)
1.544 (1.072-2.222)
-
0.020
1 (referent)
1.523 (1.046-2.217)
-
0.028 Location
Rectum (50) Distal (63) Proximal (28)
0.789 (0.455-1.199) 0.739 (0.419-1.131)
1 (referent)
0.318 0.141 0.221
-
KRAS WT (73) Mutated (59)
1 (referent)
0.872 (0.596-1.274)
-
0.478
AJCC stage I & II (33) III (35) IV (71)
0.525 (0.332-0.830) 0.571 (0.365-0.891)
1 (referent)
0.006 0.006 0.014
-
0.481 (0.303-0.763) 0.513 (0.326-0.807)
1 (referent)
0.001 0.002 0.004
-
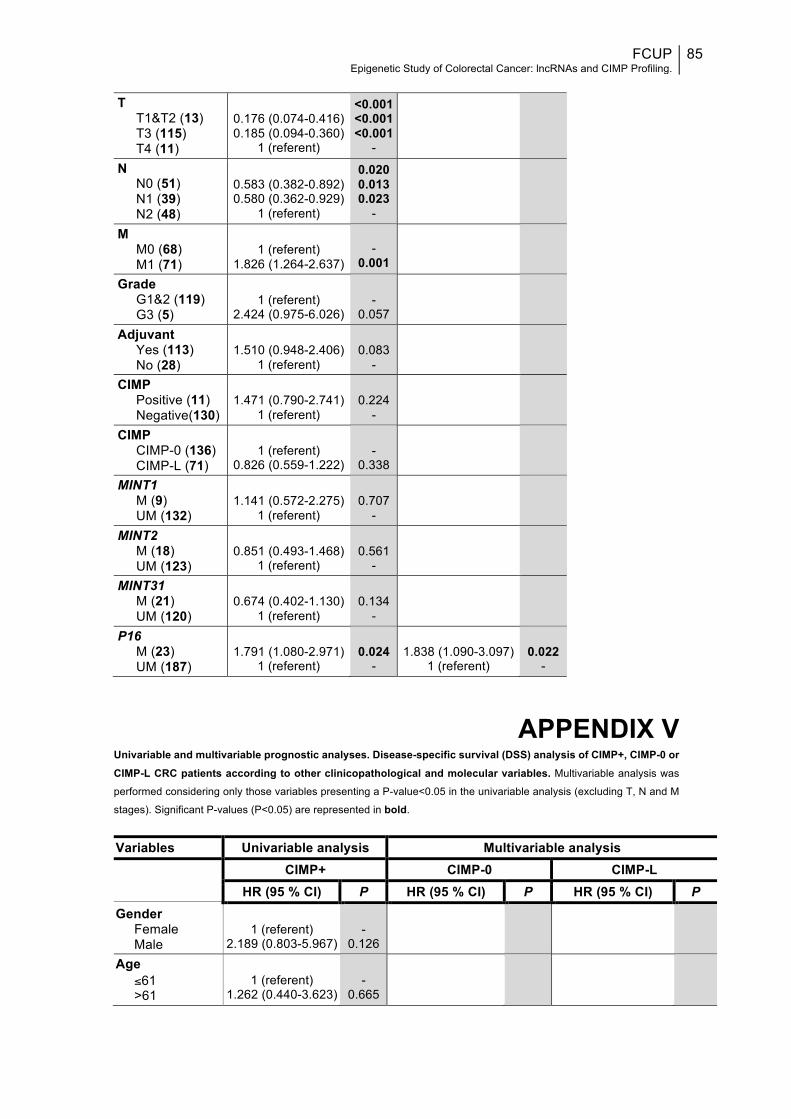
FCUP Epigenetic Study of Colorectal Cancer: lncRNAs and CIMP Profiling.
85
T
T1&T2 (13) T3 (115) T4 (11)
0.176 (0.074-0.416) 0.185 (0.094-0.360)
1 (referent)
<0.001 <0.001 <0.001
-
N N0 (51) N1 (39) N2 (48)
0.583 (0.382-0.892) 0.580 (0.362-0.929)
1 (referent)
0.020 0.013 0.023
-
M M0 (68) M1 (71)
1 (referent)
1.826 (1.264-2.637)
-
0.001
Grade G1&2 (119) G3 (5)
1 (referent)
2.424 (0.975-6.026)
-
0.057
Adjuvant Yes (113) No (28)
1.510 (0.948-2.406)
1 (referent)
0.083
-
CIMP Positive (11) Negative(130)
1.471 (0.790-2.741)
1 (referent)
0.224
-
CIMP CIMP-0 (136) CIMP-L (71)
1 (referent)
0.826 (0.559-1.222)
-
0.338
MINT1 M (9) UM (132)
1.141 (0.572-2.275)
1 (referent)
0.707
-
MINT2 M (18) UM (123)
0.851 (0.493-1.468)
1 (referent)
0.561
-
MINT31 M (21) UM (120)
0.674 (0.402-1.130)
1 (referent)
0.134
-
P16 M (23) UM (187)
1.791 (1.080-2.971)
1 (referent)
0.024
-
1.838 (1.090-3.097)
1 (referent)
0.022
-
APPENDIX V Univariable and multivariable prognostic analyses. Disease-specific survival (DSS) analysis of CIMP+, CIMP-0 or CIMP-L CRC patients according to other clinicopathological and molecular variables. Multivariable analysis was
performed considering only those variables presenting a P-value<0.05 in the univariable analysis (excluding T, N and M
stages). Significant P-values (P<0.05) are represented in bold.
Variables Univariable analysis Multivariable analysis
CIMP+ CIMP-0 CIMP-L
HR (95 % CI) P HR (95 % CI) P HR (95 % CI) P Gender
Female Male
1 (referent)
2.189 (0.803-5.967)
-
0.126
Age ≤61 >61
1 (referent)
1.262 (0.440-3.623)
-
0.665
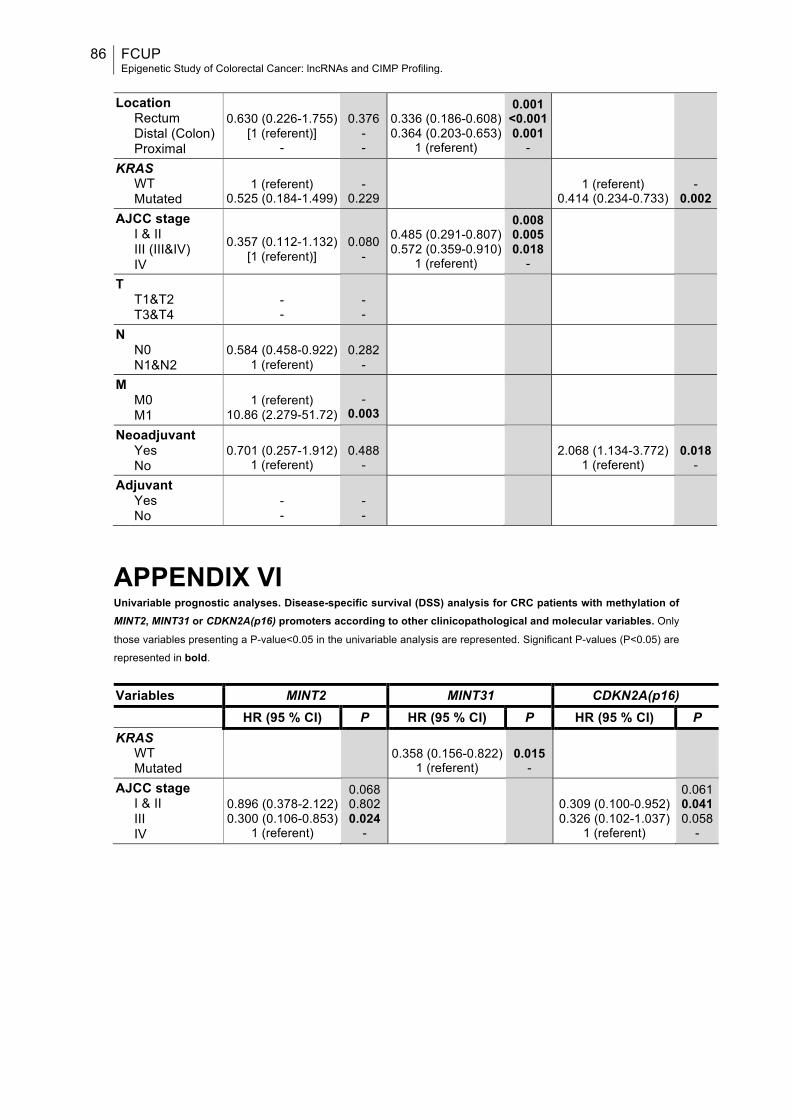
86 FCUP Epigenetic Study of Colorectal Cancer: lncRNAs and CIMP Profiling.
Location
Rectum Distal (Colon) Proximal
0.630 (0.226-1.755)
[1 (referent)] -
0.376
- -
0.336 (0.186-0.608) 0.364 (0.203-0.653)
1 (referent)
0.001 <0.001 0.001
-
KRAS WT Mutated
1 (referent)
0.525 (0.184-1.499)
-
0.229
1 (referent)
0.414 (0.234-0.733)
-
0.002 AJCC stage
I & II III (III&IV) IV
0.357 (0.112-1.132)
[1 (referent)]
0.080
-
0.485 (0.291-0.807) 0.572 (0.359-0.910)
1 (referent)
0.008 0.005 0.018
-
T T1&T2 T3&T4
- -
- -
N N0 N1&N2
0.584 (0.458-0.922)
1 (referent)
0.282
-
M M0 M1
1 (referent)
10.86 (2.279-51.72)
-
0.003
Neoadjuvant Yes No
0.701 (0.257-1.912)
1 (referent)
0.488
-
2.068 (1.134-3.772)
1 (referent)
0.018
- Adjuvant
Yes No
- -
- -
APPENDIX VI Univariable prognostic analyses. Disease-specific survival (DSS) analysis for CRC patients with methylation of MINT2, MINT31 or CDKN2A(p16) promoters according to other clinicopathological and molecular variables. Only
those variables presenting a P-value<0.05 in the univariable analysis are represented. Significant P-values (P<0.05) are
represented in bold.
Variables MINT2 MINT31 CDKN2A(p16) HR (95 % CI) P HR (95 % CI) P HR (95 % CI) P KRAS
WT Mutated
0.358 (0.156-0.822) 1 (referent)
0.015
-
AJCC stage I & II III IV
0.896 (0.378-2.122) 0.300 (0.106-0.853)
1 (referent)
0.068 0.802 0.024
-
0.309 (0.100-0.952) 0.326 (0.102-1.037)
1 (referent)
0.061 0.041 0.058
-

FCUP Epigenetic Study of Colorectal Cancer: lncRNAs and CIMP Profiling.
87
APPENDIX VII Univariable prognostic analyses. Disease-specific survival (DSS) analysis for male patients, patients that were 61 or younger or patients with tumour located in the proximal colon, according to CIMP panel/markers methylation. Only those variables presenting a P-value<0.05 in the univariable analysis are represented.
Variables Male ≤61 Proximal colon HR (95 % CI) P HR (95 % CI) P HR (95 % CI) P CIMP
CIMP-0 CIMP-L
1 (referent) 0.369 (0.168-0.810)
-
0.013 P16
M UM
1.734 (1.020-2.946)
1 (referent)
0.042
-
2.168 (1.105-4.253)
1 (referent)
0.024
-
APPENDIX VIII Univariable prognostic analyses. Disease-specific survival (DSS) analysis for patients with KRAS WT patients, patients with mutated KRAS or patients not submitted to adjuvant therapy, according to CIMP panel/markers methylation. Only those variables presenting a P-value<0.05 in the univariable analysis are represented.
Variables KRAS WT KRAS Mutation No Adjuvant HR (95 % CI) P HR (95 % CI) P HR (95 % CI) P CIMP
CIMP-0 CIMP-L
1 (referent)
1.871 (1.159-3.021)
-
0.010
1 (referent)
0.554 (0.343-0.893)
-
0.015
MINT31 M UM
0.535 (0.305-0.938) 1 (referent)
0.029
-
0.377 (0.144-0.984)
1 (referent)
0.046
-