lmxb populations in galaxy outskirts: globular clusters
TRANSCRIPT
arX
iv:1
211.
0399
v1 [
astr
o-ph
.HE
] 2
Nov
201
2Astronomy & Astrophysicsmanuscript no. ms c© ESO 2012November 5, 2012
LMXB populations in galaxy outskirts:globular clusters and supernova kicks
Zhongli Zhang1, Marat Gilfanov1,2, andAkos Bogdan3
1 Max-Planck Institut fur Astrophysik, Karl-Schwarzschild-Straße 1, D-85741 Garching, Germany2 Space Research Institute, Russian Academy of Sciences, Profsuyuznaya 84/32, 117997 Moscow, Russia3 Smithsonian Astrophysical Observatory, 60 Garden Street,Cambridge, MA 02138, USA, Einstein Fellow
email:[zzhang;gilfanov]@mpa-garching.mpg.de
Received .../ Accepted ...
ABSTRACT
For the first time, we systematically explored the population of discrete X-ray sources in the outskirt of early-type galaxies. Basedon a broad sample of 20 galaxies observed withChandra we revealed overdensity of X-ray sources in their outskirts. They appear ashalos of resolved sources around galaxies, distributing much broader than the stellar light, and extended out to at least ∼ 10re (re isthe effective radius). These halos are composed of sources fainterthan∼ 5 × 1038 erg/s, whereas the more luminous sources appearto follow the distribution of stellar light, suggesting that the excess source population consists of neutron star binaries. Dividing thegalaxy sample into four groups according to their stellar mass and specific frequency of globular cluster, we find that theextendedhalos are present in all groups except for the low mass galaxies with low globular cluster content. We propose that the extended halosmay be comprised of two independent components: (i) LMXBs located in blue (metal-poor) globular clusters (GCs), which GCs areknown to have a broader distribution than the stellar light;(ii) neutron star LMXBs kicked out of the main body of the parent galaxyby the supernova explosion. The available deep optical and X-ray data of NGC 4365 supports this conclusion. For this galaxy weidentified 60.1 ± 10.8 excess sources in the (4 – 10)re region of which∼ 40% are located in globular clusters, whereas∼ 60% arefield LMXBs. We interpret the latter as kicked NS LMXBs. We discuss implications of these results for the natal kick distributions ofblack holes and neutron stars.
Key words. X-rays:binaries - globular clusters: general - Galaxy: halo - supernovae: general
1. Introduction
LMXBs consist of a compact object – either a black hole (BH) ora neutron star (NS) – and a low-mass donor star (. 1 M⊙), whichtransfers mass via Roche-lobe overflow. The infalling matter isheated to X-ray temperatures and releases X-ray luminositiesin the range of 1035 − 1039 erg/s. Due to their luminous na-ture, LMXBs add a major contribution to the total X-ray emis-sion of galaxies, moreover they determine the X-ray appearanceof relatively gas-poor early-type galaxies (e.g. Gilfanov2004;Bogdan & Gilfanov 2011). The populations of LMXBs havebeen extensively studied in early-type galaxies withChandraobservations (e.g. Irwin et al. 2003; Gilfanov 2004; Zhang et al.2011; Colbert et al. 2004) and a simple picture of the correla-tion of their properties with the parameters of the host galaxyemerged. It has been established that LMXB population scaleswith the stellar mass of the host galaxy. For luminous LMXBs(LX > 3 × 1038 erg/s), it also has been shown that their sur-face density closely follows the near-infrared light distribution(Gilfanov 2004), except for the very inner regions of galaxies(Voss & Gilfanov 2007). However, in the course of more thanten years of operation ofChandra, a large number of early-type galaxies has been observed to a fairly deep sensitivitylimit(LX ∼ 1037 erg/s), allowing to probe LMXB populations in un-precedented details.
Such a detailed study of LMXB populations has been per-formed for Sombrero galaxy (M104) by Li et al. (2010). Theirresults appear to challenge the empirical picture that the LMXBpopulations closely follow the stellar light distributionat all
galactocentric radii. As opposed to the expectations, the outskirtof Sombrero exhibits a significant X-ray source excess. In thehalo of this galaxy 101 sources were detected, whereas the ex-pected number of cosmic X-ray background (CXB) sources is52±11, implying a∼ 4.4σ excess. Although Li et al. (2010) didnot identify the origins of the excess X-ray sources, they consid-ered that either supernova kicked binary systems and/or LMXBsassociated with GCs could be responsible.
GCs have a bimodal color distribution (Forbes et al. 1997).The red (metal-rich) population follows the stellar light distribu-tion, whereas the blue (metal-poor) population has broaderdis-tribution and traces the more extended dark matter halos (e.g.,Bassino et al. 2006). Since few percent of blue GCs host LMXBs(Kundu et al. 2002; Jordan et al. 2004), it is likely that LMXBsassociated with blue GCs will have a broader distribution thanthe stellar light. This effect could result in an extended popula-tion of LMXBs in the outskirts of galaxies. Obviously, the im-portance of GC-LMXBs is expected to be more prominent ingalaxies with higher globular cluster specific frequency (S N).
Neutron stars receive kicks (so called natal kicks) when theyare formed in the core collapse supernova explosions. The am-plitude of the natal kick velocities can be determined, for ex-ample, from proper motion of pulsars, the mean birth speed foryoung pulsars is≈ 400 km/s with the fastest neutron stars mov-ing with the velocity in excess of∼ 103 km/s (Hobbs et al. 2005).Although only a relatively small fraction of binary systemscansurvive large natal kicks (Brandt & Podsiadlowski 1995), thosedo survive, can travel to large distances producing a distribution
1
Zhongli Zhang et al.: LMXB populations in galaxy outskirts
Table 1. The galaxy sample.
Galaxy D Scale re b/a PA LK M⋆/LK M⋆ S N Age Exp Linlim/L
outlim
(Mpc) (pc/arcsec) (arcsec) (degree) (1010LK,⊙) (M⊙/LK,⊙) (1010M⊙) (Gyr) (ks) (1037 erg/s)(1) (2) (3) (4) (5) (6) (7) (8) (9) (10) (11) (12)
N720 27.7 134 25.2 0.55 -40.0 21.50 0.86 18.49 1.01a 3.4aa 138.8 5.6/4.1N821 24.1 117 19.6 0.62 30.0 9.12 0.82 7.48 1.14b 5.2bb 212.9 2.0/2.0N1052 19.4 94 18.6 0.70 -60.0 8.94 0.80 7.15 1.59c 14.5cc 59.2 3.9/2.5N1380 17.6 85 31.8 0.44 7.0 12.57 0.81 10.18 1.81d 4.4cc 41.6 3.5/2.9N1404 21.0 102 18.6 0.90 -17.0 18.73 0.85 15.92 1.69e 5.9aa 114.5 5.7/2.9N3115 9.7 47 33.6 0.39 45.0 9.43 0.83 7.83 2.22f 8.4bb 153.2 0.45/0.42N3379 10.6 51 28.5 0.85 67.0 7.92 0.83 6.57 1.20g 8.2bb 337.0 0.33/0.33N3585 20.0 97 29.9 0.63 -75.0 18.92 0.77 14.57 0.50h 3.1aa 94.7 2.6/2.7N3923 22.9 111 40.5 0.64 47.0 29.90 0.82 24.52 3.57i 3.3dd 102.1 3.6/3.4N4125 23.9 116 31.4 0.63 82.0 23.49 0.80 18.79 1.30h 5.0ee 64.2 4.4/4.1N4278 16.1 78 18.3 0.90 35.0 7.87 0.78 6.14 5.35f 12.5bb 470.8 0.62/0.60N4365 20.4 99 38.1 0.74 45.0 20.86 0.85 17.73 3.95j 7.9bb 195.8 1.5/1.5N4374 18.4 89 33.5 0.92 -57.0 24.94 0.83 20.70 5.39k 9.8cc 115.5 1.7/2.2N4382 18.5 90 54.9 0.67 12.0 27.06 0.76 20.57 1.43k 1.6aa 39.7 2.9/4.1N4472 16.3 79 56.1 0.81 -17.0 41.88 0.85 35.60 6.61k 9.6bb 89.6 3.2/3.7N4552 15.3 74 22.8 0.94 -30.0 10.82 0.83 8.98 2.99k 6.0cc 54.4 1.8/1.8N4636 14.7 71 56.2 0.84 -37.0 13.24 0.81 10.72 12.38l 13.5cc 209.8 1.4/1.4N4649 16.8 81 42.1 0.81 -72.0 32.44 0.85 27.57 5.32k 16.9bb 108.0 2.3/2.3N4697 11.7 57 39.5 0.63 67.0 8.82 0.77 6.79 3.78m 10.0cc 193.0 0.59/0.59N5866 15.3 74 28.5 0.42 -57.0 9.47 0.72 6.82 1.69n 1.8aa 33.7 2.1/1.9
Notes. (1) – Galaxy distance derived by Tonry et al. (2001). (2) – Scale conversion. (3), (4) and (5) –KS-band half-light radius, axis-ratio andposition angle from the 2MASS Large Galaxy Atlas (Jarrett etal. 2003). (6) – TotalKS-band luminosity calculated from the total apparentKS-band magnitude. (7) –KS-band mass-to-light ratios derived from Bell & de Jong (2001), with B−V colors from RC3 catalog (de Vaucouleurs et al.1991). (8) – Total stellar mass calculated fromKS-band total luminosity and theKS-band mass-to-light ratio. (9) – Globular cluster specific frequen-cies derived following Zhang et al. (2012). References for the number of observed globular clusters in each galaxy are –aKissler-Patig et al. (1996);bSpitler et al. (2008);cForbes et al. (2001);dKissler-Patig et al. (1997);eForbes et al. (1998);f Harris (1991);gRhode & Zepf (2004);hHumphrey(2009); iSikkema et al. (2006);jForbes (1996);kPeng et al. (2008);lDirsch et al. (2005);mDirsch (1996);nCantiello et al. (2007). (10) – Stellarage of the galaxy. References –aaTerlevich & Forbes (2002);bbSanchez-Blazquez et al. (2006);ccAnnibali et al. (2007);ddThomas et al. (2005);eeSchweizer & Seitzer (1992). (11) – Total exposure time of thecombinedChandra observations. (12) – Limiting source detection sensitivity inthe 0.5− 8 keV band in the (0.2 – 3)re (Lin
lim) and outer (4 – 10)re (Loutlim) regions.
much broader than that of stars. The effect of the natal kicks onbinaries should be stronger in lower mass galaxies, where kickvelocities may exceed the escape velocity in the gravitationalpotential of the parent galaxy, and binary systems may leavethegalaxy or be displaced to very large distance from its main body,where binaries were formed.
In this paper, we aim to comprehensively explore the LMXBpopulations in a large sample of galaxy outskirts with the lim-iting sensitivity of∼ 1037 erg s−1. We will address two majorpoints. First, we will investigate whether the existence ofex-cess LMXBs is ubiquitous in the outskirts of early-type galax-ies. Second, we will study the origin of the excess sources witha particular focus on GC-LMXBs and supernova kicked X-raybinaries. To achieve our goals, we will use a sample of 20 early-type galaxies with deepChandra observations. Since our galaxysample covers a broad range in both stellar mass and globularcluster specific frequency, we will be able to perform a system-atic study and address the importance of GC-LMXBs and super-nova kicked LMXBs.
The paper is structured as follows. In Sect. 2 we introducethe analyzed sample. In Sect. 3 the X-ray and near-infrared dataanalysis is described. In Sect. 4 and Sect. 5, we discuss the ra-dial distributions and the X-ray luminosity distributionsof thedetected X-ray sources. In Sect. 6 we describe a case study forNGC 4365. Our results are discussed in Sect. 7 and we concludein Sect. 8.
2. The analyzed sample
In the present work we explore the LMXB populations in theoutskirts of early-type (E/S0) galaxies. To achieve this goal andobtain statistically significant conclusions, a broad sample ofgalaxies must be analyzed. In Zhang et al. (2012) we carefullybuilt a sample of 20 galaxies, which also well suits the pro-posed goals of the present analysis for the following four rea-sons. First, the sample consists of galaxies within the distancerange of 9.7−27.7 Mpc. Therefore, adequate (∼ 5×1037 erg s−1)source detection sensitivities can be achieved with moderatelydeep (< 150 ks) Chandra exposures, and the sample galax-ies and their outskirts fit well within the ACIS field-of-view.Second, the sample includes both GC-rich and GC-poor galaxies(S N= 0.50− 12.38). Third, the sample covers a relatively broadrange of stellar masses (M⋆ = (6.1− 35.6)× 1010 M⊙), imply-ing vastly different numbers of field LMXBs, as well as differentdark matter halo masses. Finally, the selected galaxies do not ex-hibit ongoing or recent star-formation, hence their stellar contentis fairly homogeneous and the population of X-ray binaries is notpolluted by high-mass X-ray binaries. The physical properties ofthe sample galaxies are listed in Table 1.
2
Zhongli Zhang et al.: LMXB populations in galaxy outskirts
Table 2. The statistics of X-ray point sources.
Galaxy N inX N in
CXB N inKS Nout
X NoutCXB Nout
KS(1) (2) (3) (4) (5) (6)
N720 50 1.6 31.7 58 16.8 7.9N821 34 1.9 43.6 23 16.5 13.9N1052 28 0.9 18.8 19 7.6 6.2N1380 27 1.5 31.0 14 12.4 3.2N1404 18 0.9 19.6 33 12.1 8.1N3115 61 2.8 86.7 54 21.6 12.9N3379 68 6.4 86.1 58 45.4 12.5N3585 49 2.9 63.6 44 21.8 8.3N3923 76 4.9 67.9 64 26.9 6.5N4125 31 2.6 38.0 33 23.1 3.8N4278 108 3.0 60.1 94 27.6 12.8N4365 153 7.8 117.7 116 44.6 11.3N4374 96 5.0 77.9 65 30.6 12.4N4382 37 7.2 72.9 30 18.1 2.4N4472 151 8.7 126.6 55 17.3 9.1N4552 52 1.9 29.7 64 18.1 8.7N4636 116 11.5 59.0 71 30.5 0.1N4649 157 4.8 83.4 100 26.8 6.3N4697 80 6.9 74.0 69 39.4 7.7N5866 20 1.2 29.0 13 10.4 4.0Total 1412 84.4 1217.3 1077 467.6 158.1
Notes. (1), (2) and (3) – Number of detected X-ray sources, estimatedCXB sources, and estimated LMXBs fromKS-band light in the (0.2– 3)re region. (4), (5) and (6) – The same quantities in the (4 – 10)re
region.
3. Data analysis
3.1. Chandra data
The analyzedChandra observations and the main steps of thedata analysis agree with those outlined in Zhang et al. (2012).The data was reduced using standard CIAO threads (CIAO ver-sion 4.2; CALDB version 4.2.1). To detect point sources, weapplied the CIAOwavdetect task with parameters taken fromVoss & Gilfanov (2006, 2007). Namely, we set the threshold pa-rameter (sigthresh) to 10−6, which implies 1 false detection per106 pixels or one ACIS-S CCD. The source detection was per-formed in the 0.5 − 8 keV band. To increase the source detec-tion sensitivity, we did not exclude high background periods,since they are outweighed by the increased exposure time. Weproduced exposure maps in the 0.5 − 8 keV band, assuming asingle power-law model withΓ = 1.7 and Galactic absorption.Several galaxies in our sample have been observed in multipleChandra pointings, therefore we corrected the offsets followingVoss & Gilfanov (2007) using the CIAOreproject events tool.After correcting the offsets, the images were combined and re-analyzed.
To compute the source net counts, we employed circularapertures centered on the central coordinates of each source. Theradius of the aperture was defined as a circle, which includes85% of the point spread function (PSF) value. For each source,the PSF was determined using the CIAOmkpsf tool. To accountfor the background components, we applied circular regionswith three times the radius of the source regions, while the over-lapping regions of adjacent sources were excluded. The sourcenet counts were derived following Voss & Gilfanov (2007). Theobserved net counts were converted to 0.5− 8 keV band unab-sorbed luminosities assuming a power-law spectrum (Γ = 1.7)with Galactic absorption.
The source detection sensitivity varies throughout theChandra images due to the varying level of the diffuse X-rayemission associated with the galaxy, the PSF deteriorationatlarge off-axis angles, and the non-uniform exposure of the (com-bined) images. For the combined images, we derived the sourcedetection sensitivities by inverting the detection method, us-ing the local PSF, background, and exposure (Voss & Gilfanov2006). The incompleteness function,K(L), in a certain area wascalculated by accumulating the sensitivities of the pixelsin-cluded in the area, weighted by the assumed spatial distributionof sources. Thus,K(L) was computed separately for the CXBsources with a flat spatial distribution, and for LMXBs assum-ing that they follow theKS-band stellar light. We used thesefunctions to calculate the number of predicted CXB sources(Georgakakis et al. 2008) and LMXBs (Table 2), and to obtaintheir predicted radial source density profiles (Sect. 4.1).The in-completeness function was also used to correct apparent X-rayluminosity functions (XLFs), and to produce the final XLFs pre-sented in Sect. 5.2.
The contribution of CXB sources is estimated based on theirluminosity function from Georgakakis et al. (2008). To converttheir 0.5− 10 keV band logN − logS distribution to the 0.5− 8keV band, we assumed a power-law model withΓ = 1.4. Withinthe central regions of the galaxies, the contribution of CXBsources is. 10% (Table 2). Although in the outskirts of thesample galaxies the ratio of predicted CXB sources is signifi-cantly higher (Table 2), in most galaxies a statistically signifi-cant source excess is detected above the predicted CXB level.We stress that the excess sources cannot be attributed to thecosmic variance, which can be responsible for variations onthe∼ 10− 30% level. The accuracy of CXB subtraction is furtherdiscussed in Sect. 5.1.
3.2. Near-infrared data analysis
To trace the stellar light of the sample galaxies, we relied on theKS-band (2.16µm) images of the 2MASS Large Galaxy Atlas(Jarrett et al. 2003). The provided images are background sub-tracted, except for NGC 821 and NGC 1052, where we esti-mated the background level using nearby regions. To avoid pol-lution by bright foreground and background objects, we visuallyidentified and removed them. We converted the observed num-ber of KS-band source counts (S ) to apparent magnitudes usingmK = KMAGZP − 2.5 logS, where KMAGZP is the zero pointmagnitude for theKS-band image. The thus obtained magnitudeswere used to computeKS-band luminosities, assuming that theabsoluteKS-band magnitude of the Sun isMK,⊙ = 3.39 mag.
Based on theKS-band luminosities and theKS-band mass-to-light ratios, we derived the stellar mass of the sample galaxies(Table 1). The mass-to-light ratios were derived from theB − Vcolor indices (RC3 catalog; de Vaucouleurs et al. 1991) and theresults of galaxy evolution modeling (Bell & de Jong 2001).
4. Excess X-ray sources in galaxy outskirts
4.1. Radial distributions of all galaxies
To map the spatial distribution of X-ray sources in and aroundthe sample galaxies, we built stacked radial source densitypro-files (Fig. 1). The profiles were extracted from concentric el-lipses, whose shape and orientations were determined by theKS-band photometry of the galaxies (Table 1). The contributionofCXB sources was subtracted as described in Sect. 3.1. The ob-
3
Zhongli Zhang et al.: LMXB populations in galaxy outskirts
0.1
110
100
N /
arcm
in2
All sources
1 100.2 0.5 2 5
0.01
0.1
110
100
N /
arcm
in2
re
Bright sources
> 5×1038 erg/s
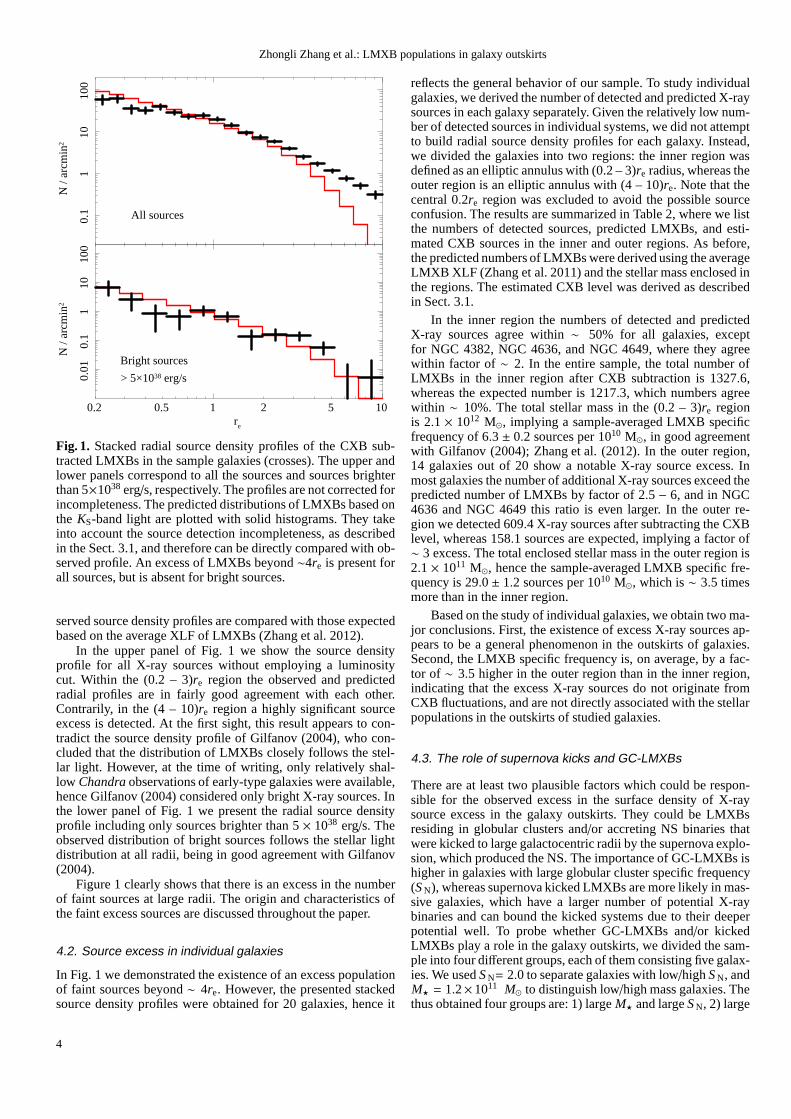
Fig. 1. Stacked radial source density profiles of the CXB sub-tracted LMXBs in the sample galaxies (crosses). The upper andlower panels correspond to all the sources and sources brighterthan 5×1038 erg/s, respectively. The profiles are not corrected forincompleteness. The predicted distributions of LMXBs based onthe KS-band light are plotted with solid histograms. They takeinto account the source detection incompleteness, as describedin the Sect. 3.1, and therefore can be directly compared withob-served profile. An excess of LMXBs beyond∼4re is present forall sources, but is absent for bright sources.
served source density profiles are compared with those expectedbased on the average XLF of LMXBs (Zhang et al. 2012).
In the upper panel of Fig. 1 we show the source densityprofile for all X-ray sources without employing a luminositycut. Within the (0.2 – 3)re region the observed and predictedradial profiles are in fairly good agreement with each other.Contrarily, in the (4 – 10)re region a highly significant sourceexcess is detected. At the first sight, this result appears tocon-tradict the source density profile of Gilfanov (2004), who con-cluded that the distribution of LMXBs closely follows the stel-lar light. However, at the time of writing, only relatively shal-low Chandra observations of early-type galaxies were available,hence Gilfanov (2004) considered only bright X-ray sources. Inthe lower panel of Fig. 1 we present the radial source densityprofile including only sources brighter than 5× 1038 erg/s. Theobserved distribution of bright sources follows the stellar lightdistribution at all radii, being in good agreement with Gilfanov(2004).
Figure 1 clearly shows that there is an excess in the numberof faint sources at large radii. The origin and characteristics ofthe faint excess sources are discussed throughout the paper.
4.2. Source excess in individual galaxies
In Fig. 1 we demonstrated the existence of an excess populationof faint sources beyond∼ 4re. However, the presented stackedsource density profiles were obtained for 20 galaxies, henceit
reflects the general behavior of our sample. To study individualgalaxies, we derived the number of detected and predicted X-raysources in each galaxy separately. Given the relatively lownum-ber of detected sources in individual systems, we did not attemptto build radial source density profiles for each galaxy. Instead,we divided the galaxies into two regions: the inner region wasdefined as an elliptic annulus with (0.2 – 3)re radius, whereas theouter region is an elliptic annulus with (4 – 10)re. Note that thecentral 0.2re region was excluded to avoid the possible sourceconfusion. The results are summarized in Table 2, where we listthe numbers of detected sources, predicted LMXBs, and esti-mated CXB sources in the inner and outer regions. As before,the predicted numbers of LMXBs were derived using the averageLMXB XLF (Zhang et al. 2011) and the stellar mass enclosed inthe regions. The estimated CXB level was derived as describedin Sect. 3.1.
In the inner region the numbers of detected and predictedX-ray sources agree within∼ 50% for all galaxies, exceptfor NGC 4382, NGC 4636, and NGC 4649, where they agreewithin factor of∼ 2. In the entire sample, the total number ofLMXBs in the inner region after CXB subtraction is 1327.6,whereas the expected number is 1217.3, which numbers agreewithin ∼ 10%. The total stellar mass in the (0.2 – 3)re regionis 2.1 × 10¹² M⊙, implying a sample-averaged LMXB specificfrequency of 6.3± 0.2 sources per 1010 M⊙, in good agreementwith Gilfanov (2004); Zhang et al. (2012). In the outer region,14 galaxies out of 20 show a notable X-ray source excess. Inmost galaxies the number of additional X-ray sources exceedthepredicted number of LMXBs by factor of 2.5− 6, and in NGC4636 and NGC 4649 this ratio is even larger. In the outer re-gion we detected 609.4 X-ray sources after subtracting the CXBlevel, whereas 158.1 sources are expected, implying a factor of∼ 3 excess. The total enclosed stellar mass in the outer regionis2.1× 1011 M⊙, hence the sample-averaged LMXB specific fre-quency is 29.0± 1.2 sources per 1010 M⊙, which is∼ 3.5 timesmore than in the inner region.
Based on the study of individual galaxies, we obtain two ma-jor conclusions. First, the existence of excess X-ray sources ap-pears to be a general phenomenon in the outskirts of galaxies.Second, the LMXB specific frequency is, on average, by a fac-tor of ∼ 3.5 higher in the outer region than in the inner region,indicating that the excess X-ray sources do not originate fromCXB fluctuations, and are not directly associated with the stellarpopulations in the outskirts of studied galaxies.
4.3. The role of supernova kicks and GC-LMXBs
There are at least two plausible factors which could be respon-sible for the observed excess in the surface density of X-raysource excess in the galaxy outskirts. They could be LMXBsresiding in globular clusters and/or accreting NS binaries thatwere kicked to large galactocentric radii by the supernova explo-sion, which produced the NS. The importance of GC-LMXBs ishigher in galaxies with large globular cluster specific frequency(S N), whereas supernova kicked LMXBs are more likely in mas-sive galaxies, which have a larger number of potential X-raybinaries and can bound the kicked systems due to their deeperpotential well. To probe whether GC-LMXBs and/or kickedLMXBs play a role in the galaxy outskirts, we divided the sam-ple into four different groups, each of them consisting five galax-ies. We usedS N= 2.0 to separate galaxies with low/highS N, andM⋆ = 1.2×10¹¹ M⊙ to distinguish low/high mass galaxies. Thethus obtained four groups are: 1) largeM⋆ and largeS N, 2) large
4
Zhongli Zhang et al.: LMXB populations in galaxy outskirts
1 100.5 2 50.01
0.1
110
100
N /
arcm
in2
re
Large M* , Large SN :
N3923 N4365 N4374 N4472 N4649
1 100.5 2 50.01
0.1
110
100
N /
arcm
in2
re
Large M* , Small SN :
N0720 N1404 N3585 N4125 N4382
1 100.5 2 50.01
0.1
110
100
N /
arcm
in2
re
Small M* , Large SN :
N3115 N4278 N4552 N4636 N4697
1 100.5 2 50.01
0.1
110
100
N /
arcm
in2
re
Small M* , Small SN :
N0821 N1052 N1380 N3379 N5866
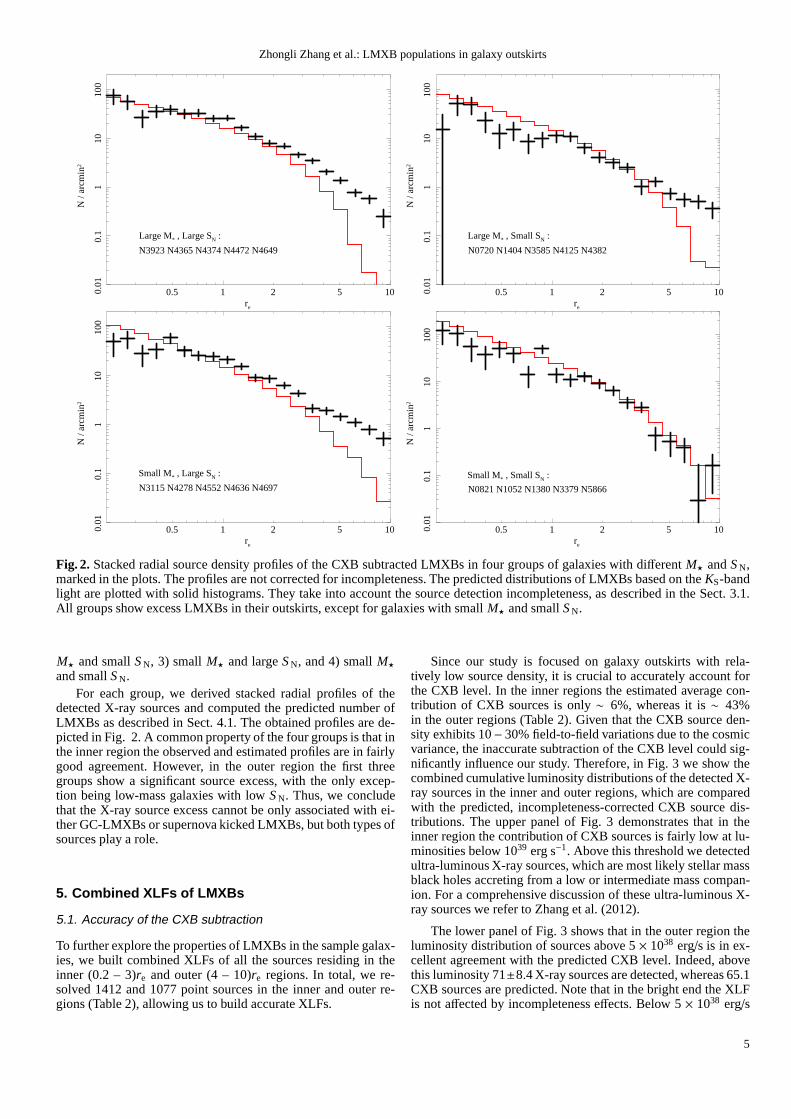
Fig. 2. Stacked radial source density profiles of the CXB subtractedLMXBs in four groups of galaxies with differentM⋆ andS N,marked in the plots. The profiles are not corrected for incompleteness. The predicted distributions of LMXBs based on theKS-bandlight are plotted with solid histograms. They take into account the source detection incompleteness, as described in the Sect. 3.1.All groups show excess LMXBs in their outskirts, except for galaxies with smallM⋆ and smallS N.
M⋆ and smallS N, 3) smallM⋆ and largeS N, and 4) smallM⋆and smallS N.
For each group, we derived stacked radial profiles of thedetected X-ray sources and computed the predicted number ofLMXBs as described in Sect. 4.1. The obtained profiles are de-picted in Fig. 2. A common property of the four groups is that inthe inner region the observed and estimated profiles are in fairlygood agreement. However, in the outer region the first threegroups show a significant source excess, with the only excep-tion being low-mass galaxies with lowS N. Thus, we concludethat the X-ray source excess cannot be only associated with ei-ther GC-LMXBs or supernova kicked LMXBs, but both types ofsources play a role.
5. Combined XLFs of LMXBs
5.1. Accuracy of the CXB subtraction
To further explore the properties of LMXBs in the sample galax-ies, we built combined XLFs of all the sources residing in theinner (0.2 – 3)re and outer (4 – 10)re regions. In total, we re-solved 1412 and 1077 point sources in the inner and outer re-gions (Table 2), allowing us to build accurate XLFs.
Since our study is focused on galaxy outskirts with rela-tively low source density, it is crucial to accurately account forthe CXB level. In the inner regions the estimated average con-tribution of CXB sources is only∼ 6%, whereas it is∼ 43%in the outer regions (Table 2). Given that the CXB source den-sity exhibits 10− 30% field-to-field variations due to the cosmicvariance, the inaccurate subtraction of the CXB level couldsig-nificantly influence our study. Therefore, in Fig. 3 we show thecombined cumulative luminosity distributions of the detected X-ray sources in the inner and outer regions, which are comparedwith the predicted, incompleteness-corrected CXB source dis-tributions. The upper panel of Fig. 3 demonstrates that in theinner region the contribution of CXB sources is fairly low atlu-minosities below 1039 erg s−1. Above this threshold we detectedultra-luminous X-ray sources, which are most likely stellar massblack holes accreting from a low or intermediate mass compan-ion. For a comprehensive discussion of these ultra-luminous X-ray sources we refer to Zhang et al. (2012).
The lower panel of Fig. 3 shows that in the outer region theluminosity distribution of sources above 5× 1038 erg/s is in ex-cellent agreement with the predicted CXB level. Indeed, abovethis luminosity 71±8.4 X-ray sources are detected, whereas 65.1CXB sources are predicted. Note that in the bright end the XLFis not affected by incompleteness effects. Below 5× 1038 erg/s
5
Zhongli Zhang et al.: LMXB populations in galaxy outskirts
11
01
00
10
00
N (
>L
x)
inner region
1 10 100 1000 104
11
01
00
10
00
N (
>L
x)
Lx (1036 erg/s)
outer region
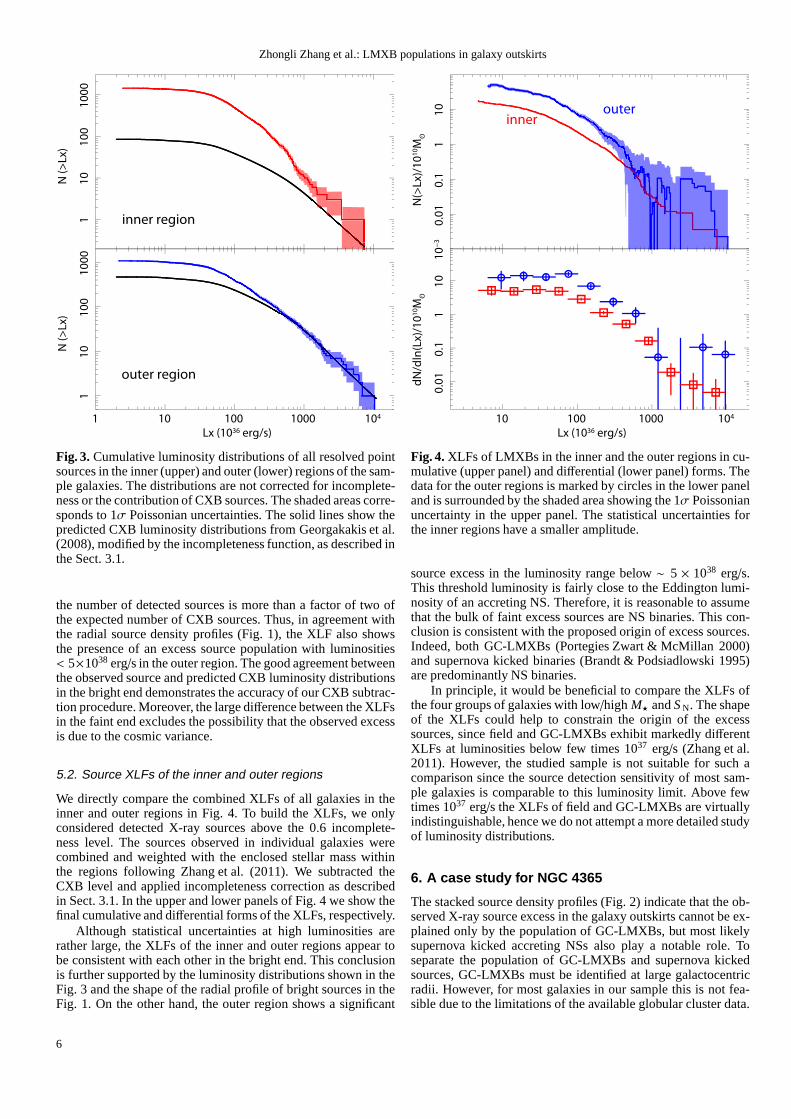
Fig. 3. Cumulative luminosity distributions of all resolved pointsources in the inner (upper) and outer (lower) regions of thesam-ple galaxies. The distributions are not corrected for incomplete-ness or the contribution of CXB sources. The shaded areas corre-sponds to 1σ Poissonian uncertainties. The solid lines show thepredicted CXB luminosity distributions from Georgakakis et al.(2008), modified by the incompleteness function, as described inthe Sect. 3.1.
the number of detected sources is more than a factor of two ofthe expected number of CXB sources. Thus, in agreement withthe radial source density profiles (Fig. 1), the XLF also showsthe presence of an excess source population with luminosities< 5×1038 erg/s in the outer region. The good agreement betweenthe observed source and predicted CXB luminosity distributionsin the bright end demonstrates the accuracy of our CXB subtrac-tion procedure. Moreover, the large difference between the XLFsin the faint end excludes the possibility that the observed excessis due to the cosmic variance.
5.2. Source XLFs of the inner and outer regions
We directly compare the combined XLFs of all galaxies in theinner and outer regions in Fig. 4. To build the XLFs, we onlyconsidered detected X-ray sources above the 0.6 incomplete-ness level. The sources observed in individual galaxies werecombined and weighted with the enclosed stellar mass withinthe regions following Zhang et al. (2011). We subtracted theCXB level and applied incompleteness correction as describedin Sect. 3.1. In the upper and lower panels of Fig. 4 we show thefinal cumulative and differential forms of the XLFs, respectively.
Although statistical uncertainties at high luminosities arerather large, the XLFs of the inner and outer regions appear tobe consistent with each other in the bright end. This conclusionis further supported by the luminosity distributions shownin theFig. 3 and the shape of the radial profile of bright sources in theFig. 1. On the other hand, the outer region shows a significant
10
−3
0.0
10
.11
10
N(>
Lx)
/10
10M
O.
innerouter
10 100 1000 104
0.0
10
.11
10
dN
/dln
(Lx)
/10
10M
O.
Lx (1036 erg/s)
Fig. 4. XLFs of LMXBs in the inner and the outer regions in cu-mulative (upper panel) and differential (lower panel) forms. Thedata for the outer regions is marked by circles in the lower paneland is surrounded by the shaded area showing the 1σ Poissonianuncertainty in the upper panel. The statistical uncertainties forthe inner regions have a smaller amplitude.
source excess in the luminosity range below∼ 5 × 1038 erg/s.This threshold luminosity is fairly close to the Eddington lumi-nosity of an accreting NS. Therefore, it is reasonable to assumethat the bulk of faint excess sources are NS binaries. This con-clusion is consistent with the proposed origin of excess sources.Indeed, both GC-LMXBs (Portegies Zwart & McMillan 2000)and supernova kicked binaries (Brandt & Podsiadlowski 1995)are predominantly NS binaries.
In principle, it would be beneficial to compare the XLFs ofthe four groups of galaxies with low/high M⋆ andS N. The shapeof the XLFs could help to constrain the origin of the excesssources, since field and GC-LMXBs exhibit markedly differentXLFs at luminosities below few times 1037 erg/s (Zhang et al.2011). However, the studied sample is not suitable for such acomparison since the source detection sensitivity of most sam-ple galaxies is comparable to this luminosity limit. Above fewtimes 1037 erg/s the XLFs of field and GC-LMXBs are virtuallyindistinguishable, hence we do not attempt a more detailed studyof luminosity distributions.
6. A case study for NGC 4365
The stacked source density profiles (Fig. 2) indicate that the ob-served X-ray source excess in the galaxy outskirts cannot beex-plained only by the population of GC-LMXBs, but most likelysupernova kicked accreting NSs also play a notable role. Toseparate the population of GC-LMXBs and supernova kickedsources, GC-LMXBs must be identified at large galactocentricradii. However, for most galaxies in our sample this is not fea-sible due to the limitations of the available globular cluster data.
6
Zhongli Zhang et al.: LMXB populations in galaxy outskirts
Although several galaxies in our sample have been observed bythe Hubble Space Telescope (HST), these images do not covertheir outskirts. Ground based observatories have larger field-of-view, but these images usually suffer from major incompletenessand foreground star contamination. An exception from this trendis NGC 4365, for which deep optical data is available, allowingto detect GCs even in its outskirts. Additionally, deepChandradata is also available with a limiting luminosity of∼ 1037 erg/s.Therefore, we probe the X-ray populations of NGC 4365 as acase study.
NGC 4365 is a large elliptical galaxy withM⋆= 1.8 ×10¹¹ M⊙ andS N= 3.95, which exhibits a notable source excessin the (4 – 10)re region. The GC population of NGC 4365 hasbeen studied as part of the SAGES Legacy Unifying Globularsand Galaxies Survey (SLUGGS). The galaxy and its outskirtshave been observed in 8 pointings with the Advanced Camerafor Surveys (ACS) onboardHST, which data has been comple-mented withSubaru/S-Cam observations. Based on this com-bined data set, Blom et al. (2012) reported more than∼6000GC candidates in and around NGC 4365. Beyond the central0.5′ (∼1re) the obtained list of GC candidates is complete tothe turnover magnitude, additionally not significantly affectedby contamination (Blom et al. 2012).
To build the list of GC candidates around NGC 4365, werelied on the publicly available SLUGGS1 data set, combiningtheHST andSubaru identifications together. If a GC candidatehas been observed by both telescopes, we prioritizedHST. Weidentified GC-LMXBs by cross-correlating the coordinates ofGC candidates with the coordinates of detected X-ray sourcesfollowing the method described in Zhang et al. (2011). The ap-plied match radius was 0.5′′, which results in a total number of104 X-ray sources residing in GCs within the study field. Theestimated number of random matches is∼ 3. The 104 identifiedsources are designated as GC-LMXBs, whereas all the others arefield sources.
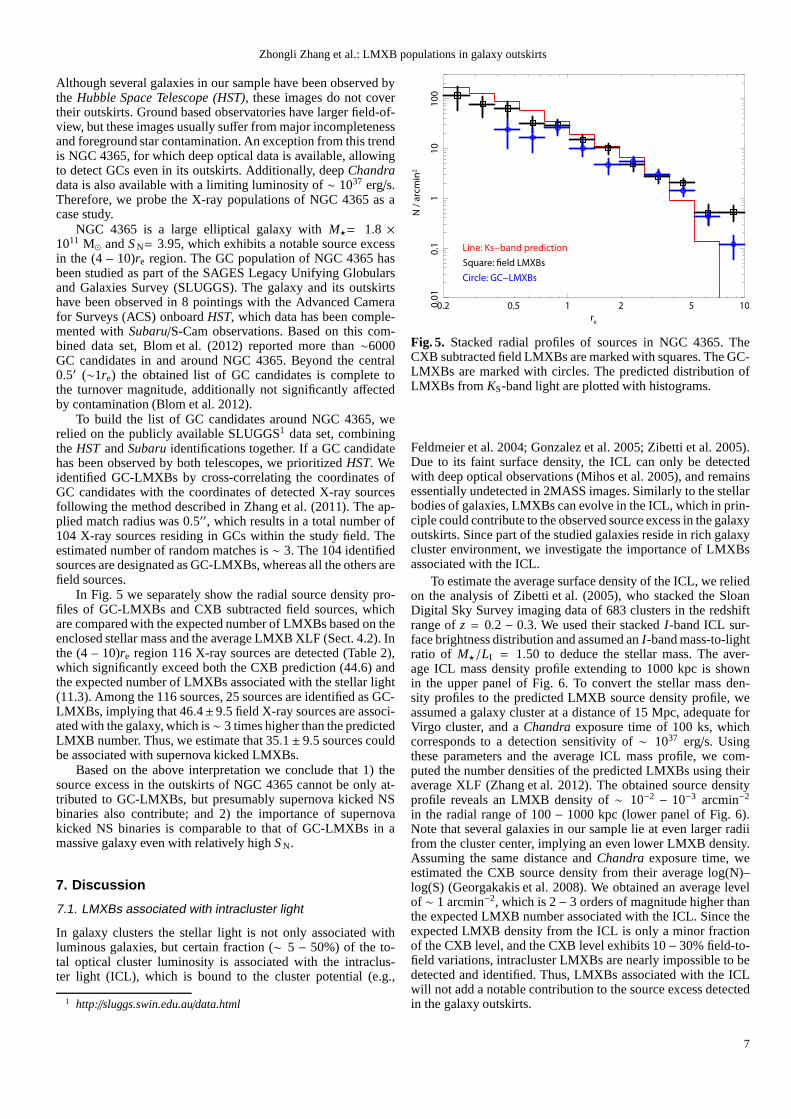
In Fig. 5 we separately show the radial source density pro-files of GC-LMXBs and CXB subtracted field sources, whichare compared with the expected number of LMXBs based on theenclosed stellar mass and the average LMXB XLF (Sect. 4.2). Inthe (4 – 10)re region 116 X-ray sources are detected (Table 2),which significantly exceed both the CXB prediction (44.6) andthe expected number of LMXBs associated with the stellar light(11.3). Among the 116 sources, 25 sources are identified as GC-LMXBs, implying that 46.4±9.5 field X-ray sources are associ-ated with the galaxy, which is∼ 3 times higher than the predictedLMXB number. Thus, we estimate that 35.1± 9.5 sources couldbe associated with supernova kicked LMXBs.
Based on the above interpretation we conclude that 1) thesource excess in the outskirts of NGC 4365 cannot be only at-tributed to GC-LMXBs, but presumably supernova kicked NSbinaries also contribute; and 2) the importance of supernovakicked NS binaries is comparable to that of GC-LMXBs in amassive galaxy even with relatively highS N.
7. Discussion
7.1. LMXBs associated with intracluster light
In galaxy clusters the stellar light is not only associated withluminous galaxies, but certain fraction (∼ 5 − 50%) of the to-tal optical cluster luminosity is associated with the intraclus-ter light (ICL), which is bound to the cluster potential (e.g.,
1 http://sluggs.swin.edu.au/data.html
00.2 0.50.0
10
.11
10
10
0
N /
arc
min
2
re
Line: Ks−band prediction
Square: "eld LMXBs
Circle: GC−LMXBs
Fig. 5. Stacked radial profiles of sources in NGC 4365. TheCXB subtracted field LMXBs are marked with squares. The GC-LMXBs are marked with circles. The predicted distribution ofLMXBs from KS-band light are plotted with histograms.
Feldmeier et al. 2004; Gonzalez et al. 2005; Zibetti et al. 2005).Due to its faint surface density, the ICL can only be detectedwith deep optical observations (Mihos et al. 2005), and remainsessentially undetected in 2MASS images. Similarly to the stellarbodies of galaxies, LMXBs can evolve in the ICL, which in prin-ciple could contribute to the observed source excess in the galaxyoutskirts. Since part of the studied galaxies reside in richgalaxycluster environment, we investigate the importance of LMXBsassociated with the ICL.
To estimate the average surface density of the ICL, we reliedon the analysis of Zibetti et al. (2005), who stacked the SloanDigital Sky Survey imaging data of 683 clusters in the redshiftrange ofz = 0.2 − 0.3. We used their stackedI-band ICL sur-face brightness distribution and assumed anI-band mass-to-lightratio of M⋆/LI = 1.50 to deduce the stellar mass. The aver-age ICL mass density profile extending to 1000 kpc is shownin the upper panel of Fig. 6. To convert the stellar mass den-sity profiles to the predicted LMXB source density profile, weassumed a galaxy cluster at a distance of 15 Mpc, adequate forVirgo cluster, and aChandra exposure time of 100 ks, whichcorresponds to a detection sensitivity of∼ 1037 erg/s. Usingthese parameters and the average ICL mass profile, we com-puted the number densities of the predicted LMXBs using theiraverage XLF (Zhang et al. 2012). The obtained source densityprofile reveals an LMXB density of∼ 10−2 − 10−3 arcmin−2
in the radial range of 100− 1000 kpc (lower panel of Fig. 6).Note that several galaxies in our sample lie at even larger radiifrom the cluster center, implying an even lower LMXB density.Assuming the same distance andChandra exposure time, weestimated the CXB source density from their average log(N)–log(S) (Georgakakis et al. 2008). We obtained an average levelof ∼ 1 arcmin−2, which is 2− 3 orders of magnitude higher thanthe expected LMXB number associated with the ICL. Since theexpected LMXB density from the ICL is only a minor fractionof the CXB level, and the CXB level exhibits 10− 30% field-to-field variations, intracluster LMXBs are nearly impossibleto bedetected and identified. Thus, LMXBs associated with the ICLwill not add a notable contribution to the source excess detectedin the galaxy outskirts.
7
Zhongli Zhang et al.: LMXB populations in galaxy outskirts
10
41
05
10
61
07
10
81
09
ICL (
MO. /
kp
c2)
1 10 100 100010
−4
10
−3
0.0
10
.11
10
N /
arc
min
2
Radius (kpc)
15 Mpc, 100 Ks, Llim
~ 1037 erg/s
LMXB
CXB
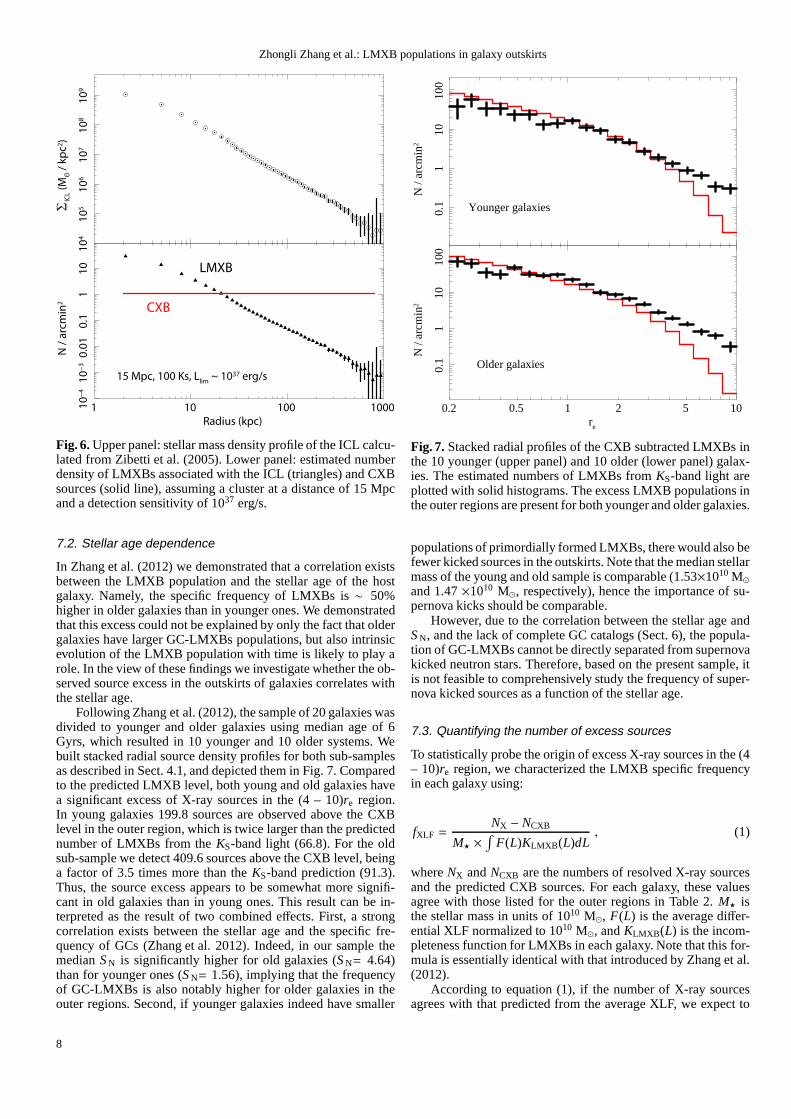
Fig. 6. Upper panel: stellar mass density profile of the ICL calcu-lated from Zibetti et al. (2005). Lower panel: estimated numberdensity of LMXBs associated with the ICL (triangles) and CXBsources (solid line), assuming a cluster at a distance of 15 Mpcand a detection sensitivity of 1037 erg/s.
7.2. Stellar age dependence
In Zhang et al. (2012) we demonstrated that a correlation existsbetween the LMXB population and the stellar age of the hostgalaxy. Namely, the specific frequency of LMXBs is∼ 50%higher in older galaxies than in younger ones. We demonstratedthat this excess could not be explained by only the fact that oldergalaxies have larger GC-LMXBs populations, but also intrinsicevolution of the LMXB population with time is likely to play arole. In the view of these findings we investigate whether theob-served source excess in the outskirts of galaxies correlates withthe stellar age.
Following Zhang et al. (2012), the sample of 20 galaxies wasdivided to younger and older galaxies using median age of 6Gyrs, which resulted in 10 younger and 10 older systems. Webuilt stacked radial source density profiles for both sub-samplesas described in Sect. 4.1, and depicted them in Fig. 7. Comparedto the predicted LMXB level, both young and old galaxies havea significant excess of X-ray sources in the (4 – 10)re region.In young galaxies 199.8 sources are observed above the CXBlevel in the outer region, which is twice larger than the predictednumber of LMXBs from theKS-band light (66.8). For the oldsub-sample we detect 409.6 sources above the CXB level, beinga factor of 3.5 times more than theKS-band prediction (91.3).Thus, the source excess appears to be somewhat more signifi-cant in old galaxies than in young ones. This result can be in-terpreted as the result of two combined effects. First, a strongcorrelation exists between the stellar age and the specific fre-quency of GCs (Zhang et al. 2012). Indeed, in our sample themedianS N is significantly higher for old galaxies (S N= 4.64)than for younger ones (S N= 1.56), implying that the frequencyof GC-LMXBs is also notably higher for older galaxies in theouter regions. Second, if younger galaxies indeed have smaller
0.1
110
100
N /
arcm
in2
Younger galaxies
1 100.2 0.5 2 5
0.1
110
100
N /
arcm
in2re
Older galaxies
Fig. 7. Stacked radial profiles of the CXB subtracted LMXBs inthe 10 younger (upper panel) and 10 older (lower panel) galax-ies. The estimated numbers of LMXBs fromKS-band light areplotted with solid histograms. The excess LMXB populationsinthe outer regions are present for both younger and older galaxies.
populations of primordially formed LMXBs, there would alsobefewer kicked sources in the outskirts. Note that the median stellarmass of the young and old sample is comparable (1.53×10¹⁰ M⊙and 1.47×10¹⁰ M⊙, respectively), hence the importance of su-pernova kicks should be comparable.
However, due to the correlation between the stellar age andS N, and the lack of complete GC catalogs (Sect. 6), the popula-tion of GC-LMXBs cannot be directly separated from supernovakicked neutron stars. Therefore, based on the present sample, itis not feasible to comprehensively study the frequency of super-nova kicked sources as a function of the stellar age.
7.3. Quantifying the number of excess sources
To statistically probe the origin of excess X-ray sources inthe (4– 10)re region, we characterized the LMXB specific frequencyin each galaxy using:
fXLF =NX − NCXB
M⋆ ×∫
F(L)KLMXB (L)dL, (1)
whereNX andNCXB are the numbers of resolved X-ray sourcesand the predicted CXB sources. For each galaxy, these valuesagree with those listed for the outer regions in Table 2.M⋆ isthe stellar mass in units of 1010 M⊙, F(L) is the average differ-ential XLF normalized to 1010 M⊙, andKLMXB (L) is the incom-pleteness function for LMXBs in each galaxy. Note that this for-mula is essentially identical with that introduced by Zhanget al.(2012).
According to equation (1), if the number of X-ray sourcesagrees with that predicted from the average XLF, we expect to
8
Zhongli Zhang et al.: LMXB populations in galaxy outskirts
observefXLF = 1. However, for the studied 20 galaxies, we ob-tained the median value offXLF = 3.31 in the outer region, in-dicating a significant source excess. Assuming that the X-raysource excess originates from supernova kicked binaries andGC-LMXBs, we fit the data with a two parameter linear model:
fXLF = a × M⋆ + b × S N (2)
whereM⋆ is the stellar mass in units of 1010 M⊙ andS N is theglobular cluster specific frequency. To find the best-fit values,we usedχ2 minimization and obtaineda = 0.081± 0.025 andb = 0.60± 0.12. The largeχ2/d.o. f = 104.9/18 implies no-table scatter in the relation. Taking into account the median stel-lar mass (M⋆ = 1.3 × 10¹¹ M⊙) and the median specific GCfrequency (S N = 2.0) of our sample, we find that (on average)the contribution of kicked binaries (a × M⋆) and GC-LMXBs(b × S N) is comparable. Thus, our statistical analysis confirms,that the excess X-ray sources have two different origins, namelyfrom GC-LMXBs and supernova kicked binaries.
7.4. The role of supernova kicks
The fate of the kicked binary depends on the amplitude of thekick velocity with respect to the orbital velocity in the binarysystem (vorb) and the escape velocity in the gravitational poten-tial of the parent galaxy (vesc). If the final velocity attained bythe binary system (vsys) exceeds the escape velocity, the binarywill become unbound to its parent galaxy. On the other hand, ifthe kick velocity is too large with respect to the orbital veloc-ity in the binary system, it will be destroyed by the kick (e.g.Brandt & Podsiadlowski 1995). Due to this selection effect, theaverage system velocities of LMXBs are expected to be smallerthan for isolated neutron stars.
Brandt & Podsiadlowski (1995) studied the effect of thesupernova kick on the binary system. Assuming that thebirth velocities of neutron stars are distributed according toLyne & Lorimer (1994) with the mean value of 450 km/s, theyconcluded that LMXBs that remain bound after the supernovaexplosion have an average system velocity ofvsys = 180 ±80 km s−1. The typical escape velocities of our sample galaxiesare in the range ofvesc∼ 250− 1000 km s−1 (Scott et al. 2009),larger than the average system velocity, therefore we should notexpect that a significant fraction of LMXBs escape the parentgalaxy, especially the more massive ones. Nevertheless, sys-tem velocities are comparable to the escape velocities, suggest-ing that natal kicks of the compact objects can significantlymodify the spatial distribution of LMXBs in the galaxy, lead-ing to its broadening as compared to the distribution of stars(Brandt & Podsiadlowski 1995). However, this does not explainthe observed dependence on the stellar mass. Indeed, assumingthat the stellar mass is a proxy to the total gravitating mass, weshould expect that the effect of kicks is stronger in the lowermass galaxies, opposite to what is observed.
However, it has been suggested that the birth velocity distri-bution of Galactic radio pulsar population has a bimodal struc-ture, with the low velocity peak at≈ 90 km/s and the high ve-locity peak at≈ 500 km/s and the population roughly equally di-vided between the two components (Arzoumanian et al. 2002).The bimodal distribution of the natal kicks will result inthe similarly bimodal velocity distribution of LMXBs (e.g.,Repetto et al. 2012). Thus, one may expect that the lower ve-locity component remains bound in galaxies of any mass fromour sample. The fate of the high velocity component, however,depends on the gravitational mass of the galaxy. In the higher
mass galaxies it will remain bound but would be (much) broaderdistributed than stars, due to much larger average velocity, thusgiving rise to the excess of X-ray sources in the galactic out-skirts. In the case of the lower mass galaxies, with the escapevelocity<∼ 500 km/s, the majority of the high velocity systemswill escape the galaxy and no extended halo of LMXBs will ap-pear.
The escaping binaries will travel to large distances in a rel-atively short time scale. Assuming a system velocity ofvsys =
200 km s−1 and a radial trajectory, we estimate that in 1 Gyr thebinary will move from the host galaxy to a distance of∼ 200kpc. This value significantly exceeds the field-of-view of thepresently studiedChandra observations (∼ 30 − 60 kpc), im-plying that such kicked X-ray sources cannot be detected in oursample. On another note, due to the expected low surface densityof supernova kicked sources at large radii, they will be virtuallyindistinguishable from the CXB level.
As the exact cause of the natal kick is not understood, it is notknown what birth velocities of black holes are. Unlike neutronstars, they cannot be measured directly from proper motionsofisolated black holes, while attempts to derive them from thespa-tial distribution of black hole binaries so far produced ambigu-ous results. Among different models, a momentum-conservingmodel is often considered, which assumes that during the su-pernova explosion, black holes and neutron stars receive samemomentum (rather than same kick velocity). In this model, thekick velocities of black holes are by a factor of∼ 5− 10 smallerthat those received by the neutron stars, in accord with their massratios. Therefore black holes kicks would be insufficient to drivethem out of even the lowest mass galaxies in our sample. Thisagrees with the fact, that the threshold luminosity above whichthe extended halo of X-ray sources vanishes,∼ (3 − 5) · 1037
erg/s, is close to the Eddington luminosity limit for the neutronstar. It also suggests that the excess sources in the galactic out-skirts with supernova kicked origins are neutron star binaries.
Above, we outlined a qualitative picture which may becomea framework for a quantitative analysis. In order for this pic-ture to be proven or falsified, realistic calculations need to bedone, similar to the ones performed by Brandt & Podsiadlowski(1995); Repetto et al. (2012). Results of such calculationscanbe compared with the observed radial source density profilesingalaxies of different masses. Such a comparison would also re-quire detailed globular cluster information in order to removecontribution of globular cluster LMXBs. This, however, is be-yond the scope of this paper.
8. Conclusion
In this paper, for the first time, we systematically exploredthepopulation of LMXBs in the outskirts of early-type galaxies.We studied a sample of 20 early-type galaxies based on archivalChandra data, which allowed us to perform a statistically signif-icant study of the X-ray populations with a limiting luminosityof ∼ 1037 erg s−1. Our results can be summarized as follows.
1. We demonstrated the existence of an excess X-ray sourcepopulation in the outskirts of early-type galaxies. Thesesources form a halo of compact X-ray sources around galax-ies extending out to at least∼ 10re and probably much fur-ther. Their radial distribution is much broader that the distri-bution of the stellar light. The extended halo is comprised ofsources with luminosity<∼ 5·1038 erg/s, while the more lumi-nous sources appear to follow the distribution of the stellarlight without any notable excess at large radii. This suggests
9
Zhongli Zhang et al.: LMXB populations in galaxy outskirts
that the majority of the excess sources are neutron star bina-ries.
2. Dividing the sample galaxies into four different groups basedon their stellar mass and specific frequency of globular clus-ters, we found that the extended halo of compact sources ispresent in all groups except for the low-mass galaxies withlow globular cluster content (smallS N).
3. We performed a case study of NGC 4365, for which galaxydeep optical (HST and Subaru) and X-ray data (Chandra)is available, allowing the identification of GC-LMXBs. Inthe (4 – 10)re region we detected 60.1± 10.8 excess X-raysources, out of which 25 are GC-LMXBs and 35.1± 9.5 arefield sources which are presumably supernova kicked NS bi-naries.
4. Interpreting our findings, we proposed that the excesssources are comprised of two independent components: (i)dynamically formed sources in blue (metal poor) globularclusters, which are known to be distributed broader than thestellar light; (ii) primordial (field) neutron star LMXBs ex-pelled from the main body of the galaxy due to kicks re-ceived during the supernova explosion.
Acknowledgements. We thank Andrew Cooper, Diederik Kruijssen and JingyingWang for discussions, which have improved this paper. We thank Klaus Dolagfor discussion of the intracluster light in clusters of galaxies. This researchhas made use ofChandra archival data provided byChandra X-ray Center,and 2MASS Large Galaxy Atlas data provided by NASA/IPAC infrared sci-ence archive.Akos Bogdan acknowledges support provided by NASA throughEinstein Postdoctoral Fellowship grant number PF1-120081awarded by theChandra X-ray Center, which is operated by the Smithsonian AstrophysicalObservatory for NASA under contract NAS8-03060.
ReferencesAnnibali, F., Bressan, A., Rampazzo, R., Zeilinger, W. W., &Danese, L. 2007,
A&A, 463, 455Arzoumanian, Z., Chernoff, D. F., & Cordes, J. M. 2002, ApJ, 568, 289Bassino, L. P., Faifer, F. R., Forte, J. C., et al. 2006, A&A, 451, 789Bell, E. F. & de Jong, R. S. 2001, ApJ, 550, 212Blom, C., Spitler, L. R., & Forbes, D. A. 2012, MNRAS, 420, 37Bogdan,A. & Gilfanov, M. 2011, MNRAS, 418, 1901Brandt, N. & Podsiadlowski, P. 1995, MNRAS, 274, 461Cantiello, M., Blakeslee, J. P., & Raimondo, G. 2007, ApJ, 668, 209Colbert, E. J. M., Heckman, T. M., Ptak, A. F., Strickland, D.K., & Weaver,
K. A. 2004, ApJ, 602, 231de Vaucouleurs, G., de Vaucouleurs, A., Corwin, Jr., H. G., et al. 1991, Third
Reference Catalogue of Bright Galaxies (Springer)Dirsch, B. 1996, Master’s thesis, Master Thesis, University of Bonn (1996)Dirsch, B., Schuberth, Y., & Richtler, T. 2005, A&A, 433, 43Feldmeier, J. J., Mihos, J. C., Morrison, H. L., et al. 2004, ApJ, 609, 617Forbes, D. A. 1996, AJ, 112, 954Forbes, D. A., Brodie, J. P., & Grillmair, C. J. 1997, AJ, 113,1652Forbes, D. A., Georgakakis, A. E., & Brodie, J. P. 2001, MNRAS, 325, 1431Forbes, D. A., Grillmair, C. J., Williger, G. M., Elson, R. A.W., & Brodie, J. P.
1998, MNRAS, 293, 325Georgakakis, A., Nandra, K., Laird, E. S., Aird, J., & Trichas, M. 2008, MNRAS,
388, 1205Gilfanov, M. 2004, MNRAS, 349, 146Gonzalez, A. H., Zabludoff, A. I., & Zaritsky, D. 2005, ApJ, 618, 195Harris, W. E. 1991, ARA&A, 29, 543Hobbs, G., Lorimer, D. R., Lyne, A. G., & Kramer, M. 2005, MNRAS, 360, 974Humphrey, P. J. 2009, ApJ, 690, 512Irwin, J. A., Athey, A. E., & Bregman, J. N. 2003, ApJ, 587, 356Jarrett, T. H., Chester, T., Cutri, R., Schneider, S. E., & Huchra, J. P. 2003, AJ,
125, 525Jordan, A., Cote, P., Ferrarese, L., et al. 2004, ApJ, 613, 279Kissler-Patig, M., Richtler, T., & Hilker, M. 1996, A&A, 308, 704Kissler-Patig, M., Richtler, T., Storm, J., & della Valle, M. 1997, A&A, 327, 503Kundu, A., Maccarone, T. J., & Zepf, S. E. 2002, ApJ, 574, L5Li, Z., Spitler, L. R., Jones, C., et al. 2010, ApJ, 721, 1368Lyne, A. G. & Lorimer, D. R. 1994, Nature, 369, 127Mihos, J. C., Harding, P., Feldmeier, J., & Morrison, H. 2005, ApJ, 631, L41Peng, E. W., Jordan, A., Cote, P., et al. 2008, ApJ, 681, 197
Portegies Zwart, S. F. & McMillan, S. L. W. 2000, ApJ, 528, L17Repetto, S., Davies, M. B., & Sigurdsson, S. 2012, MNRAS, 425, 2799Rhode, K. L. & Zepf, S. E. 2004, AJ, 127, 302Sanchez-Blazquez, P., Gorgas, J., Cardiel, N., & Gonzalez, J. J. 2006, A&A, 457,
809Schweizer, F. & Seitzer, P. 1992, AJ, 104, 1039Scott, N., Cappellari, M., Davies, R. L., et al. 2009, MNRAS,398, 1835Sikkema, G., Peletier, R. F., Carter, D., Valentijn, E. A., &Balcells, M. 2006,
A&A, 458, 53Spitler, L. R., Forbes, D. A., Strader, J., Brodie, J. P., & Gallagher, J. S. 2008,
MNRAS, 385, 361Terlevich, A. I. & Forbes, D. A. 2002, MNRAS, 330, 547Thomas, D., Maraston, C., Bender, R., & Mendes de Oliveira, C. 2005, ApJ,
621, 673Tonry, J. L., Dressler, A., Blakeslee, J. P., et al. 2001, ApJ, 546, 681Voss, R. & Gilfanov, M. 2006, A&A, 447, 71—. 2007, A&A, 468, 49Zhang, Z., Gilfanov, M., & Bogdan, A. 2012, ArXiv e-printsZhang, Z., Gilfanov, M., Voss, R., et al. 2011, A&A, 533, A33Zibetti, S., White, S. D. M., Schneider, D. P., & Brinkmann, J. 2005, MNRAS,
358, 949
10