livestock sector study - world...
TRANSCRIPT

INDONESIA
LIVESTOCK SECTOR STUDY
An Update on Livestock Sector Performance In Response to the Economic Crisis,
Government Decentralization and Local Autonomy
NOVEMBER, 2002
Prepared by: Brian Brandenburg, Consultant Livestock Specialist Drh. P Sukobagyo, DGLS staff member (retired)
37565P
ublic
Dis
clos
ure
Aut
horiz
edP
ublic
Dis
clos
ure
Aut
horiz
edP
ublic
Dis
clos
ure
Aut
horiz
edP
ublic
Dis
clos
ure
Aut
horiz
edP
ublic
Dis
clos
ure
Aut
horiz
edP
ublic
Dis
clos
ure
Aut
horiz
edP
ublic
Dis
clos
ure
Aut
horiz
edP
ublic
Dis
clos
ure
Aut
horiz
ed

2
TABLE OF CONTENTS
ACRONYMS AND INDONESIAN TERMINOLOGY 4 EXECUTIVE SUMMARY 6 SECTION 1 BACKGROUND AND SUMMARY 10 SECTION II – LIVESTOCK PRODUCTION, CONSUMPTION AND PRODUCTION 12
A. Human and Livestock Distribution 12 B. Consumer Incomes and Demand for Livestock Products 15 C. Domestic Meat Production 16 D. Supply of Livestock Products 17 E. Trade – Imports, Exports, Sources and Destinations 18
SECTION III PUBLIC AND PRIVATE SECTOR INFRASTRUCTURE 23 A. Public Sector Infrastructure 23 B. Livestock Producers’ and Service Organizations 26 C. Village Farmers’ Organizations 29
SECTION IV – LIVESTOCK PRODUCTION SYSTEMS 31 A. Poultry Production Systems. 35 B. Large Ruminant Production Systems 35 C. Small Ruminant and Pig Production Systems 38
SECTION V – ANIMAL HEALTH SERVICES AND LIVESTOCK PRODUCT QUALITY 43
A. Livestock Diseases Prevalence 43 B. National Disease Surveillance and Eradication 45 C. Meat Inspection and Slaughter Controls 46
SECTION VI TECHNICAL LIVESTOCK SUPPORT SERVICES 48
A. Public and Private Sector Support Services 48 B. Provincial and District Animal Health Services 49 C. Private Veterinary Services 52 D. Veterinary Vaccine and Drug Supplies 53 E. Village Animal Health Services 54 F. Artificial Insemination Services 56 G. Livestock Extension Services 58 H. The Animal Feed Industry 59 I. Rural Infrastructure Linkages with Agribusiness 61 J. Slaughterhouse Capacity 61
SECTION VII LIVESTOCK POLICY AND INSTRUMENTS\ 63 A. Public Sector Livestock Development Policy 63 B. Production and Pricing Policy - Impact on Efficiency and Equity 66 C. Trade Protection Policy 68

3
D. Small and Medium Enterprise (SME) Development Policy 69 E. Animal Health Policy 70
SECTION VIII GOVERNMENT AND DONOR PROJECTS AND PROGRAMS 71 A. Projects Sponsored by Multilateral Agencies 71 B. Projects Sponsored by Bilateral Donor Agencies. 72 C. NGO-sponsored Projects 74
SECTION IX RECOMMENDATIONS 76
A. Enhancing Livestock Sector Performance 76 B. Contribution to Economic Recovery and Pro-Poor Growth 77 C. Potential Projects 81
ANNEXES 86

4
ACRONYMS AND INDONESIAN TERMINOLOGY
AARHD Agency for Agricultural Human Resources and Development AARD Agency for Agricultural Research and Development APHIS Animal Health and Production Information Systems for ASEAN Agricultural Extension Information Center Balai Informasi Penyuluh Pertanian; BIPP Agricultural Extension Officer Penyuluh Pertanian Lepangan, PPL AI Artificial insemination Animal Health Post Pos Kesehatan Hewan, poskeswan, AHP Artificial Insemination Unit Pos Inseminasi Buatan; PIB ASOHI Indonesia Veterinary Drug Association; Asosiasi Obat Hewan Indonesia Balitnak Research Institute for Animal Production Balitvet Research Institute for Animal Diseases BIPP Agricultural Extension Information Center (Balai Informasi
Penyuluh Pertanian; BIPP), CRIAS Central Research Institute for Animal Sciences CSF Classical Swine Fever (hog cholera) DGLS Directorate-General of Livestock Services DIC Regional Disease Investigation Center Directorate of: Agroindustry and Marketing Industri Primer dan Pemasaran Hasil Pertanian Animal Breeding Perbibitan Distribution and Development BINA Penyebaran and Pengembangan Peternakan Farming and Processing BINA Usaha Tani dan Pengolahan Hasil Veterinary Public Health Kesehatan Masyarakat Veteriner District Kabupaten DOC Day-old chick FAO Food and Agriculture Organization of the United Nations Farmers’ Group Kelompok tani GDP Gross Domestic Product Government Livestock Services Dinas Peternakan HACCP Hazard Analysis Critical Control Point Human Agricultural Resource Development Center Badan Pengembangan Sumberdaya Manusia Pertanian, AARHD Indonesian Feed Mill Association Gebungan Pakan Makan Ternak, GPMT INTAB Village Poultry Intensification Program Intensifikasi Ayam Buras IVMA Indonesian Veterinary Medical Association; Asosiasi Doktor Hewan Indonesia JIBC Japan International Business Cooperation MBM Meat and Bone Meal MMRC Integrated Smallholder Village Poultry Production Project MoA Ministry of Agriculture MoC Ministry of Co-operatives and SME

5
National Statistical Bureau Pusat Biro Statistik NCAED National Center for Agricultural Extension Development NGO Non-governmental organization Office for Information Technology for Agricultural and Forestry Extension Kantor Informasi Teknologi dan Penyuluhan Pertanian dan Kehutanan; KITPPK OIE Organization International Epidemique Poultry Producers Assembly of Indonesia Perhimpunan Peternak Unggas Indonesia, PPAN Provincial Livestock Services Dinas Peternakan Propinsi SBM Soybean Meal SME Small and Medium Enterprises Subdistrict Kecematen Subdirectorate of [Animal] Production Subdirektorat Budidaya Union of Indonesian Dairy Co-operatives Gabungan Koperasi Susu Indonesia – GKSI Union of Indonesian Poultry Breeders Gebungan Perusahaan Pembibitan Unggas Indonesia, Village poultry Hybrid indigenous-commercial poultry crosses, ayam buras Unimproved indigenous poultry, ayam kampong Veterinary Shop Toko hewan Village Head Kepala Desa Livestock Farmers’ Groups Kelompok tani terna Village Poultry Farmers’ Group Kelompok tani ayam buras Village Dairy Cooperative Unit Koperasi susu unit desa, KSUD IPB Bogor Agricultural Institute; Institut Pertanian Bogor District Government Ordinance Peraturan Daerah; PERDA Biological Vaccine Center Pusat Veterinaria Pharma, Pusvetma Veterinary Assistant mantri hewan Veterinary Drug Assay and Certification Laboratory Balai Pengujian Mutu & Sertifikasi Obat Hewan; BPMSOH Veterinary Practitioner Doktor Hewan

6
EXECUTIVE SUMMARY
Livestock Distribution and Consumer Trends. Human population densities vary greatly between Indonesia’s regions and are paralleled by an equally dissimilar livestock distribution.. Java and Sumatra play predominant roles in commercial livestock and poultry production, market and support infrastructure, thereby dominating prices and trends. Commercial poultry production is heavily dependant on imported feed grains, and dipped sharply during the crisis years as feed imports stagnated due to the Rupiah devaluation, but have recovered quickly thereafter. In contrast, village poultry and ruminants (cattle, sheep, goats) not affected by imported feed prices, such as, were little affected by the crisis. However, cattle inventories have not recovered but have continued to decline during the post-crisis years as the result of the increased slaughter of breeding stock during the crisis to partially replace stagnated beef imports, but the resulting beef supply deficit could not be met as domestic production, by virtue of its relative low level of husbandry and slow market response, was unable to respond quickly to the resulting market shifts and lead times.
Consumer incomes dropped sharply during the crisis years and have yet to recover. Meat and dairy products are subject to rather rigid income elasticity, which has resulted in a decreased urban consumption. The crisis has shifted animal protein consumption preferences from meat to dairy products, while egg consumption has remained steady. Rural consumers were able to depend partially on household-produced crops and livestock, and many rural livestock producers actually benefited from rising domestic livestock prices.
In constant prices, the livestock subsector nearly doubled its share to 11 percent of the national agricultural gross domestic product (GDP) during the pre-crisis period of 1980-95. This gain stabilized at an 11 percent share of agricultural GDP since 1995 and remained unaffected by the crisis, without much upward or downward variation. Producer’s Organizations. The financial crisis had emphasized the need for producers’ organizations to better represent their interests during times of severe economic stress. This has been especially the case for poultry and feed industry associations. Most producers’ organizations remain top heavy in their management and structure, and their contacts with the public sector are generally rather non-confrontational. The introduction of local government autonomy will create additional stresses as well as opportunities for producers’ groups, which, should they become more effective, would have a more direct impact on their local governments. For producers’ organizations to serve their membership more effectively, the institution building and leadership development will become increasingly important, as will their active involvement in prevailing livestock production policy.
The dairy cooperative GKSI occupies a special category as it spearheads the government’s national policy of milk self-sufficiency. The milk production objectives and policy, including their implementation by GKSI, are presently flawed and doomed to failure, as evidenced by the dwindling GKSI membership and lagging milk production. Village poultry associations are the most promising and the potentially most useful organizations to benefit smallholders, and with the introduction of new village poultry schemes (e.g. the RRMC village poultry program) such organizations will flourish.
Livestock Production Systems. With the exception of poultry breeding stock farms, the commercial
poultry industry has vertically integrated, from the supply of day-old layer and broiler chicks (DOC) to commercial egg and meat production, slaughtering, processing, cold storage and distribution. The industry has strong representation with government through several producers’ associations, and is actively supported

7
by the feed mill and veterinary drug industries, whose business relies most heavily on the commercial poultry industry.
Village poultry production comprises three systems: (a) scavenging with indigenous birds (ayam kampong) and little or no supplementary feeding other than household wastes, (b) semi-confinement (at night) of hybrid village poultry (ayam buras), with part grain or broken rice and household waste feeding, and (c) full confinement of ayam buras dual purpose meat-layer hens, using purchased feeds, strict vaccination for Newcastle and other diseases, and the purchase of chicks from local hatcheries. The greatest single constraint to viable village poultry production is Newcastle Disease (ND), a viral infection that can devastate village poultry populations and result in 80 to 90 percent mortality in unvaccinated chickens
The Rural Rearing Multiplication Center (RRMC) Program is a well designed village poultry production program, participatory in nature, providing the necessary incentives to ensure success. RRMC comprises integrated village chicken production, linking small agribusiness with village farmers (i.e. the nucleus enterprise-satellite farmer model), while providing the necessary support services. The RRMC program provides an excellent model for a small-scale vertically integrated village poultry production, involving smallholders, private sector agribusiness and public sector Dinas Livestock Services, and should be adaptable to other forms of livestock production.
Indonesia’s commercial dairy subsector is struggling and in urgent need of a comparative advantage analysis versus import substitution. Co-operative milk production is the predominant production model, is heavily public sector-dominated, and is almost entirely in the hands of the national milk co-operative GKSI (Union of Indonesian Dairy Co-operatives) in Java, which holds 80 percent of the national dairy herd. GKSI has 186,000 member farmers in 200 village cooperative units of which only about one-half remain functional. The attempts to improve and increase domestic milk production while facing competition from imported dairy products is a classical example of contravening government policy, under which import substitution of lower-priced milk products depresses the incentive to increase domestic production.
Animal Health Services and Livestock Product Quality. Animal disease control and surveillance
rank amongst the most important DGLS functions, in particular where opening markets and market globalization are important livestock sector initiatives. An extensive veterinary laboratory system is in place, but is hampered by limited funds, top-heavy management and aging facilities. National vaccination campaigns maintain a basic disease control level, but lack of funds has constrained vaccination coverage. Redefine the public and private sector roles in animal health between central and local governments.
With decentralization, the roles of central and local governments are changing and need to be addressed. These include: improvement in communications at the working level between the three diagnostic laboratories and the village health care poskeswan, by introducing contract-based provision of such services to animal health recipients, allowing the latter a voice in determining the type and quality of service. The poskeswan network and livestock extension and breeding programs are in urgent need of privatization or, as an interim measure, the introduction or expansion of cost recovery through user fees.
The regional AHIS animal disease surveillance program needs to be reactivated to facilitate interaction within the Region related to disease outbreaks and quarantine controls. Decentralization has interrupted the upstream and downstream information flows, as local governments are retayloring surveillance programs that need to remain standardized. Slaughter capacity and meat inspection should be privatized, and meat inspectors should be not be employed by slaughterhouses they inspect but carry out their function independently as part of the local governments’ regulatory mandate. Food safety has received additional funding and priority, but remain rather top down and hampered by limited staff, resulting in inadequate working linkages with the processing industry.

8
The decentralization of local government, which began in 2001, aims to introduce greater autonomy and bottom-up planning and implementation at the District and Subdistrict levels, and will have a significant bearing on the identification of future opportunities for livestock development, their financing and implementation. The economic crisis has increased the dependence by rural households on livestock and poultry, as these assets can be quickly converted into emergency cash. For example, household decisions to sell valuable, even pregnant, breeding stock, may seem to have little economic rationale, other than that immediate needs must be met. Total livestock and livestock product imports dropped 40 percent in value during the pre-crisis and crisis period of 1995-98, after which imports have posted a substantial 75 percent recovery from 1998 levels Technical Livestock Support Services. The number of public sector veterinarians has declined substantially due to reorganization and the zero-recruitment government policy. This shift, which developed during the past four years, has dropped the percentage of public sector veterinarians from 72 percent in 1997 to 32 percent in 2000; a decline of 1,700 veterinarians, resulting from public sector retrenchment in response to the government’s zero recruitment policy. In the decentralization progress of animal health services, DGLS needs to focus on two important areas: public and private sector roles and responsibilities, and local versus central government responsibilities, and faces a unique window of opportunity to realign itself with prevailing condition and spearhead future livestock sector development.
The district and subdistrict veterinary laboratories now fall under local government control and carry out most animal disease diagnosis. The remaining provincial responsibilities primarily focus on regulatory veterinary medicine and disease monitoring, although there are disputes as to final authority, especially regarding slaughterhouse operations and livestock movement, which involve the payment of budget-enhancing fees.
Technical livestock support services are in a state of flux and confusion, as local governments reorganize, reassign or abolish technical service centers and their staff, and the reporting quality of disease incidence, disease surveillance and livestock production data is being compromised by this institutional disarray. On the positive side, local government autonomy has allowed for an assessment of veterinary programs as to their merit and usefulness; for the reallocation of budgets in accordance with priority and merit; and for the retrenchment of supernumerary staff.
The national village animal health post network, the direct interface between DGLS and livestock owners, is not fulfilling its mandate of providing effective and sustained animal health services. Only 39 present of poskeswan presently remain active. Notable exceptions are found in Nusa Tenggara and Bali (85 percent and 100 percent active, respectively), which is the result of active local government support, based on PERDAs committing sustained budgetary support for poskeswan. Although small in scope, this example of local government support for village animal health services can serve as a useful model for wider application. The principal constraints to more effective operation of the poskeswan are three-fold: (a) the lack of sufficient budgeting for recurrent operating costs, (b) a lack of ownership of central government-funded clinics that did not acquire local government support, and (c) the infrequent and often inadequate training or refresher training of poskeswan staff. A six-step approach is proposed to gradually privatize the poskeswan system. The national artificial insemination program is organizationally too complex, with three separate central agencies responsible for breeding stations and semen production, embryo transfer, and AI field services. This structure diffuses accountability and prevents transparent monitoring of the AI program. Privatization of all AI personnel, working under performance-based contracts, would improve insemination efficacy. The use of fresh semen or natural breeding should be allowed where persistent problems with

9
frozen semen are encountered. Conception rate rather than frozen semen coverage should become the primary program indicator. The entire agricultural extension system is presently in a state of considerable confusion and disarray, as local governments, with great individual variation, are using their newly granted authority decide which form of support to provide for agricultural extension services. Several restructuring model are emerging from the transition, some of which involve livestock. These are, however, not likely to simplify the existing, multi-layered extension structure. Instead of further complicating the existing system, a window of opportunity exists to break with the past and create a leaner, more effective extension system, operating with sufficient budget, and geared not to preserve itself but rather to serve its farmer-clients. Privatization of extension workers should be seriously considered.
The feed industry plays an important role in technology transfer to farmer-clients, related to poultry, pig and dairy cattle nutrition and husbandry, and employs significant numbers of veterinarians and animal scientists. Since the crisis, which highlighted the severe freed grain shortages as a result of skyrocketing import prices, the feed mill industry has been involved in discussions with government how best to make the industry less import-dependent by the increased use of local crops or byproducts. Options are under review to develop large-scale corn production, utilizing integrated nucleus-plasma production models that lend themselves to mechanical harvesting and improved post harvest drying and storage. Production models of this scale have however not been tried out.
Slaughter capacity should be privatized to allow financial and managerial resources to improve the present infrastructure. Existing slaughterhouse capacity is generally old and well below standard, but efforts being are made to upgrade and expand capacity. A significant technical constraint is the low level of meat inspection and standards in the large commercial facilities, which constraints export slaughter. Outside Java, virtually no cattle slaughter or poultry slaughter capacity is available. Private sector abattoirs take up some of the slack, but are reluctant to establish off-Java, leaving infrastructure building to the public sector.
Livestock Policy and Instruments. Most policy objectives are rather generic in scope and do not
directly address post-crisis adjustment and government decentralization as the central factors of change. Considerable emphasis is given to central region development without addressing adjustments in sector development in the outlying regions. Policy issues that need further attention include Definition of public and private sector roles and responsibilities, include: adjusting to decentralization and local autonomy, privatization/cost recover of support services, developing suitable livestock improvement models for the outlying regions, livestock production intensification with equitable smalholder participation, and preparing for market globalization through increased food safety and the upgrading of processing capacity.
Recommendations. As indicated repeatedly, successful livestock sector improvement will depend on the resolution of two key issues: (a) an equitable transition to decentralization and local government autonomy, and (b) a redefinition of the public and private sector roles and responsibilities in national and regional livestock development. Livestock sector performance in the post-crisis years needs to adjust to changing social and economic conditions in three areas: (a) policy adjustment, (b) institutional change and (c) technical and operational upgrading. In these three areas, the two key issues related to decentralization and redefining public-private sector roles must form an integral part. Specific recommendations are found in Section IX. ; tables denoted double digits (Section and sequence) are annex tables

10
SECTION 1 BACKGROUND AND SUMMARY 1. Background. The World Bank has, in collaboration with the Government of Indonesia (GoI), implemented several provincial and area development projects that have included livestock production activities as subcomponents. Several of these remain under implementation. Livestock continues to be an important source of income generation and food protein supply for rural inhabitants. Indonesia’s livestock sector comprises a broad composition of livestock and poultry; distributed across thousands of islands, and managed in response to different climates, socio-economic conditions, feed resources and markets. The political and economic events of 1997-98 have affected in different ways the various segments of Indonesia’s livestock sector, which will have implications for future growth projections, development planning, and institutional engagement of the sector. The decentralization of local government, which began in 2001, aims to introduce greater autonomy and bottom-up planning and implementation at the District and Subdistrict levels, and will have a significant bearing on the identification of future opportunities for livestock development, their financing and implementation. 2. Purpose. The purpose of this livestock sector survey is to provide the Directorate-General of Livestock Services (DGLS) and the World Bank with an overview of the public and private sector responses to the 1997-98 financial crisis, and the government reorganization that followed in 2001. This update report contains information and data assembled from interviews and existing reports, presented in the format outlined under the Table of Contents. The survey has attempted to find answers to four basic questions:
• How have the various livestock sector segments responded to economic downturn that followed the financial crisis,
• How have livestock producers and consumers adjusted to the consequences of crisis, • How is government decentralization impacting ongoing and planned livestock sector development,
and • What are the needs of the livestock sector to fully recover from the crisis and improve the livelihood
of rural inhabitants. 3. The country’s economic response to the crisis has been well documented, but the final impact of government decentralization and local government autonomy remains far from clear at this time. Nevertheless, there are early responses that are worthy of noting. The mission responsible for preparing this report1 spent 20 days in Indonesia (see Persons Met), and wishes to thank all officials contacted at the Directorate-General of Livestock Services; contact persons at several institutes in Bogor, and the Heads of the Provincial Livestock Services (Dinas Peternakan Propinsi) of Bali dan Nusa Tenggara Barat (NTB), for their cooperation and hospitality, which included access to numerous reports and documents. 4. Methodology. The report begins with an overview of the socio-economic effects of the financial crisis on livestock producers and on consumers, followed by specific responses by various livestock subsectors. The text is supported throughout with annexed data, tracing events in serial fashion through the period 1995-2001, where possible, to gauge the response of sector parameters before (1995-97), during
1 The mission comprised Mr. Brian Brandenburg (consultant livestock specialist) and Mr. P. Sukobagyo (DGLS staff member, retired). Assistance was also provided by support staff at the World Bank office in Jakarta.

11
(1997-89) and following (1998-2001) the financial crisis. Data were obtained from interviews with contact persons in the public and private sector, and from annual statistical yearbooks issued by DGLS, provincial authorities and the National Statistical Bureau (Pusat Biro Statistik), and from other livestock sector assessment reports. 5. Section II outlines the socio-economic response to the financial crisis. Section III addresses livestock production, consumption, and productivity and Section IV describes livestock production systems. Section V covers animal health services; and Section VI describes technical support services and private sector organizations. Section VII discusses livestock policy and instruments related to production and price policy, their impact on sector efficiency and equity, and domestic and foreign trade policy. Section VIII provides a list of past and present government and donor livestock projects implemented by multilateral or bilateral agencies, and NGOs. 6. The report closes with Section IX, with recommendations for enhancing livestock sector performance, the sector’s contribution to economic recovery and growth, their regional impact, and the accountability and efficiency of livestock health and production support services delivery. In conclusion, the report outlines a set of potential project possibilities, in line with current sector development objectives. 7. General Observations. The economic crisis has increased the dependence by rural households on livestock and poultry, as these assets can be quickly converted into emergency cash. For example, household decisions to sell valuable, even pregnant, breeding stock, may seem to have little economic rationale, other than that immediate needs must be met. Tradition and culture play important roles in Indonesia’s vast rural areas, and determine to a significant extent prevailing animal husbandry practices, land tenure and ownership, the ceremonial role of livestock, and the division of family labor in livestock production. Limited arable land and rapid population growth in Java, Bali and parts of Sumatra have resulted in complex land ownership and tenure systems, which also govern the economic and social relationships of livestock ownership, use and management. Land use, including livestock grazing, is determined by the degree to which land is owned, rented or sharecropped. Family labor requirements depend on household composition and lobar expended on sideline or mainline employment. These factors must all be considered when upgrading livestock production, as they can pose important constraining factors. 8. Adoption of new livestock production practices is highly influenced by the level of education and training of livestock owners, who, at the village level, may not have progressed beyond the primary school level. Traditional livestock raising experience is often limited to one type of livestock, which may hinder the introduction of other kinds of livestock or husbandry practices. The small size of landholdings ion densely populated areas may limit the number of livestock that can be sustained by the feeding of forage or crop byproducts. Involvement by the private sector is seen as important in introducing new livestock production practices, but access to production inputs, credit and markets must accompany such initiatives.

12
SECTION II – LIVESTOCK PRODUCTION, CONSUMPTION AND PRODUCTION 1. This Section provides a profile livestock distribution patterns across the country and livestock-human population relationships. The contribution of the livestock sector within in agriculture is described, followed by the impact of the financial crisis on the livestock sector. Finally, imports, exports, prices and trade balances for livestock commodities prior to and following the crisis are presented and analyzed.
A. Human and Livestock Distribution.
2. Human Population Distribution. With well over 13,000 islands spanning across more than 3,000 miles, the Republic of Indonesia is the world’s largest island nation, with one of the world’s most diverse cultures. These unique features have influenced human migration and settlement patterns, communications between a host of diverse ethnic groups, and the farming systems in which livestock production takes place. Weather patterns differ from tropical monsoon to arid climates, determining plant and crop growth, seasonality and the livestock production systems that depend on crops and crop byproducts. The majority of Indonesia’s inhabitants live in rural areas, and 41 million of the 90 million of employed persons, equal to 46 percent of the national workforce, is engaged in agriculture. 3. Human population densities vary enormously between regions. The islands of Java and Sumatra have a combined 144 million, or 85 percent of all inhabitants. With a national average of 93 inhabitants per km2 , Java and Sumatra post population densities of 843 and 76 inhabitants per km2, respectively. Bali, Indonesia’s smallest province, has 493 inhabitants per km2, the second largest population density in the country (Table 2.1). In contrast, the outlying islands of Kalimantan and Maluku post population densities of only 17 and 7 inhabitants per km2, respectively, and Sulawesi is split between a densely populated south, decreasing in density to the north. The national population density has increased in the past decade from 93 to 106 people per km2, a 12 percent growth rate. Most of population growth, which had been rather static between 1990 and 1995, took place during the second half of the decade (1995 and 2000), the period that straddles the time span of the 1996-97 economic crisis. These regional variations in habitation density determine infrastructure, available cropland, livestock population densities, employment opportunities and consumer habits and livestock sector development. 4. The uneven livestock distribution mirrors the uneven infrastructure development that supports livestock production across the country. Java has livestock and livestock infrastructure resources unmatched by other provinces or regions:
• Most feed mills, poultry hatcheries, livestock markets, abattoirs, meat and milk processing plants are located in Java.
• Most technical support services (veterinary services, artificial insemination (AI) and breed improvement, livestock extension) are quantitatively and qualitatively better developed and budgeted in Java than elsewhere.
• Three of the five veterinary faculties in the country are located in Java (Yogyakarta, Bogor and Surabaya), with one faculty each in Sumatra (Aceh) and West Nusa Tenggara (Denpasar).
• Virtually all major research institutes in animal science and veterinary medicine are located in Bogor, West Java.

13
• Vocational and secondary livestock training and higher education institutes are mostly located in Java.
• Livestock vaccine production (Surabaya) and veterinary drug or feed additive manufacture and distribution are overwhelmingly located in Java.
• By virtue of its large consumer pool and intensified marketing infrastructure, Java, and to some extent Sumatra, controls national livestock prices and trends.
• With its direct access to import and export markets and trade support services, Java is, almost by default, in a position to control livestock markets in other regions of the country.
5. Compared to the total number of agricultural households in the country, which stood at 18.2 million in 1993 (latest national census; conducted every 10 years), the number of livestock-owning households in Indonesia represented 22.4 percent of agricultural households, a slight increase to 24.7 percent from 1983 (second-last national census). Further increases in livestock households are expected to be confirmed in the 2003 agricultural census. 6. Large and Small Ruminant Distribution. Livestock distribution by region is quite uneven and is related more to population density than to available land area. Virtually all commercial dairy cattle production is located in Java, near the larger urban centers (Table 2.6). Java holds 50 percent of all mammalian livestock (beef and dairy cattle, buffaloes, pigs, sheep and goats), followed by Sumatra at one-half that number (Tables 2.3, 2.4 and 2.5). The outlying islands combined hold 27 percent of ruminant livestock. Cattle concentrations are highest in East Java, North Sumatra and South Sulawesi. Java has very limited forage land to produce high quality, cultivated forage, however, which especially constrains dairy and beef cattle performance. In contrast, East Nusa Tenggara and parts of Sulawesi have large, unused land areas but relatively few cattle, and have the potential for increased cow-calf production. Buffalo populations are highest in Sumatra, exclusively used for draft power and as social assets. Sumatra leads in beef/draft cattle, pigs and buffaloes, and village poultry 7. Poultry Distribution. The proportional distribution of avian livestock species parallels that of ruminants (Table 12). Java hosts over 60 percent of commercial broiler and layer production, and close to 40 percent of village poultry and ducks. The total avian livestock numbers for Java and Sumatra combined, represent over 80 percent of commercial poultry (layers and broilers) and 75 percent of village poultry (hybrid indigenous/commercial crosses, ayam buras; or unimproved indigenous chickens, ayam kampong) (Table 2.4)., and on the basis of the number animals per inhabitant, village poultry is rather evenly distributed across the regions (Table 2.3). 8. Poultry meat and eggs represent one of the largest potential sources of dietary animal protein in Indonesia, and are acceptable to all ethnic and religious groups. The national village poultry population stood at 263 million birds in 2001 quantity (Table 4.2c), which ranks village poultry between commercial broilers (527 million birds) and layers (102 million birds) in terms of The village poultry population has remained relatively stable over the past decade, although the number of households owning improved village poultry (ayam buras) has dropped precipitously, from 10 million in 1963 to 0.5 million in 1993 (national census data), in effect doubling the average size of household flocks, possibly an indication of a shift toward more intensive, cash-based production.
2 Tables denoted by one digit are text tables; tables denoted by two digits are Annex tables.

14
9. On a per capita basis, village and commercial poultry are the most widely disseminated species across all regions (Table 2.3), with a ratio of close to three commercial poultry per person, and 0.7 village birds per person. The distribution of commercial birds is highly concentrated in large farms practicing confined housing husbandry, with little impact on village production, which is widely distributed across rural areas. Markets for village and commercial poultry are different and do not impact each other to any great extent. Aside from Java, the per capita ownership of village poultry is most pronounced in the outlying rural islands of Sulawesi, Kalimantan, Maluku and Irian Jaya, where poultry forms an important dietary protein contribution to human diets. Village poultry and eggs are animal protein staples, with poultry widely disseminated, raised mainly under backyard conditions, and edible for all religions. Given that Indonesia is a largely Muslim society, it hosts a surprisingly large pig population of 5.8 million head, largely concentrated in Sumatra, Java, and Bali. Table 1 – Distribution of Mammalian and Avian Livestock, 2001 (‘000 head) Species/Region
Total Livestock
Livestock Distribution
Total Poultry
Poultry Distribution
Indonesia 39,462 100% 922,004 100% Java 19,605 50% 540,866 59% Sumatra 8,997 23% 225,090 24% Kalimantan 1,407 4% 61,502 7% Sulawesi 3,597 9% 41,185 4% Bali 1,592 4% 27,945 3% W. Nusa Tenggara 865 2% 6,884 1% E. Nusa Tenggara 2,054 5% 12,625 1% Maluku 615 2% 2,273 0% Irian Jaya 730 2% 3,634 0%
10. Livestock and Poultry Population Trends Before and Following the Financial Crisis. National livestock and poultry inventories for all species increased by 22 and 24 percent, respectively between 1995 and 2001, although commercial poultry inventories declined sharply during the financial crisis years, but have recovered rapidly to pre-crisis levels. In contrast, livestock inventories have not recovered but have continued to decline as the result of the increased slaughter of breeding cattle and buffaloes during the crisis, to compensate for the almost complete cessation of beef imports during the crisis (Table 2.2). This recovery lag has mixed implications for cattle owners, who initially benefited from increased sales and prices during the crisis, but will face reduced incomes from smaller calf crops resulting from reduced breeding cow numbers. Detailed distribution trends for livestock and poultry, by region for the period 1995-2001, are found in Tables 2.4, 2.5 and 2.6. 11. The response of the livestock and poultry subsectors to the financial crisis, outlined below in Table 2, is entirely commensurate with their degree of dependency on imported feedstuffs and other production inputs, such as day-old chicks, certain drugs and vaccines. With the exception of pigs, ruminant livestock inventories were not affected significantly by the crisis, although breeding cow numbers declined due to increased slaughter of 30,000 cows (Section V , part C). Pig inventories declined by 20 percent, as their production depends increasingly on compound feeds from imported feed grains. Buffalo numbers declined by 28 percent, due to emergency slaughter for cash emergency, and to a declining need for draft power. Overall, national livestock and poultry inventory increased by over 20 percent since 1995, largely the result of increasing poultry inventories.

15
Table 2 – Population Responses by Livestock and Poultry to the Financial Crisis (After Annex Table 2.2)
Population (‘000 head) % Change Livestock Species and 1995 1996 1997 1998 1999 2000 2001 95-98 98-01 Livestock and Poultry
875,068 1,001,255 1,047,666 715,603 691,918 928,166 923,201 22% 22%
Year Total Livestock
40,662 44,158 44,514 43,655 41,835 39,117 39,465 -7% -11%
Dairy Cattle 330 334 341 348 353 354 369 -5% 6% Beef Cattle 10,829 11,368 11,939 11,634 11,275 11,008 11,192 -7% -4% Buffalo 3,057 3,104 3,136 3,171 3,238 2,405 2,287 -4% -39% Goats 11,502 12,770 13,167 13,560 12,701 12,566 12,456 -15% -9% Sheep 6,240 7,724 7,698 7,144 7,226 7,427 7,294 -13% 2% Pigs 8,704 8,858 8,233 7,798 7,042 5,357 5,867 12% -33% Total Poultry 834,406 957,097 1,003,152 671,948 650,083 889,049 883,736
22% 24%
Village Chicken
222,893 243,260 260,835 253,133 252,653 259,257 262,631 -12% 4%
Layers 54,736 63,335 70,623 38,861 45,531 69,366 66,927 41% 42% Broilers 528,159 622,965 641,374 354,004 324,347 530,874 524,273 49% 32% Ducks 28,618 27,537 30,320 25,950 27,552 29,552 29,905 10% 13%
12. The advanced degree of livestock sector development in Java and, to some extent in Sumatra, as compared to the outlying regions, poses difficult challenges to the government in terms of the equitable distribution of resources such as market support, sector upgrading, service provision, and human resource development. These challenges have only increased in the years following the financial crisis and the government decentralization and introduction of local autonomy that followed.
B. Consumer Incomes and Demand for Livestock Products. 13. Disposable household income is the governing factor in consumer decisions to purchase meat or other sources of dietary protein, and lagging consumer demand for livestock products has played a significant role in downturn of the livestock sector during the 1997-98 crisis. Prior to the crisis, the percentage of people below the national poverty line, which had steadily declined to 18 million urban and 27 million rural inhabitants by 1990, had risen by 1998, immediately following the crisis, to 32 million and 50 million urban and rural dwellers (Table 2.7). 14. Poverty statistics indicate the return to a gradual decline in poverty for 1999-2000, although the number of rural and urban persons below the poverty line remains higher than before the crisis. Even though in quantitative terms, the urban population was more severely affected than their rural counterparts, the percentage of rural dwellers dropping below the poverty line during the crisis was far greater., In 2000, both rural and urban poverty declined sharply for the first time since the crisis, although the overall pre-crisis poverty level has not yet been recovered. During the crisis years, many rural livestock owners were able to depend on self-sufficiency from their household-owned crops and livestock, and many rural producers

16
actually benefited from rising livestock prices (Table 2.8 *), as domestic beef, poultry and egg prices increased as the result of supply constraints from diminished imports, currency devaluation and inflation. 15. Indonesia ranks third last of all Asian countries, just above Cambodia and Laos, in per capita dietary animal protein consumption. This statistic is significant, as animal protein contains amino acids essential to human health that are not found in vegetable protein. Urban inhabitants, without access to self-raised poultry or eggs, were most affected by this drop in nutritional intake. The rising prices and diminished supply of livestock products during the crisis caused a 48 percent drop in daily per capita animal protein consumption, from 18.2 to 15.1 kg/capita/year, as shown in Table 3. This rate of consumption has recovered somewhat since the crisis, but has yet to return to pre-crisis levels. The dilution factor of Indonesia’s large population plays a determining role in these low average consumption levels. Indonesia’s drop in animal protein consumption following the crisis was far more severe than the Asia region average drop of 22 percent. Annex Table 2.9 has further details on consumption intakes of meat, milk and eggs. Table 3 – Annual per capita consumption of meat, milk and eggs (kg) (After Annex Table 2,9) Food Category 1995 1996 1997 1998 1999 2000 2001 95-98 98-01
Meat 7.9 8.4 8.0 4.2 4.2 5.2 5.1 -42% 42% Eggs 3.3 3.5 3.5 2.3 2.8 3.5 3.5 -46% 21% Milk 7.0 5.7 5.3 4.1 5.2 6.5 6.5 -30% 52% Total 18.2 17.6 16.8 10.6 12.2 15.2 15.1 -41% 59%
16. The crisis has shifted animal protein consumption preferences from meat in favor of dairy products, with eggs maintaining steady consumption levels throughout 1995-2001. Meat consumption, always subject to relatively rigid demand elasticity, dropped 42 percent during the crisis, and milk has replaced meat as the largest quantitative source of animal protein. The increased demand for milk and dairy products is driving the rapidly increasing trade deficit of dairy commodities (Table 2.10), and is putting pressure on improving the efficiency of the poorly performing local dairy industry.
C. Domestic Meat Production
17. Domestic meat production remained rather static during the seven-year period of 1995-2001, with the exception of a drop in broiler meat production during and following the crisis years, (Table 4; details in Annex Table 2.11). The production of mammalian livestock meat of all types (defined here as meat from large and small ruminants, and pigs) has not grown since 1995; a concern that requires further study as to cause. Even though semi-intensive cattle feedlotting has received some acceptance, most ruminant livestock meat is still produced under extensive, rural conditions, where considerations other than commercial production prevail. Pork and beef have the most potential for increased production, although the former is consumed by only a relatively small, ethnic population segment. 18. Aside from breed improvement through the DGLS national AI program and the introduction of commercial cattle fattening, there are no long-term programs to stimulate more efficient large or small ruminant production. Meat production from small ruminants (sheep and goats) has great potential, as investment costs and inputs are much lower than for cattle and therefore more accessible to lower income

17
rural households. A small ruminant project implemented in the 1980s3 clearly demonstrated the potential of small ruminant production, but replication and follow up has been uncertain.
Table 4. Serial Domestic Meat Production, 1995-2001 (‘000 ton) Change Type of Meat 1995 1996 1997 1998 1999 2000 2001 95-01 Total Livestock 630 685 656 606 572 626 629 0% Total Poultry 875 947 898 621 621 818 821 -6%
D Supply of Livestock Products
19. Poultry Supply. Poultry meat production declined by 6 percent throughout the period 1995-2001 (Table 4), and involved all poultry meat categories (ducks, village and commercial poultry) (Table 2.11). Duck production declined by 33 percent, and this negative trend requires further investigation as to those factors and incentives that impact on village duck production. Ducks are raised primarily for their eggs and are very prolific egg layers, and preserved duck eggs are a costly delicacy. Ducks are hardier than poultry and more disease resistant. Given these advantages over chickens, the potential for profitable village duck raising should be considerable. However, traditional duck keeping is very labor intensive, as duck are herded over long distances to graze fallow rice land. Village chicken production remained relatively static, as it was little affected by commercial feed prices. The most significant cause of village poultry failure is disease, (especially Newcastle Disease; ND), and the increased cost and availability of poultry vaccine supplies, largely imported, has impacted negatively on poultry losses from disease. Commercial egg production, heavily dependant on imported grains, dropped precipitously during the crisis, but has rebounded close to pre-crisis levels. 20. Meat Supply. Even though domestic beef and village poultry supplies compensated to some degree for the precipitous drops in commercial poultry meat supply, the resulting supply deficit could not be fully met, as domestic beef and poultry production was, by virtue of its relative low level of husbandry and market response, unable to respond quickly to the sudden market trends and lead times. The supply of livestock products comprises domestic production, augmented by supplementary imports to meet demand. Beef, broiler meat, pork and village poultry meat provide, in that order, most of the domestic meat supply. The combined domestic supply of meat, milk and eggs dropped 22 percent after the crisis (Annex Table 2.11 and Table 5) but has recovered 18 percent of this loss since 1998. Most affected, in order of severity, were broiler meat (-48%), pork (-24%), duck meat (-24%), and culled layer hen meat (-21%). The only increases in meat supply during the crisis came from beef and village poultry, both posting an increase of near 10 percent. Broiler meat amounted to 37 percent of total domestic meat supply in 1995, but lost this lead to beef during the crisis years, after which it regained its pre-crisis position. Village poultry meat, the principal meat consumed in rural areas, remained unaffected by the crisis and continued to provide 15 percent of the domestic meat supply.
3 Implemented by Winrock International on behalf of USAID.

18
Table 5 - Domestic Supply of Meat, Milk and Eggs (After Annex Table 2.11) Commodity (000 t) 1995 1996 1997 1998 1999 2000 2001 Change 95-98 98-01 Meat, 1,506 1,631 1,555 1,227 1,194 1,446 1,451 -19% 18% Milk 433 441 424 375 436 495 505 -13% 35% Eggs 736 780 521 457 428 430 445 -38% -3%
21. Milk Supply. Domestic milk production, relying largely on domestically grown forage and byproduct-concentrates, was relatively unaffected by the crisis, and dropped only 13 percent during 1998, subsequently recovering to exceed 1995 production levels (Table 5). In 2001, the total milk supply stood at 35 percent above pre-crisis levels, and 14 percent above 1995 crisis levels. Milk is a favored consumer staple, but the average per capita milk consumption was only 6.5 liters/year in 2001. Domestic milk production satisfies only one-third of consumer demand, however, and Indonesia imports twice as much fluid milk-equivalent milk products (mostly in the form of milk powder) as it produces domestically. In consequence, the importation of milk products post the largest and most consistent import-export deficits of all livestock products (Table 2.10). Institutional and technical factors presently constrain more rapid and efficient increases in domestic milk production (Section IV). In contrast to other commercialized livestock commodities, the domestic dairy industry as a whole benefited from the crisis, as farm gate and retail milk prices rose in response to the diminished imports of lower-priced milk powder, which has chronically depressed domestic milk production and supply. 22. Egg Supply. Domestic egg production responses parallel those of commercial broiler production, as both industries rely heavily on imported feedstuffs and, in the case of broiler meat, on upscale (urban) markets. Egg production dropped 38 percent during the crisis and has not recovered to pre-crisis levels (Table 2.11). Egg supply data are compiled for the commercial layer segment only, so that specific national data on village chicken egg production are not available, and are therefore only estimated in this report. Although village egg production on a per bird basis is very low, the national village chicken population is very large, and estimates of village egg production are in the range of 176,000 tons per year, or a substantial 40 percent of commercial egg production. Unlike the commercial egg supply, village egg supplies were unaffected by the crisis. However, village egg supply and demand does not influence the urban commercial egg markets, as village eggs are either consumed locally or traded at the local village level. Commercial egg production, like village egg production, is in balance with domestic egg supply, as no significant importation of table eggs takes place. Egg consumption contributes only 10 percent to dietary animal protein intake, only one-fourth the level of milk and meat consumption. Nevertheless, eggs are widely available, relatively cheap, and accessible to all consumers. There is great scope in increasing village egg production, and area that has recently begun to attract wider interest.
E. Trade – Imports, Exports, Sources and Destinations 23. Financial Crisis Impact on the Agriculture Sector. In constant prices, the livestock subsector nearly doubled its share to 11 percent of the national agricultural gross domestic product (GDP) during the pre-crisis period of 1980-95 (Table 6). This gain has stabilized at an 11 percent share of agricultural GDP since 1995, unaffected by the crisis and without much upward or downward variation since.
Table 6 - GDP in Constant Prices, 1980-1999 (Rp bln)

19
Sector 1980 1990 1995 1996 1997 1998 1999 National GDP 45,446 195,597 454,514 532,568 627,695 1,002,333 1,107,291 Agriculture sector 3,425 22,357 61,885 63,828 64,468 64,988 65,424 Livestock subsector 212 2,328 6,790 7,133 7,483 6,954 6,957 Livestock as % of GDP Agriculture 6% 10% 11% 11% 12% 11% 11% Agriculture as % of National GDP 7.5% 11.4% 13.6 12.0% 10.3% 6.5% 5.9%
Agriculture GDP as a share of national GDP declined substantially following the crisis, however, after having posted substantial expansion during the pre-crisis years of 1980 to 1995. Agriculture’s 1999 share of national GDP stood at 5.9%, compared to 7.5% in 1995. The loss of agriculture GDP’s contribution to the national economy is driving the Ministry of Agriculture’s (MoA) objective to renew its efforts to boost the agriculture sector as the mainstay of the rural economy. It became clear during and following the crisis that agriculture, and livestock, were significant mitigating factors in prevented even further drops rural incomes and rural poverty, and programs to intensify rural production continue to be fundamental to providing sustainable rural and urban livelihoods. In terms of GDP value in constant prices, the overall livestock and poultry subsectors contracted by 5 percent during the crisis, but is recovering well ahead of the agricultural GDP recovery rate; at 6 percent compared to 2 percent, respectively. In turn, the agriculture sector is recovering slightly more rapidly than the national GDP, which has posted little or no expansion since the crisis. 24. Livestock Sector Trade Balance. In the following trade balance analysis, the import and export of livestock products is defined under five main categories: Live Animals (GP and P poultry stock4, breeding cattle and pigs), Meat (beef, mutton, pork, poultry), Dairy Products (milk, butter, cheese), Eggs (table and hatching eggs) and Livestock Byproducts (meat and bone meal, leather, duck feathers imported for the shoe and apparel industries). Changes in imports or exports are expressed in real dollar value. 25. Livestock Commodity Imports. Total livestock and livestock product imports dropped 40 percent in value during the pre-crisis and crisis period of 1995-98, after which imports have posted a substantial 75 percent recovery from 1998 levels (Table 2.13). Most livestock commodity import categories, including meats, dairy products, live animals and raw leather, showed sharp import declines as the foreign exchange collapse of the Rupiah put the cost of these commodities out of reach to importers. Detailed import and export data for livestock commodities are presented in Tables 2.13 and 2.14. 26. Live Animal Imports. Imports of high-cost items such as live breeding animals, specifically Grand Parent (GP) and Parent (P) poultry breeding stock, breeding bulls and dairy cow breeding stock, were most severely affected by the Rupiah devaluation. Poultry breeding stock imports dropped three-fold from pre-crisis levels, and dairy and beef cattle imports virtually stopped since 1998, and have yet to resume. The reduction in GP and P stock imports, which drive the commercial layer and broiler industry, has had an immediate and catastrophic effect on broiler and layer production, which, deprived of breeding stock while facing large price increases for imported feed grains, virtually collapsed during and immediately following 4 GP (Grand Parent) and P (Parent) poultry stock represents the genetic base for commercial layer and broiler production. The genetic pools contained in GP and P stock are controlled by the world’s ten commercial breeding companies, which export this stock in the form of day-old chicks or breeding eggs to producers of commercial breeding farms.

20
the crisis. The almost complete cessation of replacement dairy cow imports from Australia by the Indonesian Dairy Co-operative GKSI, due to high prices and lack of sufficient funds, will have longer-term implications as delays in cow replacements will negatively affect future milk production. 27. Meat Imports and Exports. Meat imports dropped 45 percent during the crisis, but have since recovered to almost triple their 1995 import level (Table 2.13). The importation of poultry meat declined most sharply during the crisis. Indonesian consumers derive, after milk, most of their dietary animal protein from poultry meat, and the significantly decreased consumption of this commodity has a negative effect on dietary quality. Following the crisis, the importation of poultry meat, unlike mutton and beef, recovered rapidly and has risen substantially during the immediate post-crisis years. The importation of cheap US and European broiler parts, while undercutting domestic poultry prices, replaced, at least on a temporary basis. collapsed domestic production. Poultry meat importation is a contentious matter with government and the domestic poultry industry, as cut-rate import pricing is undermining the recovery of the domestic broiler industry. Furthermore, the matter of halal slaughter of imported poultry is under investigation. Indonesia has been a large importer of meat and bone meal from Europe (not clearly listed in import statistics), which has serious public health implications through potential infection of livestock and meat consumers with the agent transmitting Mad Cow Disease. Meat and bone meal (MBM) has been used extensively in Europe and developing countries as a protein source in animal feeds Meat or meat product exports from Indonesia are insignificantly small as they have little competitive advantage over meat products sourced from other Asian countries. 28. Dairy Product Imports. The importation of dairy products, especially of dried milk powder, has increased, driven by domestic supply constraints from a chronically under-performing domestic dairy industry (Section IV). Except for brief declines in 1997 and 1998, milk product imports almost tripled in dollar value between 1995-2000, representing one of the fastest growing livestock commodity imports, even though in terms of tonnage, imports increased by only 20 percent (Table 2.13). During the two crisis years domestic milk prices soared, which greatly benefited the domestic dairy industry, which has been chronically constrained from expanding by competition from imported low-priced milk products. 29. Milk Product Exports. In spite of large imports of dairy commodities, significant amounts of processed dairy products are exported for value-added. Processed milk product export values rose almost twelve-fold following the crisis, and butter exports quadrupled. However, the import-export balance of milk products shows a steadily growing deficit, rising from US$71 million in 1995 to $180 million in 2000. The large export volume and value of milk products seems quite irrational in the face of domestic shortages, compounded by a struggling dairy industry. However, most milk product exports comprise reconstituted milk powder products, blended and packed at low production cost from imported milk powder, and re-exported as finished product to neighboring countries. The export segment of Indonesia’s milk blending and packaging industry is therefore not affecting domestic milk production-consumption balances, unlike the industry segment directed at the domestic market. 30. Egg Imports and Exports. Pre-crisis egg imports were relatively low, as domestic supply was able to satisfy demand, but have almost tripled in quantity following the crisis years. The collapse of the layer industry suffered the same constraints that resulted in the collapse of the broiler industry due to rising imported feed grain prices and the near cessation of GP and P poultry imports, which required the substitution of such birds by importing lower-priced hatching eggs. Since 1998, egg import values, including hatching eggs for use by commercial hatcheries, have increased almost two-fold over pre-crisis

21
levels, and have regained their 1995 import value, albeit at double 1995 unit prices. Table egg imports have been hampering the recovery of the domestic layer industry, a matter presently under investigation by a government committee. 31. Leather Imports and Exports. Leather imports and exports are governed by Indonesia’s underdeveloped leather finishing industry. Between 15 and 35 percent of domestically produced leather is exported for finishing overseas, after which the finished leather is returned to Indonesia for use by the domestic garment and shoe manufacturing industries. 32. The Livestock Products Trade Balance. Indonesia has a demand deficit in livestock commodities and must import significant quantities of livestock products to satisfy the demand of its large and growing consumer population The financial crisis brought once again to the fore the negative economic impact of Indonesia’s heavy import dependency of its agriculture sector, a state of affairs which has renewed the government’s search for suitable import substitution options.. During the pre-crisis years, the country’s trade deficit in livestock products ranged around US$650 million per year, at an import/export value ratio of between 9 or 10 to 1 (Table 7, Table 2.10). During the last decade, the livestock product trade balance has posted consistent deficits, however, a trend the government is attempting to mitigate by means of an import substitution policy designed to increase the quantity and quality of domestic livestock production. Following the financial crisis, the livestock commodity import-export value ratio has declined to 3-4 to one, as imports dropped due to skyrocketing import prices. Following the crisis, the trade deficit has continued to increase in value, however. By 2000, livestock product imports had increased over exports to create an all time high trade deficit of $810 million, indicating, perhaps, that the search for solutions must continue.
Table 7 – Trade Balance of Livestock Commodities, Parameter Unit 1995 1996 1997 1998 1999 2000 Total Imports USD 000 582,690 661,996 572,651 348,485 518,343 609,134 Total Exports USD 000 65,566 61,766 58,013 110,558 112,947 200,700 Trade Deficit USD 000 -648,256 -723,763 -630,664 -459,043 -631,290 -809,834 Import/Export Ratio Ratio 8.9 10.7 9.9 3.2 4.6 3.0
33. The overall import-export balance of livestock and livestock products deteriorated by some US$162 million between 1995 and 2000, and would have declined further, had the drive toward domestic self-sufficiency in livestock commodities not been outpaced by the export or re-export of livestock commodities and processed or repackaged meat, egg and dairy products, in an effort to capture much-needed foreign exchange. The trade deficit for 1998, immediately following the crisis, was nearly half that posted for pre-crisis years, as imports of most commodities declined sharply as the result of the Rupiah devaluation. Constraining importation to correct the trade balance is, however, unsustainable in the long run, as it suppresses import-dependent domestic production. Domestic import substitution, or even domestic livestock product exports, remains an important national trade objective.
34. Prices. Retail prices for livestock and livestock products have increased very significantly following the crisis (Table 2.8), resulting from the Rupiah devaluation, increased feed prices and inflation. Feed prices have increased by over 200 percent since 1995 and show no signs of leveling off. Price ranges listed are difficult to interpret as their averages mask the seasonal festival peaks, during which prices can triple or quadruple. For example, prices for day-old chicks, sold for outgrowing and marketing just before festivals, can increase four to five times their non-seasonal price. The same is the case for beef and pork, with consumption peaks during new year celebrations and other festive social occasions. Commodity prices also
22
continue to escalate. Since 1995, breeding stock prices have increased by 300 percent, poultry by 139 percent, meats by 189 percent, eggs by 218 percent, and milk by 443 percent. These high prices are a major factor in the current depressed consumer demand for livestock products. With feed costs representing 30 percent of total production cost, and seed stock representing 10 percent, total production costs for commercial poultry and pigs have risen by an estimated 40 percent5. The prices listed are retail, and farm gate prices (not available) would be an estimated 40 to 50 percent lower. Small-scale poultry producers are harder hit by increasing production costs than the large agro-enterprises, small-scale producers operate on a smaller economy of scale, and their financial resources are weaker.
35. Feed Grain Imports and Exports. An estimated 50 percent of animal feed produced in Indonesia’s is imported, and feed industry depends heavily on imported feed ingredients. This constraint became painfully clear during the financial crisis, when feed prices skyrocketed, almost crippling the commercial poultry industry (Section VI). In 2000, Indonesia imported 2.5 million tons of corn, soybeans, fishmeal and meat and bone meal, and this amount has remained relatively stable over the years. Net domestic supply-demand balances for corn and soybeans turned negative during the crisis years, and increased imports have managed to maintain a positive, albeit gradually deteriorating balance (Table 6.7), supported by substantial imports at a significant foreign exchange expenditure. At import prices for corn of Rp1200/kg and Rp2100/kg for soybeans, the import value of these two commodities for the year 2000 was equivalent to US$ 28.3 million. Anticipated trade deficits for imported feed grains will continue, as domestic feed grain supply, both in terms of quality and quantity, cannot meet demand. Import substitution can only succeed if large corn production bases, operated by agribusiness, are established in off-Java locations. Plans for such production bases are being considered.
36. Domestic Feed Grain Production as an Import Substitution Policy. The government is searching for a sustainable import substitution for feed corn and soybeans through increased domestic production. Even though large areas of arable land have been identified for corn and soybean production, the cost-benefit of domestic production versus importation has not been clearly analyzed or defined. Feed grain production in such countries as Australia and the United States benefit from a production scale of economics that cannot be duplicated efficiently in an environment where lower levels of production technology, disease and pest control under tropical conditions, marketing and distribution all pose significant constraints. Most imported feed grains are used by the commercial sector, with the cash flows to purchase these commodities, and even severe importation constraints as witnessed during the crisis, were relatively brief before rebounding to pre-crisis levels.
37. More benefit could probably be gained from introducing greater production efficiency in the domestic commercial livestock production subsectors, thereby lowering feed costs and increasing profits. Improved post-harvest technology and agricultural commodity forecasting would provide crucial tools in this effort, as would closer coordination between the large commercial domestic producers. At present, most feed grains and soybeans are produced on a small household scale, scattered around the country, and therefore difficult to organize. As the smallholder level begins to commercialize, the need for improved feed grains will increase accordingly. To minimize demand, the emphasis on improved domestic hybrid crosses, especially of poultry (i.e. the ayam ras) warrants high priority, as does improved disease control and the reduction of neonatal mortality; presently a greater constraint to profitable production than feed grain availability. In any case, domestic grain production, were attempted, should be left to private sector incentive; the best barometer for potential profitability. 5 Production cost estimates for large and small-scale poultry farms were provided by the Indonesian Poultry Farmers Association.

23
SECTION III PUBLIC AND PRIVATE SECTOR INFRASTRUCTURE 1. This Section describes the roles and functions of public and private sector agencies and associations involved in national livestock production. The structure of the Directorate-General of Livestock Services (DGLS) is described, together with its Directorates, their mandates and recent reorganization. Representing the private sector, a number of the larger livestock producer associations are covered, and their impact on the livestock sector is described. In conclusion, farmers’ groups are covered and their importance in representing livestock smallholders is outlined. A general overview of the public and private sector livestock production infrastructure is detailed in Table 3.1. 2. Directorate-General of Livestock Services (DGLS). The Directorate-General is the central government authority responsible on behalf of the Ministry of Agriculture (MoA) for the planning, implementation and monitoring of national livestock production. This includes the formulation of policy, planning and implementation of national livestock development programs, provision of technical support services, regulatory oversight and livestock quarantine. DGLS comprises five Directorates to carry out its mandate, namely the Directorates of Animal Breeding, Livestock Production, Animal Health, Veterinary Public Health, and Programs. Each Directorate has a number of Sub-Directorates involved with specific functions and programs. This central organizational structure was, until decentralization began on January 1, 2001, replicated at the provincial, District (Kabupaten) and Subdistrict (Kecematen) levels as the Dinas Livestock Services (Dinas Peternakan). After Laws 22/1999 and 25/2000 came into effect, which granted autonomy to District and Subdistrict governments to reorganize into autonomous units, many Dinas offices have been undergoing restructuring or even abolishment of whole or part of units, as local governments, in accordance with their mandate, decide on local operational and financial local priorities in accordance with demand and available financial resources. The current organizational structure of DGLS is outlined in Figure 3.1. DGLS, on behalf of MoA, has the legal and operational authority to carry out livestock policy, staff accreditation, program standardization, disease surveillance and control, testing and quality control, and food safety (Table 3.2). This national authority overrides any local authority concerning food safety measures carried out by local governments. 3. Three semi-autonomous agencies, reporting to MoA, are responsible for livestock research, livestock extension and staff development. The Agency for Agricultural Research and Development (AARD) focuses on three disciplines: livestock research through the Central Research Institute for Animal Sciences (CRIAS), which coordinates research activities of the Research Institute for Animal Diseases (Balitvet) and the Research Institute for Animal Production, Balitnak), all located in or near Bogor, West Java. The National Center for Agricultural Extension Development (NCAED) trains livestock extension officers and develops extension methodology. The Agency for Agricultural Human Resources and Development (AAHRD) provides support in human resource planning, need assessment and skills development. 4. DGLS has undergone three reorganizations, in 1994, 2000 and 2001, to adjust its infrastructure to changing needs and conditions. Under the 1994 reorganization, The Directorates of BINA Programs and Farming and Processing (BINA Usaha Tani dan Pengolahan Hasil) were abolished and absorbed elsewhere. The 2000 reorganization by DGLS changed the Directorate of Distribution and Development (BINA Penyebaran and Pengembangan Peternakan) into the Directorate of Agroindustry and Marketing (Industri Primer dan Pemasaran Hasil Pertanian). This Directorate is now spearheading the new agribusiness-smallholder production program, under which small farmers’ groups collaborate with agro-
24
enterprises to form vertically integrated nucleus-satellite livestock production and processing entities. The third reorganization took effect on March 22, 2001, under which the Sub-Directorate of Veterinary Public Health (Direktorat Kesehatan Masyarakat Veteriner) was upgraded to Directorate status, with broadened national responsibilities for livestock product testing and quality control, quarantine and food safety. The upgrading of this Directorate was in direct response to the government’s policy of market globalization and increased livestock products trade, which will require greater animal disease control vigilance of outgoing as well as incoming livestock and livestock products, and would stimulate the production and processing of higher-quality meat, dairy and poultry products with which to compete in world markets. These initiatives are most significant in export-oriented dairy products processing and dressed, frozen poultry products. 5. Directorate of Livestock Production (DLP). This Directorate oversees the national field artificial insemination (AI) programs for dairy cattle, beef cattle and buffaloes. It also amalgamates and analyzes livestock production data from all other Directorates from statistics and reports obtained from the provincial and subprovincial (District and Subdistrict) levels. The statistical and technical data and information generated by DGLS originates mainly from DLP. This directorate is facing increasing difficulty in maintaining the integrity of its reporting system, as District reorganizations are disrupting information flows. Furthermore, DLP is experiencing a contraction of its national field AI programs, as budgets for the purchase and distribution of frozen semen have dwindled. 6. Directorate of Veterinary Public Health (DVPH). This upgraded Directorate has a strong regulatory mandate, with two important responsibilities: (a) animal disease surveillance and control, and (b) food safety and quality control of food processing. As indicated, the opening of markets to trade brings increased exposure to unwanted animal disease, requiring greater vigilance on the part of animal quarantine and inter-provincial or international animal movement. A new, expanded Quality Control Laboratory for Livestock Product Testing has been established in Bogor to oversee and monitor good processing and quality control issues. This laboratory is under construction, has an active program and well-trained staff. Its physical and human resource base remains, however, limited to adequately fulfill its national mandate, and additional inputs will be needed to further improve the scope and array of its work. 7. Directorate of Animal Health (DAH).This directorate oversees a network of seven regional (Type A) disease investigation laboratories, 26 Type B and C District or Subdistrict diagnostic laboratories, Dinas Animal Health Services in 380 districts, and a network of nearly 400 District-level animal health posts (poskeswan), which provides the service provision interface between public sector veterinary service and the livestock owner. DAH also supervises the national livestock vaccine laboratory (Pusvetma) in Surabaya, inspects local livestock markets, and carries out national vaccination programs (anthrax, Brucellosis, rabies, hemorrhagic septicemia). DAH also collaborates with the Ministry of Health of the control of zoonotic diseases, especially rabies, which still claims hundred of lives each year. DAH also oversees the certification, registration and quality control of veterinary drugs and vaccines.. 8. Directorate of Livestock Development (DLD).This Directorate oversees national livestock development programs, related to ruminant and non-ruminant species. Its programs involve intensification of livestock production, agribusiness-smallholder programs, and the use of crop byproducts in livestock feeding. 9. Directorate of Animal Breeding (DAB) operates nine central bull and buffalo stud centers and two AI stations, both in Java, for the production of frozen beef, buffalo and dairy semen for distribution across

25
Sub-Directorates
Directorate Livestock Production
Directorate Livestock Breeding
Directorate Livestock Programs
Directorate Livestock
Development
Directorate Animal Health
Sub-Directorate Veterinary
Public Health
Head, Provincial Livestock Services
Secretariat
District Livestock Services
Sub-District Livestock Services
Farmers’ Groups
Cooperatives Feedlots Dairy
Early Warning Disease Reporting
Under local government autonomy, each District now determines the type and scope of Livestock Production and/or Animal Health Services at the District, Sub-District and village levels. Some Districts may elect not to support livestock production or animal health services; others increase and upgrade such services, based on local need or demand.
Provincial and Sub-Provincial Reorganization
Smallholders
Directorate-General Livestock Services
the country. DAB control breed improvement at the central level through bull selection, the importation of genetics in the form of embryos, semen or breeding animals. DAB has Sections dealing with dairy and beef cattle, buffaloes, and poultry. 10. Figure 3.1 – Organogram of Directorate of Livestock Services

26
10. Organizational Constraints. Similar to other government directorates, DGLS is undergoing significant changes in its human resource base and national mandate, several of which may negatively impact on the country’s livestock sector. These include:
• Staff uncertainly concerning career development and job security. • Loss of uniformity in livestock production and disease data reporting, which may endanger
early warning disease surveillance, jeopardizing national animal health; contrary to the increased vigilance needed under the market globalization policy.
• Loss of contact with local governments in prevailing livestock production programs and policy.
• Need for additional budget to support more field travel by central staff. • Need for additional training budget to retrain central staff overseeing revised field programs. • Contradictory policy and program implementation by local autonomous governments
unfamiliar with their prevailing status. • Need for a shift in agricultural research management to reorganize extension and field
research stations to conduct applied livestock production research that is more commercially oriented.
B. Livestock Producers’ and Service Organizations
11. Union of Indonesian Dairy Co-operatives (Gabungan Koperasi Susu Indonesia – GKSI). GKSI represents all dairy farmer co-operatives, which consist of primary co-operatives, wholly involved in milk production, and secondary co-operatives, involved in dairy production and other agroenterprise. GKSI is overseen by the Ministry of Cooperatives & SME, and has 220 branches and 185,000 members nationwide. GKSI controls virtually all organized milk production in the country, and operates collection centers and milk processing plants. The co-operative members own 277,000 dairy cattle or 64 percent of the national total of 341,000 head. The remaining cows are individually-owned, and their owners sell milk directly to street or local outlets, or to GKSI. 12. GKSI, by virtue of its managerial and technical leadership, was established to lead the national goal of milk self-sufficiency. However, the organization is administratively top heavy and top-down and has been providing its membership with less than optimal support. Co-operative fees for milk collection and support services are high and not commensurate with the service quality expected by the membership. One-half of GKSI’s registered coop branches have stopped functioning due to bankruptcy and dissolution, and the GKSI membership has very little input in the daily affairs of the co-operative. 13. Dairy cow production parameters are very low (Table 3.3), and have not changed significantly in the last ten years. As the result of low reproductive efficiency, insufficient replacement cows are generated by GKSI and additional heifers are imported from Australia to maintain herd size, which has not appreciatively expanded during the last decade. However, GKSI has insufficient funds for continued importation, leaving its members with aging herds and, over the longer term, declining production. GKSI has considerable representation with government on dairy and trade policy, although little benefit trickles down to the producer level. 14. The national milk production program, as presently carried out by GKSI, is not responsive to the Government’s policy of greater self sufficiency in livestock production, and far more participatory

27
involvement by primary producers is needed. The small-scale village producer segment operating outside GKSI is equally unrepresented. Government decentralization and local autonomy will also impact decentralization by MoC to become more responsive to its members. The constraints to improving domestic milk production are at present far more institutional than technical. There are indications that the MoC, in response to the government’s decentralization policy, is taking steps to review its -operative organizational structure with the aim to render to coops under its management more participatory and bottom up by providing its members a greater say. This would provide a window of opportunity for much needed change. 15. Indonesia Cattle and Buffalo Producers Association. This organization represents a pool of some 3 million cattle and buffalo owners, but is presently virtually non-operational. Reasons given for its inactivity relate to the fact that most cattle and buffalo keepers own their livestock as a sideline source of income, used mainly as a source of rapid cash in household emergencies, and for such non-commercial purposes as festivals, weddings and other social events. Their widespread dissemination across the rural countryside also makes cattle farmers difficult to organize into a national entity that enjoys strong representation with government. Yet, there are significant issues to be resolved in the cattle subsector, especially where a rapid commercialization of cattle from traditional draft power to beef fattening is underway; issues related to cattle movements and trade; out of control head and transportation taxes; quarantine issues; the slaughter ban on reproductive cows that hampers breed improvement, vaccination programs and Brucellosis control; animal health services, AI programs and their effectiveness, local slaughterhouse capacity constraints, and locally captured value-added beef processing over primary beef production and distant processing. At present, village cattle owners primarily deal with their local Dinas Livestock Service, middlemen and cattle traders, each with their own agenda. 16. As with village poultry owners, village-based, low-input-low-output production systems for cattle lack the necessary incentives for intensification and thereby lack the incentive by cattle owners for organized representation. Factors stimulating such incentives include better access to credit and markets, and upgraded animal husbandry technology (e.g. crop byproduct feeding; semi-intensive feedlotting and fattening) to scale up from subsistence to surplus cash production. Cattle fattening, a relatively new form of intensified cattle production in Java and some of the Eastern Islands, is an important avenue toward upgrading cattle performance, and cattle fatteners may well become the first producer group with a need for representation. Unlike the government INTAB (Intensifikasi Ayam Buras) program aimed at improving village poultry production, the government does not implement a similar cattle intensification program. Government-supported AI and veterinary services are the most significant public sector program for improved cattle production. 17. Poultry Producers’ Organizations. The organizational structure of the poultry industry is complex and includes poultry breeding farms, hatcheries, commercial layer and broiler producers, and the feed milling industry. The commercial poultry industry is by far the best organized, strongest and best represented producer group. An umbrella organization, MATERINDO, represents all organized poultry associations and is lead by a former parliamentary House Speaker with firm government contacts. At least three organizations operate under MASTERINDO: the Association of Poultry Breeders (GAPPI), representing GP and P breeding farms and hatcheries; the Feed Mill Association (GPMT), which sells most of its compound feed to the poultry industry; and two poultry producer associations, the Union of Poultry Breeders (Gebungan Perusahaan Pembibitan Unggas Indonesia – GPPUI), and the Poultry Producers’ Assembly (Perhimpunan Peternak Unggas Indonesia –PPAN). The latter two organizations broke away from an earlier organization, and now separately represent poultry producers.

28
18. The financial crisis has impacted mostly on the poultry and feed mill organizations, as they represent the importers of the poultry breeding stock and the feed grains on which the commercial poultry industry depends. With a seven-fold Rupiah devaluation and sharply decreased consumer demand, commercial poultry production all but collapsed during and immediately following the crisis. The Government briefly subsidized feed grain imports by supporting the import price for imported feed commodities (principally soybeans, corn and fishmeal) above a floor price of Rp5,000 per kg, but this unsustainable and expensive measure could not stem inevitable price increases. The poultry organizations are now working with government on a series of issues that arose during the crisis, involving:
• Fine tuning supply-demand forecasting for imported feedstuffs and day-old chicks, • Collaboration between small-scale producers and agribusiness, • Development of export markets for poultry products • Finding replacement commodities for imported feedstuffs, such as rice bran and other agro
industrial byproducts, • Increasing business relationships with poultry and feed industries in other ASEAN countries, • Streamlining the issue of import permit for breeding chicks, and • Applying to APEC for extended import protection, related to the Venezuela and Tokyo
Rounds of negotiations on the import-export status of second-tier (i.e. developing) countries, under which global markets are scheduled, in 2010, to be fully opened and non-subsidized.
9. Indonesian Feed Mill Association (Gebungan Pakan Makan Ternak – GPMT). This association represents most commercial feed mills, which together produce a total of 4.5 million tons per year (tpa) of compound feed. The Indonesian feed industry relies for 50 percent on imported corn, soybean meal (SBM), fishmeal and meat and bone meal (MBM), and its main objective is to facilitate imports, import prices and import permits, lobby for government price support, and investigate the potential for increased self sufficiency of local feed grains, especially soybeans and corn. The feed industry was hard hit during the crisis, when feed production declined from 6 million to 2.5 million tons per year as the result of skyrocketing import prices. GMPT’s close association with the poultry industry is based on the fact that 80 percent of feed produced by its members is sold to the commercial poultry industry. GPMT is highly politicized and has close ties with government to achieve its goals of import protection, import licensing, preferential treatment under APEC, and import substitution through domestic feed self-sufficiency. 10. Indonesian Veterinary Medical Association (IVMA). This association represents some 2,700 veterinarians, of which over 2,000 are private practitioners. Licensing and registration as veterinary professionals is controlled by DGLS, a state of affairs IVMA, as the representative of the veterinary profession, wishes to change, in line with government’s decentralization policies. The association operates the Jakarta Small Animal Hospital, the largest such facility on the country, which collaborates with veterinary faculties as a teaching hospital. IVMA has professional liaisons with a number of international veterinary associations, including the United States and Canada. The Association’s immediate goals include (a) developing a code of professional ethics for its members, (b) gain autonomy from DGLS in the licensing and certification of graduate veterinarians, and (c) improve technical skills and instill greater professionalism in its members. 11. Indonesia Veterinary Drug Association (Asosiasi Obat Hewan Indonesia - ASOHI). The Association represents some 1,700 veterinary drug manufacturers, importers, agents and distributors.

29
Indonesia has 36 drug producers and repackers, supported by 198 distributors and 1,470 agents, depots and veterinary or drug shops. The Association represents the retail industry in the distribution and sale of veterinary vaccines, feed additives, injectables and oral medications, and feed premixes. ASOHI mainly deals with the Directory of Animal Health, commercial poultry, pig and dairy sectors, but its members also own and operate veterinary shops (toko hewan), that retail at the village level and are important suppliers of poultry vaccines and drugs to local farmers and poskeswan veterinarians. Indonesia’s veterinary pharmaceutical industry relies heavily on imported ingredients and is principally involved in the blending and repacking of pharmaceuticals, rather than in primary production. A network of distributors imports drugs and vaccines from overseas, representing all major international brand companies. Its heavy reliance on imported goods puts the Association in a position similar to those representing feed millers and poultry growers, and its issues are therefore similar. There is close collaboration between ASOHI and these industries.
C. Village Farmers’ Organizations 12. Farmers’ Groups (kelompok tani). Village farmers’ groups are widespread across Indonesia, and represent the organizational structure of livestock farmers and other groups. Farmers’ groups are usually established under some degree of supervision by village or Subdistrict government, such as the village head (Kepala Desa), or, depending on their activity, by staff of one of the Dinas services, such as the poskeswan veterinarian or the local livestock extension agent (PPL). In the case of livestock farmers’ groups, Dinas Livestock Services is often involved in overseeing, and providing technical support services. Social organization is very strong in Indonesian society, and social activities therefore play an important role in farmers’ groups. 13. The number of livestock farmers’ groups (kelompok tani ternak), between 1993 and 1997 (latest data) has increased from 37,000 to 54,600 groups (Table 3.4) *, an increase of 56 percent (no published data are available beyond 1993). By comparison, the number of livestock households increased from 3.74 million to 4.49 million between 1983 and 1993, an increase of 20 percent. The degree of organization, as measured by the ratio of livestock-owning households to livestock farmers’ groups, differs between regions (Table 3.4).* As measured in 1993 (latest census data), the average national ratio stood at 132 households per farmers’ group, ranging from a low 60 households per group in Sumatra to a high of 240 households per group in Java. The ratios in outlying regions were quite close to the national average. Twice as many livestock farmers’ groups (20,000) are involved in cattle raising than in village chicken or sheep and goat production, the next two most popular farmers’ groups. The interest in joining such groups is perhaps an indicator of which livestock species has the most potential for organized village-based livestock development. 14. Livestock farmers’ groups tend to be organized by livestock species, raising cattle, buffaloes, small ruminants, poultry, rabbits or ducks. Women also organize into farmers’ groups, usually for the purpose of raising ducks, village poultry or rabbits, and usually tend to be very successful. Farmers’ groups are socially well organized, in accordance with prevailing local customs, but have little or no influence outside their village. Their social cohesion—a cultural trait—makes farmers’ groups very suitable start-off points for extension workers and village service providers (poskeswan staff, inseminators) for introducing new animal production technologies, micro credit schemes, group saving pools, or contracted veterinary or AI services. It is yet unclear how the increased local government autonomy will affect existing farmers’ groups, but the increased focus on self-help and self reliance, linked with dwindling local government budgets, will inevitably increase the responsibility for livestock farmers to take control of their own livestock production

30
environment. Local government autonomy has opened a window of opportunity for village farmers’ groups to better represent themselves with their Subdistrict and District governments. 15. Changing Roles of Producer’s Organizations. As indicated, the financial crisis emphasized the need for producers’ organizations to better represent their interests during times of severe economic stress. This was especially the case for poultry and feed industry associations. In general, producers’ organizations remain top heavy in their management and structure and their contacts with the public sector are generally rather non-confrontational. The introduction of local government autonomy will create new stresses as well as opportunities for producers’ groups, which, if effective, can have a more direct impact on their local governments. For producers’ organizations to serve their membership effectively, the development of leadership skills will become increasingly important, as will their understanding of prevailing livestock production policy as it affects their area. 16. The dairy cooperative GKSI occupies a special category as it spearheads the government’s policy of dairy self-sufficiency. Its milk production objectives and policy as well as their implementation by GKSI, are flawed and doomed to failure, as evidenced by the dwindling membership and lagging cattle performance. The organizational location of GKSI under the Ministry of Cooperatives instead of Agriculture has prevented GKSI from receiving sufficient technical and managerial backstopping. Its cooperative structure is also suspect, given its heavy public sector-dominated daily affairs, and a only drastic reorganization, complete with self-management and organizational autonomy, would suffice to begin rectifying those constraints that have prevented a more actively involved membership. 17. Poultry associations represent the most promising and potentially most useful organizations to benefit smallholders, and with the introduction of new village poultry schemes (the RRMC village poultry program) such kelompok tani ayam may well flourish. 18. In summary, producers’ organizations in Indonesia can benefit from the following inputs to make them more effective and allow producers to take advantage of the opportunities presented by government autonomy.
• Leadership training in group management • Technical back up elated to field of activity • Broader, top-down membership participation • Increased sensitization of local governments to the purpose and needs of producers’ groups • Small-business and micro-enterprise skills development • Local market development and marketing • Increased access to livestock price information • Introduction of association-driven micro-credit and micro-finance.

31
SECTION IV – LIVESTOCK PRODUCTION SYSTEMS 1. Livestock production systems in Indonesia can be divided into commercial, large-scale (pigs, poultry, dairy cattle) and non-commercial, small-scale village-based systems (village poultry, ducks, small ruminants, buffalo, cattle). There are intermediary production systems that overlap, especially where subsistence production is shifting to cash production, such as in semi-confined layer duck production, confined goat production, village hatcheries for indigenous or hybrid poultry (ayam kampong or ayam buras), or small-scale cattle fattening on crop byproducts. Livestock production systems can also be classified according to their environmental-climatic location. The systems described here are classified by species, together with some detail regarding their national distribution and any development interventions by the private or public sector. Serial livestock distribution tables are presented as background reference in the Annex by species, region and year. Population and distribution trends for individual livestock and poultry species are discussed. In conclusion, downstream production linkages are covered.
A. Poultry Production Systems.
2. The Commercial Poultry Industry. The poultry industry in Indonesia is divided into small-scale, capital extensive village-based production, utilizing mainly local feed grains and ingredients, and large-scale production on large farms, involving capital-intensive commercial layer and broiler production, relying heavily on imported feed grains, and largely concentrated in Java and Sumatra. An overview of the national commercial poultry industry is presented (Tables 4.1). With the exception of GP breeding stock farms, the commercial poultry industry has vertically integrated, from the supply of day-old layer and broiler chicks (DOC) to commercial egg and meat production, slaughtering, processing, cold storage and distribution. The industry has strong representation with government through several producers’ associations (Section III), and is actively supported by the feed mill and veterinary drug industries, whose business relies most heavily on the commercial poultry industry. 3. Over 80,000 poultry farms, holding 60 percent of total national commercial broiler and layer production are located on Java, followed in number by Sumatra. Since most poultry infrastructure, comprising feed mills, abattoirs, cold storage and urban markets, are located on these two islands, the industry has shown little incentive of moving to outlying regions, to which it transports eggs and live birds. The private sector controls veterinary services, vaccination, drug and feed supply for commercial poultry. The financial crisis has affected the broiler and layer industries more severely than any other commercial or non-commercial livestock production systems (Tables 4.2a, b). 4. A number of the major international poultry breeding companies (Ross, Cobb, Arbor Acres, Hubbard and Hyland) supply GP and P breeding chicks to Indonesia, which are grown out and crossed on certified breeding farms to produce commercial hybrid layer pullets and broiler chicks for sale to producers. There is little or no contact between the commercial and village poultry production segments, as there is little overlap between their husbandry systems, type of production inputs and markets, so that demand-supply projections for village and commercial poultry must be undertaken separately. The government’s recent promulgation of the agribusiness-smallholder cooperative (the nucleus-plasma scheme) program is receiving much attention from the poultry industry, and discussions are underway as to the mode and means of how agribusiness can collaborate with village producers, in the form of nucleus-satellite production models, by which poultry agro-enterprises provide young chicks or pullets, feed and services to contract village producers in return for markets and agreed farm gate prices. Equitable participation by the

32
smallholder in such models is a matter of much concern to government ad producers alike, and discussions are underway on how best to resolve this issue. 5. Feed self-sufficiency is a major issue of much debate in the poultry industry, which depends for 50 percent on imported feedstuffs, which in turn influences 25 percent of the cost of poultry production, and caused the near collapse of the industry during the financial crisis. Domestic feed grain production is realistically feasible only for corn and perhaps for fishmeal. The major corn production areas in Indonesia produce 1.5 million tons of corn per year, mostly in Java and Sumatra, and the latter has the necessary cropland to increase production. Section VI presents more details on the feed industry, feed grain trade balances and feed self-sufficiency. 6. Village Poultry Raising Systems. Village poultry production in Indonesia comprises three systems: (a) scavenging with indigenous birds (ayam kampong) and little or no supplementary feeding other than household wastes, (b) semi-confinement (at night) of hybrid village poultry (ayam buras), with part grain or broken rice and household waste feeding, and (c) full confinement of ayam buras dual purpose meat-layer hens, using purchased feeds, strict vaccination for Newcastle and other diseases, and the purchase of chicks from local hatcheries. Egg production of village poultry increases with the degree of management. Under scavenging conditions, village chickens can produce 40-50 eggs per laying period; under semi-intensive systems 60-90 eggs; and under intensive systems 100-140 eggs. The average contribution of village poultry to household income from raising 100 birds is estimated at about Rp300,000 per year, which can increase ten-fold under intensive management with good housing, feeding and disease control. 7. Mortality rates from predators and disease in these three poultry systems are the main determinant factor of productivity, which in turn depends on the degree of confinement practiced. Semi-intensive ayam buras layer units can house several hundred birds and be quite profitable, with eggs and culled hens sold in local villages and wet markets. Although egg production is relatively low, village eggs and village poultry meat are preferred over commercial poultry and fetch premium prices. Village egg prices have quadrupled since 1995, to Rp800 per egg, and village poultry meat, at Rp 18,000/kg retail, brings double the price of commercial broiler meat. Production costs of confined village poultry units can be 50 to 70 percent lower than those in commercial units, mainly due to lower feed costs, which include broken rice, rice bran, and soybean waste, local fishmeal or cassava. Commercial poultry feed averages at Rp2,200/kg, compared to Rp1,100/kg for village-mixed, lower to medium quality feed. 8. The greatest single constraint to viable village poultry production is Newcastle Disease (ND), a viral infection that can devastate village poultry populations and result in 80 to 90 percent mortality in unvaccinated chickens. Villagers are often reluctant to invest in poultry production because of the threat of heavy losses from ND. Strict vaccination using the attenuated eye drop ND vaccine is simple and effective, but ND can only be controlled on a village basis so that the critical mass of non-vaccinated, susceptible chickens is reduced to sub-pathogenic levels. The logistics of vaccinating the entire chicken population in one village is problematic, however, and strict confinement, combined with vaccination, remains the key to preventing heavy losses. The Center for Research in Animal Science, Balitnak, is conducting performance trials on improved hybrid ayam buras crosses with increased egg production. Programs such as this, together with improved husbandry, are important in improving the profitability of small to medium-scale, semi-commercialized village poultry production.

33
9. The INTAB Village Poultry Program. The village poultry intensification program (Intensifikasi Ayam Buras - INTAB) was designed by DGLS to assist villagers in intensifying meat and egg production from village poultry, thereby increasing the availability of dietary animal protein at the village level. INTAB has been implemented in 27 provinces. The program involves the introduction of improved poultry husbandry, vaccination against ND, and improved feeding and housing. The program’s output indicators include meat and egg production, vaccination, and the number of village poultry (apparently not the number of participating villagers) involved in the program. However, the program has recently been discontinued because of a lack of interest on the part of participating village poultry owners, who apparently saw little merit in joining. 10. An evaluation of the program indicators and accomplishments may clarify some of the reasons for the limited success of INTAB (Table 4.3). Some of the causes for the failure of INTAB, as discussed with DGLS, include the following and are important in understanding how to better design participatory programs that provide the necessary incentive for villagers to participate:
• Only 63 percent of participants stayed with the program to its completion, • The vaccination program against Newcastle disease was irregular, and dropped to 35 percent
coverage in 1998, which precipitated the high disease incidence and mortality it was supposed to prevent,
• As a result, meat and egg production reached only 60 percent of target, • Cash income from the program was far less than anticipated, • Organization by participants into groups (kelompok tani ayam buras) did not succeed in providing
the necessary support and cohesion, due to a lack of enthusiasm and lack of faith in the program, • Technical support services (vaccination, veterinary and extension support) were insufficient and
program administrators did not provide sufficient leadership, • Access to markets and inputs were insufficient, and • The program was top down in administration and provided little participatory opportunity for group
members.
11. The Rural Rearing Multiplication Center (RRMC) Program. In contrast to INTAB, the RRMC village poultry program is well designed, participatory in nature, and provides the necessary incentives to ensure success. Funded by the Japan International Business Cooperation (JBIC), a private sector NGO, RRMC is replacing the public sector-supported INTAB program. RRMC is a well-integrated village chicken production program, linking agribusiness with village farmers (i.e. the nucleus enterprise-satellite farmer model), The RRMC program provides an excellent model for a small-scale vertically integrated village poultry production, involving smallholders, private sector agribusiness and public sector Dinas Livestock Services. The RRMC program is now under implementation in 17 provinces, with RRMC centers established in 17 Districts, involving 70 RRMS production units comprising 532 poultry farmers’ groups and 123,300 farmer participants. The RRMC program began implementation in 1999/2000, and is established in Java (16 units), Sumatra (20), Bali (5), Nusa Tenggara (11), Kalimantan (10) and Sulawesi (8). 12. Each District RRMC coordinates fully integrated production inputs and support services, which include a local chick breeding and hatchery unit, a small feed mill, participation by the local village animal health unit, the poskeswan; a poultry production unit, a small poultry slaughterhouse, and a marketing unit. Each unit has its own management and must operate financially independent from the others. Agribusiness

34
supplies young chicks, feed and poultry management, and buys back the finished poultry for processing and marketing. As a precondition for the establishment of RRMCs, all responsibilities on the behalf of village farmers’ groups and participating agribusiness must have been met. Public sector support for RRMCs involves poskeswan participation, ND vaccine supply by Pusvetma, the central vaccine production laboratory; and backup support from the local Disease Investigation Center (Type A regional diagnostic laboratory). Public sector support includes the breeding chick supply by local village poultry breeding firms, and assistance in the establishment of a small poultry feed mill. 13. Early observations of the RRMC program include:
• Management of the RRMC center is important, especially for the location of markets and the setting up of an integrated production supply chain.
• Farmers’ groups must actively support their RRMC by direct involvement in administrative and business decisions.
• The production system must be bottom-up, participatory, transparent, and producer-driven. • Management and program monitoring, including trouble shooting and problem solving, must be an
ongoing process and directly involve the farmer-producers. • Prevention of disease through good management and vaccination, especially for ND, is essential for
success. • A supply of high-quality (i.e. healthy, vaccinated) chicks must be available in a sustainable and
timely manner. • Agribusiness-smallholder business relationships have to be put on a legal framework that is
equitable for producer and processor. • Managers of the hatchery, feed mill, production unit, slaughterhouse and marketing unit should
receive thorough small business management skills training. • Financial management of each unit is important, especially concerning repayment of investment,
and relationships with local banks. 14. It is clear from the above that the RRMC program requires substantial coordination and cooperation between a number of parties, and that managerial small-business skills are essential to achieve such coordination .Furthermore, the incentives for each parties to want to participate must be carefully defined. Participating producers will need significant training inputs into small business management and the poultry husbandry, and local animal health services must not fail the program. 14. Duck Production Systems. Duck production systems range from extensive foraging with flocks of 100 layer birds feeding on fallow rice fields, to intensive, confined egg production, using purchased inputs. Extensive duck production is quite labor intensive and requires full time herding. In Java, two to three rice crops per year require that flocks move frequently. As fallow periods are short, duck herders are forced to move their flocks frequently and can cover several hundred kilometers per production cycle. In South Kalimantan, ducks are kept near the house and fed on household wastes, shrimp heads and earthworms. Duck herders may keep two flocks, each of different color and at different production stage, to maintain a constant cash flow. Duck hatcheries include traditionally heated rice hulls in woven baskets, hatching eggs under Muscovy ducks that can hatch larger clutches, and kerosene-heated incubators. Hatched ducklings are raised to 6 months by breeders and then sold to herders for laying or finishing. Most duck production is for eggs, with meat from culled layers as the side product. Tegal layer ducks are most commonly used for laying.

35
15. The major constraint in traditional duck keeping is the intensive family labor required in herding and feeding. Duck production dropped sharply during the crisis, to 10 million birds; a figure well below 1995 numbers (Table 4.4), and duck raising households have similarly declined in number. The decline in duck production is due to limits in available family labor, especially where more profitable off-farm employment opportunities are found to augment income. Given their hardiness and survivability under backyard conditions, the reasons for this decline, other than labor intensity, are not entirely clear, as even semi-intensive duck production is quite profitable and not very capital intensive. Investment in 40 Tegal layer ducklings, including feed and medicine, can bring a 60 percent return in one year. More work needs to be carried out to identify the constraints to duck raising, and confined systems need to be developed that negate time-consuming herding.
B. Large Ruminant Production Systems
16. Dairy Cattle Production. Indonesia’s commercial dairy subsector is struggling and in urgent need of an analysis as to the comparative advantages of import substitution. At present, domestic production is hampered by imports. Two production systems govern dairy production in Indonesia; co-operative smallholder and private smallholder production. Co-operative milk production is the predominant production model and is entirely in the hands of the national milk co-operative GKSI (Union of Indonesian Dairy Co-operatives) in Java, which holds 80 percent of the national dairy herd (Table 8). GKSI has 186,000 member farmers, of which currently only 56,000 remain active, each with an average 5 dairy cows. registered in 200 village cooperative units (koperasi susu unit desa, KSUD), of which only about one-half remain functional. GKSI manages primary and secondary dairy co-operatives, engaged either fully or partially in dairying. An overview of the national dairy industry is detailed in Table 4.5. 17. Dairy cow production parameters are very low, with an average 300-day lactation period of 3,363 liters per cow; calving intervals of 18-20 months; and estimated conception rates (GKSI does not publish production parameters), using AI, of 50 to 65 percent per pregnancy (Table 4.6), amounting to 3.5 inseminations per live birth. These parameters have not improved significantly in the past decade. As the result of low reproductive efficiency, GKSI is unable to generate sufficient numbers of replacement heifers to sustain its dairy herd and has had to import pregnant dairy heifers from Australia. However, no replacements have been imported in the last three years due to a lack of funds, which has left coop members with aging herds and, over the longer term, further declining milk production. 18. Ironically, Java, with a high-volume commercial milk market, is technically the wrong location for intensive dairy production, as the forage base to adequately sustain dairy cattle production is severely limited by its high population density and lack of suitable land and climate. Although access to consumer markets has been the prime factor in locating in Java, dairy producers have insufficient land base on which to grow adequate forage. The undernourishment that is commonly encountered in dairy cattle is the direct result of inadequate and low quality forage feeding, combined with the farmers’ poor understanding of the basic feeds and feeding principles. Dairy cattle require a consistently high quality, high-density nutrient intake of fresh and processed forages and grain concentrates, if they are to meet their genetic potential for milk production. With Holstein Friesians as the selected dairy breed in Indonesia, these nutrient requirements are substantial, and chronic underfeeding is the second largest cause, after climate, of low milk output and poor reproductive efficiency.

36
19. Id domestic dairy production is to become viable, serious thought should be given to replacing the purebred Bos taurus temperate-climate Holstein breed with tropic-resistant hybrid dairy breeds such as the Australian Milking Zebu (AMZ) or similar crosses of Jersey, Brahman and Zebu, which are used to good effect in dairy operations in Northern Queensland and the Philippines. These animals are smaller and require less forage, and their lower milk production more than compensates for better fertility, higher disease susceptibility and longer lifespan. 20. GKSI provides milk collection and veterinary services to its members for a user fee, and owns most dairy processing capacity in Java. Milk quality is reportedly poor, and milk contamination had been shown to take place after the milk has been collected from smallholders, due to improper sanitation of milk trucks and an inadequate chilling chain between farm and dairy plant; the responsibility of GKSI. An estimated 5-10 percent of fluid milk may be rejected as unsuitable for processing, either from external contamination or from the presence of antibiotics (used to control mastitis). In response to the low milk quality, the Australian state governments of Victoria and Queensland conducted four milk hygiene workshops in 2001 in Indonesia and Malaysia to assist local authorities and milk processors with this problem. More workshops are scheduled. 21. Milk retail prices have more than quadrupled since 1995 (Table 2.8); mostly the result of inflation and the Rupiah collapse and, to a lesser extent, from increased production costs. Farm gate milk prices are periodically negotiated between KSUDs and GKSI, but are held to a ceiling price. With two-fold increases in production costs and over four-fold increases in milk prices since 1995, the widening farm gate profit margin has favored producers. As is the case in other countries, milk pricing is not immune from political manipulation, as a government policy of low food costs prevails, exacerbated since the crisis, that favors consumer over producer. 22. The struggle to improve and increase domestic milk production is a classical example contravening government policy, by which import substitution of lower-priced milk products depresses the incentive to increase domestic production. As a result a vicious cycle has developed, in which increasing shortages in domestic milk supply are compensated for by increased milk imports, thereby further depressing local prices and constraining expansion of the dairy subsector toward national self-sufficiency. On a dollar basis, almost twice as many dairy products are currently imported than produced domestically, and this trend shows few signs of abating. The comparative advantage of domestic milk production over domestic poultry meat or eggs seems obvious, but with the co-operative milk production system already in place, alternatives are politically unpalatable. Table 8 – Dairy cow ownership in Indonesia (GKSI data) Type of Ownership Unit 1995 1996 1997 1998 1999 2000 National total 000 hd 331 331 353 322 332 341 GKSI-owned 000 hd 241 248 268 262 259 277 Privately owned 000 hd 88 79 83 60 73 64 Imported Cattle Head 1,727 4,350 1,563 -- -- --
23. If domestic milk production is to become a realistic and efficient contributor to alleviating the national dietary protein gap, the following measures need to be considered:

37
• Conduct a major investigation as to the comparative advantages of domestic milk production over import substitution. Should this analyze favor domestic production, undertake the following steps:
• Gradually phase out milk powder importation (the principal competing dairy commodity), in balance with increasing domestic production.
• Completely privatize milk production and allow dairy smallholder to select their own form of organizational structure and management. Reorganize GKSI into a bottom up, participatory and more transparent organization, run and operated by milk producers instead of bureaucrats.
• Shift GKSI from the Ministry of Cooperatives to MoA/DGLS as the line ministry/agency responsible for technical and regulatory oversight (milk quality, public health, breeding and breed improvement), as DGLS has greater technical and institutional capacity than does MoC to address livestock production issues.
• Place all GKSI employees (veterinarians, office and milk collection staff) on performance-based contracts, on a merit-demerit system to provide work incentives and improve employee performance and accountability.
• Introduce trials with AMZ tropical hybrid dairy cattle as an alternative breed to improve milk production.
• Improve technical support services for breeding and veterinary care, through training of support staff and farmers.
• Expand school milk and educational programs to get young consumers used to dairy products. • Adopt a “Farmers First” attitude.
25. Beef/Draft Cattle and Buffalo Production Systems. Cattle production generally comprises a low-input, low-output production system, resulting in low beef offtakes and long production cycles that do not lend themselves well to intensification and rapid market response. Nevertheless, beef is a popular food and demand is increasing. With the exception of a few privately-owned cattle ranches in Eastern Islands, mostly comprising joint ventures with Australian participation, and a few fattening lots in East Java, almost all cattle remain in the hands of smallholders who use them for draft power, social occasions, cash safety nets and, to a lesser degree, for slaughter and fattening. It is not surprising, therefore, that the national cattle herd was little affected by the financial crisis, as their production systems are only marginally affected by markets and need for credit. Comparative performance parameters for large ruminants are summarized in Table 4.5. 26. Indonesia hosts four cattle breeds, the Ongole in Java, Bali cattle in Bali and some of the Eastern Islands, the Aceh in North Sumatra and the Madura. Swamp buffaloes and cattle are used for draft power in the lowland rice growing areas of most islands, and in the Central Sumatra uplands, although mechanization has reduced their usefulness and numbers. As indicated, cattle and buffaloes play an important role in the social and religious lives of rural people, and their most important economic impact on livelihood is their quick conversion into cash during times of emergency, such as took place during the crisis. Crossbred Australian cattle have been imported by ranches in Nusa Tenggara, and Bos Taurus beef cattle semen (Simmental, Brahman, others) is used in the national AI program to crossbreed indigenous cattle. No deliberate breeding programs seems in place to identify suitable beef crosses for the variety of environmental conditions and markets that prevail in Indonesia. An urgent priority would be to identify crossbreds most suitable for feedlotting under semi-intensive conditions. 27. Cattle inventories have remained static throughout the pre and post-crisis years, and were not significantly affected by the crisis (Table 4.6). The introduction of local government autonomy has had some impact on cattle inventories, however, as the slaughter ban on productive cows (for both cattle and

38
buffaloes), once enforced by provincial Dinas Livestock Services, is being ignored by many District governments. As a result, an estimated 30,000 breeding cows, equal to 10 percent of the national cowherd, have been slaughtered illegally since the onset of local autonomy in early 2001. In addition, cattle owners have been forced to sell off open and pregnant cows to cover cash shortages resulting from the economic downturn. Such sales, combined with increased pressure on local abattoirs to meet revenues from slaughter fees and preset slaughter quotas, have contributed to the breakdown of the slaughter ban. Cattle owners in East Nusa Tenggara have benefited from increased cattle sales to Java during the crisis, to substitute for an almost complete cessation of beef imports, and cattle inventories in Nusa Tenggara have declined sharply during 2000 and 2001 as the result of these sales. 28. Cattle production systems remain extensive, but a shift is underway in areas near urban centers to fatten young cattle for periods of 1 to 1.5 years, using crop byproducts and agro-industrial byproducts such as brewer’s grain, corn starch byproducts, cassava and pineapple wastes or sugarcane tops. Combined with 2 or 3 kg of rice bran or oilseed cake, daily gains can reach 0.75 kg. Such production systems are capital and labor intensive, but quite profitable. Investments can reach Rp1.5 million to Rp2.5 million per 6-month young bull, with net profits of Rp1 million after one year of fattening. Agro industrial byproducts can often be obtained at very little cost. A national cattle fattening grant program of Rp 300 million in value has been distributed to establish fattening units, and efforts are underway to link fattening units with local abattoirs and meat processors into integrated agro-enterprise-smallholder establishments. These efforts, although laudable, are not sustainable, however, as the grant program does not financially commit participating farmers. High investment costs and slow turnover are important constraints affecting this production system, and the stability of consumer demand for beef is quite prone to adverse economic conditions. 29. Cattle and buffalo owners are difficult to organize, as they keep their animals as a sideline resource, and, by virtue of the low-input conditions under which cattle are kept, are not seen by smallholders as significant long-term commercial assets. Government intervention in cattle and buffalo production remains confined to vaccination, Brucellosis and anthrax control and AI. Improved calf raising husbandry and the reduction of calf mortality, which averages 15 percent to 6 months of age, combined with higher conception rates, are two important factors in upgrading cattle and buffalo production. Buffaloes. Buffalo inventories have declined by 10 percent decline nationally (Table 4.7) in the past decade, and this decline is evident in all regions. Increased mechanization of rice production is the main factor for the decline, reducing the need for animal draft power. Buffaloes have the unique genetic ability to convert low quality forage into high quality protein with a highly specialized rumen flora, and it is uncommon to see buffaloes in poor body condition, even at the end of the dry season. Research is underway to identify the factors involved the biochemistry of buffalo rumen flora, with the objective to transfer such factors to other ruminants, thereby improving their feed conversion performance
C. Small Ruminant and Pig Production Systems 30. Similar to large ruminant production, sheep and goat production systems are almost entirely extensive and low-input in nature, based largely on scavenging. Nevertheless, small ruminants are an important factor in providing milk, meat, organic manure, carpet wool (sheep), and serve religious and cultural functions. Sheep and goats are widely distributed throughout Indonesia but are most heavily concentrated in only a few provinces on Java. The small ruminant population has remained relatively stable over the past 50 years, and showed little reaction during the crisis years (Tables 4.8 and 4.9). There are three

39
types of Indonesian sheep: Javanese fat-tailed, Priangan and fat-tailed sheep, and two goat breeds: the purebred Kacang and the hybrid Ettawah. 31. The Small Ruminant-CRSP program, carried out by Winrock International and supported by AARD and USAID, focused on three areas of Java, and defined the productive parameters, husbandry practices and economic potential of goats under village conditions. Goat distribution, like swamp buffaloes, has been an important livestock input component of transmigration schemes. With higher management levels, such as confinement in raised-floor stalls, cut-and-carry feeding, including byproducts such as soybean waste (ampas tahu), net profits per breeder per year can reach Rp100,000. Mutton is a favorite meat for Muslim consumers, and retail prices have increased 2.5 times since 1995, whereas small ruminant production costs have remained static, thereby substantially increasing potential profit margins. Smallholders prefer goats for sheep, as the latter are less hardy and are carriers of malignant catarrhal fever, a fatal disease of cattle. Sheep should therefore not be introduced in areas with high cattle populations, such as Aceh, Central and East Java, Bali, Kalimantan, Irian Jaya, South Sulawesi and parts of East Nusa Tenggara. 32. Smallholder goat production projects of similar design as the RRMC model for integrated smallholder village poultry production, could promote goat production as a viable source of income generation for low-income households. Investment costs are low, forage supply requires less family labor than for poultry or cattle, husbandry practices are relatively simple, and apart from intestinal parasite control, disease problems are few. Fresh meat could be sold directly to local wet markets. 33. Pig Production Systems. The consumption of pork is confined to certain ethnic and religious groups, and is therefore quite localized. Pig production is carried out as two systems, backyard or semi-confined scavenging, using household wastes and few purchased inputs; and fully confined commercial production, using AI and purchased feed. Pig distribution is heaviest in Kalimantan, Sulawesi, Sumatra and Bali. In contrast to the distribution of other livestock species, Java houses very few pigs. For reasons that are unclear, pig production in East Nusa Tenggara more than halved following the crisis. Pig inventories have declined by 1.5 million head since 1995, with most of the decline in 2000 and 2001 (Table 4.10), possibly due to the aftermath of high commercial feed costs. 34. Of the 5.8 million pigs in the country, only 10 percent are kept on large, intensively managed pig farms. The effect of the crisis on national pig production is masked by the small representation of the commercial pig production, which, relying heavily on imported feed grains, suffered a collapse similar to the commercial poultry industry. Backyard pig production using indigenous or improved breeds provides ready cash for rural households. Commercial farms employ artificial insemination, and village breeders, using indigenous or improved boars, provide breeding services to villagers. Swine fever is a highly fatal and widespread disease that can quickly devastate pig populations. Vaccination, carried out by Dinas Livestock Services for village pig owners, is an important public service, although shrinking budgets are curtailing this program, and reports of outbreaks have been increasing. Swine fever vaccination on commercial farms is paid for by the farms and carried out by private veterinarians, but Dinas budgets allowed for only a 10 percent SF vaccine coverage in 2001. 35. Downstream Processing and Linkages. The marketing and processing of livestock and livestock products, especially for rural livestock owners with limited access to large, urban markets, is a major constraint to intensifying and modernizing livestock production in Indonesia. The crisis has clearly

40
demonstrated the value of livestock to rural livelihoods, which can be quickly converted into cash to cover emergencies. However, the crisis has also demonstrated the weaknesses of rural livestock markets, where supply and demand linkages are poorly attuned, if not completely absent, and the lack of organization of livestock owners allows processors and middlemen to control markets and prices. 36. In an effort to address this constraint, the Directorate of Agribusiness is developing pilot models for collaboration between private industry and rural livestock owners, of which the RRMC village poultry project is one example. As indicated elsewhere, village poultry, small ruminants and, in selected areas, cattle fattening, have the potential to respond well to production models such as the RRMC model. To facilitate agribusiness-smallholder linkages, a legal framework was developed well before the crisis that would allow for commercial transactions by, and the establishment of small businesses. To this end, the government has promulgated the Small Scale Business Law No. 9/1995 to assist livestock owners to establish micro-businesses. The promulgation of Presidential Decree No. 99/1998 opens investment opportunities to domestic or foreign enterprises by forming partnerships with local farmers to develop so called nucleus-plasm6 schemes. These schemes have attracted investors in the commercial poultry sector and cattle fattening with foreign (mostly Australian) enterprises, but have yet to involve smallholder producers. To effect such linkages, the following conditions need to be satisfied:
• The organization of smallholder producers into associations, to negotiate effectively with more powerful agribusiness on prices, contracts, and contractual security.
• The confidence needed by agribusiness to engage in smallholder contract production and depend on timely, reliable livestock supplies.
• Availability of credit to participating smallholders, either via formal or informal financial institutions or mechanisms or through the agroenterprise, to finance the investments necessary to engage in contract production.
• Assurances that service provision (breeding, extension, animal health, marketing) will be available on a sustainable basis to contract producers.
• Equitable distribution of profits to participating smallholders through legally binding contracts. • Adequate technical and managerial skills by both parties to implement the scheme.
Many of these conditions have been either fully or partially met under the RRMC poultry program, but none can be ascertained if the mutual incentives to have the venture succeed are lacking. Confidence by agribusiness and lack of producer organization and awareness are the two most constraining factors. 37. More Effective Livestock and Poultry Development Programming. Existing national and regional livestock and poultry programs continue to be heavily public sector-driven, but this trend is beginning to change in favor of private sector involvement, mainly spearheaded by NGOs. The economic crisis will result in the significant retrenchment of DGLS human, physical and financial resources, so that a heavily public sector-directed programs can no longer be sustained. Furthermore, the effectiveness of many government-directed programs has been mixed, under which AI and veterinary services have fared better than production programs such as the INTAB poultry program, forage development, and much of the applied research program, which is insufficiently producer-oriented.
6 Nucleus-Plasm schemes involve a contractual arrangement between an agro-enterprise (the nucleus) and smallholder producers (the plasm) to engage in integrated production, processing and marketing.

41
38. On the positive side, smallholder-producer groups remain interested in organizing, provided the necessary incentives exist, and local government autonomy would provide them with greater opportunity to be heard, provided they organize. The post-crisis period is also the time for new, private sector initiatives to replace the old, government-dominated programs. To achieve this trend shift, the central government must be prepared to transfer their oversight to the local level, whereas the latter must be have, or acquire, the managerial and technical skills to take over. Regardless, of public or private sector participation, the producer and his association stands in the middle and must take over. For this to take place, substantial organizational skills development is needed, part of which with the objective to identify and develop local opportunities into activities of benefit to their members. 39. Failure to do so will allow large agro-enterprise to dominate markets and prices, and thereby, smaller producers groups. Law promulgating a level playing field are commendable, but do not resolve the problems of equity participation and opportunity realized. Attempts to have agro-enterprise join with small producers into nucleus-plasm schemes are a beginning, however, and should be evaluated, fine tuned, and replicated where warranted.

42
Directorate of Animal Health
Directorate of Disease Surveillance
(Data collection and analysis)
Provincial Animal Health
Services
Feedback And
Service
Feedback And
Service
Regional Disease
Investigation Centers
Balitvet
Quarantine Stations
-Cattle Markets -Abattoirs -District Labs -Subdistrict Labs Extension Agents
District Services Type B
diagnostic lab
Sub-District Services Type C
diagnostic la
Animal Health Posts
Veterinary Public Health
Section
-Commercial Farms -Private Veterinarians -Farmer Associations -Dairy Cooperatives
Feedback Feedback
Feedback through: -Bulletins, Reports -Control, prevention, eradication programs -Training -Extension
Figure 5.1 –National Disease Surveillance
Infrastructure

43
SECTION V – ANIMAL HEALTH AND LIVESTOCK PRODUCT QUALITY 1. In this Section, the animal health programs implemented under the DGLS Directorates of Animal Health and Veterinary Public Health are described and analyzed. Disease surveillance and eradication policies are described, followed by a section on food safety and quality control of slaughtered and processed livestock and poultry products. In conclusion, the abattoir system, meat inspection and regulatory matters related to livestock slaughtering are covered. The Section closes with a summary of strengths and weaknesses and suggestions for improvement. Figure 5.1 depicts the disease surveillance and animal health services delivery systems as administered at the various levels.
A. Livestock Disease Prevalence 2. The Directorate of Animal Health (DAH) is responsible for disease diagnosis and surveillance, and disease control and eradication, and implements a range of central and field programs to that purpose. DAH is one of the largest and most important Directorates within DGLS, and oversees a network of seven Type A regional disease investigation centers, 24 Type B provincial diagnostic laboratories, 42 Type C District-level diagnostic laboratories, and 463 and animal health posts (poskeswan) across the country. DAH employs 258 veterinarians at headquarters, 300 veterinarians at the provincial level, and 450 veterinarians at the District level (Table 5.1). All Type C laboratories and animal health posts have been, or will be, turned over to District governments as part of the decentralization and local autonomy, although DAH maintains regulatory oversight of these facilities. 3. DAH supervises five Subdirectorates: Disease Surveillance, Disease Control and Eradication, Animal Biosecurity, Veterinary Drug Control, and Veterinary Services. At the provincial and subprovincial levels, each Dinas Provincial Animal Health office (Kantor Dinas Kesehatan Propinsi) oversees provincial programs through Subdinas replicate District offices, responsible for the implementation of Sub-Directorate programs at the field level. However, the provincial offices have lost their operational mandate for District and Sub-District services to local government autonomy, but remain responsible for enforcing regulatory programs. This divergence of responsibility can only hamper effective disease control, where one public sector agency monitors and identifies threats to which a different agency will have to respond. 4. The National Livestock Disease Profile. With market globalization and the opening up of Indonesian markets, disease surveillance and control have become ever more important in the country’s renewed effort to increase trade as part of its import substitution policy, at a time when DGLS faces human resource and financial constraints to increase its mandate accordingly. Indonesia’s geographic location, comprising thousands of islands, has both advantages in their relative isolation, and disadvantages in their remoteness and lack of ready accessibility. Indonesia is host to a large array of viral, bacterial and parasitic diseases, some of which are characteristic of tropical environments. Indonesia is a member of FAO and the Organization International Epidemique (OIE), of which both monitor and report on disease prevalence and outbreaks around the world. Indonesia also hosts the secretariat of the Animal Health and Production Information Systems for ASEAN (APHIS), a regional network that monitors disease outbreaks in ASEAN countries and issues a newsletter and early warning reports of livestock disease outbreaks in the region.
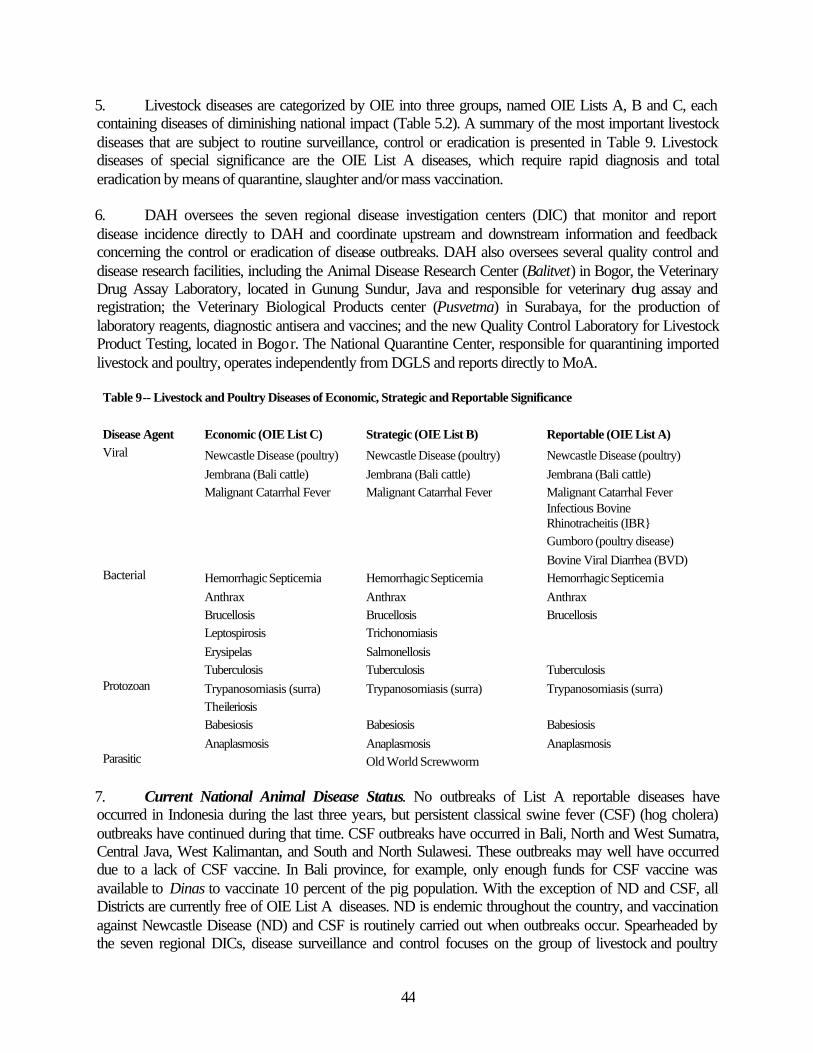
44
5. Livestock diseases are categorized by OIE into three groups, named OIE Lists A, B and C, each containing diseases of diminishing national impact (Table 5.2). A summary of the most important livestock diseases that are subject to routine surveillance, control or eradication is presented in Table 9. Livestock diseases of special significance are the OIE List A diseases, which require rapid diagnosis and total eradication by means of quarantine, slaughter and/or mass vaccination. 6. DAH oversees the seven regional disease investigation centers (DIC) that monitor and report disease incidence directly to DAH and coordinate upstream and downstream information and feedback concerning the control or eradication of disease outbreaks. DAH also oversees several quality control and disease research facilities, including the Animal Disease Research Center (Balitvet) in Bogor, the Veterinary Drug Assay Laboratory, located in Gunung Sundur, Java and responsible for veterinary drug assay and registration; the Veterinary Biological Products center (Pusvetma) in Surabaya, for the production of laboratory reagents, diagnostic antisera and vaccines; and the new Quality Control Laboratory for Livestock Product Testing, located in Bogor. The National Quarantine Center, responsible for quarantining imported livestock and poultry, operates independently from DGLS and reports directly to MoA. Table 9 -- Livestock and Poultry Diseases of Economic, Strategic and Reportable Significance Disease Agent Economic (OIE List C) Strategic (OIE List B) Reportable (OIE List A) Viral Newcastle Disease (poultry) Newcastle Disease (poultry) Newcastle Disease (poultry) Jembrana (Bali cattle) Jembrana (Bali cattle) Jembrana (Bali cattle) Malignant Catarrhal Fever Malignant Catarrhal Fever Malignant Catarrhal Fever
Infectious Bovine Rhinotracheitis (IBR}
Gumboro (poultry disease) Bovine Viral Diarrhea (BVD) Bacterial Hemorrhagic Septicemia Hemorrhagic Septicemia Hemorrhagic Septicemia Anthrax Anthrax Anthrax Brucellosis Brucellosis Brucellosis Leptospirosis Trichonomiasis Erysipelas Salmonellosis Tuberculosis Tuberculosis Tuberculosis Protozoan Trypanosomiasis (surra) Trypanosomiasis (surra) Trypanosomiasis (surra) Theileriosis Babesiosis Babesiosis Babesiosis Anaplasmosis Anaplasmosis Anaplasmosis Parasitic Old World Screwworm
7. Current National Animal Disease Status. No outbreaks of List A reportable diseases have occurred in Indonesia during the last three years, but persistent classical swine fever (CSF) (hog cholera) outbreaks have continued during that time. CSF outbreaks have occurred in Bali, North and West Sumatra, Central Java, West Kalimantan, and South and North Sulawesi. These outbreaks may well have occurred due to a lack of CSF vaccine. In Bali province, for example, only enough funds for CSF vaccine was available to Dinas to vaccinate 10 percent of the pig population. With the exception of ND and CSF, all Districts are currently free of OIE List A diseases. ND is endemic throughout the country, and vaccination against Newcastle Disease (ND) and CSF is routinely carried out when outbreaks occur. Spearheaded by the seven regional DICs, disease surveillance and control focuses on the group of livestock and poultry
45
diseases categorized under OIE Lists A, B and C, with the greatest vigilance on the OIE List A diseases. As indicated above, standardized reporting and follow up procedures are essential to effective disease surveillance and control, but these standards are weakening as local governments take control, and often amend reporting procedures to suit their own rather than national reporting criteria. This problem is serious and requires rapid resolution, before mass outbreaks are either missed or misreported. 8. Disease control measures for prevalent diseases (Table 9) involve vaccination or eradication (e.g. Brucellosis, anthrax, rabies). National vaccination programs are in place for ND, CSF, anthrax and hemorrhagic septicemia, as are control programs for Brucellosis and tuberculosis in dairy cattle. Rabies eradication is carried out in collaboration with the Ministry of Health’s Zoonotic Diseases Section. The incidence of protozoan diseases is monitored by the DICs, although no vaccines are available to control these diseases. Bali is off limits to cattle from other islands for two reasons: the prevention of spreading Jembrana disease, a disease confined to Bali cattle; and the preservation of the Bali cattle breed by preventing interbreeding. A Brucellosis eradication program is underway in selected areas of Indonesia (Java, parts of Eastern Islands, South Sulawesi) through serotesting and the elimination of infected carriers. 9. Recommendations for improved animal health and disease surveillance. as they relate to decentralization, include:
• Redefine the public and private sector roles in animal health between central and local governments.
• Improve communications at the working level between Type A, B and C laboratories and the poskeswan, by introducing contract-based provision of such services to animal health recipients, allowing the latter a voice in determining the type and quality of service.
• Privatize the poskeswan network and livestock extension and breeding programs (See Section VI). • Re-active the regional AHIS program to facilitate interaction within the Region related to disease
outbreaks and quarantine controls.
B. National Disease Surveillance and Eradication
10. . An organogram of the national disease surveillance system is depicted in Figure 5.1, which indicates the upstream and downstream information flows between central and peripheral offices and laboratories This system requires much improvement to operate more effectively, in particular at the Subdistrict level. The provincial Dinas Animal Health Services, together with their regional DICs, play a central role in disease monitoring and early warning, but this system is currently compromised at the District and Subdistrict levels by local autonomy, under which local governments can decide, often arbitrarily, whether to reorganize, abolish or reduce services in accordance with their budget priorities and demand for a particular service. For example, local government now has the power to abolish or reorganize Type C laboratories and poskeswan and other service resources as they see fit. 11. The consequences of the implementation of local government autonomy are affecting national animal disease and surveillance, and, similarly, the livestock extension and breed improvement (AI) programs. Inadequate communications and feedback are important factors that further augment the transition constraints listed below, and prevail throughout the system. Altogether, service systems have been affected as follows:

46
• The disease reporting chain is weakened as the result of the changing status of disease reporting units.
• The quality and standardization of disease reporting is declining as individual local governments decide on their own reporting formats, or reassign staff responsible for reporting, thereby compromising the accuracy of field information on which disease control decisions must depend.
• Reduced local government budgets are similarly reducing the service capability of local animal health services through shortages of equipment, supplies and vaccines, and field mobility.
• Staff morale is suffering under local autonomy, as job positions are no longer secure and career prospects uncertain.
• A brain drain may develop as animal health workers seek alternative, more secure employment outside government service.
• Local governments are issuing ordinances (PERDA) for the reorganization or restructuring (or, occasionally the outright abolishment) of District animal health services, often without the necessary information or understanding of the implications of such decisions.
• DGLS and its provincial Dinas offices now have to communicate with 380 independent District governments, often with different reporting formats and operating procedures, on matters of national concern, instead of only the 30 provincial Dinas offices.
C. Meat Inspection and Slaughter Controls
12. Meat inspection is carried out by provincial and District Dinas Animal Health Services in both public and private abattoirs, but the efficacy of this program is compromised, given that carcass rejection rates are extremely low, and the meat inspectors are employed by the slaughterhouses they must inspect. Meat inspection in Asian countries has a special dimension, as the Asian consumer views many organ parts as edible delicacies, not normally utilized by Western consumers. This additional consumer exposure to animal parts has the potential of greater exposure to disease-tainted organ tissue, which requires more, rather than less, stringent inspection procedures. 13. With the opening of export markets, slaughterhouse capacity and quality will require substantial upgrading to regional or even internationally accepted standards, if exports are to be realized. An ISO-9001 management accreditation program and ISO-9002 environmental management accreditation should be undertaken by all Type A abattoirs with the design and capacity capable of entering export markets. As part of the local government autonomy process. the laws covering meat inspection should be amended to let local governments, not the abattoirs, be the employers of the meat inspectors, who would work under provincial regulatory compliance. Further information on abattoir services and capacity is presented in Section VI. 14. Slaughter controls DGLS should review the continued enforcement of the slaughter ban, which has been detrimental to breed improvement by the retention of too many unproductive cows and cows of with poor traits, even though such cows are allowed to be slaughtered, but are not always identified. Instead, market forces should be allowed to determine the breeding cow inventory, so that farmers can adjust their cattle in accordance with prevailing demand and select their best cows for this purpose. Local government will now have the opportunity to address this matter. 15. Food Safety and Quality Control. The safety of fresh and processed livestock products is now receiving serious government attention by additional budgeting to improve quality assurance. This emphasis

47
is driven by Indonesia’s renewed emphasis on opening markets and efforts to increase livestock product exports, thereby decreasing the trade deficit and the drain of foreign exchange. Two initiatives have been taken to support the quality control program: • First, the Sub-Directorate of Disease Repulsion and Veterinary Public Health was upgraded to
Directorate level, giving it a broader and stronger national mandate to enforce and upgrade existing regulatory statutes governing the food safety measures and sanitation of packing and processing facilities.
• Second, a new Quality Control Laboratory for Animal Products is being established in Bogor with a national mandate for residue testing and food safety. Such testing is vital to ensure consumer protection and exports, as international compliance with minimal chemical and biological residue levels are the entryway to successful export.
11. Quality assurance is a major constraining factor in promoting livestock products, gaining market share and entering the more profitable, higher-niche markets. Quality control issues therefore affect both the consumer and the livestock producers. For example, two cases currently affecting Indonesia’s broiler industry are day-old chick survivability and poultry feed quality, which are causing substantial production losses for broiler producers. Poultry industry and government committees are now evaluating a transparent quality control testing program that would provide information to public and poultry industry alike, regarding the quality of commercial feeds and the health day-old chicks. Such testing programs should come under the control of the new testing facility in Bogor, which currently only tests human food products. 16. Government should adopt a two-pronged approach to food safety, which involves both industry and the consumer. On the industry side, incentives to reach quality standards can, in selected cases where sustainable export markets are involved, be encouraged by acquiring ISO9001 or obtain HACCP accreditation. On the consumer side, better food handling and cooking will do much to improve food safety. At the present time, such a two-pronged approach is not yet evident. 17. In summary, the following measures should be considered to improve veterinary public health and food safety, especially where local governments will receive the brunt of responsibility for these activities:
• Privatize local slaughterhouses and allow the private sector to rehabilitate or rebuilt local slaughterhouse capacity.
• Emphasize capacity development of village-based poultry slaughter facilities, as these pose a significant constraint in improving intensified village poultry production.
• Local government should maintain control of the regulatory aspects of meat inspection and food safety, but allow its own staff to independently supervise private sector-owned facilities.
• The slaughter ban should be lifted and be allowed to operate under free market conditions, allowing local breeders to raise and sell breeding stock. The testing and grading of such stock should remain the responsibility of the public sector.
48
SECTION VI TECHNICAL LIVESTOCK SUPPORT SERVICES
1. This Section covers the technical services that support the livestock sector, including animal health and veterinary services, livestock extension, AI programs and breed improvement. The feed industry, am important resource in information transfer to farmers and producers, is also discussed. Subprovincial services, now under local government autonomy, are discussed, as are the roles of private and public sector services. Service inputs such as frozen semen, veterinary drugs, vaccines and animal health worker education and training are described and analyzed. 2. Public and Private Sector Roles in Service Delivery. The overriding issues for more effective service delivery at all levels is related to available resources and quality. Central and local government budgets are increasingly inadequate to cover ever-expanding services, and this situation is likely to deteriorate further when local governments take over these services at the producer level. The answer lies in privatization and/or degrees of cost recovery, an objective that has, with some exception, not received full government commitment. Privatization goes hand in hand with a redefinition of the public and private sector roles of livestock service provision, and relates to regulatory versus operational and technical inputs. DGLS should view this as a priority issue when addressing decentralization and service programs. 3. Privatization of village animal health and laboratory services, the AI program, livestock extension and slaughterhouse management should receive high priority for outright privatization, whereas provincial laboratory services should adapt a cost recovery scheme based on user fees. Regulatory functions related to food hygiene and public health, quarantine and animal movement, veterinary drug registration, and meat inspection, should remain under central or local government control. Livestock and poultry breeding stations should expand their impact on livestock production by contracting the multiplication phase of improved stock and frozen semen production to the private sector.
A. Public and Private Sector Support Services 4. Public and Private Animal Health Human Resources. It is surprisingly difficult to obtain accurate and timely data on veterinary manpower resources by type of occupation, as DGLS, the Indonesia Veterinary Medical Association (IVMA) and the private sector provide different data. From data compiled and adjusted from these sources, however, it is clear that the number of public sector veterinarians has declined substantially due to reorganization and the zero-recruitment government policy presently in effect (Table 10; Table 6.1a), and many veterinarians who left government service have found employment in the private sector. The decline is causing a shift, confirmed by DGLS and IVMA, from majority public sector to majority private sector employment of veterinarians. 5. Public Sector Veterinary Manpower. This shift, which developed during the past four years, has dropped the percentage of public sector veterinarians from 72 percent in 1997 to 32 percent in 2000, a decline of 1,700 veterinarians, resulting from public sector retrenchment in response to the government’s zero recruitment policy. The overall qualitative and quantitative effects of the decline in public sector veterinary human resources should be of concern, as many who left the public service were personnel with long-time experience. In contrast to the overall decline in professional manpower, auxiliary veterinary manpower, employed at the poskeswan level, has also increased. In view of the declining manpower base, Indonesia’s five veterinary faculties have been instructed by the Ministry of Education to double their undergraduate enrollment, so that an additional 250 veterinary graduates per year can be injected into the

49
system (Table 6.1b). However, with the exception of the Bogor Agricultural Institute (Institut Pertanian Bogor, IPB), other faculties and their teaching facilities have yet to adjust to accommodate such expansion, for which no budget allocations have yet been announced.
Table 10. Shifts in Public and Private Sector Veterinary Employment. Type of Employment 1997 1998 2000 Total veterinarians 5,550 4,635 3,849 Public Sector Veterinarians 4,000 3,085 1,224 Private Sector Veterinarians 1,550 1,550 2,625 Public Sector 72% 67% 32% Private Sector 28% 33% 68%
6. Private Sector Veterinary Manpower. Statistics for private sector veterinary inventory are sketchy and contradictory; a state of affairs that should be of concern to the IVMA. From available data (Table 6.1a), the number of private veterinarians has increased by one thousand in the past four years to 2,625, but this number may not include the poorly documented pool of private veterinarians in house pet practice who, although estimated at 3,800 professionals in 2001, do not contribute to veterinary services to the livestock sector. 7. Many veterinarians who left government service have established pet practices in urban areas. Furthermore, many private veterinarians have sideline occupations and are only part time veterinary practitioners. Commercial poultry and pig farms, hatcheries, large aquaculture enterprises, large feed mills, and poultry breeding farms, and some cattle feedlots have private veterinarians on staff, and the total is estimated at five hundred. At the village level, private poskeswan veterinarians may be engaged in contract work for farmers’ groups or villages. Dinas Animal Health Services and the private sector each operate 124 and 384 pet hospitals and clinics (Table 6.2), respectively, two-thirds of which are located in the cities of Java and Sumatra. The urban Dinas pet clinics contribute to cost recovery for Dinas services, offsetting operating costs for veterinary public health inspections, rabies control vaccination, wet market inspections, and other food safety or public health related matters in urban areas.
B. Provincial and District Animal Health Services.
8. Public Sector Veterinary Services. Provincial Dinas Animal Health Services (Dinas Propinsi Kesehatwan Hewan) have been most significantly affected by local government autonomy, as the provincial Dinas have had to transfer its field programs to the District governments. The Head of each District government, the Bupati, now has the authority to pass local ordinances (Peraturan Daerah, PERDA) concerning the operations and organization all District level (Tinggat II) animal health services and Type C laboratories, leaving Dinas Propinsi in charge of regulatory affairs, although its authority over these presently remain unclear and is therefore often subject to dispute. Government budgets allocated to municipal (Kota) and District governments were once distributed by the provincial governments, but are now passed directly by Jakarta to the Districts, often with substantial delays as to paralyze operations. For example, 2001 budgets that were to reach provincial and local governments in January did not arrive until October. Provincial governments, formerly heavily overstaffed and currently without many of their former activities, are now severely strapped for funds, and retrenchment of staff and resources is hitting this level of government more severely than the lower-level services. By mid-2002, local governments in 18 of the 30

50
provinces had reorganized their animal health services, and at that time, unknown number of District-level animal health services had been eliminated. 9. Provincial animal health programs are implemented under the technical direction of DAH as part of its national disease control policy, with the provinces responsible for administrative and executive control. With proportionally larger budgets, the provinces had considerable power in program implementation, although they rarely made use of these to adjust centrally directed programs to local needs and conditions. With local governments now in control of budgets, the provincial needs are frequently ignored Most provincially-directed programs were related more to an equitable distribution of program benefits regardless of need, rather than to the support of technical programs of merit. Provincial anima health programs fall into three categories: Disease Monitoring and Control
• Diagnostic services • Livestock transit • Quarantine and Zone regulation • Vaccination programs and vaccine monitoring • Strategic/economic disease monitoring • Data collection, amalgamation and preliminary analysis
Veterinary Public Health Milk quality inspection (where relevant)
• Animal-derived food product inspection • Zoonotic disease control
Regulatory Veterinary Medicine
• Slaughter bans on productive female cattle and buffaloes • Livestock transit; inter-island and inter-provincial • Slaughterhouse hygiene • Meat inspection • Veterinary drug and vaccine inspection • Quarantine • Veterinary accreditation
Most of the above programs were replicated under provincial supervision at the District level, but their operational aspects now under District government control. The Type B and C laboratories, now under local government control, carry out most of the diagnosis of veterinary sampling and inspections, and these laboratories are now also under District control. The remaining provincial responsibilities are primarily those involving regulatory veterinary medicine, although there are disputes as to final authority, especially regarding slaughterhouse operations and livestock movement, which involve the payment of budget-enhancing fees 10. Provincial Dinas Animal Health Services continues to have authority over:
• Regulatory enforcement of all public health and food safety laws,

51
• Zoonotic disease control, in collaboration with the Ministry of Health, such as rabies and Brucellosis eradication,
• Amalgamation of livestock production and health data sent up by the Districts for transmission to Jakarta,
• Meat inspection of type A abattoirs, • Regulatory control of inter-provincial livestock movement and quarantine, • Liaison with regional DICs concerning provincial disease surveillance and control. • Backup technical support for Type B diagnostic laboratories • Reference backup for DICs and the central Directorate of Animal Health concerning disease
surveillance and control measures.
11. Municipal, District and Subdistrict Services. Local government autonomy has impacted most significantly on livestock support services now undertaken by the Municipalities (Kota), Districts and Subdistricts. Municipal and District governments have also taken control of all physical and human resource bases of such services, but what the longer-term implications of this change in authority will be on service provision is presently far from clear. As indicated, the provincial Dinas services now largely confine themselves to regulatory matters and the conduit of upstream and downstream information to DGLS headquarters in Jakarta. Municipal and District services interface directly with livestock owners, and the quality of their service, or lack thereof, has a direct and immediate effect on producer risk and livestock health and production.
12. The physical animal health services infrastructure that has come under local government control is substantial and includes all facilities, equipment, transport and land attached to these services. Local governments are making decisions on whether to continue, reorganize or abolish certain services or programs. Such decisions are not always based on sound information or understanding of the service in question, and may negatively affect livestock health and production in the longer term. Dinas land of livestock facilities formerly used by provincial Dinas as research, extension or demonstration units can now be sold by local governments, or assigned different use. Decisions to sell land or facilities are often made for the short term objective of boosting local budgets. Many service personnel affected by these changes face uncertain career futures, and must decide whether to leave Dinas services for better career opportunities. 13. The full impact of local government autonomy on livestock services has yet to play itself out, but early signs are evident:
• Technical livestock support services are in a state of flux and confusion, as local governments reorganize, reassign or abolish technical service centers and their staff.
• Animal health and production services are less affected than other services (i.e. extension), as these usually bring quick and tangible results, and are well known and accepted by the public.
• The reporting quality of disease incidence, disease surveillance and livestock production data is being compromised by the institutional disarray, resulting in a loss of timely, standardized reporting.
• A brain drain may have developed where the employment insecurity of service providers continues to be uncertain.
• Local governments often ignore or override regulations once enforced by provincial governments, and can issue PERDA to the contrary. Examples include the breeding cow slaughter ban; livestock transport, increased livestock market and health examination fees; which often result in double taxation.
52
• Efforts by local governments to put support services on a cost recovery basis may leave poorer farmers who cannot afford to pay for services at increased risk.
• Decision making on service continuation is frequently based on short-term budgetary considerations.
On the positive side, local government autonomy is beginning to have a significant impact. Veterinary programs can now be assessed as to their merit and usefulness; local budgets and be reallocated accordingly; redundant staff can be retrenched job descriptions reviewed; and local producers’ groups now have a direct ear with their local representatives. 11. Local government autonomy has introduced local government empowerment, but not necessarily the necessary skills to adequately utilize this new authority, and there is an urgent need for training or refresher training in managerial skills, program development and implementation, participatory management and organizational skills, and needs assessment. Whether and how much of such training and skills development is taking place is uncertain, and no reference was found during this survey that specific training had been either contemplated or budgeted.
C. Private Veterinary Services
14. There are indications, based on available employment statistics for private veterinary practitioners that the private sector will benefit from local government autonomy and reorganization. These benefits may be two-fold. First, increased pressure to privatize public sector services will improve employment opportunities for private veterinarians and animal health workers. Second, retrenched public sector veterinarians are seeking alternative employment in private practice and are contributing to its growth. The growth of public sector veterinary manpower as the dominant segment employing veterinarians which has taken place during the last four years is an indicator of this trend (Table 6.1). 15. Given the ongoing public-private sector shift, there is a growing need for DGLS to re-examine its own public and private sector service roles to determine how its resources are best utilized. DGLS is in the process of redefining its authority (Table 3.2), often by default as local governments take over. DGLS needs to focus on two important areas: (a) public and private sector roles and responsibilities, and (b) local versus central government responsibilities, and faces a unique window of opportunity to realign itself with prevailing condition and spearhead future livestock sector development. 16. In such a review, the following issues need to be addressed and resolved:
• A livestock policy review for the future, based on a clear realignment of public and private sector roles,
• Needs assessment of DGLS resources to adjust to the post-crisis mandates and budgets, • Identification of core regulatory and mandated programs to remain under public sector control, • Reassignment of programs and mandates best carried out by the private sector by means of
contracting and/or outsourcing, or fee-for-service-based cost recovery • Privatization/cost recovery of the poskeswan network, • Adequate service provision to lower-income livestock owners, • Full privatization of vaccination campaigns, Brucellosis testing, and artificial insemination,

53
• Developing the legislative framework needed to facilitate contractual arrangements between the public and private sector,
• More accurate veterinary manpower forecasting, incorporating private as well as public sector demand and skills alignment,
• Realignment of the early warning disease control system with linkages between local and central governments, and
• Transfer of field programs to either local governments or by contracting to the private sector.
D. Veterinary Vaccine and Drug Supplies
17. Vaccine Supply. Domestically-produced livestock and poultry vaccines are produced by the Biological Vaccine Center (Pusat Veterinaria Pharma, Pusvetma) in Surabaya; Indonesia’s only semi-autonomous animal vaccine production laboratory. The majority of poultry vaccines, almost all of which are live, attenuated virus vaccines, are imported. Pusvetma produces vaccines for anthrax, brucellosis, rabies, hemorrhagic septicemia and Newcastle Disease, and antigens for Brucellosis (Rose Bengal test), mycoplasma, Newcastle and pullorum testing. The overall production quantity of Pusvetma does not exceed 25 percent of the national demand for vaccines and diagnostic reagents, however. 18. DGLS has experienced chronic budget shortages for the purchase of adequate drugs and other veterinary supplies for its diagnostic laboratories and veterinary clinics, and Pusvetma has not been able to meet the annual demand for veterinary biologicals. An estimated 25 percent of veterinary drugs used in Indonesia are produced domestically, with the remainder being imported. Although the greatly increased cost of imported biological and other veterinary products is passed on by distributors to the livestock owner, this has further pinched availability. In Bali province, for example, the DGLS budget allocated for swine fever vaccination was sufficient to cover only 10 percent of targeted animals, and, as a result, Bali has been experiencing increasing outbreaks of swine fever. Swine fever vaccine is imported from Japan at high cost, and neither Dinas nor most non-commercial pig producers can afford to pay for the vaccine. Such shortages increase production risk and the danger of spreading outbreaks. 19. Given the dwindling government operational budgets, the increasing cost of imported vaccines, and the widening gap between national vaccine demand and supply, renewed efforts should be made to consider privatizing and expanding Pusvetma into a major domestic vaccine producing facility, capable of supplying adequate quantities of vaccine and reagents. The upgrading of Pusvetma would best be accomplished through a joint venture with an international veterinary vaccine corporation. The Indonesian market for animal vaccines is very substantial and increasing intensification of livestock production will further increase demand. 20. Veterinary Drug Regulation and Certification. The production, regulation and registration of vaccines, drugs and feed additives is the responsibility of three agencies. The Veterinary Drug Assay and Certification Laboratory (Balai Pengujian Mutu & Sertifikasi Obat Hewan; BPMSOH). located in Gunung Sindur, West Java, is responsible for the quality control of local and clearance for certification of new domestic and imported veterinary medicaments. Veterinary drug inspectors are trained at BPMSOH and licensed by Provincial Dinas Livestock Services to monitor drug outlets. The Veterinary Drugs Section (Seksi Obat Hewan) under DAH handles the regulatory aspects of drug use and issues national certification of approved local and imported drugs and vaccines. The regulatory and certification system for drugs and vaccines has been in place for a long time and benefits from a well-trained and highly qualified staff.

54
E. Village Animal Health Services
21. The National Animal Health Post (AHP; poskeswan) Network. The national animal health post network is not fulfilling its mandate of providing effective and sustained animal health services to livestock producers. The network was first established in the 1980s with support from the World Bank-financed Third National Agricultural Extension Project (NEAP III), under which 200 AHPs were built and equipped. Known by its local acronym poskeswan (Pos Kesehatan Hewan), the AHPs are the grassroots-level interface between public sector veterinary services and the village livestock owner. Each poskeswan is staffed with a veterinary graduate (doktor hewan) and a veterinary assistant (mantri hewan) with vocational animal science training, obtained at an agricultural high school. Inseminators often share AHP facilities to carry out AI in surrounding villages, as part of the Directorate of Animal Breeding national program. 22. Poskeswan are located in Subdistricts near villages with significant livestock and poultry populations, although not all units occupy such strategically selected locations. Location is crucial in rural areas, where access to transportation and field mobility are essential factors for effective service provision. Since the 1980s, DGLS has expanded the AHP network to over 400 units, located in all provinces, but s chronic shortage of operating funds has rendered much of the system inoperative (Table 11, Table 6.3).
Table 11. National Animal Health Post Network
Region Total AHP No. Active No. Inactive %
Inactive Indonesia 463 284 179 39 Sumatra 125 87 38 30 Java 109 48 61 56 Nusa Tenggara 131 111 20 15 Bali 13 13 0 0
Kalimantan 42 18 24 57 Sulawesi 49 16 33 67 Maluku, Irian Jaya 7 4 3 43
23. Presently, only 39 percent of the entire poskeswan network is active, and no new units have been built since 1994 (the construction cost of these units has tripled from Rp8million to Rp24 million since the first ones were built in 1985). The high activity rates for Nusa Tenggara and Bali, at 85 percent and 100 percent, respectively, deserve special note (Table 11), as support for poskeswan is based a local government PERDA committing budgetary support for poskeswan. Although small in scope, this example of local government support for village animal health services is a harbinger of a trend to come as local government autonomy takes over local services. The AusAID-supported Easter Islands Veterinary Services Project, implemented in the 1990s, was responsible for ensuring the sustainability of poskeswan in the project areas of Bali and Nusa Tenggara by ensuring that governments would issue such PERDA. 24. The principal constraints to more effective operation of the poskeswan are three-fold: (a) the lack of sufficient budgeting for recurrent costs, (b) a lack of ownership of central government-funded clinics that did not require local government support, and (c) the infrequent and often inadequate training or refresher

55
training of poskeswan staff. AHP staff frequently have to use their own motorbikes and buy their own fuel or bus tickets to reach villagers needing their assistance, and it is not uncommon for AHP staff to have to hitch rides with AI technicians (who are better supported by their program), or from passersby to reach villages. Attempts at cost recovery through fees-for-services schemes have been sketchy, and have largely failed due to a lack of local government commitment. An estimated 10 percent of AHPs have been privatized to the extent that government salaries are no longer paid to AHP staff. An additional 25 percent is partly privatized (i.e. government salaries are partially paid), whereas the remaining 65 percent remain fully government-supported. 25. With declining local government budgets, and the responsibility for effective village veterinary services now wholly the responsibility of local governments, the following measures should be considered to develop a self-financed village veterinary service system, following a gradual, six step approach, which should be participatory, transparent, and tailored to local conditions:
• Step One. Invitation to Participate. Issue an invitation to local governments to join and commit to the AHP privatization program. Outline the program clearly, so that governments know what to expect. It is important to emphasize from the beginning that public sector-driven veterinary services system in the world is operating on full cost recovery, but that the program can significantly reduce local government budget outlays, while still providing satisfactory services.
• Step Two. Determination of Service Payment Capability. Divide the entire AHP network into three categories: (a) Located in a higher than average income service area, (b) located in an average income service area, and (c) located in a higher than average income service area.
• Step Three. Determine Area Service Needs. Train AHP veterinarians in household survey techniques and have them conduct standardized livestock owner surveys in their own service area to verify and record household incomes and payment capability, and determine with them, and from their own experience, the service needs for each area. Areas without AHP staff could be surveyed by District Dinas Livestock staff.
• Step Four. Establishment Baseline Budgets. Establish, in collaboration and agreement with local governments, baseline budgets that represent the AHP service area’s income levels and service recipient needs. These budgets will form the basis for budgetary support, supported by PERDA, by local governments, topping off AHP budgets not recovered from fees.
• Step Five. Development Privatization Plan. Design privatization plans for the three income category levels. These plans are based on the introduction of a graduated scale of fees-for-services scheme that will increase over time, depending on the payment ability and income levels of the service recipients in the area. The higher the area income, the more rapid the fees scale will escalate to full cost recovery will take place. Local governments are committed to top off the baseline AHP budget until, (a) fees have reached their maximum, or (b) clients begin having repayment difficulties, and service calls begin to drop.
• Step Six. Proceed to Full Privatization. The final step toward fully privatized village poskeswan services can be achieved by first leasing the AHP building and equipment to the AHP staff, followed by issuing a collateral-free, local government-guaranteed mortgage on the property, repayable in 15 to 20 years. This process should again be supported by irrevocable PERDA.
26. A program such as described above would mutually benefit the three parties involved: (a) local government would face decreased budgetary outlays for improved veterinary services, (b) AHP veterinary staff would have the incentive to work hard to succeed toward full privatization, and (c) livestock owners

56
would receive regular veterinary service at a cost fees tailored to their repayment ability. Mechanisms should be incorporated to ensure full and equitable service for everyone. Although it is well established that even poor farmers will pay for useful support services, there are service areas in which low-income livestock owners may not be able to pay fully for drugs and services. In such areas, part payment should be accepted, possibly topped of by the District government. Alternative service financing schemes may include farmers’ saving pools, in which a farmers’ group or village contributes regular, small sums of money, which is pooled to pay for scheduled or emergency veterinary assistance, vaccines or drugs. The AI program model is already addressing this constraint, by charging three levels of AI fees to target farmers, based on three levels of income.
F. Artificial Insemination Services 27. The national AI program is organizationally quite complex, with three separate central agencies responsible for breeding stations and semen production, embryo transfer, and AI field services. The field service program employs three types of technicians, inseminators, pregnancy diagnosers, and reproductive technicians, each working independently of each other. This arrangement seems designed to avoid accountability by determining which parties or persons are responsible for insemination failure. There is no comprehensive performance testing program at the farmer level to identify superior offspring derived from AI, so that guided gene pool improvement does not take place, instead requiring continuous gene pool imports. This matter is more serious for dairy cattle where, despite smaller herd numbers and more intensive husbandry, superior offspring cannot be identified. The program needs to become more simply structure and become technically flexible by allowing for the use of fresh semen or natural breeding where problems with frozen semen are encountered. Conception rates rather than frozen semen coverage should become the primary goal. 28. Breed improvement through artificial insemination (AI) programs for cattle, buffaloes and pigs is one of the few livestock-directed programs with a built in cost recovery mechanism, as farmers pay for AI services . The Directorate of Animal Breeding (Direktorat Perbibitan) is responsible for carrying out the field insemination program through AI units, staffed by inseminators, AI assistants and reproductive technicians. The Subdirectorate of Production (Subdirektorat Budidaya) manages two stud stations that maintain breeding stock for frozen semen production, which is shipped to the provinces in liquid nitrogen tanks, from where it is distributed to District AI units (Pos Inseminasi Buatan; PIB), which are often located in AHPs. A third agency manages reproductive research and development, which involves embryo transfer. Cost recovery through payment for insemination has long set an important precedent for cost recovery of other service programs such as animal health. 29. The AI program is one of the few government field programs incorporating fees-for-services, usually based on guaranteed pregnancy, although these fees are subsidized. About 30 percent of inseminators operate privately, with 70 percent remaining in government service. Frozen semen is kept in AI units or poskeswan, and motorcycle transport is provided to public inseminators and support staff. Payment for AI services is well accepted by farmers, who pay at two fee levels, in accordance with their ability. Decentralization of AI services is underway at the District level. Farmers are grouped into units owning 500 to 1000 breeding cows, which are then covered by District inseminators, while the provincial Dinas remains responsible for data collection and upstream program reporting. A revealing indicator of illegal cow slaughtering resulting from the breakdown of the slaughter ban has been the number of cows

57
targeted for insemination in 2002. The target was set at 2.076 million cows nationally, but, according to the Directorate of Animal Breeding, only 1.5 million cows could be located as candidates for insemination.
Table `12. Target Completion for the National AI Programs(after Table 6.4) Year Beef Cattle Buffalo Dairy 1996 80% 7% 74% 1997 772% 9% 59% 1998 140% 15% 73% 1999 52% n/a 68% 2000 27% 18% 23%
30. Following increased insemination coverage before the crisis, the target realization of the national AI program has declined precipitously since 1998 (Table 12; Table 6.4); both in terms of annual national targets reached and in serial decline of coverage since 1998. Two important factors that have contributed to this decline include insufficient frozen semen supplies and low conception rates, which require more inseminations per pregnancy, further draining limited supplies. Conception rates7 are in indicator of breeding efficiency, the factors of which include inseminator and farmer skills (estrus detection, insemination technique, cattle nutrition and body condition), and animal factors (reproductive disease or dysfunction). Few reliable data are published on conception rates, and textbook figures are often quoted instead. Calculated estimates of conception rates for beef cattle (based on 1.8 million head) range from an average of 1.9 to 2.5 inseminations per pregnancy, compared to 3.1 to 3.6 inseminations for dairy cattle (320,000 head). (Table 6.4). Data of the national AI program by region are detailed in Table. 6.5. Conception rates were not available as hard data but had to be extrapolated from indirect data provided. This difficulty is diagnostic of the trend not to utilize conception rates, but rather, AI coverage, as the prime criterion of success of the AI program. 31. Given the above state of affairs, there is a clear need to improve the AI program by means of two measures: (a) streamline AI breeding and services to improve intercommunication, and (b) introduce performance accountability for all AI laboratory and field service personnel. Measures to achieve these goals should include:
• Change the primary indicator of program efficiency to conception rates achieved rather than the number of inseminations made.
• Privatize semen production. • Contract breeding stock multiplication for distribution to farmers to the private sector. • Integrate the three separate job descriptions positions for inseminator, pregnancy diagnoser and
reproductive technician jobs into one job position, thereby allowing an inseminator to follow up, and learn from, his own work.
• Privatize all inseminators and technical support staff under performance-based contracts with a bonus system based on performance quality, and confine government inputs to policy, regulatory and quality control monitoring functions.
• Introduce an independent spot check quality control monitoring system, carried out by experienced field personnel that audits insemination records and rates inseminators’ performance.
7 Conception rate – the number of artificial inseminations or natural matings per live birth.

58
• Develop a simple, practical field progeny testing program through which superior animals can to identified.
• .Set realistic annual AI coverage targets, based on realistic forecasts of semen supply and possible field coverage, with target realization linked to a bonus system.
• Introduce the use of fresh (i.e. non-frozen) semen or natural breeding for dairy cattle, and • Use natural breeding in addition to AI, using superior, locally-raised bulls, to offset poor
conception rates.
G. Livestock Extension Services.
32. The entire agricultural extension system (Table 6.6a) is presently in a state of considerable confusion and disarray, as local governments, with great individual variation, are using their newly granted authority under Laws 22/1999 and 25/2000 to decide in which form, or whether, support for agricultural extension services is to be continued. At present (i.e. May, 2002), 78 Districts of the national total of 323 districts and municipalities have decided to keep their agricultural extension information centers (Balai Informasi Penyuluh Pertanian; BIPP), the principal District-level unit from which agricultural extension is carried out at field level. A national inventory of agricultural extension officers (Penyuluh Pertanian Lepangan, PPL), completed in May 2002 by the Ministry of Agriculture’s Human Agricultural Resource Development Center (Badan Pengembangan Sumberdaya Manusia Pertanian, AARHD), indicates that of 37,332 extension staff the employment status of 2,497 staff is presently undefined, as they await reassignment (Table 6.6b). A government policy of zero recruitment of extension staff is in effect, under which no new staff will be recruited. With zero recruitment, the extension system will retrench through attrition from retirement and resignations. In many cases, extension staff no longer required by the central or local governments are reassigned to the Dinas extension system; a return to an older organizational structure. 33. Compared to crop extension, however, the transition appears to have affected livestock extension to a far lesser extent, which may be due to two factors. First, agricultural extension has traditionally been heavily crop-oriented, with livestock extension as the junior partner. Of the 37,300 agricultural extension field officers (PPL) in the country, an estimated 4,270 (11 percent of total) have been designated as livestock extension officers. Second, livestock extension is, by default, also provided through public and private sector veterinarians and by reproductive technicians, who transfer knowledge to livestock owners on animal care and conditioning, breeding and animal husbandry. Local governments are using their newly gained autonomy to make demand and priority-based decisions on maintaining, changing or abolishing their agricultural extension services, and the considerations in making these decisions are often purely budgetary. Occasionally, decisions to abolish existing extension services are based on a misunderstanding of benefits that effective services can provide. 34. Several restructured extension models are emerging from the transition, some of which involve livestock extension. These will, however, not simplify the existing, multi-layered extension structure, and this response to modification of national extension services is rather typical of earlier responses to earlier changes. There is a real danger that local governments will further reorganize the system, thereby further expanding the infrastructure, increasing its maintenance costs, and diffusing the objectives. The models presently being introduced by local governments include:
• Maintenance of existing BIPPs without change,

59
• Upgrading BIPPs to Kantor (information office) or Badan (information agency) level, • Integration of BIPPs into the Dinas extension structure; a return to the past and carried out in parts
of NTT and NTB, • Upgrading the BIPP mandate by District Regulation (PERDA) to an Office for Information
Technology for Agricultural and Forestry Extension (Kantor Informasi Teknologi dan Penyuluhan Pertanian dan Kehutanan; KITPPK), and
• Merging livestock extension, breeding and animal health services into yet unnamed multidisciplinary service units.
35. Instead of expanding the existing system a window of opportunity now exists to break with the past and create a leaner, more effective extension system, geared not to preserve itself but to serve its client. If the decision by many local governments to give high priority to the reduction or outright abolishment of existing extension services is any guide, the system is in serious need of change. New extension models such as listed above need to be evaluated with care, so as not to repeat past mistakes of introducing yet more infrastructure on an already top heavy system. 36. In many instances, such as in West Nusa Tenggara and Kalimantan, District animal health services have outright refused District PERDA to join the new KITPPKs or to merge with other service units, because animal health service delivery would be seriously jeopardized and diluted by such integration. The consequences of decentralization and local autonomy will impact effective livestock extension services in different ways:
• An institutional brain drain may develop as livestock extension officers seek other employment, resign, or retire.
• Retraining and reorientation is necessary for livestock extension staff transferred to the Dinas Livestock Services.
• Education of local government officers (especially Bupati) of the importance of sustained knowledge transfer in agriculture, and the danger of technology stagnation in the absence of such transfer.
H. The Animal Feed Industry 37. Even though the feed industry is not in the direct sense a technical livestock service, it does provide substantial private sector technical support to commercial livestock producers and, by virtue of its control of feed grain imports and feed pricing, plays an important role in Indonesia’s commercial livestock sector. The industry’s role will increase as livestock production continues to intensify and utilize more commercially-formulated feed. Post-crisis production dropped sharply as the result of a drop in feed grain imports. As a result, capacity utilization dropped from 67 percent in 1995 to 28 percent in 1998, and is recovery has been slow (Table 13).
Table 13. Serial National Feed mill Capacity and Output
Region 1995 1996 1997 1998 1999 2000 Total Number Mills 40 59 59 67 66 61 Total Capacity (000 t) 5,278 6,839 8,074 9,092 9,089 10,019 Feed Production (000 t) 3,551 4,295 5,930 2,538 3,367 4,481 Capacity Utilization, % 67% 63% 73% 28% 37% 45%

60
38. Indonesia’s feed milling industry, as is the case with most other livestock–related industries and services, is heavily concentrated in Java and Sumatra (Table 6.7a), with 80 percent of output capacity concentrated in Java, with the balance in Sumatra (18 percent) and Sulawesi (2 percent) (Table 6.7b). Seventy-eight percent of industry’s feed is sold to the commercial broiler and poultry industry, with the remainder marketed to pig farms and aquaculture enterprises (Table 6.7c). The industry is dominated by a few very large, international milling companies, with a large number of smaller mills in more rural areas. 39. Feed Ingredients. A full fifty percent of feed ingredients used by the industry must be imported in the form of corn, soybean, fishmeal and feed additives, which together make up more than 50 percent of the cost of compounded feed. Corn, the largest ingredient in commercial feed, is, in order of quantity, imported from the United States, Argentina, South Africa, China and India. Indonesia itself produces about 1.5 million tons of corn per year, mostly in Java, Sumatra and South Sulawesi, but post harvest losses due to spoilage, rodent and insect damage, and wastage approach 10 to 15 percent. More importantly, feed mills prefer using imported, drier (i.e. harder) corn, which is easier to grind and blend, and less prone to spoilage. Local corn has a high moisture content due to high humidity and a shortage of mechanical corn dryers, which are rarely used in smalholder-based corn production systems. Moist, harvested corn is more susceptible to spoilage and toxic fungus contamination (aflatoxin). Local fishmeal varies greatly in protein content and quality and is therefore unsuitable for accurate commercial ration formulation. Soybeans are grown as a food crop in Indonesia, and are used for producing soybean milk, tofu and various base ingredients used by the food processing industry. Like corn, locally grown soybeans are too moist and even more susceptible to post harvest spoilage than corn. 40. Feed Grains Balance. Since the crisis, which highlighted the severe freed grain shortages as a result of skyrocketing import prices, the feed mill industry has been involved in discussions with government how best to make the industry less import-dependent by the increased use of local crops or byproducts. This is not an easy task, given the comparative advantages of imported feed grains, as outlined above. The grains in question involve soybeans and corn, and the two major constraints to increased feed grain self-sufficiency are, (a) poor post harvest treatment and storage, and (b) irregular, often seasonal grain supplies, supplied in small quantity of irregular quality. 41. Domestic corn production stands at a static 5.5 million tons per year (Table 6.7), but its production areas are widely scattered and harvests are small and of varying quality. No significant domestic soybean production is taking place. Both corn and soybean utilization by the feed industry has resulted in increasing deficits which have been balanced by increased imports of both grains. Annual imports in 2001 of corn and soybeans stood at 687,000 tons and 957,000 tons, respectively. 42. Options are under review to develop large-scale corn production, utilizing integrated nucleus-plasma models that lend themselves to mechanical harvesting and improved post harvest drying and storage. For such models to work well, a large crop production land base is necessary, such as available in parts of Sulawesi and Sumatra. The nucleus farms would provide production inputs (seeds, fertilizer, tilling machinery), and smallholders would contract to grow the corn crop to harvest, after which the nucleus farm would control the critical post harvest period and marketing. Issues similar to those discussed under livestock nucleus-plasma models would have to be resolved. Whether such models would work on the intended scale is questionable, as no trials have been carried out. Furthermore, the comparative advantages of importing corn and soybeans over domestic production, similar to dairy production, should be carefully

61
analyzed. As a first step, initiatives to improve existing corn production and post-harvest storage may be more cost effective. 43. Technology Transfer. The feed industry plays an important role in technology transfer to its clients, related to poultry, pig and dairy cattle nutrition. Nutritional specialists employed by the industry for production, quality control and product promotion are highly qualified. The industry’s product promotion and market development and business techniques would be useful to smallholder enterprises considering commercialization, and linkages between these two groups would be beneficial to both.
I. Rural Infrastructure Linkages with Agribusiness
44. Livestock Production Intensification and Quality Control. In line with government policy, DGLS is putting renewed emphasis on opening livestock markets to import and export, and is addressing these objectives in two ways. First, DGLS is promoting intensified livestock production under the nucleus-plasma model, based on integrated smallholder-based contract production in collaboration with agribusiness enterprises. These enterprises would serve as nucleus farms, providing production inputs and markets to numerous (i.e. satellite) contract smallholders. As a second initiative, DGLS would strengthen control measures to improve the disease monitoring and consumer quality of imported and exported livestock products. In the nucleus-satellite model, secondary livestock product processing would receive major emphasis, with the aim to provide local employment in rural areas and capture value-added from primary production. Several integrated livestock production schemes are in planning or implementation, including ‘colony dairy farming’ in Java, with groups of 50 smallholders, each milking 500 cows; large-scale beef cattle fattening in East Java and West Sumatra; commercial, smallholder-based layer and broiler production, and small ruminant production in oil palm estates in Bengkulu, Sumatra and in Papua. Designated government-owned slaughterhouses would be transferred to the private sector to improve throughput and quality control, with local government remaining in charge of meat inspection and other regulatory controls. 45. Local Tariffs as Constraints to Livestock Movement. Driven by the need to augment local budgets, and supported by their newly granted autonomy, District governments in many locations, notably in NTB and East Java, are increasing cattle transport taxes and livestock market taxes, often four to five-fold of traditional rates. As a consequence, cattle traders may face multiple taxation as they cross Subdistrict and/or District borders to their points of sale. For example, transport taxes in NTB have in many places increased from Rp10,000 to Rp45,000 per head, to the point where the provincial Dinas Livestock called a meeting to resolve the matter, as livestock traders and smallholders faced in creasing financial hardship and delays in transporting stock from local markets to distant locations.
J. Slaughterhouse Capacity 46. Slaughterhouse capacity is generally old and below standard, but efforts are made to upgrade capacity. With bilateral assistance from Japan, ten new slaughterhouses are under construction in ten provinces. National abattoir capacity operated by DGLS comprises three classes of facilities; Types A(national), B (provincial) and C (District) and D (Subdistrict), located at the national, provincial and sub-provincial levels. 47. The small, type C and D slaughterhouses make up the majority of slaughter capacity in the country, and many were built during the colonial times and have deteriorated, with substandard sanitation (Table

62
6.8). These small slaughterhouses receive minimal, often cursory inspection and service only the daily wet markets. National slaughter capacity has increased only slowly, from 2.9 million to 3.5 million animals of all types, between 1996 and 2001 (Table 6.8, 6.9) Slaughter capacity for cattle and poultry, especially at the Type B and C levels, is a frequently mentioned marketing constraint in remote areas. At the type C and D levels, no poultry slaughtering capacity exists, which poses an important drawback when considering village poultry upgrading and marketing. Even at the Type B level, the national poultry slaughtering capacity is minimal, as virtually all poultry is presently sold in wet markets. Commercialization of village poultry production will, however, require mechanical slaughter and cold storage. Cattle slaughtering facilities are equally small, but not yet a serious constraint. 48. A significant technical constraint is the low level of meat inspection and Type A facilities, which constraints export slaughter. Outside Java, virtually no cattle slaughter capacity is available. Private sector abattoirs take up some of the slack, but are reluctant to establish off-Java, leaving infrastructure building to the public sector. Without budgets for this purpose, grant funding seems the only alternative for building capacity. Subdistrict poultry abattoir do not have to be expensive, and FAO has simple, cost effective abattoir designs that suit small-scale slaughtering. 49. Type B, C and D slaughterhouses have been taken over by District and municipal governments, which will face substantial costs to rehabilitate these facilities, where feasible. The majority of facilities are, however beyond repair and should be replaced. Local governments are best advised to turn slaughterhouse operations over to the private sector for rebuilding or rehabilitation, and confine themselves to the regulatory functions of meat inspection and food hygiene.
63
SECTION VII LIVESTOCK POLICY AND INSTRUMENTS 1. This Section present existing livestock development policy, pricing policy and animal health services policy as promulgated by GoI, and the objectives by DGLS to implement its 5-year, 2000-20005 livestock sector development strategy. Alternative policy implementation is suggested to some of these objectives. Prices and trade deficits were covered in Section II, and conclusions on prevailing pricing and trade policies are summarized here.
A. PUBLIC SECTOR LIVESTOCK DEVELOPMENT POLICY
2. The National Agricultural Policy Framework. In response to the challenges of the financial crisis and the renewed emphasis of opening markets to trade, DGLS has promulgated a 5-year strategic livestock sector development plan for 2000-2005, which emphasizes five objectives. The 5-Year Plan contains the following objectives:
• Increasing self sufficiency in milk, beef, poultry meat and eggs through increased and more efficient
livestock production, driven, where feasible, by linkages between smallholder livestock owners and agro-enterprises,
• Increasing secondary livestock product processing to capture local value-added and increase rural employment opportunities,
• Developing linkages between agribusiness and smallholder producers under nucleus-plasma production models, with agro-enterprises providing production inputs, markets and services, in return for supplies of livestock produced under contract by smallholders.
• Increasing quality control of livestock products, to improve consumer confidence, food safety and export quality; linked to improved animal disease surveillance to guard against the entry of livestock diseases resulting from liberalized markets and trade , and
• Improving technical livestock support services, including production technology transfer, animal health services and genetic breed improvement, to provide the technology base for upgraded, more efficient livestock production.
3. Most of these objectives are rather generic in scope. Two objectives, namely the development of agribusiness-smallholder linkages and secondary processing for local value-added, address constraints that have long hindered livestock development in areas with limited access to credit, markets and technology. These two objectives primarily address the commercialized livestock segment without addressing sector development in the outlying regions. Other objectives, including improved support services and increasing livestock output, are rather general and not supported by concrete objectives or results. In the information to which the report authors were privy, no reference was ever made to the sector adjustments necessary following the financial crisis and government decentralization. Further elaboration on the promulgated policy follows below. 4. Increased self-sufficiency goals in milk consumption cannot be achieved until a major overhaul of the dairy co-operative infrastructure is undertaken. Increased self sufficiency in poultry meat for rural consumers is a more feasible goal, provided the village poultry subsector is upgraded along the lines of the RRMC integrated village poultry production model. For this to be realized, substantial infrastructure development is needed in these areas of farmers’ organizations development, production inputs (feed, chicks, husbandry), and markets. Sustained development of the commercial poultry industry will continue

64
to benefit the urban consumer. The production of micro-livestock (rabbits, quail) deserves further evaluation, but is feasible at the village-level for lower-income households. Improving small ruminant production under confined housing and cut-and-carry feeding, improved farmers’ organization for better marketing, and the transfer of simple husbandry, animal health and feeding technologies. On a larger, more capital-intensive scale, cattle fattening under a nucleus-plasma model could succeed in areas with a sufficient forage base, but because of its capital intensity, will require access to farmers’ credit. 5. Increased secondary processing. This objective is a worth one but must be closely linked to simultaneous agribusiness participation in nucleus-plasma production models as a downstream activity. The unresolved constraint in achieving this objective is the equitable participation by smallholders producing production inputs under contract. More time should be expended on finding the right mechanisms, of which stronger, smallholder organization is an important ingredient. Nucleus-plasm schemes are capital intensive and require sustained, reliable supplies of raw material (often difficult to achieve in rural areas), substantial agribusiness inputs and expertise, market access and development, and credit. Preferential capital investment incentives and agribusiness commitment are essential if such joint-ventures with smallholders are to succeed, and the public sector must play a dominant facilitating role. The legislative framework to facilitate such investment is in place at the central level; however, local governments will need to follow up with similar PERDA. As indicated, this objective bypasses outlying areas, where different schemes for livelihood improvement are needed. 6. Increased product quality control and food safety are important issues that cover a wide terrain in which the public sector must address substantial regulatory and standardization issues. Successful implementation cannot only be a public sector objective, but must include two prongs: the consumer and the private sector. Consumers need to be informed of safe food storage and preparation methods; an area not yet well meshed with industrial food safety improvements. The food processing industry will only respond positively to food safety improvement if incentives are provided for good corporate behavior. Self-regulation is an option which does not yet appear to be a significant factor, and public sector regulation remains weak. Only in instances where international export markets are involved, should ISO-9000 or HACCP accreditation by attempted, as the cost of such accreditation is high. At present, the current enforcement of compliance by the industry with existing public health laws, like public sector compliance monitoring, leaves much room for improvement. The achievement of this objective should be revisited by incorporating self-regulation and consumer education. 7. Improved technical livestock support services continues to be the domain of the public sector. Three factors will drive realistic service improvement: the privatization and/or cost recovery of services, redefining public and private sector roles, and strong local government commitment to support services. At present, none of these three factors is fully or functionally in place. A window of opportunity for the introduction of privatization is now open, given the shift of responsibilities for support service provision to local governments, and the dwindling government budgets with which to adequately cover services. Political factors and a lack of local government commitment are delaying the introduction of cost recovery programs. The privatization model for the animal health post network (Section VI) may serve as an example. 8. Suggested Policy Alternatives. As indicated repeatedly, livestock sector policy should be redefined in the light of post-crisis adjustment and decentralization, and these two factors should pervade all sector initiatives. It is not clear, however, that is in fact the case. The financial crisis has resulted in significant shifts

65
in livestock sector development, and the decentralization policies that have followed have placed the large parts of the responsibility for future sector development to the local government. Recognition of these shifts is, however, not evident in the content of the 5-year sector plan presently under implementation. Much of the prevailing confusion at both central and local government levels that surround decentralization and government retrenchment stem from the lack of clear policy guidelines pertaining to the satisfactory resolution of these important factors. 9. Moreover, little or no initiatives have been proposed to suit the outlying Have Not regions, other than the standard interventions. Support services, such as the poskeswan network, local laboratory service, livestock extension and farmer training suffer from chronic budget constraints and technical input, but no privatization initiatives are being proposed. Local government autonomy would hopefully better address these constraints. On the production side, the INTAB and forage distribution programs are ineffective, and local NGOs have fared best in providing similar interventions. In rural areas, service privatization, farmer organizations, and working with NGOs offer the best hope for sustained success. 10. In summary, a number of issues need to be addressed and require further evaluation, leading to their incorporation into national policy. These issues are outlined below, and include:
• Definition of public and private sector roles and responsibilities, • Adjusting to decentralization and local autonomy, • Privatization/cost recover of support services, • Developing suitable livestock improvement models for the outlying regions • Livestock production intensification with equitable smalholder participation, and • Preparing for market globalization through increased food safety and the upgrading of processing
capacity.
11. The above topics should be assigned to DGLS working groups and refined until ready for policy implementation. A brief explanatory follows for each: 12. Adjusting to Decentralization and Local Autonomy. A window of opportunity exists to carry out this objective, given the ongoing decentralization and divestment by DGLS of District-level services and programs. Adjustments between central and local governments, are presently underway, are often confrontational in nature, involving disputes concerning boundaries of authority, transfer of property and reassignment or retrenchment of staff. The transition deadline date was announced on rather short notice, and a one-year transition period would have greatly assisted the process. Transition inevitably involves a redefinition of central and local government roles, including public and private sector roles, so that these two issues are interdependent and have to be resolved as one. MoA and DGLS should, together with the provinces, redefine the regulatory and service aspects of livestock sector development, with the aim to achieve partial or complete privatization of District and village veterinary services, breeding, production-related livestock and poultry programs. During this process it will become clear which aspects of DGLS’s present mandate should be turned over for privatization. 13. Local governments often lack the technical and managerial skills to take over programs that were a central government responsibility. Substantial refresher training is needed, for which DGLS, as the line agency, should bear the responsibility. Financial and human resources to accomplish this objective have however not been allocated. Areas of special need for smoother transition between DGLS and the Districts

66
include: disease surveillance and reporting, transferring ongoing field programs (forage development, AI), privatization of the poskeswan network; ongoing research and development; slaughtering and meat hygiene; vaccination campaigns. 14. Privatization of Support Services. Neither the central nor local governments have sufficient budget to support adequate livestock services, and privatization of selected service programs seems the most effective alternative. Privatization should include: the poskeswan network; AI programs; animal slaughter; and livestock extension. Networking closely with the private sector, including agribusiness and NGOs, is essential in achieving this objective, as they have the resources and field experience to effect privatization 15. Suitable Livestock Development Models for Outlying Regions. Livestock development policies such as the nucleus-plasm schemes, market globalization and food safety are mainly directly towards the core regions in Java and parts of Sumatra, and do not significantly impact on the outlying provinces, which thereby miss the opportunity for equitable development. A more fine tuned policy approach is necessary to address this gap, by taking into account existing resources. For example, introducing nucleus-plasm schemes, feasible in Java, will not succeed in remote areas with little infrastructure and remote markets, but NGOs have had far greater success, albeit on a smaller scale, in achieving livestock development, employing project designs adapted to local conditions and participatory involvement of stakeholders. DGLS should seek to liaise more closely with NGOs in its attempts to promote livestock development. Small-scale production models carried out be a number of NGOs (i.e. the RRMC poultry scheme) are also worthy of further study and replication. 16. Livestock Production Intensification to Meet Consumer Demand. This objective is directly linked to market globalization and privatization, is applicable to the developed regions of Java and other provinces, and involves close cooperation with agribusiness in developing production models that involve smallholder participation. As indicated elsewhere, equitable distribution of benefits and responsibilities are essential in the success of such schemes. 17. Market Globalization, directed to livestock-intensified regions, to stimulate the livestock sector through increased and improved production and production quality, increased food safety and quality, and increased rural employment. This objective is being undertaken as part of current livestock sector policy. 18. A review of the dairy subsector is presently outside the jurisdiction of MoA and DGLS, as the responsible cooperative GKSI is managed under the Ministry of Cooperatives. As indicated, commercial dairy production, if to be continued, should be transferred to MoA and a complete review should be carried out, with as objectives, (a) comparative advantages, (b) cooperative or alternative management structures, (c) technical constraints, and (d) increased producer empowerment and free-market production.
B. Production and Pricing Policy - Impact on Efficiency and Equity 19. Import Substitution. Two factors drive the government’s agricultural pricing policy, each frequently contradictory in its objective and implementation. They are, first, promoting a policy of low consumer prices for livestock, poultry and dairy products, and, second, import substitution and decreased reliance on expensive imports of feedstuffs, breeding stock and other commodities not domestically available. The effects of the financial crisis, which escalated consumer prices and import costs, have rekindled government efforts to address these objectives.

67
20. However, import substitution of imported feed grains, dairy products and exotic breeding stock are objectives difficult to achieve, with their success subject to creating the necessary enabling environment for efficient production, marketing and infrastructure. The socio-economic polarization of the urban and rural populations in Indonesia, as seen in the widening income gaps between these two groups, further precludes easy solutions. The declining import-export trade balance value for livestock products shows some evidence that import substitution objectives are being addressed, but the improvement of the trade balance since 1998 is largely the result of decreased imports, without addressing increased domestic substitution (Table 14). Table 14 Serial Trade Balance for Breeding Stock and Livestock Products (US$000)
Commodity 1995 1996 1997 1998 1999 2000 1995-98 1998-00 Export-Import Deficit -517,124 -600,230 -514,638 -237,927 -405,396 -408,434 -54% 72%
21. A realistic assessment is required to define the comparative advantages of domestically produced livestock products in accordance with the most efficient cost-benefits ratio, which can then be followed up by the necessary policy intervention. In this assessment, animal protein production from dairy, poultry and ruminant subsectors should be compared, incorporating the extent to which the necessary enabling environment is presently in place to support each commodity. As indicated in Section II, of those input products or finished presently being imported, increased export substitution is only partially feasible for corn and, over the longer term for breeding stock (dairy cattle, poultry GP and P stock). 22. Improvements in domestic milk production are will require substantial institutional change, but may even then not be comparatively cost effective. Domestic poultry production has great scope, but will increase import dependency on imported feed grains. However, commercial poultry production may be able to reach a sufficient level of efficiency to offset increased feed grain importation. Livestock products, even if in short supply locally, continue to be exported in spite of domestic shortages to earn much needed foreign exchange; thereby overriding broader trade objectives. Many of the irrationalities encountered in the livestock import-export trade are the result of the inability to fine tune demand and supply, for which much closer collaboration is needed between government and industry. 23. Even in the commercial poultry industry, representing the most commercialized and organized livestock subsector in Indonesia, supply and demand trade linkages are not well attuned, and overproduction of day-old chicks are common, and usually followed by price crashes that necessitate large kill-offs of surplus chicks. Such measures are cost-inefficient and increase production and consumer prices. The Directorates of Planning and Agribusiness should set up, or strengthen, working groups with the poultry and feed industry to discuss measures to improve the economic fine tuning of markets. DGLS has substantial leverage in these matters, as it issues the import and export licenses that drive the international livestock products trade. 24. Prices. As outlined in Section II, livestock retail prices have increased substantially as the result of the Rupiah devaluations, the declining economy and the increased cost of commercial livestock production (Table 15). At the same time, disposable household income has also declined, widening the gap between food expenses and affordability. Due to their overwhelming dominance of commercial—and to some extent non-commercial—livestock production and infrastructure, Java and Sumatra play a deciding role in livestock product pricing and livestock-derived food supply, which in turn influences retail prices elsewhere in the country.

68
Table 15. Serial Prices for Breeding stock, Meat, Milk, Eggs and Animal Feeds (Rp/kg or liter)
Year 1995 1996 1997 1998 1999 2000 2001 Increase 95-01 Breeding stock (imported) 3,563 3,668 4,192 4,764 8,251 11,944 14,876 320% Commercial Poultry 2,894 3,580 3,722 4,451 8,326 4,667 4,704 139% Other Meats 7,059 7,774 7,978 10,402 16,711 19,987 23,467 243% Commercial Eggs 2,477 2,884 3,018 5,774 8,702 6,812 7,872 218% Milk 645 682 702 1,225 1,225 3,612 3,500 443% Animal Feed 792 881 941 2,258 2,231 1,801 2,416 205%
C. Trade Protection Policy
25. The member economies of Asia Pacific Economic Cooperation (APEC) are determined to liberalize trade and investment in the Asia Pacific region. In the meeting in Bogor, Indonesia8, in 1994, APEC set the long-term goal of free and open trade and investment in the Asia Pacific. The Bogor Declaration hoped to realize the goal in 2010 for the developed economies and 2020 for the developing economies. Furthermore, the Bogor meeting clarified the three pillars on which APEC would be based, namely, (a) Trade and Investment Liberalization and Facilitation (TILF); (b) Economic and Technical Cooperation (ECOTECH); and (c) Development Cooperation. Import tariffs have been cut unilaterally in APEC member economies, and further tariff cuts are expected to implement the Bogor goal consistently. 26. While tariff reduction has been implemented in APEC, there has not been much discussion on agricultural liberalization. This is different from the WTO/UR liberalization scheme, which is more explicit in specifying the reduction of import tariff, domestic distortion, and export intervention of agricultural commodities. In APEC, the tariff reduction is generally measured based on the average tariff level, meaning that sect oral classification becomes less relevant. It was only recently that sectoral approach of tariff reduction, the so called EVSL (early Voluntary Sectoral Liberalization), was set in Vancouver meeting in 1997. However, in Kuala Lumpur meeting in 1998, there was disagreement among APEC member economies on the liberalization of some sensitive agricultural sectors. As a result, APEC had to submit its EVSL problems to the WTO for resolution. It was clear that agriculture remains a sensitive sector in APEC. 27. Indonesia enjoys preferential treatment for export tariffs to the A-7 countries under the APEC Venezuela and Tokyo Rounds, but by the year 2010 these advantages will be phased out, so that competition will then take place on even playing fields. The remaining time until tariff equalization will not be adequate for Indonesia to establish an export industry for livestock products than can compete at the market niche already occupied by other Asian countries (Korea, Malaysia, China). Indonesia is therefore preparing requests to extend the deadline on the rationale that its economic recovery and market liberalization cannot be accomplished fully by 2010, and that the economy, which is beginning to show some signs of recovery, will regress if further preferential tariff treatment is not granted. Low production costs in rural areas are Indonesia’s main comparative regional advantage in livestock production, but these
8 Excerpts from papers by the Centre for International Economic Studies, Adelaide University, Australia, 1999 (paras. 13-15).

69
can only play a role if mechanisms are found to commercialize smallholder production where feasible. The role of small and medium enterprise development is an important factor in this process.
D. Small and Medium Enterprise (SME) Development Policy 28. SME Performance. Small and Medium Enterprises, including co-operatives, have played an important role in the national economy. Based on 2000 data, there are 39 million enterprises of which 99.85 percent are small; 0.14 percent, and only 0.01 percent large enterprises. A small enterprise is defined as having less than Rp200 million in capital assets and a turnover of less than Rp1 billion per year. In 2000, SMEs employed more than 74 million workers and contributed 56 percent of GDP, generating an export value of Rp439 billion. The SME sector is under the oversight of the Ministry of Co-operatives and SME (MoC). SMEs comprised 19 percent of total SME capital assets, but their export value of agricultural products was only 1.8 percent of total exports, which are dominated by the petroleum industry. 29. The government has identified resource-based economic activities, which includes agro industry, as a prime area for SME support and development, with the objective to increase farmers’ incomes, promote exports, and general rural employment. Such initiatives will require human capacity building, capital in terms of credit and equity financing, information technology, and the development of a conducive business environment through legal and legislative reforms, taxation, licensing and other trade issues. 30. SMEs played an important stabilizing role during the economic crisis, as they account for a major proportion of employment and are major actors in economic development. Many burgeoning rural production enterprises that have-or aim to-reach the SME status, are facing similar problems9. It is therefore important to apply development policies and principles aimed at the rural SME sector. SMEs face constraints similar to those in the agriculture sector. These include access to credit, applied technology, managerial and skilled human resources, and access to commercial banks, markets, networks, and information. There is a growing need to establish micro-financing banks or informal financial institutions or entities that can respond to rural financial needs. Non-financial support can be provided through business development services or tax incentives to promote a competitive environment. 31. Strategic Planning. As part of the 1999 Basic Guidelines to State Policy, MoC has introduced a 5-year strategic SME development plan, which will impact on rural SMEs to be engaged in livestock production. The strategy focuses on the establishment of local (including rural) economies based on market rationale, and available natural and human resources. The strategy includes the following programs:
• Inter-government-institutional coordination • Decentralization, • Stakeholder participation, • One-stop shop licensing and regulatory services in selected areas, • Women’s entrepreneur development, • Tax incentives • Simplification of legal and regulatory compliance • Protection against monopoly
9 From a presentation in April, 2001 by the Minister of Co -operatives and SMEs, presented to the Interim CGI Meeting held in Jakarta.

70
• Strengthening financial services and institutions, and • Strengthening alternative financial institutions.
32. There is no clear view how, or whether, the SME policy would impact rural enterprises (i.e. rural SME) involving smallholder or village-based production, and what the mechanisms of involving rural SME might be. There is a clear need to address this issue, as it is fundamental to the upgrading and commercializing of suitable segments of rural livestock enterprises. Business collaboration with agro industry under nucleus-plasma models is one approach referred to in this report, but others need to be identified and tested.
E. Animal Health Policy
33. The policy framework for a national animal health services system has long been established, and the infrastructure and legal/regulatory frameworks to carry out the policy are in place. The constraints related to an effective animal health policy relate more to implementation by the central and provincial Dinas Animal Health Services, than to the framework itself. Compounding these constraints is the decentralization policy, which has divided the animal health services system into two tiers that are presently operating separately. And not engaged to any significant extent in networking together, and adjusting to the change. As indicated earlier, the solutions lie in redefining public and private sector roles and responsibilities in the light of local government autonomy and decentralization, and privatizing, partly or fully outsourcing animal health services. 34. Divestment of animal health services to District governments should alleviate some budgetary constraints, but these would be offset by the confusion and lack of focus by which many local governments are assuming their new, and often unfamiliar, responsibilities. 35. Several recommendation would assist in improved focusing and cost savings:
• Redefining public and private animal health protection roles. Defining the roles between local and central Dinas services will reduce staff but improve staff capability, assist in the transition process, and allow the opportunity to adjust programs within allocated budgets.
• Privatization or cost recovery of village animal health services programs, livestock slaughter, vaccination and animal breeding, a repeated recommendation in this report, would allow Dinas Animal Health to focus on regulatory and legislative matters, and vocal governments to better implement their programs.
• Standardization of disease reporting between district and provincial levels, already in progress, combined with clear guidelines for local and central government responsibilities, would further focus programs, policies and budgets.
• Performance meriting should be introduced for all Dinas staff, to improve efficiency, accountability, and to define responsibilities.

71
SECTION VIII GOVERNMENT AND DONOR PROJECTS AND PROGRAMS 1. This Section summarizes livestock projects supported by multilateral institutions, bilateral development agencies and non-governmental organizations (NGOs). The collection is incomplete, but contains the more interesting projects that were brought to the author’s attention while preparing this report. Numerous unmentioned small projects do exist, carried out by a host of international NGOs and local NGOs, but which were, giving time constraints, too time-consuming to identify. Several projects deserve the report authors’ Best Practices rating, especially where they assisted remote, poor areas or fostered sustained government and community commitment to livestock production. 2. A significant change in livestock project design is taking place as the result of decentralization and local autonomy. The NGOs are leading this change, which involves bottom-up, very participatory project design and implementation. Such design changes are easier to effect in small projects, as those that must cover areas larger than a village or subdistrict usually require the involvement of the public sector agencies. Nevertheless, these projects provide useful models from which to design alternative or scaled-up models. As has been indicated repeatedly in this report, the organization of smallholder producers is essential to this participatory project design, and therefore forms an integral part of the design, giving these models a substantial social structuring content. Many projects include, aside from assistance to local governments in development planning and organization, the organizing of livestock producers into stakeholder groups that have a voice with local government.
A. Projects Sponsored by Multilateral Agencies 3. These projects are quite large in scope, often multi-provincial and involve, by virtue of their government-to-government format, the participation of, or direct sponsorship by, the government line agencies. NGOs are free to engage directly with stakeholder groups, but often lack the financial and organizational resources to carry out projects with broad sector impact or high-level institutional change. Lack of sustainability is a frequent problem in the “older” projects, of which the poskeswan components under the World Bank-financed NEAP I and II projects of the 1980s are good examples. Nearly 40 percent of the poskeswan that were then established have closed down for lack of operating funds or, more importantly, lack of local government support, even though the need for effective animal health services has continued to rise. A number of poskeswan supported by the NAADP and SAADP projects were in similar danger, until these projects were redesigned to be more recipient-responsive. Multilateral Donor Agency Recipient Agency Activities Time
span World Bank Kalimantan Transmigration Projects
Bappedas, Provinces_
Distribution of cattle and buffaloes to resettlers from other islands
1980s
World Bank NTAADP and SAADP
Bappedas, Provinces in Sulawesi, NTT, NTB
Area agricultural development, including livestock procurement and production; support to animal health posts.
1990s
World Bank, with AARD National Agricultural Extension Projects (NAEP I
Bappedas, AARD, Project Provinces
Establishment of 200 animal health posts (poskeswan) to deliver village-level animal health services to
1980s
72
and II) livestock producers, mostly in Java. Asian Development Bank, with DGLS
Indonesian Livestock Marketing and Slaughterhouse Development Project
Upgraded livestock marketing distribution and slaughterhouse facilities by identifying and supporting improvements through a technology transfer program
1988-89
Islamic Development Bank, with IFAD
Cattle, sheep and goat distribution project, S. Sulawesi, Maluku
Ruminant production and infrastructure development; expansion of project to new recipients through in-kind transfer of young stock.
1996-2003; ongoing
B. Projects Sponsored by Bilateral Donor Agencies.
4. The bilateral agencies have assisted in a substantial number of livestock projects, of which several deserve special note. The integrated smallholder poultry production MMRC project, financed by JBIC, receives a Best Practices rating from the report authors for its participatory, bottom-up design, beneficiary focus, local government participation and commitment, and its integrated, self-reliant objectives. The MMRC project is replacing the INTAB poultry project, which was of opposite design; top down, authoritarian and “poorly adjusted to suit local conditions, and without the benefit of integrated support, animal health and marketing services. INTAB failed, by DGLS’ own admission, because program recipients never had ownership of the project and therefore saw little incentive in joining or participating. MMRC project need excellent implementation management and are rather complicated to prepare, as they involve multiple participating parties, all with the necessary sense of project ownership and incentive to provide sustained and successful input. 5. The DFID-supported DINAMIS project is notable for its close liaison with local government and stakeholders, and a good example of a “modern,” well integrated and stakeholder-responsive design. DINAMIS does nor directly address livestock production, but targets local government reorganization and autonomy issues, and tailors its projects to these changes. It provides however a good generic model for the design of other project objectives, which can include livestock development. The DFID liaison with local NGOS has been generally very successful. The Eastern Island Veterinary Services Project, supported by AusAID, was quite successful, in particular where the project had targeted a remote and very poor area. Dinas Livestock for West Nusa Tenggara still speaks highly of the impact this project, which established a village veterinary services system for own income livestock smallholders. This project was responsible for having governments in project areas issue PERDA requiring sustained budget allocations to support poskeswan and veterinary services, which have been instrumental in the low attrition rate (from 0 to 12 percent, compared to 40 percent nationally) of poskeswan in that region. Bilateral Donor Agency Recipient Agency Activities Time
Span DFID with Pact Indonesia NGO DINAMIS Project
Bulukumba District, government service providers
Service delivery enhancement, privatization, decentralization
Ongoing
Japan Business Investment Center (JBIC), with provincial Dinas Livestock
Integrated Smallholder Village Poultry Production
Established in 18 provinces, in pilot district, involving 13, 000 farmers. Integrated production model, including
1999- present

73
(MMRC) small feedmills, hatcheries, poultry abattoirs, training, small business development, marketing unit A Best Practices project..
Australian International Development (AusAID), through N.S. Wales Department of Agriculture and DGLS
Eastern Islands Veterinary Services Project (East Timor, NTT, NTB)
Support to veterinary faculty of Udayana University, NTT.
1996-1998
AusAID, through New South Wales Department of Agriculture and DGLS
East Timor, NTT and NTB Dinas Peternakan
Eastern Island Veterinary Services Project (EIVSP) \
1996-98
Research Institute for Veterinary Science (Balitvet) in research collaboration with ACIAR, ILRI, DFID, World Bank, CSIOR, ADB
Bogor, West Java Technical assistance in developing various diagnostic tools and animal disease research. Including screwworm (ACIAR), fascioliasis (liver fluke), malignant catarrhal fever (DFID); others.
1998 to, 2001
Canadian International Development Agency (CIDA), with DGLS and Ontario Ministry of Agriculture & Food
Yogyakarta Regional Disease Investigation Centre Development Project
Technical assistance in the establishment of the laboratory, responsible for disease surveillance in Java, including diagnostic equipment, long-term TA, field investigations, in the job and post graduate training
1985-1992
Canadian International Development Agency (CIDA)
Indonesian Veterinary Association (IVA)
Technical support in establishing the IVA-owned Jakarta Small Animal Hospital; support to the organizational structure of the association; membership training; exchange visits.
1980s
DFID District Dinas Livestock Services
Animal Health Project. Veterinary services at District level.
1990-94
Canadian International Development Agency (CIDA)
Regional Disease Investigation Center, Yogyakarta
Integrated Animal Health Services Study, Java
1991
Japan International Cooperation Agency (JICA)
Directorate of Veterinary Public Health
Abattoir upgrading project. The construction of ten abattoirs in ten provinces
1999-02 ongoing
1-New Zealand 2-JICA 3-AusAID 4-CIDA
GKSI Dairy Cooperative
1-Milk cooling unit and milk truck 2-30,000 doses of frozen semen 3-200,000 doses of frozen semen; training in forage production and storage 4-60,000 doses of frozen semen
Various

74
C. NGO-sponsored Projects.
6. Although small in scope and investment, many NGO-sponsored projects have excellent recipient ownership and local government commitment, primarily the result of the direct and close access by NGO staff to local government staff and project beneficiaries. Of the international NGOs, Heifer International, an offspring of Winrock International of Arkansas, the United States, has established a large and remarkably innovative set of mini-projects in Sumatra, related to community-based veterinary services delivery. These projects are very bottom up, and heavily oriented to community welfare, community planning and community empowerment. These mini-projects also merit a Best Practices rating. 7. The NGO projects provide excellent models of community participation and local government strengthening, and these models should serve to develop the larger-scale projects or project components that typify Bank projects.
Bilateral Donor Agency
Recipient Agency Activities Time span
Indonesia International Rural and Agricultural Development Foundation (INI RADEF), with Directorate of Higher Education and private sources.
Udayana University, Bali
Establishment of self-supported Bali Cattle Investigation Center.
1995-1999
Heifer International With village communities and local veterinary services in: Sumatra, Aceh, Java,
1. Increased Income and Community Welfare through Livestock Activities (South Sumatra) 2. Strengthening the Values of Caring and Social Responsibility through Livestock Activities (2002-2004) 3.Fish and Water Buffalo Project(2000-2004) 5.Community Animal Health Voluntary Services in Indonesia (2000-2005) 6.Pilot Grants for Values-based Planning for Community Organizations (2000-2005( 7.Building Capacity of Local Organizations (2001-2005) 8.Compost Training (2000-2001) 9.Klaten Dairy Development Program (1995-2000) 10.Intensification and Improvement of Livestock Production (1996-2000) 11.Training Farmer Technical Trainers (preparation) 12. Community Water Monitoring for Empowerment and Action (preparation)
Most are ongoing.
Winrock International DGLS Review of the Livestock Sector in the Republic of 1986

75
Indonesia (2 Vol.)
The DINAMIS Program
Through DFID, with local NGO Pact Indonesia.
Supporting improvements in service delivery by local government agencies and civil society organization throughout Indonesia. (Not livestock-oriented but useful in general approach to local government support)
Ongoing
DELIVIRI, through DFID
Dinas Livestock Services, with DFID in N. and S. Sulawesi
A 4-year program to establish client-focused approaches to livestock service provision within the department of Livestock Services, to be developed and tested in four districts in Sulawesi. The capacity of department staff to implement them on a wider scale will be enhanced through in-country and overseas training. If successful, the program will contribute to sustainable increases in wealth and enhanced self-reliance of small-scale and resource-poor farmers through increased livestock production
Ongoing
Agriteam Canada, with DGLS
Animal Health and Production Information System for ASEAN (AHPISA)
Regional animal health and production information system that integrates the national requirements of each ASEAN member country and addressed the constraints related to regional issues, trade and access to international markets for livestock and livestock products.
1993-94

76
SECTION IX RECOMMENDATIONS
1. Recommendations for improving livestock sector performance are included in the various Sections of this report. As indicated repeatedly, successful livestock sector improvement will depend on the resolution of two key issues: (a) an equitable transition to decentralization and local government autonomy, and (b) a redefinition of the public and private sector roles and responsibilities in national and regional livestock development. A resolution of these issues is fundamental to resolving secondary issues such privatization, disease surveillance, program implementation and regulatory responsibility, addressing the widening gap between central and outlying regions, and improving services to rural livestock producers. This Section summarizes recommendations and draws on lessons learned from livestock development programs and other projects in Indonesia and elsewhere.
A. Enhancing Livestock Sector Performance
2. Livestock sector performance in the post-crisis years needs to adjust to changing social and economic conditions in three areas: (a) policy adjustment, (b) institutional change and (c) technical and operational upgrading. In these three areas, the two key issues related to decentralization and redefining public-private sector roles must form an integral part. (A). National Livestock Sector Policy Adjustment: Six areas impacting on livestock sector development policy require a clear resolution and should become an integral part of the national livestock policy framework. They are:
• Definition of public and private sector roles and responsibilities, • Adjusting to decentralization and local autonomy, • Privatization or cost recovery of support services, • Addressing the widening gap between the Have and Have-Not regions • Livestock production intensification to meet future demand • Preparing for market globalization
These issues have been discussed in detail in Section VII. Additional issues include:
• Developing the legislative framework to allow livestock support service units to engage in self-financed service programs by the retention of earnings to cover recurrent costs, maintenance costs, and, where necessary, adding to or improving the capital assets of service units.
• Standardizing local government PERDA pertaining to animal disease surveillance reporting, and
• Autonomy to IVMA to register and license its own members as an important step to privatize the veterinary profession and allow it greater professional autonomy.
(B) Institutional Strengthening of both public and private sector to deal more effectively with post-crisis change, by:

77
• Strengthening local government livestock program administrative and managerial skills, to ensure that livestock service programs divested by decentralization will continue to serve their recipients.
• Strengthening livestock owners’ associations, allowing for better producer representation with local governments.
• Privatization or cost recovery of specific livestock services: animal health posts, livestock breeding, slaughter, and extension, to ensure their operational sustainability.
• Divestment of production-oriented programs to the private sector, with Dinas assuming a technical and, if necessary, regulatory, back-up role.
• Injecting greater personnel accountability into service program delivery, by means of greater accountability, setting realistic service targets. To be achieved through contracted, performance-based employment. This is especially relevant for local government personnel.
• Assisting local governments in prioritizing livestock sector needs, based on prevailing poverty levels, livestock potential in local areas, and the longer-term prospects of advancing toward cash-based production.
• Revitalization of the regional APHIS early animal disease warning system, by attracting bilateral and ASEAN membership funding to further develop this important network.
• Management review of Pusvetma (Central Vaccine Laboratory) operations, to decide on its future sustainability, and considering financial and technical strengthening options related to joint venture, privatization, refinancing or other such options.
• Review of the dairy cooperative GKSI with the aim to improve managerial and technical structure and increase producer empowerment.
(C). Technical Improvements.
• Introduction of routine refresher training of all program field staff (animal health, production, extension) to enforce existing and learn new technical expertise, and making refresher training part of continued staff accreditation.
• Development of better working linkages between the diagnostic laboratories, with higher level laboratory staff training the lower levels, making refresher training part of the service requirements of diagnostic laboratories.
• Better back up support by District laboratories to poskeswan in their service area, and act as resource centers for (a) regular field staff training, (b) providing information feedback, (c) providing technical backup support, (d) trouble shooting.
• Inclusion of small business management training into the veterinary curriculum of the five veterinary faculties.
B. Contribution to Economic Recovery and Pro-Poor Growth
1. Livestock development depends heavily on infrastructure and human resource development, which are hampered by the uneven and inequitable geographical and economic distribution of livestock resources in Indonesia. These constraints hamper equitable development and economic recovery in the outlying regions distanced from Java and Sumatra. In order to assist leveling the playing field for less-advantaged areas, policies and programs need to be better tailored to local priorities and needs. This requires participatory involvement by program recipients; bottom-up approach. Enhanced livestock performance goes hand in hand with rural poverty alleviation, and the recommendations for increased contribution by the

78
livestock sector in economic recovery and poverty alleviation are therefore similar. These recommendations cover institutional, technical, and human resource development aspects. (A) Institutional Strengthening:
• Small business development in remote areas. Establishment of a working group between the Ministries of Co-operatives and SMA (MoC) and the Ministry of Agriculture/DGLS and major agribusiness representatives, to develop and implement specific development strategies for remote rural areas. DGLS initiatives that address livestock development for such areas appear unfocussed, with little allowance for local conditions in livestock programs in such regions. Similarly, MoC SME development policies do not address specific models for agricultural development in remote, poverty-designated areas, even though MoC claims to be targeting these areas for special attention.
• Preferential investment and tax incentives packages for agribusiness to establish in remote for the
purpose of setting up nucleus-household contract production models.
• Integrated development programs targeted to poverty-designated areas, with significant roles played by NGOs, agribusiness and smallholders, so that a critical mass of livestock production is generated to stimulate market and other infrastructure development.
• Organization of farmers in target areas to better represent themselves with government and
agribusiness partners, and to promote participatory involvement by stakeholders.
• Participation in livestock program implementation based on commitment. A bottom-up process, based on the best proposals received by invitation to local public and private sector parties, to ensure firm commitment to follow up and completion. Proposals for livestock sector development programs should be graded heavily on local stakeholder participation and impact.
• Developing the Legal and regulatory framework to facilitate agribusiness or NGO-smallholder
linkages, in close collaboration with local governments, agribusiness and stakeholders in disadvantaged areas.
• Development of micro-finance models to access agricultural credit through formal or informal
institutions to alleviate this serious constraint to development.
• Improved market information for local producers in remote areas. (B) Human Resource Development:
• Developing local government skills in poverty-designated areas related to long-range planning, project identification and management, small business management, and access to information technology. Includes training in leadership and financial management skills for farmers’ association leaders and program administrators.
• Strengthening local livestock producers’ associations: village poultry and cattle.

79
• Introduction of community-based participatory program project models. (C )Technical Improvements
The AI Program: • Integration and accountability of AI services, by combining the jobs of inseminator and pregnancy
diagnosers into one; by privatizing inseminators by employing them work under performance contracts; introduce independent performance monitoring; and accept conception rates as the prime indicator of program outcome.
• Realistic target setting of AI programs, in line with available semen supplies; quality control of
semen production.
• Retraining of inseminators to improve their reproductive knowledge to carry out trouble shooting and pregnancy diagnosis.
• Increased cost recovery and privatization by removing fee subsidies, introduction of revolving
funds to better cover recurrent operating costs. • Upgrading of performance selection programs at national stud stations, linked to simple breeding
cow improvement programs and bull performance tests; outsourcing of multiplier stock production to the private sector.
Animal Production: . • Improved livestock forage production programs, shifting to direct participation by farmers’
associations in operating and managing demonstration plots; introduction of simple harvesting and storage technology; selection of lead farmers to head up village demonstations.
• Restructuring of the dairy production cooperative GKSI, in collaboration with the Ministry of Co-
operatives and DGLS, into a participatory co-operative with greater producer empowerment and better production-oriented objectives, as discussed elsewhere.
• Revitalization of the national small ruminant program in selected low-income areas, using the
MMRC poultry model, by incorporating local diagnostic laboratories and poskeswan, local government, marketing, improved husbandry and confined housing, forage production.
• Integrated semi-confined village duck raising program, involving producers’ groups, local
poskeswan, local hatcheries, market development, to be managed by village administrators and/or NGOs.
• District poultry abattoir capacity upgrading, to support much needed slaughter capacity in support
of local market development.
Animal Health and Veterinary Public Health:

80
• Restructuring of the poskeswan network, including privatization, veterinary skills development, increased accountability, improved transport, legislation for local government support, linkages with support laboratories, local government commitment through PERDA.
• Strengthening the national livestock disease and surveillance data collection system, including
upstream and downstream information exchange and APHIS network rehabilitation. In collaboration with DGLS, Ministry of Health, bilateral assistance agency, IOE, and IOE or FAO.
• Strengthening of the veterinary public health program, including staff training; introduction of
information technology; TA for laboratory assistance, meat inspection, quarantine, food safety. Consider introduction of privatized food inspectors, working under contract.
• Increased technical and financial support for veterinary faculties outside Java to update
undergraduate curricula, introduce veterinary practice management and economics, introduce veterinary epidemiology and biostatistics, support faculty skills development and advanced faculty training in regional veterinary schools.
• Research management support for animal disease and production research institutes, in
restructuring research toward market-based, applied research of direct application to producers.
• Technical Assistance to the new Directorate of Veterinary Public Health, related to information technology, quality control and food safety measures.
2. Regional Impact. The above-listed inputs should focus on low-income, remote rural areas where livestock can play a significant role in improving livelihoods. Where feasible, livestock production programs should collaborate with local or regional agribusiness and NGOs to provide the necessary infrastructure, market and support services. Local government commitment should be the principal criteria for program introduction, and can be secured through competitive bidding on program participation, subject to the selection of the most feasible program proposal(s). Program impact should be carefully scaled, beginning with pilot programs, followed by replication of successful models. Farmers’ organization and consultation are crucial initial steps in this process, and every effort should be made to incorporate a bottom-up and transparent approach. 3. Accountability and Efficiency in Livestock Services Delivery. As indicated repeatedly in this report, most public sector-managed livestock programs remain top down, are generic and lack adjustment to local conditions, do not place the farmer in the center of the program, and do not provide adequate inputs to meet expectations. Different approaches are needed to more successfully introduce and implement livestock programs. As indicated repeatedly in this report, local government and local producer commitment are essential in program success. Similarly, participation by agribusiness requires its commitment and confidence in the outcome. Therefore, local agribusiness, local governments and stakeholders should be invited, as a first step, to comment on intended programs in their area, and voice their degree of confidence in what is being proposed. In this manner, a bottom up participatory approach is developed that involves all parties concerned and fosters understanding and commitment. Finally, as indicated, program participation is by invitation to bid, followed by the selection of best candidates. This process can be lengthy and requires negotiational and organizational skills, as well as an enabling legal framework in which to succeed/

81
C. Potential Projects
4. Project identification, based on the information presented in this report must, by virtue of the broad range of topics covered in this report, focus on the principal constraints that currently hamper more effective livestock sector development. Potential projects are presented in three categories: (a) Institutional Strengthening, (b) Animal Health, and (c) Animal Production. These categories will confluence in those proposals that need an integrated approach. In the light of recent decentralization, local government autonomy and passage through the financial crisis, the restructuring or strengthening of the institutional environment essential to successful project implementation is a common thread that runs through a number of project proposals,. Institutional change is a vast and independent area by itself, but expedience requires that in the smaller context of livestock project development, those segments of institutional change necessary to secure project viability are addressed. 5. Suggested Projects. Parts of the sample project proposals outlined below can be recombined to form separate project designs. Although not specifically indicated, all project designs:
• Are bottom up and recipient-driven, • Involve stakeholder consultations, needs assessment, surveys, or other recipient-oriented
interaction, • Define publics and private sector roles for each project, and emphasize stakeholder participation by
livestock producers and NGOs. • Integrate institutional, technical and human resource development activities, • Encourage privatization or optimal cost recovery, where applicable, to ensure financial
sustainability, • Are conditional to full commitment by sponsoring agencies or local governments. • May need bilateral assistance for technical assistance (i.e. soft) components/

82
Organization/Project Title Components and Objectives Sponsor: Participating District Governments with DGLS Directorate of Livestock Development. Project: Integrated Smallholder Livestock Development Project. Objective: Integrated poor area livestock development.
A. Institutional Strengthening -Identify and select low income areas -Develop local government program capacity -Establish producers’ associations -Integrate support services, markets, other infrastructure B. Livestock Production. -Focus on integrated poultry and/or small ruminant production -Attract agribusiness as partners, where possible. -Develop markets and services C. Animal Health Services -Upgrade local poskeswan and diagnostic laboratories -Cost recovery of service programs -Contracted veterinary, AI and extension services D. Human Resource Development -Farmers’ association development and training -Technical training for poskeswan, extension staff
Organization/Project Title Components and Objectives Sponsor: District Governments and DGLS Directorate of Animal Health Project: Village Animal Health Services Rehabilitation Objective: Village-based veterinary services for low income livestock producers.
A. Institutional Strengthening. -Local government PERDA for legal framework allowing independent financed poskeswan operation -Develop gradual poskeswan privatization program -Assist local government in livestock program management -Establish producers’ associations -Producers contracts for technical support services -Access to credit or micro credit by farmers’ associations B. Animal Health Services -Poskeswan staff training – technical and micro business management -Veterinary equipment and drug procurement -Set service fee schedules -Set up area poskeswan supervision and support program, managed by local Type B lab staff. C. Livestock Production -Seed money credit for livestock procurement -Lead farmers as demonstration households -Producer training -Confined livestock raising and animal husbandry -Livestock markets -Forage production

83
Organization/Project Title Components and Objectives Sponsor: DGLS Directorate of Veterinary Public Health Project: Livestock Product Quality Improvement and Food Safety. Objective: Assistance to Directorate to strengthen institutional and technical aspects of livestock-derived food quality and safety.
A. Institutional Strengthening. -Review of legal and regulatory frameworks to strengthen all aspects food safety -Compliance of legal food safety laws and standards with international standards. -Cost recovery programs for meat inspection, laboratory and certification services. Review hiring system of meat inspectors to assure objective meat inspection. - ISO and HACCP) accreditation programs for participating food processors B. Technical Assistance (Bilateral?) -TA for Livestock Product QC Laboratory -TA in developing undergraduate veterinary public health curriculum -Refresher training for: meat inspectors, QC personnel, residue assay technology. -Training in quality control and food safety.
Organization/Project Title Components and Objectives Sponsor: GKSI Dairy Co-operative with Ministry of Co-operatives and DGLS Project: National Dairy Sector Development Objective: Restructuring of the Diary Production Subsector
A. Institutional Strengthening. -Assist MoC, in line with ongoing restructuring efforts, to revise legal framework for the operation of dairy co-operative GKSI, including transfer of GKSI under MoA. -Restructure dairy co-operative GKSI into participatory farmers’ organization, including privatization option. -Introduce full cost recovery programs for production inputs and support services. -Reorganize producers’ association in accordance with GKSI restructuring. -Reorganize farm gate milk pricing to be more attuned to production costs. B. Dairy Production. -Improve AI services through greater accountability and quality control program. -Assist with the establishment of, and support services for, colony dairy farming groups. Retain dairy veterinarians in more effective, production-oriented animal health services. -Improve forage production, storage and feeding practices. -Develop a simple dairy cow performance evaluation program to identify superior animals. C. Quality Control. -Improve milk storage, collection and transport systems -Improve the mastitis control program and screening. D. Technical Assistance and Training. -Participatory co-operative management for GKSI managers. -Train dairy vets and producers in dairy production efficiency.

84
Organization/Project Title Components and Objectives Sponsor: DGLS Directorates of Animal Health, and Veterinary Public Health Project:
National Animal Disease-Trainer-training programs for senior technical GKSI technical staff -Producer training in dairy husbandry practices -Forage production: demonstration storage, preservation, post harvest treatment.
Surveillance Development. Objective: Upgrade existing, and develop new disease surveillance networks for rapid response to disease outbreaks.
A. Institutional Strengthening. -Adjust existing national and regional networks to develop the necessary linkages. -Collaborate with Regional and lower level veterinary laboratories and institutions to define roles and responsibilities. -Network with international animal disease monitoring agencies: OIE and FAO. -Revise and standardize upstream and downstream disease reporting flow between District and lower levels, Provinces, and DGLS. B. Technical Assistance and Training. -Epidemiological training for key personnel -Biostatistics training for key personnel. -Computerized information technology training. -Standardized reporting and indicators. C. Equipment. -Computer networks and software.
Organization/Project Title Components and Objectives Sponsor: Participating Veterinary Faculties, with Ministry of Education and DGLS (?) Project: Veterinary Education and Training Project. Objectives: Upgrade veterinary education to meet the challenge of intensified livestock production, increased student enrollment, increased food safety awareness, and opening international markets. Support for two of the smaller, less endowed veterinary faculties (Udayana, Denpasar, and Airlannga, Surabaya ?)
A. Institutional Strengthening. -Curriculum review and updating. -Capacity planning for increased student enrolment -Procurement plan for additional physical and human teaching resources -Review of undergraduate entry, and graduate exit standards -Cost recovery mechanisms -Review of veterinary accreditation procedures. B. Technical Assistance -Faculty staff development -Hands-on teaching methodology -Increased clinical and farm exposure -Assistance to IVMA regarding: association management practices, continued education for members, and representation with government regarding accreditation of new graduates. -Upgrading of clinical undergraduate teaching methods and facilities C. Procurement -Undergraduate veterinary textbooks and teaching materials -Establishment of animal teaching facilities. -Establishment of ambulatory veterinary services for livestock owners, for the purposes of income generation from fees, student teaching, and applied field research.
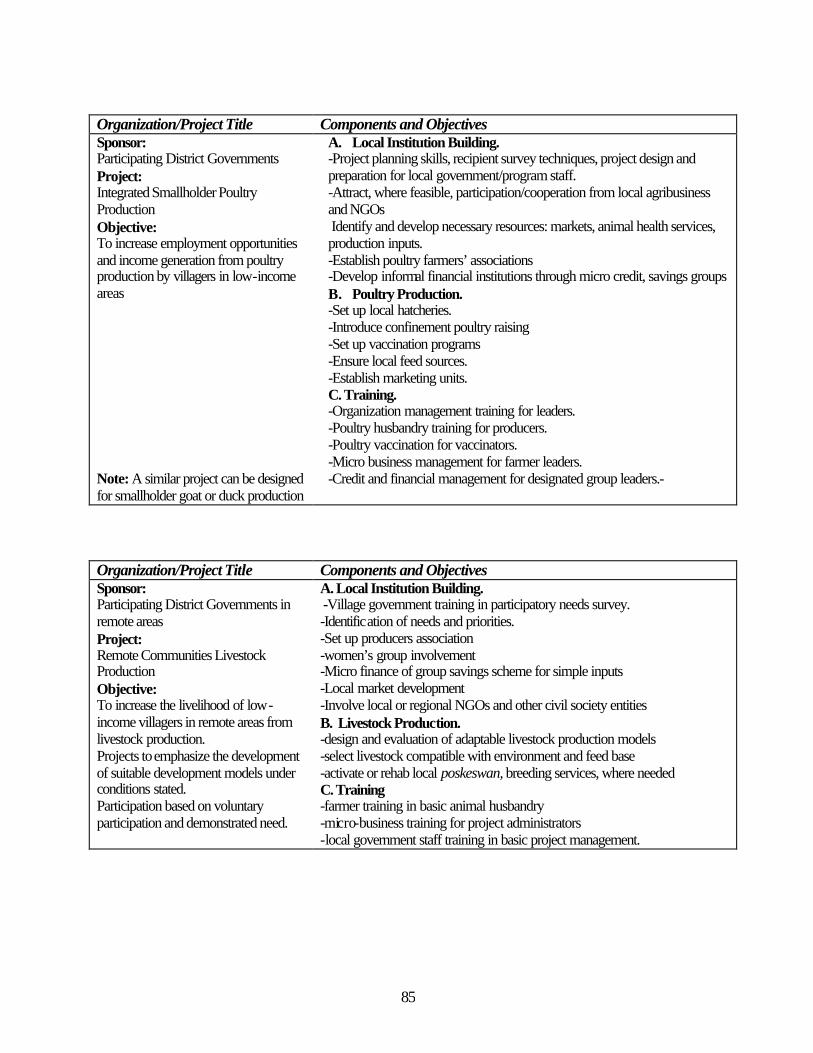
85
Organization/Project Title Components and Objectives Sponsor: Participating District Governments Project: Integrated Smallholder Poultry Production Objective: To increase employment opportunities and income generation from poultry production by villagers in low-income areas Note: A similar project can be designed for smallholder goat or duck production
A. Local Institution Building. -Project planning skills, recipient survey techniques, project design and preparation for local government/program staff. -Attract, where feasible, participation/cooperation from local agribusiness and NGOs Identify and develop necessary resources: markets, animal health services, production inputs. -Establish poultry farmers’ associations -Develop informal financial institutions through micro credit, savings groups B. Poultry Production. -Set up local hatcheries. -Introduce confinement poultry raising -Set up vaccination programs -Ensure local feed sources. -Establish marketing units. C. Training. -Organization management training for leaders. -Poultry husbandry training for producers. -Poultry vaccination for vaccinators. -Micro business management for farmer leaders. -Credit and financial management for designated group leaders.-
Organization/Project Title Components and Objectives Sponsor: Participating District Governments in remote areas Project: Remote Communities Livestock Production Objective: To increase the livelihood of low-income villagers in remote areas from livestock production. Projects to emphasize the development of suitable development models under conditions stated. Participation based on voluntary participation and demonstrated need.
A. Local Institution Building. -Village government training in participatory needs survey. -Identification of needs and priorities. -Set up producers association -women’s group involvement -Micro finance of group savings scheme for simple inputs -Local market development -Involve local or regional NGOs and other civil society entities B. Livestock Production. -design and evaluation of adaptable livestock production models -select livestock compatible with environment and feed base -activate or rehab local poskeswan, breeding services, where needed C. Training -farmer training in basic animal husbandry -micro-business training for project administrators -local government staff training in basic project management.

ANNEX 1 Persons Met
Name Position Institution Topic Mr. A. Sidik Prawiranegara
Director Pt. Lintang Visikusuma Poultry industry
Dhr. Ketut Tastra Sukata -Secretary-General -Director
-Indonesian Poultry Breeders Association) -Secretariat, Indonesia Veterinary Drug Association (ASOHI)
Poultry industry Drug supply and marketing
Ir. Bambang Suharno Executive Secretary
Indonesia Veterinary Drug Association (ASOHI)
Veterinary drug marketing
Drh. Djajadi Gunawan Head Directorate of Veterinary Public Health, DGLS
Disease surveillance and control
Ir. Putu Sumantra Head, Animal Production
Provincial Livestock Services, Bali, Animal Production Section
Livestock production
Ir. Mathur Riady Ketu Gde Atmadja Drh. Dewa Made Muditha A.A. Istri Iriani Drh. Ketut Suarda Putu Mas Adi Putu Sumantra
Head Head Head Head Head Administration Staff Member
Provincial Livestock Services, Bali Subdinas Production $ Development Subdinas Veterinary Public Health Subdinas BINA Agribusiness Subdinas Animal Health Planning Section
Livestock production in Bali
Drh. Sodjasmiran Prodjodihardjo
Head Indonesia Cattle and Buffalo Producers Association
Cattle production I n Indonesia
Drh. Tri Satya Putri Hutabarat
Director Directorate of Livestock Development
Public sector support for livestock sector in Indonesia
Ir. Supodo Budiman Director Directorate of Livestock Production, DGLS
Livestock production programs
Ir. Bonar Lubis Specialist Directorate of Livestock Production, DGLS
Livestock sector trends
Ir. Don Utayo Director Directorate of Animal Breeding, DGLS
Breeding programs and AI
Dr. Budi Triakoso Director Directorate of Animal Health, DGLS
Disease control programs
Drh. Sri Mandayani Head Information Section, Dir. Of Animal Health, DGLS
Livestock statistics
Ir. Maradoli Head Technical Cooperation, Dir. Of Livestock Production
Survey coordination and data
Drh. Ahmad Junaedi Head Statistics Section, Dir. Of Livestock Production
Data collection
Drh. Diana Hermawati Head Quality Control Laboratory for Livestock Products , DGLS
Residue testing and sanitation of processed livestock products
Dr. Rudy Hutagalung Managing
Director Nutrifindo (technical services firm to feed industry)
Feed milling industry
Dr. Argono Rio Setioko Director Research Institute for Animal Production (Balitnak)
Livestock production research

87
Production (Balitnak) research Dr. Ir. Ketut Sutama Reproduction
scientist Research Institute for Animal Production (Balitnak)
Livestock production research
Dr. Darminto Head Research Institute for Veterinary Science (Balitvet)
Livestock disease research
Dr. Fachriyan Pasaribu Dean Veterinary Faculty, Bogor Agricultural Institute (IPB)
Veterinary education
Drh. Wiwiek Bagdja -General Manager -Secretary General
-Jakarta Small Animal Hospital -Indonesian Veterinary Medical Association (IVMA)
Veterinary education, licensing and service provision
Drh. Agus Heriyanto Head Directorate of Animal Health, DGLS
Disease control programs
Dr. Ir. Amrin Zakarias Head Directorate of Agricultural Extension
Livestock extension programs
Ir. Rozak Astira Director, Operations
Union of Indonesian Dairy Co-operatives (GKLI)
Dairy production
Drh. Tri Widharetna Research & Devt. Union of Indonesian Dairy Co-operatives (GKLI)
Dairy cow production parameters
Drh. P. Sukobagyo Veterinarian Livestock Survey Coordination and consultant
Contacts and data collection
Dr. Pasti Tarigan Tasmpubolon,
Director Agency for Agricultural Human Resource Development (AAHRD)
Extension service reorganization
Mr. Kalim Qamar Agricultural Training and Extension Officer
FAO, Rome Extension services structure
Mr. Hero Ananto Secretary General Member
Indonesian Poultry Producers Association Indonesian Chamber of Commerce
Private sector poultry production and regulations
Drs. Achmad Arief Member Parliament of Indonesia Poultry industry regulations and development policy

88
TABLE 2.1 - Population by Number and Density, by Region, 1990-2000
ANNEX 2
Tables 2.1 and 2.2
Region
1990 Population
Share
1995 Population
Share
2000 Population
Share Number (%) Density Number (%) Density Number (%) Density
('000) Pop/km2 ('000) Pop/km
2 ('000) Pop/km
2
Indonesia 168,640 100% 93 195,285 100% 101 203,455 100% 106
Sumatra 36,506 22% 76 40,970 21% 76 42,665 21% 88
Java 107,581 64% 843 114,988 59% 843 120,430 59% 945
Bali 2,778 2% 493 2,902 1% 493 3,125 2% 555 E,W Nusa Tenggara 6,639 4% 88 8,081 4% 88 7,751 4% 95
Kalimantan 9,099 5% 17 10,521 5% 17 10,947 5% 20
Sulawesi 2,530 2% 65 13,772 7% 65 14,446 7% 75 Maluku, Irian Jaya 3,507 2% 7 4,051 2% 7 4,091 2% 8 Sources: Statistics Indonesia, Intercensal Population Surveys 1990, 1995, 2000.
TABLE 2.2 - Indonesia Livestock Population 1995 - 2001
Population (‘000 head) % Change Livestock
Species and 1995 1996 1997 1998 1999 2000 2001 95-98 98-01
Year
Livestock & Poultry
875,068 1,001,255 1,047,666 715,603 691,918 928,166 923,201 22% 22%
Total Livestock
40,662 44,158 44,514 43,655 41,835 39,117 39,465 -7% -11%
Dairy Cattle 330 334 341 348 353 354 369 -5% 6%
Beef Cattle 10,829 11,368 11,939 11,634 11,275 11,008 11,192 -7% -4%
Buffalo 3,057 3,104 3,136 3,171 3,238 2,405 2,287 -4% -39%
Goats 11,502 12,770 13,167 13,560 12,701 12,566 12,456 -15% -9%
Sheep 6,240 7,724 7,698 7,144 7,226 7,427 7,294 -13% 2%
Pigs 8,704 8,858 8,233 7,798 7,042 5,357 5,867 12% -33%
Total Poultry 834,406 957,097 1,003,152 671,948 650,083 889,049 883,736 24% 24%
Village Pltry 222,893 243,260 260,835 253,133 252,653 259,257 262,631 -12% 4%
Layers 54,736 63,335 70,623 38,861 45,531 69,366 66,927 41% 42%
Broilers 528,159 622,965 641,374 354,004 324,347 530,874 524,273 49% 32%
Ducks 28,618 27,537 30,320 25,950 27,552 29,552 29,905 10% 13%

89
ANNEX 2 Table 2.3
TABLE 2.3 – Human and Livestock Population Ratios, 2000
(‘000) Population Per 100 Inhabitants Per 100 Inhabitants
Human Large Small Comm. Village Large Small Comm. Village
` Population Rum. Rum. Poultry Poultry Rum. Rum. Poultry Poultry
\b \c \d \e
Indonesia 203,455 2,287 19,752 628,555 293,449 1 10 309 69
Sumatra 42,665 1,191 3,827 120,815 104,275 3 9 283 41
Java 120,430 474 13,535 423,744 117,122 0 11 352 103
Bali 3,125 69 96 22,235 18,973 2 3 712 16 E,W Nusa Tenggara 7,751 230 693 5,716 29,566 3 9 74 26
Kalimantan 10,947 167 298 42,529 5,710 2 3 388 192
Sulawesi 14,446 130 860 11,619 13,793 1 6 80 105 Maluku, Irian Jaya 4,091 26 443 1,897 4,010 1 11 46 102
\a Figures rounded to nearest whole number.
\b Dairy and beef cattle, buffaloes.
\c Sheep and goats.
\d Commercial layers and broilers.
\e Chickens and ducks. Sources: Annual Livestock Statistical Reports, DGLS; Statistics Indonesia 1997 and 2001; Intercensal Population Surveys 1990, 2000

90
Livestock Distribution by Species and Region ANNEX 2
Table 2.4 and 5
TABLE 2.4 - Proportinal Distribution of Livestock Species by Region, 2001
(000 head)
Species Pigs Beef Cattle
DairyCattle Buffalo Sheep Goats
Total Livestock
Village Pltry Broilers Layers Ducks
Total Avian
Indonesia 100% 100% 100% 100% 100% 100% 100% 100% 100% 100% 100% Sumatra 24% 23% 2% 52% 8% 26% 23% 35% 18% 27% 38% 24% Java 3% 45% 98% 21% 91% 55% 50% 40% 68% 64% 38% 59% Kalimantan 11% 4% 0% 3% 0.1% 2% 4% 6% 8% 3% 10% 7% Sulawesi 16% 14% 0% 10% 0.1% 7% 9% 10% 1% 4% 9% 4% Bali 16% 5% 0% 0.3% 0.0% 1% 4% 2% 4% 2% 2% 3% W. Nusa Tenggara 1% 4% 0% 7% 0.2% 2% 2% 1% 1% 0% 2% 1% E. Nusa Tenggara 17% 5% 0% 6% 0.5% 3% 5% 4% 1% n/a 1% 1% Maluku 2% 1% 0% 1% 0.1% 3% 2% 1% n/a n/a 0.4% 0% Irian Jaya 10% 1% 0% 0.1% 0.0% 0% 2% 1% 0.3% 0.4% 0.4% 0%
TABLE 2.5 - Quantitative Distribution of Livestock Species by Region, 2001 (000 head)
Species Pigs Beef Cattle
DairyCattle Buffalo Sheep Goats
Total Livestock
Village Pltry Broilers Layers Ducks
Total Avian
Indonesia
5,866 11,189
368 2,287 7,395 12,357 39,462 262,629
526,940 101,615
30,820 922,004
Sumatra 1,433
2,540 6 1,191 581 3,246 8,997 92,632
93,084 27,731 11643 225,090
Java 182
5,053 361 474 6,732 6,803 19,605 105,476
358,907 64,837
11,646 540,866
Kalimantan 638
402 0 69 11 287 1,407 15,873
39,789 2,740 3,100 61,502
Sulawesi 947 1,568 0 222 9 851 3,597 26,726 7,435 4,184 2,840 41,185 Bali
954 533 1 8
0.1 96 1,592 5,081 20,511 1,724 629 27,945
W. Nusa Tenggara 38
392 0 167 17 251 865 3,492 2,840 36 516 6,884
E. Nusa Tenggara 982
517 0 130 35 390 2,054 9,584 2,840 n/a 201 12,625
Maluku 110 98 0 24 7 376 615 2,150 n/a n/a 123 2,273 Irian Jaya 582 86 0 2 3 57 730 1,615 1,534 363 122 3,634

91
Table 2.6 - Dairy Cattle Population by Region, 1995-2001 ANNEX 2 Table 2.6
Population (head) Change Livestock Species and Year 1995 1996 1997 1998 1999 2000 2001 95-98 98-01
National Dairy Herd
346,343 341,551 334,327 321,956 332,031 354,253 368,426 -7% 14%
Sumatra 9,363 9,565 10,030 7,426 7,374 7,332 7,332 -21% -1%
Java 331,531 331,531 323,916 314,159 324,282 346,623 360,775 -6% 15%
Java % National Herd
95.7% 97.1% 96.9% 97.6% 97.7% 97.8% 97.9%
Kalimantan 220 229 225 190 189 134 155 -13% -18%
Sulawesi 51 51 22 56 52 25 25 10% -55%
Bali 75 78 71 55 62 67 67 -26% 22%
West Nusa Tenggara
0 0 0 0 0 0 0 n/a n/a
East Nusa Tenggara
0 0 0 0 0 0 0 n/a n/a
Maluku 0 0 0 0 0 0 0 n/a n/a
Irian Jaya 54 57 63 70 72 72 72 28% 3%
TABLE 2.7 - Poverty Incidence, 1990-2000
Parameter Unit 1990 1993 1996 1998 1999 2000 Change 1990-2000
Poverty Incidence million people
Urban 17.8 17.2 15.3 31.9 32.7 25.1 41%
Rural 27.2 25.9 22.5 49.5 48.4 37.5 38%
Change by Year: %
Urban -- -3% -12% 52% 2% -30%
Rural -- -5% -15% 55% -2% -29%
Poverty Line Rupiah 000/yr
Urban Income 20,614 27,905 38,246 96,959 92,009 89,845 336%
Rural 13,295 18,244 27,413 72,780 73,272 69,420 422%
Change by Year: %
Urban -- 35% 37% 154% -5% -2%
Rural -- 37% 50% 165% 1% -5% Below Poverty Line % People
Urban 16.8 13.5 9.7 21.9 19.5 15.1 -10%
Rural 14.3 13.8 12.3 25.7 26.1 20.2 41%
Change by Year: %
Urban -- -24% -39% 56% -12% -29%
Rural -- -4% -12% 52% 2% -29%

92
TABLE 2.8 - Livestock and Feed Retail Prices, 1995-1999
ANNEX 2 Table 2.8
Livestock Unit 1995 1996 1997 1998 1999 2000 2001 Change
95-01
Live Animals ave/kg 3,563 3,668 4,192 4,764 8,251 11,944 14,876 320%
Cattle per kg 3,738 4,012 4,053 5,591 8,806 12,950 15,972 327%
Buffaloes per kg 3,556 3,755 3,918 4,464 8,201 n/a n/a n/a
Goats per kg 3,773 3,424 4,315 4,318 7,802 12,450 14,778 292%
Sheep per kg 3,773 3,424 4,315 4,318 7,802 12,450 14,778 292%
Pigs per kg 2,975 3,724 4,357 5,128 8,645 9,925 13,975 370%
Poultry ave/kg 2,894 3,580 3,722 4,451 8,326 4,667 4,704 139%
Layers, DOC kg 1,020 1,234 1,466 1,901 4,343 1,175 2,778 172%
Broiler, DOC kg 1,100 1,026 888 1,264 2,708 2,850 1,615 47% Finished broiler kg 3,268 3,586 3,471 5,595 9,190 9,975 9,719 197% Village chicken kg 6,189 8,475 9,061 9,043 17,064 n/a n/a n/a
Meats ave/kg 7,059 7,774 7,978 10,402 16,711 19,987 23,467 243%
Beef per kg 10,002 10,991 11,062 15,971 24,488 31,250 38,800 288%
Buffalo per kg 9,004 9,895 9,959 n/a n/a n/a n/a n/a
Mutton per kg 8,613 9,469 9,871 11,574 19,580 25,000 28,994 237%
Pork per kg 6,396 8,706 9,260 10,946 18,921 22,750 27,375 328%
Broiler per kg 5,861 4,699 4,696 7,746 11,863 14,125 14,293 144%
Culled layer per kg 2,477 2,884 3,018 5,774 8,702 6,812 7,872 218%
Eggs
Commercial dozen 2,477 2,884 3,018 5,774 8,702 6,812 7,872 218%
Village dozen 281 324 335 489 807 n/a n/a n/a
Duck dozen 254 289 304 473 774 n/a n/a n/a
Milk liter 645 682 702 1,225 1,225 3,612 3,500 443%
Animal Feed ave/kg 792 881 941 2,258 2,231 1,801 2,416 205%
Layer starter per kg 822 875 932 2,249 2,183 1,600 2,308 181%
Layer grower per kg 754 806 870 2,145 2,116 1,675 2,050 172%
Broiler starter per kg 825 929 998 2,328 2,263 1,912 2,739 232% Broiler finisher per kg 765 912 964 2,308 2,361 2,017 2,566 235%
Source: DGLS Statistics and Yearbooks.

93
TABLE 2.9- Per Capita Consumption of Animal Protein, Calories and Fat
ANNEX 2 Table 2.9
Year 1995 1996 1997 1998 1999 2000 2001 1995- 1998- 1998 2001
National Meat Consumption
Meat 1,530 1,661 1,589 1,243 1,334 1,518 1,532 -19% 23%
Milk 906 1,124 1,051 844 1,047 1,322 1,330 -7% 58%
Eggs 646 688 692 464 564 705 615 -28% 33%
1. Annual animal protein (kg)
intake from:
Meat 7.9 8.4 8.0 4.2 4.2 5.2 5.1 -46% 21%
Eggs 3.3 3.5 3.5 2.3 2.8 3.5 3.5 -30% 52%
Milk 7.0 5.7 5.3 4.1 5.2 6.5 6.5 -41% 59%
Total 18.2 17.6 16.8 10.6 12.2 15.2 15.1 -42% 42%
2. Daily caloric intake (cal)
from:
Meat 40.4 43.2 39.6 28.2 28.2 33.7 n/a -30% n/a \a
Eggs 13.8 14.4 14.3 9.5 11.6 14.3 n/a -31% n/a \a
Milk 11.7 9.6 8.8 7.0 9.1 10.9 n/a -40% n/a \a
Total calories/cap/day 65.9 67.2 62.7 44.7 48.9 58.9 n/a -32% n/a \a
3. Daily per capita protein (g) 4.9 5.1 4.7 3.3 3.5 4.3 n/a -33% n/a \a
4. Asia average daily protein (g) 5.5 5.8 5.7 4.5 5.8 n/a n/a -18% n/a
\a For period 1998-2000 only (no data yet available for 2001).
Source: FAO Food Balance Tables, 1995-2000.
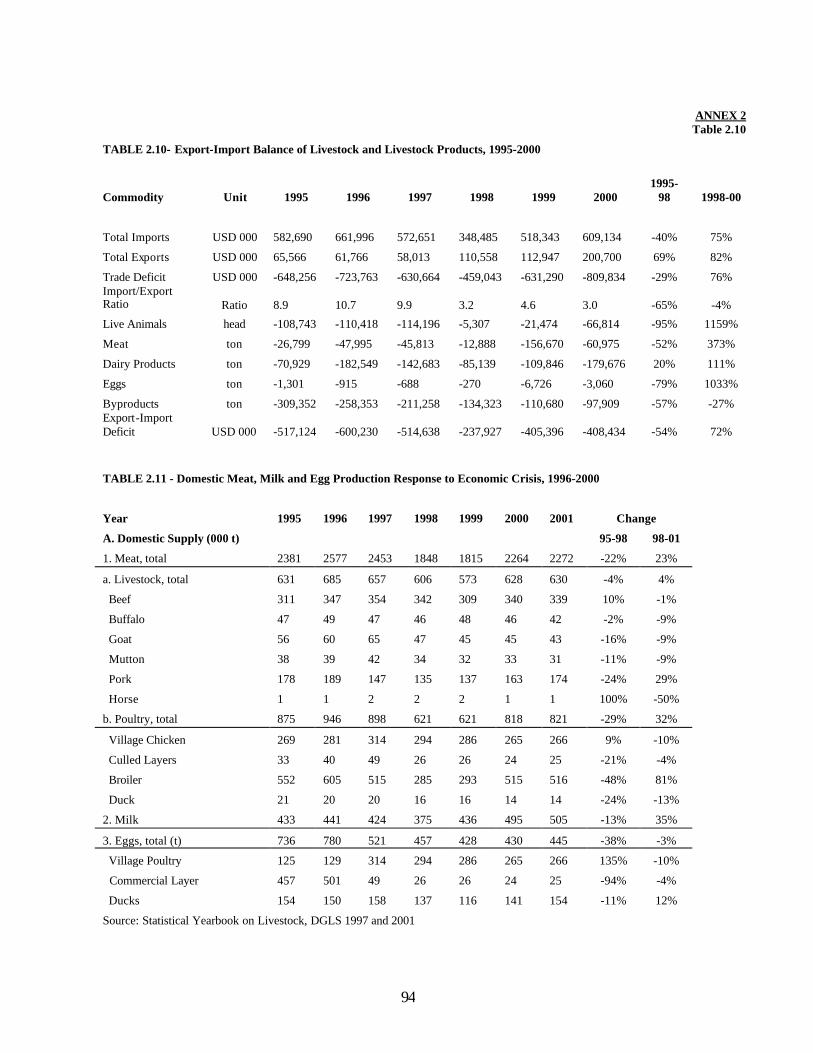
94
ANNEX 2 Table 2.10
TABLE 2.10- Export-Import Balance of Livestock and Livestock Products, 1995-2000
Commodity Unit 1995 1996 1997 1998 1999 2000 1995-
98 1998-00
Total Imports USD 000 582,690 661,996 572,651 348,485 518,343 609,134 -40% 75%
Total Exports USD 000 65,566 61,766 58,013 110,558 112,947 200,700 69% 82%
Trade Deficit USD 000 -648,256 -723,763 -630,664 -459,043 -631,290 -809,834 -29% 76% Import/Export Ratio Ratio 8.9 10.7 9.9 3.2 4.6 3.0 -65% -4%
Live Animals head -108,743 -110,418 -114,196 -5,307 -21,474 -66,814 -95% 1159%
Meat ton -26,799 -47,995 -45,813 -12,888 -156,670 -60,975 -52% 373%
Dairy Products ton -70,929 -182,549 -142,683 -85,139 -109,846 -179,676 20% 111%
Eggs ton -1,301 -915 -688 -270 -6,726 -3,060 -79% 1033%
Byproducts ton -309,352 -258,353 -211,258 -134,323 -110,680 -97,909 -57% -27% Export-Import Deficit USD 000 -517,124 -600,230 -514,638 -237,927 -405,396 -408,434 -54% 72%
TABLE 2.11 - Domestic Meat, Milk and Egg Production Response to Economic Crisis, 1996-2000
Year 1995 1996 1997 1998 1999 2000 2001 Change
A. Domestic Supply (000 t) 95-98 98-01
1. Meat, total 2381 2577 2453 1848 1815 2264 2272 -22% 23%
a. Livestock, total 631 685 657 606 573 628 630 -4% 4%
Beef 311 347 354 342 309 340 339 10% -1%
Buffalo 47 49 47 46 48 46 42 -2% -9%
Goat 56 60 65 47 45 45 43 -16% -9%
Mutton 38 39 42 34 32 33 31 -11% -9%
Pork 178 189 147 135 137 163 174 -24% 29%
Horse 1 1 2 2 2 1 1 100% -50%
b. Poultry, total 875 946 898 621 621 818 821 -29% 32%
Village Chicken 269 281 314 294 286 265 266 9% -10%
Culled Layers 33 40 49 26 26 24 25 -21% -4%
Broiler 552 605 515 285 293 515 516 -48% 81%
Duck 21 20 20 16 16 14 14 -24% -13%
2. Milk 433 441 424 375 436 495 505 -13% 35%
3. Eggs, total (t) 736 780 521 457 428 430 445 -38% -3%
Village Poultry 125 129 314 294 286 265 266 135% -10%
Commercial Layer 457 501 49 26 26 24 25 -94% -4%
Ducks 154 150 158 137 116 141 154 -11% 12%
Source: Statistical Yearbook on Livestock, DGLS 1997 and 2001

95
TABLE 2.12 - Impact of the Economic Crisis on the Agriculture Sector
(Rp billion in constant prices) ANNEX 2 Table 2.12
Sector/Subsector 1995 1996 1997 1998 1999 Crisis Impact 1995-98 1998-99 Livestock 6,790 7,133 7,483 6,459 6,869 -5% 6% Food Crops 32,952 33,674 32,688 33,186 33,768 1% 2% Fisheries 5,928 6,248 6,610 6,518 7,134 10% 9% Estate Crops 6,790 10,354 10,496 11,234 11,464 65% 2% Forestry 6,304 6,444 7,189 6,631 6,125 5% -8% Agriculture 61,885 63,827 64,468 64,029 65,381 3% 2% National 383,792 413,797 433,245 376,892 378,050 -2% 0%

96
ANNEX 2
Tables 2.13 TABLE 2.13 - Livestock Product Imports, 1995-2000
(USD '000)
% Change
Commodity 1995 1996 1997 1998 1999 2000 1995-
98 1998-
00
Qty USD Qty USD Qty USD Qty USD Qty USD Qty USD Qty USD
Total Imports 319,936 582,690 241,395 661,996 248,397 572,651 168,807 348,485 230,532 518,343 349,244 609,134 -40% 75%
Live Animals ('000 hd) 1,607 125,750 1,572 131,645 1,160 132,569 654 24,281 2,010 48,631 2,037 102,855 -81% 324% Breeding cattle 4 3,167 4 3,014 4 3,119 2 569 0.2 73 1 225 -82% -60% Feeder steers 86 109,146 205 115,129 227 117,117 50 20,005 118 39,405 268 92,443 -82% 362% Breeding pigs 0 0 0 0 0 99 0 0 0 0 0 1 Poultry P -stock 1,500 13,327 1,289 12,828 693 10,940 497 3,549 1,863 8,869 1,610 9,805 -73% 176% Poultry GP stock 17 110 74 674 235 1,294 106 158 29 284 158 381 44% 141%
Meat (t) 22,052 30,325 20,039 48,076 33,844 47,186 16,084 16,570 22,913 160,900 72,295 62,978 -45% 280%
Beef 7,259 14,534 15,773 32,434 23,315 36,523 8,813 10,327 10,553 152,244 26,962 41,047 -29% 297%
Mutton 737 1,062 702 675 675 1,002 412 528 435 499 592 655 -50% 24%
Duck 91 22 96 101 101 165 58 73 108 194 321 373 230% 414%
Poultry 2,002 2,653 2,051 3,446 811 964 572 741 4,070 2,722 14,017 381 -72% -49% Bovine liver 11,963 12,054 1,417 11,420 8,942 8,532 6,229 4,901 7,747 5,241 30,403 20,522 -59% 319%
Dairy Products (t) 130,516 78,002 90,224 189,857 83,269 147,738 54,490 93,537 92,681 127,308 164,686 254,244 20% 172%
Milk 66,071 65,531 51,789 114,822 48,783 94,372 32,737 57,890 59,927 83,602 117,268 189,273 -12% 227%
Butter 56,534 11,910 32,316 62,770 29,795 42,189 17,944 26,328 28,479 35,328 41,392 53,467 121% 103%
Cheese 7,911 561 6,119 12,265 4,691 11,177 3,809 9,319 4,275 8,378 6,026 11,504 1561% 23%
Eggs (t) 3,210 1,477 890 972 1,160 726 150 270 27,170 6,932 8,613 3,312 -82% 1127%
Table Eggs 670 561 161 103 163 61 81 109 532 109 533 189 -81% 73% Hatching eggs 2,540 916 729 869 997 665 69 161 26,638 6,823 8,080 3,123 -82% 1840%
Byproducts (t) 162,551 347,136 128,670 291,446 128,964 244,432 97,429 213,827 85,758 174,572 101,613 185,745 -38% -13%
Leather 162,551 347,136 128,670 291,446 128,964 244,432 97,429 213,827 85,758 174,572 101,613 185,745 -38% -13%
Sources: Statistical Handbook on Livestock for 1997 and 2001, DGLS; Macroanalysis of Agribusiness, Feb 2002, DGLS.

97
TABLE 2.14 - Livestock Product Exports, 1995-2000
ANNEX 2 Tables 2.13
% Change
Commodity 1995 1996 1997 1998 1999 2000 1995-
98 1998-
00
Qty USD Qty USD Qty USD Qty USD Qty USD Qty USD USD USD
Total Exports 12,054 65,566 14,662 61,766 16,590 58,013 48,338 110,558 64,680 112,947 112,907 200,700 69% 82%
Live Animals ('000 hd) 1,873 17,007 3,071 21,227 1,179 18,373 679 18,974 1,719 27,157 1,757 36,041 12% 90% Poultry parent stock 78 382 1,371 1,231 466 682 270 1,619 1,192 2,396 -- 1,809 324% 12% Poultry GP stock -- -- -- -- -- -- -- -- -- -- 256 148 n/a n/a Other poultry 1,634 2,712 1,538 2,335 528 920 149 204 40 334 700 791 -92% 288%
Pigs 161 13,913 162 17,661 185 16,771 260 17,151 487 24,427 801 33,293 23% 94%
Meat (t) 1,031 3,526 45 81 373 1,373 3,266 3,682 3,111 4,230 1,455 2,003 4% -46%
Beef 21 7 4 6 5 8 1 4 17 77 26 56 -43% 1300%
Mutton 0 0 0 0 0 0 69 101 13 20 35 132 n/a 31%
Pork 10 76 41 66 366 1,364 189 240 222 221 690 516 216% 115%
Poultry 1,000 3,443 0 9 2 1 3,007 3,337 2,859 3,912 704 1,299 -3% -61%
Dairy Products (t) 3,159 7,073 5,308 7,308 4,470 5,055 7,989 8,398 16,928 17,462 60,675 74,568 19% 788%
Milk 3,104 6,900 4,978 6,871 1,731 3,409 2,885 4,290 2,353 6,002 31,482 55,080 -38% 1184%
Butter 52 60 312 350 2,729 1,536 4,936 3,691 14,562 11,403 29,171 19,430 6052% 426%
Cheese 3 113 18 87 10 110 168 417 13 57 22 58 269% -86%
Eggs (t) 936 176 132 57 188 38 0 0 723 206 218 252 -100% n/a
Table Eggs 198 32 1 0 5 3 0 0 0 0 78 198 -100% n/a Hatching eggs 738 144 131 57 183 35 0 0 723 206 140 54 -100% n/a
Byproducts (t) 5,055 37,784 6,106 33,093 10,380 33,174 36,404 79,504 42,199 63,892 48,802 87,836 110% 10%
Leather/Hides 2,958 36,729 2,618 31,369 9,407 32,189 36,125 79,208 39,068 62,730 43,885 86,404 116% 9% Meat and Bone Meal 1,707 415 2,954 1,176 630 437 252 73 2,800 496 3,777 1,222 -82% 1574%
Duck feathers 390 640 534 548 343 548 27 223 331 666 1,140 210 -65% -6%
Sources: Statist ical Handbook on Livestock for 1997 and 2001, DGLS; Macroanalysis of Agribusiness, Feb 2002, DGLS.

98
ANNEX 3 TABLE 3.1- Livestock Production and Processing Infrastructure Table 3.1 Production Phase Components Type Number 1. Input Supports Livestock breeding Regional stations 8 Feed processing Feedmills 67 Veterinary drug suppliers Outlets 1,578 Depots 887 Shops 279 Distributors 194 Manufacturers 34 Importers 27 Frozen semen production Stations 2 2. Livestock Production Households Cattle raising 2,566,000 Buffalo raising 416,000 Goat raising 397,000 Sheep raising 184,000 Village poultry holders 480,000 Village layer/broilers 38,000 Duck raising 285,000 Pig raising 368,000 Non-coop milk producers 98,000 Commercial production Broiler farms thousands Layer farms thousands Feedlots 50 Coop milk producers 185,000 Pig farms 15 3. Processing Slaughterhouses Type C, D (small) 725 Type A (large) 7 Meat marketing Meat shops, Jakarta 7 licensed (no data for outside Meat retailers, Jakarta 22 Jakarta) Grocery stores, Jakarta 86 supervised Meat processing Meat canners 3 4. Technical Support Animal health Animal health posts, active 284 AI program Inseminators 947 Pregnancy testers 673 Livestock extension Extension agents 4,274 Disease investigation Regional Type A Centers 7 Disease diagnosis District Type B labs 24 Subdistrict Type C labs 43 Veterinary drug assay National laboratory, Bofor 1 Vaccine production Pusvetma, Surabaya 1 Feed assay National laboratory, Bogor 1 Food quality control National laboratory, Bogor 1

99
NNEX 3 Table 3.2
TABLE 3.2 - Legal and Operational Authority of Ministry of Agriculture pertaining to the Livestock Subsector 1. National Policy a Agricultural development policy to support macro development. b Mandatory minimal service standards in agriculture sector to be carried out by District and Subdistrict governments. c Determination and change of area and spatial land use planning. d Macro planning for the agriculture sector. e Foreign agreements on agriculture on bewhalf of the state. f Policy on national agricultural information systems. 2. Human Resource a Accreditaton requirements for educational institutions in agriculture, Development b Certification of professionals and job requirements in agriculture. c Organization of the national agriculture institutions network. 3. Local Government a Oversight of local government guidelines, supervision, train ing, guidance and advocacy in agriculture. b Standardization of licensing in agriculture sector by District governments. c Facilitation of inper-provincial issues in agriculture. 4. Natural Resources a Guidelines for natural resource management and conservation. 5. Animal Disease Control a Implementation of national epidemic and disaster control measures. b Standards for disease eradication programs. 6. Services a Agricultural services qualification. b Regulation of technical standards for animal health services. 7. Production, Marketing a Export regulations for breedingstock. b Standardization of the release or withdrawal of agricultural commodities. 8. Quality Control a Guidelines for breed improvement standards. b Regulation and control of the production of agricultural chemicals and biological products. c Regulation of minimal standards for abattoirs, animal clinics and animal health services. d Standards for animal feed production.

100
ANNEX 3 Table 3.3 TABLE 3.3 -The Union of Indonesian Dairy Cooperatives (GKSI) Parameter Unit 1995 1996 1997 1998 1999 2000 Cooperative Units \a No. 205 206 214 219 219 220 GKSI farmers 000 161 165 179 174 173 185 Coop staff 000 22 22 25 23 24 26 Average cows/GKSI memberNo. 1.5 1.5 1.5 1.5 1.5 1.5 Dairy Cattle Ownership National total 000 hd 331 331 353 322 332 341 GKSI-owned 000 hd 241 248 268 262 259 277 Local origin cattle 000 hd 301 301 350 313 335 359 Imported Cattle hd 1,727 4,350 1,563 0 0 0 Value GKSI cattle, total Rp bln 611 515 1,121 1,286 1,139 1,529 Dairy Herd Structure GKSI Dairy Herd, total head 241 248 268 262 259 277 Breeding cows head 133 135 151 143 145 152 Lactating cows head 97 98 109 103 108 113 % Pregnant head 37% 38% 39% 39% 35% 35% Non-lactating cows head 36 37 42 40 38 39 % Pregnant head 31% 30% 29% 28% 29% 28% Heifers head 38 43 46 48 48 51 % Pregnant head 47% 49% 50% 48% 23/% 49% Milk Production National 000 t 443 441 447 452 436 453 From GKSI 000 t 362 362 420 376 403 431 From other sources 000 t 82 80 27 76 34 21 Milk Prices Paid by dairy processors Rp/kg 640 676 702 850 1,255 1,330 Farm gate price Rp/kg 560 592 614 744 1,098 1,164 Consumer price Rp/kg 1,957 2,101 2,255 4,250 4,800 5,150 Processed milk value Rp bln 206 220 246 266 421 478 Imported milk value Rp bln 89 92 42 33 59 53 Imported vs. imported fluid milk % 43% 42% 17% 12% 14% 11% Reproductive Efficiency \b Dairy cows inseminated 000 hd 349.9 180.0 158.6 189.2 169.2 61.5 Calves born from AI No. n/a n/a n/a n/a 54.1 17.3 Inseminations/Live Birth No. n/a n/a n/a n/a 3.1 3.6 Conception rate \c % n/a n/a n/a n/a 32% 28% Milk production/cow/300 days liters 2,718 2,658 2,571 2,400 2,514 3,363 \a Denotes registered coops, of which approximately 50% has ceased operations due to dissolution or bankruptcy. \b Data from DGLS do not exactly match those from GKSI. \c No. cows pregnant following breeding or insemination.

101
TABLE 3.4 - Livestock Farmers' Groups by Region, 1983 and 1997 ANNEX 3
Table 3.4
Region 1993 1993 1994 1995 1996 1997 Change Ave. Hholds
per
Farmers' Livestock Farmers' Farmers' Farmers' Farmers' 93-97 Farmers Group
Groups Households Groups Groups Groups Groups 1993 Sumatra 16,158 963,337 19,149 16,995 23,394 23,796 47% 60 Java 11,958 2,872,055 15,410 16,953 33,405 24,878 108% 240 Kalimantan 3,389 320248 3,154 1,647 4,191 3,794 12% 94 Sulawesi 3,557 493,821 2,795 5,914 3,122 2,810 -21% 139 Bali 1,486 194,603 1,535 1,535 1,599 1,664 12% 131 Nusa Tenggara 2,956 405,411 4,313 4,250 4,527 5,832 97% 137 Maluku, Irian Jaya
1,422 144,793 996 996 1,026 1,193 -16% 102 Total 40,926 5,394,268 47,352 48,290 71,264 63,967 56% 132
Source: Buro Statistik Nasional, Agricultural Census 1993 (latest published data) ANNEX 4 Table 4.1 TABLE 4.1 - The Commercial Poultry Industry in Indonesia Production Phase Components Type Number 1. Production inputs Breeding farms GP stock 16 P stock 120 eries hundreds Poultry feeds Most mills produce 67 compound poultry feeds Veterinary drugs Depots 887 Shops 279 Distributors 194 Manufacturers 34 Importers 27 2. Production Layers farms Most are in Java 38,000 Broiler farms Most are in Java 40,000 Village poultry farmers Mostly backyard 480,000 Duck farmers Backyard and semi- 285,000 intensive Poultry meat shops Most are unlicensed thousands 3. Processing Poultry abattoirs Type A (large) 8 Type B (medium) 7 Type C (small) hundreds Family (privately) owned thousands 4. Technical support See Section V
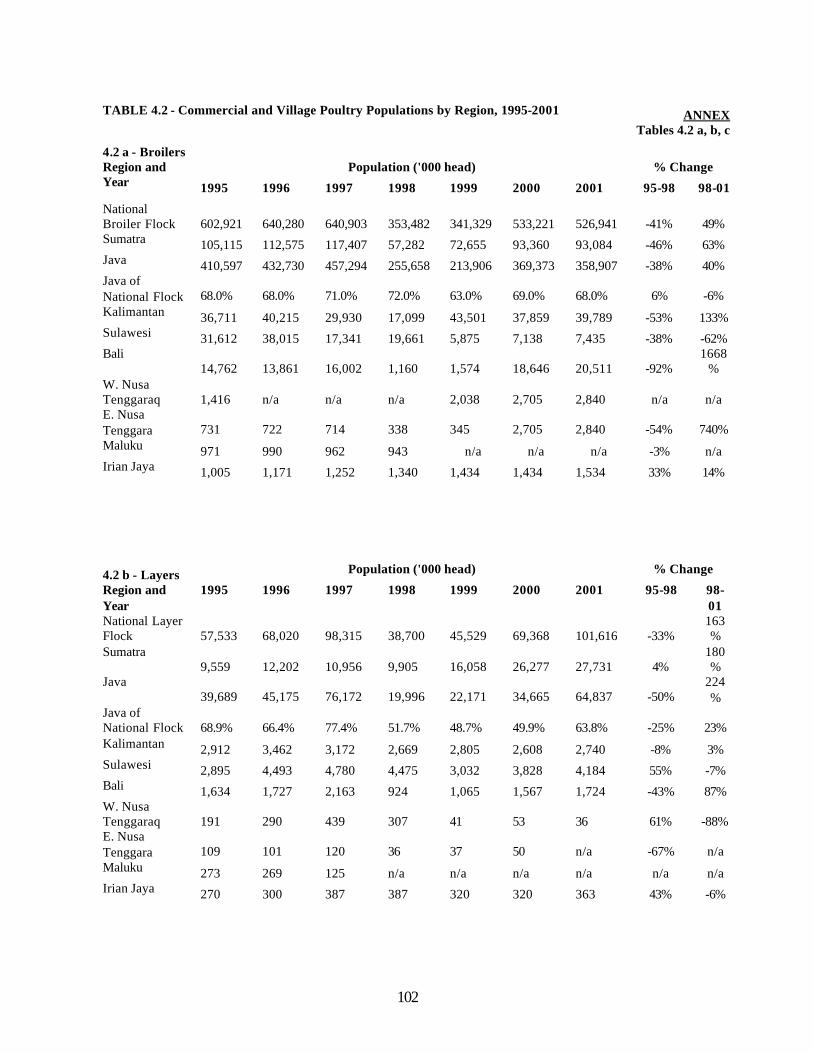
102
TABLE 4.2 - Commercial and Village Poultry Populations by Region, 1995-2001
ANNEX
Tables 4.2 a, b, c
4.2 a - Broilers Population ('000 head) % Change Region and
Year 1995 1996 1997 1998 1999 2000 2001 95-98 98-01
National Broiler Flock 602,921 640,280 640,903 353,482 341,329 533,221 526,941 -41% 49% Sumatra 105,115 112,575 117,407 57,282 72,655 93,360 93,084 -46% 63% Java 410,597 432,730 457,294 255,658 213,906 369,373 358,907 -38% 40% Java of National Flock 68.0% 68.0% 71.0% 72.0% 63.0% 69.0% 68.0% 6% -6% Kalimantan 36,711 40,215 29,930 17,099 43,501 37,859 39,789 -53% 133% Sulawesi 31,612 38,015 17,341 19,661 5,875 7,138 7,435 -38% -62% Bali
14,762 13,861 16,002 1,160 1,574 18,646 20,511 -92% 1668
% W. Nusa Tenggaraq 1,416 n/a n/a n/a 2,038 2,705 2,840 n/a n/a E. Nusa Tenggara 731 722 714 338 345 2,705 2,840 -54% 740% Maluku 971 990 962 943 n/a n/a n/a -3% n/a Irian Jaya 1,005 1,171 1,252 1,340 1,434 1,434 1,534 33% 14%
4.2 b - Layers Population ('000 head) % Change
Region and Year
1995 1996 1997 1998 1999 2000 2001 95-98 98-01
National Layer Flock 57,533 68,020 98,315 38,700 45,529 69,368 101,616 -33%
163%
Sumatra 9,559 12,202 10,956 9,905 16,058 26,277 27,731 4%
180%
Java 39,689 45,175 76,172 19,996 22,171 34,665 64,837 -50%
224%
Java of National Flock 68.9% 66.4% 77.4% 51.7% 48.7% 49.9% 63.8% -25% 23% Kalimantan 2,912 3,462 3,172 2,669 2,805 2,608 2,740 -8% 3% Sulawesi 2,895 4,493 4,780 4,475 3,032 3,828 4,184 55% -7% Bali 1,634 1,727 2,163 924 1,065 1,567 1,724 -43% 87% W. Nusa Tenggaraq 191 290 439 307 41 53 36 61% -88% E. Nusa Tenggara 109 101 120 36 37 50 n/a -67% n/a Maluku 273 269 125 n/a n/a n/a n/a n/a n/a Irian Jaya 270 300 387 387 320 320 363 43% -6%

103
4.2 c – Village Poultry ANNEX 4
Population ('000 head) Change Region And Year 1995 1996 1997 1998 1999 2000 2001 95-
98 98-01
Sumatra 81,987 85,061 85,150 87,718 85,564 89,145 92,632 7% 6% Java 64,866 109,989 109,359 101,515 106,812 108,494 105,476 56% 4% Kalimantan 14,791 16,645 15,955 12,905 13,664 14,688 15,873 -13% 23% Sulawesi 25,684 25,349 26,018 26,705 27,537 81,197 26,726 4% 0% Bali 6,313 6,349 6,545 5,673 5,111 5,056 5,081 -10% -10% W. Nusa Tenggara 5,286 5,674 6,087 6,037 3,760 3,316 3,492 14% -42% E. Nusa Tenggara 7,614 7,805 8,000 8,743 9,154 9,154 9,584 15% 10% Maluku 1,743 1,957 2,106 2,253 2,140 2,148 2,150 29% -5% Irian Jaya 1,269 1,329 1,394 1,485 1,538 1,538 1,615 17% 9% National Flock 209,553 260,158 260,614 253,034 255,280 314,736 262,629 21% 4%
TABLE 4.3 - The National Village Poultry Production Intensification (INTAB) Program
Parameter/Year Unit 1995 1996 1997 1998 Ave. Targets
Reached
Participating Provinces no. 27 27 27 27
Initial Poultry Population 000 birds
Target 53,961 41,326 44,368 46,588 186,243
Actual 48,592 43,320 38,477 33,010 163,399
% Target 90% 105% 87% 71% 88%
Vaccination for ND 000 doses
Target 268,393 66,122 91,292 248,722 674,529
Actual 88,032 101,852 130,061 86,418 406,363
% Target 33% 154% 142% 35% 60%
Meat Production tons
Target 129,139 99,182 99,955 97,313 425,589
Actual 45,567 71,431 88,484 48,212 253,694
% Target 35% 72% 89% 50% 60%
Egg P:roduction 000 eggs
Target 299,603 97,042 195,151 397,076 988,872
Actual 111,153 169,831 166,365 138,771 586,120
% Target 37% 175% 85% 35% 59%
Final Poultry Population 000 birds
Target 95,897 74,387 75,708 79,560 325,552
Actual 54,133 55,817 52,157 43,963 206,070
% Target Reached 56% 75% 69% 55% 63%

104
Table 4.3 - Duck Population by Region, 1995-2001 ANNEX 4
Table 4.3 Population ('000 head) % Change Livestock Species
and Year 1995 1996 1997 1998 1999 2000 2001 95-98 98-01
National Flock 29,496 29,929 19,639 16,717 17,683 18,489 19,177 -43% 15% Sumatra 10,255 10,390 10893 10094 10875 11263 11643 -2% 15% Java 11,057 10,794 10,894 10,094 10,830 11,263 11,646 -9% 45% Kalimantan 3,456 4,007 3,914 2,143 2,610 2,965 3,100 -38% 45% Sulawesi 3,114 3,121 3,148 3,148 2,859 2,724 2,840 1% -10% Bali 672 680 713 534 538 616 629 -21% 18% W. Nusa Tenggara
556 575 594 383 416 491 516 -31% 35% E. Nusa Tenggara
212 163 161 183 192 192 201 -14% 10% Maluku 83 98 109 121 122 122 123 46% 2% Irian Jaya 91 101 106 111 116 116 122 22% 10%
TABLE 4.4 - The Commercial Dairy Industry in Indonesia Production Phase Components Type Number 1. Input Supports Breeding Units BPTHMT, Baturraden Imported Friesian Holsteins and crossbreds KOSBIT Cattle breeding Coop Dairy concentrates GKSI Coop Feedmills Complete feed Veterinary drugs ASOHI Dairy medications Frozen semen production Singosari, Java Holstein nucleus herd Nucleus herd maintenance Salatiga, Java Embryo transfer 2. Production Cooperative production Dairy cooperative (GKSI) 98000 members Dairy Cooperative No. GKSI coops 221 Co-ops \a Non-cooperative Dairy as sideline business 4 units Private dairy farming Non-organized smallholders 50 units 3. Processing and marketing Milk processors Fresh, condensed, reconsti- tuted milk from imported milk powder 4 Chilled, fluid milk only 5 Milk collecting centers Fresh milk from producers hundreds Milk retailing shops, distributors variable Secondary processing Candy, pasteurized, flavored n/a 4. Technical support GKSI dairy veterinarians See Section V \a About half of these are registered co-ops but non-functional.

105
TABLE 4.5 - Production Parameters for Indonesian Livestock and Poultry
ANNEX 4 Table 4.5
Species and Bali Aceh Madura Ongole Swamp Dairy Pigs
Parameter Unit Cattle Cattle Cattle Cattle Buffalo Cows Sheep Goats local
Production
Adult Body weight
Males kg 375 250 275 400 550 1800 40 -- 60
Females kg 275 150 250 300 400 1000 35 30
Daily gain kg 0.35 0.25 0.3 -- -- -- -- --
Dressing percentage % 56 -- 48 45 -- 60 52 Feed conversion (feed/gain) kg 9.1 -- 9.2 8.6 8 Milk per cow per year ton -- -- -- -- --
2.5-3.5 -- -- --
Reproduction
Age at first birth mth 29 60 63 42 52 24 14 14 1.5
Birth interval mth 14 15 16 20 8 8 1
Conception rate % 79 30-75 -- 66-72 25-80 52-62 65 65-85 65
Species and Village Layer Commercial Poultry
Parameter Unit Poultry Ducks Layers Broilers
Age at first laying mth 6.5 3 6 -- Eggs per bird per year no. 80 150 265 --
Hatchability % 80 85 85 75 Mortality first 6 weeks % 75 15 8 5
Body weight kg 1.1 2.5 1.8 2.2
Sources: Directorate of Animal Breeding, DGLS; Livestock Sector Review Indonesia, Winrock International/DGLS, 1981.
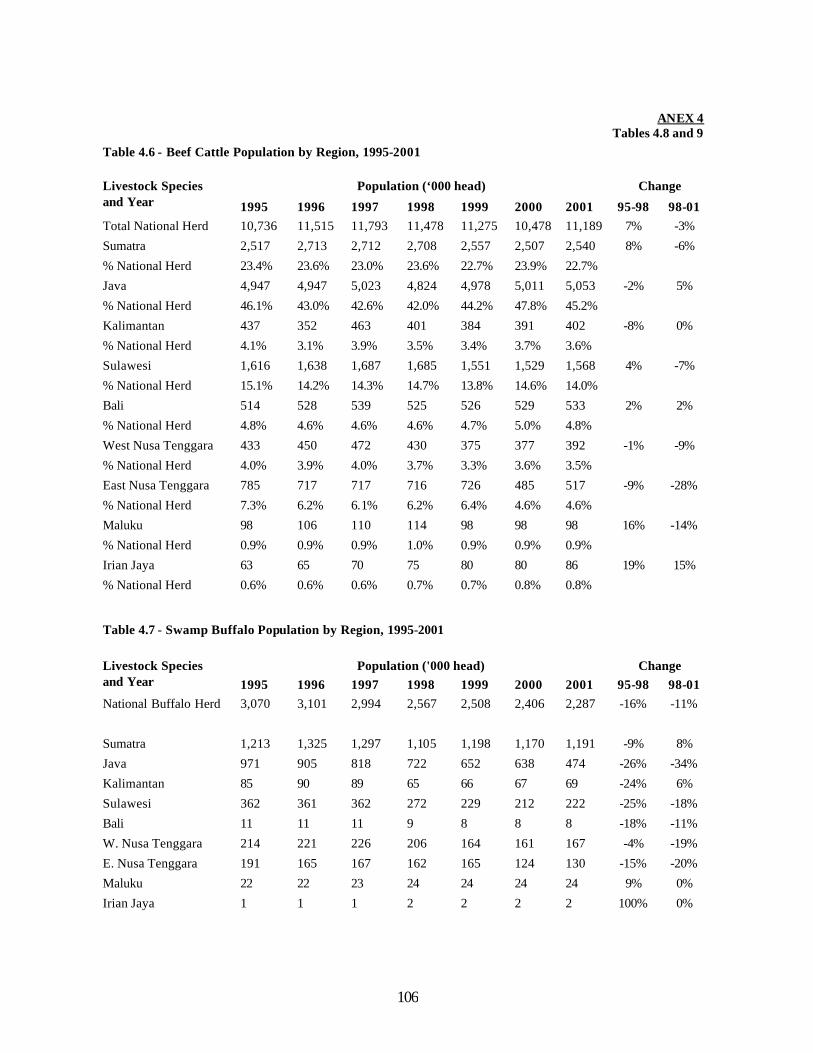
106
ANEX 4
Tables 4.8 and 9 Table 4.6 - Beef Cattle Population by Region, 1995-2001
Population (‘000 head) Change Livestock Species and Year 1995 1996 1997 1998 1999 2000 2001 95-98 98-01 Total National Herd 10,736 11,515 11,793 11,478 11,275 10,478 11,189 7% -3%
Sumatra 2,517 2,713 2,712 2,708 2,557 2,507 2,540 8% -6%
% National Herd 23.4% 23.6% 23.0% 23.6% 22.7% 23.9% 22.7%
Java 4,947 4,947 5,023 4,824 4,978 5,011 5,053 -2% 5%
% National Herd 46.1% 43.0% 42.6% 42.0% 44.2% 47.8% 45.2%
Kalimantan 437 352 463 401 384 391 402 -8% 0%
% National Herd 4.1% 3.1% 3.9% 3.5% 3.4% 3.7% 3.6%
Sulawesi 1,616 1,638 1,687 1,685 1,551 1,529 1,568 4% -7%
% National Herd 15.1% 14.2% 14.3% 14.7% 13.8% 14.6% 14.0%
Bali 514 528 539 525 526 529 533 2% 2%
% National Herd 4.8% 4.6% 4.6% 4.6% 4.7% 5.0% 4.8%
West Nusa Tenggara 433 450 472 430 375 377 392 -1% -9%
% National Herd 4.0% 3.9% 4.0% 3.7% 3.3% 3.6% 3.5%
East Nusa Tenggara 785 717 717 716 726 485 517 -9% -28%
% National Herd 7.3% 6.2% 6.1% 6.2% 6.4% 4.6% 4.6%
Maluku 98 106 110 114 98 98 98 16% -14%
% National Herd 0.9% 0.9% 0.9% 1.0% 0.9% 0.9% 0.9%
Irian Jaya 63 65 70 75 80 80 86 19% 15%
% National Herd 0.6% 0.6% 0.6% 0.7% 0.7% 0.8% 0.8%
Table 4.7 - Swamp Buffalo Population by Region, 1995-2001
Population ('000 head) Change Livestock Species
and Year 1995 1996 1997 1998 1999 2000 2001 95-98 98-01 National Buffalo Herd 3,070 3,101 2,994 2,567 2,508 2,406 2,287 -16% -11%
Sumatra 1,213 1,325 1,297 1,105 1,198 1,170 1,191 -9% 8%
Java 971 905 818 722 652 638 474 -26% -34%
Kalimantan 85 90 89 65 66 67 69 -24% 6%
Sulawesi 362 361 362 272 229 212 222 -25% -18%
Bali 11 11 11 9 8 8 8 -18% -11%
W. Nusa Tenggara 214 221 226 206 164 161 167 -4% -19%
E. Nusa Tenggara 191 165 167 162 165 124 130 -15% -20%
Maluku 22 22 23 24 24 24 24 9% 0%
Irian Jaya 1 1 1 2 2 2 2 100% 0%

107
Table 4.8 – Sheep Population by Region, 1995-2001
ANNEX 4 Tables 4.10, 11
Population ('000 head) Change Livestock Species
and Year 1995 1996 1997 1998 1999 2000 2001 95-98 98-01
National Flock 5,550 6,295 7,665 7,107 7,226 7,428 7,395 28% 4% Sumatra 401 484 505 512 450 472 581 28% 13% Java 4,969 5,623 6,942 6,390 6,581 6,879 6,732 29% 5% Kalimantan 8 14 9 8 8 9 11 0% 38% Sulawesi 13 10 11 11 9 9 9 -15% -18% Bali 0.2 0.3 0.1 0.1 0.1 0.1 0.1 -50% 0% E. Nusa Tenggara 111 115 145 147 151 32 35 32% -76% W. Nusa Tenggara 39 40 43 29 17 17 17 -26% -41% Maluku 7 7 7 7 7 7 7 0% 0% Irian Jaya 2 2 3 3 3 3 3 50% 0%
Table 4.9 – Goat Population Distribution by Region, 1995-2001
Population ('000 head) Change Livestock Species and Year 1995 1996 1997 1998 1999 2000 2001 95-98 98-01
National Flock 12,994 13,653 13,965 13,342 12,702 12,566 12,357 2.7% -7.4% Sumatra 3,227 3,359 3,500 3,599 3,144 3,072 3,246 12% -10% Java 7,374 7,922 7,892 7,102 7,014 7,234 6,803 -4% -4% Kalimantan 246 280 278 259 277 275 287 5% 11% Sulawesi 861 873 893 1,020 890 901 851 18% -17% Bali 116 117 122 110 103 96 96 -5% -13% E. Nusa Tenggara 612 505 629 636 655 362 390 4% -39% W. Nusa Tenggara 301 322 344 273 234 241 251 -9% -8% Maluku 212 232 261 293 332 332 376 38% 28% Irian Jaya 45 43 46 50 53 53 57 11% 14%
4.10 - Pig Population Distribution by Region, 1995-2001
Population ('000 head) % Change Livestock Species and Year 1995 1996 1997 1998 1999 2000 2001 95-98 98-01
National Pig Herd 7,379 7,500 7,750 7,504 7,651 5,357 5,866 2% -22% Sumatra 1,506 1,942 1,714 1,743 1,479 1,314 1,433 16% -18% Java 255 245 187 147 126 171 182 -42% 24% Kalimantan 1,180 885 505 537 609 616 638 -54% 19% Sulawesi 1,274 1,265 1,325 1,172 1,488 889 947 -8% -19% Bali 1,080 1,073 1,131 967 968 939 954 -10% -1% E. Nusa Tenggara 1,538 1,588 2,229 2,233 2,287 725 982 45% -56% W. Nusa Tenggara 23 24 26 21 22 31 38 -9% 81% Maluku 96 100 109 119 107 107 110 24% -8% Irian Jaya 427 378 524 565 565 565 582 32% 3%

108
TABLE 5.1 - Inventory of Animal Health and Research Facilities, 2002
ANNEX 5 Table 5.1
Laboratory/Institute/Center Location Number Function
Regional Disease Investigation Centers 7
Regional disease diagnosis and surveillance
Region I Disease Investigation Laboratory
Medan, North Sumatra
Region II Disease Investigation Laboratory
Bukittingi, North Sumatra
Region III Disease Investigation Laboratory Lampung Region IV Disease Investigation Laboratory Wates, Central Java Region V Disease Investigation Laboratory
Banjarbaru, S. Kalimantan
Region VI Disease Investigation Laboratory Denpasar, Bali Region VII Disease Investigation Laboratory
Maros, South Sulawesi
Diagnostic and Veterinary Services Units
Type B Diagnostic Laboratories: Provincial capitals 24 District level services and disease reporting
Type C Diagnostic Laboratories District level 43 Village-level basic diagnostic services
Animal Health Posts (poskeswan) Subdistrict level 463 Village-level veterinary assistance to farmers
Research and Regulatory Control Facilities 7 Research Institute for Animal Disease (Balitvet) Bogor, Java Basic, applied research Animal Production Research Institute (Balitnak) Bogor, Java Basic, applied research Veterinary Drug Assay Laboratory (BPMSOH) Gunung Sindur, Java Quality control of veterinary drugs Animal Production Research Institute (Balitnak) Bogor, Java Livestock products hygiene, sanitation
Livestock Product Testing Laboratory Bogor, Java Certification of new drugs and additives
Biological Veterinary Product Center (Pusvetma) Surabaya, Java
Production of veterinary vaccines and reagents
Quality Control Laboratory for Livestock Products Bogor, Java Residue testing of livestock products

109
ANNEX 5
Table 5.2 TABLE 5.2 - Livestock and Poultry Diseases of Economic, Strategic and Notifiable Significance \a Disease Agent Economic (Class C) Strategic (Class B) Notifiable (Class A) Viral Poultry: Poultry: Poultry: Newcastle Disease Newcastle Disease Newcastle Disease Infectious Brochitis Infect. Laryngotracheitis Fowl Pox Marek's Disease Fowl Plague Infectious Bursal Disease Ruminants: Ruminants: Ruminants: Jembrana (Bali cattle) Jembrana (Bali cattle) Jembrana (Bali cattle) Enzootic Bovine Leucosis IPV Blue Tongue Rabies Contagious ORF Bovine Viral Diarrhea Aujeszky's Disease Bovine Ephemeral Fever Bovine Ephemeral Fever Bovine Ephemeral Fever Malignant Catarrhal Fever Malignant Catarrhal Fever Malignant Catarrhal Fever Bacterial Poultry: Poultry: Poultry: Pullurum Disease Snot Chronic Respiratory Disease Fowl Cholera Tuberculosis Ruminants: Ruminants: Ruminants: Hemorrhagic Septicemia Hemorrhagic Septicemia Hemorrhagic Septicemia Anthrax Anthrax Anthrax Brucellosis Brucellosis Brucellosis Leptospirosis Erysipelas Tuberculosis Tuberculosis Tuberculosis Blackleg Vibriosis

110
TABLE 5.2 - Livestock and Poultry Diseases of Economic, Strategic and Notifiable Significance (Continued) \a Disease Agent Economic (Class C) Strategic (Class B) Notifiable (Class A) Protozoan Poultry: Poultry: Poultry: Coccidiosis Ruminants: Ruminants: Ruminants: Trypanosomiasis Trypanosomiasis Trypanosomiasis Theileriosis Babesiosis Babesiosis Babesiosis Anaplasmosis Anaplasmosis Anaplasmosis Coccidiosis Nematodiasis (ruminants) Cysticercosis Trichinosis (pigs) Fascioliasis Cascado Distosomiasis Piroplasmosis Parasitic Ruminants: Ruminants: Ruminants: Scabies Myiasis Demodex (also pigs) Fascioliasis Fascioliasis Source: DGLS - Directorate of Animal Health Services. \a Bolded diseases indicate those subject to routine surveillance and control.

111
TABLE 6.1 - Veterinary Manpower and Training
ANNEX 6
Tables 6.1a and b
Table 6.1a - Veterinary Employment by Sector Employment 1997 1998 2000 Public Sector: 4,000 3,085 1,224 Government 3,000 2,675 724 Laboratories, research, faculties 1,000 410 500 Private Sector: 1,550 1,550 2,625 Private practice 500 360 2,175 Industrial \a 500 350 350 Other \b 550 840 100 Auxillary: 2,280 1,420 1,841 Animal health assistants \c 1,200 1,200 1,541 Animal health workers \d 1,080 220 300 Veterinary Employment: Total veterinarians 5,550 4,635 3,849 Public Sector 72% 67% 32% Private Sector 28% 33% 68% TABLE 6.1 b - Veterinary Faculty Undergraduate Capacity \b 1995 1998 2001+ IPB, Bogor 50 50 100 Universitas Gadja Mada, Yogyakarta 100 100 100 Universitas Airlangga, Surabaya 85 85 100 Udayana, Denpasar 45 45 60 Universitas Syahkuala, Aceh 55 55 75 Total 335 335 435
Programs offered DVM Dip. An Hlth MSc PhD
Institut Pertanian Bogor X X X X Universitas Gadja Mada, Yogyakarta X X X X Universitas Airlangga, Surabaya X Universitas Udayana, Denpasar X Universitas Syahkuala, Aceh X Sources: FAO Statistics; IBIS World Information Service
\a Meat inspection, food hygiene \b zoos, drug companies \c with formal training \d with vocational training \e By government regulation, all veterinary faculties are to increase the number of undergraduate students to 100, beginning in year 2000. To date, only IPB can comply by 2003.

112
TABLE 6.2 - Private and Government Pet Animal Hospitals and Pet Clinics
Animal
Hospitals Animal Clinics Private Clinics \c
Region and Province Dinas Private Dinas Private Single Private Province District
Indonesia 2 1 37 21 346 16 46 38
Sumatra 0 0 3 2 31 2 26 15
Aceh
North Sumatra 1 2 15 2
West Sumatra
Riau 1 1 21
Jambi 1 3
South Sumatra 12 5 15
Bengkulu
Lampung
Banka Belitung
Java 1 1 4 9 288 1 8 5
DKI Jakarta 1 1 73 Banten (new prov)
West Java 20 3 2
Central Java 2 4 56 1 5
DI Yogyakarta 1 34
East Java 1 5 105 3
Nusatenggara 1 0 1 1 8 0 3 0
Bali W. Nusatenggara 1 2
E.Nusatenggara 1 1 6 3
Kalimantan 0 0 28 2 16 13 7 2 West Kalimantan 26 13 12
Central Kalimantan 1 1 South Kalimantan 1 3 1 6 2 East Kalimantan
Sulawesi 0 0 1 0 3 0 0 16
Sulut 2
Gorontalo Central Sulawesi 1
South Sulawesi
Sultra 16

113
Malaka, Irian Jaya 0 0 0 0 0 0 2 0
Malaku 2
North Malaku
Irian Jaya

114
TABLE 6.3 - National Animal Health Posts (Poskeswan) by Province, 2001
Service provision at the village level. ANNEX 6 Table 6.3
Region and Province No. Animal Health Posts
AHP Service Providers(SP) Livestock Poultry
One AHP SP per
Total Active Inactive %
Inactive Vet Paravet Total SP ('000 hd) ('000 brd)
1000 Lvstk
1000 Pltry
Indonesia 463 284 179 39% 218 389 607 39,094 891,184 64 1,468
Sumatra 125 87 38 30% 45 80 125 8,991 213,447 72 1,708
Aceh 9 9 0 0% 0 0 0
North Sumatra 8 0 8 100% 8 10 18
West Sumatra 13 13 0 0% 0 0 0
Riau 30 17 13 43% 11 23 34
Jambi 12 5 7 58% 7 10 17
South Sumatra 34 28 6 18% 15 32 47
Bengkulu 5 1 4 80% 4 5 9 Lampung 13 13 0 0% 0 0 0
Banka Belitung 1 1 0 0% 0 0 0 Java 109 48 61 56% 80 75 155 19,244 529,220 124 3,414
DKI Jakarta 2 0 2 100% 2 2 4 Banten (new prov) n/a n/a n/a n/a n/a n/a n/a West Java 19 19 0 0% 0 0 0 Central Java 27 0 27 100% 27 27 54 DI Yogyakarta 23 18 5 22% 16 32 48 East Java 38 11 27 71% 35 14 49 Nusatenggara 131 111 20 15% 57 145 202 2,919 18,792 14 93
Bali 13 13 0 0% 0 0 0 W. Nusatenggara 52 45 7 13% 41 83 124 E.Nusatenggara 66 53 13 20% 16 62 78 Kalimantan 42 18 24 57% 8 38 46 1,407 58,402 31 42 West Kalimantan 2 0 2 100% 2 2 4 Central Kalimantan 25 10 15 60% 0 27 27 South Kalimantan 9 2 7 78% 6 9 15 East Kalimantan 6 6 0 0% 0 0 0 Sulawesi 49 16 33 67% 28 44 72 3,597 38,345 50 11
Sulut 4 0 4 100% 3 4 7
Gorontalo 1 0 1 100% 1 2 3 Central Sulawesi 4 2 2 50% 0 5 5
South Sulawesi 20 -2 22 110% 20 20 40 Sultra 20 16 4 20% 4 13 17

115
Malaka, Irian Jaya 7 4 3 43% 0 7 7 1,345 5,662 192 4
Malaku 5 2 3 60% 0 7 7
North Malaku 0 0 0 n/a 0 0 0 Irian Jaya 2 2 0 0% 0 0 0
a\ AHP veterinarians are called Mantri Hewan, and are university graduates.
b\ Paravets receive 2 years of applkied training in basic veterinary medical care, vaccination, and simple diagnostic techniques.
TABLE 6.4 - National Artificial Insemination (AI) Program, 1995 - 2000 ANNEX 4 Table 6.4
Parameter 1995 1996 1997 1998 1999 2000 Change (Beef Cattle (mln hd 1995-2000 AI Target 2,185 1,794 1,856 800 1,800 2,076 -5% No. inseminated 1,616 1,434 14,324 1,122 944 564 -186% % Target 74% 80% 772% 140% 52% 27% -172% Calves born from AI n/a n/a n/a n/a 506.4 221.5 n/a Inseminations/Birth n/a n/a n/a n/a 1.9 2.5 n/a Conception rate a\ n/a n/a n/a n/a 54% 39% n/a Dairy Cattle (000 hd) AI Target 368 242 268 259 250 266 -38% No. inseminated (000 hd)
350 180 159 189 169 62 -469%
% Target 95% 74% 59% 73% 68% 23% -311% Calves born from AI n/a n/a n/a n/a 54.1 17.3 Inseminations/Birth n/a n/a n/a n/a 3.1 3.6 Conception rate n/a n/a n/a n/a 32% 28% Buffalo (000 hd) AI Target 43.3 42.3 36.9 22.5 n/a 4.54 -854% No. inseminated 16.0 6.9 3.4 3.4 n/a 0.82 -1851% % Target 37% 16% 9% 15% n/a 18% -105% Calves born from AI n/a n/a n/a n/a n/a 0.23 n/a Inseminations/Birth n/a n/a n/a n/a n/a 3.6 n/a Conception rate n/a n/a n/a n/a n/a 28% n/a
n/a No data provided. a\ Conception rate = Calves born /No. cows inseminated. Calves born taken from the year following insemination.

116
ANNEX 6 Table 6.5 (1 of 2)
TABLE 6.5 - Artificial Insemination Program by Livestock Species and Region, 1996-2000 \a Region 1996 1997 1998 Cattle Buffalo Dairy Cattle Buffalo Dairy Cattle Buffalo Dairy Indonesia
Target 1,800,920 38,250 241,205 1,707,418 37,600 268,300 798,520 22,500 257,125
Actual 1,472,699 8,671 183,862 922,551 6,977 165,084 1,122,308 3,439 189,191
% Target 82% 23% 76% 54% 19% 62% 141% 15% 74%
Sumatra
Target 351,190 14,300 12,015 317,150 11,400 8,700 138,240 10,500 10,975
Actual 209,867 3,048 8,654 201,956 2,371 4,249 175,772 1,919 12,117
% Target 60% 21% 72% 64% 21% 49% 127% 18% 110%
Java
Target 1,058,650 14,100 228,600 1,096,007 12,100 257,000 557,340 5,500 245,850
Actual 1,060,147 3,855 172,463 557,340 3,413 158,968 810,150 1,059 175,138
% Target 100% 27% 75% 51% 28% 62% 145% 19% 71%
Bali \b
Target 40,000 0 0 40,000 0 0 19,400 700 0
Actual 41,855 0 0 40,549 0 0 34,125 0 0
% Target 105% n/a n/a 101% n/a n/a 176% 0% n/a Nusa Tenggara
Target 98,000 750 250 58,211 750 250 33,040 500 150
Actual 58,025 339 1,936 33,040 26 526 58,467 9 242
% Target 59% 45% 774% 57% 3% 210% 177% 2% 161%
Kalimantan
Target 78,780 2,600 340 42,550 3,350 350 20,960 1,300 150
Actual 24,124 416 329 22,106 80 305 13,973 27 98
% Target 31% 16% 97% 52% 2% 87% 67% 2% 65%
Sulawesi
Target 156,400 6,500 0 134,500 10,000 2,000 25,940 4,000 0
Actual 73,540 728 480 65,408 1,087 1,036 29,632 425 1,596
% Target 47% 11% #DIV/0! 49% 11% 52% 114% 11% n/a
Maluku, Irian Jaya
Target 17,900 0 0 19,000 0 0 3,600 0 0
Actual 5,141 285 0 2,152 0 0 189 0 0
% Target 29% n/a n/a 11% n/a n/a 5% n/a n/a Figures differ slightly from Table 6.4 as the result of updated information.

117
ANNEX 6 Table 6.5 (2 of 2)
TABLE 6.5 - Artificial Insemination Program by Livestock Species and Region, 1996-2000 (cont’d) Region 1999 2000 Cattle Buffalo\a Dairy Cattle Buffalo Dairy Indonesia
Target 1,835,000 0 233,131 2,077,261 4,544 266,214
Actual 1,603,706 1,895 202,687 919,062 835 71,438
% Target 87% n/a 87% 44% 18% 27% Sumatra
Target 290,000 0 8,050 321,333 2,544 4,717
Actual 155,273 1,137 6,582 141,980 319 333
% Target 54% n/a 82% 44% 13% 7%
Java
Target 1,304,000 0 225,081 1,559,426 1,500 257,497
Actual 1,344,000 530 192,617 721,292 374 70,686
% Target 103% n/a 86% 46% 25% 27%
Bali \b
Target 40,000 0 0 45,000 0 0
Actual 25,273 0 0 11,396 0 0
% Target 63% n/a n/a 25% n/a n/a
Nusa Tenggara
Target 100,000 0 0 45,000 0 2,000
Actual 41,938 37 144 11,396 0 323
% Target 42% n/a n/a 25% n/a 16%
Kalimantan
Target 40,000 0 0 32,602 0 300
Actual 18,346 1 197 14,105 0 5
% Target 46% n/a n/a 43% n/a 2%
Sulawesi
Target 51,000 0 0 63,900 500 1,700
Actual 18,876 190 3,147 18,893 142 91
% Target 37% n/a n/a 30% 28% 5%
Maluku, Irian Jaya
Target 10,000 0 0 10,000 0 0
Actual 0 0 0 0 0 0
% Target 0% n/a n/a 0% n/a n/a
Notes:
\a No insemination target estimates were recorded for buffalo for Year 1999. \b No AI programs for buffalo and dairy cattle in Bali. Source: Directorate of Animal Breeding, DGLS, 2002. Data for 2001 not yet available.

118
TABLE 6.6 - Agricultural Extension Staff in Transition ANNEX 6
Table 6.6 a, b
TABLE 6.6a - National Agricultural Extension Units by Region, 2002
Extn Info Extension Farmers
Centers Agents Groups
Region Districts Subdistricts Villages (BIPP or (PPL) (Kelompok)
KITPPK)
Sumatra 95 1,086 13,287 41 9,590 77,404
Java 104 1,763 16,216 29 10,819 104,298
Nusatenggara 29 253 1,642 3 2,093 142,361
Kalimantan 29 367 9,536 10 3,764 25,034
Sulawesi 45 507 4,356 26 5,360 30,175 Maluku, Iruan Jaya 21 150 271 12 716 4,061
Total 323 4,126 45,308 121 32,342 383,333
Source: Dinas Human Resource Development, May 2002 report BIPP - Balai Informasi Penyuluh Pertanian; Agricultural Information Center KITPPK - Kelompok Informasi Penyuluh Pertanian; Agricultural Information Group (newly established, integrated extension centers, set up by some local governments) PPL - Penyuluh Pertanian Lepangan - Agricultural extension officer.
TABLE 6.6b - Staff Profile of Agricultural Extension Agents and Employment Status, 2001 and 2002
Region Staff Profile, 2001 Staff Profile, 2002
Fulltime Temporary Total Fulltime Reassigned Status
\a b\ Uncertain
Sumatra 10,135 456 10,591 10,092 472 1,430
Java 11,270 134 11,404 10,760 469 1,446
Nusatenggara 3,442 166 3,608 2,726 78 640
Kalimantan 3,777 322 4,099 3,397 101 849
Sulawesi 4,884 427 5,311 5,297 233 919 Maluku, Iruan Jaya 2,231 0 2,231 1,195 8 1,219
Indonesia 35,739 1,505 37,244 33,467 1,361 6,503
Staff Decrease 2001-2002 was 7%. \a Not yet contracted as fulltime staff, but included in national inventory. \b Reassigned to other Dinas units by local governments. \c Not yet reassigned and awaiting final status. Source: Dinas Human Resource Development, May 2002 report

119
TABLE 6.7 - Feedmill Numbers, Capacity and Output ANNEX 6 Table 6.7
Table 6.7 a - Number of Feedmills by Region
% Change
Region 1995 1996 1997 1998 1999 2000 95-98 98-00
Java 13 16 16 17 16 15 31% -12%
Kalimantan 27 42 42 49 49 45 81% -8%
Sulawesi 0 0 0 0 0 0 n/a n/a
Bali 0 1 1 1 1 1 n/a 0%
Nusa Tenggara 0 0 0 0 0 0 n.a n.a
Maluku, Irian Jaya 0 0 0 0 0 0 n/a n/a
Total Number 40 59 59 67 66 61 68% -9% Table 6.7b - Feedmill Capacity by Region ('000 mt) Capacity Change
Region 1996 1997 1998 1999 2000 96-98 98-00
Sumatra 1,368 1,658 1,658 1,658 1,795 21% 8%
Java 5,457 6,378 7,396 7,394 8,186 36% 11%
Kalimantan 0 0 0 0 0 n/a n/a
Sulawesi 14 38 38 38 38 170% 0%
Bali 0 0 0 0 0 n/a n/a
Nusa Tenggara 0 0 0 0 0 n/a n/a
Maluku, Irian Jaya 0 0 0 0 0 n/a n/a
Total Capacity 6,839 8,074 9,092 9,089 10,019 33% 10% Table 6.6c - Feedmill Production ('000 mt)
Feed by Production
Change
Type of Feed 1997 1998 1999 2000 Type 95-98 98-00
Broiler feed 2,121 643 1,369 1,951 37% -70% 203%
Layer feed 2,762 1,146 1,168 1,684 41% -59% 47%
Pig feed 580 500 500 500 13% -14% 0%
Aquatic feed 467 249 330 346 9% -47% 39%
Total Production 5,930 2,538 3,367 4,481 100% -57% 77%
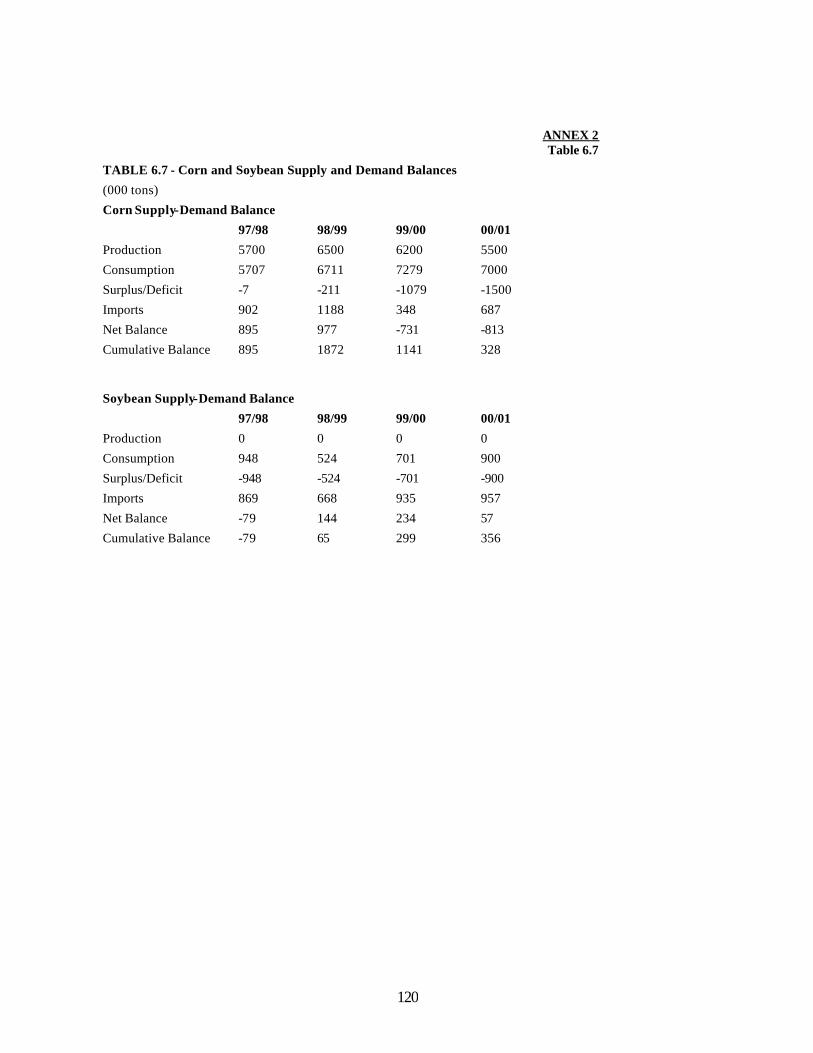
120
ANNEX 2 Table 6.7
TABLE 6.7 - Corn and Soybean Supply and Demand Balances
(000 tons)
Corn Supply-Demand Balance
97/98 98/99 99/00 00/01
Production 5700 6500 6200 5500
Consumption 5707 6711 7279 7000
Surplus/Deficit -7 -211 -1079 -1500
Imports 902 1188 348 687
Net Balance 895 977 -731 -813
Cumulative Balance 895 1872 1141 328
Soybean Supply-Demand Balance
97/98 98/99 99/00 00/01
Production 0 0 0 0
Consumption 948 524 701 900
Surplus/Deficit -948 -524 -701 -900
Imports 869 668 935 957
Net Balance -79 144 234 57
Cumulative Balance -79 65 299 356

121
ANNEX 6 Table 6.8
TABLE 6.8 - Abattoir Inventory and Capacity by Design Type, Livestock and Region, 1996 and 2001 (Capacity in Head/Day)
Daily Slaughter Capacity, 2001 (Head per Day) Region and Slaughter Capacity/Day Type A Type B Type C, D
Total by Region
Sumatra Cattle Pigs Poultry Cattle Pigs Poultry Cattle Pigs Poultry Abattoirs by Type \a 0 0 1 5 1 0 92 69 0 168 Approximate slaughter capacity 0 0 100 375 100 0 644 483 0 1,702 Java Abattoirs by Type 5 1 7 18 2 7 485 72 0 597 Approximate slaughter capacity 500 100 700 1350 200 700 3395 504 0 7,449 Kalimantan Abattoirs by Type 0 0 0 2 0 0 73 50 0 125 Approximate slaughter capacity 0 0 0 150 0 0 511 364 0 1,025 Sulawesi Abattoirs by Type 0 0 0 3 0 0 56 12 0 71 Approximate slaughter capacity 9 0 0 225 0 0 392 84 0 710 Bali Abattoirs by Type 0 1 0 1 1 0 2 1 0 6 Approximate slaughter capacity 0 100 0 75 100 0 14 7 0 296 Nusa Tenggara Abattoirs by Type 0 0 0 6 0 0 9 0 0 15 Approximate slaughter capacity 0 0 0 450 0 0 63 0 0 513 Maluku, Irian Jaya Abattoirs by Type 0 0 0 0 0 0 7 0 0 7 Approximate slaughter capacity 0 0 0 0 0 0 49 0 0 49
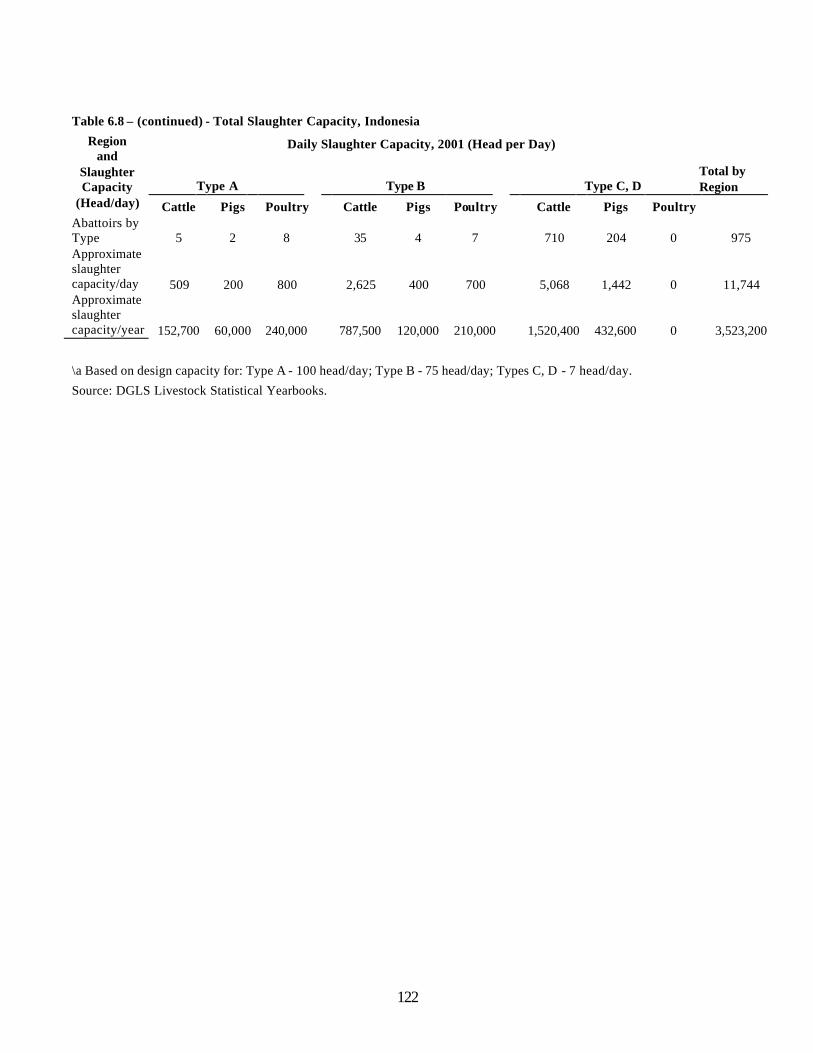
122
Table 6.8 – (continued) - Total Slaughter Capacity, Indonesia
Daily Slaughter Capacity, 2001 (Head per Day) Region and
Slaughter Capacity Type A Type B Type C, D
Total by Region
(Head/day) Cattle Pigs Poultry Cattle Pigs Poultry Cattle Pigs Poultry Abattoirs by Type 5 2 8 35 4 7 710 204 0 975 Approximate slaughter capacity/day 509 200 800 2,625 400 700 5,068 1,442 0 11,744 Approximate slaughter capacity/year 152,700 60,000 240,000 787,500 120,000 210,000 1,520,400 432,600 0 3,523,200
\a Based on design capacity for: Type A - 100 head/day; Type B - 75 head/day; Types C, D - 7 head/day.
Source: DGLS Livestock Statistical Yearbooks.

123
ANNEX Table 6.9 – Slaughter Capacity per Day and Year in 1966, by Type A, B, C and D abattoirs Table 5.4
Region Daily Slaughter Capacity, 1996 And Slaughter Capacity/Day (head/day)
Type A Type B Type C, D Region
Sumatra Cattle Pigs Poultry Cattle Pigs Poultry Cattle Pigs Poultry Abattoirs by Type \a 0 0 1 2 1 0 91 69 0 164 Approximate slaughter capacity 0 0 100 150 75 0 637 483 0 1,445 Java Abattoirs by Type 5 1 6 10 2 5 485 72 0 586 Approximate slaughter capacity 375 100 600 750 150 375 3395 504 0 6,249 Kalimantan Abattoirs by Type 0 0 0 0 0 0 73 52 0 125 Approximate slaughter capacity 0 0 0 0 0 0 511 364 0 875 Sulawesi Abattoirs by Type 0 0 0 2 0 0 56 12 0 70 Approximate slaughter capacity 0 0 0 150 0 0 392 84 0 626 Bali Abattoirs by Type 0 0 0 1 1 0 2 1 0 5 Approximate slaughter capacity 0 0 0 75 75 0 14 7 0 171 Nusa Tenggara Abattoirs by Type 0 0 0 4 0 0 8 0 0 12 Approximate slaughter capacity 0 0 0 300 0 0 56 0 0 356 Maluku, Irian Jaya Abattoirs by Type 0 0 0 0 0 0 7 0 0 7 Approximate slaughter capacity 0 0 0 0 0 0 49 0 0 49 Indonesia Abattoirs by Type 5 1 7 19 4 5 708 206 0 955 Approximate slaughter capacity, in head/day
375 100 700 1,425 300 375 5,054 1,442 0 9,771 Approximate slaughter capacity/year (in 1000 head/yr) 112.5 30 210 427.5 90 112.5 1516.2 432.6 0 2,930.3
\a Calculations based on design capacities for: Type A - 100 head/day; Type B - 75 head/day; Types C, D – 7 head/day.

124
WB161564
N:\IndonesiaEastTimorPIS\Consultant & Evaluation Reports\Livestock Report (Brandenburg)\LivestockSectorStudyNov2002complete.doc November 11, 2002 11:26 AM