livelihood empowerment against poverty program ghana
TRANSCRIPT

December 2012
Sudhanshu Handa [email protected]
University of North Carolina Department of Public Policy
Chapel Hill, NC USA
Michael Park [email protected]
University of North Carolina Department of Health Policy
and Management Chapel Hill, NC USA
Livelihood Empowerment Against Poverty Program Ghana Baseline Report
Carolina Population Center University of North Carolina at Chapel Hill 123 West Franklin Street/ Campus Box 8120 / Chapel Hill, North Carolina 27516-2524

[This page intentionally left blank]
Acknowledgements The authors wish to thank Robert Osei Darko and Isaac Osei-Akoto, Principal Investigators of the ISSER team and Chris Udry of Yale University for agreeing to incorporate the LEAP evaluation into the Yale/ISSER study. The authors also thank Carlos Alviar, Julianna Lindsey and Jane Mwangi of UNICEF and Graham Gass of DFID for useful discussion and guidance, and Mawutor Ablo, William Niyuni and Lawrence Ofori-Addoo for their commitment to the evaluation exercise.
i| Page

Executive Summary This document constitutes the baseline report for the quantitative impact evaluation of the Livelihood Empowerment Against Poverty (LEAP) Program of the Government of Ghana. The impact evaluation is being implemented by a consortium of partners including the Institute for Statistical, Social and Economic Research (ISSER) of the University of Ghana-Legon and the University of North Carolina under contract to the Government of Ghana. The primary goals of this baseline report are to describe the sample developed for the evaluation and the approach to constructing a comparison group, assess targeting, and estimate potential effects of the program on outcomes by using statistical models that link outcomes to income and other factors. The Program: LEAP is a social cash transfer program, which provides cash and health insurance to extremely poor households across Ghana to alleviate short-term poverty and encourage long-term human capital development. LEAP started a trial phase in March 2008 and then began expanding gradually in 2009 and 2010, and currently reaches over 35,000 households across Ghana with an annual expenditure of approximately USD11m. Study Design: The proposed evaluation strategy entails a longitudinal propensity score matching design. Baseline data was collected from future beneficiaries who are part of a larger nationally representative sample of households surveyed as part of a research study conducted by ISSER and Yale University (USA) in the first quarter of 2010. A comparison group of ‘matched’ households will be selected from the ISSER sample and re-interviewed after 24 months along with LEAP beneficiaries to measure changes in outcomes across treatment and comparison group. Sample: The evaluation sample contains a total of 5,698 households with 699 in the treatment (LEAP) group and 4,999 in the ISSER sample, which includes urban (one-third) and rural (two-thirds) districts. The 699 LEAP households were randomly drawn from the group of 13,500 households that were selected into the program in the second half of 2009, and are located in 7 districts across 3 Regions (Brong Ahafo, Central, Volta). LEAP households are poorer than the national average, and have unique characteristics which suggest that they are ‘AIDS-affected’. Sixty-two percent of LEAP households are below the upper poverty line compared to 29 percent of households in GLSS5 and 39 percent of rural households in GLSS5. Mean per capita expenditure is G¢47 per person per month or about 1 U.S. dollar per day using the prevailing exchange rate of 1.44 in early 2010; 85 percent of LEAP households have a consumption level that is less than U.S.$ 2 per person per day. Unlike the generally poor in Ghana, LEAP households are significantly smaller, have fewer young children, but more orphans. LEAP household heads also tend to be much older, female and less likely to be married.
ii| Page

It is possible to identify a viable comparison group from the ISSER sample using Propensity Score Matching (PSM). This comparison group, drawn from all rural regions of Ghana, has very similar background characteristic to LEAP households and very similar child level outcomes. The value of the LEAP transfer is low by international standards. LEAP transfers approximately 7 percent of mean per capita expenditure to its beneficiaries, one of the lowest values in the world. These values for programs in Kenya, Zambia, South Africa, Mexico and Colombia range from 20-30 percent of the mean consumption of participants. LEAP has the potential to impact several key human development indicators including girls’ secondary school enrolment, curative health care, school attendance, and household diet diversity. This is because the relationship between these indicators and total household spending is strong among LEAP households. However, because the value of the transfer is low, the actual predicted impact of LEAP on these outcomes is low. Expected impacts would rise to levels comparable to other successful programs if the value of the LEAP transfer were increased by at least three times and preferably four times its current value. For example, tripling the value of the transfer is predicted to increase girls’ secondary school enrolment by 5.5 percentage points, an effect size that is comparable to other programs around the globe despite the fact that LEAP does not employ punitive conditions.
iii| Page
Acronyms DD Difference-in-differences DSW Department of Social Welfare GLSS5 Ghana Living Standards Survey 2005-06 ISSER Institute for Statistical, Social and Economic Research of the University of Ghana-
Legon LEAP Livelihood Empowerment Against Poverty (LEAP) MESW Ministry of Employment and Social Welfare NHIS National Health Insurance Scheme OVC Orphan or vulnerable child PSM Propensity score matching PWD Person with extreme disability SD Standard Deviation
iv| Page

Table of Contents
1. Introduction and Background .................................................................................................. 6
2. Conceptual Framework ............................................................................................................ 7
3. Study Design ............................................................................................................................ 9
4. Survey instrument .................................................................................................................. 10
5. Description of LEAP Households and Comparison with National Samples ........................... 11
6. Selection of Comparison Groups ........................................................................................... 16
7. Prediction of Program Impacts .............................................................................................. 22
8. Main Conclusions ................................................................................................................... 26
Appendix 1: Means of matched samples with and without replacement ................................... 28
Appendix 2: Propensity score logit model estimation .................................................................. 29
Appendix 3: Distribution of LEAP and comparison households with replacement ...................... 30
Appendix 4: Outcome variable across LEAP and ISSER matched samples with replacement ..... 31
Appendix 5: Power calculations .................................................................................................... 32
v| Page

1. Introduction and Background This document constitutes the baseline report for the quantitative impact evaluation of the Livelihood Empowerment Against Poverty (LEAP) Program of the Government of Ghana. The impact evaluation is being implemented by a consortium of partners including the Institute for Statistical, Social and Economic Research of the University of Ghana-Legon (ISSER) and the University of North Carolina under contract to the Government of Ghana. LEAP is a social cash transfer program, which provides cash and health insurance to extremely poor households across Ghana to alleviate short-term poverty and encourage long-term human capital development. LEAP started a trial phase in March 2008 and then began expanding gradually in 2009 and 2010, and currently reaches over 35,000 households across Ghana with an annual expenditure of approximately USD11m. The program is fully funded from general revenues of the Government of Ghana, and is the flagship program of its National Social Protection Strategy. It is implemented by the Department of Social Welfare (DSW) in the Ministry of Employment and Social Welfare (MESW). Eligibility is based on poverty and having a household member in at least one of three demographic categories: single parent with orphan or vulnerable child (OVC), elderly poor, or person with extreme disability unable to work (PWD). Initial selection of households is done through a community-based process and is verified centrally with a proxy means test. An exciting feature of LEAP, unique in the world, is that aside from direct cash payments, beneficiaries are provided free health insurance through the new National Health Insurance Program, which began in 2004-05. This is facilitated through an MOU between the MESW and Ministry of Health, where funds to cover enrollment in health insurance are transferred directly to the local health authority who then issues cards to LEAP households. Continued receipt of cash payments from LEAP is conditional on a health insurance card.
Though the LEAP program, eligible households receive between G¢ 8-15 per month depending on eligible beneficiaries per household. The transfer payment structure based on household beneficiaries is as follows:
• Household with one eligible beneficiary receive G¢ 8; • Household with two eligible beneficiaries receive G¢ 10; • Household with three eligible beneficiaries receive G¢ 12; • Household with four eligible beneficiaries receive G¢ 15; and • Household with more than four eligible beneficiaries receive G¢ 15.
6

2. Conceptual Framework LEAP provides a cash transfer to ultra-poor households within three demographic categories: elderly, disabled, and OVC. As we will show later in this report, LEAP households are poorer than the national rural average, with 51 percent falling below the national (upper) poverty line and a median per capita daily expenditure of approximately 85 US cents. The cash is conditional on enrollment in the National Health Insurance Scheme (NHIS). As in most cash transfers targeted to the ultra-poor and vulnerable, the immediate impact of the program is typically to raise spending levels, particularly basic spending needs for food, clothing, and shelter, some of which will influence children’s health, nutrition, and material well-being. Once immediate basic needs are met, and possibly after a period of time, the influx of new cash may then trigger further responses within the household economy, for example, by providing room for investment and other productive activity, the use of services, and the ability to free up older children to attend school. When the transfer is conditional on schooling and health service use, these outcomes will also increase provided that there is adequate monitoring or follow-up and participants are clearly aware of program rules. Figure 1 brings together these ideas into a conceptual framework that shows how LEAP can affect household activity, the causal pathways involved, and the potential moderator and mediator factors. The diagram is read from left to right. We expect a direct effect of the cash transfer on household consumption (food security, diet diversity), on the use of services, and possibly even on productive activity after some time. An important component of LEAP is the enrollment of participants in the NHIS. This enrollment will itself directly trigger potential behavior change in terms of inducing households to use health services and is thus considered a potential mediator or mechanism through which the effect of LEAP is felt at the household level. Another possible mediator is social networks—the program may encourage social interaction among participants which can facilitate the exchange of information and knowledge that could ultimately change behavior. On the other hand, the impact of the cash transfer may be weaker or stronger depending on local conditions in the community. These moderators include access to markets and other services, prices, and shocks. Moderating effects are shown with dotted lines that intersect with the solid lines to indicate that they can influence the strength of the direct effect. The next step in the causal chain is the effect on children. It is important to recognize that any potential impact of the program on children must work through the household through spending or time allocation decisions (including use of services). The link between the household and children can also be moderated by environmental factors, such as distance to schools or health facilities, as indicated in the diagram, household-level characteristics themselves such as the mother’s literacy, and the degree of follow-up from the social welfare workers. Note that from a theoretical perspective, some factors cited as mediators may actually be moderators and vice-versa (such as social networks). We can test for moderation versus
7

mediation through established statistical techniques,1 and this information will be important to help us understand the actual impact of the program on behavior.2 In Figure 1, we list some of the key indicators along the causal chain that we will analyze in the LEAP evaluation.
1 Baron, R. M., & Kenny, D. A. (1986). The moderator-mediator variable distinction in social psychological research: conceptual, strategic and statistical considerations. Journal of Personality and Social Psychology, 51(6), 1173–1182. 2 A mediator is a factor that can be influenced by the program and so lies directly within the causal chain. A moderator, in contrast, is not influenced by the program. Thus, service availability is a moderator, whereas NHIS participation is a mediator because it is itself changed by the program. Parental literacy is a moderator and not a program outcome, unless the program inspires caregivers to learn to read and write.
8

3. Study Design The proposed evaluation strategy entails a longitudinal propensity score matching (PSM) design. Baseline data was collected from future beneficiaries who are part of a larger nationally representative sample of households surveyed as part of a research study conducted by ISSER and Yale University (USA) in the first quarter of 2010. A comparison group of ‘matched’ households will be selected from the ISSER sample and re-interviewed after 24 months along with LEAP beneficiaries to measure changes in outcomes across treatment and comparison group. The core evaluation strategy will thus employ a difference-in-differences (DD) propensity score matching (PSM) estimator to measure the impact of LEAP. Baseline data has already been collected on 699 future LEAP beneficiary households as part of a special sample included within an on-going nationally representative household socioeconomic survey funded by Yale University and ISSER. The baseline and the 24-month follow-up survey of the special evaluation sample are funded by DSW through an Institutional Strengthening Program with DFID. Funding from 3IE has been acquired to finance the follow-up survey of the comparison group from the ISSER sample in order to carry out a robust impact evaluation analysis. The PSM strategy will enable the evaluation team to attribute changes over time to the intervention by allowing for the construction of a counterfactual through the matched comparison group, and to follow this group over the same period of observation. The present document describes the characteristics of the LEAP sample and conducts the PSM analysis to identify the comparison group from the ISSER sample, and assesses the appropriateness of this comparison group for the evaluation strategy. It should be noted that the current design could also permit a comparison among three groups of households: those receiving both health insurance and a cash transfer (most LEAP households), those receiving health insurance only and those receiving neither. The latter two groups will be drawn from the ISSER sample using PSM. A key study question could then be to understand the value-added of health insurance plus cash versus health insurance only in improving the use of social services and health outcomes among the poor.
9

4. Survey instrument The survey instrument includes detailed consumption expenditures, child development measures such as the Raven’s Matrices test, reading, arithmetic and short term memory, anthropometrics, physical health status, use of preventive and curative health services, out-of- pocket health expenditures, illness and days lost to illness, school enrollment, attendance and progression, labor force participation for all members age 5 and above, income and productive investment activities including agricultural production, housing quality, asset and durable goods ownership. The community questionnaire compiles information from key informants on staff and supplies within schools and health centers, prices of main production and consumption items plus wage rates, and an inventory of economic and social shocks. Table 1 presents the topics of the household and community questionnaires in the LEAP and ISSER/Yale survey.
Table 1: Topics in Survey Questionnaires Household Survey Community Survey Household Background Water and sanitation Employment Transportation Education Land Values Migration Crop prices Household Assets Extension services Agricultural Production Shocks and conflicts Non-farm Household Enterprise Employment and business Household Health Social and political groups Child health and development Education staffing Social Networking Health Staffing Household Food Security Health Services Expenditure Food prices Housing characteristics Non-food prices Land Measures and Transactions
10

5. Description of LEAP Households and Comparison with National Samples
This section describes the LEAP sample and compares key characteristics of eligible households with national samples to understand the targeting and selection process of the program. Most comparisons are done using the ISSER/Yale national sample but we also include some comparisons with the Ghana Living Standards Survey 2005-06 (GLSS5). There were 8000 LEAP households at the end of 2008 and an additional 27,000 were enrolled in 2009, half in April-June and the remainder between November 2009 and February 2010. The program itself operates in all 10 Regions of rural Ghana. Within Regions, districts are selected for inclusion based on the national poverty map; within districts, local DSW offices choose communities based on their knowledge of relative rates of deprivation. Within communities, local LEAP committees prepare a roster of potentially eligible households, which is then sent to Accra for final selection. The initial evaluation sample of 699 households were randomly drawn from the group of 13,500 households that were selected into the program in the second half of 2009, and are located in 7 districts across 3 Regions (Brong Ahafo, Central, Volta). These households were interviewed prior to receiving any indication that they had been selected for LEAP; because field work was conducted by ISSER (and not DSW officials) there is thus minimal chance of anticipation effects that could affect baseline values of variables of interest. Demographics The evaluation sample consists of 699 households in the treatment (LEAP) group and 4,999 in the ISSER sample, which includes urban (one-third) and rural (two-thirds) districts. The demographic characteristics for the households in these three groups are presented in table 2. When compared to the rural ISSER households, the LEAP sample has a smaller household size, 3.83 as compared to 4.12. As expected given the eligibility criteria, the LEAP sample has a smaller proportion of children under five and a larger proportion of elderly (aged over 65 years). Additionally, the LEAP sample has more households with orphans (27 percent) a well as a larger number of orphans 0.62) relative to the ISSER groups. Interestingly, LEAP households are more likely to have health insurance. Coverage of NHIS at ‘no-cost’ is part of the LEAP objective, and while current coverage is nowhere near 100 percent, it does appear as if on this indicator LEAP households are no worse off than other households in rural Ghana.
11
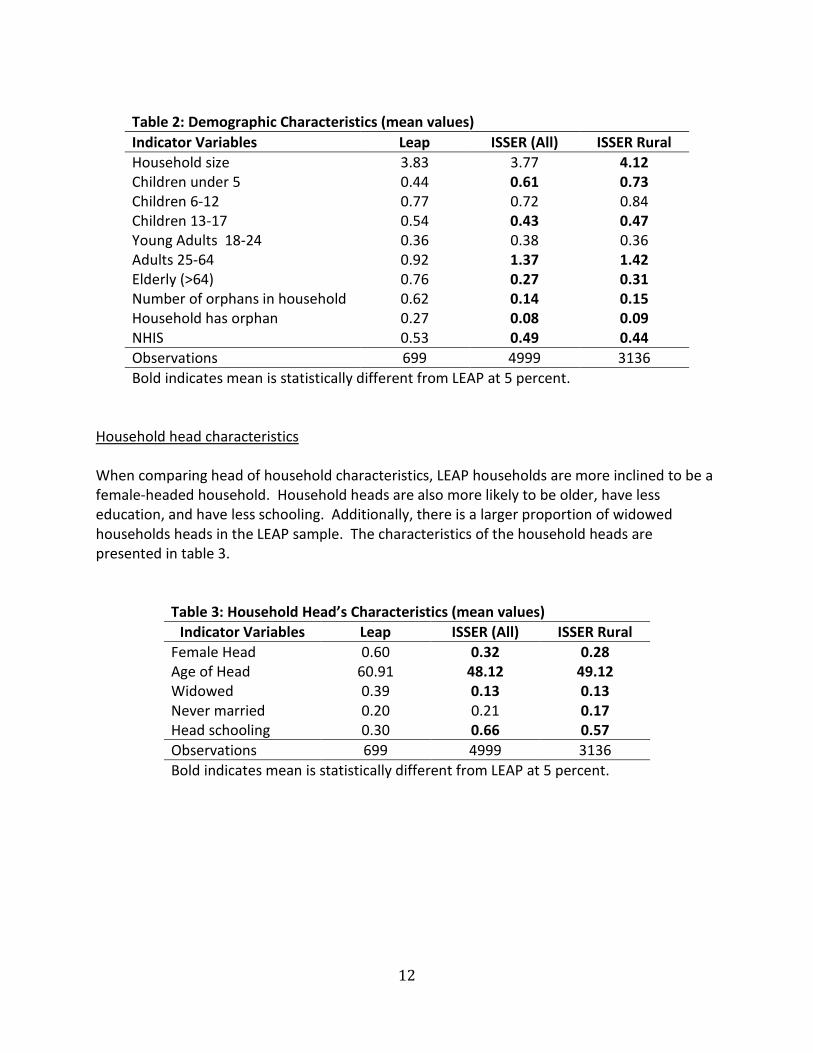
Table 2: Demographic Characteristics (mean values) Indicator Variables Leap ISSER (All) ISSER Rural Household size 3.83 3.77 4.12 Children under 5 0.44 0.61 0.73 Children 6-12 0.77 0.72 0.84 Children 13-17 0.54 0.43 0.47 Young Adults 18-24 0.36 0.38 0.36 Adults 25-64 0.92 1.37 1.42 Elderly (>64) 0.76 0.27 0.31 Number of orphans in household 0.62 0.14 0.15 Household has orphan 0.27 0.08 0.09 NHIS 0.53 0.49 0.44 Observations 699 4999 3136 Bold indicates mean is statistically different from LEAP at 5 percent.
Household head characteristics When comparing head of household characteristics, LEAP households are more inclined to be a female-headed household. Household heads are also more likely to be older, have less education, and have less schooling. Additionally, there is a larger proportion of widowed households heads in the LEAP sample. The characteristics of the household heads are presented in table 3.
Table 3: Household Head’s Characteristics (mean values) Indicator Variables Leap ISSER (All) ISSER Rural
Female Head 0.60 0.32 0.28 Age of Head 60.91 48.12 49.12 Widowed 0.39 0.13 0.13 Never married 0.20 0.21 0.17 Head schooling 0.30 0.66 0.57 Observations 699 4999 3136 Bold indicates mean is statistically different from LEAP at 5 percent.
12

Housing Characteristics Based on comparing the sample means of housing characteristics, the LEAP households appear to be poorer than ISSER rural households (see table 4). LEAP households are more likely to share housing and typically do not have an exclusive kitchen. Housing in LEAP households is also less likely to be made of cement and more likely to have thatched roofs. As expected, both the rural ISSER and LEAP households have less access to protected water sources and LEAP households have a lower proportion of households with a pit latrine. The overall per capita monthly spending is significantly lower in LEAP households at G¢ 46 compared to 67 in the rural ISSER sample. At the time of the survey the exchange rate was approximately 1USD:1.44 so this translates to USD31.94 per person or month or about USD1 per person per day. Note that the median (50th percentile) is significantly lower at around G¢ 37 per person per month or 85 US cents per person per day; the lower median (relative to the mean) is because of five particularly large consumption values in the LEAP sample.3 Rural ISSER households were the most likely to own livestock (57 percent) compared to 41 percent among LEAP households.
Table 4: Housing Characteristics (mean values) Indicator Variables Leap ISSER (All) ISSER Rural
No kitchen 0.09 0.05 0.03 No toilet 0.31 0.27 0.37 Pit latrine 0.38 0.41 0.46 Cement walls 0.30 0.57 0.40 Cement floors 0.62 0.80 0.71 Thatch roof 0.31 0.13 0.20 Crowding 0.69 0.70 0.68 Shared dwelling 0.29 0.24 0.24 Exclusive kitchen 0.31 0.52 0.58 Unprotected water source 0.21 0.16 0.24 Per capita monthly spending (G¢) 46.61 81.80 67.05 Livestock owned 0.41 0.41 0.57 Observations 699 4999 3136 Bold indicates mean is statistically different from LEAP at 5 percent.
3 The five outliers range from Gc190 to Gc362 per capita per month.
13

Table 5: Outcome variable across LEAP and ISSER Samples (mean values) Outcome Variables Leap ISSER (All) ISSER Rural Enrollment Age 6-12 (N=505) 0.96 0.98 0.98 Age 13-17 (N=351) 0.88 0.92 0.91 Age 6-17 (N=856) 0.93 0.96 0.95 Boys age 13-17 (N=158) 0.90 0.94 0.93 Girls age 13-17 (N=193) 0.86 0.90 0.89 Any missed school days (N=913) 0.21 0.14 0.15 Repeat grade (N=903) 0.19 0.13 0.13 Ravens’ score (N=691) 4.29 4.85 4.55 Illness in last month (N=1225) 0.10 0.07 0.07 Curative services (N=120) 0.59 0.56 0.53 * Observations (N) presented are for the LEAP sample. Bold indicates mean is statistically different from LEAP at 5 percent.
Table 5 shows means for selected child level impact indicators by sample. School enrolment rates are extremely high in Ghana so there appears to be very little room to improve this outcome except possibly for secondary school children. Most indicators are lower (worse) among LEAP households except for curative health care, which is actually higher; this is consistent with the higher rate of health insurance coverage among LEAP households. Comparisons with GLSS5 We also provide comparisons of key variables using the most recent GLSS data available to us (2005-06, or GLSS5). Table 6 shows that LEAP households are poorer than GLSS households and are somewhat poorer that poor rural households in GLSS as well. This is true whether we use the national poverty lines or convert the reported consumption figures to USD at the prevailing exchange rates at the time and benchmark the proportion of people living below 2, 1 and half a U.S. dollar per person per day. Using the national upper line for example, the rural poverty rate is 26 percent as reported in GLSS5 while 38 percent of LEAP households fall below this line. Using the US dollar lines does not change this basic result; for example 51 percent of LEAP participants fall below the dollar-a-day line compared to 28 percent of all Ghanaians (in 2005-06) and 39 percent of poor rural Ghanaians. Assuming there have been improvements in poverty over the last four years, these differences would be even larger in 2010 when the LEAP households were surveyed. In other words, the results in the table under-estimate the difference in poverty between the GLSS and LEAP households.
14

Table 6: Poverty comparisons with GLSS5 (%) LEAP All GLSS Rural GLSS National line (upper) 62 29 39 National line (lower) 38 18 26 USD2 per day or below 85 66 79 USD1 per day or below 51 28 39 Columns 2 and 3 are calculated by the authors from the Ghana Living Standard Survey 2005-06. The national upper and lower lines are old cedis 3,708,900 and 2,884,700 per year respectively in 2006. These are converted to new cedis and inflated to 2010 using a factor of 1.876 (upper) and 1.639 (lower). The USD exchange rate used for GLSS5 is 0.909 while the rate used for LEAP 2010 is 1.44. Both LEAP and GLSS welfare measures are in adult equivalent terms. Table 7B compares household characteristics between LEAP and GLSS households and shows clearly how LEAP selects a unique group of not just poor but also vulnerable households for program eligibility. LEAP household heads are significantly older than their poor rural counterparts (61 versus 48 years of age) and more likely to be female (60 percent versus 17). LEAP households are significantly smaller than poor rural households in Ghana, and have fewer children, but have more children who do not live with their parents (e.g. orphans).4 Similar selection processes occur in the cash transfer programs in Malawi and Kenya—those households are also poorer than average, but have also have atypical characteristics for poor households, being smaller, with fewer children and older, usually female heads. Table 7 A: Poverty comparisons with ISSER (%) LEAP All ISSER Rural ISSER National line (upper) 62 42 50 National line (lower) 38 21 26 USD2 per day or below 85 69 78 USD1 per day or below 51 31 37 The national upper and lower lines are old cedis 3,708,900 and 2,884,700 per year respectively in 2006. These are converted to new cedis and inflated to 2010 using a factor of 1.876 (upper) and 1.639 (lower). The USD exchange rate used for 2010 is 1.44. Both LEAP and ISSER welfare measures are in adult equivalent terms.
4 GLSS5 does not ask whether the child’s parents are dead so a direct measure of orphan status cannot be constructed. The indicator shown in this table represents orphans and fostered children, and is calculated similarly in both surveys.
15

Table 7 B: Comparisons of household Characteristics with GLSS5 (mean values) LEAP GLSS Rural GLSS Rural Poor Age of head 61 47 48 Head is female 0.60 0.25 0.17 Head attended school 0.30 0.53 0.35 Household size 3.8 4.7 6.3 # Children 0-17 1.8 2.4 3.4 # Children not living with a parent 1.2 0.76 0.90 Own livestock 0.41 0.61 0.71 Observations 699 5069 1806 Columns 2 and 3 are calculated by the authors from the Ghana Living Standard Survey 2005-06
6. Selection of Comparison Groups In this section we use the ISSER national sample to identify a comparison group that can be used for the quantitative impact evaluation. The approach we use is propensity score matching (PSM). The key feature of this approach is that is uses a set of characteristics that are thought to influence eligibility for LEAP, combines these into a score which indicates the likelihood or ‘propensity’ to be eligible for the program, and then ‘matches’ households using this score. The procedure is done in three steps. First, we identify a list of characteristics that are thought to influence the probability of qualifying for LEAP. These will include measures of both monetary (such as per capita consumption) and non-monetary well-being, demographic characteristics especially presence of orphans, and head’s characteristics. Second, the propensity score for each household in LEAP and ISSER is estimated. Finally, each LEAP household is paired with a ISSER household with the closest score. There are a several strategic decisions that can influence the quality of matches using the PSM technique. Two relevant decisions for this study are whether to allow ISSER households to be paired with more than one LEAP households (the issue of ‘replacement’ into the pool) and whether to restrict matches to households from the same or adjacent regions of the country as the LEAP sample. Recall the LEAP sample comes exclusively from three regions (Volta, Brong Ahafo and Central). We try all combination of approaches and find that using households from all regions of Ghana and matching without replacement provides the best comparison group for the LEAP households. We define ‘best’ as the sample that most closely resembles LEAP in terms measurable demographic and welfare indicators. The graph below shows the distribution of the propensity score (also referred to as the balancing score) for LEAP and ISSER households when allowing matches to come from the entire ISSER rural sample. If we interpret this score as the propensity or likelihood of being eligible for LEAP we see that the scores are significantly higher for LEAP households as we would expect. The key question is whether there is any area of overlap in the two
16

distributions—are there some ISSER households with similar or identical scores to all or most LEAP households? The answer to this is yes; despite the fact that the distribution of the ISSER sample is shifted to the left of the LEAP sample there are clearly households with overlapping scores indicating the potential for finding a comparison group. As mentioned above, we have repeated this exercise limiting the ISSER comparison group to the same three LEAP regions, and to come from these three plus three adjacent regions (Ashanti, Eastern and Greater Accra). The distributions of the propensity scores for these additional analyses are presented in the Appendix.
Table 8 shows the results of the matching exercise for the three different approaches. In this table we compare the mean characteristics of LEAP households with the respective matched samples; for comparison purposes we also include means for the full ISSER rural sample to highlight the power of the PSM technique. For the purpose of the comparison in Table 8, households from the national rural sample are presented as ISSER Rural. Comparison households identified by PSM are presented under the heading: ISSER Matched Samples. The heading “ISSER matched households: All rural regions” represent the means for comparison households identified by PSM using rural households from all regions of Ghana. “Six regions” represent the means for comparison households identified by PSM using rural households from six regions of Ghana only, which include the three LEAP regions and three adjacent regions. “Three regions” present the means for PSM matched households using only the three LEAP regions.
0.1
.2.3
-10 -5 0 5 -10 -5 0 5
YALE LEAP
Den
sity
LEAP EvaluationGraphs by 1=T, 0=comparison
Distribution of Balancing Score by Sample - All Regions
17

Means from the matched samples that are statistically different from LEAP are in bold for ease of assessment. Thus the best comparison group is the one that is most similar to LEAP on these measured characteristics. It is clear from Table 8 that the best comparison group is the one that is selected from the entire ISSER rural sample where only six out of the 26 indicators shown in the table are statistically significant. In contrast, the matched sample drawn from only the same three regions is quite different from the LEAP sample, with all but six indicators being statistically different from LEAP households.
Table 8: PSM comparison of matched samples without replacement (mean values) ISSER Matched Samples
Indicator Variables Leap ISSER Rural
All Rural Regions
Six Regions
Three Regions
Demographics Household size 3.83 4.12 3.70 3.70 3.54 Children under 5 0.44 0.73 0.37 0.48 0.56 Children 6-12 0.77 0.84 0.75 0.77 0.70 Children 13-17 0.54 0.47 0.54 0.50 0.40 Young Adults 18-24 0.36 0.36 0.40 0.36 0.31 Adults 25-64 0.92 1.42 0.86 0.97 1.19 Elderly (>64) 0.76 0.31 0.77 0.61 0.38 Number of orphans 0.62 0.15 0.42 0.31 0.15 Orphan living in hhld 0.27 0.09 0.24 0.18 0.10 NHIS 0.53 0.44 0.51 0.47 0.44 Head characteristics Female Household 0.60 0.28 0.59 0.53 0.44 Age of Head 60.91 49.12 62.08 58.57 52.94 Widowed 0.39 0.13 0.38 0.29 0.20 Never married 0.20 0.17 0.24 0.23 0.23 Head schooling 0.30 0.57 0.37 0.50 0.58
Household characteristics No kitchen 0.09 0.03 0.08 0.07 0.04 No toilet 0.31 0.37 0.32 0.29 0.27 Pit latrine 0.38 0.46 0.40 0.45 0.50 Cement walls 0.30 0.40 0.36 0.40 0.40 Cement floors 0.62 0.71 0.65 0.67 0.68 Thatch roof 0.31 0.20 0.26 0.22 0.23 Crowd 0.69 0.68 0.73 0.72 0.70 Shared dwelling 0.29 0.24 0.27 0.24 0.15 Exclusive kitchen 0.31 0.58 0.35 0.39 0.41 Unprotected Water Source 0.21 0.24 0.22 0.21 0.28 Per capita spending (GH) 46.61 67.05 47.57 50.75 56.70 Livestock owned 0.41 0.57 0.44 0.43 0.44 N=699 N=3136 N=699 N=699 N=699 Bold indicates mean is statistically different from LEAP at 5 percent.
18

Table 8 illustrates the power of the PSM technique. Notice how the technique pulls a sub-sample of households within the ISSER survey that better resembles LEAP households. For example, LEAP households have on average 0.76 elderly members compared to 0.31 in the full ISSER rural sample. However the ISSER matched sample contains 0.77 elderly when using matches from the entire country; even when we restrict our matches to three or six regions we still manage to obtain a comparison group that has more elderly than the full ISSER rural s ample. This is the case for almost all other indicators shown in the table—the matching technique is able to select a sub-group of households that most resemble LEAP households, and which can then be used as a comparison group to assess program impacts. Based on the results in Table 8, picking a matched sample from all rural regions appears to be the best approach A key defining characteristic of LEAP households is that they contain many more orphans than an average household in rural Ghana. For this one particular characteristic the PSM technique is not quite able to perfectly match the mean number of orphans in LEAP households (0.62) although the mean of 0.42 in the preferred comparison group is almost three times higher than the full rural ISSESR sample mean of 0.15. However the proportion of households with any orphan is about the same in the matched sample (0.24) as it is in the LEAP sample (0.27). Table 9 A presents means for some key child level impact indicators for LEAP and matched comparison group samples. With the exception of the Ravens test score and curative care, all the indicators in the preferred matched sample move closer towards the LEAP values compared to the all rural sample and most are reasonably close to LEAP values. Note that these values do not necessarily need to be identical since the evaluation design entails comparing the change in these outcomes from baseline to follow-up, rather than the levels themselves. On the other hand, if starting levels are large then the effort to achieve a similar absolute change may be different.
19

Table 9 A: Comparison of outcomes by matched samples (mean values)
Outcome Variables
Leap
ISSER Rural
Matched Samples
All Rural Regions
Six Regions
Three Regions
Enrollment Age 6-12 (N=505) 0.96 0.98 0.96 0.98 0.98 Age 13-17 (N=351) 0.88 0.91 0.89 0.91 0.92 Age 6-17 (N=856) 0.93 0.95 0.93 0.95 0.96 Boys age 13-17 (N=158) 0.90 0.93 0.90 0.91 0.90 Girls age 13-17 (N=193) 0.86 0.89 0.88 0.91 0.93 Any missed school days (N=913) 0.21 0.15 0.15 0.17 0.13 Repeat grade (N=903) 0.19 0.13 0.16 0.13 0.10 Ravens’ score (N=691) 4.29 4.55 4.83 4.68 4.92 Illness in last month (N=1225) 0.10 0.07 0.07 0.07 0.05 Curative services (N=120) 0.59 0.53 0.48 0.50 0.52 * Observations (N) presented are for the LEAP sample. Bold indicates mean is statistically different from LEAP at 5 percent.
Table 9 B: Comparison of outcomes by matched samples (mean values) Outcome Variables
Leap
ISSER Rural
Matched Samples All Rural Regions
Six Regions
Three Regions
Use fertilizer/pesticides (Binary) 0.15 0.36 0.23 0.23 0.24 Sell crops (Binary) 0.31 0.51 0.38 0.43 0.43 Have non-farm enterprise (Binary) 0.29 0.29 0.27 0.30 0.34 Total number of hoes 1.72 2.17 1.9 1.62 1.85 Total number of axes 0.37 0.34 0.28 0.29 0.30 Total number of rakes 0.06 0.05 0.04 0.03 0.03 Total number of shovels 0.09 0.24 0.15 0.12 0.17 Total number of pick 0.10 0.18 0.12 0.11 0.10 Total number of sickle 0.07 0.33 0.23 0.08 0.02 Total number of cutlass 1.42 2.06 1.71 1.81 1.95 Total days of casual labor 4.94 5.45 4.28 4.81 4.09 Total hours of casual labor 4.84 5.62 4.31 4.82 5.01 Total number of casual laborers 2.41 4.19 2.86 2.83 3.06 N=699 N=3136 N=699 N=699 N=699 Bold indicates mean is statistically different from LEAP at 5 percent.
20

Table 10: Distribution of LEAP and ISSER matched households All Six Regions Three regions LEAP (1) (2) (3) (4) N (%) N (%) N (%) N (%) Western 47 6.7 Central 82 11.7 105 15.0 186 26.6 176 25.2 Greater Accra 19 2.7 29 4.1 Volta 115 16.5 172 24.6 298 42.6 82 11.7 Eastern 83 11.9 125 17.9 Ashanti 104 14.9 161 23.0 Brong Ahafo 66 9.4 107 15.3 215 30.8 441 63.1 Northern 85 12.2 Upper East 52 7.4 Upper West 46 6.6 N 699 100 699 100 699 100 699 100
Table 10 shows the regional distribution of matched households for each of the three PSM approaches while the distribution of the actual LEAP evaluation sample is shown in the last column. The ‘best’ matched comparison group is the one that uses households from the entire country and this distribution is shown in column (1). Surprisingly, only 37 percent of these households come from the three LEAP districts and a large percentage comes from Ashanti (15) and Northern (12.2) regions. Apparently good matches for LEAP households can be found throughout rural Ghana. Conversely, the ISSER sample is simply not large enough in the three evaluation districts (N=959) for us to obtain good matches using only households in those districts. However, picking matches from geographically diverse areas has its own limitations in that agro-ecological conditions, relative prices and natural disasters (floods, crop disease, drought) may differentially affect the two groups of households and thus confound treatment effects. We indicated earlier that a strategy of ‘no-replacement’, where an ISSER household can only be used as a match once, was the preferred approach in this study. The results when we allow ISSER households to be matched multiple times (i.e. to be replaced back into the pot and matched again if necessary) are shown in the Appendix. The sample size of the matched comparison group shrinks considerably when we use this approach; in the all-Ghana analysis the resulting matched sample consists of 396 households only. We believe this sample is too small to provide sufficient power for the impact evaluation and so do not propose using this approach. In addition, as the Appendix demonstrates, the characteristics of this (smaller) matched group are no closer to those of the LEAP households than when we adopt the ‘no replacement’ approach, so there is no compelling reason to favor the ‘with replacement’ approach. To address contamination bias, all households in the follow-up survey in 2012 will be asked to complete the LEAP operational module of the questionnaire. Each of the comparison and LEAP households will be asked filter question on whether they had heard of LEAP. Households will
21

then be asked whether they had ever received a LEAP payment. This will identify LEAP households that have never heard of the program or had heard of the program but never received a LEAP payment. In addition, this will allow us to identify ISSER households that reported having received payments from the LEAP program, which would indicate possible contamination of the comparison group. Contaminated ISSER households and LEAP households never receiving LEAP payments will be dropped from the final impact analysis sample.
7. Prediction of Program Impacts We assess the potential impact of the cash transfer by using the baseline evaluation data to estimate the relationship between total per capita household expenditure and some of the key impact indicators shown in the Conceptual Framework (Section 2, Figure 1). For each indicator, we apply regression analysis to estimate the relationship between an outcome and total per capita expenditure controlling for age and sex of the child (for child-level indicators), head’s sex and region (Volta, Central, Brong Ahafo). Because units of measure are not the same across outcomes, we report the Standard Deviation (SD) of the effect for a one SD increase in per capita expenditure to easily compare the relative magnitude of potential program effects across different outcomes. The potential impact of LEAP depends on two key factors: the amount of cash provided to the household and the strength of the effect of income (or total expenditures) on the outcome of interest. For example, if a particular outcome does not vary with income, LEAP is not expected to have an effect on that outcome. This is the case for primary school enrollment, which is nearly universal and thus does not vary with income. In this section we estimate these ‘total expenditure’ or ‘income’ effects to see which outcomes might respond to increases in cash—this is where LEAP may have an impact. For outcomes where there is a large income effect, the actual magnitude of change evoked by LEAP will depend on the size of the change in income—the value of the cash transfer. Here the prospects are not very promising. Given the profile of LEAP households the mean transfer value is G 12 per month or G in per capita terms since mean household size is 3.83. This represents only a 0.10 SD increase and is roughly 7 percent of mean per capita monthly expenditure of LEAP households--one of the lowest transfer values in the world. For example, the new Child Support Grant in Zambia transfers about 30 percent of mean per capita expenditure to households, the value of the Kenya CT-OVC is about 20 percent of household expenditure, and the Social Cash Transfer Scheme in Malawi transfers 30 percent of mean expenditure to recipients. Indeed a rough rule-of-thumb is that a program should endeavor to transfer at least 20 percent of mean consumption to the household in order to induce meaningful behavioral change5. With a transfer value well below 10 percent, LEAP can expect
5 UNICEF 2008. Social Protection in Eastern & Southern Africa: A Framework and Strategy for UNICEF. UNICEF Eastern & Southern Africa Regional Office, Nairobi, Kenya.
22

very little meaningful impact on household behavior and in fact, the value of the transfer is so low that it may not even exceed the total administrative cost of making the payment itself. Table 11 shows the results of this exercise for a range of schooling and health outcomes and for a few expenditure categories. As hinted above, the predicted impact of LEAP in virtually nil on primary school enrollments as we would expect since this is universal in Ghana. There are potentially ‘interesting’ impacts for older boys and for older girls from the poorest LEAP households but these are still small. For example, the impact on school enrolment of boys age 13-17 is 0.51 percentage points while for girls 13-17 in the poorest households it is 1.82 percentage points (we found no evidence of heterogeneous impacts among boys 13-17 in poorer households). The SD impacts in column (1) are large for these outcomes, especially for girls, but the value of the LEAP transfer is so low that it is hard to generate a large behavior change. If LEAP were to triple its benefit size, it would still only transfer about 21 percent of mean income, the minimum amount thought to be necessary to induce behavioral change. In this scenario the predicted impact on older girls’ school enrolment is 5.5 percentage points which is in line with successful programs such as Mexico’s Progresa, Colombia’s Familias en Accion, South Africa’s Child Support Grant and Kenya’s CT-OVC. Table 11: Predicted impact of LEAP on Selected Outcomes (1) (2) (3) Outcome Impact in SD
Units Baseline mean Actual Impact
School enrollment 6-17
0.025
0.93
0.0004
6-12 0.006 0.96 0.0000 13-17 0.049 0.88 0.0016 13-17 boys 0.154 0.90 0.0051 13-17 girls in poorest 50 percent of households
0.550 0.86 0.0182
Ravens test score (range is 0 – 7) 0.140 4.29 0.0020 Incomplete school attendance—poorest 50 percent
0.340 0.24 0.0139
Grade repetition 13-17 0.110 0.19 0.0050 Morbidity last 2 weeks 0.013 0.10 0.0003 Curative care if sick 0.300 0.59 0.0147 Household food spending G 0.839 31.53 2.10 Household health spending G 0.411 4.29 0.36 Household education spending G 0.029 1.94 0.01 Column 1 shows the impact of a one SD change in expenditure per capita on the outcome in SD units of the outcome. Column 2 shows the actual baseline mean of the indicator. Column 3 translates that impact in column (1) into the change in the outcome in its own units given that LEAP transfers 0.1 SD to the household. The formula is given by the product of 0.1 times the effect in column 1 times the SD of the outcome, which is calculated from the LEAP baseline survey on LEAP households only.
23

For poor households receiving cash transfers, the largest direct impact is typically felt on consumption. Recent evidence from the Kenya Cash Transfer for Orphans & Vulnerable Children (Kenya CT-OVC) for example show an increase in monthly consumption that is almost equivalent to the transfer level, though with significant shifts in the composition of consumption6. Similar results are found for Mexico’s Progresa program7. It is thus of interest to study in greater detail the potential impacts of the program on consumption behavior. Using the economic theory of consumer demand, we estimate a system of demand equations for seven mutually exclusive expenditure groups, relating each one to total per capita expenditure. Using these equations, we can calculate theoretically consistent responses (referred to as “elasticities” in economic theory) to the change in total per capita expenditure associated with the cash transfers under the LEAP.8 Given the average transfer per person to the household (G 3.10 per person per month or a 7 percent increase in mean per capita expenditure), the average level of spending on each item at baseline, and the estimated “response,” we can calculate the expected change in consumption due to the program.9 Appendix 6 provides further details on this methodology. Table 12 provides these estimates for seven broad budget categories. The first column shows the predicted impact of the program in Cedis, while the second column reports the share of the transfer that is devoted to each item. Notice that the sum of each individual impact in column 1 is constrained to sum to approximately the mean value of the transfer (our estimate is G 3.75, well within the confidence bound of G 3.10, the actual mean value)—this is a crucial aspect of the estimation approach. Based on preprogram behavior and the assumption that behavior is stable (i.e., household preferences do not change drastically over time), about 68 percent of the increase in cash will be devoted to food, 9.2 percent to health and hygiene, 5.36 percent to fuel (including charcoal, wood and kerosene), and 5 percent on gifts and donations. Very little of the additional cash will be spent on clothing (3.8 percent). In most cases the allocation of LEAP funds is very similar to the existing allocation of the household budget shown in the last column but there are some differences, most notably gifts and donations. Only 2.5 percent of the existing budget is devoted to this item while we predict that almost 5 percent of the LEAP cash will be spent on gifts and donations.
6 This section is adapted from Kenya CT-OVC Evaluation Team 2012. “The impact of the Kenya CT-OVC on household spending,” Journal of Development Effectiveness, Vol.4(1): 9-37. 7 Hoddinott, John and Emmanuel Skoufias, 2004. “The Impact of Progresa on Food Consumption.” Economic Development & Cultural Change, Vol 59(1): 187-229. 8 The estimates are theoretically consistent in that they do not violate the budget constraint. That is, the sum of the predicted responses should not exceed the total amount of additional money provided by the program (G 3.10 per person per month). 9 Mathematically, the estimated response (or elasticity) for each item, measured in percent terms, is multiplied by the percent increase in mean per capita expenditure implied by the program (7 percent) to get the total impact of the program on that item in percent terms. This total impact is multiplied by the actual mean level of spending to obtain the predicted impact in cedis.
24
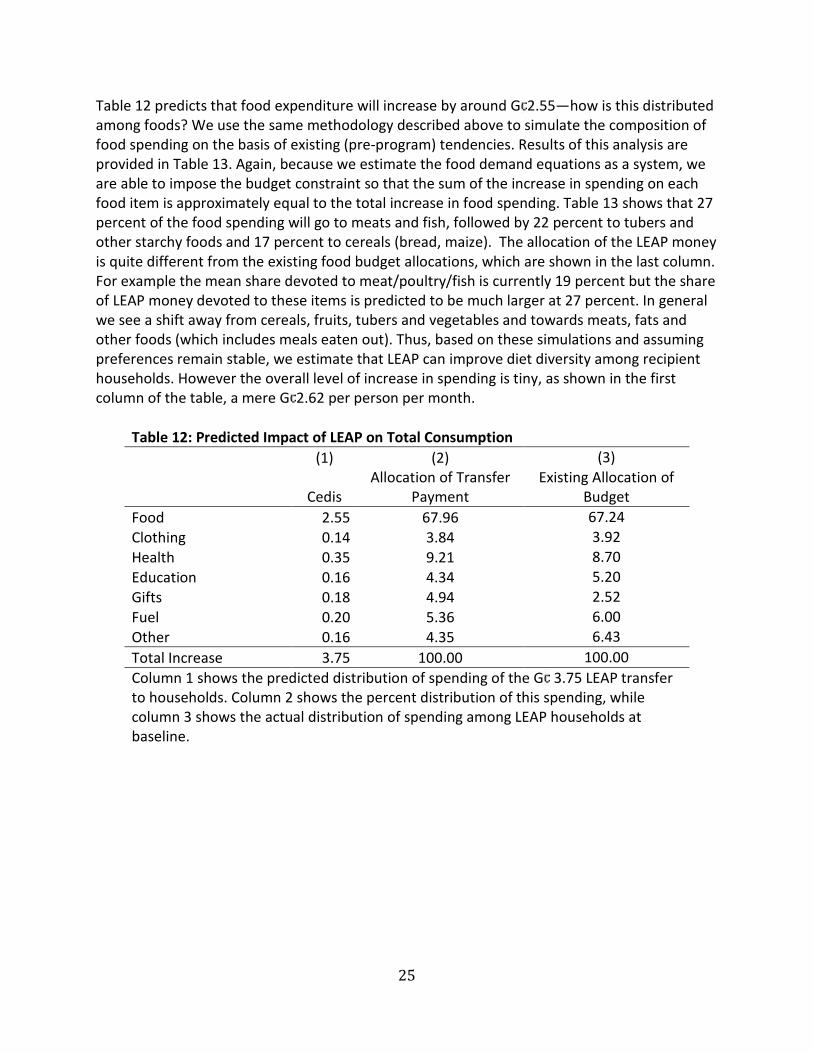
Table 12 predicts that food expenditure will increase by around G 2.55—how is this distributed among foods? We use the same methodology described above to simulate the composition of food spending on the basis of existing (pre-program) tendencies. Results of this analysis are provided in Table 13. Again, because we estimate the food demand equations as a system, we are able to impose the budget constraint so that the sum of the increase in spending on each food item is approximately equal to the total increase in food spending. Table 13 shows that 27 percent of the food spending will go to meats and fish, followed by 22 percent to tubers and other starchy foods and 17 percent to cereals (bread, maize). The allocation of the LEAP money is quite different from the existing food budget allocations, which are shown in the last column. For example the mean share devoted to meat/poultry/fish is currently 19 percent but the share of LEAP money devoted to these items is predicted to be much larger at 27 percent. In general we see a shift away from cereals, fruits, tubers and vegetables and towards meats, fats and other foods (which includes meals eaten out). Thus, based on these simulations and assuming preferences remain stable, we estimate that LEAP can improve diet diversity among recipient households. However the overall level of increase in spending is tiny, as shown in the first column of the table, a mere G 2.62 per person per month.
Table 12: Predicted Impact of LEAP on Total Consumption
(1) (2) (3)
Cedis
Allocation of Transfer Payment
Existing Allocation of Budget
Food 2.55 67.96 67.24 Clothing 0.14 3.84 3.92 Health 0.35 9.21 8.70 Education 0.16 4.34 5.20 Gifts 0.18 4.94 2.52 Fuel 0.20 5.36 6.00 Other 0.16 4.35 6.43 Total Increase 3.75 100.00 100.00 Column 1 shows the predicted distribution of spending of the G 3.75 LEAP transfer to households. Column 2 shows the percent distribution of this spending, while column 3 shows the actual distribution of spending among LEAP households at baseline.
25

Table 13: Predicted Impact of LEAP on Food Consumption
Cedis
Allocation of LEAP Payment
Existing Budget Allocation
Cereals 0.44 16.67 21.75 Tubers 0.57 21.65 23.60 Pulses 0.17 6.43 6.59 Fruits 0.04 1.54 3.61 Meats 0.71 26.97 18.88 Dairy 0.05 1.92 1.24 Fats 0.16 5.93 3.61 Veg 0.34 12.83 14.58 Other 0.14 5.33 4.91 Alcohol, Tobacco 0.02 0.73 1.24 Total Increase 2.62 100.00 100.00 See text and notes to Table 12 above for explanation.
8. Main Conclusions LEAP households are poorer than the national average, and have unique characteristics. Sixty-two percent of LEAP households are below the upper poverty line compared to 29 percent of households in GLSS5 and 39 percent of rural households in GLSS5. Mean per capita expenditure is G¢47 per person per month or about 1 U.S. dollar per day using the prevailing exchange rate of 1.44 in early 2010 and 85 percent of LEAP households have a consumption level that is less than U.S.$ 2 per person per day. Unlike the generally poor in Ghana, LEAP households are significantly smaller, have fewer young children, but more orphans. LEAP household heads also tend to be much older, female and less likely to be married. It is possible to identify a viable comparison group from the ISSER sample using Propensity Score Matching (PSM). This comparison group, drawn from all regions of Ghana, has very similar background characteristic to LEAP households and very similar child level outcomes. The value of the LEAP transfer is low by international standards. LEAP transfers approximately 7 percent of mean per capita expenditure to its beneficiaries, one of the lowest values in the world. These values for programs in Kenya, Zambia, South Africa, Mexico and Colombia range from 20-30 percent of the mean consumption of participants.
26

LEAP has the potential to impact several key human development indicators including girls’ secondary school enrolment, curative health care, school attendance, and household diet diversity. This is because the relationship between these indicators and total household spending is strong among LEAP households. However, because the value of the transfer is low, the actual predicted impact of LEAP on these outcomes is low. Expected impacts would rise to levels comparable to other successful programs if the value of the LEAP transfer were increased by at least three times and preferably four times its current value. For example, tripling the value of the transfer is predicted to increase girls’ secondary school enrolment by 5.5 percentage points, and effect size that is comparable to other successful programs around the globe. Note that LEAP does not impose punitive conditions like many Latin American cash transfer programs.
27

Appendix 1: Means of matched samples with and without replacement
Indicator Variables Leap ISSER
Rural
Matched Samples Without Replacement
Matched Samples With Replacement
All Rural Regions
Six Regions
Three Regions
All Rural Regions
Six Regions
Three Regions
Demographics Household size 3.83 4.12 3.70 3.70 3.54 3.92 3.87 3.51 Children under 5 0.44 0.73 0.37 0.48 0.56 0.49 0.50 0.44 Children 6-12 0.77 0.84 0.75 0.77 0.70 0.78 0.81 0.68 Children 13-17 0.54 0.47 0.54 0.50 0.40 0.54 0.54 0.48 Young Adults 18-24
0.36 0.36 0.40 0.36 0.31 0.39 0.39 0.38
Adults 25-64 0.92 1.42 0.86 0.97 1.19 1.02 0.98 0.99 Elderly (>64) 0.76 0.31 0.77 0.61 0.38 0.70 0.65 0.58 Number of orphans
0.62 0.15 0.42 0.31 0.15 0.40 0.33 0.26
Has Orphan living in hhld
0.27 0.09 0.24 0.18 0.10 0.24 0.18 0.18
Head characteristics Female Household
0.60 0.28 0.59 0.53 0.44 0.53 0.50 0.56
Age of Head 60.91 49.12 62.08 58.57 52.94 60.23 60.23 59.33 Widowed 0.39 0.13 0.38 0.29 0.20 0.33 0.31 0.30 Never married 0.20 0.17 0.24 0.23 0.23 0.18 0.19 0.24 Head schooling 0.30 0.57 0.37 0.50 0.58 0.39 0.49 0.48 Household characteristics No kitchen 0.09 0.03 0.08 0.07 0.04 0.06 0.06 0.06 No toilet 0.31 0.37 0.32 0.29 0.27 0.33 0.27 0.26 Pit latrine 0.38 0.46 0.40 0.45 0.50 0.40 0.47 0.44 Cement walls 0.30 0.40 0.36 0.40 0.40 0.37 0.42 0.40 Cement floors 0.62 0.71 0.65 0.67 0.68 0.66 0.68 0.66 Thatch roof 0.31 0.20 0.26 0.22 0.23 0.23 0.20 0.22 Crowd 0.69 0.68 0.73 0.72 0.70 0.70 0.69 0.72 Shared dwelling 0.29 0.24 0.27 0.24 0.15 0.26 0.24 0.17 Exclusive kitchen 0.31 0.58 0.35 0.39 0.41 0.41 0.39 0.38 Unprotected Water Source
0.21 0.24 0.22 0.21 0.28 0.22 0.20 0.21
Per capita spending (Cedis)
46.61 67.05 47.57 50.75 56.70 47.97 50.68 54.01
Livestock owned 0.41 0.57 0.44 0.43 0.44 0.47 0.43 0.45 Observations 699 3136 699 699 699 396 337 259
28

Appendix 2: Propensity score logit model estimation All Regions Six Regions Three Regions
Variable Coefficients Standard Error
Coefficients Standard Error
Coefficients Standard Error
lnexp 2.10 (0.48) 2.50 (0.54) 2.11 (0.55) hhld does not cook 0.87 (0.25) 0.90 (0.27) 1.05 (0.32) no toilet facility used -1.08 (0.15) -0.29 (0.17) -0.20 (0.19) pit toilet -0.86 (0.15) -1.02 (0.16) -0.76 (0.19) outer walls of cement -0.61 (0.21) -0.93 (0.22) -0.48 (0.25) floor made of cement -0.12 (0.13) 0.13 (0.15) -0.06 (0.18) thatch roof 0.78 (0.22) 0.85 (0.25) 0.42 (0.28) crowd -0.82 (0.30) -0.37 (0.31) 0.90 (0.46) Shared dwelling 0.38 (0.12) 0.90 (0.14) 1.22 (0.17) badly damaged 0.82 (0.23) 1.07 (0.26) 0.67 (0.29) dirty surroundings 1.26 (0.21) 1.09 (0.24) 1.06 (0.29) exclusive cooking room -0.91 (0.12) -0.67 (0.14) -0.33 (0.17) unprotected 0.00 (0.14) -0.24 (0.16) -0.79 (0.18) lnsize 0.09 (0.21) 0.51 (0.23) 1.04 (0.28) hasorphan 1.02 (0.15) 1.09 (0.17) 1.14 (0.20) age of head -0.11 (0.07) -0.12 (0.07) -0.14 (0.08) headage2 0.00 (0.00) 0.00 (0.00) 0.00 (0.00) headage3 0.00 (0.00) 0.00 (0.00) 0.00 (0.00) fhh 0.90 (0.14) 0.70 (0.15) 0.60 (0.17) residents age 0-5 -0.24 (0.08) -0.22 (0.09) -0.20 (0.11) residents age 6-12 -0.01 (0.07) 0.03 (0.08) 0.07 (0.10) residents age 13-17 -0.04 (0.09) -0.06 (0.10) 0.04 (0.12) residents age 65+ 0.78 (0.12) 1.04 (0.14) 1.12 (0.17) widow 0.37 (0.18) 0.50 (0.20) 0.52 (0.22) nevermar 0.44 (0.17) 0.39 (0.18) 0.37 (0.21) lnexp2 -0.34 (0.07) -0.38 (0.07) -0.34 (0.08) Scores for factor 1 0.30 (0.20) 0.26 (0.21) -0.06 (0.24) ln_lstock -0.20 (0.05) -0.14 (0.05) -0.17 (0.06) Constant -2.56 (1.45) -4.13* (1.61) -3.72 (1.77) Observations 3768 2613 1612 Pseudo R2 0.31 0.34 0.35 Note. Logit estimated on the combined LEAP evaluation and ISSER national rural samples. Households in the LEAP evaluation sample are given a value of one, and those in the ISSER national rural sample, zero.
29

Appendix 3: Distribution of LEAP and comparison households with replacement
All Regions with replacement
Six Regions with replacement
Three Regions with replacement
LEAP Households
N (%) N (%) N (%) N (%) Western 34 8.59 Central 43 10.86 52 15.43 72 27.80 176 25.2 Greater Accra 7 1.77 18 5.34 Volta 58 14.65 74 21.96 110 42.47 82 11.7 Eastern 57 14.39 57 16.91 Ashanti 58 14.65 83 24.63 Brong Ahafo 40 10.10 53 15.73 77 29.73 441 63.1 Northern 52 13.13 Upper East 21 5.30 Upper West 26 6.57 Totals 396 100 337 100% 259 100 699 100
30

Appendix 4: Outcome variable across LEAP and ISSER matched samples with replacement
Outcome Variables
Leap
ISSER (All)
ISSER Rural
Matched Samples With Replacement
All Rural Regions
Six Regions
Three Regions
Enrollment Age 6-12 0.96 0.98 0.98 0.97 0.98 0.96 Age 13-17 0.88 0.92 0.91 0.89 0.91 0.91 Age 6-17 0.93 0.96 0.95 0.94 0.95 0.94 Boys age 13-17 0.90 0.94 0.93 0.93 0.89 0.88 Girls age 13-17 0.86 0.90 0.89 0.86 0.94 0.94 Any missed school days 0.21 0.14 0.15 0.14 0.17 0.15 Repeat grade 0.19 0.13 0.13 0.12 0.13 0.11 Ravens’ score 4.29 4.85 4.55 4.70 4.68 5.12 Illness in last month 0.10 0.07 0.07 0.06 0.05 0.06 Curative services 0.59 0.56 0.53 0.41 0.38 0.38 Observations 1225 8823 6415 844 732 497
31
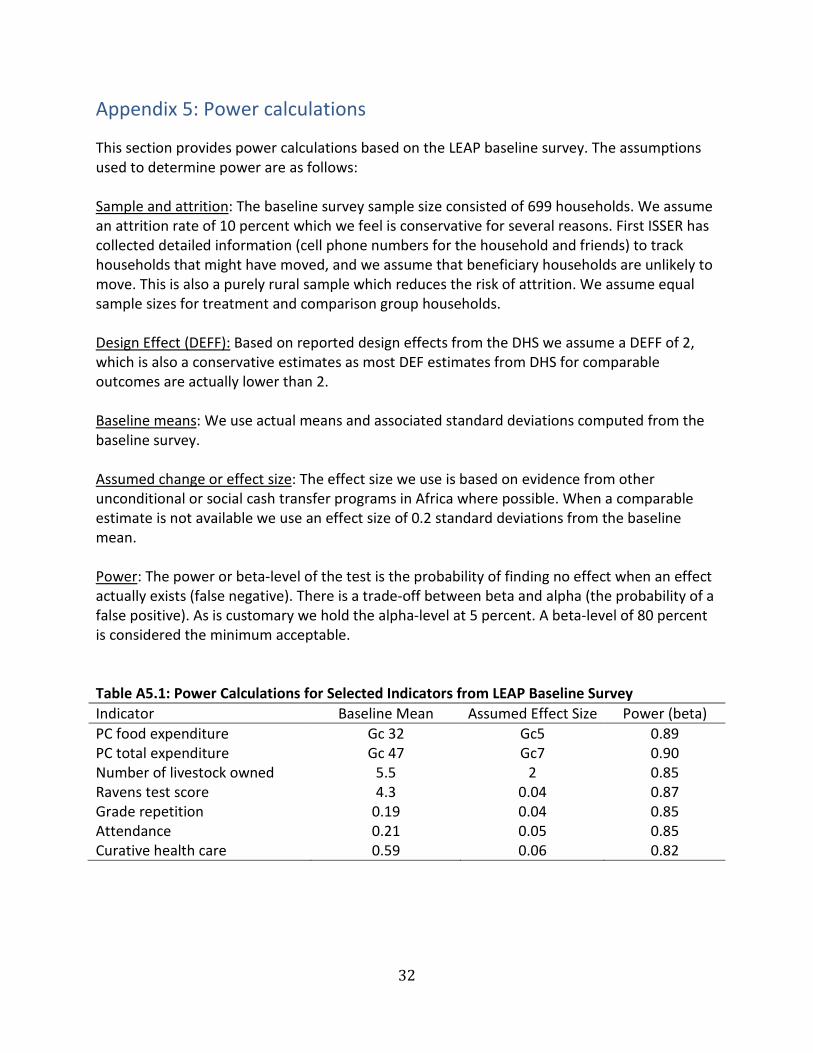
Appendix 5: Power calculations This section provides power calculations based on the LEAP baseline survey. The assumptions used to determine power are as follows: Sample and attrition: The baseline survey sample size consisted of 699 households. We assume an attrition rate of 10 percent which we feel is conservative for several reasons. First ISSER has collected detailed information (cell phone numbers for the household and friends) to track households that might have moved, and we assume that beneficiary households are unlikely to move. This is also a purely rural sample which reduces the risk of attrition. We assume equal sample sizes for treatment and comparison group households. Design Effect (DEFF): Based on reported design effects from the DHS we assume a DEFF of 2, which is also a conservative estimates as most DEF estimates from DHS for comparable outcomes are actually lower than 2. Baseline means: We use actual means and associated standard deviations computed from the baseline survey. Assumed change or effect size: The effect size we use is based on evidence from other unconditional or social cash transfer programs in Africa where possible. When a comparable estimate is not available we use an effect size of 0.2 standard deviations from the baseline mean. Power: The power or beta-level of the test is the probability of finding no effect when an effect actually exists (false negative). There is a trade-off between beta and alpha (the probability of a false positive). As is customary we hold the alpha-level at 5 percent. A beta-level of 80 percent is considered the minimum acceptable. Table A5.1: Power Calculations for Selected Indicators from LEAP Baseline Survey Indicator Baseline Mean Assumed Effect Size Power (beta) PC food expenditure Gc 32 Gc5 0.89 PC total expenditure Gc 47 Gc7 0.90 Number of livestock owned 5.5 2 0.85 Ravens test score 4.3 0.04 0.87 Grade repetition 0.19 0.04 0.85 Attendance 0.21 0.05 0.85 Curative health care 0.59 0.06 0.82
32

Appendix 6: Simulating the Impact of LEAP on Consumption10 We assess the likely behavioural effects of LEAP by using standard economic demand theory to predict how the program ought to impact spending based on pre-program expenditure elasticities. Our approach is to derive theoretically consistent expenditure elasticities from the baseline data and use these to predict household responses to the program. If preferences remain constant over time, the ex-ante predictions should match the ex-post actual impacts, in other words, the program simply moves households along their (total expenditure) Engel’s curves. Deviations between the ex-ante predictions and actual impacts might suggest changes in actual preferences for spending induced by the program. The principal analytical tool we use to build the baseline elasticities is the Engel curve, which relates budget shares devoted to various spending groups to total household expenditures and other household characteristics such as demographic composition. The exact specification used is what is now commonly known as the Working-Leser functional form, for which applications can be found in Deaton & Muellbauer (1980) and Handa (1996). This specification looks like the following: (1) where is the budget share for commodity i, PCEXP is household total per capita consumption expenditures and X is a vector of control variables. The α and the βs are parameters to be estimated, and ε i is a random error term. A main benefit of employing this specification is that it automatically imposes Engel’s Aggregation Property which the double log model estimated in levels does not do. Using equation (1), the marginal effect on the budget share of a change in total household expenditure is given by (3), while the total expenditure elasticity can be derived using the formula in (4) (Deaton, Ruiz and Thomas 1989): (2)
(3)
Note that the elasticity calculation set out in equation (3) is based on the budget share out of total expenditure, and so for our estimates of elasticity we use this as our dependent variable even when analysing specific food groups. Tables A6.1 and A6.2 display the estimated elasticities from this exercise for broad spending items and food groups. The higher the elasticity the larger the share that will be devoted to that
10 This section is adapted from Kenya CT-OVC Evaluation Team 2012. “The impact of the Kenya CT-OVC on household spending,” Journal of Development Effectiveness, Vol.4(1): 9-37.
33

item given additional income. Thus we see that Gifts (1.64) and Meats (1.46) are the most sensitive to changes in income—we would predict a large impact of LEAP on these items. Table A6.1: Estimated Expenditure Elasticities for Broad Spending Groups Expenditure Group Elasticity Food 1.01 Clothing 1.01 Heath 1.02 Education 1.03 Gifts 1.64 Fuel 0.84 Other 0.75 Table A6.2: Estimated Expenditure Elasticities for Food Groups Food Expenditure Group Elasticity Cereals 0.84 Roots and Tubers 0.97 Pulses 1.06 Fruits 0.51 Meats 1.30 Dairy 1.46 Fats 1.09 Vegetables 0.96 Other 1.03 Alcohol, Tobacco 0.66 However the actual predicted impact of the program on expenditure patterns depends both on the sensitivity of household income towards spending on that item (the elasticity) as well as the absolute level of spending on that item prior to the increase in income. So an item may attract a large elasticity but if it currently represents a small part of the budget, the overall increase in spending on that item could be low. Tables 12 and 13 in the text show that the actual share devoted to Gifts is 2.52 but is predicted to rise to 4.94. On the other hand the share of the food budget devoted to Meats is fairly substantial at 18.8 and is predicted to rise to 27 per cent of the food budget due to LEAP. The actual predicted level of spending for an item is given by the per cent change in PCEXP due to LEAP (7 per cent) times the elasticity for that good times the mean level of spending on that good.
34

35