little bear creek watershed - austin, texas · little bear creek watershed summary sheet catchment...
TRANSCRIPT
SR-12-01 Oct 2011 311
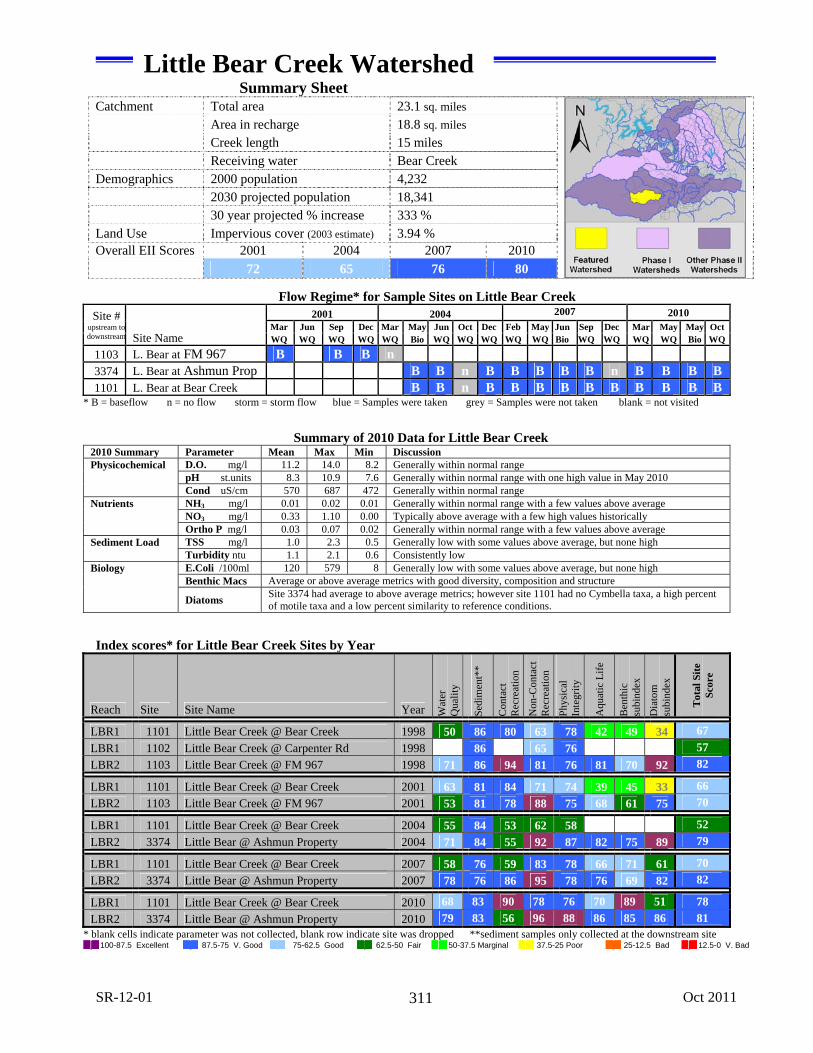
Little Bear Creek Watershed Summary Sheet
Catchment Total area 23.1 sq. miles Area in recharge 18.8 sq. miles Creek length 15 miles Receiving water Bear Creek Demographics 2000 population 4,232 2030 projected population 18,341 30 year projected % increase 333 % Land Use Impervious cover (2003 estimate) 3.94 % Overall EII Scores 2001 2004 2007 2010 72 65 76 80
Flow Regime* for Sample Sites on Little Bear Creek
Site # upstream todownstream Site Name
2001 2004 2007 2010 Mar Jun Sep Dec Mar May Jun Oct Dec Feb May Jun Sep Dec Mar May May Oct WQ WQ WQ WQ WQ Bio WQ WQ WQ WQ WQ Bio WQ WQ WQ WQ Bio WQ
1103 L. Bear at FM 967 B B B n
3374 L. Bear at Ashmun Prop B B n B B B B B n B B B B 1101 L. Bear at Bear Creek B B n B B B B B B B B B B
* B = baseflow n = no flow storm = storm flow blue = Samples were taken grey = Samples were not taken blank = not visited
Summary of 2010 Data for Little Bear Creek
2010 Summary Parameter Mean Max Min Discussion Physicochemical D.O. mg/l 11.2 14.0 8.2 Generally within normal range
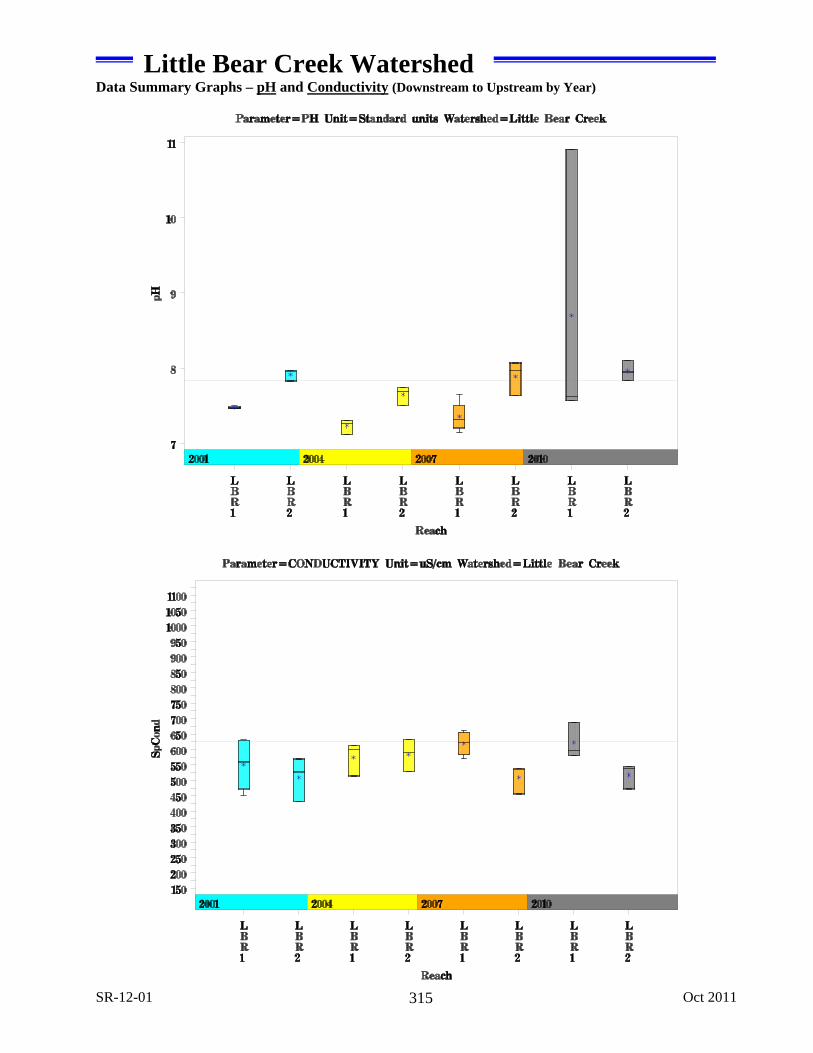
pH st.units 8.3 10.9 7.6 Generally within normal range with one high value in May 2010 Cond uS/cm 570 687 472 Generally within normal range
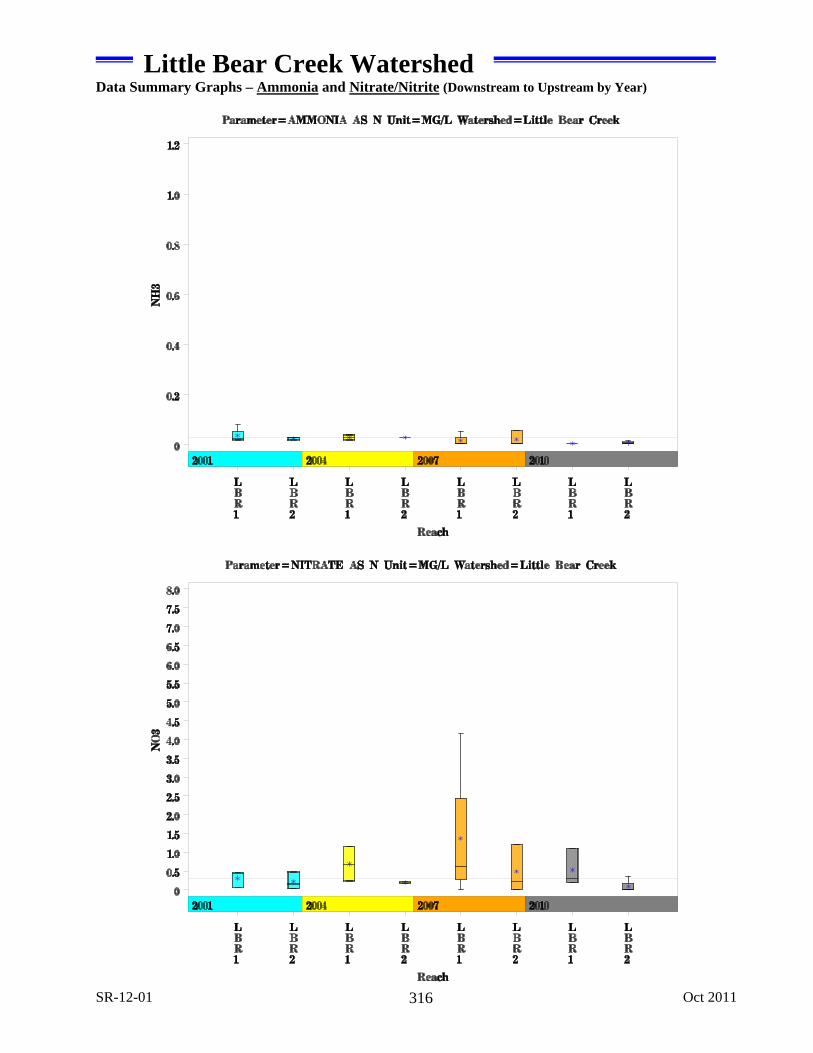
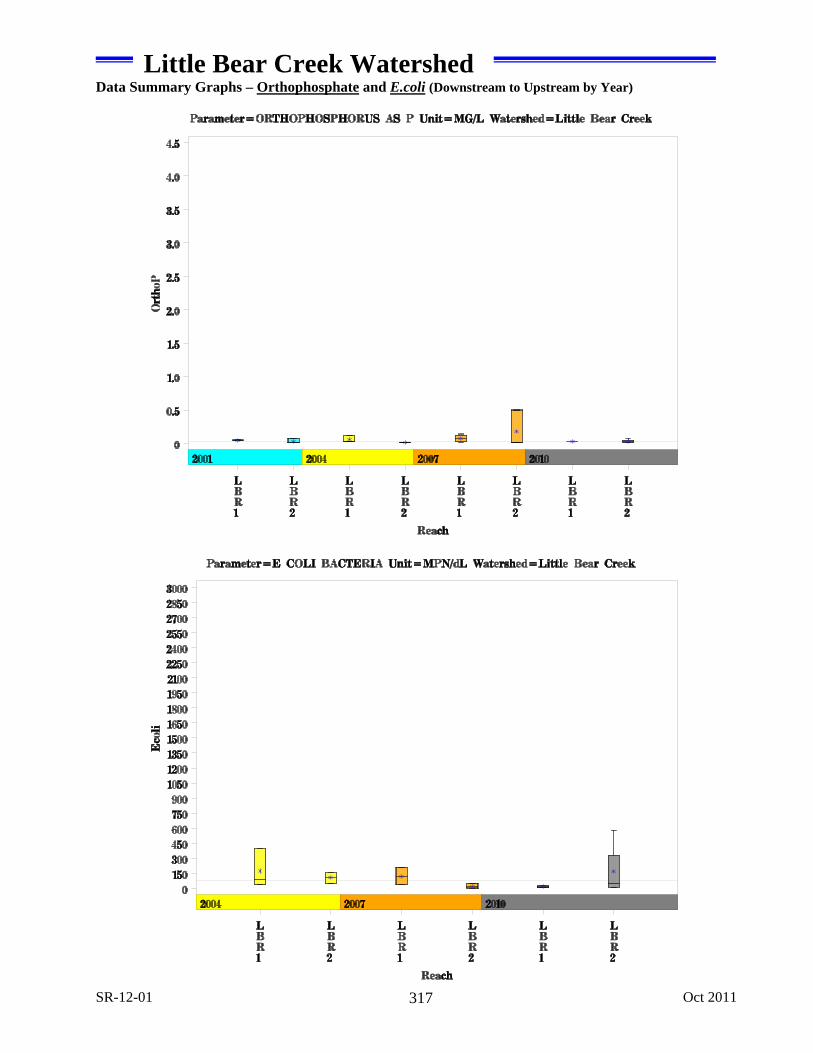
Nutrients NH3 mg/l 0.01 0.02 0.01 Generally within normal range with a few values above average NO3 mg/l 0.33 1.10 0.00 Typically above average with a few high values historically Ortho P mg/l 0.03 0.07 0.02 Generally within normal range with a few values above average
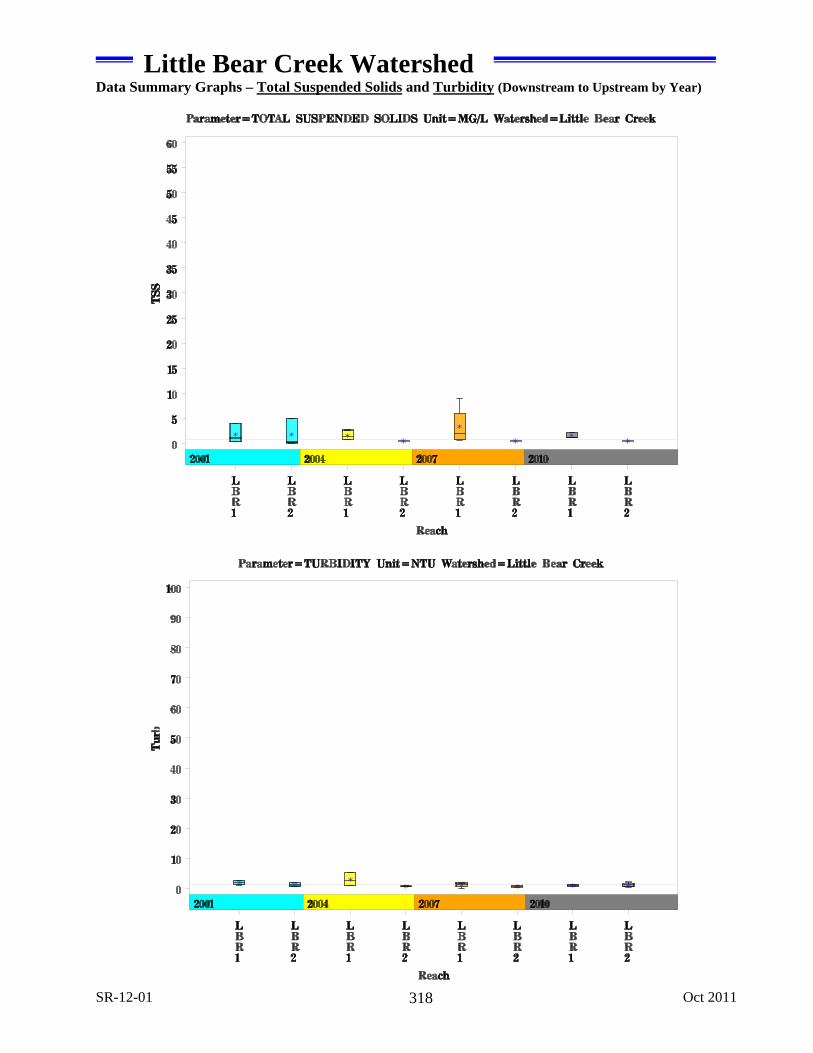
Sediment Load TSS mg/l 1.0 2.3 0.5 Generally low with some values above average, but none high Turbidity ntu 1.1 2.1 0.6 Consistently low
Biology E.Coli /100ml 120 579 8 Generally low with some values above average, but none high Benthic Macs Average or above average metrics with good diversity, composition and structure
Diatoms Site 3374 had average to above average metrics; however site 1101 had no Cymbella taxa, a high percent of motile taxa and a low percent similarity to reference conditions.
Index scores* for Little Bear Creek Sites by Year
Reach Site Site Name Year Wat
er
Qua
lity
Sed
imen
t**
Con
tact
R
ecre
atio
n
Non
-Con
tact
R
ecre
atio
n
Phy
sica
l In
tegr
ity
Aqu
atic
Lif
e
Ben
thic
su
bind
ex
Dia
tom
su
bind
ex
Tot
al S
ite
Sco
re
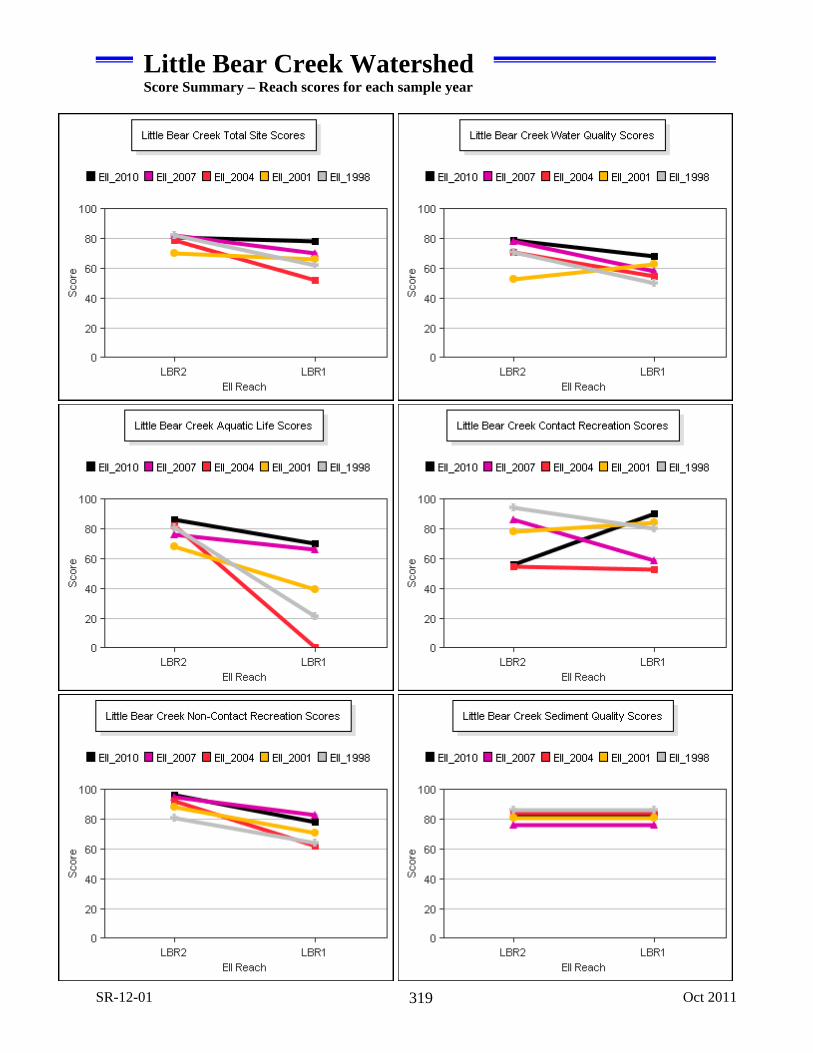
LBR1 1101 Little Bear Creek @ Bear Creek 1998 50 86 80 63 78 42 49 34 67
LBR1 1102 Little Bear Creek @ Carpenter Rd 1998 86 65 76 57
LBR2 1103 Little Bear Creek @ FM 967 1998 71 86 94 81 76 81 70 92 82
LBR1 1101 Little Bear Creek @ Bear Creek 2001 63 81 84 71 74 39 45 33 66
LBR2 1103 Little Bear Creek @ FM 967 2001 53 81 78 88 75 68 61 75 70
LBR1 1101 Little Bear Creek @ Bear Creek 2004 55 84 53 62 58 52
LBR2 3374 Little Bear @ Ashmun Property 2004 71 84 55 92 87 82 75 89 79
LBR1 1101 Little Bear Creek @ Bear Creek 2007 58 76 59 83 78 66 71 61 70
LBR2 3374 Little Bear @ Ashmun Property 2007 78 76 86 95 78 76 69 82 82
LBR1 1101 Little Bear Creek @ Bear Creek 2010 68 83 90 78 76 70 89 51 78
LBR2 3374 Little Bear @ Ashmun Property 2010 79 83 56 96 88 86 85 86 81 * blank cells indicate parameter was not collected, blank row indicate site was dropped **sediment samples only collected at the downstream site
100-87.5 Excellent 87.5-75 V. Good 75-62.5 Good 62.5-50 Fair 50-37.5 Marginal 37.5-25 Poor 25-12.5 Bad 12.5-0 V. Bad
SR-12-01 Oct 2011 312
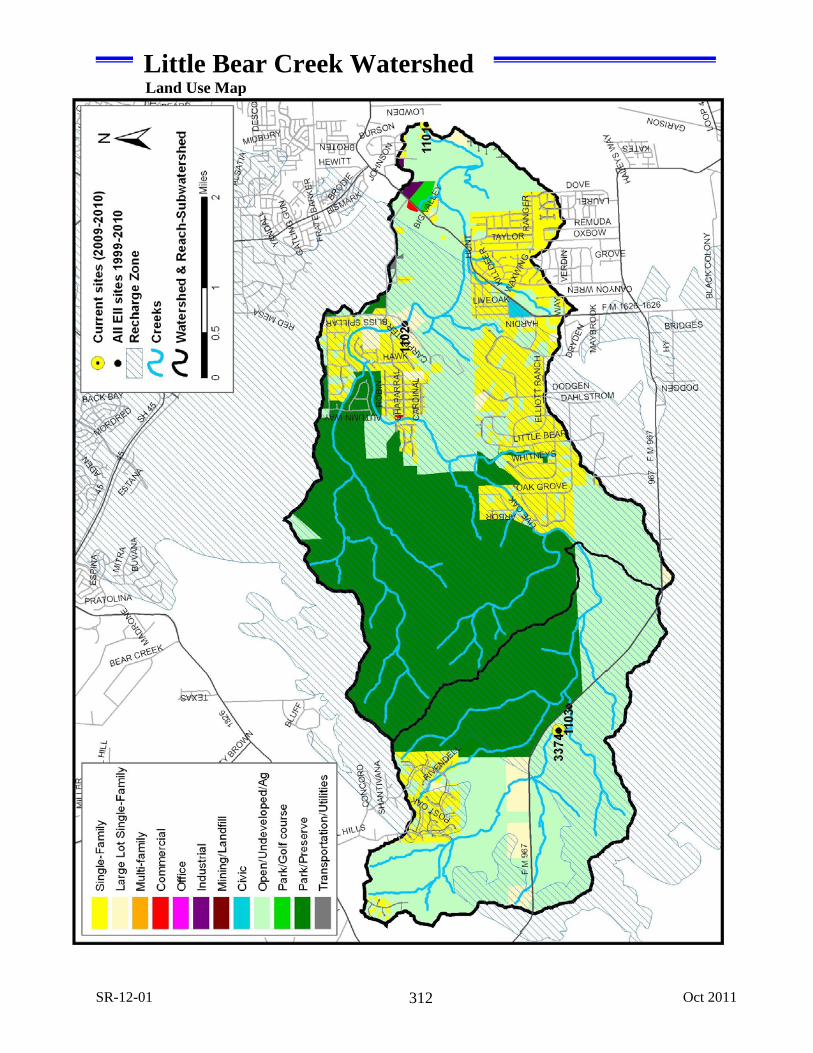
Little Bear Creek Watershed Land Use Map
SR-12-01 Oct 2011 313
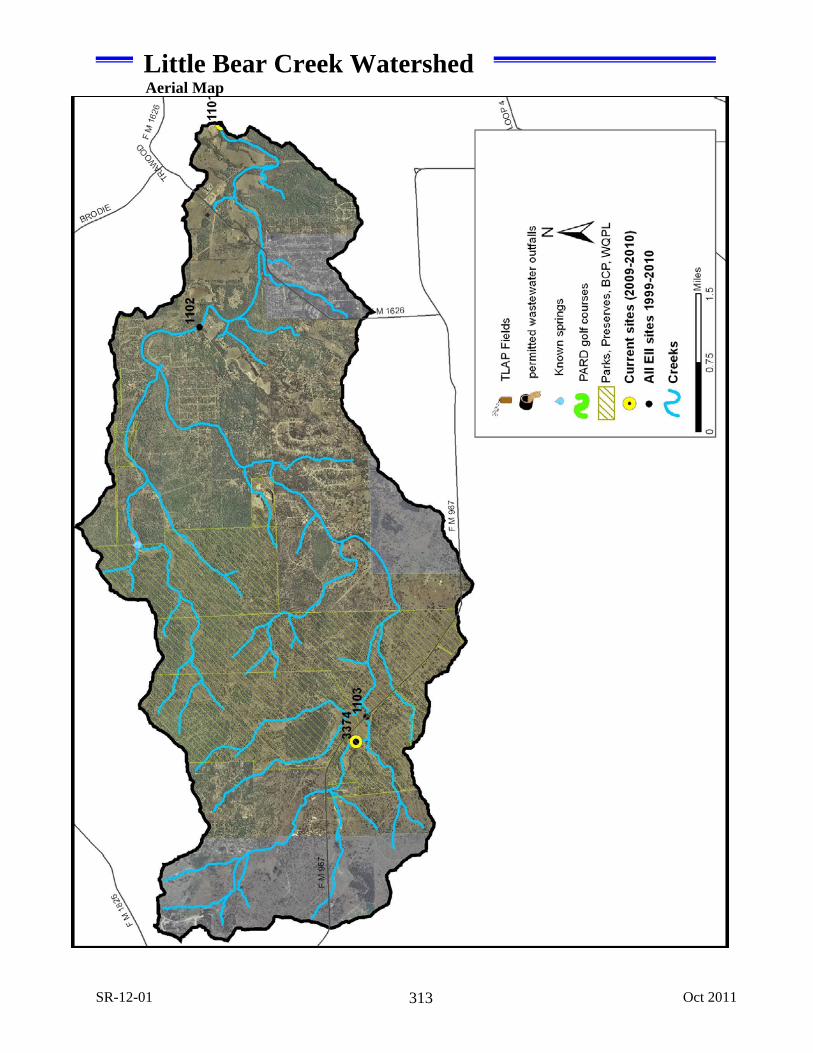
Little Bear Creek Watershed Aerial Map
SR-12-01 Oct 2011 314
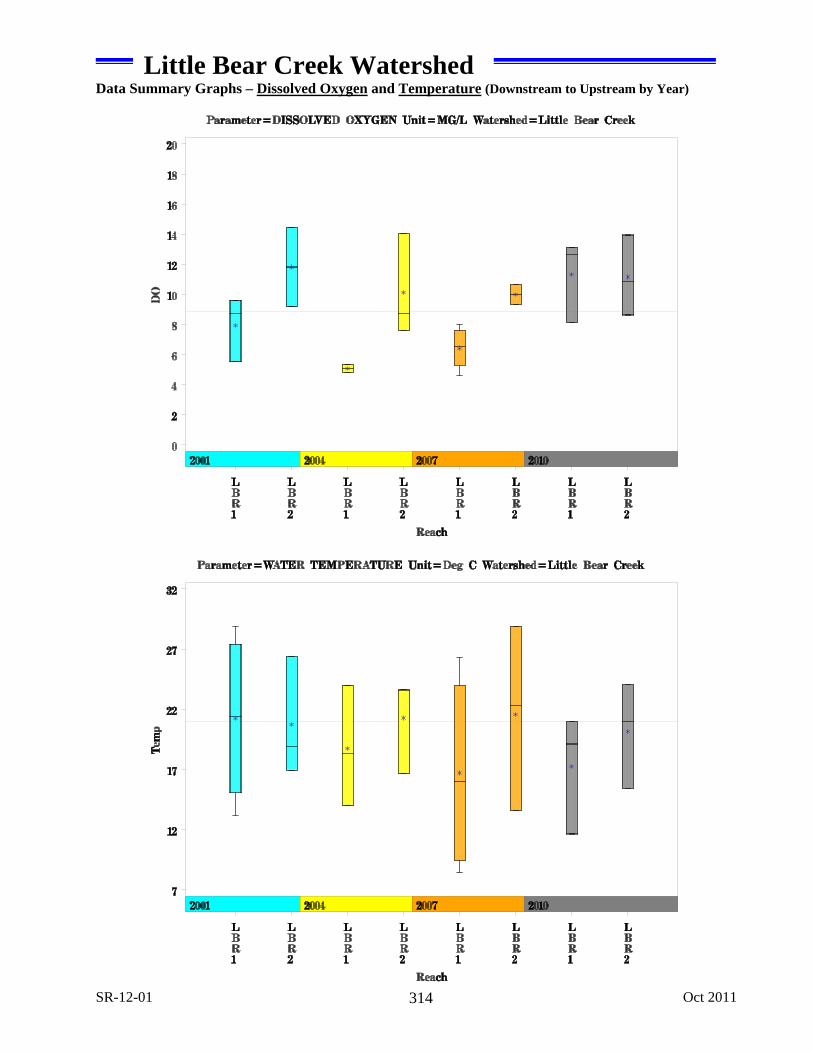
Little Bear Creek Watershed Data Summary Graphs – Dissolved Oxygen and Temperature (Downstream to Upstream by Year)
SR-12-01 Oct 2011 315
Little Bear Creek Watershed Data Summary Graphs – pH and Conductivity (Downstream to Upstream by Year)
SR-12-01 Oct 2011 316
Little Bear Creek Watershed Data Summary Graphs – Ammonia and Nitrate/Nitrite (Downstream to Upstream by Year)
SR-12-01 Oct 2011 317
Little Bear Creek Watershed Data Summary Graphs – Orthophosphate and E.coli (Downstream to Upstream by Year)
SR-12-01 Oct 2011 318
Little Bear Creek Watershed Data Summary Graphs – Total Suspended Solids and Turbidity (Downstream to Upstream by Year)
SR-12-01 Oct 2011 319
Little Bear Creek Watershed Score Summary – Reach scores for each sample year
SR-12-01 Oct 2011 320
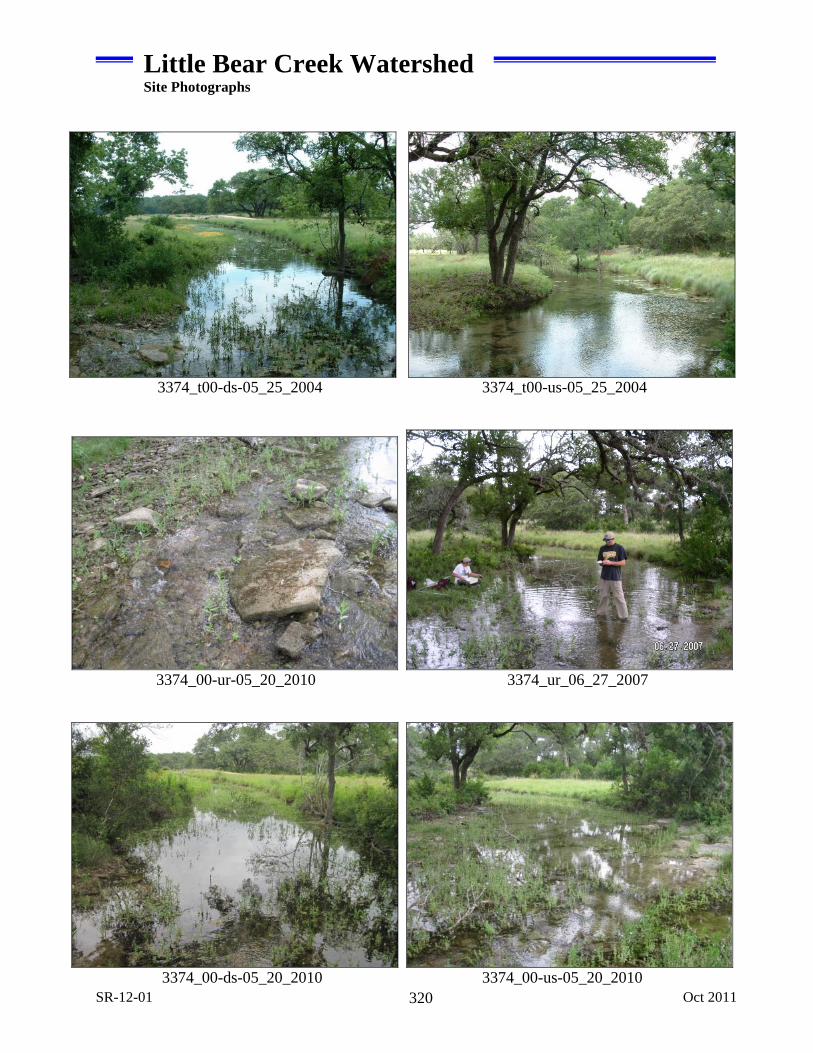
Little Bear Creek Watershed Site Photographs
3374_t00-ds-05_25_2004 3374_t00-us-05_25_2004
3374_00-ur-05_20_2010 3374_ur_06_27_2007
3374_00-ds-05_20_2010 3374_00-us-05_20_2010
SR-12-01 Oct 2011 321
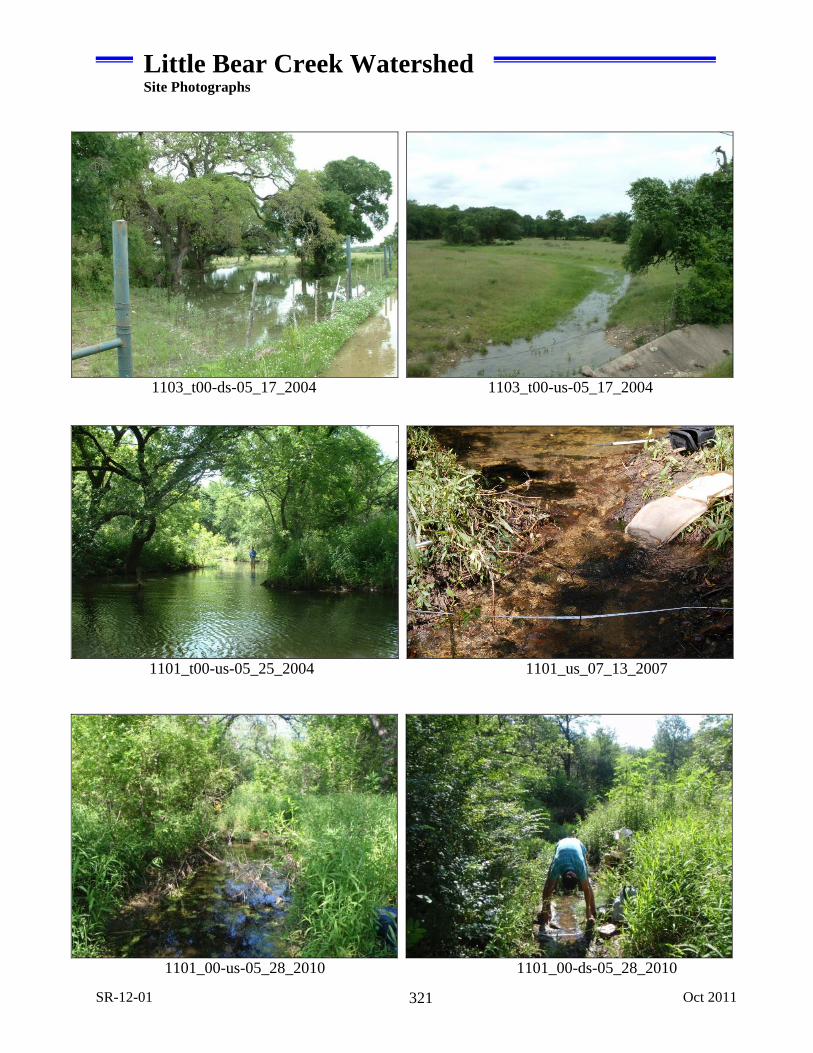
Little Bear Creek Watershed Site Photographs
1103_t00-ds-05_17_2004 1103_t00-us-05_17_2004
1101_t00-us-05_25_2004 1101_us_07_13_2007
1101_00-us-05_28_2010 1101_00-ds-05_28_2010

SR-12-01 Oct 2011 322
This page left intentionally blank