literature review flat panel displays: end of life ... review flat panel displays: end of ... 1.2...
TRANSCRIPT

Literature Review
Flat Panel Displays: End of Life Management Report
Final Report
Prepared By:
King County Solid Waste Division 201 South Jackson Street, Suite 701
Seattle, WA 98104
Updated April 24, 2008
Original Report Date
August 20, 2007

Updated Report: April 24, 2008 i
Table of Contents
Acronyms ……............................................................................................................................. iv
Acknowledgements...................................................................................................................... vi
Executive Summary .................................................................................................................... vii
Section 1: Introduction............................................................................................................1 1.1 Goals and Objectives.................................................................................3 1.2 Scope and Limitations ...............................................................................4
Section 2: Types of Flat Panel Displays.................................................................................5 2.1 Liquid Crystal Displays (LCDs) ..................................................................5
2.1.1 History............................................................................................5 2.1.2 Technology ....................................................................................5 2.1.3 Manufacturing ................................................................................7 2.1.4 Market Trends................................................................................7
2.2 Plasma Displays ........................................................................................8 2.2.1 History 8 2.2.2 Technology ....................................................................................8 2.2.3 Manufacturing ..............................................................................10 2.2.4 Market Trends..............................................................................10
2.3 Other types of Flat Panel Displays ..........................................................10 2.3.1 Microdisplays ...............................................................................11 2.3.2 Electroluminescent Displays ........................................................11 2.3.3 Light-Emitting Diode (LED) Arrays...............................................11 2.3.4 Organic Light-Emitting Diodes (OLEDs) ......................................12 2.3.5 Field Emission Displays (FEDs)...................................................13 2.3.6 Liquid Crystal on Silicon (LCOS) .................................................13 2.3.7 Vacuum Fluorescent Displays .....................................................13 2.3.8 Future Development ....................................................................14
Section 3: Potentially Hazardous Constituents.....................................................................15 3.1 FPD Constituents.....................................................................................15 3.2 Toxicity of FPD Constituents ...................................................................19
3.2.1 Inorganic Constituents .................................................................20 3.2.2 Organic Constituents ...................................................................24
Section 4: Applicable or Relevant Laws and Regulations ....................................................31 4.1 International Laws and Regulations.........................................................31 4.2 Federal Laws and Regulations ................................................................33
4.2.1 Toxic Substances Control Act......................................................33 4.2.2 Resource Conservation and Recovery Act ..................................34 4.2.3 Universal Waste Rule ..................................................................40
4.3 State Laws and Regulations....................................................................40 4.3.1 Washington State Dangerous Waste Regulations.......................40 4.3.2 Other States.................................................................................42
4.4 Local Policies...........................................................................................43

Table of Contents (Continued)
Updated Report: April 24, 2008 ii
Section 5: End-of-Life Management.....................................................................................44 5.1 Product Life and Repairability..................................................................44 5.2 Storage ....................................................................................................45 5.3 Substances of Concern in End-of-life FPDs ............................................46 5.4 Current Recycling Practices ....................................................................55
5.4.1 Disassembly and Material Separation .........................................55 5.4.1.1 FPD Disassembly............................................................. 56 5.4.1.2 Shredder/Magnet/Eddy Current ....................................... 58 5.4.1.3 Landfilling ......................................................................... 59
5.4.2 Downstream Processing of Recovered Components and Materials ......................................................................................60 5.4.2.1 Plastics............................................................................. 60 5.4.2.2 Metals............................................................................... 61 5.4.2.3 Mercury Lamps ................................................................ 61 5.4.2.4 LCD Screens.................................................................... 62
5.5 Recycling Technologies Under Development..........................................63 5.5.1 Recycling of Liquid Crystals and Liquid Crystal Mixtures ............63 5.5.2 Recycling of LCD Panels .............................................................64 5.5.3 Recycling and Recovery of Indium Tin Oxide ..............................65
Section 6: Potential Human Health and Environmental Impacts ..........................................66 6.1 Possible Exposure Pathways ..................................................................66 6.2 End-of-Life Activities and Associated Impacts.........................................68
Section 7: Data Gaps and Recommendations .....................................................................73 7.1 Data Gaps................................................................................................73 7.2 Recommendations...................................................................................74
Section 8: Literature Reviewed ............................................................................................76 Appendix A: EPA’s New Chemical’s Risk Assessment Process Under TSCA Appendix B: Flat Panel Display Recycling Contacts Appendix C: Useful Operating Life of Flat Panel Products

Updated Report: April 24, 2008 iii
List of Tables 3-1 List of Materials Used in the Manufacture of LCDs ............................................. 17
3-2 Toxicity of Inorganic FPD Constituents ............................................................... 21
3-3 Toxicity of Organic FPD Constituents.................................................................. 23
3-4 Liquid Crystal Compounds Tested for Potential Ecotoxicity ................................ 26
4-1 Toxicity Characteristics List ................................................................................. 35
4-2 Results of Previous TCLP Analyses.................................................................... 39
5-1 Substances of Concern in Three High-Volume Flat Panel Products................... 49
5-2 Substances of Concern in Flat Panel TVs........................................................... 51
5-3 Substances of Concern in Laptop Computers and Flat Screen Monitors............ 53
6-1 Potential Exposure Pathways.............................................................................. 67
List of Figures 1-1 Sales by Year ........................................................................................................ 2
1-2 Projected Market for FPDs by Display Type.......................................................... 3
2-1 Cross-section of a TFT-LCD Display..................................................................... 6
2-2 Simple Composition of the Alternating Current Plasma Display Panel with Matrix Electrode Design. ....................................................................................... 9
2-3 Structure of an Organic Light-Emitting Diode...................................................... 12
5-1 Flow Diagram for the Recovery of Materials from Flat Panel Displays ............... 57

Updated Report: April 24, 2008 iv
Acronyms AMD Active matrix display ATSDR Agency for Toxic Substances and Disease Registry CCFL Cold cathode fluorescent lamp CESQG Conditionally-exempt small quantity generator CIWMB California Integrated Waste Management Board CRT Cathode ray tube DSM Dynamic scattering mode EL Electroluminescent ELD Electroluminescent display EPA U.S. Environmental Protection Agency EU European Union FED Field emission display FPD Flat panel display HDTV High definition television HIC High information content HIPS High impact polystyrene HPLC High performance liquid chromatography IARC International Agency for Research on Cancer IC Integrated circuit IPS In-plane switching ITO Indium tin oxide LC Liquid crystal LCD Liquid crystal display LCOS Liquid crystal on silicon LED Light emitting diode LEP Light emitting polymer MCL Maximum contaminant level MEMS Micro-Electrical Mechanical Systems MSDS Material safety data sheet MTBF Mean time before failure OECD Organization for Economic Cooperation and Development OLED Organic light emitting diode PBB Polybrominated biphenyl PBDE Polybrominated diphenyl ether PBT Persistent, bioaccumulative toxic PC Printed circuit PCB Printed circuit board PLED Polymer light emitting diode

Acronyms (Continued)
Updated Report: April 24, 2008 v
PVC Polyvinyl chloride SED Surface-conduction electron-emitter display SM-OLED Small-molecule organic light emitting diode STLC Soluble Limit Threshold Concentration STN Super twisted nematic TCLP Toxicity Characteristic Leaching Procedure TFT Thin film transistor TTLC Total Threshold Limit Concentration VFD Vacuum fluorescent display WET Waste extraction test ZBD Zenithal bistable device

Updated Report: April 24, 2008 vi
Acknowledgements This report was prepared for the King County Department of Natural Resources & Parks, Solid Waste Division by Eastern Research Group, Inc., under subcontract to Colehour & Cohen, and by Science Applications International Corporation (SAIC).

Updated Report: April 24, 2008 vii
Executive Summary The purpose of this report is to summarize available information obtained from the literature, Internet sources, and through conversations with manufacturers, recyclers, and others about:
• Dominant flat panel display technologies that are used in televisions, computer monitors, and other electronic devices;
• Potentially hazardous components contained within these devices;
• Potential health and environmental impacts associated with end-of-life management;
and
• The potential for recycling of flat panel display devices and their components. Flat panel displays (FPDs) are thin, lightweight video displays used in a variety of applications, including laptop and desktop computers, televisions, microdisplays, medical devices, and industrial instruments. They feature a flat surface and a thickness generally less than 4 inches. By 2008, devices that contain FPDs are projected to account for nearly 85 percent of the total U.S. demand for these products; by 2013, the percentage is predicted to reach 94 percent. FPDs are predicted to replace cathode ray tubes (CRTs) in almost every application, particularly in desktop computer monitors and television sets. Liquid crystal displays (LCDs) are the dominant flat panel technology. In 2003, they accounted for approximately 85 percent of the demand for FPD devices in the United States. Plasma displays are expected to increase market share to 13 percent, primarily for high definition television (HDTV) and other large screen applications. Microdisplays, light emitting diode arrays, vacuum fluorescent displays, organic light-emitting diodes, and electroluminescent displays are projected to remain a small portion of the total flat panel market. While relatively few FPD devices have entered the waste stream at this time, they represent a potentially large volume of material that will be reused, recycled, or discarded in the future. Potentially hazardous components and materials are contained both in the display unit itself and in the electronic device containing the display unit (e.g., computer monitor, television); these include substances common to electronic waste in general, for example lead, cadmium, chromium, antimony, beryllium, and brominated flame retardants. Several substances are unique to flat panels or are present in greater quantities in devices that contain flat panels; these include mercury and liquid crystals. Mercury is used to manufacture the cold cathode fluorescent lamps (CCFLs) that are used to backlight LCD panels. While the evidence regarding human toxicity of mercury and other heavy metals contained in FPD devices is fairly clear, the toxicity of flame retardants and liquid crystals continues to be researched. Liquid crystals are organic compounds with optical and structural properties of crystals but with the mechanical features of fluids. There are hundreds of liquid crystal compounds used in LCDs, and a typical LCD contains as many as 25 different liquid crystal substances. Liquid crystal manufacturers have conducted fairly extensive testing for acute toxicity, mutagenic properties, skin/eye irritation, aquatic toxicity, and bioaccumulation potential. Industry’s overall conclusions are that liquid crystals are not acutely toxic or mutagenic and in general they do not appear to pose a significant human health or environmental hazard based

Updated Report: April 24, 2008 viii
on these tests. Additionally, EPA’s Office of Pollution Prevention and Toxics has determined that liquid crystals reviewed as New Chemicals for the Toxic Substances Control Act do not pose an unreasonable risk to human health or the environment. While available data suggest a low potential for harmful effects, testing regimens are based on the premise that long-term exposures to large quantities of liquid crystals is not likely. As a result, no chronic animal studies have been conducted. Data on the potential for liquid crystal release and exposure during end-of-life management of LCDs are also absent, precluding definitive conclusions about liquid crystal hazard potential. Several researchers (University of Florida, California Department of Toxic Substances Control) have tested FPD devices using the Toxic Characteristic Leaching Procedure (TCLP) to determine whether they would be designated as “hazardous waste” under the federal Resource Conservation and Recovery Act (RCRA) or equivalent state laws. While the results were mixed and appear to depend on the specific sample preparation methodology used, the data indicate that at least some flat panel devices (including LCDs, laptop computers, and plasma displays) would be designated as hazardous waste under RCRA because they exceed the toxic threshold concentration for the heavy metal lead.1
Potential health effects associated with recycling include generation and dispersal of dust from the shredding process, discharges of water used during material processing, and leaching of hazardous substances from electronic components stored outdoors. The most significant health hazards related to the recycling of FPD devices are associated with occupational exposure to recycling workers. Currently, relatively few FPD devices are being recycled, primarily because they have not yet entered the waste stream in significant quantities. Those FPDs, primarily LCDs, that do enter the waste stream are generally processed in a similar fashion to other electronic devices (e.g., disassembly, shredding or crushing, sorting, and sale of scrap materials). None of the recyclers interviewed for this research separate liquid crystals from the glass panels before they are processed. The research does indicate that technologies are being developed to recycle LCD panels, primarily in Europe. Some data gaps remain, including information about potentially hazardous components contained in the current generation of LCDs and plasma displays, the chronic toxicity of liquid crystals, toxicity of other components that are common to many electronic products (e.g., brominated flame retardants), and potential health effects to recycling workers. Recommendations for further research are provided in Section 7. This version of the document is identical to the original release (dated August 20, 2007); however, an appendix was included to address stakeholder requests for more information regarding the operating life of flat panel products (see Appendix C).
1 Lead is contained in the solder used to manufacture flat panel display devices, and may be present in other display device components as well.

Updated Report: April 24, 2008 1
Section 1: Introduction
This version of the document is identical to the original release (dated August 20, 2007); however, an appendix was included to address stakeholder requests for more information regarding the operating life of flat panel products (see Appendix C). A flat panel display (FPD) is a thin, lightweight video display used in a variety of applications, including laptop and desktop computers, televisions, microdisplays, medical devices, and industrial instruments. FPDs feature a flat surface and a thickness generally less than 4 inches. Early FPDs were low-resolution displays (also called low-information content displays); these are limited to a few alphanumeric characters, several lines of text, or simple graphics. They typically use preformed characters built into the screen, segmented elements, or a matrix (such as a 5×7 array of light-emitting diodes) to form characters. The 1990s saw a huge increase in demand for portable products, thus increasing the demand for FPDs (MCC 1995). The development of portable/notebook personal computers (PCs), which require high resolution as well as limited thickness, provided a major incentive for the development of high-resolution FPDs (Freedonia Group 2004). High-resolution (or high-information content, HIC) screens can display many lines of text and highly detailed graphics. These screens have a large number (several hundred thousand) of near-microscopic individually electronically addressable cells called picture elements (or pixels). They are capable of forming highly detailed images; the images can be erased and reformed, or refreshed, many times per second to give the illusion of motion. FPDs are grouped into emissive and non-emissive types. Like cathode ray tubes (CRTs), emissive displays emit light, while non-emissive displays must have an external light source to make the images on the screen visible. The major emissive FPDs include: plasma displays, electroluminescent displays, and vacuum fluorescent displays (all high resolution), and light-emitting diode displays (low resolution). Liquid crystal displays (LCDs) are non-emissive and require an external source of light. The two major types of LCDs are passive matrix (twisted nematic and super-twisted nematic, which show only a limited range of colors) and active matrix (which are capable of showing a full range of colors). In 1998, the U.S. demand for FPDs accounted for just over 20 percent of the total U.S. demand for electronic displays. By 2008, FPDs are projected to account for nearly 85 percent of the total U.S. demand for these products (Freedonia Group 2004); by 2013, this percentage is predicted to be over 94 percent (Figure 1-1). This represents an increase of 19 percent per year through 2008. FPDs are expected to replace CRTs in almost every application, particularly in desktop computer monitors and television sets (which make up the majority of the demand for display products). Most FPDs are manufactured in Asia: China, Japan, South Korea and Taiwan (Freedonia 2004). U.S. companies have concentrated on niche markets such as microdisplays, medical device displays, industrial instrument displays, and military/avionics displays. LCDs are the dominant FPD technology. In 2003, they accounted for approximately 85 percent of the total FPD demand in the U.S., followed distantly by plasma displays, microdisplays, light-

emitting diode (LED) arrays, vacuum fluorescent displays (VFDs), organic light-emitting diode (OLED) displays, electroluminescent (EL) displays, and other types. Active matrix LCDs using thin-film transistors (TFT-LCDs) are predicted to continue this dominance of the FPD market. Plasma displays are expected to increase market share for high definition television (HDTV) and other large screen applications. Figure 1-2 summarizes the projected market for FPDs by display type.
0
5000
10000
15000
20000
25000
30000
35000
40000
1993 1998 2003 2008 2013
Year
Mill
ion
$
Electronic Displays
Flat panel displays
Figure 1-1. Sales by Year
(Adapted from: Freedonia Group 2004)
Updated Report: April 24, 2008 2
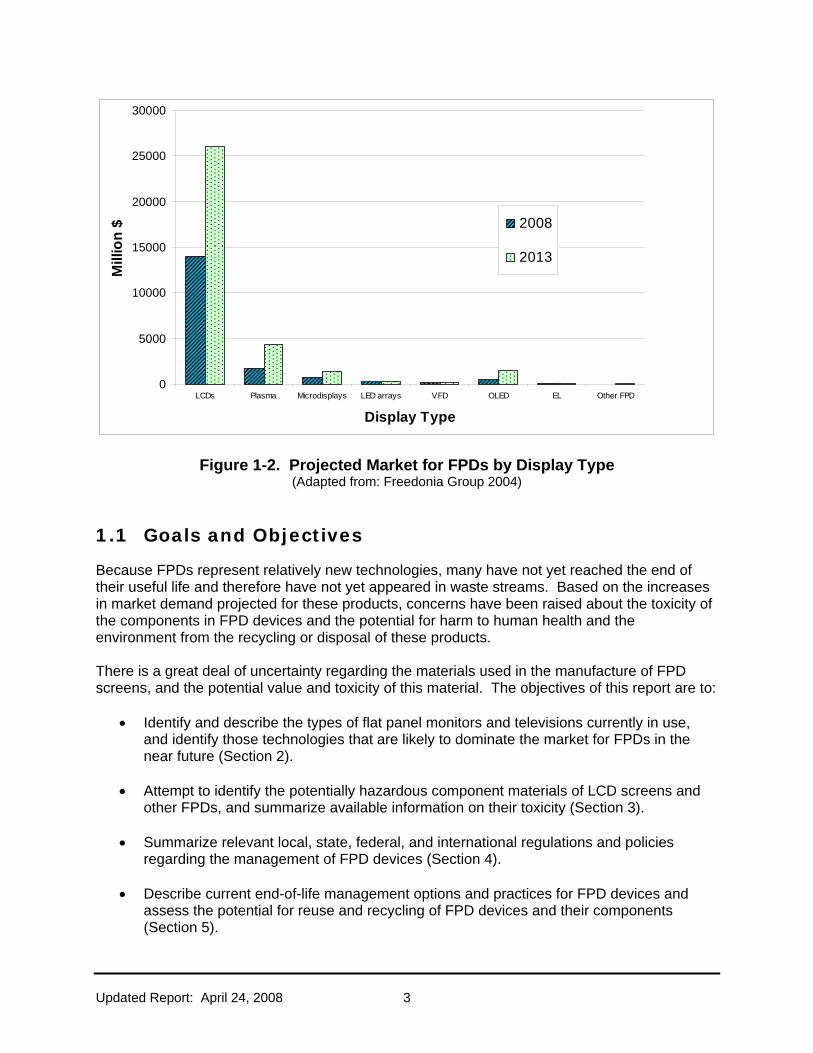
0
5000
10000
15000
20000
25000
30000
LCDs Plasma Microdisplays LED arrays VFD OLED EL Other FPD
Display Type
Mill
ion
$ 2008
2013
Figure 1-2. Projected Market for FPDs by Display Type (Adapted from: Freedonia Group 2004)
1.1 Goals and Objectives
Because FPDs represent relatively new technologies, many have not yet reached the end of their useful life and therefore have not yet appeared in waste streams. Based on the increases in market demand projected for these products, concerns have been raised about the toxicity of the components in FPD devices and the potential for harm to human health and the environment from the recycling or disposal of these products. There is a great deal of uncertainty regarding the materials used in the manufacture of FPD screens, and the potential value and toxicity of this material. The objectives of this report are to:
• Identify and describe the types of flat panel monitors and televisions currently in use, and identify those technologies that are likely to dominate the market for FPDs in the near future (Section 2).
• Attempt to identify the potentially hazardous component materials of LCD screens and
other FPDs, and summarize available information on their toxicity (Section 3).
• Summarize relevant local, state, federal, and international regulations and policies regarding the management of FPD devices (Section 4).
• Describe current end-of-life management options and practices for FPD devices and
assess the potential for reuse and recycling of FPD devices and their components (Section 5).
Updated Report: April 24, 2008 3

Updated Report: April 24, 2008 4
• Describe potential adverse health and environmental impacts associated with end-of-life management of FPD devices, including potential occupational health impacts to recyclers and recycling methods under development (Section 6).
• Identify data gaps and develop recommendations for further study (Section 7).
1.2 Scope and Limitations
A complete life cycle assessment of FPDs and devices they are used in is outside the scope of this study. Rather, this report focuses on end-of-life disposal and recycling processes. A number of studies have been performed to assess the toxicity and recyclability of electronic components, including electronic products that contain FPDs. These and other relevant documents were reviewed and summarized. Stakeholders were contacted, including liquid crystal and display manufacturers; regulatory agencies; research organizations; trade and recycling organizations; and electronics recyclers. Because LCDs are expected to dominate the flat panel display market in the foreseeable future (see Figure 1), greatest emphasis was placed on collecting information relevant to this technology. However, plasma display and other current and developing technologies are also discussed.

Updated Report: April 24, 2008 5
Section 2: Types of Flat Panel Displays
This section presents information about the history, manufacture, and market trends for the flat panel display technologies that are currently in use, with emphasis on those technologies that are likely to dominate the U.S. market over the next 10 years. 2.1 Liquid Crystal Displays (LCDs)
A liquid crystal display (LCD) is a thin, flat panel display device made up of a number of color or monochrome pixels arrayed in front of a light source or reflector. It uses very small amounts of electricity, and is therefore frequently used in battery-powered electronic devices. The display includes a of a column of liquid crystal molecules that are suspended and evenly distributed to form a uniform layer between two transparent electrodes, and two polarizing filters with axes of polarity that are perpendicular to each other. The liquid crystal layer is typically about 3 to 5 µm thick. Without the liquid crystals between them, light passing through one polarizing filter would be blocked by the other. The liquid crystals twist the polarized light entering one filter to allow it to pass through the other. 2.1.1 History
The first operational LCD was introduced in 1968 by George Heilmeier at RCA, based on the Dynamic Scattering Mode (DSM); Heilmeier found Optel, a company that introduced a number of LCDs based on this technology. In 1969, James Fergason (Kent State University) discovered the twisted nematic field effect in liquid crystals. His company, ILIXCO, produced the first LCDs based on this effect, and they quickly superseded earlier types (Merck 2004b). During the early 1970s the first digital watches and pocket calculators with liquid crystal displays were sold. In 1984, the “Super Twisted Nematic Mode” (STN) was commercially introduced in the first high resolution LCDs. In 1989, the “Active Matrix Display” (AMD) was first commercially manufactured based on a concept developed by B.J. Lechner in 1971. This technology made high resolution full color displays possible and in 1990, the first notebook PCs using this technology were commercially available. In 1996 “In-Plane Switching” (IPS) was first used in commercial production. It made higher contrast of the LCD display possible and substantially improved viewing angles (up to 170º). Since 1997, LCD desktop personal computer monitors have been produced. Mobile phones with liquid crystal displays were first sold in 2000. “Vertical Alignment” (VA) technology was used commercially in 1998 and has been used since 2002 in flat panel televisions. It combines the advantages of viewing angles of up to 170º, higher contrast ratios, and fast response times (important for fast moving images) (USEPA 1998, Wikipedia 2005). 2.1.2 Technology
Liquid crystals are substances that exhibit a phase of matter that has properties between those of a conventional liquid and those of a solid crystal. For instance, a liquid crystal may flow like a liquid, but its molecules may be arranged and oriented in a crystal-like manner. There are many different types of liquid crystal phases, which can be distinguished based on their different optical properties.

The liquid crystal molecules are electrically charged. By applying an electric current to transparent electrodes over each pixel or subpixel, the molecules are twisted by electrostatic forces. This changes the twist of the light passing through the molecules, and allows varying degrees of light to pass through the polarizing filters. Before an electric current is applied, the liquid crystal molecules are in a relaxed state. Charges on the molecules cause them to align themselves in a helical structure, or twist. If the liquid crystals are completely untwisted, light passing through them will be polarized perpendicular to the second filter, and thus be completely blocked. The pixel will appear unlit. By controlling the twist of the liquid crystals in each pixel, light can be allowed to pass through in varying amounts, correspondingly illuminating the pixel. In color LCDs, each individual pixel is divided into three cells, or subpixels, which are colored red, green, and blue by additional filters. Each subpixel can be controlled independently to yield thousands or millions of possible colors for each pixel.
Figure 2-1. Cross-section of a TFT-LCD Display. Source: Adapted from Wikimedia Commons public domain graphic. http://commons.wikimedia.org/wiki/Image:TFT-LCD.jpg#filehistory
Depending on the location of the light source, LCDs are either transmissive or reflective. Transmissive LCDs are illuminated from the back by a backlight and viewed from the opposite side (the front). This is the type of LCD used in computer displays, personal digital assistants, and mobile phones. These applications require high luminance levels, and the illumination
Updated Report: April 24, 2008 6

Updated Report: April 24, 2008 7
device usually consumes much more power than the LCD itself. Reflective LCDs are often found in digital watches and calculators; they are illuminated by external light which may be reflected by a diffusing reflector behind the display. These LCDs have higher contrast than the transmissive types, and significantly lower power consumption. Small monochrome displays use a passive matrix structure using supertwist nematic (STN) or double layer STN technology. Each row or column of the display has a single electrical circuit; the pixels are addressed one at a time by row and column addresses. This type of display is called a passive matrix because the pixel must remain in its state between refreshes without the benefit of a steady electrical charge. Modern LCD computer monitors and televisions, with high-resolution color displays, use an active matrix structure. A matrix of thin-film transistors (TFTs) is added to the polarizing and color filters. Each pixel has its own dedicated transistor. Active matrix displays are much brighter and sharper than passive matrix displays of the same size, and generally have quicker response times. There are approximately 300 different liquid crystal compounds used. Up to four fluorescent lamps and a thin light diffuser are used to provide light. 2.1.3 Manufacturing
Three manufacturers currently supply 90 percent of the liquid crystals and liquid crystal mixtures used in LCDs worldwide. These are Merck KGaA (Darmstadt, Germany) and the Japanese companies Chisso Corporation and Dainippon Ink. Merck KGaA alone has an approximate market share of 69 percent (Becker and Lemp 2004) and holds about 2,500 patents on liquid crystals and mixtures. The remaining 10 percent of liquid crystal manufacturers are located primarily in China and in many cases their products and mixtures follow old “recipes” of Merck (Prösler 1999). LCDs use mixtures of liquid crystals and usually contain 25 or more types of liquid crystal molecules. 2.1.4 Market Trends
Worldwide, sales of 165,000 tons of LCDs (containing about 190 tons of liquid crystals) are predicted for the year 2008 (Prösler 1999). A study by DisplaySearch (2005) projects that the market share of LCDs in the flat panel display market will grow from 73.3 percent in 2004 to 81 percent in 2008. LCDs represented a total display area of 13.2 million square meters in 2004 and are projected to represent a total display area of 39.7 million square meters in 2008. In 2004, passive matrix LCDs represented 4 percent of the market display area (684,000 square meters); they are expected to represent 1.4 percent (6.7 million square meters) of the total display area in 2008. Average display size of LCD computer monitors will increase from about 16.7 inches in 2005 to 17.2 inches in 2008 (DisplaySearch 2004, Becker 2005). LCD notebook displays are expected to increase from a 14.5-inch display size in 2005 to an average size of 14.8 inches in 2008. Worldwide sales are predicted to grow from about 55 million pieces in 2005 to over 85 million pieces in 2008 (DisplaySearch 2004). U.S. markets for LCDs are expected to increase at an annual rate of 17 percent to reach about $14 billion by 2008 (Freedonia 2004).

Updated Report: April 24, 2008 8
Technical difficulties with early LCD panel televisions have largely been overcome in recent years, and the market for LCD televisions is booming. Sharp Corporation, Samsung and LG Philips are producing ever-larger panels; 40-inch to 45-inch LCD televisions are widely available, and Sharp Corporation has announced the successful manufacture of a 65-inch panel. In March 2005, Samsung announced an 82-inch high definition television (HDTV) TFT-LCD panel and in 2006 Sharp announced a 108-inch LCD. LCD television sales are projected to grow from about 9 million pieces and an average display diagonal of 21.3 inches (average display area 218 square inches) in 2004 to about 55 million pieces and a display diagonal of 30.4 inches in 2008 (average display area of 480 square inches). 2.2 Plasma Displays
A plasma display is an emissive flat panel display where light is created by phosphors excited by a plasma discharge between two flat panels of glass. A mixture of noble gases (neon and xenon), which is inert, is used to produce the gas discharge. Plasma displays do not use mercury. The word “plasma” refers to an ionized gas, and is usually considered to be a distinct phase of matter. It refers to a system of charged particles that is large enough to behave collectively; even a gas in which as little as 1 percent of the particles are ionized can behave as a plasma and have the characteristics of a plasma. Plasmas are the most common phase of matter, comprising more than 99 percent of the visible universe. Examples of plasmas found in nature include flames, lightning, the Northern Lights, and the sun and stars. Artificially produced plasmas include rocket exhaust, the electric arc in an arc lamp or arc welder, and the inside of neon signs and fluorescent lamps. Plasma displays are bright, have a wide color range, and can be produced in fairly large sizes (up to 80 inches). The display panel is 2 1/2 inches thick. Plasma display panels use as much power per screen area as a CRT; the larger screen sizes can use up to 700 watts of power, enough to make some critics worry about the environmental consequences of wide adoption of plasma displays (Mann 2004). In addition, plasma displays are susceptible to screen burn, a phenomenon where images can be permanently imprinted on the screen if the device is left on for too long a period. This will limit plasma technology’s penetration into the potentially high-volume personal computer market (Freedonia Group 2004). 2.2.1 History
The plasma display panel was invented in 1964 by Donald L. Bitzer and H. Gene Slottow at the University of Illinois. The original monochrome (usually orange or green) panels were popular in the early 1970s because the displays were rugged and did not need memory or refresh circuitry. Sales declined in the late 1970s as semiconductor memory made CRT displays inexpensive. In 1975, Larry Weber of the University of Illinois worked to create a color plasma display, and finally achieved this goal in 1995. Today, the superior brightness and viewing angle of color plasma panels have resulted in a resurgence of popularity, particularly for use in televisions. 2.2.2 Technology
Plasma displays contain xenon and neon gas in hundreds of thousands of tiny cells positioned between two plates of glass. Two types of long electrodes are also sandwiched between the glass plates, on both sides of the cells. The “address” electrodes are located behind the cells

along the rear glass plate, while the transparent “display” electrodes are mounted above the cell, along the front glass plate. The display electrodes are surrounded by an insulating dielectric material and covered by a magnesium oxide protective layer. In a monochrome plasma panel, the electrodes that cross paths at a cell are charged by the control circuitry, causing the plasma to ionize and emit photons between the electrodes. The ionizing state is maintained by applying a low-level voltage between all the horizontal and vertical electrodes, even after the ionizing voltage is removed. To erase a cell, all voltage is removed from a pair of electrodes. This type of panel has inherent memory and does not use phosphors. To ionize the gas in a color panel, the electrodes that intersect at a cell are charged thousands of times in a small fraction of a second, charging each cell in turn. When the intersecting electrodes are charged, an electric current flows through the gas in the cell. The current creates a rapid flow of charged particles, which stimulates the gas atoms to release ultraviolet photons. The phosphors in a color plasma display give off colored light when they are excited. Each pixel is made up of three separate subpixel cells, each with different colored phosphors (red, green, and blue). By varying the pulses of current flowing through the different cells, the control system can increase or decrease the intensity of each subpixel color to create hundreds of different combinations of red, green and blue, across the entire visible spectrum. Electronic control of the pixels is relatively simple, and therefore manufacturing is inexpensive compared to other display technologies. Plasma displays use the same phosphors as CRTs.
Figure 2-2. Simple Composition of the Alternating Current Plasma Display Panel with Matrix Electrode Design. Source: Jari Laamanen March 2007
http://commons.wikimedia.org/wiki/Image:Plasma-display-composition.svg
Updated Report: April 24, 2008 9

Updated Report: April 24, 2008 10
2.2.3 Manufacturing
In the 1970s and 1980s, many companies were interested in research on plasma displays, and took out licenses from the University of Illinois. Among them were computer manufacturers such as IBM, and television manufacturers such as RCA, Zenith, and General Electric. Due to long development time and high cost, most of the US manufacturers resigned in the 1980s. The last of them was IBM in 1987. Today in the US, only a small plasma manufacturing industry remains; this serves specialized instrumentation displays to the Pentagon. Among the remaining manufacturers are Photonics Systems, Planar Systems, ViewSonic, L-3 Communications, and Vishay Intertechnology (Freedonia 2004). A number of Japanese companies took out licenses from University of Illinois and built up their own plasma display research programs. These companies made important developments based on the original technology from University of Illinois. Among them are Hitachi, Matsushita, Sony, NEC, and especially Fujitsu. Other manufacturers include Chungwha Picture Tubes, LG Electronics, Samsung Electronics, Sanyo Electric, and Sharp. In Japan, plasma displays are widely used in cash registers, public signs and meters since they were a solution to the problem of displaying Kanji script, something that alphanumeric computer displays of that time could not do (Hutchinson 2003). 2.2.4 Market Trends
Plasma displays are mostly used for high quality large-format video applications. With the costs for such systems still high compared to LCDs, plasma displays are positioned at the high-end sector of the display market. Televisions are currently the primary market for plasma displays. Plasma displays have a necessary minimum viewing distance, which greatly restricts their in-home use. Due to issues with flickering of plasma displays, their use for computer systems is currently of limited interest. U.S. markets for plasma displays are expected to increase at an annual rate of 35 percent to reach about $1.8 billion by 2008 (Freedonia 2004). This is one of the fastest growth rates expected for any electronic product over this time span. The growth will be mainly due to the increasing popularity of large plasma televisions (42-inches and larger). Other areas that hold promising prospects for plasma displays are avionics displays, medical instruments, and industrial measuring and control devices. The U.S. market is dominated by Asian suppliers: Fujitsu-Hitachi, Chungwha Picture Tubes, LG Electronics, NEC, Samsung Electronics, Sanyo Electric, and Sharp. 2.3 Other types of Flat Panel Displays
A variety of flat panel display technologies have been developed or are currently under development. The most important technologies (besides LCD and plasma) used in flat panel displays include the following:
• Microdisplays; • Electroluminescent Displays; • Light Emitting Diode arrays; • Organic Light-Emitting Diode
Displays;
• Field Emission Displays; • Liquid Crystal on Silicon (LCOS)
displays; and • Vacuum Fluorescent Displays.

Updated Report: April 24, 2008 11
This section provides brief information about each of these, however the remainder of the report will focus on the technologies that are most likely to be used in mass production of devices such as flat screen TVs, computer monitors and notebook displays. 2.3.1 Microdisplays
Microdisplays are displays that are so small that magnifying optics are needed to use them. A variety of flat panel technologies can be used to manufacture microdisplays. These include electroluminescence, OLED, vacuum fluorescence, LCOS, OLED on silicon, and tilted mirrors. These technologies are described below. They hold potential for a variety of uses, including high definition television (HDTV), projection systems, and near-to-eye devices such as viewfinders for digital cameras. Microdisplays are lightweight and can fit into small units. Demand for microdisplays is expected to grow at a rate of 21 percent per year, and is anticipated to reach $750 million by 2008 (Freedonia 2004). The Micro Electrical Mechanical Systems (MEMS) used in these devices are the subject of intensive product research and development activity, and represent an important emerging technology. 2.3.2 Electroluminescent Displays
Electroluminescent display (ELD) technology is used to produce very thin display screens and is mainly used in portable computers. The origin of ELDs lies in scientific discoveries that were made during the first decade of the twentieth century. However, commercially they did not become viable products until the1980s. They are particularly useful in applications that require ruggedness of the display, high display speed, brightness, high contrast, and where a wide angle of vision is needed and at the same time full color is not necessarily required. In recent years, color ELD technology has advanced significantly, especially for microdisplays. Inside an ELD screen, a thin film of phosphorescent substance is sandwiched between two plates. One plate is coated with vertical wires and the other with horizontal wires, forming a grid. The phosphorescent film at the intersection of the wires glows, creating a display pixel, when electrical current is passing through the respective horizontal and vertical wires. The two main firms that have developed and commercialized ELDs are Sharp in Japan and Planar Systems in the United States (Hart et al. 1999). The US market for ELDs is expected to grow from $55 million in 2003 to about $75 million in the year 2008 (Freedonia 2004). Growth in demand matches those of microdisplays and LED arrays but with a lower market share. Nevertheless, depending on future innovations and actual market development, ELDs could potentially become an important technology for flat panels. 2.3.3 Light-Emitting Diode (LED) Arrays
A light-emitting diode (LED) is a semiconductor device that emits narrow-spectrum light; this effect is a form of electroluminescence. The color of the emitted light depends on the chemical composition of the semiconducting material used, and can be near-ultraviolet, visible or infrared. Common materials used include compounds of aluminum, gallium, arsenic, zinc, selenium, indium, nitrogen, phosphorus, indium, and silicon. LEDs are used as information indicators in various types of systems, in thin, lightweight message displays, instrument displays, flashlights, and as a light source in fiber optic communications. LED panels may be used indoors or

outdoors; the largest LED display in the world is 118 feet high in Times Square, New York City. Demand for LED arrays is expected to reach $225 million in 2008 (Freedonia 2004). 2.3.4 Organic Light-Emitting Diodes (OLEDs)
An organic light-emitting diode (OLED) is a thin-film light-emitting diode (LED) in which the emissive layer is an organic compound. When the emissive layer is an organic polymer, varying amounts of OLEDs can be deposited in arrays on a screen using simple “printing” methods to create a graphical color display. They may be used in television screens, computer displays, portable systems screens, and in advertising and information boards. OLEDs are available as “distributed” sources, while standard inorganic LEDs are point sources of light. OLEDs do not require a backlight to function, so they use far less power and can be used with small portable devices such as digital cameras and cell phones. There are two main types of OLEDs: small-molecule OLEDs (SM-OLEDs), developed by Eastman-Kodak, and polymer light emitting diodes (PLEDs), developed by Cambridge Display Technologies. The SM-OLEDs are produced using vacuum deposition, which makes the production process expensive and inflexible. PLEDs, also known as Light-Emitting Polymers (LEPs), are easier to produce. No vacuum is required, and the emissive materials can be applied on the substrate by a technique derived from commercial inkjet printing. Because of this, they have substantially lower cost to manufacture than LCDs or plasma displays, and can be produced in large sizes. The fact that OLEDs can be printed onto flexible substrates opens the door to new applications such as roll-up displays or displays embedded in clothing (Howard 2004).
Figure 2-3. Structure of an Organic Light-Emitting Diode Source: PC Technology Guide, www.pctechguide.com, November 2005.
OLEDs work on the principle of electroluminescence. A thin film of luminiphore is sandwiched between electrodes to create “excitons.” The excitons consist of a bound, excited electron and a hole pair; when the electron and hole combine, a photon is emitted. Derivatives of PPV, poly(p-phenylene vinylene) and poly(fluorene), are commonly used as polymer luminiphores in
Updated Report: April 24, 2008 12

Updated Report: April 24, 2008 13
OLEDs. Indium tin oxide is a common transparent anode, while aluminum or calcium are common cathode materials. The global market for OLEDs is expected to grow very rapidly over the next decade. Analysts expect an annual increase of 53 to 56% between 2003 and 2008 (OLED Market Trends; Freedonia 2004). U.S. sales are projected to reach $500 million by 2008. 2.3.5 Field Emission Displays (FEDs)
A field emission display (FED) is a type of flat panel display that uses phosphor coatings as the emissive medium. Although similar to CRTs, they are only a few millimeters thick. Instead of a single electron gun, an FED uses a large array of fine metal tips or carbon nanotubes (which are very efficient electron emitters), one positioned behind each phosphor dot, to emit electrons through a process known as field emission. A similar technology in development is the surface-conduction electron-emitter display (SED). FEDs are more energy efficient than LCDs or plasma displays, and can be cheaper to make because they have fewer components. Currently, small demonstration panels have been produced but the technology is not commercially available for the consumer market at this time. 2.3.6 Liquid Crystal on Silicon (LCOS)
Liquid crystal on silicon (LCOS) is a microdisplay technology that is typically applied in projection televisions. It is a reflective technology, but uses liquid crystals instead of individual mirrors. In LCOS displays, liquid crystals are applied directly to the surface of a silicon chip coated with an aluminized layer making it highly reflective. There may also be a polyimide alignment layer. As the liquid crystals open and close, the light is either reflected from the mirror below, or blocked. The LCOS technology requires less optical quality glass than do LCD and plasma displays, which makes it less expensive to manufacture devices such as televisions. This technology is the subject of intensive research and development activity, and represents an important emerging technology (Freedonia 2004). 2.3.7 Vacuum Fluorescent Displays
Vacuum Fluorescent Displays (VFDs) are well established on the market and offer a good alternative where very low-cost displays are needed, in low information content applications. They are frequently used for alpha-numeric applications where their characteristics of good brightness and contrast, wide viewing angle, and flexibility are important. VFDs are widely used in consumer products such as CD players, clocks, radios, and microwave ovens. The VFD consists of a cathode (filaments), anodes (phosphor) and grids encased in a glass envelope under a high vacuum condition. The cathode is made up of fine tungsten wires, coated by alkaline earth metal oxides, which emit electrons. These electrons are controlled and diffused by the grids, which are made up of thin metal. This display consumes a large amount of power, which is a disadvantage for use in battery-operated equipment such as calculators. Demand for VFDs is expected to reach $175 million by 2008.

Updated Report: April 24, 2008 14
2.3.8 Future Development
Additional technologies under development include:
• Nano-emissive displays (based on carbon nanotubes).
• Surface-conduction electron-emitter displays, which use surface conduction electron emitters for every individual display pixel.
• Electrochromic displays, which are reflective displays using electrochromic materials to
switch pixels on and off; electrochromic materials change color when the oxidation state of the material is changed by an applied voltage.
• Zenithal bistable device (ZBD), developed by QinetiQ, which can retain an image without
power.
• A French company, Nemoptic, has developed another zero-power paper-like LCD technology, which has been mass-produced in Taiwan since 2003. This technology is intended for use in low-power mobile applications such as e-books and wearable computers.

Updated Report: April 24, 2008 15
Section 3: Potentially Hazardous Constituents
Flat panel display (FPD) devices are known to contain some potentially toxic or hazardous constituents. This section reviews various FPD constituents and highlights those that may be hazardous to human health and the environment. Section 3.1 lists components and materials in FPD devices reported by the electronics industry and researchers. Section 3.2 highlights the toxic or hazardous nature of individual constituents, including uncertainties about the toxicity of particular constituents. The purpose of this section is to provide a broad overview of known or suspected hazards associated with individual FPD constituents. The section is not intended to evaluate specific human health or ecological risks associated with end-of-life management of FPDs. Potential impacts of FPD devices are dependent not only on the hazardous nature of the constituent but on the quantities present and the type of exposure. The relative quantities, release potential, and specific exposure scenarios during end of life management will ultimately influence the degree of risk to both human and ecological receptors. The extent to which identified hazardous constituents may be present in waste streams and the likely exposure or release potential during end-of-life management are described more fully in Sections 5 and 6, respectively. 3.1 FPD Constituents
Researchers at the University of Florida, funded by EPA Regions 4 and 5, studied discarded electronic devices and identified the component materials of various types of devices including FPD devices that contained liquid crystal display (LCD) screens (Townsend et al. 2004). Also, a Computer Display Project under EPA’s Design for the Environment Program compiled an inventory of materials throughout the life cycle of desktop computer displays, including those associated with LCD and cathode ray tube (CRT) technologies (Socolof et al. 2001). The results of this collective research indicate that FPD devices consist primarily of the following types of material:
• Ferrous metal (25% to 44%);
• Plastic (28% to 31%);
• Glass (10% to 23%);
• Printed wire board (6% to 10%);
• Nonferrous metal (3% to 9%);
• Wires (4%); and
• Other materials, including cold cathode fluorescent lamps (CCFLs) or tubes and liquid crystals (<1%),

Updated Report: April 24, 2008 16
Table 3-1 presents a list of individual materials and the associated components and parts of the increasingly popular LCDs. Computer displays using CRT technology contain many of the same components with the primary exception of liquid crystals. Of the various constituents in these devices, those most often identified as posing a potential concern for the management of electronic wastes include metals, such as lead and mercury, brominated flame retardants, and plastic polymers (Socolof et al 2001; FWI 2001). Lead and lead compounds are present in both LCD and CRT devices. Lead may be found in the solder used to make printed wiring boards and their components. Solder typically contains 37 to 40 percent lead (Socolof et al. 2001; FWI 2001). In addition, some lead may be contained in fluorescent tubes and in the batteries of early laptop computers (Nordic Council of Ministers, as cited in FWI 2001). Alternatives to lead are being developed by the electronics industry, including lead-free solders and glass components. It is the subject of much industry research to reduce or eliminate its use. Mercury is used in the manufacture of the cold cathode fluorescent lamps (CCFLs) that backlight LCD panels. A typical LCD uses two CCFLs, but larger displays may use as many as eight. Estimates of the quantity of mercury used in a 15-inch LCD display assembly range from 4 to 5 milligrams (mg) of mercury (Socolof et al. 2001; FWI 2001) to 5 to 10 mg of mercury (HDP User Group 2003). Mercury-containing bulbs are energy-efficient and cost-effective, and no clear alternatives exist at this point in time. Manufacturers are currently working to develop alternative backlights that eliminate mercury and improve on the optical characteristics of the displays. Other metals of interest include antimony, beryllium, cadmium, and chromium. Antimony appears as a trace element in telecommunications products as a flame retardant (FWI, 2001). A small percentage of beryllium (2-4%) is used in the beryllium-copper alloys used in clips and “fingers” used in FPD assemblies. The most common use of cadmium is in nickel-cadmium (Ni-Cd) batteries, which were used extensively in earlier laptop computers. These have since been largely replaced by lithium-ion or metal-hydride batteries. Other uses of cadmium include as a stabilizer in plastic components and use as a color pigment. Cadmium sulfide is used as a phosphorescent coating on the inside of fluorescent monitor screen (5 to 10 g per screen), and is added to PVC plastic insulation of wires and cables as a plastic stabilizer and flame retardant (FWI 2001). Chromium VI, or hexavalent chromium, is reportedly used as a hardener or stabilizer for plastic housings as well as a colorant in pigments; quantities of chromium VI used in FPD and other electronic equipment do not appear to be well-documented but are believed to be trace amounts. LCD technology introduced the family of liquid crystals—organic mixtures which continue to be studied as the technology evolves. Approximately 1.2 g of liquid crystal mixture is used to manufacture a 15-inch LCD (Socolof et al. 2001). According to Merck, only 0.35 g of liquid crystals are present in a 15-inch panel (REF). Merck further reports that liquid crystals comprise only about 0.13% per display and 0.02% per overall device (Merck, 2004). In 2001, about 70 tons of liquid crystals were manufactured worldwide. Another constituent introduced with LCD technology is indium tin oxide (ITO). Indium is a natural element that, combined with tin, is widely used as a transparent wire. ITO electrodes are attached to the glass plates that sandwich the liquid crystals in LCDs. Approximately 0.5 g of ITO is used in each 15-inch display (Socolof et al. 2001).

Updated Report: April 24, 2008 17
Table 3-1. List of Materials Used in the Manufacture of LCDs
Material Component Part Aluminized mylar Backlight assembly Corner tape Aluminum LCD assembly; power
supply assembly Glass panel assembly (thin film transistor); heat sink
Beryllium copper LCD assembly; rear cover assembly
Metal clip, beryllium-copper fingers
Boroslicate LCD assembly Glass panel assembly Brass Backlight assembly Brass threaded stand off Cellulose triacetate-acrylic LCD assembly Glass panel assembly (polarizers) Chromium LCD assembly Glass panel assembly (thin film transistor) Copper LCD assembly; backlight
assembly; power supply assembly; controller
Glass panel assembly (row/column drivers, connection flex, wires/connectors); light assembly (cables); backlight; printed wiring board; power cord receptacle
Foam rubber Backlight assembly Gasket Glass Backlight assembly Light assembly (cold cathode tube) Hi-mu ferric Backlight assembly Flat cable toroid Indium-tin oxide (ITO) LCD assembly Glass panel assembly (electrode) Iodine LCD assembly Glass panel assembly (polarizers) Lead LCD assembly Solder Liquid crystals LCD assembly Glass panel assembly Mercury Backlight assembly Light assembly (cold cathode fluorescent
lamp) Molybdenum LCD assembly Glass panel assembly (thin film transistor) Nylon Backlight assembly;
base/stand assembly Nylon clamp; strain relief bushing
Phospors Backlight assembly Light assembly (cold cathode tube) Plastics and plasticizers (phthalates)
Power supply assembly; rear cover assembly; base/stand assembly
Power cord receptacle; rear cover; covers
Plexiglass Backlight assembly Clear protector Polycarbonate Backlight assembly Light pipe, rear plate assembly; plastic tube Polycarbonate, glass-filled LCD assembly Plastic frame Polyester LCD assembly; power
supply assembly; backlight assembly; rear cover assembly
Brightness enhancer; insulator; power switch; opaque diffuser; white reflector; cloth mesh; insulator
Polyester, glass-filled Base/stand assembly Upright Polymide LCD assembly Glass panel assembly (orientation film) Polyoxymethylene (acetal) Base/stand assembly Swivel bearing Resins LCD assembly Glass panel assembly (color filters)

Table 3-1 (Continued)
Updated Report: April 24, 2008 18
Material Component Part Silicon Controller; power supply
assembly; LCD assembly; backlight assembly
Glass panel assembly (thin film transistor, row/column driver tabs and printed wiring boards)
Silicone rubber LCD assembly; backlight assembly; base/stand assembly
Gaskets; light assembly (shock cushion); rubber feet
Soda lime LCD assembly Glass panel assembly (glass) Stainless steel Base/stand assembly Swivel bearing Steel (iron) Power supply assembly;
backlight assembly; LCD assembly; rear cover assembly; base/stand assembly
Housing; screws; metal plate; rear plate; hold-down plate; meal plate brackets; washers; axle and spring; base weight; C-clip
Source: Socolof et al. 2001

Updated Report: April 24, 2008 19
Plastics are another material widely used in the electronics industry, with polyvinyl chloride (PVC) being one of the major plastic polymers (FWI, 2001). The main use of PVC plastic in flat panels is in the monitor housing and cables. Many PVC formulations contain additional chemicals: organotin; lead and cadmium-based stabilizers, and plasticizing (softening) additives in flexible PVC, including phthalates. In addition, flame retardants have historically been incorporated into various plastic electronic equipment components. Those receiving the most attention are brominated flame retardants. Section 5.4 presents more detail on the types and quantities of materials that are used in the manufacture of FPDs that may be entering the waste stream, with focus on lead, mercury, liquid crystals, and flame retardants in flat panel televisions, laptop computers, and flat panel computer monitors. 3.2 Toxicity of FPD Constituents
This subsection presents an overview of what is known and not known about the toxicity of the constituents in FPD devices. Summaries of the effects of the more well-studied FPD constituents as documented in the literature are kept relatively brief. More discussion is provided on those constituents for which studies are ongoing or inconclusive. Documenting the potential toxicity and hazards of FPD constituents requires consideration of a myriad of factors, including but not limited to evidence from human and animal studies documenting irritant or other acute effects; various organ system effects (e.g., central nervous system, lung, kidney, liver); functional effects such as immune system or developmental effects; and known or suspected constituent carcinogenicity. Also of interest are constituent bioaccumulation potential and bioavailability, as both affect a constituent’s potential toxicity. Of the constituents identified in Section 3.1, the human health and environmental effects associated with lead, mercury, and other heavy metals, are fairly well described in the scientific literature. Research is ongoing on other inorganic constituents (e.g., plasma gases, indium-tin oxide [ITO]) and organic compounds such as brominated flame retardants (BFRs), plastics and plasticizers (phthalates), and liquid crystals. As such, less definitive conclusions can be made about the toxicity of these constituents. Several data sources were reviewed to identify relevant toxicity information on FPD constituents. Where possible, particularly for the more well-studied constituents (e.g., mercury, lead, and other metals), authors of this report relied upon data from the most up-to-date peer-reviewed databases or toxicity reviews prepared by governmental or other reliable scientific bodies (e.g., National Library of Medicine resources such as the Hazardous Substance Data Bank [HSDB] and Haz-Map; the Agency for Toxic Substances and Disease Registry [ATSDR] toxicological profiles; EPA’s Integrated Risk Information System). As needed, authors also sought and reviewed data Material Data Safety Sheets (MSDSs) and studies generated by material manufacturers, and in a limited number of cases from the primary published peer-reviewed scientific literature. Due to the proprietary nature of data related to some constituents of concern (in particular liquid crystals), complete data sets could not be reviewed in all cases.

Updated Report: April 24, 2008 20
Tables 3-2 and 3-3 provide an at-a-glance look at known or suspected toxic properties of the various inorganic and organic FPD constituents. It presents U.S. EPA’s cancer classifications (and brief descriptions, per table footnotes), primary documented acute and chronic health effects, along with reported ecological effects. Most of the reported acute effects have been associated with high level human exposures to individual constituents in a variety of occupational settings; some are based on documented poisonings. Where pertinent, the exposure route(s) of primary concern from a toxicity perspective are noted. The sections that follow provide more detail on what is known and not known about individual inorganic (Section 3.2.1) and organic (Section 3.2.2) constituents, and where data gaps or uncertainties may exist. 3.2.1 Inorganic Constituents
Heavy Metals
As shown in Table 3-2, many of the metals and metal compounds used in the manufacture of FPD devices are associated with a wide range of adverse health effects, ranging from mild irritant effects to serious longer-term illnesses in both children and adults. Many of these metals are most hazardous when inhaled as a dust or fume (e.g., antimony, beryllium, cadmium, chromium VI). Some are known or suspected carcinogens. Most are known to persist in the environment, and generally bioaccumlate in fish and wildlife. The extent of uptake and/or harm incurred by plants varies element by element and depends on local soil conditions. Metal-contaminated dust deposition on soils and plants serves as the primary vehicle for movement up the food chain. As noted above, lead and mercury continue to be among the most closely watched and managed constituents due to their persistence and well-documented toxicity. Lead has been studied quite extensively. The main target for lead toxicity is the central and peripheral nervous systems, including developmental effects in children. Lead exposures also are linked with kidney and reproductive system effects, as well as cancer (ATSDR, 2005). The primary health effects of mercury are on the neurological development of children; effects depend on the level of exposure but may include decreases in IQ, development delays, mental retardation, blindness, muscle weakness, and inability to speak (USEPA 1999b; ATSDR 1999). Children, infants, and fetuses are more vulnerable to the effects of lead and mercury; both can be passed from a pregnant woman to her unborn child. Indium Tin Oxide (ITO)
Limited information on the toxicity of indium compounds is available. Indium is believed to be moderately toxic, with potential liver, heart, and kidney effects. It is mildly irritating when inhaled. A recent study describes a case of fibrotic lung disease after a 4-year exposure to ITO (Homma et al., 2005). Following the first report on lethal lung injury in an ITO worker in 2001, industrial physicians in a Japanese plant conducted pulmonary check-ups for 115 workers. Interstitial pulmonary disease was reported in three workers who had engaged in wet-surface grinding of ITO for 8 to 12 years (Taguchi and Chonan, 2006). According to Homma et al. (2005) and Taguchi and Chonan (2006), inhaled indium compounds may cause new and unique lung diseases that warrant preventive measures.

Updated Report: April 24, 2008 21
Table 3-2. Toxicity of Inorganic FPD Constituents
Constituent
U.S. EPA Cancer
Classificationa Acute Effects Chronic Effects Ecotoxicity Aluminum Not classifiable Low acute toxicity;
minor eye and lung irritation in dust formb
Respiratory effects, asthma; possible neurological effects; possible dermal sensitivity;a low ingestion toxicity -poorly absorbed in the GI tractb
Adverse effects in aquatic species; high concentrations likely toxic to birds and mammalsb
Antimony Not evaluated Nasal irritation and GI symptoms upon exposure to dustb
Possible cardiovascular and respiratory effects; contact allergyb,d
NR
Beryllium Probable human carcinogen (inhalation)
Skin, eye, mucous membranes, and respiratory irritations; acute beryllium disease: shortness of breath, coughing, chest pain, rapid heart rates; acute dermatitisb
Lung disease characterized by scarring of the lungs; inflammatory lung disease; impaired lung function;b beryllium sensitization in subset of population
NR
Borosilicate (fibrous glass)
Not evaluated Nuisance dust; skin rashesc
NR NR
Cadmium Probable human carcinogen (inhalation)
Irritation of the digestive and respiratory tract; swelling and scarring of the lungsd
Respiratory and kidney effects; hypertensiond
Accumulation potential in fish, wildlife, plantsb
Chromium VI Known human carcinogen (inhalation)
Nasal irritation; skin ulcers;d allergic reactions;c gastrointestinal effects upon ingestiond
Kidney and gastrointestinal effectsd
No accumulation in fishd
Copper Not evaluated Eyes, nose, and respiratory irritant; nausea, vomiting, diarrhea, stomach crampsb,d
Essential nutrient; long-term effects not well-studied
NR
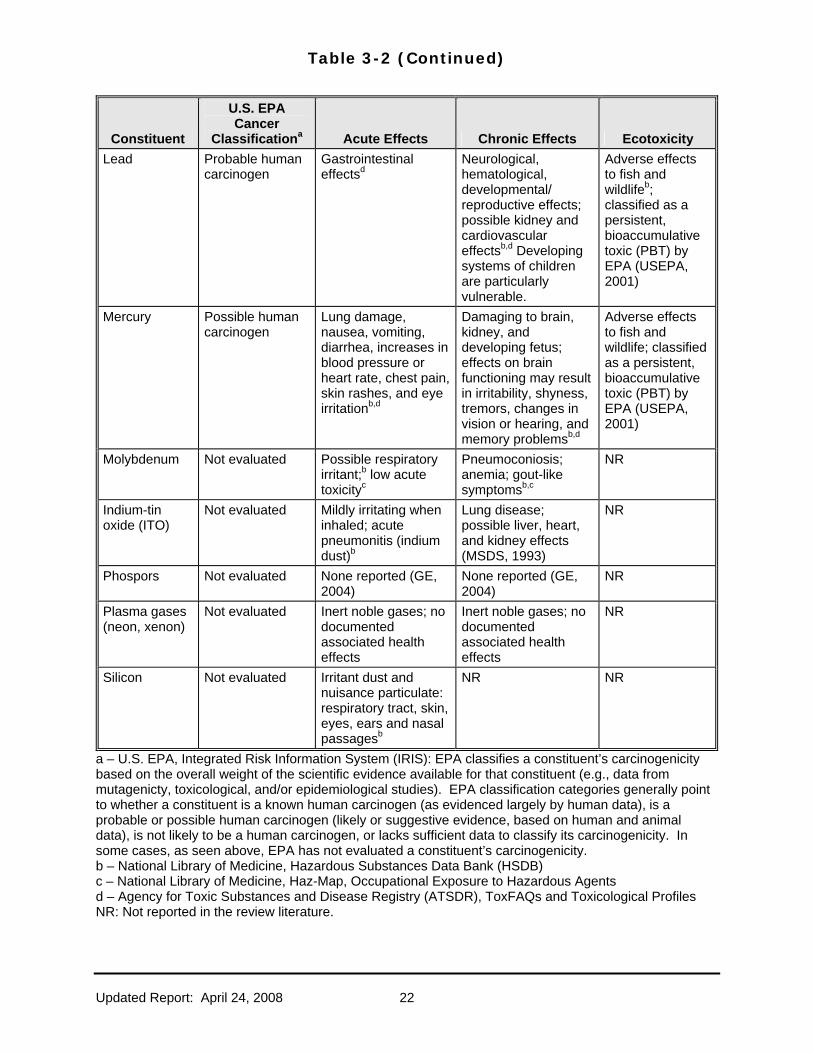
Table 3-2 (Continued)
Updated Report: April 24, 2008 22
Constituent
U.S. EPA Cancer
Classificationa Acute Effects Chronic Effects Ecotoxicity Lead Probable human
carcinogen Gastrointestinal effectsd
Neurological, hematological, developmental/ reproductive effects; possible kidney and cardiovascular effectsb,d Developing systems of children are particularly vulnerable.
Adverse effects to fish and wildlifeb; classified as a persistent, bioaccumulative toxic (PBT) by EPA (USEPA, 2001)
Mercury Possible human carcinogen
Lung damage, nausea, vomiting, diarrhea, increases in blood pressure or heart rate, chest pain, skin rashes, and eye irritationb,d
Damaging to brain, kidney, and developing fetus; effects on brain functioning may result in irritability, shyness, tremors, changes in vision or hearing, and memory problemsb,d
Adverse effects to fish and wildlife; classified as a persistent, bioaccumulative toxic (PBT) by EPA (USEPA, 2001)
Molybdenum Not evaluated Possible respiratory irritant;b low acute toxicityc
Pneumoconiosis; anemia; gout-like symptomsb,c
NR
Indium-tin oxide (ITO)
Not evaluated Mildly irritating when inhaled; acute pneumonitis (indium dust)b
Lung disease; possible liver, heart, and kidney effects (MSDS, 1993)
NR
Phospors Not evaluated None reported (GE, 2004)
None reported (GE, 2004)
NR
Plasma gases (neon, xenon)
Not evaluated Inert noble gases; no documented associated health effects
Inert noble gases; no documented associated health effects
NR
Silicon Not evaluated Irritant dust and nuisance particulate: respiratory tract, skin, eyes, ears and nasal passagesb
NR NR
a – U.S. EPA, Integrated Risk Information System (IRIS): EPA classifies a constituent’s carcinogenicity based on the overall weight of the scientific evidence available for that constituent (e.g., data from mutagenicty, toxicological, and/or epidemiological studies). EPA classification categories generally point to whether a constituent is a known human carcinogen (as evidenced largely by human data), is a probable or possible human carcinogen (likely or suggestive evidence, based on human and animal data), is not likely to be a human carcinogen, or lacks sufficient data to classify its carcinogenicity. In some cases, as seen above, EPA has not evaluated a constituent’s carcinogenicity. b – National Library of Medicine, Hazardous Substances Data Bank (HSDB) c – National Library of Medicine, Haz-Map, Occupational Exposure to Hazardous Agents d – Agency for Toxic Substances and Disease Registry (ATSDR), ToxFAQs and Toxicological Profiles NR: Not reported in the review literature.

Updated Report: April 24, 2008 23
Table 3-3. Toxicity of Organic FPD Constituents
Constituent U.S. EPA Cancer Classificationa Acute Effects Chronic Effects Ecotoxicity
Liquid crystals Not evaluated Possible eye and skin irritation, but not expected at concentrations seen in liquid crystal mixturesb,c
Not evaluated Low aquatic toxicity based on available evaluations
Polybrominated diphenyl ethers (PBDEs)
DecaBDEs: Possible human carcinogen Other PPDEs: Not classifiable
Possible effects on breathing ratesd
Range of effects being evaluated, including thyroid, liver, immunological, and developmental effectsd
Relatively low aquatic toxicity; uncertainty remainsg
Plexiglass Not evaluated Occupational asthmaf
NR NR
Polyoxymethylene (paraformaldehyde)
Not evaluated [Formaldehyde: suspected human carcinogen]
Skin, eye, respiratory system irritantg
Possible respiratory and reproductive, effects (formaldehyde)g.
NR
Polyvinyl chloride Not evaluated by EPA; not classifiable (IARC)e
Occupational asthmac
Possible respiratory and liver effectsg
NR
Phthalates Probable human carcinogen (some forms)
Upper respiratory tract irritantg; Mild gastrointestinal disturbances, nausea, and vertigoh
Possible liver, reproductive, and developmental effects (based on individual phthalates)i
NR
a – U.S. EPA, Integrated Risk Information System (IRIS): EPA classifies a constituent’s carcinogenicity based on the overall weight of the scientific evidence available for that constituent (e.g., data from mutagenicty, toxicological, and/or epidemiological studies). EPA classification categories generally point to whether a constituent is a known human carcinogen (as evidenced largely by human data), is a probable or possible human carcinogen (likely or suggestive evidence, based on human and animal data), is not likely to be a human carcinogen, or lacks sufficient data to classify its carcinogenicity. In some cases, as seen above, EPA has not evaluated a constituent’s carcinogenicity. b – Becker, 2003 c – Becker and Simon-Hettich, 2007 d – ATSDR, 2004 e – International Agency for Research on Carcinogens (IARC) f – National Library of Medicine, Haz-Map, Occupation exposures to Hazardous Agents g – National Library of Medicine, Hazardous Substances Data Bank (HSDB) h – U.S. EPA, 2005 i – CDC, 2005

Updated Report: April 24, 2008 24
Phosphors
Fluorescent phosphors may contain antimony, manganese, yttrium, tin and other metal compounds (Socolof et al. 2001). The only information identified on the potential toxicity of these phosphors was from an MSDS prepared by General Electric (GE) for fluorescent lamps. GE reports two types of phosphor systems. One system uses calcium choro-fluoro-phosphate with small amounts of antimony and manganese. The other system uses a mixture of rare earth elements such as yttrium used as oxides or phosphates, along with barium/aluminum oxide. GE reports no significant adverse effects, either by ingestion, inhalation, skin contact, or eye implant in a 5-year animal study conducted by the IH Foundation of the Mellon Institute, and no "significant" adverse effects on humans by any of these routes during the many years of manufacture (GE, 2004). 3.2.2 Organic Constituents
Liquid Crystals
Manufacturers have conducted a fairly wide range of testing to evaluate the potential for harmful effects associated with liquid crystals. The findings of liquid crystal compounds and mixtures tested to date generally suggest a low toxicity to humans and ecological receptors and that test compounds are not mutagenic. Though much of the underlying data were unavailable for review for proprietary reasons, tests were reportedly conducted in accordance with international guidelines set forth for industrial chemicals (e.g., Organization for Economic Cooperation and Development [OECD], European Union [EU]) and prior to introduction to the market. According to manufacturers, tested liquid crystals are representative of untested liquid crystal compounds. Further, no liquid crystal is introduced in the market if it is shown to be acutely toxic or mutagenic. More detail on liquid crystal toxicity from available study data is presented below. Liquid crystals are organic compounds with optical and structural properties of crystals but with the mechanical features of fluids. In general, they consist of polycyclic aromatic hydrocarbons such as phenylcyclohexanes and biphenyls (EIAJ 1996). There are hundreds of liquid crystal compounds that are used in LCDs, and a typical LCD contains as many as 25 different compounds that are mixed together to form a white, opaque liquid that flows easily. Each of these liquid crystal compounds has different physical and optical characteristics. Liquid crystals are low molecular weight compounds with very low solubility and low vapor pressures (Broschard et al. 2000). Some liquid crystals are not readily biodegradable (Becker et al., 2003). The make-up of specific liquid crystal compounds is proprietary; however, it should be noted that as of 2006, many contain fluorinated compounds. Three manufacturers are responsible for 90 percent of liquid crystal production - Merck KGaA, Dainippon Ink and Chemicals [DIC], and Chisso Corporation. These companies have conducted testing for acute toxicity and irritant effects on skin and eyes, as well mutagenicity testing in bacteria and mammalian cells. Mutagenicity tests are generally used in evaluating the carcinogenic potential of an agent. Some skin sensitization study data also are available. The most comprehensive publicly available summary of liquid crystal toxicity was generated by Merck, as summarized in Becker et al. (2003), with a more recent update in 2007 (Becker and Simon-Hettich, 2007). According to Merck, testing data presented are representative of materials produced by other liquid crystal manufacturers. Merck’s findings can be summarized as follows:

Updated Report: April 24, 2008 25
• Liquid crystals in production are not acutely toxic. Of the 261 substances tested, 252 (97%) did not show any potential for acute toxicity; 8 substances had an LD50 of less than 2,000 milligrams per kilogram (mg/kg) body weight (classified as “harmful” by the European Union) and one substance had an LD50 of less than 200 mg/kg body weight (classified by the European Union as “toxic”).2 Merck emphasizes that the concentration of tested liquid crystals in mixtures are present at concentrations of 10%. Of the 14 liquid crystal mixtures tested, none reported LD50s below 2,000 mg/kg body weight. According to Merck, no substance found to be acutely “toxic” is introduced to the market.
• Some liquid crystals may be irritants, corrosive, or sensitizing. Six compounds of 141
tested by Merck showed slight skin irritation; 3 were classified as corrosive. Of the 74 compounds tested for eye irritation, 2 caused slight eye irritation.
• Liquid crystals are not mutagenic in bacteria and in mammalian cells. Merck tested 263
individual substances and 14 liquid crystal mixtures for mutagenic effects in bacteria. Of these, only one compound showed mutagenic potential. This substance was excluded from further development and was never marketed. Merck also tested possible genotoxic effects of 55 liquid crystals in mammalian cells; all tests were negative.
Merck, DIC, and Chisso Corporation, in conjunction with the German Federal Environmental Agency, also conducted testing to evaluate potential ecotoxicity of liquid crystals. Ten individual liquid crystal compounds and one liquid crystal mixture (typically used in TFT-LCDs for laptop computers) were tested for their toxicity to daphnia and algae (see Table 3-4). Researchers report that the ten selected compounds represent “technically and commercially very important substance classes” and the tested mixtures represent typical mixture formulations (Broschard et al., 2000; Becker and Simon-Hettich, 2007). Concentrations of liquid crystals in the test media were measured using high performance liquid chromatography (HPLC); toxicity tests were performed according to the OECD and EU guidelines. Results for daphnia immobilization and algal growth inhibition showed no adverse effects to aquatic organisms up to the limit of solubility of the liquid crystal compounds. Based on available testing results, investigators concluded that liquid crystals are not harmful to aquatic organisms (bacteria, algae, daphnia, and fish), but acknowledge that because of the poor water solubility of liquid crystals, they are difficult to test in aquatic systems (Broschard et al., 2000; Becker et al., 2003). Based on these test results, the German Federal Environment Agency does not require special requirements for the disposal of LCDs based on the content of liquid crystals (GFEA, 2000). Subsequent testing by Merck include 6 tests for acute toxicity in fish, 8 bacterial toxicity tests, 12 algae growth inhibition tests, and 35 daphnia immobilization tests, all of which reportedly show no hazard to aquatic organisms (Becker and Simon-Hettich, 2007). Other potentially relevant testing includes bioaccumulation studies conducted by Japanese manufacturers. Again, due to the proprietary nature of the study information, only summary data were available. Investigators generally conclude that liquid crystals do not show a significant bioaccumulation potential (Becker and Simon-Hettich, 2007).
2 LD50 represents the statistically derived dose of chemical that is lethal to 50 percent of the test population. An LD50 of 2000 mg/kg body weight is equivalent to 140 g for a typical 70-kg individual.
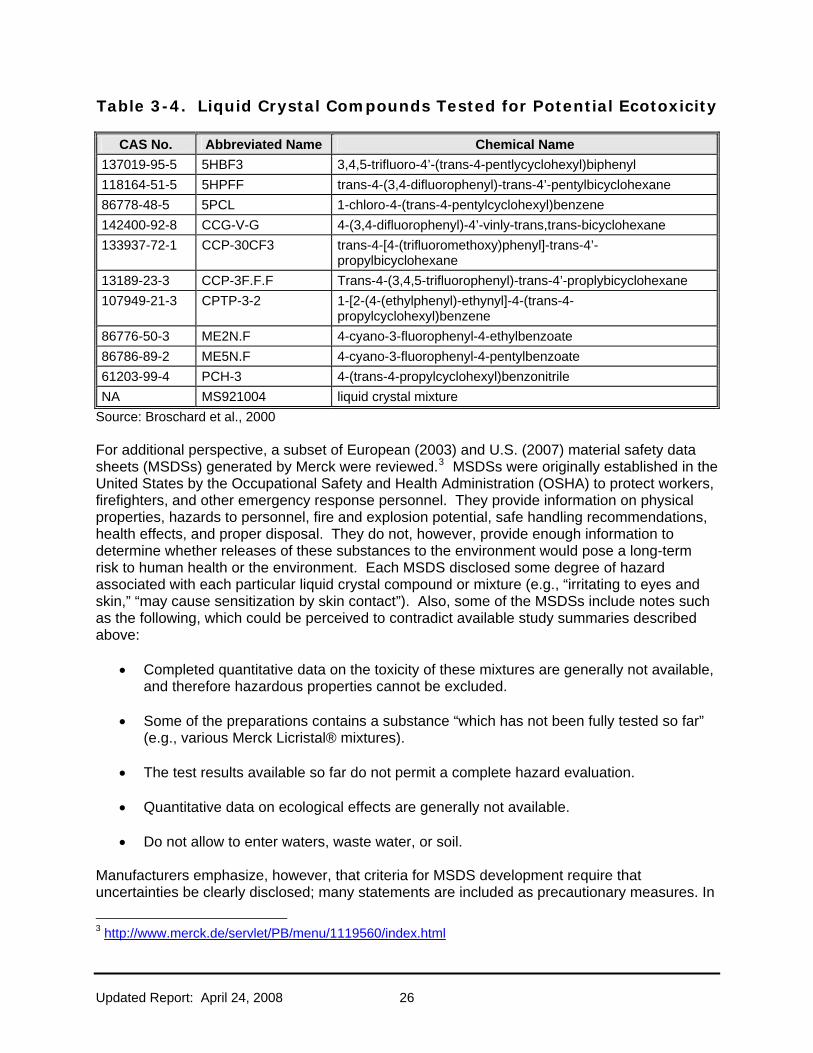
Updated Report: April 24, 2008 26
Table 3-4. Liquid Crystal Compounds Tested for Potential Ecotoxicity
CAS No. Abbreviated Name Chemical Name 137019-95-5 5HBF3 3,4,5-trifluoro-4’-(trans-4-pentlycyclohexyl)biphenyl 118164-51-5 5HPFF trans-4-(3,4-difluorophenyl)-trans-4’-pentylbicyclohexane 86778-48-5 5PCL 1-chloro-4-(trans-4-pentylcyclohexyl)benzene 142400-92-8 CCG-V-G 4-(3,4-difluorophenyl)-4’-vinly-trans,trans-bicyclohexane 133937-72-1 CCP-30CF3 trans-4-[4-(trifluoromethoxy)phenyl]-trans-4’-
propylbicyclohexane 13189-23-3 CCP-3F.F.F Trans-4-(3,4,5-trifluorophenyl)-trans-4’-proplybicyclohexane 107949-21-3 CPTP-3-2 1-[2-(4-(ethylphenyl)-ethynyl]-4-(trans-4-
propylcyclohexyl)benzene 86776-50-3 ME2N.F 4-cyano-3-fluorophenyl-4-ethylbenzoate 86786-89-2 ME5N.F 4-cyano-3-fluorophenyl-4-pentylbenzoate 61203-99-4 PCH-3 4-(trans-4-propylcyclohexyl)benzonitrile NA MS921004 liquid crystal mixture
Source: Broschard et al., 2000 For additional perspective, a subset of European (2003) and U.S. (2007) material safety data sheets (MSDSs) generated by Merck were reviewed.3 MSDSs were originally established in the United States by the Occupational Safety and Health Administration (OSHA) to protect workers, firefighters, and other emergency response personnel. They provide information on physical properties, hazards to personnel, fire and explosion potential, safe handling recommendations, health effects, and proper disposal. They do not, however, provide enough information to determine whether releases of these substances to the environment would pose a long-term risk to human health or the environment. Each MSDS disclosed some degree of hazard associated with each particular liquid crystal compound or mixture (e.g., “irritating to eyes and skin,” “may cause sensitization by skin contact”). Also, some of the MSDSs include notes such as the following, which could be perceived to contradict available study summaries described above:
• Completed quantitative data on the toxicity of these mixtures are generally not available, and therefore hazardous properties cannot be excluded.
• Some of the preparations contains a substance “which has not been fully tested so far”
(e.g., various Merck Licristal® mixtures).
• The test results available so far do not permit a complete hazard evaluation.
• Quantitative data on ecological effects are generally not available.
• Do not allow to enter waters, waste water, or soil. Manufacturers emphasize, however, that criteria for MSDS development require that uncertainties be clearly disclosed; many statements are included as precautionary measures. In
3 http://www.merck.de/servlet/PB/menu/1119560/index.html

Updated Report: April 24, 2008 27
other words, because every liquid crystal compound/mixture has not been studied individually, such statements are included even if the testing of representative or like liquid compounds or mixtures showed low toxicity. Others who have reviewed liquid crystals in FPD devices also have concluded that the relative impact of liquid crystals in overall life-cycle assessment does not appear to be significant, though uncertainties have been consistently acknowledged (Socolof et al., 2001). In addition, reviews of numerous liquid crystal mixtures by EPA under the auspices of the Toxic Substances Control Act (TSCA) have drawn similar conclusions. EPA’s Office of Pollution Prevention and Toxics (OPPT) has evaluated the potential hazards and risks associated with the release of liquid crystals through TSCA’s New Chemicals Program for several years as companies have submitted Premanufacturing Notices (PMNs). Based on these reviews, OPPT has concluded that liquid crystals do not pose an unreasonable risk to human health or the environment. This conclusion is based on Structure Activity Relationship (SAR) analyses and exposure assessment modeling based on physical and chemical properties of these chemicals. EPA’s chemists, toxicologists, and engineers conducting these reviews have determined that the physical and chemical properties of liquid crystals result in negligible absorption through human skin, in lungs, and in the gastrointestinal tract. SAR predictions also indicate that liquid crystals would have low acute toxicity and low chronic toxicity towards aquatic organisms—that is, if tested, no-toxic-effects at saturation would be the expected result. This conclusion is generally consistent with the findings reported in Broschard et al. 2000. Additionally, EPA’s New Chemicals Program risk assessors have modeled the potential fate and transport of liquid crystals if they were released into the environment. Based on this modeling, EPA believes the potential exposure to humans and the environment is low. Liquid crystals are predicted to have negligible water solubility; high adsorption potential to organic matter in sewage sludge, sediments and soils; high removal by sewage treatment (i.e., equal to or greater than 90 percent via sorption to sludge); negligible transport through soils to ground water; and low bioconcentration potential. Thus, any release of liquid crystals throughout their life cycle is expected to result in a low unreasonable risk finding towards humans and the environment. Liquid crystals are expected to be destroyed via municipal incineration without the production of any persistent degradation products. While a liquid crystal may be expected to be persistent in the environment, liquid crystals are expected to have nil absorption through membranes and negligible bioconcentration potential in organisms. Even if liquid crystals were to be inhaled, they are not large enough to cause lung over-load toxic effects. Because of these conclusions, EPA’s New Chemicals Program categorizes liquid crystals as a class of chemicals that will not pose an unreasonable risk towards humans or the environment. Therefore, each liquid crystal submitted by industry as a New Chemical is quickly reviewed to ensure its chemical structure meets the Liquid Crystal Drop Category requirements. If so, it is dropped from further review at the first step of the New Chemical Review assessment process based on low concern for toxicity towards humans and the environment. See Appendix A for more information pertaining to EPA’s New Chemical’s Risk Assessment Process. The collective findings described above suggest that liquid crystals present a relatively low risk of harm to human and ecological receptors; however, some data gaps remain.

Updated Report: April 24, 2008 28
• No information on chronic (i.e., long-term) effects was identified for any of the liquid crystal compounds.
• No tumorogenic studies for liquid crystal compounds were identified; as noted above,
negative mutagenicity test results suggest a low carcinogenic potential but are not definitive. For example, no data are available to rule out carcinogenicity of agents possibly acting via a non-mutagenic mode of action.
The overall negative findings of short-term, irritant/sensitization, mutagenicity, ecotoxicity, and bioaccumulation studies—coupled with the premise that liquid crystals are unlikely to present exposure threats—have however precluded the initiation of more elaborate longer-term studies. Section 6 offers additional perspective regarding liquid crystal release and exposure potential during end-of-life management. Brominated Flame Retardants
Polybrominated diphenyl ethers (PBDEs) are a class of brominated hydrocarbons that are used as flame retardants in a variety of consumer products including plastics that are found in various electronic components such as FPD devices. PBDE chemicals consist of compounds in which one to ten bromine atoms are attached to a biphenyl structure in up to 209 combinations, known as congeners Commercial production of PBDEs began in the 1970s. They are a group of synthetic organic chemicals with no known natural sources in the environment. Some PBDEs are added to the polymer material, but often are not chemically incorporated into the polymer matrix. Therefore, they are able to migrate from the plastic and find their way into the environment. The exact mechanism by which these chemicals find their way from their source (the plastic) through the environment and to receptors is not known. Nor is the actual level of concern completely understood from a toxicity standpoint. However, recent studies indicate potential toxicity concerns for some congeners. Additional studies show that some of these chemicals persist in the environment and bioaccumulate (ATSDR, 2004) Because of the quantity of PBDEs being used and the uncertainty regarding their hazard potential, the scientific community world-wide is conducting tests to acquire more data. Much of the current research and legislation surrounds three specific congeners that have been commercially manufactured: penta, octa, and decabromodiphenyl ether (decaBDE). Two of these congeners may be present in flat panel displays and ancillary equipment components that are at or nearing their end of life (octaBDE and decaBDE). OctaBDE was used almost exclusively in acrylonitrile butadiene-styrene (ABS) polymers incorporated into casings for computers and other electronic equipment before its domestic manufacturing was phased out on January 1, 2005 (pentaBDE was concurrently phased out, but was never used in plastics). DecaBDE is still manufactured in large quantities and is the only congener now incorporated into plastics for flat panel displays. It is used as an additive flame retardant for hard, dense plastics of consumer electronic products such as TV cabinets, CPU housings, and associated wires and cables. While pentaBDE and octaBDE are no longer manufactured in the United States, production of decaBDE is continuing. It is used in a variety of applications, including high impact polystyrene (HIPS) for use in the television industry for cabinet backs, polypropylene and other polymers used in electrical and electronic equipment (such as computers, connectors, electrical boxes, wire and cable), and textiles (carpet backing).

Updated Report: April 24, 2008 29
Concerns about potential human health effects (e.g., neurological development in infants) have increased in recent years because PBDEs have been found to be ubiquitous in the environment, at varying concentrations (Washington Department of Ecology and Washington State Department of Health 2005). Also, the lower brominated PBDE congeners have been found in human blood, breast milk, and body fat of individuals throughout the U.S., at higher levels than in other regions of the world. Health effects in laboratory animals exposed to lower brominated PBDEs include thyroid effects, behavioral changes, and effects on the immune system. Animal studies indicate that commercial decaBDE mixtures are generally less toxic than products containing lower brominated PBDEs (such as pentaBDE) and recent risk assessments in Europe and for the U.S. Voluntary Children’s Chemical Evaluation Program show inconclusive data regarding its hazard potential. While some have concluded decaBDE is expected to have relatively little effect on the health of humans (ATSDR, 2004) others have raised additional concerns about decaBDE because of its potential to degrade in the environment to the less-brominated (and more toxic) congeners. Further, decaBDE is classified by EPA as a possible human carcinogen, based on limited evidence in animals but not evidence in humans. It should be noted that although pentaBDE and octaBDE are no longer manufactured and incorporated into products, significant quantities were used prior to 2005. Therefore, older flat panel displays (and associated equipment) that enter waste or recycle streams in the future have the potential of containing decaBDE as well as octaBDE. Additional information regarding ongoing efforts can be found in several studies and government Web sites, including:
• Washington State Department of Ecology; PBDE Chemical Action Plan, January 19, 2006 (http://www.ecy.wa.gov/)
• Voluntary Children’s Chemical Evaluation Program; reports for pentabromodiphenyl
ether, octabromodiphenyl ether, and decabromodiphenyl ether (http://www.epa.gov/chemrtk/vccep/)
• U.S. EPA’s Design for the Environment Furniture Flame Retardancy Partnership
(http://www.epa.gov/opptintr/dfe/pubs/projects/flameret/index.htm) Additionally, many governments have enacted or are considering legislation to ban or limit their use. Please refer to Section 4 for additional information regarding legislation. Other Potentially Hazardous Organic Constituents
Other organic constituents identified in FPD devices with documented or possible hazards associated with them include the following: Plexiglas is the trademark name for thermoplastic poly(methyl methacrylate)-type polymers, which is used in the manufacture of flat panel displays. Plexiglas dust has been linked to occupational asthma (Haz-Map 2004).

Updated Report: April 24, 2008 30
Polyoxymethylene is also known as paraformaldehyde; it is a polymer composed of 8 to 100 formaldehyde monomers. It is used in the manufacture of the FPD base swivel bearing. It is a severe eye, skin, and respiratory system irritant (HSDB 2005). Polyoxymethylene has not been evaluated by EPA, IARC, or NTP for carcinogenicity, though the aldehyde formaldehyde is classified as a probable human carcinogen by EPA. Polyvinyl chloride (PVC) is one of the major plastic polymers used in electronic equipment. Occupational asthma has been reported in workers exposed to PVC dust. More severe and prolonged respiratory systems have been reported in those exposed to burning PVC (e.g., in firefighters) (Haz-Map, 2004). IARC concluded that PVC is not classifiable as to its carcinogenicity to humans (HSDB, 2005). Though various cancers have been reported in long-term workers in PVC manufacturing facilities, it has not been determined whether the cancers could be associated with the PVC and/or the monomeric vinyl chloride used to produce PVC (HSDB, 2005). Phthalates are relatively persistent in the environment; potential long-term health effects vary depending on the specific compound but may include damage to the liver and testes and cancer (CDC, 2005). An increasing body of evidence has shown possible reproductive and developmental toxicity from low-level exposure to phthalates (Kavlock et al., 2002). Data are limited primarily to animal studies and gaps remain in the understanding of the toxicity of phthalates in humans.

Updated Report: April 24, 2008 31
Section 4: Applicable or Relevant Laws and Regulations
There are a variety of laws, regulations, and policies at the international, national, state, and local levels that relate to the end-of-life management of electronic devices; some of these are directly relevant to the management of flat panel displays. These are discussed below. 4.1 International Laws and Regulations
Readers should be aware of potential ramifications associated with importing FPD devices, and selling and recycling these devices and their components on the global market place. As discussed in general throughout this report and in particular in Section 7.1, there are data gaps pertaining to the toxicity and the fate and transport of some chemicals used in FPD devices (e.g., brominated flame retardants and liquid crystals). In these situations, some U.S. localities and foreign governments adopt a conservative stance if some data exist (even if inconclusive) that indicate there may be a potential of risk to human health and the environment. In these situations, the governing body may adopt the philosophy of what is often referred to as the “precautionary principal”. One component of the precautionary principal is potential regulation that may limit the manufacture, processing, and/or use of the chemical (or products that contain it) until data can be developed to conclusively show the chemical does not pose a risk. This philosophy has lead to a number of international guidelines and regulations that may affect the manufacture, sale, disposal, and recycling of FPD devices. Included are the WEEE, RoHS, and REACH directives discussed below. Two directives that relate to waste from electrical and electronic equipment and the content of such products were adopted by the European Union (EU) and became effective in February 2003. The EU member states were required to implement these directives in their own countries by August 2005. The goal of the Waste Electrical and Electronic Equipment (WEEE) and Restriction of the Use of Certain Hazardous Substances in Electrical and Electronic Equipment (RoHS) directives is to substantially reduce the quantity of electrical and electronic equipment entering municipal solid waste incinerators and landfills and to reduce the amount and type of hazardous substances these products contain (Inform 2003). The WEEE Directive is broad in scope, covering virtually all electrical and electronic equipment used by consumers that may end up in the municipal waste stream. The Directive establishes the principle of Extended Producer Responsibility (EPR): producers (defined as the brand name on the product or importer of the product) are financially responsible for the collection, treatment, recovery, and disposal of their own products at end of life. Producers may fund their own system or participate in a collective system with other producers. According to the Directive, new products sold after August 13, 2005 should be covered by the system and must carry a label that indicates the product is to be collected separately and not put in the trash. The directive states that the costs of covering orphan and historic products should be shared by all existing manufacturers according to the proportion of their market share for each type of product. Also, producers may not use design features that prevent products from being reused unless such features provide overriding safety and environmental benefits. There is a minimum quota to collect 4 kilograms per capita per year. A target of 75% recovery and 65% reuse/recycling was set for computer-related equipment. The Directive allows for a
Updated Report: April 24, 2008 32
visible fee on the sale of new products to cover these costs during an eight-year transition period. After this period, there must be no visible fee to the consumer. The Directive also covers WEEE from commercial users, but the rules are different. For example, the Directive allows Member States to hold non-household users partially or fully responsible for the costs of managing the WEEE. The Directive also specifies many substances and components that must be removed from all separately collected waste electrical and electronic equipment, including PCBs, mercury, printed circuit boards in cell phones, plastics that contain brominated flame retardants, and LCDs with greater than 100 square centimeter surface area. Some Member States have not met the deadlines for implementing the WEEE Directive. For those that have operating systems in place, the systems have been implemented in differing manners. For most countries, including Belgium, the Netherlands, Norway, and Sweden, the system is operated collectively as non-profit organizations run by commercial organizations involved in the manufacture and distribution of products. In Denmark, however, collection is the responsibility of the municipal and regional authorities, whereas the recovery and disposal is covered by the WEEE System, which obtains funds from a private, non-profit organization supported by producers and importers. Most countries utilize municipal collection systems as their primary collection mechanism, but retailers and producers may take back products as well. Many WEEE systems, base system fees on current operating costs as well as a portion of future liabilities to build reserve funds for future operating cost contingencies.4 The RoHS Directive is a companion to WEEE with similar scope (i.e., products covered by WEEE are also covered by RoHS with some minor exceptions). The RoHS Directive is based on the premise that even if all waste electrical and electronic equipment were collected separately and recycled, its toxic content would pose risks to health and the environment. It calls for the substitution of hazardous substances with less hazardous materials. It also specifies that, by July 1, 2006, no new electrical and electronic equipment put on the market may contain lead, mercury, cadmium, hexavalent chromium, and two types of flame retardants (PBB and PBDE). Exemptions were identified and will be reviewed periodically; current exemptions related to computer equipment include the use of mercury in fluorescent bulbs, lead in CRT glass, lead in electronic components and fluorescent tubes, and lead in electronic ceramic parts. Europe is one of the largest markets for electrical and electronic equipment in the world, and companies will be able to sell to this market only if they remove the hazardous substances specified in the RoHS Directive. In addition, U.S. companies selling products in Europe will need to participate in systems to take back, reuse, and recycle their products in EU member states. The RoHS and WEEE Directives are already driving environmental legislation being enacted in the United States, including California’s Electronic Waste Recycling Act (described in Section 4.3 below), the Washington State Electronic Product Recycling Law and other proposed legislation in several states. In addition to these directives, the European Parliament’s Environmental Commission proposed a new regulatory framework for the Registration, Evaluation and Authorisation of Chemicals (REACH) on 29 October 2003. REACH will take effect on 1 June 2007. (See:
4 United Kingdom Department of Trade and Industry, Study into European WEEE Schemes, November 20, 2003.

Updated Report: April 24, 2008 33
http://ec.europa.eu/environment/chemicals/reach/reach_intro.htm). The aim of REACH is to improve the protection of human health and the environment through the better and earlier identification of the properties of chemical substances. REACH builds on the precautionary principal by imposing greater responsibility to industry to manage the risks from chemicals and to provide safety information on the substances. Manufacturers and importers will be required to gather information on the properties of their substances, and to register the information in a central database. A new EU Chemicals Agency will act as the central point in the REACH system: it will run the databases necessary to operate the system, co-ordinate the in-depth evaluation of “suspicious chemicals” and run a public database in which consumers and professionals can find hazard information. Under REACH, manufacturers and importers of chemicals in mass greater than 1 tonne per year must register the chemicals with the EU Chemicals Agency, submitting information on properties, uses, and safe ways of handling them. This information must be provided to downstream users. The information will be evaluated for potential human health and environmental risk. Based on the risk evaluation certain uses for the chemicals may be restricted, or manufacture may be banned entirely. Unlike many U.S. regulations, restrictions can be imposed based on persistence and bioaccumulation potential even if the data pertaining to toxicity is inconclusive or unknown. 4.2 Federal Laws and Regulations
4.2.1 Toxic Substances Control Act
The federal Toxic Substances and Control Act (TSCA) was enacted in 1976; it authorizes the U.S. Environmental Protection Agency (EPA) to test chemicals prior to and after introduction into commerce based on their potential human health and environmental effects, and to regulate these chemicals at any point during the chemical’s life cycle as necessary to minimize risks to human health and the environment. The term “chemical substance” is broadly defined under TSCA to include organic and inorganic chemicals. TSCA’s objectives are to develop adequate data to determine the health and environmental effects of chemicals and to control the use of chemicals that present an unreasonable health or environmental risk. Any company planning to manufacture or import a new chemical must submit a premanufacture notice to the EPA that contains information on the substance’s identity and use. Producers and importers can be required to supply data on exposure and risk. EPA may also ask manufacturers and importers to report unpublished health and safety studies on existing chemicals and to conduct and report results of toxicological tests. EPA compiles and maintains a chemical substance inventory for each substance that is manufactured or processed in the United States. Individual states may obtain grants for regulating substances that pose a risk within their state boundaries, but are not regulated under the federal program. While the law applies to chemical substances and mixtures, it does not currently require certification that imported “articles” are in compliance with TSCA. An “article” is defined as a manufactured item which (a) is formed to a specific shape or design during manufacture; (b) has end use functions dependent in whole or in part upon its shape or design during end use; and (c) has either no change of chemical composition during its end use or only those changes of composition which have no commercial purpose separate from that of the article (USEPA 1999).

Updated Report: April 24, 2008 34
Thus, liquid crystals that are imported as a manufactured item (as a panel or a complete display unit) are not covered under TSCA. However, if they are imported to a U.S. manufacturer of LCDs or if they are manufactured domestically; a risk assessment is conducted as part of TSCA’s New Chemicals Program. Appendix A provides a detailed discussion of the TSCA New Chemicals review process. 4.2.2 Resource Conservation and Recovery Act
The federal Resource Conservation and Recovery Act (RCRA), Subtitle C, regulates the handling, storage, treatment, and disposal of hazardous waste. Because RCRA is focused on preventing contamination of groundwater at landfills, the suite of chemicals listed as hazardous in the RCRA regulations is limited to those most often found in landfills. These chemicals include both organic and inorganic substances. EPA does not specifically list discarded electronic devices, including flat panel displays, as hazardous waste. However, they may exhibit the hazardous characteristic of toxicity due to the presence of heavy metals, including mercury and lead. While there is no full list of chemicals regulated under RCRA, a fairly comprehensive list is provided in EPA’s List of Lists, available at www.epa.gov/ceppo/pubs/title3.pdf (USEPA 2001). This consolidated chemical list includes chemicals subject to reporting requirements under the Emergency Planning and Community Right-to-Know Act (EPCRA) and chemicals listed under section 112(r) of the Clean Air Act (CAA). Separate lists are also provided for RCRA waste streams and unlisted hazardous wastes, and of radionuclides reportable under the Comprehensive Environmental Response, Compensation, and Liability Act (CERCLA). Liquid crystals are not identified on this list, although several other chemicals used in the manufacture of electronics in general (e.g., solvents, components of plastic, etc.) are included. To determine whether a waste material exhibits the characteristic of toxicity as defined in RCRA, EPA has developed the Toxicity Characteristic Leaching Procedure (TCLP). The purpose of the TCLP is to identify those wastes that might result in contamination of groundwater if improperly managed; it is therefore a laboratory test designed to simulate leaching in a municipal landfill. The TCLP methodology is listed as Test Method 1311 in “Test Methods for Evaluating Solid Waste, Physical/Chemical Methods” (EPA Publication SW-846). The TCLP includes testing for heavy metals and selected organic substances, as listed in Table 4-1. The organic substances are primarily volatile organic compounds and pesticides; these substances are not likely to be present in FPDs. EPA has excluded some wastes from regulation under RCRA; these include household hazardous waste and generators of less than 100 kg of hazardous waste per month (called conditionally exempt small quantity generators, or CESQGs). Disposal in a municipal waste landfill for these wastes was allowed under RCRA. However, studies showed that mercury was migrating from municipal solid waste landfills in harmful concentrations and could reach human drinking water sources located over a mile from the landfill in significant concentrations (i.e., exceeding drinking water maximum contaminant limits, or MCLs; USEPA 1999b). To deal with this problem, EPA promulgated the Universal Waste Rule.

Updated Report: April 24, 2008 35
Table 4-1. Toxicity Characteristics List
Contaminant Threshold Concentration (mg/L) Inorganics Arsenic 5 Barium 100 Cadmium 1 Chromium 5 Lead 5 Mercury 0.2 Selenium 1 Silver 5 Organics Benzene 0.5 Carbon tetrachloride 0.5 Chlordane 0.03 Chlorobenzene 100 Chloroform 6.9 o-Cresol 200 m-Cresol 200 p-Cresol 200 Cresol 200 2,4-D 10 1,4-Dichlorobenzene 7.5 1,2-Dichloroethane 0.5 1,1-Dichloroethylene 0.7 2,4-Dinitrotoluene 0.13 Endrin 0.02 Heptachlor (and its epoxide) 0.008 Hexachlorobenzene 0.13 Hexachlorobutadiene 0.5 Hexachloroethane 3 Lindane 0.4 Methoxychlor 10 Methyl ethyl ketone 200 Nitrobenzene 2 Pentachlorophenol 100 Pyridine 5 Tetrachloroethylene 0.7 Toxaphene 0.5 Trichloroethylene 0.5 2,4,5-Trichlorophenol 400
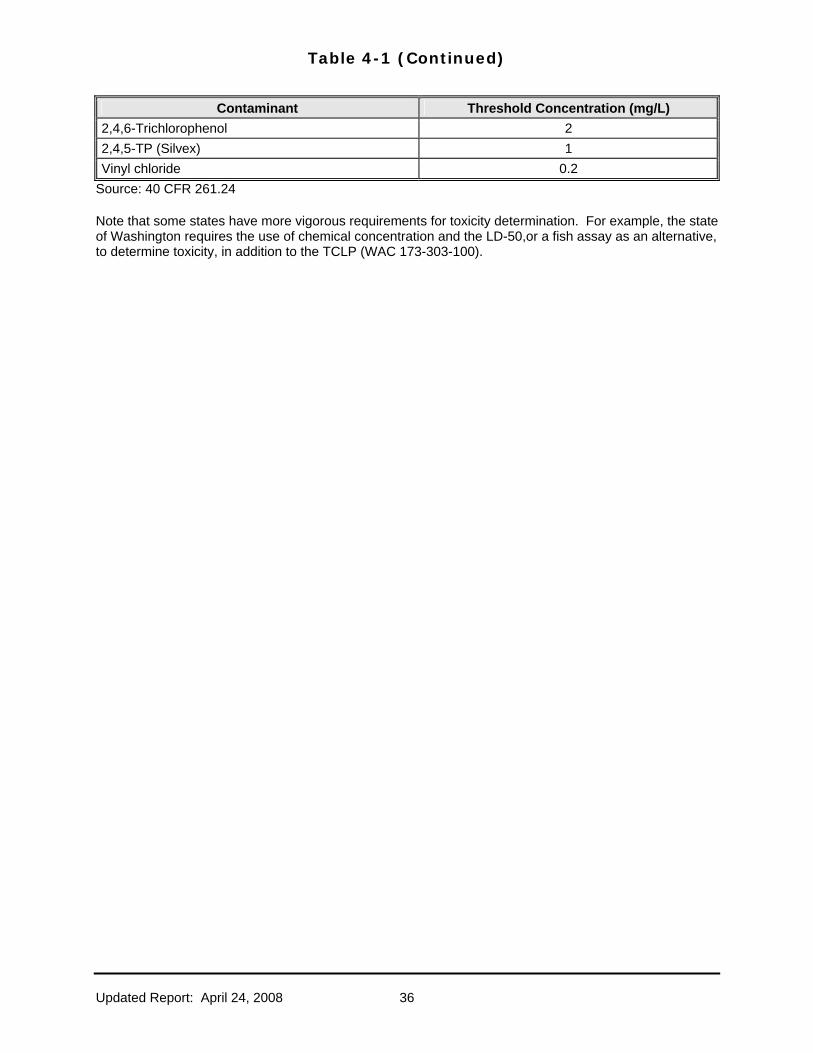
Table 4-1 (Continued)
Updated Report: April 24, 2008 36
Contaminant Threshold Concentration (mg/L) 2,4,6-Trichlorophenol 2 2,4,5-TP (Silvex) 1 Vinyl chloride 0.2
Source: 40 CFR 261.24 Note that some states have more vigorous requirements for toxicity determination. For example, the state of Washington requires the use of chemical concentration and the LD-50,or a fish assay as an alternative, to determine toxicity, in addition to the TCLP (WAC 173-303-100).
Updated Report: April 24, 2008 37
Studies have been conducted by the University of Florida and the California Department of Toxic Substances Control to determine whether FPD devices would be regulated as a hazardous waste under RCRA (Section 4.2.2 above). These studies are described below. The Toxicity Characteristic Leaching Procedure (TCLP) is a laboratory test designed to simulate leaching from a sanitary landfill and therefore, identify wastes likely to leach hazardous concentrations of toxic constituents to groundwater. Any waste that contains contaminants with leachate concentrations at or above the levels shown in Table 4-1 is designated a hazardous waste (termed a “dangerous waste” in the state of Washington; WAC 173-303-090), and must be handled and disposed of in accordance with Washington’s Dangerous Waste Regulations. (Note: Ecology has issued an Interim Enforcement Policy – Conditional Exclusion for CRTs and Related Electronic Wastes http://www.ecy.wa.gov/pubs/0204017.pdf that would otherwise designate as a dangerous waste; see Section 4.3). The TCLP is an 18-hour batch leaching test in which 100 grams of solid material is leached in the presence of 2 liters of a prescribed leaching fluid designed to simulate the conditions that might occur in a municipal solid waste landfill as the waste decomposes. The particle size of the solid material must be reduced such that it can pass through a 9.5-mm standard sieve. The material and leaching fluid are placed in a rotary extraction vessel for 18 hours at 30 rpm. After rotation, the leachate is filtered and then analyzed for a number of chemicals, both metals and organics (Table 4-1).5 Performing the TCLP analysis on electronic wastes such as FPDs poses a variety of problems. Particle size reduction is difficult; a whole device such as a flat panel must be ground, shred or cut to the appropriate particle size. This may require specialized equipment or labor-intensive manual size reduction. In addition, the sample technician must decide which part of a large device should be size-reduced, thereby introducing potential bias and inaccuracy into the procedure. Researchers at the University of Florida have recently developed a modified TCLP for large devices (Townsend et al. 2004). This modified protocol involves testing an entire electronic device by disassembling it, then placing it in a large extraction vessel and conducting the leaching test while maintaining the TCLP-prescribed ratio of liquid extraction fluid to solid waste material. No size reduction is performed using this method. Leaching the entire device eliminates human bias introduced during sample processing and collection. Because the TCLP simulates worst-case conditions, it does not accurately represent actual landfill conditions. Researchers at the University of Florida have attempted to measure the leachability of heavy metals in electronic products using actual landfill leachate rather than the TCLP-specified fluid (Townsend et al. 2003). They found dramatic differences between the lead concentrations measured using the TCLP and those measured using Florida landfill leachates. Although the TCLP was designed to be a conservative, worst-case test, and thus would be expected to result in higher concentrations of chemicals, the very large differences found by Townsend et al. (2003) suggest that the test may be over-conservative. It is postulated that the TCLP may be overly conservative for some elements, such as lead, and less conservative for others.
5 Note: California uses a Waste Extraction Procedure (WET) rather than the TCLP to determine whether a waste material is considered “hazardous.” If a material’s waste extract exceeds California’s Soluble Threshold Limit Concentration (STLC), it is defined as a hazardous waste. The WET/STLC methodology is also intended to simulate landfill leachate, but uses a slightly different methodology and includes a longer list of analytes.

Updated Report: April 24, 2008 38
TCLP Testing Results
Townsend et al. (2004) applied the modified large-scale TCLP (using the TCLP-prescribed extraction fluid) to a variety of discarded electronic devices, including laptop computers and flat panel monitors. Results are shown in Table 4-2. Three of the eight flat panel monitors tested exceeded the 5 mg/L threshold concentration for lead; the average lead concentration was 3.75 mg/L. The flat panel monitors were not tested for mercury. All 15 laptop computers tested exceeded the threshold concentration for lead; the average lead concentration using the modified TCLP was 23 mg/L, while the average lead concentration using the standard TCLP was 37 mg/L. Mercury concentrations in the laptop computers were below the detection limit of 0.03 mg/L. In December 2004, the California Department of Toxic Substances Control (DTSC) tested four types of devices (laptop computers, LCD monitors, plasma televisions, and LCD televisions) using the TCLP and analytical methods for total and extractable concentrations6 of regulated elements, for comparison with California’s hazardous waste criteria (California DTSC 2004). All components were weighed, and the PC boards and LCD panels were ground to pass a 2mm sieve. Representative samples were digested using EPA Method 3050, or extracted using either the TCLP or the California Waste Extraction Test. CCFLs were processed according to California SOP-914S. Results were extrapolated to the entire device based on relative weights and assuming that the non-processed components did not significantly contribute to any of the regulated elements. Researchers found that the LCD panels did not exceed threshold concentrations for any of the eight regulated metals (arsenic, barium, cadmium, chromium, lead, mercury, selenium, and silver); however, the plasma display inner panels and PC boards exceeded the threshold concentration for lead. In addition, the CCFLs exceeded the total threshold limit concentration for mercury. Additional results are summarized below:
• CCFLs are high in mercury, exceeding California’s total threshold limit concentration (TTLC). If, however, the CCFLs are not removed but are disposed as part of the entire device, the mercury content of the entire device is below the TTLC.
• The glass panels of the LCD monitors and laptops and the outer glass panels of the LCD
televisions contain negligible amounts of regulated elements.
• The inner panels of the plasma televisions clearly exceeded California’s soluble limit threshold concentration (STLC) for lead.
• The PC boards contained the highest amounts of regulated elements.
• The copper content of the PC boards was above the TTLC in all devices tested. (Note:
copper is not one of the elements regulated under the RCRA characteristic of toxicity.)
6 Extractable concentration is the concentration of a substance present in the leaching fluid after completion of the extraction process.

Updated Report: April 24, 2008 39
Table 4-2. Results of Previous TCLP Analyses
Chemical Study Device Type Analysis Method
Concentration (mg/L)
Threshold (mg/L)
Arsenic California DTSC 2004 LCD panel Standard TCLP ND - 0.02 5 Plasma TV panel Standard TCLP ND LCD TV panel Standard TCLP ND Barium California DTSC 2004 LCD panel Standard TCLP ND - 0.07 100 Plasma TV panel Standard TCLP 0.19 - 0.63 LCD TV panel Standard TCLP ND - 0.04 Cadmium California DTSC 2004 LCD panel Standard TCLP ND 1 Plasma TV panel Standard TCLP ND LCD TV panel Standard TCLP ND Chromium California DTSC 2004 LCD panel Standard TCLP ND - 0.002 5 Plasma TV panel Standard TCLP ND LCD TV panel Standard TCLP ND Copper Townsend et al. 2004 laptop computer Modified TCLP 0 - 2.9 NA laptop computer Standard TCLP 0.01 - 1.9 flat panel monitor Modified TCLP 0.04 - 0.26 Iron Townsend et al. 2004 laptop computer Modified TCLP 17 - 206 NA laptop computer Standard TCLP 0.8 - 116 flat panel monitor Modified TCLP 37 - 360 Lead Townsend et al. 2004 laptop computer Modified TCLP 15 - 35 5 laptop computer Standard TCLP 11 - 86 flat panel monitor Modified TCLP 0.3 - 6.4 California DTSC 2004 LCD panel Standard TCLP ND - 1.72 Plasma TV panel Standard TCLP 0.05 - 101 LCD TV panel Standard TCLP ND - 0.01 Zinc Townsend et al. 2004 laptop computer Modified TCLP 15 - 55 NA laptop computer Standard TCLP 0.5 - 152 flat panel monitor Modified TCLP 62 - 117 Mercury Townsend et al. 2004 laptop computer Modified TCLP < 0.03 0.2 laptop computer Standard TCLP < 0.03 Selenium California DTSC 2004 LCD panel Standard TCLP ND 1 Plasma TV panel Standard TCLP ND LCD TV panel Standard TCLP ND Silver California DTSC 2004 LCD panel Standard TCLP ND 5 Plasma TV panel Standard TCLP ND LCD TV panel Standard TCLP ND
ND - Not detected

Updated Report: April 24, 2008 40
A study was recently conducted by the California Department of Toxic Substances Control (DTSC) to determine the concentrations of California regulated elements7 in electronic waste for comparison with hazardous waste criteria (Petreas et al. 2005). Eleven electronic product types, including LCD monitors, were identified; four devices of each product type were submitted for analysis of regulated elements and PBDEs. The devices were dismantled individually and components were weighed. The LCD panels were ground to pass a 2-mm sieve and were mixed well. Representative subsamples were digested using EPA Method 3050 or were extracted using either the EPA Toxicity Characteristic Leaching Procedure (TCLP) or the California Waste Extraction Test (WET). Analytical results were not available, however they indicated that the LCD monitors/televisions and plasma televisions tested exceeded California’s TTLC for copper and the RCRA TCLP criterion concentration for lead. In summary, available data indicate that at least some flat panels, including LCDs, laptop computers, and plasma displays, would be designated as a dangerous/hazardous waste under RCRA because they exceed the toxic threshold concentration for lead. Since so many types and models of FPDs are being sold, it is not possible to state definitively which ones would be designated as a dangerous waste. While TCLP testing of additional models and components could be done and may be useful, the studies described above suggest it may be appropriate to manage these devices as dangerous waste. 4.2.3 Universal Waste Rule
Under the Universal Waste Rule, handlers of universal waste are subject to less stringent standards for storing, transporting, and collecting these wastes. EPA believes that, for some wastes, regulating them as a universal waste will lead to better management. The rule allows waste generators to send certain types of waste to a central consolidation point, which does not require a RCRA permit. Therefore, these materials will be easier to send to recycling and proper disposal. These wastes might otherwise be sent to a municipal waste landfill under a CESQG or household hazardous waste exemption. On July 6, 1999, EPA finalized a rule adding mercury-containing and other hazardous waste lamps to the federal list of universal wastes regulated under the RCRA hazardous waste regulations (USEPA 1999b); mercury-containing lamps include fluorescent lamps used as backlights for LCD monitors. More recently, on August 5, 2005, EPA added waste mercury-containing equipment, such as mercury switches, to the universal waste list (USEPA 2005). According to draft guidance from the Washington Department of Ecology, mercury-containing equipment does not include intact devices with mercury-containing lamps.8 After the mercury-containing backlights in an LCD are removed, they would be considered universal waste. 4.3 State Laws and Regulations
4.3.1 Washington State Dangerous Waste Regulations
In April 2002, the Washington Department of Ecology issued an interim enforcement policy that conditionally excludes CRTs and other electronic wastes that are designated as “dangerous
7 California regulated elements are: antimony, arsenic, barium, beryllium, cadmium, chromium, cobalt, copper, lead, mercury, molybdenum, nickel, selenium, silver, thallium, vanadium, and zinc. 8 Personal communication with Robert Rieck, Washington Department of Ecology, December 8, 2005.

Updated Report: April 24, 2008 41
waste9” from compliance with the Washington Dangerous Waste Regulations if they are recycled (Washington Department of Ecology 2003). While this policy applies primarily to fully regulated businesses (i.e., large quantity hazardous waste generators), those that manage household hazardous waste (which is exempt from the Dangerous Waste Regulations) and those that generate only small quantities of hazardous waste (which are required to comply with a subset of the Dangerous Waste Regulations) are encouraged to follow the requirements of this policy, which facilitates proper recycling. The policy can be referenced at: http://www.ecy.wa.gov/pubs/0204017.pdf The Ecology policy allows generators to accumulate hazardous computer-related equipment for 180 days before being sent to a recycling facility. Recycling facilities must comply with the following:
• Notify the Department of Ecology that they are handling this type of equipment;
• Operate and maintain the facility so as to prevent threats to human health and the environment;
• Conduct physical dismantling activities inside a building;
• Use trained personnel and properly operating equipment;
• Control litter, dust, noise, and other nuisances in the operation of the facility;
• Have measures in place to prevent and control fires; and
• After dismantling, equipment must be sent for recycling (e.g., extraction of metals in a
smelting operation, glass to glass recycling) within 180 days. Export outside the United States must include documentation that the receiving facility will legitimately recycle the electronic materials. Although accumulation is approved for only 180 days, consolidators may apply for an extension from Ecology if longer accumulation would facilitate proper recycling and make transport more cost-effective. Ecology, with the Solid Waste Advisory Committee (SWAC), has been studying permanent solutions to effect end-of-life management options for electronic waste. The Washington Electronic Product Recycling Act was passed in March of 2006. This law requires that manufacturers finance and implement a statewide electronics collection and recycling program by Jan 1, 2009. Residents, small businesses and small government agencies will be able to recycle their computers, laptops, TVs, monitors (flat panel and CRT) at no cost through the program. Manufacturers can implement their own recycling program or pay to participate in the standard plan which will be operated by the Materials Management and Financing Authority. The Authority is a third-party organization with a board of directors comprised of electronics manufacturers with oversight from the Department of Ecology. Rules for implementing the program are currently being developed.
9 A dangerous waste under the Washington Dangerous Waste Regulations is equivalent to a hazardous waste under the federal RCRA regulations.

Updated Report: April 24, 2008 42
In January 2004, Washington Governor Gary Locke issued an executive order directing the Department of Ecology to move forward on phasing out the use of PBDEs. In March 2004, the legislature approved funding for Ecology to phase out all three types of PBDEs (penta-, octa-, and deca-BDE). Two companion bills were introduced in 2005 (HB1488 and SB5515); these bills would have prohibited the sale of products that contain PBDEs. The bills were not passed. The departments of Ecology and Health will recommend that the state legislature ban PBDEs (Dodge 2005). The agencies recommend that deca-BDE be banned in electronic components as long as safer fire retardants are available or if additional studies show that deca-BDE harms human health, and continue research on PBDE alternatives and levels of PBDE in the environment. (PBDE chemical action plan). Several other states have proposed legislation to ban decaBDE or restrict its use. 4.3.2 Other States
Several states have implemented legislation to encourage the recycling of electronic waste including California, Maine and Maryland. California’s Electronic Waste Recycling Act imposes a fee at the point of sale on “covered electronic devices” sold in California to cover the cost of properly disposing of these products when they become waste. Covered products include:
• Televisions that contain CRT or LCD screens; • Computer monitors that contain CRTs or LCDs; • Laptop computers with LCDs; • Any other products that contain a CRT; and • Plasma televisions.
The law also requires covered electronic devices sold after January 1, 2007 to meet the same requirements as those found in the RoHS Directive. Products currently included are new and refurbished video display devices with a screen size of greater than 4 inches (measured diagonally). These covered electronic devices may not be manufactured, sold, or imported into California after January 1, 2007 if they contain the RoHS-listed toxic metals. In addition, California bills AB302/2587 prohibit the manufacture, processing, or distribution of a product (or flame-retarded part of a product) that contains greater than 0.1 percent octa- or penta-BDE after January 1, 2006. Similar (RoHS-type) legislation has been proposed in New Jersey, Texas, and Vermont. In addition, at least 10 states currently have legislation addressing mercury content and 12 have laws regulating PBDE content. In 2000, Massachusetts became the first state to ban CRTs from municipal landfills. California and Minnesota followed in 2005. In May 2006, New Hampshire also instituted a landfill ban on video display devices greater than four inches diagonally that will become effective July 1, 2007. Maine banned the disposal of monitors and TVs in solid waste disposal facilities as of July 2006 and also implemented a law that requires recycling of all computer monitors and televisions discarded by households. Towns pay to collect the discarded equipment and transfer them to consolidators, who separate them by manufacturer and bill the appropriate manufacturer for the costs of handling, transporting, and recycling their own products as well as a share of the orphan products collected. Consolidators can only ship equipment to recyclers who are certified under Maine’s Environmentally Sound Management Guidelines. Retailers are responsible for

Updated Report: April 24, 2008 43
ensuring that they sell products only from manufacturers that are in compliance with the Maine laws.10
The state of Maryland instituted a pilot program in which, after January 1, 2006, computer manufactures could not sell products in the state unless they were registered with the state and paid a fee of $5,000. In subsequent years, the annual fee would be reduced to $500 if the manufacture has in place a product take back program that is free to consumers and if their products were properly labeled with the brand name. If they did not meet these requirements, their annual fee would remain at $5,000. The fees are to be deposited in a fund used to administer the recycling program, as well as provide funds to counties for collection and recycling. Most recently in July 2006, the Rhode Island legislature passed the Electronic Waste Prevention, Reuse and Recycling Act, which bans electronics from landfills as of July 2008. It also requires the state DEM to develop a plan for implementing and financing a program that addresses collection, recycling and reuse of covered electronic products from all covered electronic product generators in the state. The products covered include CPUs, CRTs, FPDs, portable computers, TVs (CRT and non-CRT with screens >4 inches diagonally that contain a circuit board). There are currently many bills addressing EOL electronics being considered by many states. They all are proposing different approaches, some similar to programs in California, Maryland, or Maine. 4.4 Local Policies
Effective as of October 1, 2005, King County no longer accepts computers, monitors and televisions (including FPDs), cell phones, or mercury-containing products (such as button batteries, fluorescent lamps, mercury switches, thermometers, and thermostats) for landfill disposal. Within the City of Seattle, televisions, monitors and other devices that contain cathode ray tubes are prohibited from disposal. Snohomish County prohibits disposal of the same products as those banned by King County. The City of Tacoma prohibits disposal of computer monitors and televisions from their commercial customers (businesses, schools, and non-profit organizations).
10 http://www.state.me.us/dep/rwm/ewaste/summaryhouseholdreclaw.htm (September 5, 2006)

Updated Report: April 24, 2008 44
Section 5: End-of-Life Management
This section begins with a discussion of the product life of flat panel displays, then estimates the quantities of substances of concern that can be anticipated to enter the waste stream for management as flat panel products reach the end of their useful life. End-of-life management practices for flat panel products are also identified and described, including current practices and developing technologies. 5.1 Product Life and Repairability
The end-of-life is defined as the point at which a flat panel display is no longer used for its intended purpose in the physical form in which it was originally manufactured. End-of-life options include indefinite storage (which assumes that it is not reused after storage), reuse, recycling, or disposal. EPA’s Desktop Computer Display Life-Cycle Assessment (Socolof et al. 2001) reviewed literature on the lifetime of a computer monitor. In a study by the National Safety Council (NSC 1999, as cited in Socolof et al. 2001), it was assumed that a desktop monitor is used for 4 years in its “first life” (e.g., by its first user) and 2.5 years in its second and subsequent “lives,” for a total lifespan of 6.5 years. These data were specific to cathode ray tube (CRT) monitors; however Socolof et al. assumed that the lifespan of LCDs would be similar. The NSC data also included information on “notebook” computers; they estimated 2 to 3 years for the first life and 1 to 2 years for the remaining lives, for a total lifespan of 3 to 5 years. Another way to evaluate the lifespan of flat panel displays is to look at manufactured life, or the length of time a monitor is designed to operate effectively for the user. Manufacturers or assemblers typically calculate the mean-time-before-failure, or MTBF. For CRT monitors, the limiting component is the tube itself, and the MTBF is about 12,500 hours. For active matrix LCDs, the components with the greatest potential to fail first are the display panel itself (including the liquid crystals and thin film transistors), backlights, driver integrated circuit (IC) tabs, and other smaller components (Socolof et al. 2001). The backlights and IC tabs can be replaced and therefore do not necessarily represent the end of a monitor’s lifespan; however, failure of the liquid crystals or transistors would require replacement of the display panel itself and would not be cost effective. The MTBF for these components is approximately 45,000 hours. Thus, based on component failures, LCD monitors have a lifespan that is 3.6 times the lifespan of a CRT monitor. This estimate does not account for other reasons that a monitor may reach its end-of-life; for example, it may become unusable due to technological obsolescence. A study by IBM found that the technological useful life of a personal computer in an industrial environment is 2 to 3 years, and that businesses begin the transition to newer technology equipment between 3 to 5 years (IBM 2002). The IAER estimates the life span of computer monitors to be 6 to 7 years (IAER 2003). Televisions are believed to have a longer useful life than computers. A recent University of Wisconsin study assumed a 15-year life for televisions (Diggelman 2003). Other estimates of television lifespan range from 13 to 15 years (IAER 2003). These estimates are for standard CRT televisions; a flat panel television will likely have a shorter lifespan, however no data specific to the lifespan of flat panel display televisions was identified.

Updated Report: April 24, 2008 45
Note that after the original release of this document (August 20, 2007), stakeholders requested additional information pertaining to the operating life of flat panel products and the mean time before failure discussed above. In response to these requests, additional information regarding the basis of data in the Socolof et al. 2001 reference was compiled. Additionally, industry stakeholders were contacted to acquire updated information on this topic. Appendix C (Useful Operating Life of Flat Panel Products) presents the basis of estimates and a summary of the new information. 5.2 Storage
Large quantities of obsolete electronic devices, including flat panel display devices, are currently being generated, with even larger volumes projected over the next 5 to 10 years. While some of the obsolete electronics are being landfilled, most are currently stockpiled. The National Safety Council (NSC) has estimated that 254 million computers became obsolete in the United States between 1997 and 2003. An additional 250 million computers were predicted to become obsolete between 2004 and 2007; the annual number of outdated computers was expected to level off at about 63 million per year in 2005 (NSC 1999). Currently, most of these outdated computers (about 75 percent) are believed to be stockpiled in people’s home – in storerooms, attics, garages, and basements, approximately 14 percent are recycled or reused, and 11 percent are buried in landfills (Gattuso 2005). Some sources estimate that in 2002, electronic waste represented between 2 and 5 percent of the national municipal solid waste stream, and is expected to increase by 3 to 5 percent per year (Arensman 2000). The portion of this waste stream that comprises flat panel displays will likely increase as these devices gain market share. In August 2001, the California Integrated Waste Management Board (CIWMB) published a study that indicates that approximately 2.9 million televisions (74,000 tons) and 3.2 million computer monitors (48,000 tons) are stockpiled in California alone. Residential survey results indicate that 18.5 percent of California households stockpile their outdated televisions. Of those, 13 percent store one television, 3.9 percent store two, and 1.6 percent store three or more televisions. For computers, California households were found to stockpile 19.4 percent of their obsolete or inoperable computer monitors. Of those documented, 13.9 percent were stockpiling one monitor, 2.7 percent were stockpiling two monitors, and 2.8 percent were stockpiling three or more monitors (CIWMB 2002). The situation in Washington State is similar. A 2002 assessment of electronic waste generation in Eastern Washington estimated that 180,000 computers and 170,000 televisions are currently stockpiled (Cascadia 2002). These numbers were expected to grow significantly in subsequent years, particularly as the rise in popularity of FPDs causes consumers to discard CRT monitors in sooner than the typical product lifetime. Approximately 72,000 computers were projected to become obsolete in Eastern Washington in 2002. A 2003 study of electronic waste generation in Northwest Washington (including Whatcom, Skagit, Snohomish, King, Pierce, and Thurston Counties) projected that in 2010, households in this region would generate 76,000 flat panel monitors (380 tons) and 132,000 laptop computers (460 tons) (Cascadia 2003). In addition, the study estimated that in 2003, approximately 120,000 laptop computers (400 tons) were stockpiled. No flat panel monitors were estimated to be stockpiled at that time. In addition, small quantity generators (e.g., businesses) were projected to generate 42,000 obsolete flat panel monitors (210 tons) and 51,000 obsolete laptop

Updated Report: April 24, 2008 46
computers (200 tons) in 2010. Combined, this equates to a projected 590 tons of obsolete flat panel monitors and 660 tons of obsolete laptop computers that will be generated in the year 2010. This does not include the 400 tons of laptop computers that are currently estimated to be stockpiled. A 2005 survey of 603 King County households found that about 29 percent currently store an unused computer, and 15 percent store an unused television (Informa Research Services 2005). If this survey was representative of King County as a whole, this corresponds to approximately 206,000 computers (3,090 tons) and 107,000 televisions (2,675 tons) currently stockpiled in King County alone.11
No data on the quantity of flat panel display devices currently being landfilled or incinerated in the region were identified. As described in Section 4.4, several area jurisdictions have recently implemented disposal bans on some types of electronic devices. As a result of these bans, the quantities of FPD devices disposed are anticipated to decline. 5.3 Substances of Concern in End-of-life FPDs
Flat panel display products contain several substances that are known to be hazardous or are considered potentially hazardous. These substances include, but are not limited to, lead (found mainly in solder in circuit boards), mercury (in backlight lamps), and flame retardants (used in various plastic components of electronic products). Some uncertainties remain about the hazardous potential of liquid crystals. In order to get an idea of the magnitude of the quantities of these materials in flat panel display products that may be entering the waste stream in the near future, three high-volume flat panel products were analyzed: flat panel televisions, laptop computers, and flat panel computer monitors. First, U.S. consumption of each product was analyzed using electronics industry market data and U.S. Census data, and the equation: Apparent consumption = U.S. shipments - domestic exports + imports for consumption. Consumption of each product in units was converted to tons using in-house data that have been used for the EPA municipal solid waste (MSW) characterization report series.12,13 These average weights were based on a detailed research and data gathering effort reviewing Consumer Reports Annual and Monthly Buying Guides from 1984 through 1999. For the most recent years studied (2000 to 2004), data on product weights were collected from Internet searches of large consumer electronic retailer listings of product specifications. The municipal solid waste characterization data were supplemented with some
11 Based on 2000 U.S. Census Data which lists 710,916 households in King County (http://quickfacts.census.gov/qfd/states/53/53033.html). Assumes a television weighs 50 pounds and a computer weighs 30 pounds. 12 U.S. EPA. Municipal Solid Waste in The United States: 2003 Facts and Figures and previous years’ editions of the same report. www.epa.gov/epaoswer/non-hw/muncpl/msw99.htm. 13 The data series used for flat panel televisions does not include large screen units. Thus, the quantities of substances of concern reported in the tables for televisions do not include the quantities associated with large screen units. With rapidly increasing sales, a significant number (and tonnage) of large screen units can be expected to enter the waste stream as they reach end of life, increasing the associated quantities of substances of concern. However, ERG does not have a historical data series that quantifies the generation of large screen units.

Updated Report: April 24, 2008 47
product weight data from a year-long electronics collection study by the Florida Department of Environmental Protection.14 Next, the amounts of the four substances of concern in each type of product were estimated based on the composition by weight for a 15-inch LCD flat panel computer monitor as reported in the study Desktop Computer Displays: A Life Cycle Assessment (EPA/744-R-01-004a, December 2001) and in a presentation provided by Merck at the 2004 – 11th International Display Workshop (December 8-10, 2004). It was assumed that the weight percentages of plastics with flame retardant and circuit boards with lead-containing solder in each flat panel product would be similar to the weight percentages for these substances reported for the LCD monitor in the study. The weights of mercury and liquid crystals were assumed to be proportional to the viewing area of the LCD screen. Total quantities of the four substances of concern in the three flat panel products for each year from 1989 through 2004 are shown in Table 5-1. In the category of flame retardants there was insufficient data to estimate the relative percentages of specific brominated and non-brominated flame retardants used in the three product categories. Similarly, no data were available to characterize the composition of the “liquid crystals” category. In order to estimate when these quantities of substances might enter the waste stream, it was necessary to estimate the time delay between initial acquisition of these products and the time at which they are likely to be disposed. According to Recycling Technology Products: An Overview of E-Waste Policy Issues (U.S. Department of Commerce, Office of Technology Policy, July 2006), TVs in the waste stream tend to be 15-17 years old, while disposed computers tend to be 6-10 years old. This time delay reflects both the years that the product is in use and the time that it is stored before it is actually disposed by the consumer. The estimates in Tables 5-2 and 5-3 use the midpoint ages, 16 years for TVs and 8 years for laptop computers and computer monitors, to estimate when each year’s units will be disposed. These time delays mean that even if substances of concern are reduced, replaced, or banned from use in flat panel products, these substances will be present in products entering the waste stream for many years. For example, the European RoHS directive specifies that no new electronic equipment produced after July 1, 2006 may contain flame retardants PBB and PBDE; however, large quantities of existing equipment containing these substances will be disposed over the next 15 or more years. The final columns in the tables show that these three categories of flat panel products contain large quantities of the four substances of concern. It is clear that there is potential for significant impacts on environmental and human health if large quantities of products containing these substances are improperly managed as they reach the end of their useful lives and enter the solid waste stream. Note that the two data sources identified provide different estimates regarding the quantity of liquid crystals in LCD devices (0.02% to 0.04% by weight). Therefore, tables 5-1 through 5-3 of this report present analyses based on each estimate.
14Florida Department of Environmental Protection. Database, accessible at: http://www.dep.state.fl.us/waste/categories/electronics/pages/FloridaElectronicProductBrandDistributionProject.htm

Updated Report: April 24, 2008 48
5.4 Current Recycling Practices
Due to potential health and environmental impacts associated with their disposal, reuse and recycling are the preferred end-of-life management scenarios for electronic waste (Washington Department of Ecology 2003). FPD devices contain glass, plastics, heavy metals and other recyclable materials. Recycling of these devices will save natural resources and reduce the need to mine and/or manufacture new materials.

Updated Report: April 24, 2008 49
Table 5-1. Substances of Concern in Three High-Volume Flat Panel Products
U.S. Consumption in Units Average Pounds/Unitd U.S. Consumption in Tons Total Tons of Substances of Concerne
Year Flat Panel
TVsaLaptop
ComputersbFlat Panel Monitorsc
Flat Panel TVs
Laptop Computers
Flat Panel
Monitors
Flat Panel TVs
Laptop Computers
Flat Panel
Monitors Leadf MercurygLiquid
CrystalshLiquid
CrystalsiFlame
Retardantj
1989 2,243,214 0 1,083,598 29.0 15.7 32,527 - 8,506 115 0.030 17.5 8.7 644
1990 1,479,513 0 882,707 29.0 15.7 21,453 - 6,929 79 0.021 12.0 6.0 446
1991 1,258,313 0 1,499,605 29.0 15.7 18,246 - 11,772 84 0.021 12.1 6.0 471
1992 2,388,180 1,850,000 1,726,516 29.0 9.00 15.7 34,629 8,325 13,553 158 0.043 24.8 12.4 888
1993 2,403,629 2,527,979 1,839,521 29.0 8.73 15.7 34,853 11,035 14,440 168 0.047 26.9 13.4 948
1994 1,648,638 3,200,464 2,795,290 29.0 8.46 15.7 23,905 13,538 21,943 166 0.045 26.0 13.0 933
1995 943,646 3,563,808 2,967,154 29.0 8.20 15.7 13,683 14,612 23,292 144 0.039 22.8 11.4 810
1996 1,217,575 4,949,204 2,266,424 29.0 7.93 15.7 17,655 19,624 17,791 154 0.046 26.3 13.1 865
1997 1,375,254 6,000,142 1,222,048 29.0 7.66 15.7 19,941 22,981 9,593 147 0.047 27.3 13.7 825
1998 2,228,984 6,407,928 1,849,201 29.0 7.39 15.7 32,320 23,677 14,516 197 0.062 35.6 17.8 1,108
1999 3,045,631 7,870,995 11,195,520 29.0 7.13 15.7 44,162 28,060 87,885 447 0.119 68.3 34.2 2,515
2000 2,554,290 9,622,814 12,817,066 29.0 7.13 15.7 37,037 34,305 100,614 480 0.128 73.7 36.8 2,701
2001 2,385,427 9,575,220 13,966,136 29.0 6.95 15.7 34,589 33,274 109,634 496 0.131 75.3 37.7 2,788
2002 3,124,772 10,883,296 23,463,917 29.0 6.78 15.7 45,309 36,894 184,192 744 0.187 108 53.8 4,184
2003 2,768,129 13,807,702 34,257,913 29.0 6.61 15.7 40,138 45,634 268,925 990 0.243 140 70.0 5,571
2004 2,748,560 16,623,580 44,155,156 29.0 6.44 15.7 39,854 53,528 346,618 1,229 0.299 172 86.1 6,911
a - Data for flat panel TVs based on TV sales data obtained from Consumer Electronics Association (CEA) Market Research, 2005 and ERG analyses of "Other TV" category in US Census data on shipments, imports, and exports, combined with CEA data on monochrome TVs. Data are for standard size units and do not include large screen TVs. b - Data for laptop computers obtained from IDC WW Quarterly PC Tracker in October 2005. c - Data for flat panel monitors based on ERG analysis of US Census data on shipments, imports, and exports. d - Average weight per unit for flat panel TVs and laptop computers from ERG in-house data series. TV weight data are for standard size TVs and do not include large screen TVs. Average weight for flat panel monitors developed from ERG in-house data series averaged with data points from Florida DEP electronics collection study.

Table 5-1 (Continued)
Updated Report: April 24, 2008 50
e - Based on composition by weight for LCD flat panel monitors reported in "Desktop Computer Displays: A Life Cycle Assessment" (EPA/744-R-01-004a, December 2001). The weight of mercury in LCD backlight lamps and the weight of liquid crystals in LCD panels are assumed to be proportional to a unit's screen area. Average screen area for flat panel monitors and laptops is assumed to be 108 square inches, and average screen area for a 29-lb flat panel TV is estimated as 280 square inches. f - Lead = (0.0028 lb lead per lb of product) x tons of flat panel products g - Mercury = (8.1×10⁻⁸ lb mercury per sq inch of screen area) × viewing area per unit x number of units h - Liquid crystals based on information provided in "Desktop Computer Displays: A Life Cycle Assessment" (EPA/744-R-01-004a, December 2001); (4.7 x 10⁻⁵ lb liquid crystals per sq inch of screen area) x viewing area per unit x number of units i - Liquid crystals based on information provided in Merck's presentation at the 2004 – 11th International Display Workshop (December 8-10, 2004). (weight of liquid crystals = 0.02% the weight of flat panel display) j - Flame retardant = (0.016 lb flame retardant per lb of product) × tons of flat panel products

Updated Report: April 24, 2008 51
Table 5-2. Substances of Concern in Flat Panel TVs
Tons of Substances of Concernc
Year
U.S. Consumption
in UnitsaAverage
Pounds/Unitb
U.S. Consumption
in Tons Leadd MercuryeLiquid
CrystalsfLiquid
CrystalsgFlame
Retardanth
Estimated Disposal
Yeari
1989 2,243,214 29.0 32,527 91 0.026 14.7 7.4 511 2005 1990 1,479,513 29.0 21,453 60 0.017 9.7 4.9 337 2006 1991 1,258,313 29.0 18,246 51 0.014 8.3 4.1 287 2007 1992 2,388,180 29.0 34,629 97 0.027 15.7 7.8 544 2008 1993 2,403,629 29.0 34,853 97 0.027 15.8 7.9 547 2009 1994 1,648,638 29.0 23,905 67 0.019 10.8 5.4 375 2010 1995 943,646 29.0 13,683 38 0.011 6.2 3.1 215 2011 1996 1,217,575 29.0 17,655 49 0.014 8.0 4.0 277 2012 1997 1,375,254 29.0 19,941 56 0.016 9.0 4.5 313 2013 1998 2,228,984 29.0 32,320 90 0.025 14.6 7.3 508 2014 1999 3,045,631 29.0 44,162 123 0.035 20.0 10.0 694 2015 2000 2,554,290 29.0 37,037 103 0.029 16.8 8.4 582 2016 2001 2,385,427 29.0 34,589 97 0.027 15.7 7.8 543 2017 2002 3,124,772 29.0 45,309 127 0.036 20.5 10.3 712 2018 2003 2,768,129 29.0 40,138 112 0.032 18.2 9.1 630 2019 2004 2,748,560 29.0 39,854 111 0.031 18.1 9.0 626 2020
a - Data for flat panel TVs based on TV sales data obtained from Consumer Electronics Association (CEA) Market Research, 2005 and ERG analyses of "Other TV" category in US Census data on shipments, imports, and exports, combined with CEA data on monochrome TVs. Data are for standard size units and do not include large screen TVs. b - Average weight per unit for flat panel TVs from ERG in-house data series. TV weight data are for standard size TVs and do not include large screen TVs. c - Based on composition by weight for LCD flat panel monitors reported in "Desktop Computer Displays: A Life Cycle Assessment" (EPA/744-R-01-004a, December 2001). The weight of mercury in LCD backlight lamps and the weight of liquid crystals in LCD panels are assumed to be proportional to a unit's screen area. Average screen area for a 29-lb flat panel TV is estimated as 280 square inches. d - Lead = (0.0028 lb lead per lb of product) × tons of flat panel products e - Mercury = (8.1×10⁻⁸ lb mercury per sq inch of screen area) × viewing area per unit x number of units

Table 5-2 (Continued)
Updated Report: April 24, 2008 52
f - Liquid crystals based on information provided in "Desktop Computer Displays: A Life Cycle Assessment" (EPA/744-R-01-004a, December 2001); (4.7 x 10⁻⁵ lb liquid crystals per sq inch of screen area) x viewing area per unit x number of units g - Liquid crystals based on information provided in Merck's presentation at the 2004 – 11th International Display Workshop (December 8-10, 2004). (weight of liquid crystals = 0.02% the weight of flat panel display) h - Flame retardant = (0.016 lb flame retardant per lb of product) × tons of flat panel products i - Average age of televisions in the waste stream tends to be 15-17 years old, according to "Recycling Technology Products: An Overview of E-Waste Policy Issues" (U.S. Department of Commerce Office of Technology Policy, July 2006).

Updated Report: April 24, 2008 53
Table 5-3. Substances of Concern in Laptop Computers and Flat Screen Monitors
U.S. Consumption in Units Average Pounds/UnitcU.S. Consumption in
Tons Tons of Substances of Concernd
Year Laptop Computersa
Flat Panel Monitorsb
Laptop Computers
Flat Panel Monitors
Laptop Computers
Flat Panel Monitors Leade Mercuryf
Liquid Crystalsg
Liquid Crystalsh
Flame Retardanti
Estimated Disposal
Yearj
1989 0 1,083,598 15.7 - 8,506 24 0.005 2.7 1.4 134 1997
1990 0 882,707 15.7 - 6,929 19 0.004 2.2 1.1 109 1998
1991 0 1,499,605 15.7 - 11,772 33 0.007 3.8 1.9 185 1999
1992 1,850,000 1,726,516 9.00 15.7 8,325 13,553 61 0.016 9.1 4.5 344 2000
1993 2,527,979 1,839,521 8.73 15.7 11,035 14,440 71 0.019 11.1 5.5 400 2001
1994 3,200,464 2,795,290 8.46 15.7 13,538 21,943 99 0.026 15.2 7.6 557 2002
1995 3,563,808 2,967,154 8.20 15.7 14,612 23,292 106 0.029 16.6 8.3 595 2003
1996 4,949,204 2,266,424 7.93 15.7 19,624 17,791 104 0.032 18.3 9.1 588 2004
1997 6,000,142 1,222,048 7.66 15.7 22,981 9,593 91 0.032 18.3 9.2 512 2005
1998 6,407,928 1,849,201 7.39 15.7 23,677 14,516 107 0.036 20.9 10.5 600 2006
1999 7,870,995 11,195,520 7.13 15.7 28,060 87,885 324 0.084 48.3 24.2 1,821 2007
2000 9,622,814 12,817,066 7.13 15.7 34,305 100,614 377 0.099 56.9 28.4 2,119 2008
2001 9,575,220 13,966,136 6.95 15.7 33,274 109,634 399 0.104 59.7 29.8 2,245 2009
2002 10,883,296 23,463,917 6.78 15.7 36,894 184,192 617 0.151 87.1 43.5 3,473 2010
2003 13,807,702 34,257,913 6.61 15.7 45,634 268,925 878 0.211 121.8 60.9 4,941 2011
2004 16,623,580 44,155,156 6.44 15.7 53,528 346,618 1,117 0.267 154.0 77.0 6,285 2012
a - Data for laptop computers obtained from IDC WW Quarterly PC Tracker in October 2005. b - Data for flat panel monitors based on ERG analysis of US Census data on shipments, imports, and exports. c - Average weight per unit for laptop computers from ERG in-house data series. Average weight for flat panel monitors developed from ERG in-house data series averaged with data points from Florida DEP electronics collection study. d - Based on composition by weight for LCD flat panel monitors reported in "Desktop Computer Displays: A Life Cycle Assessment" (EPA/744-R-01-004a, December 2001). The weight of mercury in LCD backlight lamps and the weight of liquid crystals in LCD panels are assumed to be proportional to a unit's screen area. Average screen area for flat screen monitors and laptops is assumed to be 108 square inches. e - Lead = (0.0028 lb lead per lb of product) × tons of flat panel products f - Mercury = (8.1×10⁻⁸ lb mercury per sq inch of screen area) × viewing area per unit x number of units

Table 5-3 (Continued)
Updated Report: April 24, 2008 54
g - Liquid crystals based on information provided in "Desktop Computer Displays: A Life Cycle Assessment" (EPA/744-R-01-004a, December 2001); (4.7 x 10⁻⁵ lb liquid crystals per sq inch of screen area) x viewing area per unit x number of units h - Liquid crystals based on information provided in Merck's presentation at the 2004 – 11th International Display Workshop (December 8-10, 2004). (weight of liquid crystals = 0.02% the weight of flat panel display) i - Flame retardant = (0.016 lb flame retardant per lb of product) × tons of flat panel products h - Average age of computers in the waste stream tends to be 6-10 years old, according to "Recycling Technology Products: An Overview of E-Waste Policy Issues" (U.S. Department of Commerce Office of Technology Policy, July 2006).
Updated Report: April 24, 2008 55
A study at Carnegie-Mellon University estimated that nearly 150 million computers will have been recycled by 2005 (Matthews et al. 1997, 1999). According to the International Association of Electronics Recyclers (IAER), there are 400 companies in the U.S. that are considered to be electronics recyclers, with annual revenues of over $700 million and more than 7,000 employees (IAER 2003). A recent IAER survey shows that over 60 e-waste recyclers are located in the Pacific Coast region. Although most electronics recyclers are small companies, there are several major recyclers that collectively process a large portion of the industry volume. Recyclers may be involved in any of the following industry segments or operations:
• Asset management; • Broker; • Reuse; • Demanufacturing; • Parts recovery; • Materials recovery; and • Materials processing.
The key economic drivers for electronics recycling are the need for a predictable stream of high volume sources and the capital required for automated processes (IAER 2003). According to local recyclers in the Pacific Northwest, the number of flat panel displays that are currently being recycled is low. As a result, there has been little effort or investment in developing specialized techniques to recover the small amount of residual materials contained in the displays. This is likely to change as larger volumes of flat panel displays reach end-of-life. The following recyclers of FPDs and FPD components and materials were contacted as part of this study: Ecoglass Recycling; Metech International; RC Recycling; RMD Technologies; SIMS Recycling Solutions; Supreme Computer Recycling; Total Reclaim, Inc.; We Recycle, Inc!; Hewlett-Packard; Recovery Plastics International (RPI); Integrated Solutions and Services, Inc.; Association of Lighting and Mercury Recyclers (ALMR); QML Inc.; Metals & Logistics; and Noranda. See Appendix B for contact information. The descriptions of FPD recycling (receipt, storage, export, disassembly, shredding/separation, and recycling of materials) in the following sections are based on communications with the specific recyclers cited. These recyclers represent the more advanced end of the spectrum of recovery and recycling practices that were identified for FPDs in the U.S. No “typical” or “average” industry practice for recycling FPDs could be identified, as discussed in the sections below. 5.4.1 Disassembly and Material Separation
Electronics recyclers receive flat panel displays from a variety of sources, including both single- and mixed-waste streams. The predominant types of FPD devices being received by electronics recyclers are desktop monitors, laptop screens, and TVs. These units come to recyclers from community collection events, individual drop-offs, businesses that update company electronic systems, and batches of failed units from manufacturers.

Updated Report: April 24, 2008 56
Depending on storage space issues and local regulations, collected electronics equipment may be stored indoors or outdoors with varying degrees of protection from the elements and measures to contain or control releases to the environment that may result from broken or damaged equipment. Different recyclers may have different standards for protective equipment. One major electronics recycler reported that all operations for their recycling facility are indoors. The recycling personnel wear coveralls or aprons, Kevlar sleeves, steel-toed boots, safety glasses, and gloves.15
Electronics recyclers often provide a variety of services and processes for recovered equipment. Products may first be sorted according to condition, with units still in operating condition or requiring minor repair/refurbishing being diverted to secondary users. Inoperable units may be processed by domestic recyclers or exported to countries such as China, Vietnam, Indonesia, or Malaysia for recycling. East coast recyclers may find it more profitable to ship to South America or Africa instead of Asia. For FPD devices recycled domestically, usable components or components containing hazardous substances may be removed manually, although this is not currently common practice since they are not designed for ease of disassembly and it is difficult to remove components. Plastic casings and larger metal components may also be removed manually. The remaining bulk may be shredded and various separation techniques utilized to obtain material commodity fractions such as ferrous and non-ferrous metals and plastics. 16 However, not many electronics recyclers have shredders. One smelter reported processing entire FPD units for copper recovery.17
A general flow diagram for end-of-life management of FPDs is presented in Figure 5-1. 5.4.1.1 FPD Disassembly
FPDs are not manufactured for easy disassembly. The fasteners of a typical FPD are small and may be inaccessible, including clips, screws, and adhesives. Further, the design of FPDs, including the types and locations of fasteners and other components, differs among FPD products made by different manufacturers. These design barriers and differences make it difficult from both a manufacturing and cost perspective for recyclers to develop a standard disassembly method that can accommodate the different designs of different FPDs. Components that may be removed from an FPD unit for separate management include LCD screen assemblies, mercury lamps, and circuit boards; however, because it is often difficult to remove these components many recyclers prefer to export entire monitors. Some recyclers shred the FPD device components that cannot be easily disassembled.
15 Communication with Craig Lorch, Total Reclaim Inc. Environmental Services. August 3, 2006. 16 Recycling Technology Products: An Overview of E-waste Policy Issues. U.S. Department of Commerce, Technology Administration, Office of Technology Policy. July 2006. 17 Communication with Mark TenBrink, Noranda. September 2006.

Manufacturers(failed units)
Communities(collection events
or curbsiderecycling)
Individuals(direct drop-off at
recycler)
Figure 1. Flow Diagram for the Recovery of Materials from Flat Panel Displays(note that figure shows components that may be removed by some recyclers;
other recyclers may leave some or all of these with bulk that is shredded or exported)
Exportfor Recycling
Disassembly(by hand)
Shredder,Magnetic Separation,
& Eddy CurrentSeparation
Mixed plastics
Steel
Aluminum
Copper
Mixed metals (non ferrous)
Removableplastic
components
Metals broker(markets unknown)
Plastics broker(markets unknown)
Metals broker(domestic and
export markets)
Metals broker(export markets)
Plastics broker ordirect customers
who furtherprocess plastics
Mercury lamps Mercury recoveryrecycler
Circuit boards Metals recovery
(smelter)Removed LCD
screensRe
sidua
l Bul
k(a
fterc
ompo
nent
sm
anua
llyre
mov
ed)
Resid
ual B
ulk
(afte
rcom
pone
nts
man
ually
rem
oved
)
Sortingby recycler
ToSecondary
User
WorkingUnits
Non-Working
Units
Non-workingUnits
Figure 5-1. Flow Diagram for the Recovery of Materials from Flat Panel Displays
Updated Report: April 24, 2008 57

Updated Report: April 24, 2008 58
The following sections briefly address removed components and recovered material streams; more detail on the processing and ultimate fate of each component or material is provided in Section 5.4.2. LCD Screens
The FPD screen is comprised of thin layers of glass with very small quantities of liquid crystals and other materials. One company reported that they remove LCD displays from the larger products they receive (copiers and printers) but not from smaller products such as cameras. Laptop screens are separated from the rest of the computer by hyper-extending the hinges. The removed screens are sent to a primary smelter in Canada for metals recovery.18 This smelter also processes intact FPD units.19
Another recycler reported that while some efforts have been made to develop recovery techniques for materials in FPDs, at this time there are not any methods for recovering the glass or the liquid crystals from LCDs; thus, they remove the mercury backlight then shred the LCD panel with the bulk of the FPD. The glass and other LCD component materials end up as residues on the shredder output streams. Depending on the specific recycler, these residues could be landfilled or disposed of by downstream processors (e.g., a plastics recycler or metal smelter). Some recyclers do not send any of this material to landfills; however, others do. In addition, it should be noted that shredder residues are entrained with other materials (e.g., liquid crystal residues on plastics) that are later disposed of by downstream processors.20 Mercury Lamps
According to the EPA, about 4 mg of elemental mercury is contained in the fluorescent backlights of an LCD unit21, and thus should be handled properly. The intact mercury lamp can be removed by hand; however, recovery of mercury from the lamp requires special equipment that breaks the lamp and safely separates the glass, mercury, and other components. This is a closed process with negative pressure, which prevents the release of mercury. Because of this, only specialized recyclers are typically capable of recovering the mercury from the lamps. Based on informal discussions with lamp recyclers and ALMR (Association of Lighting and Mercury Recyclers), there is no current demand for the recycling of FPD lamps, so it is reasonable to conclude that many recyclers are mismanaging these lamps. More information on lamp recycling is provided in Section 5.4.2. 5.4.1.2 Shredder/Magnet/Eddy Current
After individual components have been removed, some recyclers shred the remaining FPD materials and then pass the shredded material through magnetic and eddy current separators. This sequence of processes allows recyclers to separate the shredder output into ferrous metals, aluminum and other nonferrous metals, and remaining residuals. Depending on what components were removed prior to shredding, the residuals pile may include shredded circuit boards, plastic casings, LCD screen materials, etc. A disadvantage of shredding is that the resulting mix of materials is difficult to separate. Even when magnetic or Eddy current separators are used, each output contains a small amount of contaminant material (e.g., shredded plastics may contain small amounts of non-ferrous metals.)
18 Communication with Larry King, Hewlett-Packard. July 19, 2006. 19 TenBrink, Noranda, 2006. 20 Lorch, Total Reclaim, 2006. 21 Desktop Computer Displays: A Life-Cycle Assessment – EPA 744-R-01-004a, December 2001.
Updated Report: April 24, 2008 59
Plastics
Electronics recyclers recover commodity plastics and send them to a broker or downstream recycler for management. The initial electronics recycler normally does not grind or pelletize plastics for direct sale to end users (e.g., plastic molders). Some recyclers may segregate plastics and then shred them to prepare them for a particular buyer or market, but normally plastics kept in large pieces and are baled and shipped to a buyer. Electronics recyclers usually do not have identification equipment to identify plastics by resin type (ABS, PC, HIPS, and other resins). Further, most domestic recyclers do not use rudimentary identification techniques, such as burning a small sample of plastic and observing the color and scent of the smoke. Some recyclers sort plastics by color or by the type of equipment from which it was removed. Commodity plastics recovered from electronics include ABS (acrylonitrile-butadiene-styrene), HIPS (high impact polystyrene), and polycarbonate. One recycler reports that they have a steady domestic market for HIPS and an established export market for ABS. Although this recycler recovers polycarbonate from other sources, they do not recover polycarbonate from FPDs. The presence of flame retardants in electronics plastics may also complicate recovery, separation, and reuse. However, this recycler reports that there are no current restrictions on the marketability (export or domestic) for plastics containing fire retardants .22 More information on separation of plastics is provided in Section 5.4.2. Metals
Steel and aluminum are used in FPDs as structural components or to provide ballast to prevent tipping. Copper is used in wiring and circuitry, and precious metals and lead (in solder) can be found in circuit boards. Larger discrete metal components can be removed manually, while smaller or internal metal components can be recovered via shredding and separation, etc. Electronics recyclers recover steel, aluminum, copper, and circuit boards. Recovered metals are sold to either downstream recyclers or metal brokers. Once materials have been sold to brokers, recyclers may not know if the materials are used domestically or exported to foreign markets. There is a strong domestic demand for steel and aluminum, and it is likely that such metals are processed in the U.S. However, depending on location, it is possible that steel is exported to China, Japan, Korea, or Latin America. Copper bearing scrap, on the other hand, is exported because there are no secondary copper smelters in the U.S. Precious metals are found in the circuit boards of electronics equipment and can be recovered by precious metals smelters. The three most commonly used precious metals smelters, none of which are located in the U.S., are Boliden (Sweden), Noranda (Canada), and UMICORE (Belgium). The plastic components and epoxy resin of circuit boards may be used as a fuel source in the recovery process by these smelters. Precious metals are also recovered in developing countries using rudimentary refining techniques, with fewer worker safety and environmental controls. 5.4.1.3 Landfilling
In general electronics disassemblers/shredders send little or no material directly to a landfill if they are able to find markets for the materials. They may resort to landfilling materials for which they cannot 22 Lorch, Total Reclaim, 2006.

Updated Report: April 24, 2008 60
find takers. Some fraction of the recovered components and materials that go to downstream processors may be unusable and end up being disposed at a later processing stage. 5.4.2 Downstream Processing of Recovered Components and
Materials
5.4.2.1 Plastics23
Flame retardants are often added to plastics used in electronic equipment applications. There are two primary types of flame retardants used for plastics: brominated flame retardants and phosphate flame retardants. The two types of flame retardants are not compatible. If both types of flame retardants are present in the same recovered supply of a given plastic, the plastic will degrade during further processing. One primary flame retardant used in flat panel displays is decabromodiphenyl ether (decaBDE), a brominated flame retardant that has been receiving increased scrutiny the past several years because of uncertainty regarding its persistence, bioaccumulation, and toxicity potential. Recovery Plastics International (RPI) was the only electronics plastics recycler identified with a process for separating plastics with flame retardants. RPI has developed a separation process for thermoplastics recovered from electronics. RPI’s process is unique because it sorts plastics by type of plastic as well as by flame retardant. Currently, RPI has one facility in Utah. The input to RPI’s process is baled, unshredded plastics from electronics recyclers; the outputs of the process are mixtures of plastics with or without flame retardants. Virtually all plastics used in electronics are thermoplastics such as high impact polystyrene (HIPS), acrylonitrile butadiene styrene (ABS), polycarbonate (PC), and polyvinyl chloride (PVC). The majority of recovered plastics received by RPI are from computer monitors, laptops, and TVs. The percentages of computer monitor plastics from CRTs (cathode ray tubes) and FPDs (flat panel displays) are unknown. The percentages of plastics from laptops, TVs, and other electronics are unknown. RPI’s process utilizes the hydrophobic properties imparted by flame retardants. Bubbles form on the surface of plastics with phosphate flame retardants, causing the plastics to float in a floatation tank. Bubbles do not form on the surface of plastics with brominated flame retardants, causing the plastics to sink in a floatation tank. RPI produces 1,000 pounds of sorted plastic per hour, including grades with and without flame retardants. Non-flame retardant grades represent 30 percent of RPI’s products and include HIPS and ABS. Flame retardant grades represent 70 percent of RPI’s products and include HIPS, ABS, mixed PC/ABS, and mixed ABS/PVC. The mixed PC/ABS is the only grade that has phosphate flame retardants. RPI’s products can be processed like virgin material and thus can be used in high grade products. For example, one of RPI’s customers uses the flame retardant HIPS to mold housings for televisions. All of RPI’s products are at least 95 percent pure. Contamination is not due to the presence of non-plastic components, but is due to the presence of plastics that are not specified for the grade.
23 Information in this section is derived from conversations with Susan Landry, Albemarle, August 9, 2006, and Ron Kobler, Recovery Plastics International, July 27, 2006.

Updated Report: April 24, 2008 61
The solid wastes from RPI’s process include residual metals, rubber, and unusable plastics. These solid wastes are landfilled. According to RPI, there are negligible waterborne effluents from the process. 5.4.2.2 Metals24
Research on the recovery of heavy metals focused on lead and mercury. The major sources for lead in electronics equipment are leaded glass used for CRTs and solder used for circuit boards. Unlike CRTs, FPDs do not use leaded glass, and thus the main source of lead from FPDs is the solder used for circuit boards. The predominant practice for managing metals in circuit boards is to either export the circuit boards to a precious metals smelter or to a developing country with rudimentary metals recovery techniques. If a precious metals refiner is used, an assay will be performed on the shipment by the recycler, their broker, or the refiner to determine the types and quantities of metals in the shipment to enable the parties to negotiate a price at which the electronics recycler can sell the circuit boards. Although older circuit boards and electronics may contain mercury wetted relays, the major source of mercury in electronics currently is lamps used for the illumination of FPD screens. In most states, lamp recyclers must have a specialized permit or state authorization to manage mercury-bearing materials, and thus there are only a few mercury recovery facilities in the U.S. Processing of mercury lamps is described in the following section. 5.4.2.3 Mercury Lamps25
An unknown percentage of mercury lamps in FPDs are removed and processed in mercury recovery facilities, although the lamp recyclers surveyed believe that this percentage is currently very small. Mercury recyclers must operate within the requirements of RCRA and their particular state’s operating requirements, and may be considered hazardous waste treatment facilities by their state regulating authority. Although the managers of mercury lamps, including backlight assemblies in FPDs, are regulated under the Universal Waste regulations, mercury recyclers state that there currently is no tracking, accountability, or government oversight in the management of FPD lamps. Under Title 40: Protection of Environment, Part 273: Standards for Universal Waste Management26, the Code of Federal Regulations specifically defines and addresses management of some products that may contain mercury, i.e., batteries, pesticides, and lamps. FPDs and other e-waste are not specifically addressed in Part 273 or in Part 261: Identification and Listing of Hazardous Waste27 (273.4: Applicability—Mercury-containing equipment, 273.9: Definitions, or 261.4:Exclusions), although an amendment to 261.4 excluding CRTs was added July 28, 2006.28
While it is possible to reuse mercury lamps removed from FPDs, it is not economically feasible. Thus, recovered mercury lamps should go to mercury recoverers for proper management.
24 The description of metals processing is based on a discussion with John Powers, president of Integrated Solutions and Services, Inc. and a founding member of the International Electronics Recycling Association (IAER). August 2, 2006. 25 Information on mercury lamp reprocessing is based on a discussion with Paul Abernathy, Executive Director of the Association of Lighting and Mercury Recyclers (www.almr.org). August 8, 2006. 26Title 40, Part 273 at: http://ecfr.gpoaccess.gov/cgi/t/text/ 27 Title 40, Part 261 at: http://ecfr.gpoaccess.gov/cgi/t/text/ 28Title 40, Part 261 CRT exclusion amendment at: http://ecfr.gpoaccess.gov/cgi/t/text/

Updated Report: April 24, 2008 62
There are approximately 35 facilities in the U.S. that recycle mercury-containing lighting products including FPD lamps . The Association of Lighting and Mercury Recyclers (ALMR) represents the majority of these recyclers, including the largest processors that can process the entire range of items that contain mercury. All mercury lamp recyclers in North America use a dry process. First, lamps are crushed and separated in a machine under a continuous vacuum that pulls air inward and draws the shattered material across mechanical separators. Glass is recovered and sent to glass markets wherever feasible for use as feedstock in various products. For fluorescent and FPD lamps, the mercury is recovered as a component of a powder that also contains phosphorus. Vapor-state mercury liberated in the crushing process is trapped in carbon filters that must also be properly managed. The second step of the mercury recovery process is a distillation process during which the mercury/phosphor powder is heated in a retort, mercury is gasified, and elemental mercury is condensed. Reclaimed mercury is sold on the commodities market. As stated above, there is no government tracking or accountability system, and reclaimed mercury is sold by brokers or recyclers to anyone needing it, including exportation. A recent article in the Wall Street Journal discussed the secretive chain of processors and brokers that sell mercury to African, Asian, and Latin American gold mines, where there is a high probability it will get back into the environment.29 The Government Accounting Office (GAO) estimates that 25 million pounds of mercury-containing wastes are not recycled every year30, and it is likely that much of this waste is mismanaged. There are many types of lamps and electronic devices that contain mercury. As an individual product, a lamp may have much less mercury than a thermostat or a switch. But there are over 500 million lamps (not just FPD lamps, but all types of lamps) per year that are not being recycled, making lamps a key potential source of mercury pollution. Based on conversation with ALMR, there is no data available to compare the amount of mercury generated by FPD lamps versus other devices. 5.4.2.4 LCD Screens
As described earlier, LCD screens may be removed from the FPD and sent elsewhere for processing, or the screens may be left with the bulk of the FPD that is shredded or sent to a smelter. A smelter of electronic equipment noted that LCD panels should not be shredded unless mercury lamps have first been removed; this is consistent with dismantling and shredding practices reported by another recycler31,32. This recycler reported that LCD materials (shredded after lamp removal) are not separated into a separate material fraction, but remain as residues with other material fractions separated from the shredder output. The smelter that was interviewed processes LCD screens and intact FPD units to recover copper. The smelting process is preceded by a shredder, which has equipment that can recover mercury. For example, Noranda’s smelting operation in Canada has two emission control units for collecting mercury off gas. Additionally, the workers who handle electronics at Noranda’s smelting facility are
29 “Backfire: How Mercury Rules Designed for Safety End Up Polluting.” Article by John Fialka published in the Wall Street Journal, April 20, 2006. 30 United States Government Accountability Office, Report to Congressional Requesters, “Hazardous Waste, EPA needs to Clarify the Types of Mercury Waste that Can be Treated and Disposed of Using the Debris Regulations”, December, 2005 31 TenBrink, Noranda, 2006. 32 Lorch, Total Reclaim, 2006.

Updated Report: April 24, 2008 63
closely monitored for exposure to mercury and are required to wear respirators with mercury vapor cartridges. Noranda’s recyclable feed cannot exceed 0.2 percent by weight of mercury. According to a representative of Noranda, this percentage is lower than amount of mercury contained in copper ores or concentrates. (Source: Mark TenBrink, Operations Manager, Noranda Recycling, 12/21/06). It should be noted that the process described above represents this smelter’s operations and may not reflect standard industry practice. Sand is a conventional fluxing agent for copper smelting; however, in the smelting of electronic equipment the LCD glass and other sources of silica in the electronic equipment serve as a fluxing agent. No materials are landfilled at the smelter’s U.S. equipment sorting operations. The solid wastes from smelting are tailings and slag, comprised mostly of metal oxides and silica, which are disposed in a tailings pond at the smelter’s facility in Canada.33 Slag is also used in the manufacture of cement. Slag from the TeckCominco smelter is shipped to Seattle for use in making cement. Management of slag enjoys certain exemptions from hazardous waste management rules under RCRA if used for sand blasting media or manufacturing cement. Another recycler is currently evaluating the feasibility of recovering valuable metals such as indium from LCD panels. This would most likely be done via a dry process (shredding followed by separation operations).34 Another indium recovery process is described in Section 5.5.3. 5.5 Recycling Technologies Under Development
A variety of recycling practices and technologies are currently being researched to reclaim components from flat panel displays; these practices, some of which are described below, may become economically viable when larger volumes of FPDs are available for recycling. 5.5.1 Recycling of Liquid Crystals and Liquid Crystal Mixtures
Technically, recovery of liquid crystals from end-of-life LCDs is possible. However, there are a number of factors greatly limiting the practicability of recycling the liquid crystals. These include:
• The liquid crystal mixture in an LCD typically contains 25 components or more (Becker 2002);
• The quantity of liquid crystals in each LCD is very small: 0.6 mg per square cm display size in a layer about 5 micrometers thick (Becker 2002; LIREC no date);
• Mechanical reclaiming of liquid crystals is not very efficient, because adhesive forces between
the liquid crystals and the glass plates are high and lead to the risk of glass breakage; and
• The extensive use of solvents is necessary to reclaim the liquid crystals; the use of these solvents is restricted by economic and regulatory considerations.
There are also legal ramifications to the reclamation of liquid crystal mixtures. The specific composition of liquid crystal mixtures contained in LCDs varies by manufacturer. Many of the liquid crystals and liquid crystal mixtures are patented. Thus, liquid crystals reclaimed from LCDs would have to be separated into their individual liquid crystal components or would need to be segregated by specific “recipes,” to be offered to their respective original manufacturers. Research done by Merck indicates that this reclamation procedure is more expensive than the manufacturing of the same
33 TenBrink, Noranda, 2006. 34 Communication with Jim McMahon, QML Inc. Metals & Logistics. August 2006.

Updated Report: April 24, 2008 64
amount of virgin liquid crystal mixture. Therefore, the recycling of liquid crystal mixtures does not appear to be cost effective at this point in (Becker 2005). In addition, the liquid crystal mixtures used in LCDs require an extreme degree of purity, which further restricts the reuse of reclaimed liquid crystals. The liquid crystal mixtures reclaimed from mixed LCD waste may contain up to 500 different liquid crystalline components; this illustrates the practical difficulties in their reclamation and recycling. Recyclers contacted during this study do not separate liquid crystals from the display module; the liquid crystals are ground or shredded or disposed with the glass/plastic screen materials. Because they represent such a small portion of the material, they essentially disappear. 5.5.2 Recycling of LCD Panels
One of the first approaches to separating liquid crystals from LCDs and to recover glass used in the display was developed by Vicor, a recycling company based in Berlin, Germany. LCDs were crushed mechanically and the liquid crystals removed under low pressure. However, the liquid crystals extracted in these trials were not reused but destroyed at high temperature using a catalyst in a closed system. About 70 percent of the glass from the displays was recovered with this method (Prösler, 1999). Merck developed two technological options for the recovery of materials used in LCDs (Martin et al. 2004). The focus of the recycling technologies developed by Merck was on the recovery of the glass substrate used in LCDs. The glass typically represents more than 80% by weight of the LCD. Currently two types of glass substrate are used for manufacturing of TFT-LCDs:
• Soda-lime-glass is used in STN-LCDs (typical composition is 70-73% SiO2, 7-12% CaO, 13-15% Na2O and K2O, melting point is about 1000°C); and
• Borosilicate Glass is used in TFT-LCDs (typical composition is 50% SiO2, 15% B2O3, 10%
Al2O3, 25% BaO, melting point is about 1150°C). Thus, when LCDs of the types currently on the market reach their end of life, recycling of glass from these displays will need to deal with a mixture of two different types of glass. A selective melting process with separation of the impurities appears to be feasible (Becker 2004). The glass reclaimed using this process could then be used in the cement industry or in ceramic manufacturing. Research at Merck resulted in the development of two processes for utilizing materials from LCDs. The following summarizes their research results: Use of LCDs in industrial waste incinerators
This “recycling” technique does not actually recover materials from the LCDs for further use in product applications, but the LCD materials serve some useful purpose in this application, both replacing alternative materials and serving as an energy source, and the quantity of LCD material ultimately disposed is reduced by incineration of the combustible fraction. For this process the LCD is separated from the monitor’s other components, such as electronics and plastic case. Merck conducted trials that showed that LCDs could be used as a raw material substitute for silica sand in incinerators for industrial waste. Typically glass or melting sand is used in industrial waste incinerators in order to protect the incinerator’s walls against aggressive products during the incineration processes. Merck’s tests showed that shredded LCDs could be used as a

Updated Report: April 24, 2008 65
substitute serving the same purposes. The LCD glass is used as a substitute for additives (silica sand or silica containing materials) in the incineration process. Plastic foil from the LCD can be used as a substitute for oil or gas used as an energy source in the same process. The use of LCDs contributed to raw material cost savings as well as to energy cost savings. Energy contained in the plastic portion of the LCD is sufficient to melt the glass portion of the LCD. Merck applied for a patent for this method in 2004 (Martin, et al. 2004b). Use of LCDs in metal recycling processes (metallurgy)
In this process, the electronics contained in the LCD monitor do not need to be removed but can be recycled in the same process. The study showed that LCDs could be used in metal recycling processes for the separation of noble and base metals. The process glass from LCDs is used as a raw material instead of melting sand. The foil of the LCDs serves as a reduction agent instead of coal. Suitable applications for the use of LCDs include “metallurgical” processes for the production or purification of metals (e.g. used catalysts or waste metals) with high temperatures. These processes typically require the use of melting sand to separate the noble metals from the base materials. The products resulting from this process are slag and the recovered noble metals. To avoid the formation of metal oxides, reducing agents - like carbon-containing products – must be added. Merck applied for a patent for this method in 2004 (Martin, et al. 2004). 5.5.3 Recycling and Recovery of Indium Tin Oxide
In May 2005, Sharp announced that it had developed a technique to recycle indium from indium tin oxide (ITO) in the transparent conducive film used in LCD panels. The LCD panel is smashed into glass cullet, which is processed via acid dissolution. The company employs a unique indium separation technique to extract indium from the solution. Sharp says that the technique is quite simple since it uses commercially available chemicals and does not require much energy, and yet it can recover highly pure indium. Though a rare metal, indium is expected to be used increasingly in transparent electrodes of plasma displays and organic electroluminescent (EL) displays. Sharp is planning to test the technique using a large system for commercial application (Tsukioka 2005).

Updated Report: April 24, 2008 66
Section 6: Potential Human Health and Environmental Impacts
This section describes potential impacts to human health and the environment associated with the end-of-life management of flat panel displays. The purpose of this section is to provide overall perspective on potential exposures and impacts associated with the end-of-life handling and disposal of FPD devices. This section does not present a full life-cycle analysis. Exposure is defined as the contact of an organism with a chemical or physical agent; an exposure pathway is the course a chemical or physical agent takes from a source to the exposed organism (USEPA 1989). Each exposure pathway must include a source or release from a source (in this case, the FPD device), an exposure point (the location of potential contact between an organism and a chemical/physical agent), and an exposure route (ingestion, inhalation, skin contact). If the exposure point differs from the source, then a transport/exposure medium (such as air or groundwater) must also be present. If one of these components of an exposure pathway is not present, then exposure will not occur. Health impacts can occur only when a complete exposure pathway exists and if constituent exposure levels are sufficiently high. In the absence of specific exposure data (e.g., measured levels of FPD device constituents at exposure points) as well as some uncertainties regarding the toxicity of particular constituents, no definitive or quantitative estimates of impact or risk are possible. Instead, this section provides a qualitative discussion of the impact potential based on the review of the literature. The information presented in previous sections on type and quantity of materials used in FPD devices, constituent toxicity, and end-of-life management activities are pulled together here. The section points to instances where exposure could occur and where preventive measures would be prudent. Section 6.1 summarizes possible exposure situations associated with the end-of-life management of FPD devices. Section 6.2 details the potential impacts of those exposures. 6.1 Possible Exposure Pathways
Exposures to hazardous materials released from FPD devices can occur in a variety of ways. They may occur by inhalation of vapors (e.g., mercury) or dust (e.g., lead, cadmium). People may also be exposed to potentially hazardous materials by dermal (skin) contact or by incidental ingestion. Incidental ingestion occurs when contaminants present on the hands or elsewhere are placed in the mouth and swallowed unintentionally. Table 6-1 presents an overview of possible exposure pathways associated with the end-of-life management of FPD devices. Examples are described in more detail below. As discussed in previous chapters, the primary end-of-life management activities include storage, re-use/recycling, and disposal of non-recycled components (e.g., landfilling, incineration). Recycling, landfilling, and incineration involve various handling and process activities that could result in the disturbance of and release of hazardous constituents (see Chapter 5). Depending on those activities, receptors—or potentially exposed populations—include workers involved in the disposal or recycling of the panels.

Table 6-1. Potential Exposure Pathways
Source and Release
Mechanism Exposure Point Exposure
Route
Potentially Exposed
Populations Comment Recycling: Releases during disassembly, material separation, shredding, and other processing activities
Recycling/processing facility
Inhalation Direct skin contact Incidental ingestion
Recycling worker
Use of appropriate protective equipment and clothing will reduce or eliminate worker exposures. Measures to prevent off-site transport via worker clothing are prudent.
Landfilling: Releases during waste disposal activities
Landfill Inhalation Direct skin contact Incidental ingestion
Landfill worker Protective clothing will minimize direct skin contact and incidental ingestion. Measures to prevent off-site transport via worker clothing are prudent.
Volatile chemicals or particulates that are transported off site via wind Chemicals that migrate through the landfill to groundwater and are transported off site Chemicals that are transported off site via surface runoff
Vicinity of recycling facility, landfill, or incinerator
Inhalation Direct and indirect contact with dust Ingestion of contaminated groundwater Direct contact with sediment or surface water Incidental ingestion of sediment or surface water
Residents near recycling facility, landfill, or incinerator (adults and children)
Today’s landfills are designed to minimize these types of exposures; liners are used to prevent migration of contaminants to groundwater, and daily cover reduces the potential for surface water runoff. Little information available about controls at recycling facilities.

Updated Report: April 24, 2008 68
The likelihood and extent of exposures depend, however, on the degree of physical manipulation of FPD components, the quantity of hazardous constituents within said components, and controls in place to prevent constituent release (e.g., landfill liners, dust containment, emissions control, etc.) and to prevent exposure (e.g., personal protective equipment). 6.2 End-of-Life Activities and Associated Impacts
Generally, activities that mechanically disturb or alter the component parts provide an opportunity for constituent release. The following discussion describes how constituents of potential concern may be released and transported from FPD devices during end-of-life handling and the associated impacts. Recycling
The greatest potential for exposures and health hazards associated with recycling of FPD devices is to recycling workers. Recycling activities include manual disassembly, shredding, grinding, burning and melting (to reclaim plastics), solder melting, and metals processing. Metals and organics may be released as fine particulate dusts and fumes during crushing, shredding, and heating of FPD components and devices (FWI 2001). Workers involved in recycling of flat panel displays may be exposed to constituents of potential concern via inhalation (e.g., mercury vapors or plexiglass dust), incidental ingestion, or dermal contact. Of greatest concern is the release of mercury when lamps are broken. When spent mercury-containing lamps break or are crushed, the mercury inside is released and becomes available for evaporation, or for adsorption through direct skin contact. Mercury may also be released to the environment as a result of lamp crushing operations. An estimated 10 to 100 percent of the total mercury in the lamps may be released during crushing (USEPA 1999b). Lead may be released from printed circuit boards as dust or fumes. Lead is normally in solid form at atmospheric temperatures and therefore not readily released to air. If heated or ground into a powder, lead can be released and dispersed in the air. Recycling components containing cadmium may release the cadmium to air. Cadmium and cadmium oxide dust and fumes may be emitted when plastics are burned, and when printed circuit boards are shredded during metal recovery operations. Beryllium may be released to the air when components are shredded and from copper-beryllium alloys when metals are heated. Brominated flame-retardants may result in the formation of dioxins and furans when heated or incinerated (FWI 2001). In most cases, proper handling and controlled pre-treatment of FPD devices can minimize the hazards associated with these substances. Proper controls, such as air extraction and filtration, along with personal protective equipment can reduce the risk of inhalation exposures. Similarly, proper management methods for the recycling of waste fluorescent lamps and the collection of mercury emissions offer protection to workers and the environment. MJC and Associates (MJC) conducted a screening level human health and ecological risk assessment for a generic electronic waste processing facility for Environment Canada and Industry Canada (MJC 2004). Over one hundred e-waste recycling facilities operate in Canada, including large, state-of-the-art recycling and processing facilities as well as small to medium

Updated Report: April 24, 2008 69
sized operations which use a variety of techniques and methods to separate and process e-waste. The report responded to concerns that have been raised about the presence of heavy metals and other substances in e-waste that could pose a hazard to both human health and the environment. The assessment reviewed a wide range of inorganic and organic constituents; it did not address liquid crystal toxicity. With respect to human health risks in the occupational setting, the study found that:
• Recycling of e-waste, including FPDs, may pose health risks to recycling workers if not properly mitigated.
• Exposure to metals and other chemicals of concern can occur throughout the e-waste
processing cycle, including shredding, sorting, packaging, etc. and as a result of exposure to various media (air, dust, soil, etc.) through direct contact exposure pathways.
• E-waste exposure limits were ranked in terms of relative potential to cause human health
toxicity as follows, from highest to lowest, as follows: chromium, beryllium, nickel, cadmium, arsenic, azo-colorants, and phthalates. This was based on exposure to a female employee. (Note: lead was evaluated separately.)
• Metals and other compounds which can exist in particulate form and to which human
receptors could be exposed via the inhalation pathway pose potentially significant human health risks. To reduce these exposures, personal protective clothing, including use of proper dust masks, gloves, and other protective gear (coveralls, boots, etc.) would be an effective mitigation technique.
• Potential exposures to lead dust would present an unacceptable hazard to a pregnant
female worker and her fetus.
• Concentrations of beryllium and lead measured within the work areas of e-waste recycling facilities in Canada exceeded occupational exposure limits identified by the American Conference of Governmental Industrial Hygienists (ACGIH).
• Insufficient data were available to assess risks to residents who lie in proximity to an e-
waste processing facility; environmental monitoring was recommended.
• Additional measured exposure data are needed to more fully evaluate hazards associated with the constituents of potential concern within e-waste processing facilities. As such, further risk characterization and enhanced monitoring were recommended.
The report also recommended that training programs be implemented for each waste flow process that takes place at a facility (e.g., disassembly, parts classification, shredding, electrowinning); authors indicate that this is the best means to mitigate risks at a recycling facility. Authors warned that small, low-budget recycling facilities may lack resources to provide adequate equipment and training to mitigate workplace hazards. Activities at these facilities should be limited to operations such as disassembly that will not likely result in harmful exposures. In addition, e-waste recycling facilities should be designed to minimize worker access to hazardous processes and situations

Updated Report: April 24, 2008 70
In addition, the study recommended that an industry-government group be formed to promote programs within recycling facilities to ensure worker safety and environmental stewardship. The MJC assessment also evaluated risks to the natural environment from the processing of electronic waste, including flat panel displays. Data from air, soil and dust sampling conducted at Canadian e-waste recycling facilities were used in this evaluation. This screening level assessment identified three potential pathways by which constituents of concern could potentially enter the natural environment:
• The dispersal of dust associated with the shredding process from the recycling facility through doors, ventilation systems, etc.; the dust could deposit in soils or wetland sediments, with possible subsequent uptake by plants and animals.
• The release of water used in the processing of material; water and dust could flow
through drains out of the facility and migrate into soils and sediments.
• Leaching of hazardous constituents from electronic components stored outdoors before they are disassembled. Water (from precipitation) could leach through and drain into the local watershed, carrying with it dissolved chemicals of concern that would then be deposited in soils or water. Leachate could also percolate through the ground and contaminate groundwater.
The study found that exposure of all trophic levels to constituents of concern could occur if contaminated dust were to migrate outside an e-waste facility. The risk would be highest for organisms that directly ingest or allow uptake of dust, including plants, amphibians, and burrowing mammals that ingest earthworms. Risks to higher trophic level organisms could also be high, due to bioaccumulation of heavy metals. The study qualifies the results by saying that there is a high degree of uncertainty with their conclusions; very little actual measurements of concentrations of contaminants in the vicinity of electronic waste processing site in North America have been collected. Also, the level of contaminants in dust is likely to be highly variable depending on the types of e-waste processed and the processing and mitigation methods in place. Researchers recommended that additional measurement and characterization be conducted, including analysis for metals and PBDEs as well as bioassay testing to evaluate bioavailability of contaminants of concern in dust. Implementation of Best Management Practices within these facilities was also strongly recommended. Incineration
Incineration may be employed to recover energy from the waste material or to decrease its volume. While incineration reduces the hazardous potential of some substances, it may increase the toxic potential of others such as PVC and brominated flame-retardants. It concentrates substances, such as lead, for recovery or further management, but also disperses other substances into the environment due to air emissions from the incinerator (mercury, dioxins). When incinerated, plastics containing PBDEs may form brominated dioxins and furans (ATSDR 2004). Recycling of plastic materials containing PBDEs is a common industry practice.

Updated Report: April 24, 2008 71
However, it has been demonstrated that decaBDE-containing resins can be successfully recycled without generation of dioxins or furans (Donnelly et al. 1987; McAllister et al. 1990). Health and environmental impacts depend on the waste mix and emission controls. Landfilling
Disposal of FPD devices and components in landfills raise questions of potential worker exposures and the release of hazardous constituents to the environment. Exposure to landfill workers would depend largely on the nature of materials received and handling practices, such as the level of crushing or pulverizing of the materials. While releases to the environment and exposures to the general public cannot be ruled out, strict regulations governing the construction and operation of solid waste landfills render this scenario relatively unlikely. Also, the specific nature of materials to be disposed in a landfill dictate the level of potential impact (see Section 5.0). Regardless, controls should be in place to control contaminant migration to the environment through surface runoff, groundwater transport, or by wind. According to federal and state municipal solid waste regulations, landfill leachate must be collected and treated during the active life of the landfill, as well as for at least 30 years following closure of the landfill. Leachate is defined as “liquid that has passed through or emerged from solid waste and contains soluble, suspended, or miscible materials removed from the waste” (SWANA 2004). It is formed when rain or other water percolates through the landfill and collects contaminants that are leached from the waste or are produced as the waste decomposes. Many landfills utilize a standard composite liner system, which includes a leachate collection system, a “geomembrane” or plastic liner that is used as a hydraulic barrier, and a 24-inch thick compacted clay liner. Leachate is collected and treated prior to being pumped to the wastewater treatment plant. Selected Releases to Air
Mercury is easily volatilized; it can be dispersed widely through the air and transported thousands of miles. Mercury deposited on land or water may reenter the atmosphere to be redeposited elsewhere. When mercury enters water bodies, either through direct deposition or through runoff of mercury deposited on land, a series of transformations occur resulting in conversion of some of the mercury into a methylated form which is more toxic and more conducive to bioaccumulation in fish (USEPA 1999b). Lead-containing particles can stay aloft for up to 64 hours and travel 1,600 kilometers before settling (HSDB 2005). The lead would eventually settle by precipitation or by gravitational settling onto soil, surface water, or vegetation. Lead may also be released to surface water or groundwater through leaching from landfills. Because lead is relatively insoluble in water, it will precipitate and settle into lake or stream sediment. PBDEs may be present in the atmosphere as dust rather than vapors; the dust particles settle and are washed out by snow and rainwater. Since PBDEs do not dissolve easily in water, they tend to settle on lake and river sediments, which may act as reservoirs for PBDEs. The highly brominated PBDEs, such as deca-BDE, are not found in fish at measurable concentrations. Their breakdown in soil or sediment is very slow, and they may remain for several years. Since PBDEs bind strongly to soil particles, it is unlikely that they will enter groundwater (ATSDR 2004). PBDEs are persistent in the environment and tend to bioaccumulate in lipid (fatty)

Updated Report: April 24, 2008 72
tissues and the food web. Concerns have been raised that certain types of PBDEs may break down in the environment and change to other potentially more toxic forms. Low levels of PBDEs have been measured in suspended dust in indoor environments with computers and other electronic devices. Workers involved in the manufacture and production of PBDE-containing resins are exposed to higher concentrations of PBDEs; occupational exposure may also occur in confined workplaces where plastic and foam products containing PBDEs are recycled, or where computer monitors containing PBDEs are repaired. Occupational exposure occurs mainly by inhalation.

Updated Report: April 24, 2008 73
Section 7: Data Gaps and Recommendations
This section summarizes data gaps identified during the literature review and the subsequent research effort conducted during the preparation of this report. Recommendations for further study are also provided. 7.1 Data Gaps
The following data gaps were identified: Potentially hazardous constituents. While previous studies, such as EPA’s Desktop Computer Display Life Cycle Assessment (Socolof et al. 2001), developed lists of LCD components and materials, the technology and materials used in the design and manufacture of LCDs and other flat panel display devices is constantly evolving. Although structurally similar, the LCDs produced today may be different in terms of the materials they contain than the LCDs evaluated in 2000/2001. It is not clear how current LCDs and other flat panels compare to the devices evaluated in earlier studies. Complete Life Cycle Assessment. In addition, the 2001 LCA focused on a life cycle inventory of LCD materials and components. A complete life cycle assessment of all flat panel display devices (evaluating additional parameters such as energy use and up-stream and down-stream chemical use) could complement the current knowledge-base. Toxicity of liquid crystals. Toxicity testing has been conducted by the liquid crystal manufacturers for acute (short-term) toxicity, mutagenic effects, and skin/eye irritation. Based on these data, some have concluded the associated risk to these chemicals is not significant. Further, EPA’s Office of Pollution Prevention and Toxics has concluded that liquid crystals do not pose an unreasonable risk to human health or the environment (largely based on Structure Activity Relationships). However, no data were identified that evaluated chronic health effects (i.e., from long-term exposure to low levels of a substance) or tumorogenic (cancer) responses of these substances. Toxicity of decaBDE and emissions from plastic. Very little information is available on the emission rate of decaBDE from plastics used in flat panel display devices. In addition, minimal information is available on the fate and transport of deca-BDE, its potential for degradation into lower brominated congeners, and the potential toxicity of alternative flame-retardants. Current research is being conducted, to evaluate these issues; however, this lack of information makes it difficult to conclusively evaluate the potential health risks associated with this chemical during recycling and end-of-life disposal activities. Toxicity of Indium Tin Oxide. Some toxicity studies have been conducted indicating ITO may be moderately toxic and irritating when inhaled; however, the limited data are inconclusive (see section 3.2.1). Additional testing may provide definitive information pertaining to this compound. Risk evaluations of e-Waste Processing Facilities. Few studies on human health risks in the occupational setting and ecological risk assessments for the areas surrounding e-waste processing facilities are available. In particular:

Updated Report: April 24, 2008 74
• Insufficient data are available to assess risks to residents who lie in proximity to an e-waste processing facility; environmental monitoring may provide the required information.
• Additional measured exposure data are needed to more fully evaluate hazards
associated with the constituents of potential concern within e-waste processing facilities. Additional and/or enhanced monitoring, followed by further risk characterization is needed.
• Training programs specifically for recycling workers are generally inadequate.
Regulatory Review. A more thorough review of local, state and federal regulations regarding electronics recycling, disassembly and processing facilities is needed to determine if they are protective of human health and the environment. 7.2 Recommendations
Materials inventory. A study could be initiated to work with LCD and plasma display manufacturers to develop a comprehensive inventory of materials used to manufacture the current generation of devices. It would be necessary to identify manufacturers that are eager to demonstrate their commitment to sustainable manufacturing practices and the environment. Because some of the requested information is likely to be proprietary, assurances would need to be negotiated with the manufacturer to ensure that proprietary information will not be made public. Publicity about their participation in such an effort may serve as encouragement to one or more manufacturers. Support continued toxicity evaluations of liquid crystals. The testing conducted on liquid crystals to date points to low chronic toxicity, but is not definitive. Additional toxicity testing of representative liquid crystals or liquid crystal mixtures could be conducted, focusing on chronic toxicity, carcinogenicity, and aquatic toxicity. Acquiring sufficient data may be a significant undertaking; however, a definitive conclusion regarding potential chronic toxicity of liquid crystals cannot be made without this information. Support toxicity research for Indium Tin Oxide. Some toxicity studies have been conducted indicating ITO may be moderately toxic and irritating when inhaled; however, the limited data are inconclusive (see section 3.2.1). Additional testing may provide definitive information pertaining to this compound. Support efforts to replace toxic constituents. Data are inadequate to make definitive conclusions about the toxicity of some flat panel display device components, however the toxicity of others (particularly heavy metals) are well known. Additional efforts to identify viable, less-hazardous alternatives and encourage their use could be beneficial (e.g., efforts underway to develop substitutes for lead solder and decaBDE). Develop best management practices for FPD recycling. To reduce the release and subsequent occupational and general population exposures to potentially hazardous substances, additional research on potential occupational health effects during recycling operations could be conducted. This could include:

Updated Report: April 24, 2008 75
• Conducting a more formal (and exhaustive) survey of recycling facilities to assess all current recycling methods;
• Developing recycling process flowcharts;
• Identifying engineering controls, personal protective equipment (PPE), and workplace
practices that minimize releases and exposures with each unit operation and activity; and
• Conducting an outreach campaign to publicize appropriate controls, PPE, and best
management practices for recycling FPDs. Contaminant concentrations in or near recycling facilities. Very few actual measurements of contaminant concentrations in or near electronic waste processing/recycling facilities have been collected. Additional measurement and characterization studies could be conducted to evaluate the extent of contamination from e-waste recycling facilities. Studies could include analyses for metals and PBDEs, as well as bioassay testing to evaluate bioavailability of contaminants of concern in onsite and offsite dust. Conduct an updated, complete life cycle assessment. An LCA was prepared to assess environmental concerns pertaining to desktop computer displays in 2000 (Socolof et al. 2001). This study focuses on computer displays and does not address all aspects of the life cycle that are associated with all flat panel display devices. A new LCA could be conducted to evaluate additional flat panel display devices, including material use and wastage associated with the manufacturing process. This effort could include an evaluation of new, green technologies and potential alternative chemicals.

Updated Report: April 24, 2008 76
Section 8: Literature Reviewed
Agency for Toxic Substances and Disease Registry (ATSDR). 1992. Toxicological Profile for Antimony. U.S. Department of Health and Human Services. September 1992.
ATSDR. 1999a. Toxicological Profile for Mercury. U.S. Department of Health and Human Services. March 1999.
ATSDR. 1999b. Toxicological Profile for Cadmium. U.S. Department of Health and Human Services. July 1999.
ATSDR. 2000. Toxicological Profile for Chromium. U.S. Department of Health and Human Services. September 2000.
ATSDR. 2004. Toxicological Profile for Polybrominated Biphenyls and Polybrominated Diphenyl Ethers. U.S. Department of Health and Human Services. September 2004.
ATSDR, 2005. Toxicological Profile for Lead (Draft for Public Comment). U.S. Department of Health and Human Services. September 2005.
Arensman, R. 2000. Ready for Recycling? Electronic Business, The Management Magazine for the Electronics Industry. November 2000. As cited in CIWMB 2002.
Becker, W, Simon-Hettich, B. 2007. Toxicological and Ecotoxicological Investigations of Liquid Crystals. Status: July 16, 2007.
Becker, W. Simon-Hettich, Honicke, P. 2003. Toxicological and Ecotoxicological Investigations of Liquid Crystals and Disposal of LCDs. Merck KGaA, Darmstadt, Germany. Updated February 2003.
Broschard, T.H., Simon-Hettich, B., Becker, W., Takeuchi, H., Saito, H., Ohnishi, H., Takatsu, H., Naemura, S., Kobayashi, K. 2000. Ecotoxicological Properties of Liquid Crystal Compounds. Presented at 7th International Display Workshops, Kobe, Japan, November 29 – December 1, 2000.
California Department of Toxic Substances Control (DTSC). 2004. SB20 Report: Determination of regulated elements in discarded laptop computers, LCD monitors, Plasma TVs and LCD TVs. Hazardous Materials Laboratory. December 2004.
California Environmental Protection Agency (CalEPA). 2004. Procedural SOP No. 916-S: Preparation of consumer electronic devices containing Liquid Crystal Displays (LCDs) for Metals, California Waste Extraction Test and Toxicity Characteristic Leaching Procedure. Revision 2. Department of Toxics Substance Control, Hazardous Materials Laboratory. January 16, 2004.
CalEPA. 2004b. Procedural SOP No. 914-S. Preparation of Cold Cathode Fluorescent Lamps for Mercury Testing, including WET and TCLP. Revision 2. Department of Toxic Substances Control, Hazardous Materials Laboratory. January 16, 2004.

Updated Report: April 24, 2008 77
California Integrated Waste Management Board (CIWMB). 2002. Electronic Product Management Issues. Publication Number 441-02-002. February 2002.
California Integrated Waste Management Board (CIWMB). 2004. Best Management Practices for Electronic Waste. Publication # 630-04-005. Prepared by Santa Clara County Department of Environmental Health. April 2004.
Cascadia Consulting Group, Inc. (Cascadia). 2002. Assessment of Electronic Waste Generation, Collection, and Processing in Eastern Washington. Final Report. Prepared for Washington State Department of Ecology. December 31, 2002.
Cascadia Consulting Group, Inc. (Cascadia). 2003. E-Waste Generation in Northwest Washington. Final Report. Prepared by Cascadia Consulting Group and Sound Resolutions for Seattle Public Utilities. November 21, 2003.
Centers for Disease Control and Prevention. 2005. Third National Report on Human Exposure to Environmental Chemicals. Department of Health and Human Services. July 2005.
Diggelman, C. and Rau, G. 2003. Wisconsin End-of-Life Electronics Study. University of Wisconsin Extension Solid and Hazardous Waste Education Center. FY 2003.
Dodge, J. 2005. Chemicals target of state ban. The Olympian. December 3, 2005.
Donnelly, J., Grange, A.H., and Nunn, N.J. 1987. Analysis of thermoplastic resins for brominated dibenzofurans. Biomed. Environ Mass Spectrom 18(10):884-896. As cited in ATSDR 2004.
Electronics Industry Association of Japan (EIAJ). 1996. 1996 Update to: Research Report on the visions of the Electronic Display Industry to the Year 2000. Translated and published in English by InterLingus. As cited in Socolof et al. 2001.
ENVIRON. 2003. Voluntary children’s chemical evaluation program pilot. Tier I assessment of the potential health risks to children associated with exposure to the commercial octabromodiphenyl ether product. As cited in ATSDR 2004.
Environment Australia. 1999. Hazard Status of Waste Electrical and Electronic Assemblies or Scrap. Guidance Paper. Department of the Environment and Heritage. October 1999.
European Union. 2003. Directive 2002/95/EC of the European Parliament and of the Council of 27 January 2003 on the restriction of the use of certain hazardous substances in electrical and electronic equipment (ROHS Directive).
Five Winds International (FWI). 2001. Toxic and Hazardous Materials in Electronics: An Environmental Scan of Toxic and Hazardous Materials in IT and Telecom Products and Waste. Final Report. Prepared for Environment Canada, National Office of Pollution Prevention, and Industry Canada, Computers for Schools Program. October 2001.
Freedonia Group, Inc. 2004. Electronic Displays to 2008 – Market Size, Market Share, Market Leaders, Demand Forecast and Sales. Study 1787. 224 pp.

Updated Report: April 24, 2008 78
Frisman, P. 2005. OLR Research Report: Computer Recycling in California and Maine. Connecticut General Assembly Office of Legislative Research. 2005-R-0077. January 25, 2005. http://www.cga.ct.gov/2005/rpt/2005-R-0077.htm.
Gattuso, D.J. 2005. Mandated Recycling of Electronics, A Lose-Lose-Lose Proposition. Competitive Enterprise Institute, Issue Analysis. February 1, 2005.
General Electric (GE). 2004. Lamp Material Information Sheet. Fluorescent Lamps Material Safety Data Sheet. GE Consumer & Industrial Lighting. August 2004.
German Federal Environment Agency (GFEA). 2000. Statement of the German Federal Environment Agency Concerning the Ecotoxicology of Liquid Crystals in Liquid Crystal Displays, Status August 2000. http://www.umweltbundesamt.de/uba-info-daten-e/daten-e/lcd.htm
Hardy, M.L. 2002. The toxicology of the three commercial polybrominated diphenyl oxice (ether) flame retardants. Chemosphere 46(5):757-777. As cited in ATSDR 2004.
Hazardous Substances Data Bank. National Library of Medicine. http://toxnet.nlm.nih.gov/cgi-bin/sis/htmlgen?HSDB
Haz-Map. 2004. Occupational Exposures to Hazardous Agents. http://hazmap.nlm.nih.gov/
HDP User Group International. 2003. Evaluation of Environmentally-sensitive Material Content in IT Products. Document DfE Phase I. High Density Packaging User Group. February 20, 2003.
Homma, S., Miyamoto, A., Sakamoto, S., Kishi, K., Motoi, N., and Yoshimura, K. 2005. Pulmonary fibrosis in an individual occupationally exposed to inhaled indium-tin oxide. Eur. Respir J. Jan. 25(1):200-4, 2005.
*Howard, W.E. 2004. Better Displays with Organic Films. Scientific American. p. 76. February 2004.
Hutchinson, J. 2003. Plasma display panels: The colorful history of an Illinois technology. Electrical and Computer Engineering (ECE) Alumni News. University of Illinois at Urbana-Champaign. Vol. XXXVI, No. 1, Winter 2002-2003. http://www.ece.uiuc.edu/alumni/w02-03/plasma_history.html.
IBM. 2002. Composition and Value of Returned Industrial Information Technology Equipment Revisited. International Symposium on Electronics and the Environment. International Business Machines Corp., E. Grenchus et al., May 2002. As cited in IAER 2003.
INFORM. 2003. European Union (EU) Electrical and Electronic Product Directives: Overview and Highlights/Analysis. June 2003. www.informinc.org
Informa Research Services, Inc. 2005. Residential Waste Reduction and Recycling Survey 2005, Survey of King County Households, Final Report. Prepared for King County Department of Natural Resources and Parks, Solid Waste Division. April 2005.
International Association of Electronics Recyclers (IAER). 2003. IAER Electronics Recycling Industry Report.

Updated Report: April 24, 2008 79
Kavlock et al. 2002. NTP Center for the Evaluation of Risks to Human Reproduction: Phthalates Expert Panel Report on the Reproductive and Developmental Toxicity of [butyl benzyl phthalate, di-n-butyl phthalate, di(2-ethylhexyl)phthalate, di-isodecyl phthalate, di-isononyl phthalate, di-n-hexyl phthalate, di-n-octyl phthalate]. Reprod. Toxicol. 16(5):453-734.
LCD Industries Research Committee (LIREC). No date. Japan Electronics and Information Technology Industries Association. Environment and Safety Activities: http://home.jeita.or.jp/device/lirec/english/environ/material.htm.
Mann, C.C. 2004. Nanotech on Display. TechnologyReview.com. November 2004. http://www2.technologyreview.com/articles/04/11/mann1104.0.asp.
Martin, R., Simon-Hettich, B., and Becker, W. 2004. New EU Legislation (WEEE) compliant Recovery Processes for LCDs. Merck KGaA, Darmstadt, Germany. Presented at 11th International Display Workshop, IDW 2004, December 8-10, 2004.
Martin, R., Simon-Hettich, B., and Becker, W. 2004b. Safety of Liquid Crystals (LCs) and Recycling of Liquid Crystal Displays (LCDs) in Compliance with WEEE. In Liquid Crystal Newsletter No. 19, SID 2004 Special. Merch KGaA, Darmstadt, Germany. May 2004.
Material Safety Data Sheet (MSDS). 1993. Indium-Tin Oxide.
Matthews, H.S., Hendrickson, C., McMichael, F.C., and Hart, D.J. 1997. Disposition and End-of-Life Options for Personal Computers. Green Design Initiative Technical Report #97-10. Carnegie-Mellon University. July 1997.
Matthews, H.S., Hendrickson, C., McMichael, F.C., and Hart, D.J. 1999. Disposition and End-of-Life Options for Products: A Green Design Case Study. Carnegie-Mellon University, August 1999.
McAllister, D., Mazac, C.J., and Gorsich, R. 1990. Analysis of polymers containing brominated diphenyl ethers as flame retardants after molding under various conditions. Chemosphere 10-12:1537-1541. As cited in ATSDR 2004.
Meinhardt Infrastructure & Environment Group. 2001. Computer & Peripherals Material Project. Prepared for Environment Australia. October 2001.
Merck. No Date. Liquid Crystals for Active Matrix Displays. Prepared by M. Heckmeier, G. Lussem, K. Tarumi, and W. Becker. Merck KGaA, Darmstadt, Germany.
Merck. No Date. Licristal® Liquid Crystals from Merck, World Leading Source for LCD materials. Merck KGaA, Darmstadt, Germany.
Merck. 2004. New EU Legislation (WEEE) Compliant Recovery Processes for LCDs. Presented by Dr. Roland Martin, Dr. Brigitte Simon-Hettich, and Dr. Werner Becker at IDW 2004 – 11th International Display Workshop. December 8-10, 2004.
Merck. 2004b. The history of the future: 100 years of liquid crystals at Merck. Merck KGaA, Darmstadt, Germany.

Updated Report: April 24, 2008 80
Merck. 2004c. Liquid Crystal Newsletter No.19, SID 2004 Special. Merck KGaA, Darmstadt Germany. May 2004.
Mercury Research Team. 2002. Mercury in King County. Published by the Local Hazardous Waste Management Program in King County. SQG-Mercury-1(11/02). November 2002.
Microelectronics and Computer Technology Corporation (MCC). 1995. Electronics Industry Environmental Roadmap. Sponsored by the Advanced Research Projects Agency (ARPA), Environmental Protection Agency (EPA), and United States Department of Energy. June 1995.
Minnesota Office of Environmental Assistance (MOEA). 2004. Product Stewardship Initiative for Electronics. http://www.moea.state.mn.us/stewardship/electronics.cfm.
Mitchell, R.L. 2004. Toxic Legacy: Improper disposal of obsolete IT equipment is fast becoming a major liability for corporations. ComputerWorld. February 2, 2004.
MJC & Associates. 2004. Screening Level Human Health and Ecological Risk Assessment for Generic E-Waste Processing Facility. Prepared for ICT Innovation and Computers for Schools Program, Industry Canada and National Office of Pollution Prevention, Environment Canada. MJC03-126. September 2004.
National Electrical Manufacturers Association (NEMA). 2000. Environmental Impact Analysis: Spent Mercury-Containing Lamps. January 2000.
National Safety Council (NSC). 1999. Electronic Product Recovery and Recycling Baseline Report: Recycling of Selected Electronic Products in the United States. Washington, D.C. May 1999. As cited in Gattuso 2005.
NEMA. 2001. Fluorescent Lamps and the Environment: Mercury Use, Environmental Benefits, Disposal Requirements. National Electrical Manufacturers Association.
Nordic Council of Ministers. 1995. Waste from electrical and electronic products: a survey of the contents of materials and hazardous substances in electric and electronic products. TemaNord Report 1995:554. Nordic Council of Ministers, Copenhagen. As cited in FWI 2001.
Petreas, M., Garcha, J., and Simmons, B. 2005. E-Waste: Consumer Electronics Exceed Hazardous Waste Criteria. California Department of Toxic Substances Control, Hazardous Materials Laboratory. Presented at the American Chemical Society Division of Environmental Chemistry Symposium, San Diego, CA, March 13-17, 2005.
Premier Farnell. 2005. Premier Farnell RoHS Legislation and Technical Manual. Step-by-Step Guide, Version 2.
Prösler, M. 1999. Liquid Trash - Problems with disposal of LC displays. C't Magazine, Hannover, Germany, December 1999. http://www.heise.de/ct/english/.
Schmidt, C.W. 2002. E-Junk Explosion. Environmental Health Perspectives. Volume 110, Number 4, p. A188-A194. April 2002.
Searl, A. 2003. Review of the potential human exposure to decaBDE and the associated risks to health. Institute of Occupational Medicine. October 16, 2003.

Updated Report: April 24, 2008 81
Socolof, M.L., Overly, J.G., Kincaid, L.E., and Geibig, J.R. 2001. Desktop Computer Displays: A Life-Cycle Assessment. Volume 1. EPA-744-R-01-004a. Prepared by the University of Tennessee Center for Clean Products and Clean Technologies for EPA’s Design for the Environment Branch, Economics, Exposure & Technology Division, Office of Pollution Prevention and Toxics. December 2001.
Solid Waste Association of North America (SWANA). 2004. The Effectiveness of Municipal Solid Waste Landfills in Controlling Releases of Heavy Metals to the Environment. Prepared for the SWANA Applied Research Foundation Disposal Group Subscribers. March 2004.
Taguchi, O and T Chonan. 2006. [Three cases of indium lung] [Nihon Kokyuki Gakkai Zasshi] 44(7):532-6. [Article in Japanese, reviewed abstract only]
Townsend, T.G., Jang, Y.C., Ko, J.H., Pearson, B., Spalvins, E., and Wadanambi, L. 2003. Assessment of True Impacts of E-Waste Disposal in Florida. Report #04-0232008. Annual Report. Florida Center for Solid and Hazardous Waste Management. December 2003.
Townsend, T.G., Vann, K., Mutha, S., Pearson, B., Jang, Y.C., Musson, S., and Jordan, A. 2004. RCRA Toxicity Characterization of Computer CPUs and Other Discarded Electronic Devices. Department of Environmental Engineering Services, University of Florida. July 15, 2004.
Tsukioka, A. 2005. Sharp Uses LCD Panels to Recycle Indium. Japan Corporate News Network. May 25, 2005.
http://www.japancorp.net/printarticle.asp?Art_ID=10141
Umweltbundesamt. 2000. Statement of the German Federal Environmental Agency Concerning the Ecotoxicology of Liquid Crystals in Liquid Crystal Displays. http://www.umweltbundesamt.de/uba-info-daten-e/daten-e/lcd.htm.
U.S. Environmental Protection Agency (USEPA). 1989. Risk Assessment Guidance for Superfund, Volume I, Human Health Evaluation Manual (Part A). Interim Final. EPA/540/1-89/002. December 1989.
U.S. Environmental Protection Agency (USEPA). 1992. Method 1311 – Toxicity Characteristic Leaching Procedure. Revision 0. July 1992.
U.S. Environmental Protection Agency (USEPA). 1998. Computer Display Industry and Technology Profile. EPA 744-R-98-005.
USEPA. 1999. Introduction to the Chemical Import Requirements of the Toxic Substances Control Act. EPA 305-B-99-001. June 1999.
USEPA. 1999b. Hazardous Waste Management System; Modification of the Hazardous Waste Program; Hazardous Waste Lamps. Final Rule. Federal Register Vol. 64, No. 128. July 6, 1999.
U.S. Environmental Protection Agency (EPA). 2001. Persistent and Bioaccumulative Toxic Chemical Program’s Chemical List. Office of Pollution Prevention and Toxics.

Updated Report: April 24, 2008 82
USEPA. 2005. Hazardous Waste Management System; Modification of the Hazardous Waste Program; Mercury Containing Equipment. Final Rule. Federal Register, Volume 70, No. 150. August 5, 2005.
USEPA. Integrated Risk Information System (IRIS). http://www.epa.gov/iris/
Washington Department of Ecology. 2003. Interim Enforcement Policy. Conditional Exclusion for Cathode Ray Tubes and Related Electronic Waste. Publication Number 02-04-017. Originally Published April 2002, Revised December 2003.
Washington Department of Ecology. 2004. Economic and Financial Issues of End-of-Life Electronic Waste. Solid Waste Advisory Subcommittee, Electronics Waste. October 2004.
Washington Department of Ecology. 2004b. Solid Waste Advisory Subcommittee, Electronics Waste Meeting. Final Notes. October 29, 2004.
Washington Department of Ecology. 2005. Solid Waste Advisory Subcommittee, Electronics Waste Meeting. Final Notes. March 19, 2005.
Washington Department of Ecology. 2005b. Solid Waste Advisory Subcommittee, Electronic Product Recycling Proposal. August 2005.
Washington Department of Ecology. 2005c. Solid Waste Advisory Subcommittee, Electronics Waste Meeting. Final Notes. July 12, 2005.
Washington Department of Ecology. 2005d. Solid Waste Advisory Subcommittee, Electronics Waste Meeting. Final Notes. June 8, 2005.
Washington Department of Ecology and Washington State Department of Health. 2005. Washington State Polybrominated Diphenyl Ether (PBDE) Chemical Action Plan: Draft Final Plan. Department of Ecology Publication No. 05-07-048. December 1, 2005.
Wikipedia contributors. 2005. Liquid crystal display. Wikipedia, The Free Encyclopedia, http://en.wikipedia.org/w/index.php?title=Liquid_crystal_display&oldid=31033477

Appendix A:
EPA’s New Chemical’s Risk Assessment Process Under TSCA
Updated Report: April 24, 2008 A-1
For additional information, please contact J. V. Nabholz, Risk Assessment Division (mail code: 7403), Office of Pollution Prevention and Toxics, United States Environmental Protection Agency, 1200 Pennsylvania Avenue NW, Washington, DC 20460-0001, [email protected], Tel: 202.564.8909, Fax: 202.564.9063 or 7608. The Toxic Substances Control Act (TSCA) provides for the regulation of new industrial chemicals by the United States Environmental Protection Agency (USEPA). If the USEPA determines that a new chemical may present an unreasonable risk and/or significant exposure towards humans or the environment during the pre-manufacture notification period, then the Agency can request additional information be submitted and this additional information may be testing. The purpose of this additional information is to eliminate the potential risk. Section 5 of TSCA specifies the premanufacture reporting requirements for new chemicals. Since 1979, the USEPA has received about 38 000 pre-manufacture notifications (PMN) and currently there are about 2000 notifications per year. The only information that must be provided in the notification are: chemical identity, molecular weight, trade name, production volume, uses and amount for each use, by-products and impurities, human exposure estimates, disposal methods, and any test data in the possession of the notifier. TSCA does not require testing prior to submission of a PMN. Even if a chemical belongs to a Sec. 5 Chemical Category, a notifier does not have to do any testing prior to submission of a PMN. As a consequence, less than 20% of current notices have human health toxicity test data, less than 10% have environmental fate/transport test data, and less than 5% have environmental toxicity test data. Since TSCA places the burden of proof on the USEPA to demonstrate risk and/or exposure for a new chemical, the Agency may need to predict over 150 attributes for a chemical during an assessment. The Agency routinely performs environmental risk assessments for new chemicals within 21 days after receipt of the PMN. Environmental risk assessment is simply a comparison of toxicity with exposure. The toxicity of the new chemical is expressed as effective concentrations and the exposure is expressed as predicted environmental concentrations. If the environmental concentration significantly exceeds the effect concentration, then the EPA will request additional information from the submitter of the PMN. The purpose of this information is to mitigate the potential risk. If the risk cannot be mitigated, then the new chemical may be banned from production. If the risk can be mitigated and controlled, the new chemical may be regulated to ensure that the potential risk remains low. In order to do a risk assessment for a new chemical, the Agency makes predictions concerning chemical identity, physical/chemical properties, environmental transport and partitioning, environmental fate, environmental toxicity, engineering releases to the environment, and environmental concentrations. The Agency uses a variety of methods to make predictions which include structure activity relationships (SAR), nearest analog analysis, chemical class analogy, mechanisms of toxicity, chemical industry survey data, and professional judgment. The Agency uses these methods to fill data gaps in an assessment and to validate submitted data in notifications. Uncertainty associated with each prediction generally varies with attribute, chemical class, and type of method. Some attributes are not predicted because uncertainty is always too high. Some attributes are initially predicted only qualitatively and later

Updated Report: April 24, 2008 A-2
quantified on an as needed basis. The most common method of increasing certainty during assessment is submission of additional information and/or test data by notifiers. The following steps are needed to perform an adequate environmental risk assessment for a new chemical under TSCA Sec. 5 unless noted. I. Clear determination of chemical identity. The chemical identity is the foundation of each assessment. If the identity changes, then the assessment has to be started over to determine if the change in structure will significantly change the assessment. Some changes require complete revisions while minor changes require no revisions. A. Discrete monomers. Chemical structure is generally given in the PMN. A Chemical
Abstracts Service (CAS) chemical name is required. CAS name and structure are always compared.
B. Reaction products.
1. Representative structure is needed. If a representative structure is not given, then a representative structure is determined for the assessment.
2. If several representative structures are determined for a reaction product, then it
must be decided if a risk assessment will be done for every structure or a selected set of chemicals.
C. Polymers. The chemical structure of polymers can be highly uncertain because CAS
gives one chemical name for all ratios of monomers, all molecular weights (MW), and random and blocked reactions of monomers. In practice, the polymer which is assessed by the Agency is the polymer to be used in the intended commercial product. It is important that the reaction sequence of monomers be known and that the molecular weight distribution be determined.
D. Dyes. Dyes are reaction products that are manufactured for their color and not their
chemical structure. Chemical structures are determined after the dye has been made. In practice, the representative structure is assessed.
E. Natural products including distillation fractions of natural products. The chemical
structure of natural products, such as, petroleum products and natural oils is rarely determined by the chemical industry for new chemicals and uncertainty about the chemical structures in the product can be high. Ideally, each chemical in the product is identified and its weight percent measured. The chemicals with the highest weight percent are assessed. If the chemicals all belong to the same chemical class then one assessment can be done on the weighted-average chemical structure. If chemicals in the product belong to various chemical classes, then a separate assessment can be done on each chemical.
F. Ion pairs. Predicting the strength of ion pairs can be difficult. For weak ion pairs, a
risk assessment is done on each of the chemicals making up the pair assuming that they will separate in the environment. For strong ion pairs, an assessment is done on the ion pair. For ion pairs of moderate strength, a conservative approach should

Updated Report: April 24, 2008 A-3
be taken. Each chemical making up the pair should be assessed separately until additional information can be obtained.
G. Additional guidance with regard to some aspects of chemical identity for new
chemicals can be found at:
• http://www.epa.gov/oppt/newchems/ II. Physical/chemical properties. The physical/chemical properties of the chemical to be assessed need to be measured or predicted. Predicted values should always be compared to measured values. If predicted and measured values are in agreement, then this should increase the confidence of the assessment. If predicted and measured values are in significant disagreement, then the assessor should determine what is causing the difference. If a structure activity relationship (SAR) is determined to have poor predictive power for the chemical, then the measured value can be used to increase the predictive power of the SAR. However, it may be determined that the measured value is invalid and, thus, should not be used in the assessment. Once the physical/chemical-properties profile for a chemical is complete, all of the properties should be compared for internal consistency. For example, if the logarithm of the octanol/water partition coefficient (Kow) of a neutral organic chemical is predicted to be 6.0, the water solubility is measured to be 1.0 gram per liter but predicted to be 0.100 mg/L, and the chemical is not a surfactant, which would be expected to be dispersible in water, then these two values are inconsistent with one another. The assessor needs to validate the water solubility test data and determine why the measured water solubility is so much higher than predicted. During assessments of new chemicals each of the following physical/chemical properties can be predicted: A. Molecular weight (MW) distribution. The average-number molecular weight (MWn),
percent <1000, and percent <500 need to be measured. However, for some chemical classes MW distribution cannot be measured, such as, sulfur dyes.
B. Physical state: gas, liquid, or solid needs to be known.
1. Melting point (C). Melting points are necessary for many assessments. If the melting point has not been measured for a solid at room temperature, then melting point can be predicted by SAR. However, if the predicted melting point appears too high, then a lower melting point should be used as a conservative approach.
C. Boiling point (C). D. Vapor pressure (mm Hg or torr at 25 C). E. Water solubility (mg/L at 25 C and pH 7). Water solubility can determine the
maximum amount of chemical that can be in the aquatic environment in a dissolved state.

Updated Report: April 24, 2008 A-4
1. Liquids. The water solubility of liquids at room temperature can generally be
accurately predicted with SARs based on Kow.
2. Solids at room temperature. As melting point increases water solubility decreases and the presence of suspended particles/crystals increases. The water solubility of high melting solids and disperse dyes are over-estimated if suspended solids/crystals are not removed from the water phase prior to analytical determinations. Suspended solids/crystals should be removed by centrifugation and samples should not be filtered.
3. Dispersibility in water, such as, surfactants and detergents, is an important
attribute to determine in addition to water solubility.
a. Distinguish between micelle formation, micro-dispersions, and macro-dispersions if possible. In practice, important information can be determined from how the chemical will be used. For example, if the chemical is to be used in paper making, then the chemical has to be soluble or dispersible in water for it to work properly.
b. Distinguish between self-dispersion by a chemical and man-made emulsions.
Self-dispersing chemicals will self-disperse in the aquatic environment, but man-made emulsions will be destroyed by sewage treatment.
4. Predicting the water solubility and/or dispersibility of moderate to strong ion pairs
is difficult. If the solubility/dispersibility of strong ion pairs has not been measured, then the final use of the ion pair may help in determining if an ion pair will be soluble, dispersible, or insoluble and not dispersible in water.
5. The effect of water hardness and salinity on water solubility or dispersibility may
be difficult to predict, but in general, as hardness and salinity increases water solubility decreases.
F. Henry's law constant is important for predicting the potential of a chemical to partition
from water to the atmosphere. G. Global warming potential.
1. Infrared absorption spectrum. OPPT generally relies on nearest analog analysis. Predictions of infrared absorption and global warming potential are done in the Office of Air and Radiation (OAR).
H. Molecular cross-sectional diameters are estimated on a case-by-case basis when it
is believed that the chemical is too large to pass thru biological membranes. Diameters that are estimated are minimum diameter, maximum diameter, and effective diameter. Diameters are estimated for the chemical at its lowest energy state. When the effective cross-sectional diameter is greater than 20 angstroms, the Agency assumes that the chemical is too large to pass thru biological membranes and, thus, the chemical's potential to cause systemic toxicity and bioconcentrate is nil.

Updated Report: April 24, 2008 A-5
I. OPPT structure activity relationships (SAR) for physical/chemical properties used for new chemical assessments can be found at:
• http://www.epa.gov/oppt/exposure/docs/episuitedl.htm
J. OPPTS test guidelines for physical/chemical properties used for new chemical
assessments can be found at:
• http://www.epa.gov/opptsfrs/OPPTS_Harmonized/ III. Transport/partitioning. Transport/partitioning in the environment needs to be determined for every new chemical. A. Octanol/water partition coefficient (Kow) predicts the potential of a chemical to
partition from water to fat. Kow is used in many SARs for predicting aquatic toxicity. B. Fish bioconcentration factor (BCF) indicates a chemical's potential to partition from
water to fish. Fish BCF is not used in environmental risk assessment of new chemicals, but is routinely used in the human health risk assessment. Fish BCF is used to determine a new chemical's PBT score. A PBT score indicates a chemical's potential to persist in the environment, to bioconcentrate in aquatic organisms, and to cause chronic systemic toxicity.
1. Bioconcentration is partitioning of a chemical from water to aquatic organisms.
Bioconcentration is accomplished by two broad mechanisms:
a. Partitioning from water to aquatic organism by a water-to-lipid mechanism, such as, exhibited by neutral organic chemicals or solvents; and
b. Partitioning from water to aquatic organisms by a non-lipid mechanism, such
as, calcium and other metals to bone, and perfluoroalkyl anionic surfactants to the fatty cycle in mammals: water to a blood-liver-bile-GI tract-blood mechanism.
C. Fish bioaccumulation factor (BAF) indicates partitioning of a chemical from water, from food, and/or from ingested sediment to fish. BAFs are either measured or predicted by nearest analog analysis. The best SARs for these endpoints in our view is in the EPIWIN suite of SARs prepared by SRC at: http://www.epa.gov/oppt/exposure/docs/episuitedl.htm The published paper supporting the SAR for fish bioconcentration is: Meylan WM, Howard PH, Boethling RS, Aronson D, Printup H, and Gouchie S. 1999. Improved method for estimating bioconcentration/bioaccumulation factor from octanol/water partition coefficient. Environmental Toxicology and Chemistry vol. 18, no 4, pp 664-672. The latest publications are:

Updated Report: April 24, 2008 A-6
Persistent, Bioaccumulative, and Toxic Chemicals I (Fate and Exposure) and II (Assessment and New Chemicals), two volumes, ACS Symposium Series 772 and 773, respectively. American Chemical Society, Washington, DC. Both edited by Lipnick RL in 2001.
D. Adsorption to soils and sediments or water/organic matter partition coefficient [Koc]. E. Volatilization from water (fugacity, Henry's law constant). Predictions in terms of
half-lives from a standard river and a standard lake are made using SARs. However, as the volume of the river or lake increases the time required to transport a constant amount of chemical from the water to the atmosphere increases.
F. Removal of a chemical by waste water treatment is predicted via percent removal.
Removal percentages can range from 0 to 99 percent. In practice, removal of new chemicals by sewage treatment generally range from 0 to 90 percent during assessment when the predictions are only based on SAR/model predictions and professional judgment. Removal percentages from 91 to 99 percent are used when supported by test data from the submitter, however, there are exceptions. For example, removal percentages from 91 to 99 percent can be given for (a) high-MW polycationic polymers which are used as flocculants, (b) volatile chemicals, such as, HFCs and low MW perfluorinated hydrocarbons, with low water solubility, (c) some gases, and (d) chemicals which hydrolyze rapidly. Each removal mechanism is assessed separately and added. Biodegradation is the generally the most difficult mechanism to predict and the mechanism most dependent on professional judgment.
1. Sludge. Removal of chemical by adsorption to sludge is predicted using SARs
based on the chemical's Koc.
2. Biodegradation of a chemical via waste water treatment is predicted by nearest analog analysis and professional judgment. Average residence time in US sewage treatment plants is about 7 hours.
3. Air (stripping). SARs for fugacity are used to predict the percent of chemical
removed by stripping.
4. Total percent removal by waste water treatment. G. Level III fugacity model transports a chemicals to various environmental
compartments:
1. Air.
2. Water.
3. Soil.
4. Sediment.
5. Persistence time.
Updated Report: April 24, 2008 A-7
H. Transport from sediments to water column. Predictions are not done due to high uncertainty.
I. Transport to upper atmosphere, such as, the ozone layer. OPPT predictions are
based on nearest analog analysis. Predictions for regulatory purposes are done by the EPA's Office of Air and Radiation (OAR).
1. Ozone depletion potential. OPPT predictions are based on nearest analog
analysis. Predictions for regulatory purposes are done by OAR. J. Migration to ground water. Predictions are initially qualitative, such as, negligible,
slow, moderate, and rapid. Quantitative predictions are made on an as needed basis.
K. OPPT structure activity relationships (SAR) for environmental transport and
partitioning used for new chemical assessments can be found at:
• http://www.epa.gov/oppt/exposure/docs/episuitedl.htm L. OPPTS test guidelines for transport/partitioning used for new chemical assessments
can be found at:
• http://www.epa.gov/opptsfrs/OPPTS_Harmonized/ IV. Fate in the environment. A chemical's half-life in the environment can determine the type of risk assessment done. If the half-life is less than one hour, then only the degradation products are assessed. If the half-life is greater than an hour but less than 14 days, then the intact chemical and products are assessed. And if the half-life is greater than 14 days, then only the parent chemical is assessed. A. Pyrolysis or rapid oxidation (half-life). If a chemical is pyrophoric and burns prior to
release to the environment, then the oxidation products are assessed. Caution should be used when assessing chemicals which are pyrophoric in the atmosphere because they may be stable in water.
B. Oxidation or slow oxidation in water or air (half-life). C. Hydrolysis (half-life). Hydrolysis half-lives at pH 7 and 20 C are used for most
environmental assessments. Hydrolysis half-lives at other pH values are determined by any site-specific factors related to the exposure.
D. Aerobic biodegradation (half-life).
1. Primary biodegradation (half-life) is very important but very difficult to predict. No SARs used; professional judgment is used based on nearest analog analysis. No half-life is used in assessments unless measured.
a. Degradation products from primary biodegradation. Generally not predicted
due to high uncertainty. Laboratory studies to identify products and rates for

Updated Report: April 24, 2008 A-8
formation can be very expensive and are not done routinely. Such studies are considered research projects. When degradation products are predicted, predictions are based on nearest analog analysis.
2. Ultimate biodegradation or complete mineralization to carbon dioxide and water.
a. Sewage treatment plants (percent removal). Predictions are made by
nearest analog analysis and professional judgment.
b. Natural water (half-life). Predictions are more uncertain than for sewage treatment.
E. Anaerobic biodegradation (half-life).
1. Azo reduction (half-life). Predictions are made by nearest analog analysis.
2. Other reactions, such as, dehalogenation of aromatics in natural sediment. Predictions are highly uncertain and predictions of rates and products are not generally made. For example, while debromination of a highly brominated aromatic to a lower brominated aromatic which may be highly toxic to aquatic organisms is of great concern, it is very difficult to predict.
F. Atmospheric oxidation (half-life).
1. OH radical (half-life).
2. Ozone (half-life).
a. Products from atmospheric oxidation. Predictions are not generally made due to high uncertainty.
G. Photolysis (half-life). Predictions of half-lives are made by nearest analog analysis.
1. Visible spectrum.
2. UV spectrum.
a. Products from photolysis. Predictions are not generally made due to high uncertainty.
H. OPPT structure activity relationships (SAR) for environmental fate used for new
chemical assessments can be found at:
• http://www.epa.gov/oppt/exposure/docs/episuitedl.htm I. OPPTS test guidelines for fate used for new chemical assessments can be found at:
• http://www.epa.gov/opptsfrs/OPPTS_Harmonized/ V. Health toxicity profile/assessment.

Updated Report: April 24, 2008 A-9
A. Absorption. Predictions are made for:
1. Skin.
2. Lungs.
3. GI tract.
4. Basis of predictions in order of highest to lowest priority are:
a. Test data. b. Analog test data. c. Kow and water solubility. d. MWn, percent less than 1000 and percent less than 500. e. Physical state.
B. Metabolism.
1. Products of metabolism are generally predicted on an as needed basis. C. Toxicity.
1. Predictions of toxicity are initially qualitative and all toxic effects are included. Quantitative predictions of potency are made on an as needed basis. Uncertainty depends on chemical class. Basis of predictions in order of highest to lowest priority are:
a. Test data on the chemical.
b. Nearest analog analysis using:
(1) TSCA Sec. 5. (2) TSCA Sec. 8 and 4. (3) Public databases.
c. Chemical class toxicity.
d. Mechanism of toxicity.
e. Professional judgment.
f. Weight of the evidence.
2. Toxic effects predicted:
a. Acute toxicity.
(1) Oral. (2) Ocular. (3) Inhalation. (4) Dermal.
b. Irritation and corrosion.

Updated Report: April 24, 2008 A-10
(1) Skin. (2) Eyes.
i. Corneal opacity. ii. Vascularization or cornea. iii. Dying of eyes.
(3) Mucous membranes. (4) GI tract.
c. Systemic effects.
(1) Liver. (2) Kidneys. (3) Heart. (4) Blood. (5) Spleen.
i. Subchronic toxicity: (a) Rat 28-d. (b) Rat 90-d.
ii. Chronic toxicity: life cycle(s).
d. Sensitization. (1) Dermal. (2) Pulmonary.
e. Immunotoxicity.
f. Developmental toxicity.
g. Reproductive toxicity.
(1) Males. (2) Females.
h. Neurotoxicity.
(1) Central nervous system (CNS). (2) Sympathetic NS. (3) Retinopathy.
i. Genotoxicity.
(1) In vitro. (2) In vivo.
j. Oncogenicity.
k. Lung toxicity via chronic inhalation of large molecular weight chemicals, such
as, polymers. (1) Soluble chemicals. (2) Insoluble chemicals. (3) Swellable chemicals, such as, cross-linked polyacrylamide polymers.
OPPTS test guidelines for health toxicity used for new chemical assessments can be found at:

Updated Report: April 24, 2008 A-11
• http://www.epa.gov/opptsfrs/OPPTS_Harmonized/ VI. Environmental toxicity profile and assessment. Predictions of toxicity are all quantitative, are in terms of effective concentrations (EC) in mg/L (ppm), and are based on 100 percent active ingredients. Effective concentrations are expressed in terms of mean measured concentrations or nominal concentrations of parent material depending on chemical class. Predictions for freshwater aquatic organisms are done for every chemical. Predictions for saltwater aquatic organisms, benthic or sediment organisms, and terrestrial organisms are done for those chemicals being released to those environments. In the US more than 99 percent of the assessments done are for the aquatic environment and less than 1 percent are done for the terrestrial environment. Predictions are made using chemical structure, SARs, and nearest analog analysis. Measured toxicity test data, when available, are integrated into the toxicity profile if these data are determined to be valid. Measured toxicity data are validated by (1) confirming the chemical identity of the test material; (2) determining the composition and purity of the test material; (3) investigating the test methods, such as, size and age of test organisms, loading, experimental design, preparation of stock solutions, analytical methodology, characterization of dilution water; (4) identifying any test characteristic which could have influenced the intrinsic toxicity of the test substance; (5) quantification of the complete concentration-response curve; (6) and adjusting all effective concentrations for (a) 100 percent active ingredient of PMN chemical and (b) any losses during the exposure period. If the test data are determined not to be valid and/or adequate for risk assessment, then the data are not used in the risk assessment. Valid toxicity data are always compared to predicted toxicity data. When the data are in agreement, the measured toxicity data are used for risk assessment. When the measured and predicted toxicity value(s) are in disagreement, the assessor must determine why the value(s) are different before proceeding. If the assessor determines that the measured are adequate for risk assessment, then the risk assessment proceeds using the measured toxicity data. Likewise, if the assessor determines that the measured data are inadequate for risk assessment, then the risk assessment proceeds using the predicted toxicity data. Species Sensitivity Distributions. USEPA OPPT's experience with species sensitivity distributions (SSD). Staff compiled SSDs for industrial chemicals and some pesticides in the 1980s. Very few industrial chemicals and several pesticides had enough test data to indicate the shape of the distribution. When enough data were available, no one species seemed to predominate as the most sensitive species and the range of the distribution seem to be about 10 times. When the variation within and between testing laboratories were evaluated, the average within-laboratory variation was about 2 times and the average between-laboratory variation was about 10 times. The staff came to the conclusion that most of the variation observed between species was probably a function of inter-laboratory variation. When significant species differences were observed between species, i.e., differences much larger than 10 times, it was only for pesticides and metals with a specific mode-of-toxic action. An environmental toxicity profile may consist of the following effects:

Updated Report: April 24, 2008 A-12
A. Freshwater organisms (SARs and analogs).
1. Fish acute toxicity. 2. Daphnid acute toxicity. 3. Green algal toxicity. 4. Fish Chronic Value (ChV). 5. Daphnid ChV. 6. Green algal ChV.
B. Saltwater organisms (SARs and analogs).
1. Fish acute toxicity. 2. Mysid shrimp acute toxicity. 3. Green algal toxicity. 4. Fish ChV. 5. Mysid ChV. 6. Green algal ChV.
C. Benthic or sediment-dwelling organisms (analogs). D. Terrestrial plants (analogs). E. Terrestrial soil.
1. Earthworms (SARs and analogs). 2. Insects (analogs).
F. Birds (analogs).
1. Mallards. 2. Quail. 3. Raptors.
G. Wild mammals (human health effects profile and analogs).
1. Marine. 2. Terrestrial.
H. Terrestrial insects (analogs). I. OPPT structure activity relationships (SAR) for aquatic toxicity which are used for
new chemical assessments can be found at:
• http://www.epa.gov/oppt/exposure/docs/episuitedl.htm • http://www.epa.gov/oppt/newchems/
J. OPPTS test guidelines for environmental toxicity used for new chemical
assessments can be found at:

Updated Report: April 24, 2008 A-13
• http://www.epa.gov/opptsfrs/OPPTS_Harmonized/ VII. Persistence, Bioaccumulation, Toxicity (PBT) Potential. Each new chemical is scored for potential persistence in the environment, bioaccumulation in aquatic organisms, and chronic toxicity in mammals and birds. A. P1, P2, or P3. Chemicals whose half-life in the aquatic environment is less than 60
days are scored P1, chemicals with half-lives of 60 days or greater to 6 months are scored P2, and chemicals with half-lives of greater than 6 months are scored P3.
B. B1, B2, or B3. Chemicals whose bioconcentration or bioaccumulation factor (BCF or
BAF) is less than 1000 for all aquatic species is given a B1 score. In addition, chemicals with a MW greater than 1000 or with an effective-cross-sectional diameter of greater than 20 angstroms are given a B1 score. BCF or BAF values of equal to 1000 or greater and less than 5000 in any aquatic species are scored B2, and values of 5000 or greater are scored B3. PBT concern for bioconcentration is for persistent chemicals which are transported up aquatic food chains. You do not have to demonstrate biomagnification; food chain transport is all that is necessary. In fact, bioconcentration in any aquatic species can trigger concern for bioconcentration and contamination of aquatic food sources.
C. T1, T2, or T3. The PBT Policy does not have specific criteria values for toxicity,
rather we review toxicity on a case specific basis. The following thresholds can be used for categorizing new chemicals as T1, T2, or T3 based on ecotoxicity testing of mammals and birds; we don't have specific values we apply for chronic aquatic toxicity, however, as described below, we can illustrate our approach using one of our assessment tools. Chemicals with low concern for systemic toxicity in mammals (including humans) and birds are scored T1, moderate concern receives a T2, and high concern receives a T3. PBT toxicity is limited to chemicals which exhibit or are expected to exhibit chronic toxicity to humans, birds, or wild mammals via the oral (or dietary) route generally via food, for example, fish eaters. The following thresholds can be used for categorizing new chemicals as T1, T2, or T3 based on ecotoxicity testing of mammals and birds. New chemicals are not categorized based on aquatic toxicity testing. 1. Chronic toxicity hazard concern levels for terrestrial wildlife species (mammals
and birds) via diet or food are:
a. High concern (T3): chronic value (ChV) less than or equal to 50.0 mg/kg dry weight food;
b. Moderate concern (T2): ChV greater than 50.0 mg/kg and less than or equal
to 100.0 mg/kg; and
c. Low concern (T1): ChV greater than 100.0 mg/kg dry weight food.

Updated Report: April 24, 2008 A-14
2. Although the OPPT New Chemical Program does not categorize new chemicals based on chronic aquatic toxicity testing, OPPT has developed a computer model, the PBT Profiler, which uses chronic toxicity towards fish to categorize the toxicity of PBT chemicals because this is the only SAR for chronic toxicity of vertebrates that has been computer programmed and is free. Chronic toxicity hazard concern levels for fish exposed to a chemical in water are:
a. High concern (T3): chronic value (ChV) less than or equal to 0.100 mg/L
based on 100 percent active ingredients and mean measured concentrations;
b. Moderate concern (T2): ChV greater than 0.100 mg/L and less than or equal to 10.0 mg/L; and
c. Low concern (T1): ChV greater than 10.0 mg/L.
D. PBT chemicals have to receive a score of 2 or greater for persistence,
bioconcentration, and toxicity, such as, P2 or 3, B2 or 3, and T2 or 3. E. Uncertainties in PBT scoring include volatile chemicals which are persistent in water
and the atmosphere, have a potential to bioconcentration and are expected to be chronically toxic via the oral route, but are transported rapidly from the aquatic environment to the atmosphere where they are expected to remain, that is, they are not expected to be returned to the aquatic environment via rain. At the present time, the Agency is not giving these type of chemicals any special consideration in the New Chemical Program.
F. The OPPT Category for Persistent, Bioaccumulative, and Toxic New Chemical
Substances was published in the Federal Register, Vol. 64, No. 213, Thursday, November 4, 1999, pages 60194 to 60204.
G. Models for assisting in profiling chemicals for PBT:
• http://www.epa.gov/pbt/toolbox.htm • http://esc.syrres.com • http://www.epa.gov/oppt/exposure/docs/episuitedl.htm
H. OPPTS test guidelines for assisting in profiling chemicals for PBT for new chemical
assessments can be found at:
• http://www.epa.gov/opptsfrs/OPPTS_Harmonized/ I. Rationale for MW cut-off of 1000 and CXD of 20 A.
The MW and cross-sectional diameter (CXD) are not taken from one paper but several papers in the open literature, test data on new chemicals received under TSCA Sec 5, and experience.
Literature:

Updated Report: April 24, 2008 A-15
Zitko V. 1981. Uptake and excretion of chemicals by aquatic fauna. pages 67 to 78 in Stokes PM (ed) Ecotoxicology and the Aquatic Environment. Pergamon Press. Opperhulzen A, Velde E, Gobas F, Llem D, Steen J, Hutzinger O. 1985. Relationship between bioconcentration in fish and steric factors of hydrophobic chemicals. Chemosphere 14 (11/12): 1871-1896. Niimi AJ and Oliver BG. 1988. Influence of molecular weight and molecular volume on dietary absorption efficiency of chemicals by fishes. Canadian Journal of Fisheries and Aquatic Sciences 45 (2): 222-227. Sijm D, Schuurmann G, Vries P, Opperhuizen A. 1999. Aqueous solubility, octanol solubility, and octanol/water partition coefficient of nine hydrophobic dyes. Environmental Toxicology and Chemistry 18(6): 1109-1117. Cash GG and Nabholz JV. 2002. Minimum cross-sectional diameter: calculating when molecules may not fit through a biological membrane. Environmental Toxicology and Chemistry 21(10):2095-2098. MW<1000. Uptake/absorption rate or passive diffusion of neutral chemicals thru gills of aquatic organisms begins to decrease at about MW600. The rate decreases exponentially with MW. The rate of absorption is low but still measurable at MW900, especially thru the GI tract. Thus, we set our cutoff for absorption thru gill and GI tract membranes at 1000. Lung membranes can absorb chemicals with MWs up to 10 000 if inhaled to the deep lung but this is not a significant route of uptake for environmental organisms, bioconcentration in the environment, and food chain transport. This route of exposure is generally assessed for workers and the general population. We suspected that absorption of soluble chemicals with MWs 10 000 to 13 000 is possible thru lung membranes based on analogs. But absorption of insoluble chemicals thru lung membranes at MWs equal to and greater than 10 000 is nil. Gill Veith at the EPA laboratory in Duluth MN has found and published that the uptake rate of neutral chemicals thru fish gills starts to decrease at about MW600 in his research about fish bioconcentration. CXD: Research has shown that passive diffusion thru gill membranes occurs when the effective CXD of chemicals is equal to or less than 9.5 angstroms (A). Research has also shown that the GI tract will absorb chemicals with CXDs of greater than 9.5 A. We have test data which demonstrated fish bioconcentration of 1,2,5,6,9,10-hexabromo-cyclododecane [3194-55-6]: MW642, log Kow = 7.8 (P), CXDeff=10.8 A, fish BCF = 6200 (P), log fish BCF = 3.8 (P), BCF fish = rainbow trout, greater than 107 d old, FWT = 3.46 g, MLen = 72 mm, 5.5% lipid whole fish, 3.0% lipid edible portion, exposure = 0.001 800 mg/L measured and 0.003 400 mg/L nominal, measured fish BCF for 35-d whole fish = 8974 = log fish BCF = 4.0 (M), time to steady state in whole fish = 21 d (M), depuration half-life for whole fish = 19.0 d (M), fish BCF for edible portion = 4650 over 35-d = log fish BCF edible = 3.7 (M), fish (RT) BCF for whole fish = 13085 for 35-d at exposure = 0.000 180 mg/L (M), 0.000 340 mg/L (nominal), but BCF not at steady state at 35 d, time to 90% steady state for whole fish predicted to be 101 d by BIOFAC, fish 35-d BCF for edible = 6531.0 (M) but not yet at steady state, log fish BCF for edible = 3.8 (M). More details are available upon request.

Updated Report: April 24, 2008 A-16
We have data via the New Chemical Program that Cu-phthalocyanine is not absorbed thru the rat GI tract and the CXDeff is about 20 A, thus the cutoff of PBT was set at less than or equal to 20 A. The 20 A cutoff may be lowered when new data come in about uptake of compounds with CXDeff of between 11 and 20 A.. VIII. Engineering releases and/or exposures to the environment. A. Releases are predicted for a chemical over its entire chemical life cycle. Every
release is assessed separately. Every site is assessed separately if known. If a release occurs at an unknown site, then a generic release assessment is done for all potential sites where the release could occur using standard industrial classification (SIC) codes.
1. Manufacturing. Imported chemicals have no manufacturing releases.
2. Processing.
3. Use.
4. Disposal.
5. OPPT maintains release information via industry type and type of activity. These
data come from survey data and past PMNs.
6. Releases from sludge applied to land are not estimated by OPPT because this activity is regulated by another EPA Office.
7. Losses from leaking underground storage tanks are not assessed under TSCA
because underground storage tanks are not supposed to leak.
8. Losses to the atmosphere resulting in global warming, smog production, and ozone depletion are not assessed by OPPT. These losses are regulated by the Office of Air and Radiation.
9. Transportation spills are regulated by the US Department of Transportation
(DOT). B. Types of releases and/or exposures. For each release low flow and mean flow
estimates are made for:
1. Workers. 2. General population. 3. Natural surface water.
a. Direct releases of industrial chemicals to the environment are rare in the US.
Most releases to the environment occur via sewer to the aquatic environment.
b. Indirect releases are releases which occur after sewage treatment. Sewage treatment may occur either on-site or off-site at a publicly-owned treatment works (POTW). Treatment only off-site by a POTW is most common but on-site treatment followed by treatment by a POTW is not uncommon. On-site

Updated Report: April 24, 2008 A-17
treatment only followed by direct release is not common for new chemicals. On-site treatment efficiency (percent chemical removed) is not predicted by OPPT; only removal by a POTW. Companies practicing on-site treatment must submit sufficient documentation to quantify the percent removal of a chemical before they will get credit for the on-site treatment during an OPPT assessment.
4. Landfills. Releases from landfills to ground water are predicted and used only for
human health risk assessment. Releases from landfills to surface water are not predicted due to uncertainty.
5. Incineration releases the environment are predicted but are generally negligible.
More important are releases of incomplete incineration products to the environment. For example, release of perfluorinated alkyl sulfonic acids or perfluorinated alkyl carboxylic acids via incomplete incineration of larger molecules, such as, polymers containing a perfluorinated alkyl moiety, are of high concern for environmental contamination and injury. Municipal incinerators are not hot enough to reduce a perfluorinated alkyl to hydrofluoric acid. In fact, only 20 chemical incinerators in the US have been identified as being capable of destroying perfluorinated alkyl moieties.
6. Consumer exposures.
C. Container Residues. Releases from shipping containers are generally assumed to
be released to the sewer if not specified in the PMN.
1. Sewer. Releases are assumed to go to a POTW and surface water.
2. Landfills.
a. Chemical landfill. No releases are expected.
b. Municipal landfills.
(1) Unlined landfills. Releases are assumed to go to ground water which is assumed to be a source of drinking water.
(2) Lined landfills. No releases are expected.
3. Incineration.
a. General population exposures are predicted.
4. Dedicated containers. Dedicated containers or totes allow a manufacturer and/or importer to maintain control of residues and prevent releases to the environment.
D. Worker exposure. Typical and worst case exposures are predicted.
1. Dermal. Generally exposure by both hands. 2. Inhalation. Vapor, aerosol, dust. 3. Splashes to eyes are difficult to predict and highly uncertain. Only qualitative
predictions are made.

Updated Report: April 24, 2008 A-18
E. General population exposure. 1. Dust. 2. Vapor. 3. Aerosol. 4. Drinking water. Drinking water comes from either ground water and/or
freshwater surface water. Saltwater is not considered a source of drinking water for humans.
5. Fish ingestion. Average fish ingestion for a human population is estimated using equations from the Office of Water.
6. Ingestion of invertebrates, such as, shrimp and shellfish, and aquatic plants are a special case assessment.
F. Releases to surface water after sewage treatment can occur to rivers and streams,
lakes and reservoirs, near-shore marine environments, and off-shore marine environments.
1. Surface water concentrations and sediment concentrations in rivers and streams
can be predicted using several different models which vary considerably in complexity.
a. Simple dilution model or probability dilution model (PDM). This is one of the
simplest models. One day's release is mixed with one day's flow assuming no losses after release. This is the worst case model and is done for all new chemicals with releases to freshwater surface water. Model predictions can either be site-specific or generic. The United States Geological Service (USGS) stream reach data base is overlain with locations of industrial chemical activity using SIC codes, and locations of POTWs. This model is a part of E-FAST which can be found at:
• http://www.epa.gov/oppt/exposure/docs/
b. REACHSCAN. This is a more complex model which predicts losses after
release to transport, partitioning, and fate. This model needs site-specific information about a chemical's release and predictions about a chemical's transport and fate in surface water. This model is used on an as needed basis.
c. Exposure analysis modeling system (EXAMS) II. This is the most complex
model used for the assessment of new chemicals. This model has the greatest amount of input variables and is used less than once per year by OPPT. This model was developed by the US EPA research laboratory in Athens, GA.
2. Lakes and reservoirs.
a. Dilution factors are used. These dilution factors are site-specific and set by
the EPA regional offices. There are two types:
(1) Acute dilution factors are used to assess chemical exposures of short duration.

Updated Report: April 24, 2008 A-19
(2) Chronic dilution factors are used to assess chemical exposures of long duration.
b. No dilution factor available. If releases occur at a site for which no dilution
factor has been specified, then the effluent concentration is used during the assessment.
c. Protected environments. Risk assessment for environments which are being
actively protected to preserve their ecological diversity and/or function or to assist in their recovery from past chemical contamination can be done without dilution factors. Effluent concentrations are used during the assessment or chemical releases are banned. The degree of protection will determine the method. For example, the Great Lakes are protected and effluent concentrations are used for non-PBT chemicals. Releases of new chemicals which are characterized as being a PBT chemical are banned from the Great Lakes and all rivers and streams draining into the Great Lakes.
3. Saltwater-near shore releases, such as, estuaries and bays.
a. Dilution factors are used. These dilution factors are site-specific and set by
the EPA regional offices. There are two types:
(1) Acute dilution factors are used to assess chemical exposures of short duration.
(2) Chronic dilution factors are used to assess chemical exposures of long
duration.
b. No dilution factor available. If releases occur at a site for which no dilution factor has been specified, then the effluent concentration is used during the assessment.
c. Protected environments. Risk assessment for environments which are being
actively protected to preserve their ecological diversity and/or function or to assist in their recovery from past chemical contamination can be done without dilution factors. Effluent concentrations are used during the assessment or chemical releases are banned. The degree of protection will determine the method.
4. Saltwater-off shore releases. Large dilution factors are assumed to exist for all
off-shore releases and water concentrations are generally expected to be less than one microgram per liter or one part-per-billion (ppb). OPPT's policy is to prevent the release of new chemicals characterized as PBT chemicals even to the oceans.
5. Sediment concentrations can be predicted using REACHSCAN and EXAMS II.
The sediment concentration is predicted for a stream reach after one year's release. Sediment concentrations based on multi-year releases are considered too uncertain for risk assessment. Concentrations are given in terms of mg/kg dry weight sediment.

Updated Report: April 24, 2008 A-20
IX. Risk assessment for humans. A risk assessment is done for all humans organisms exposed to a chemical. Acute and chronic risks are assessed. A. Human workers. Reference doses for humans (RfDs or RfCs), chronic no-observed-
effect-levels (NOEL), and cancer q1* values are compared to exposures. The goal of risk assessment is to keep human exposures at or below RfDs or RfCs. If a RfD or RfC is not available then a margin-of-exposure (MOE) is calculated for the exposure and a chronic NOEL. The goal here is a minimum MOE of 100. For cancer, the goal is a probability of less than one incidence in 1.0 million.
B. General human population toxicity. Same as for human workers.
1. Risk from bad taste to drinking water and/or fish flesh by a chemical is not assessed under TSCA.
C. Risk Assessment for Human Health. In this section, toxicity (dose-response)
information, if available, for a particular health effect will be mathematically integrated with exposure to assess risk. If dose-response information is not available, risk cannot be quantified. Depending on the strength of the data on hand, the likelihood that a specific effect will occur can be expressed in qualitative terms.
1. Human Health Noncancer Risk. For noncancer effects, dose-response
information for a particular effect typically is given in the form of a NOAEL (no observed adverse-effect level) or a LOAEL (lowest observed adverse-effect level). These doses should be identified by the health toxicity assessment and they will typically be for an analogue of the PMN substance. Sometimes you will have this information on the PMN substance itself, but this is more the exception than the rule. When there is a large gap between the NOAEL and the LOAEL, for example, if the NOAEL is 20 mg/kg/day and the LOAEL is 200 mg/kg/day, and incidence data are available, it is preferable to use the benchmark dose. This is the statistically predicted dose that will produce a 5% response rate in the test animals. It is to be used instead of the NOAEL. However, most of the time you will be dealing with NOAELs and LOAELs.
For noncancer effects with NOAEL, LOAEL, or benchmark values available, risk is expressed in terms of a MOE, or margin of exposure. The meaning of this term becomes more apparent when you realize that the NOAEL or LOAEL level for a particular effect is divided by the respective exposure levels. First, you must make sure that the units of the NOAEL or LOAEL level are the same as the exposure level. Most NOAELs or LOAELs are expressed as milligrams per kilogram (mg/kg). For inhalation exposures, they may also be expressed as milligrams per cubic meter (mg/m3). Formulas for converting doses or exposure levels from one set of units to another for various species may be needed. The occupational human exposure levels are provided in the Engineering Report and are given in units of milligrams per day for a number of days per year. Typically, exposures are provided for the inhalation and dermal routes of exposure. For example, an inhalation exposure is expected to be 150 mg/day and a dermal exposure is expected to be 3,800 mg/day for 250 days/yr. The average male body weight is 70 kg. This gives an inhalation exposure level of 2.1 mg/kg/day and a dermal exposure level of 54.0 mg/kg/day. However,

Updated Report: April 24, 2008 A-21
these levels are exposure levels and not absorbed doses. To obtain absorbed doses, consult the human health toxicity assessment. For example, say inhalation absorption is expected to be 100% and dermal absorption is expected to be 5%. This gives absorbed doses of 2.1 mg/kg/day by the inhalation route and 2.7 mg/kg/day by the dermal route. There may also be exposure to the general population through (1) drinking water contaminated as a result of leaching of the PMN substance to ground or surface water and entering drinking water supplies, (2) consuming contaminated fish, (3) inhaling contaminated air through incineration processes or through airborne releases. These exposure levels, in mg/kg/day, are provided in the Exposure Report; proceed as above for occupational exposure to obtain absorbed doses. Now to calculate the MOEs. For example, you have a NOAEL of 50 mg/kg/day for developmental toxicity and an inhalation absorbed dose of 0.4 mg/kg/day; dividing the former by the latter gives a MOE of 125. The higher the NOAEL/LOAEL value and the lower the exposure value, the higher the MOE and, thus, the lower the risk. For a NOAEL, an acceptable MOE is >= 100; for a LOAEL, the acceptable MOE is >= 1,000. You may also have an RfD (reference dose, for oral or dermal data) or an RfC (reference concentration, for inhalation data) level for a particular analogue if one is available from IRIS (Integrated Risk Information System). Exposure levels less than or equal to the RfD or RfC are considered to have low risk. For example, the RfD = 0.05 mg/kg/day for organ toxicity and human exposure level is 0.03 mg/kg/day. This exposure dose is less than the RfD and is considered to pose a low risk of organ toxicity. If, on the other hand, the human exposure dose is 3 mg/kg/day, 40 times higher than the RfD, there is a risk of organ toxicity.
2. Human Health Cancer Risk. Cancer risk is equal to lifetime average daily dose
(LADD, in mg/kg-day) times the q1*, a measure of an individuals excess risk or increased likelihood of developing cancer if exposed to a chemical. It is an approximation of the upper bound of the slope of the dose-response curve using the linearized multistage procedure at low doses. An example of this type of risk assessment is as follows. Chemical: Oxydianiline q1*: 0.099 (mg/kg-day)E-1 Drinking water exposure: 75 mg/year LADD: 75 mg/yr divided by 70 kg (average body weight, adult male) divided by 365 days/yr, or 0.0029 mg/kg-day Excess cancer risk: 0.099 (mg/kg-day)E-1 x 0.0029 mg/kg-day, or 3 x 10E-4 Under the New Chemicals Program, there is concern for occupational exposures that give a risk of >= 1x10E-5 (1 in 100,000) and for general population exposures that give a risk of >= 1x10E-6 (1 in 1,000,000). Therefore, with regard
Updated Report: April 24, 2008 A-22
to this example, a reduction in the potential drinking water exposure would be necessary. OPPT has a computer program, the Q1STAR Program, that automatically calculates risk upon insertion of data specific to each case (molecular weight of the PMN substance, absorption rate relative to the analogue, days of exposure per year).
X. Risk assessment for the environment. A risk assessment is done for all environmental organisms exposed to a chemical. Acute and chronic risks are assessed. Concern concentrations (CC) are compared to predicted environmental concentrations (PEC). Concern concentrations are derived from the environmental toxicity profile via the use of assessment factors. Assessment factors. Environmental toxicology developed within the ecosystem concept. The ecosystem was defined by Odum (1971) [Odum EP. 1971. Fundamentals of Ecology. 3d Ed. W B Saunders Co, Philadelphia, PA. 574 p.] as living organisms and their abiotic environment interacting upon one another in such a way that the flow of energy and materials leads to trophic structure, biotic diversity, and nutrient cycles. Odum further identified levels of organization within the ecosystem: genes-cells-organs-organisms-populations-communities. If one studied an effect at one level of ecological organization, then the mechanism(s) causing that effect would be found in the lower levels of organization and the significance of that effect to the ecosystem would be found in the higher levels. Environmental toxicology has traditionally focused and still emphasizes the organism level of ecological organization via single-species toxicity tests. For most industrial chemicals toxicity data from organisms are the only data available, yet the protection goals of legislation and regulatory authorities include populations, communities, and ecosystems. This situation requires that we either test for chemical effects at higher levels or ecological organization or rely on models which use the data at the organism level and extrapolate to higher levels of ecological organization. Testing of the effects of chemicals to populations, communities, or ecosystems have serious limitations. Testing at these higher levels of ecological organization is significantly more expensive than testing organisms. The cost of testing a chemical for 30 d in a laboratory pond ecosystem can easily exceed $50 000; a 60-d test in a 250-L laboratory site-specific marine ecosystem can exceed $300 000; and a 1-yr pond/lake field study can cost over $500 000 per year. In addition, laboratory and field microcosm/macrocosms are not large enough to realistically maintain a viable fish community. And the contamination of natural ponds/lakes/rivers/fields which results from toxicity testing is not acceptable to local authorities and society. The reliance on simple models which use data from toxic effects on individuals to extrapolate to higher levels of ecological levels of organization is what is used by regulatory authorities at the present time. Complex models, such as, ecosystem simulation models, have not been used extensively because large numbers of explicit and implicit assumption are needed to parameterize these models. These models require a large amount of data about the fate and effects of a chemical on an ecosystem. When these data are lacking assumptions have to be make by experts and the values chosen may be subject to intense debate between experts. Differences between expert

Updated Report: April 24, 2008 A-23
judgment will lead to legal stalemate. Thus, the most simple way to extrapolate from the organism level to higher levels of ecological organization is to use an extrapolation factor. Extrapolation factors have been used by the chemical industry and regulatory authorities for over 30 years and are known by a variety of names: application factors by some research toxicologists, safety factors by the chemical industry, assessment factors by the USEPA, and uncertainty factors by the EU. The USEPA initiated the development of extrapolation factors for use with the Toxic Substances Control Act (TSCA) after its passage in 1976 and published a concept/policy paper in 1984 (USEPA 1984). [United States Environmental Protection Agency (USEPA). 1984. Estimating "concern levels" for concentrations of chemical substances in the environment. Washington DC: Office of Pollution Prevention and Toxics, USEPA. 49 p.] Four assessment factors were defined: 1000, 100, 10, and 1. An assessment factor (AsF) of 1000 can be used for estimating a concern concentration (CC), i.e., equivalent to the EU's PNEC, when only one acute value is available. When acute values are available from several species, an AsF of 100 can be used to estimate the CC and the AsF has to be applied to the most sensitive species. The minimum number of acute values is three and they have to come from a fish, an invertebrate, and green algae. If acute values are available from only two taxonomic groups, such as, fish and invertebrates, then a minimum of 5 values are needed. When a chronic value (ChV) is available, an AsF of 10 was proposed to estimate the CC. The only limitation is that the ChV as to be for the most sensitive taxonomic group of fish, invertebrates, and green algae. When test data are available from a microcosm/mesocosom/pond study/field study/natural environment an uncertain factor does not have to be applied to the lowest ChV, i.e., AsF of 1, as long an the most sensitive taxonomic group is represented in the ecosystem study. For example, if fish are known or suspected of being the most sensitive species, then the study ecosystem has to have had fish as a population before the ChV from the study can be used in risk assessment. USEPA (1984) reported that when SAR predictions are used an extra factor of 10 had to be used. However, as OPPT gained experience in using SAR in risk assessment, then extra factor was dropped. Presently, in OPPT SAR predictions are used the same as valid measured test data. In fact, the only assessment factor generally used in OPPT risk assessments is an AsF of 10 which is applied to the lowest ChV. OPPT predicts the acute and chronic values for a chemical using SAR analysis, prepares a standard environmental toxicity profile for the chemical, integrates valid measured test data for the chemical into the toxicity profile, and applies an AsF of 10 to the lowest ChV to determine the CC to be used in risk assessment. The goal of using assessment factors by OPPT was to protect natural ecosystems or the natural environment. The main assumptions used to determine the size of the assessment factors were (1) field situations could be about 10 times more sensitive than the laboratory situation, (2) the average acute-to-chronic ratio was assumed to be about 10 times, egg, fish 96-h LC50 divided by fish 30-d ChV = 10, and (3) average species sensitivity to industrial chemicals was assumed to be about 10 times.

Updated Report: April 24, 2008 A-24
OPPT also recognized that the use of assessment factors (1) represented a simple method which could be applied consistently by all staff, (2) was a method which could be understood by the public and the chemical industry, and (3) was a method already used by the chemical industry. A. Aquatic organisms.
1. Chronic risks. Steam water concentrations (SWC) are compared to a concern concentration (CC). A CC is a concentration 10 times less than the lowest ChV from the environmental toxicity profile and is homologous to the European Union's Predicted No-Effect Concentration (PNEC). This lowest possible CC can be regarded as a worst case for the chemical. For low risk, a SWC must either not exceed the CC or, if the SWC does exceed the CC, then the SWC must not exceed the SWC for more than 20 days. Moderate risk occurs when the SWC exceeds the CC for more than 20 days. The longer the SWC exceeds the CC, i.e., from 21 days to 365 days, the greater the potential risk. The first environmental risk assessment of new chemicals occurs within 21 days of receipt of the PMN and the worst case risk is done with the lowest CC for the chemical. However, risk assessments using chronic CCs for each species in the toxicity profile can be done. In fact, a risk assessment can be done using any effective concentration (EC), such as, the fish chronic value, in the toxicity profile. The number of risk assessments needed for a chemical is determined on a case-by-case basis during the assessment for a particular chemical.
2. Acute risks. A SWC is compared to the acute values in the environmental
toxicity profile. If a SWC is within 4 times of the acute value, then the potential for an acute risk is expected to be moderate. If the SWC exceeds the acute value, then the risk can be considered to be high.
B. Sediment organisms.
1. Chronic risks. Sediment concentrations (mg/kg dry weight of sediments) are compared to a concern concentration (CC) for sediment organisms. A CC is a concentration 10 times less than the lowest ChV from the environmental toxicity profile and is homologous to the European Union's Predicted No-Effect Concentration (PNEC). This lowest possible CC can be regarded as a worst case for the chemical. For low risk, a sediment concentration may not exceed the CC. Moderate risk occurs when the sediment concentration exceeds the CC. If the sediment concentration exceeds the chronic value, the potential risk can be considered to be high.
2. Acute risks. A sediment concentration is compared to the acute values for
sediment organisms in the environmental toxicity profile. If a sediment concentration is within 4 times of the acute value, then the potential for an acute risk is expected to be moderate. If a sediment concentration is equal to or exceeds an acute value, then the risk is considered to be high.
C. General guidance for using OPPT structure activity relationships for
physical/chemical properties, aquatic toxicity, and environmental exposure can be found at:

Updated Report: April 24, 2008 A-25
• http://www.epa.gov/oppt/p2framework/
XI. Risk Management. A. Unreasonable risk.
1. If a new chemical is determined to present an unreasonable risk towards the environment, then the chemical is banned from manufacture until the submitter of the PMN can send additional information to the Agency to mitigate the risk. Under TSCA, the manufacturer or importer of the new chemical is held responsible for all risks which may occur throughout the entire life cycle of the chemical. Additional information can be any information that the submitter feels will mitigate or control the potential risk, such as, removing the use which is causing the risk, toxicity testing, fate testing, controlling container residues via dedicated totes, on-site treatment of waste streams prior to release to sewage treatment, recycling waste streams, etc. The Agency can extend the initial 90-d pre-manufacturing notification review period to an additional 90 days if necessary. If the unreasonable risk cannot be mitigated by the end of the review period, the Agency can write a Sec. 5(e) Order banning the new chemical from production or the manufacturer can withdraw the PMN from review. In practice, the Agency and the chemical industry have both desired to avoid Sec. 5(e) Orders because of their adversarial nature. As a result, PMN submitters have been willing to suspend the 90-d review period, for example, stop the initial 90-d review period on day 45 for 60 days. This allows more discussion between the submitter and the Agency about the nature of the unreasonable risk, allows more time for the submitter to generate additional information, allows the Agency to evaluate these additional data, and avoids a Sec. 5(e) Order. Every time new additional data are submitted to the Agency, the Agency integrates these data into their last risk assessment and repeats the risk assessment. Again, if the unreasonable risk cannot be mitigated, the Agency can write a Sec. 5(e) Order banning the new chemical from production or the manufacturer can withdraw the PMN from review. In most cases, the additional data from the submitter of the PMN does mitigate the risk. In these cases, the Agency has several options: (1) drop the new chemical from further review and allow it to be added to the TSCA chemical inventory without further regulation or (2) regulate the new chemical with either a Consent Order or a Significant New Use Rule (SNUR) and allow it to be added to the existing chemical inventory. a. A drop decision occurs when the Agency believes that an unreasonable risk
is unlikely to occur during the life cycle of the chemical in light of the additional data submitted to mitigate the potential risk predicted by the Agency. For example, if toxicity testing showed that the new chemical is less toxic than predicted and a new risk assessment shows low risk when these measured toxicity values are integrated into the environmental toxicity profile, then the PMN will be dropped from further review. Another example of a drop

Updated Report: April 24, 2008 A-26
decision occurs when the submitter can demonstrate that the releases to surface water are significantly less than predicted by the Agency engineers because of a new standard practice being followed by the chemical industry that the Agency engineers were unaware of at the time of its initial assessment.
b. A Consent Order is a legally binding agreement between the EPA and the
manufacturer and/or importer which requires the PMN submitter to adhere to one or more of the changes made in the PMN in order to mitigate the potential risk. The submitter is allowed to add the chemical to the chemical inventory and produce the chemical, but the submitter must adhere to the restrictions or controls specified in the Order. For example, if the submitter agrees to treat their waste effluent stream with activated charcoal prior to release to the sewer, then the Agency may ask the submitter to sign a Consent Order requiring the use of activated charcoal treatment prior to release.
c. A Significant New Use Rule (SNUR) allows the submitter to add the new
chemical to the chemical inventory and allows the submitter to manufacture the chemical except for the restriction(s) in the SNUR. For example, if a PMN lists 4 uses and there was a potential risk from use no. 4, and the submitter amends his PMN to remove this use, then the Agency can write a SNUR for the new chemical for this eliminated use. If the PMN submitter or any other manufacturer/importer wants to use this chemical for this banned use, then they will have to submit a Significant New Use Notice (SNUN) 90 days prior to using this chemical for this banned use. This allows the Agency to assess the potential risk from this new use.
2. Chemical Categories. The Agency uses Chemical Categories to eliminate the
need for a 45-d standard (or detailed) review of a new chemical. From 1979 to 1987, about 20% of PMNs were subjected to a detailed review (or standard review) following the FOCUS meeting. If a new chemical was determined to present an unreasonable risk towards the environment during its initial risk assessment at the FOCUS meeting which occurred during the first 14 to 21 days after receipt of the PMN, then the chemical was subjected to a more thorough risk assessment. A risk assessment team was assigned to do this assessment within 45 days. As Agency staff gained experience in assessing several chemicals belonging to the same chemical class, it became apparent that staff did not need 45 days to assess additional chemicals from that same chemical class. For example, after several assessments of linear alkyl benzene sulfonate anionic surfactants or LAS-type surfactants, staff (a) had gathered most of the valid toxicity data for many members of the class, (b) had developed structure activity relationships (SAR) for acute and chronic toxicity, (c) could accurately and quickly predict the toxicity of new LAS-type surfactants, (d) could recommend the necessary testing if the surfactant presented an unreasonable risk, and (e) could develop an adequate assessment prior to FOCUS. There was no need for a 45-d standard review for LAS-type surfactants. Based on experience, a chemical category statement was prepared for LAS-type anionic surfactants. The category statement (a) described the types of chemicals belonging to the class, (b)

Updated Report: April 24, 2008 A-27
identified the boundary conditions or class limits in terms of chemical structure, (c) listed the SARs for the class, and (d) proposed a tiered testing scheme. Once a chemical category was accepted and approved by OPPT managers, the Agency could request additional information about a new LAS-type surfactant immediately after the FOCUS meeting if the surfactant was determined to present an unreasonable risk to the environment. The Chemical Category statement was used to support the Agency's determination of risk and request for additional information in lieu of a Standard Review. If a new LAS-type surfactant was determined not to present an unreasonable risk to the environment at FOCUS, then the surfactant was dropped from further review. If a notified chemical belongs of one of OPPT's Chemical Categories, OPPT does not automatically request the notifier to conduct the testing. Testing under TSCA New Chemicals is only recommended if OPPT determines that the new chemical presents a potential unreasonable risk (or, for high volume chemicals (100 000 kilograms is the trigger volume), if there is significant environmental exposure or release). If low risk, then no testing is recommended. If potential risk, then testing is recommended; however, the notifier can submit any information that the notifier believes will eliminate or reduce the potential risk. Testing is only one form of information that a submitter may submit. In general, chemical-specific testing is necessary to understand the environmental risk predicted by our models. The results of the testing and a re-assessment of the risk would be conducted prior to any commercial manufacture; the re-assessment would have to indicate a risk no longer exists before the new chemical is permitted to be manufactured. If, however, the notifier can exercise environmental controls that would mitigate the risk, EPA and the notifier would enter into a binding agreement, signed by both parties, that specifies the terms and conditions for the commercial manufacturing and use such that the risks are mitigated. The recommended testing is incorporated into such an agreement as additional information that would help EPA to understand the potential risk. A detailed description of a Chemical Category statement and all of the Chemical Categories developed to date by OPPT can be found at:
• http://www.epa.gov/oppt/newchems
3. Recommended testing. If a new chemical is determined to present an unreasonable risk towards the environment, then recommended testing is based on (a) the chemical's expected release(s) to the environment, (b) the chemical's expected toxicity, and (c) areas of greatest uncertainty about a chemical's toxicity and fate.
a. If a new chemical is predicted to be only released to a freshwater
environment, then freshwater species are recommended for testing. If release is only a marine or salt water environment, then salt water species are recommended. And likewise, if release is only to the terrestrial environment, such as, farms or golf courses, then terrestrial species are recommended. If chemical release is to more than one type of environment, such as, freshwater, marine, and terrestrial, then all species are

Updated Report: April 24, 2008 A-28
recommended. The chemical's expected environmental exposure will determine which species are tested.
b. If a new chemical is predicted to be acutely and chronically toxicity to aquatic
organisms, then the testing is tiered. Acute toxicity is recommended prior to chronic toxicity. The acute toxicity data are integrated into the environmental toxicity profile and the profile is adjusted based on the results of the acute toxicity data. New concern concentrations (CC) are calculated and a new risk assessment is done. If it is determined that the new chemical still may present an unreasonable risk towards the environment after the acute toxicity data have been integrated in to the assessment, then chronic toxicity testing is recommended.
If a new chemical is predicted to show no-acute-toxic-effects to aquatic organisms but is expected to be only chronically toxic, then only chronic toxicity is recommended.
c. If there is greater uncertainty about a chemical's fate than its expected
toxicity, then recommended fate testing will be tiered prior to toxicity testing. For example, if a chemical is predicted to be highly toxic to aquatic organisms, is expected to hydrolyze but its hydrolysis half-life at 20 C and pH 7 is unknown, and may biodegrade during sewage treatment but there are insufficient analog data to set a specific removal percentage during sewage treatment, then recommended testing will be tiered based on greatest uncertainty. Thus, hydrolysis testing will be recommended to be done first, followed by aerobic or ready biodegradation, and lastly the aquatic acute toxicity testing. As each tier of data are completed, these new data are integrated in to the Agency's assessment, and a new risk assessment is done. If the chemical still presents a potential risk towards the aquatic environment, then the next tier of testing will be requested from the notifier. In general, terrestrial testing is rarely recommended because the exposure and environmental fate assessment usually does not predict a concern in these areas. Unlike the use of pesticide chemicals, the exposures associated with manufacture and use of industrial chemicals are typically more limited and defined. The predominant environmental exposures of concern are from releases to water and the effect on aquatic life (as part of the assessment, we also consider endangered species inhabiting such water systems). Where there are air releases, EPA assesses potential risk to humans, and if there does not appear to be a human health risk, our assumption is that other mammalian species are also not at risk. Companies will often conduct acute ecotoxicity testing when we require that level of testing; this is probably due to a combination of the relatively low cost and the limited time required for the testing. Higher level testing is, in general, less frequently done (i.e., companies will opt to drop the chemical rather than do the testing).

Updated Report: April 24, 2008 A-29
B. Significant Exposure.
If a new chemical is determined not to present an unreasonable risk towards the environment, but the new chemical is released surface water in significant amounts, then the Agency may ask the submitter to test this new chemical for aquatic toxicity and/or fate. Significant exposure is defined as a production volume of more than 100 000 kg/y and more than 1000 kg/y released to surface water during the life cycle of the chemical. If the Agency determines that there is a data gap in its toxicity or fate data bases for this type of chemical, then the Agency can ask for either toxicity testing or fate testing, or both. Exposure-based toxicity testing is generally the environmental base set of tests which are the fish acute toxicity test, the daphnid acute toxicity test, and the green algal 96-h toxicity test. If the chemical is predicted to have no-acute-toxic-effects at saturation, then the Agency will ask for the chronic set of tests which are the fish 28-d early life stage toxicity test, the daphnid 21-d reproduction inhibition toxicity test, and the green algal 96-h toxicity test. If the submitter does the fate testing before the toxicity testing and asks the Agency to reassess its exposure-based finding in light of these new fate data, then the toxicity testing will not be required if the new fate data result in a reduction of the amount of chemical predicted being released to surface water to less than 1000 kg/y. The submitter can either suspend the 90-d review period and do the required testing prior to manufacturing or sign a Consent Order which requires testing after manufacturing has begun. The Consent Order allows the submitter to make sufficient profits from sales of the chemical to pay for the testing.
C. Unreasonable risk and significant exposure.
If a new chemical is determined to present an unreasonable risk towards the environment and is released to surface water in significant amounts, then the Agency will focus on mitigating the unreasonable risk finding. If the unreasonable risk is mitigated, the Agency will pursue the exposure-based finding.
D. Substitute analysis.
If a new chemical is determined to present an unreasonable risk towards the environment, but is designed to replace an existing chemical which the Agency has a greater concern, then the new chemical may be dropped from review without regulation in the hope that the new chemical will replace the existing chemical in the marketplace. For example, a new organic pigment designed to replace an existing Pb-based pigment, a new organic catalyst designed to replace an existing organotin-based catalyst, or a new surfactant, which rapidly degrades after use, designed to replace an existing highly-branched and persistent surfactant.
E. PBT Chemicals.
New chemicals with PBT scores of P2B2T2 or greater are regulated. Chemicals with a score of P2B2T2 are regulated by a consent order. The order allows manufacturing to begin but requires testing to address the concerns for PBT and certain controls would be stipulated, such as, annual reporting and restrictions on environmental releases.

Updated Report: April 24, 2008 A-30
New chemicals with PBT scores of P3B3T3 are banned from being produced until sufficient testing is done to allow the Agency to design the appropriate regulatory strategy. New chemicals with PBT scores of P2B2 or greater and T1 are not regulated. A letter is sent to the submitter outlining the Agency's concerns for the chemical's expected persistency and bioconcentration. The OPPT Category for Persistent, Bioaccumulative, and Toxic New Chemical Substances was published in the Federal Register, Vol. 64, No. 213, Thursday, November 4, 1999, pages 60194 to 60204.
XII. Additional Sources of Information A. General guidance about ecological risk assessment in the US Federal Government:
• http://www.nap.edu/catalog/366.html • http://www.nap.edu/catalog/776.html • http://www.whitehouse.gov/WH/EOP/OSTP/html/OSTP_Home.html • http://www.nnic/noaa.gov/CENR/cenr.html
B. General guidance about ecological risk assessment at the US Environmental
Protection Agency:
• http://www.epa.gov/ncea/ecorsk.htm • http://www.epa.gov/ncea/raf/rafpub.htm
C. Guidance about ecological risk assessment at chemical waste landfill clean-up sites:
• http://www.epa.gov/superfund/programs/risk/tooleco.htm#GG D. EPA's Design for the Environment Program adopted many of the OPPT New
Chemical Program's risk assessment methods. Their Cleaner Technologies Substitutes Assessment Methodology and Resource Guide can be found at:
• http://es.inel.gov/dfe • http://www.ra.utk.edu/eerc/
E. Validation studies of OPPT structure activity relationships (SAR) used in the new
chemical program can be found at:
Internal EPA validation 1993: Nabholz, J. V., Clements, R. G., Zeeman, M. G., Osborn, K. C., and Wedge, R. "Validation of Structure Activity Relationships used by the Office of Pollution Prevention and Toxics for the Environmental Hazard Assessment of Industrial Chemicals," Environmental Toxicology and Risk Assessment: 2nd Volume, ASTM STP 1216, Joseph W. Gorsuch, F. James Dwyer, Christopher G. Ingersoll, and Thomas W. La Point, Eds., American Society for Testing and Materials, Philadelphia, 1993, pp. 571-590.

Updated Report: April 24, 2008 A-31
EU-EPA MPD-SAR validation 1994
US EPA's validation sent to the EU: • http://www.epa.gov/oppt/MPD-SAR/ • http://www.epa.gov/MPD-SAR/index.html The OECD publication of the EU-EPA MPD-SAR validation: Organisation for Economic Co-Operation and Development (OECD). 1994. US EPA/EC Joint Project on the Evaluation of (Quantitative) Structure Activity Relationships. OECD Environment Monographs No. 88. OECD/GD(94)28. OECD, Paris, France. 368 pp. Download this publication at an EPA web site: • http://www.epa.gov/oppt/newchems/21ecosar.htn Download this publication at an OECD web site: • http://www.oecd.org/ehs/ehsmono/index.htm The OECD publication of the EU-EPA MPD-SAR validation republished as an EPA publication: United States Environmental Protection Agency. 1994. U.S. EPA/EC Joint Project on the Evaluation of (Quantitative) Structure Activity Relationships. Washington, DC: Office of Pollution Prevention and Toxics, United States Environmental Protection Agency, EPA Report #EPA-743-R-94-001. Available from National Technical Information Service, U.S. Department of Commerce, 5285 Port Royal Road, Springfield, Virginia 22161, Tel: 703-487-4650, and http://intranet.epa.gov/oppthome/testsite/MPD-SAR/index.html
F. Database of aquatic toxicity values from the literature:
• http://www.epa.gov/ecotox/

Appendix B:
Flat Panel Display Recycling Contacts

Updated Report: April 24, 2008 B-1
Albemarle Corp. 451 Florida Street Baton Rouge, LA 70801 Phone: (225)-388-7565 Alcorn Consulting 1890 Preston White Dr. #102 Reston, VA 20191 Phone: (703)-390-9200 Association of Lighting and Mercury Recyclers 2436 Foothill Boulevard Calistoga, CA 94515 Phone: (707)-942-2197 Ecoglass Recycling, Inc. 1950 Rutgers University Blvd. Lakewood, NJ 08701 Phone: (732)-730-2880 International Association of Electronics Recyclers (IAER) and Integrated Solutions and Services 506 Green Hill Beach Road Wakefield, RI 02879 Phone: (401)-792-0155 Merck KGaA Liquid Crystals Division Phone: +49(0)6151 727360 Email: [email protected] Metech, International 6200 Engel Way Gilroy, CA, 95020-7012 Phone: (408)-848-3050 Noranda Recycling, Inc. 1695 Monterey Road San Jose, CA 95112 Phone: (408) 998-4930 RC Recycling Ltd. 209 - 669 Ridley Place Delta V3M 6Y9 Vancouver, British Columbia Canada Phone: (866)-771-2981 Recovery Plastics International, LLC 3695 West 2340 South
Salt Lake City, UT 84120-7222 Phone: (801) 973-4774 RMD Technologies, Inc. 1597 East Alamo Rd Holtville, CA 92250 Phone: (800) 831-3048 SIMS Recycling Solutions 2377 Eichler Street – Unit E Hayward, CA 94545 Phone: (510)-259-0340 Supreme Computer & Electronic Recycling, Inc. 1955 Swarthmore Avenue Units 4 & 5 Lakewood, NJ 08701 Phone: (732)-370-4100 Total Reclaim Inc, Environmental Services PO Box 24996 Seattle, WA 98124-0996 Phone: (206) 343-7443 US Geological Survey (USGS) 988 National Center Reston, VA 20192 Phone: (703)-648-4978 We Recycle!, Inc. 500 South Broad Street Meriden, CT 06450 Phone: (203)-630-0344

Appendix C:
Useful Operating Life of Flat Panel Products

Updated Report: April 24, 2008 C-1
USEFUL OPERATING LIFE OF FLAT PANEL PRODUCTS
Study Overview and Summary of Findings The purpose of this research effort was to assess the lifespan of current flat panel devices (FPDs) including computer monitors, laptop computers and televisions. When evaluating products on a life cycle basis, one must consider the environmental implications of manufacturing and disposing of a product, as well as the energy use consumed during the product’s functional life. Differences in the functional life of durable products such as computers and televisions also have significant implications in terms of production and disposal impacts. For example, if one type of television has a shorter useful operating life than another, more units of the shorter-lived product would need to be produced (and ultimately disposed) to provide the same number of hours of use as the longer-lived product. The most recent published study that was found to thoroughly address the lifespan of a flat panel LCD product was the EPA report “Desktop Computer Displays: A Life-Cycle Assessment” conducted by the Center for Clean Products and Clean Technologies at the University of Tennessee in 2001.1 This study was a comparative evaluation of a CRT monitor and an LCD monitor. As flat panel technology has matured, it is likely that there have been corresponding increases in the lifespan and/or reliability of flat panel products. In this project, research for updating the lifetime of flat panel products focused on three areas:
• Characterizing the overall manufactured operating life of flat panel products, • Identifying which components in a flat panel display fail first, and
• Assessing whether failing components can be repaired or replaced cost-
effectively to return the product to working condition, or whether failure of a component effectively ends the useful life of the product.
Many potential sources of information were explored, including companies manufacturing flat panel components and products, market research firms specializing in display technology issues, electronic product repair and warranty companies, and consumer buying guides. There was general consensus that the life-limiting component of FPD products is the lamp or backlight, although different sources varied in their assessment of the repairability of a failed light source. CRT technology was mature at the time of the 2001 study, and available data about operating performance for CRT products have not changed. The standard for assessing the manufactured life of display products is hours of operation until the display fades to half of its original brightness. Using brightness half-life as the basis for comparison (without extensions for repair, replacement, or adjustment of failing components), the available data suggest that an LCD flat panel 1 Desktop Computer Displays: A Life-Cycle Assessment. Volumes I and II. Design for the Environment Computer Display Project. U.S. Environmental Protection Agency, Office of Pollution Prevention and Toxics, Washington, DC (Socolof, M. L., J. G. Overly, L. E. Kincaid and J. R. Geibig; 2001). Accessible at http://www.epa.gov/oppt/dfe/pubs/comp-dic/lca/.

Updated Report: April 24, 2008 C-2
product can be used approximately two to three times as many hours as a CRT product before reaching half-brightness. However, if the units are operated until failure, regardless of reductions in brightness, it is likely that the products will have similar total operating lifespans, or the lifespan of the CRT may be longer than the LCD. Background ERG staff reviewed the 2001 EPA report to develop a full understanding of the data supporting the lifetime estimates for the CRT and LCD monitors.2 Section 2.2.1 of Appendix H describes the lifespan as follows:
“The manufactured life is defined here as the length of time a monitor is designed to operate effectively for the user. It is the number of hours a monitor would function as manufactured, and is independent of user choices or actions. One way to estimate this manufactured life is to use the mean-time-before-failure (MTBF) specification of a monitor or its components. The CRT MTBF specification dictates the amount of time the display must operate before it reaches its brightness 'half-life,' or the ability to produce 50% of its initial, maximum brightness. The MTBF value, generally provided in total hours per life of a monitor, is what most final manufacturers or assemblers of personal computer (PC) equipment, including monitor assemblers, typically specify for a component.”
Appendix H Section 2.1.1 goes on to state:
“From review of the information obtained on CRT-based monitors (see Attachment A, Table A23), it appears that the CRT itself is the limiting component, or the component that 99% of the time determines whether the entire monitor has reached its end-of-life. Thus, from the limited information that was obtained on CRTs, and the limited confidence that can be instilled in that data, an average of the two ranges obtained on the estimated lifetime of CRTs (10,000 - 15,000 hours) was used as the CRT manufactured lifetime (12,500 hours) (Goldwassar 1999, Douglas 1999).
“For active matrix LCDs, the components that have the greatest potential to fail first are the display panel itself (including the liquid crystals and thin-film transistors), backlights, driver integrated circuit (IC) tabs, and other smaller components. The backlights and driver IC tabs can be field-replaced, thus their failure does not necessarily represent the end of the monitor's life. However, failure of the liquid crystals or transistors, which would require replacement of the display panel itself, would most likely mean that the monitor cannot be cost-effectively repaired. The MTBFs of all these components appear to have a broad range. For example, different backlight manufacturers reported from as few as 15,000 hours to as many as 50,000 hours (Douglas 1999, Tsuda 1999, VP150 1999). However, it appears that those components that are not field-replaceable (e.g., the LCD panel) have MTBFs in the range of 40,000 - 50,000 hours (Tsuda 1999, Young 1999). Thus in this TM, the amount of time an LCD monitor would operate during its
2 Ibid. Appendix H: Technical Memorandum: Use Life-Cycle Stage Approach. 3 Table A-2 of Appendix H provides a summary matrix of information obtained from contacts at manufacturing companies, a contact at DisplaySearch, (a leading display technology market research firm), an internet-accessible computer and video monitor troubleshooting and repair guide, and monitor product specification sheets.

Updated Report: April 24, 2008 C-3
manufactured life is assumed to be the average of the two non field-replaceable values, or 45,000 hours.” Research Approach After developing a baseline understanding of the product lifetime data in the 2001 EPA study, the next step was to attempt to update flat panel lifespan data using the same types of sources as were used in the EPA study. The internet repair guide, “Notes on the Troubleshooting and Repair of Computer and Video Monitors” (Copyright 1994-2007, Samuel M. Goldwasser), was available at http://www.repairfaq.org/sam/monfaq.htm#monlifesom. The report is now listed as Version 3.19, with a date of 4-Sep-07, but all the information on CRT lifespans is unchanged. The guide has not been expanded to address LCD or other flat panel monitors. Wayne Rifer of the Green Electronics Council provided a list of contacts at flat panel product manufacturing companies, including Apple, Dell, Lenovo, Philips, Sony, and ViewSonic. ERG staff followed up with each contact. Most contacts were unable to provide any information on MTBFs for flat panel products or individual components of flat panel products; however, some useful information was received. One manufacturer of LCD panels reported that the LCD panel is designed to have a life span of approximately 40,000 to 50,000 hours; however, the brightness level begins to drop substantially after about 10,000 hours. The manufacturer also indicated that although it is technically possible to decap the backlight assembly and replace a failed lamp, it is generally not cost-effective, so that failure of a lamp effectively ends the useful operating life of the panel. Other manufacturers made similar statements about the cost-effectiveness of repairing and replacing failed components as prices of new flat panel products continue to decrease. ERG also contacted Dr. Werner Becker, Senior Advisor Technology and Regulatory Affairs Liquid Crystals Division, Merck KGaA about availability of information on the lifetime of the liquid crystals used in LCD panels. Dr. Becker was unable to provide any information but suggested contacting two leading market research firms for the flat panel industry, DisplaySearch and iSuppli. When contacted, iSuppli indicated that they did not have any reports addressing flat panel lifespans. DisplaySearch also did not have any lifespan reports available, but their website and staff provided useful information.
Several DisplaySearch presentations were available on the company’s website, including a 2006 presentation containing a slide with a comparison of the lifetime in hours for different backlight technologies.4 The lifetimes shown on the slide for different technologies were as follows:
• More mature technologies
4 Presentation: DisplaySearch 2006 TFT LCD and Component Market Trends, David Hsieh, Vice President, DisplaySearch Greater China, Taiwan Flat Panel Display Materials and Device Association, May 5, 2006. Available at: http://www.displaysearch.com/cps/rde/xbcr/SID-0A424DE8-24430988/displaysearch/tdmda_050506_davidhsieh.pdf .
Updated Report: April 24, 2008 C-4
Cold Cathode Fluorescent Lamp (CCFL): 50,000 – 60,000 hours External Electron Fluorescent Lamp (EEFL): > 60,000 hours Light Emitting Diode (LED): 50,000 hours
• Newer technologies Flat Fluorescent Lamp (FFL): 100,000 hours Organic LED (OLED): 12,000 – 15,000 hours
The CCFL lamp is the type of backlight used in LCD products. In addition to lifespan issues, the DisplaySearch presentation contained an assessment of a range of other issues for each backlight technology, such as power consumption, display quality issues (color uniformity and brightness), and a summary of issues to be solved for each technology, such as cost, use of mercury, power consumption, and lifetime. Chris Connery, Vice President, PC and Large Format Commercial Displays at DisplaySearch, confirmed that “It is widely regarded that the lowest MTBFs of any components of LCDs are the backlight units” and “all other components have MTBFs far in excess of the BLU [backlight unit].”5 He went on to note that CCFL backlights are typically not field replaceable, as they require a certain level of clean room environment. According to Mr. Connery, with the decreases in FPD prices over the past few years, the cost of a replacement backlight unit and the labor cost for replacement is usually more than the price of a new display. Electronics repair companies and associations were also contacted for information about FPD failures and repairability. ERG contacted the companies managing the warranty programs for Best Buy and Circuit City, but neither would provide any information about the most common failing components on flat panel products or repairability. Consumer Reports Magazine was sent a request for failure information from Consumer Reports’ Testing Laboratory evaluations of flat panel products, but they responded that they are unable to respond to individual requests for this type of information. Consumer Reports does include product reliability information in their published reviews of products, although without specific details on the causes of repairs, as described later in this report. An internet search for companies repairing flat panel products and LCD products turned up a range of companies, from large companies with clean room operations to individual technicians working out of their homes or small shops. Most of the companies contacted declined to provide any information; however, a repair technician at TCC Monitor Repair spoke at length.6 He reported that flat panel products can often be repaired economically unless the failure involves the LCD panel (rare) or a tab chip failure, which appears as a horizontal or vertical line on the display. The majority of the repairable flat panel failures he sees are power supplies, which can be replaced economically, and backlights, which may last from 10,000 to 15,000 hours in TVs and desktop monitors but tend to last longer in laptop computers. The life of backlights varies depending on the manufacturer. He also reported that CRT TVs and monitors can last for many years. He personally has a CRT unit that has only required servicing twice in 20 years of use. The gain of the CRT
5 Email correspondence between Chris Connery, DisplaySearch, and Beverly Sauer, ERG, February 14, 2008. 6 Telephone conversation between Christian Berryer, TCC Monitor Repair, and Beverly Sauer, ERG, January 8, 2008.

Updated Report: April 24, 2008 C-5
tube can be adjusted to restore brightness as the picture begins to dim. However, there is a limit on the number of times the gain can be adjusted to restore brightness. James Burgett, a refurbisher who runs the Alameda County Computer Resource Center, also reported that power supplies and backlights are the most common points of failure in the products received at his facility. He indicated that these components can be replaceable depending on the design of the product.7
Another repair company, MoniServ (www.moniserv.com), has clean room facilities that allow them to make repairs to flat panel components as well as flat panel products. They also sell replacement parts. They report a lifetime for LCD CCFL backlights of 50,000 hours. MoniServ’s website contains the following description of failure modes:
“The industry-wide failure modes for LCD and FPD reveal a common Pareto dispersion pattern. By far the highest failure mode is blank horizontal rows or blank vertical columns resulting from either bad drivers or broken driver-to-LCD interconnection. Failures requiring driver recovery and re-bonding typically make up about 75% of all LCD failures. Other significant failure modes include damaged polarizers, failed backlights, bad inverter boards, LCD delamination (Scratch), and glass related failures.”
The MoniServ description differs from information from other sources indicating that backlights are the most common failure. ERG believes that is logical to infer that MoniServ may see a somewhat different population of failed units due to their clean room repair capabilities. That is, they may tend to receive units that require specialized interior repairs, for example due to faulty connections made during manufacture or assembly of the product or component, rather than failures associated with properly assembled components that wear out from normal use. Several of the repair company websites indicated that the company was a member of NESDA, the National Electronics Service Dealers Association. ERG contacted NESDA with a request for information on flat panel product lifetimes and repairs, but was advised that they do not have this type of information. Consumer buying guides were also searched for information on the lifespans of flat panel products. Several on-line articles, as well as the March 2008 issue of Consumer Reports magazine, contained comparisons of LCD, plasma, and rear projection TVs. Most articles focused on issues such as picture quality (resolution, color contrast, brightness), viewing angle, size, and power consumption. Surprisingly little information was found on product lifespans, particularly considering the high price of these products. The information that was available is summarized in the following paragraphs. the March 2008 Consumer Reports article8 states that rear-projection TVs (which use bulbs that must be replaced approximately every 5,000 hours) have been more prone to repairs than flat panel TVs. The article also notes that new technologies are arriving, such as LED lighting. Regarding FPD repairs and reliability, the article states that “Our surveys of thousands of consumers show that LCD and plasma flat-panel TVs have been very reliable for the first three years”; however, the article contains no information 7 Email correspondence between James Burgett and Beverly Sauer, ERG, January 29, 2008. 8 “TV Stars: More New HDTVs Shine in Our Tests.” Consumer Reports. March 2008.

Updated Report: April 24, 2008 C-6
on average hours of use per year. A sidebar article on TV repairs reports results of the 2007 Annual Product Reliability Survey conducted by the Consumer Reports National Research Center. Out of 74,544 responses for flat-panel LCD and plasma TVs purchased new between 2004 and 2007, the overall repair rate for ten major brands of flat-panel TVs was 3 percent, with little difference between LCD and plasma TVs. No detail was provided on the causes of failure or the average cost of flat panel TV repairs. Other on-line consumer buying guides or TV comparison guides also contained information on lifespan and other issues for LCD and other technologies, including plasma and DLP (Digital Light Processing, utilizing micromirrors). Information from different sources are summarized below. In most cases, the original data sources and publication dates for these articles could not be determined from the website, so it is not possible to assess the validity of the statements. Source: http://www.lcdtvbuyingguide.com/lcdtv/lcdtv-lifetime.shtml Main points:
• LCD televisions last longer than their plasma TV counterparts. • Flat-panel LCD screen displays have a lifespan approaching 60,000 hours. • The pictures on LCD displays will dim over time and with use as the lamp itself
dims, so the light source in the LCD monitor is the critical component of the LCD display unit.
Source: http://www.flatpaneltv.org/article/flat-panel-tv-shopping-and-tips/the-lifespan-of-plasma-lcd-and-other-flat-panel-tvs.html Main points:
• A TV's lifespan is measured as a half-life – the period of time it takes before the screen dims to half its original brightness.
• The LCD panel itself has a virtually infinite lifespan; thus, the actual lifespan of the LCD's light source determines the screen's longevity. Because bulb life is virtually equivalent to LCD screen life, the lifespan of LCD televisions is 30,000 to 60,000 hours (with manufacturers even claiming 80,000). If the set can have its bulbs replaced, then the life can be extended. At six hours of TV per day, it'll be 28 years before the LCD TV's brightness begins to dim to half the original level.
• The gases used in plasma TVs gradually decay over time. Generally, the lifespan of plasma TVs is 20,000 to 30,000 hours (with manufacturers stating 60,000 hours under optimal, but highly unlikely, conditions). Right now, it's impossible to have the plasma gases replaced like LCD bulbs. At six hours of TV per day, it'll be 14 years before the plasma TV's brightness begins to fade to half the original level.
• Digital Light Processing or DLP TVs use projectors, which typically last between 1,000 to 3,000 hours (though some manufacturers claim 6,000-10,000). These lamps can easily be replaced for $200-$500. The DLP screen itself is estimated to have a lifespan of 80,000 to 100,000 hours, which translates to around 30 years of 'regular' viewing.
• OLED (organic light-emitting diode) TVs use organic materials that have limited lifetimes – only 1,000 to 5,000 hours. However, the variant PHOLEDs (phosphorescent) can last up to 20,000 hours.

Updated Report: April 24, 2008 C-7
• Liquid crystal on silicon (LCOS or LCoS) TVs use a technology similar to DLP projectors. LCOS TVs boast of a long lifespan, that is, around 80,000 hours.
• Cathode ray tube (CRT) TVs have a lifespan longer than 80,000 hours. Source: http://www.dlptvreview.com/dlptv/plasmatelevision.html Main points :
• DLP manufacturers list the backlight bulb hours at around 80,000 hours9, and the bulb can be replaced for as little as $200 in some cases. Some DLPs are configured in a way that makes it easy for a layperson to replace bulbs, while other require a technician.
• Since DLP technology is based on mirrors and light, replacement of the bulb will restore the DLP to like-new performance.
• For plasma TVs, the life of plasma phosphors is estimated to be about 60,000 hours. At 30,000 hours the phosphors will be at their half-life, and the image will have half the original brightness. The gases in plasma TVs cannot be replaced.
Source: http://www.plasmadepot.com/dlptv/dlptelevisionlifespan.html Main points:
• A DLP-based HDTV set should last indefinitely because the digital micromirror device behind it is very reliable.
• The only consumer replaceable component is the DLP light source (lamp) which will last for 8,000 hours and costs around $250 to replace. The micro-mirrors used in DLP are not subject to degradation due to heat, humidity, vibration or "burn-in".
Summary and Conclusions Most sources agree that the CCFL backlight or lamp is the life-limiting factor for LCD flat panel devices; however, there are differences in the assessment of the repairability of this component and the cost-effectiveness of repair. It is not always clear whether sources are using the term “lamp” or “backlight” to refer to the complete light assembly or to the individual lamp component of the assembly. As described on a European flat panel repair company website, “The CCFL is part of the diffuser/backlight assembly which also comprises of a reflector, light enhancement films, diffuser films and a plastic framework. Quantities of CCFL’s within LCD’s can vary from a single lamp in the small notebook LCDs to 20 or more lamps within the large screen TV LCDs.”10 Other internet sources and illustrations show that the lamp is a long, thin, delicate tube secured inside a reflector, with cables soldered to the ends of the lamp, which are protected by rubber caps. It is easy to find instructions for do-it-yourself replacement of laptop computer CCFL lamps11, although these sources note that this is not an easy repair even for an 9 This appears to be a typo, as another article from the same site, http://www.dlptvreview.com/dlptv/3estimated.html , reports “The only consumer replaceable component is the DLP light source (lamp) which will last for 8,000 hours and costs around $250 to replace.” 10 http://www.fps-europe.com/repair.html11 http://www.laptoprepair101.com/laptop/2007/12/09/replace-laptop-backlight-ccfl-lamp/; http://www.lcdpart.com/doc/ccflinstallation.html

Updated Report: April 24, 2008 C-8
experienced technician and should be done in a clean environment. The size, number, or location of lamps within TVs and desktop monitors may make it more difficult to replace backlight lamps or assemblies in these products. In any case, the majority of sources indicated that a CCFL lamp, whether it is replaceable or not, should last for approximately 50,000 hours. A more difficult issue to address is functional performance over the 50,000-hour life. Most sources did not clearly specify whether 50,000 hours is the time until complete failure of the lamp or until the lamp reaches its brightness half-life. The 2001 EPA life-cycle assessment states that MTBF for monitors is based on time to brightness half-life. This was also confirmed by a flat panel product manufacturer as well as the flatpaneltv.org article. Thus, this analysis assumes that reported lifetime hours for FPDs are the hours of operation until half-brightness. One manufacturer provided some interesting perspective on using half-brightness as a measure of lifespan, noting that the brightness of a brand-new display unit in 1998 would today be considered a failing brightness level when applying the 50% brightness criterion to today’s products that have higher initial brightness levels. Thus, “failure” based on half-brightness is really a moving target as technology improves. Some data sources (such as the Goldwasser troubleshooting and repair guide) continue to report that the MTBF to brightness half-life for a CRT is 10,000 to 15,000 hours. However, other sources (the repair technician and the flatpaneltv.org article) claim a CRT life of 80,000 hours – a huge difference. Based on the repair technician’s comments about adjusting the CRT tube gain to restore brightness, it is likely that some repair or adjustment of the CRT is required in order to stay above half-brightness for an 80,000-hour life. If the CRT user is unable to make the adjustment themselves, is unaware that adjustments can be made to prolong brightness, or is unwilling to pay someone else to adjust the gain to restore brightness, it is likely that a user who can afford to replace the unit will do so after the CRT reaches half-brightness at approximately 10,000 to 15,000 hours of use. ERG believes it is reasonable to assume that an average consumer will probably not have the knowledge or skills to replace LCD lamps or make gain adjustments to a CRT to restore brightness. Thus, it seems most realistic to base the useful operating life of these products on the stated MTBFs without extension for repair or replacement of failing components, or for adjustment of dimming CRTs. Based on brightness half-life, the results of this research suggest that an LCD flat panel product can be used approximately two to three times as many hours as a CRT product before reaching half-brightness. If the units are operated until failure, regardless of reductions in brightness, it is likely that the products will have similar total operating lifespans, or the lifespan of the CRT may be longer than the LCD. As for other flat panel technologies such as plasma and DLP, lifespan estimates vary. Two articles stated that the total lifespan for plasma displays is 60,000 hours with a half-brightness life of 20,000 to 30,000 hours. For DLP, sources seemed to agree that the screen and micro-mirrors are very long-lived (80,000 hours or more), but different sources reported widely varying lifespans for the replaceable projector bulbs, anywhere from 1,000 to 10,000 hours.