liquidity intervention options
TRANSCRIPT
Liquidity Intervention Options
Prepared By:
4 Barb Mews
London
W6 7PA
United Kingdom
Issued: May 2013
Status: FINAL
Liquidity Options Analysis
Prepared for DECC 2 of 142
May 2013
CONTENTS
PART I - INTRODUCTION AND SUMMARY 4
1 Introduction 5
1.1 Context and Background 5
1.2 Purpose and Scope 6
1.3 Structure of this document 7
2 Executive Summary 10
2.2 Liquidity Drivers 10
2.3 Intervention Options 10
PART II – LIQUIDITY DRIVERS 12
3 Overview 13
3.1 Introduction 13
3.2 Summary of Findings 13
4 Market Structure & Trading Arrangements 15
4.1 Introduction 15
4.2 Gas Market Correlation 15
4.3 Power Market Volatility 17
4.4 Generation Mix & Intermittency 18
4.5 Market Coupling and Physical Interconnection 22
4.6 GB Trading Arrangements 23
4.7 Low Carbon Reforms 26
5 Industry Structure & Business Models 27
5.1 Introduction 27
5.2 GB Industry Structure & Concentration 27
5.3 Typical GB Business Models 29
5.4 Drivers of Vertical Integration 34
5.5 Current Level of Vertical Integration 38
6 Margining and Financial Regulation 41
6.1 Introduction 41
6.2 European Market Infrastructure Regulation (EMIR) 41
6.3 Liquidity Impact of EMIR 43
6.4 Markets in Financial Instruments Directive and Capital Requirements 45
PART III - INTERVENTION OPTIONS 47
7 Overview 48
7.1 Introduction 48
7.2 Intervention Options 48
8 Analytical Framework 50
8.1 Overview 50
8.2 Reduce Barriers to Entry and Competition: 51
Liquidity Options Analysis
Prepared for DECC 3 of 142
May 2013
8.3 Minimise Costs, Complexity, and Risks 54
8.4 Align and Comply with Reform and Regulation 56
8.5 Assessment Scoring 57
9 Physical Self-Supply Restrictions 59
9.1 Option Definition 59
9.2 Assessment of Partial SSR 65
9.3 Assessment of Full SSR 66
10 Functional Separation 68
10.1 Option Definition 68
10.2 Assessment of Functional Separation – Agency Model 71
10.3 Assessment of Functional Separation – Full Separation Model 73
11 Mandatory Auctions 75
11.1 Option Definition 75
11.2 Assessment of Mandatory Auctions 78
12 Mandatory Market Making 80
12.1 Option Definition 80
12.2 Assessment of Mandatory Market-Making 83
13 Supplementary Intervention Options 85
13.1 Introduction 85
13.2 Ofgem Minimum Proposals 85
13.3 CfD Reference Price 88
13.4 Credit Interventions 89
13.5 Collateral Interventions 91
13.6 Transparency Interventions 92
14 Conclusions 94
14.1 Overview 94
14.2 Benefits 95
14.3 Costs and Risks 97
14.4 Alignment and Compliance 99
14.5 Recommendations 100
APPENDICES 101
A Assessment Criteria 102
B VIU Business Models 107
C SSR Analysis 109
D Case Studies 112
E Credit Risk Management, Collateral, and Margining 115
F Assessment by Intervention Option 119
G Assessment by Criteria 139
Liquidity Options Analysis
Prepared for DECC 4 of 142
May 2013
PART I - INTRODUCTION AND SUMMARY
Liquidity Options Analysis
Prepared for DECC 5 of 142
May 2013
1 Introduction
1.1 Context and Background
1.1.1 The GB wholesale power market exhibits low levels of liquidity relative to other major European
markets and international commodity markets. While the recent surge in volumes traded at the
N2EX exchange has markedly improved the depth in Day-Ahead auctions and short term markets,
liquidity in forward trading products remains poor by comparison to both the NBP gas market and
the Nordic and Continental power markets.
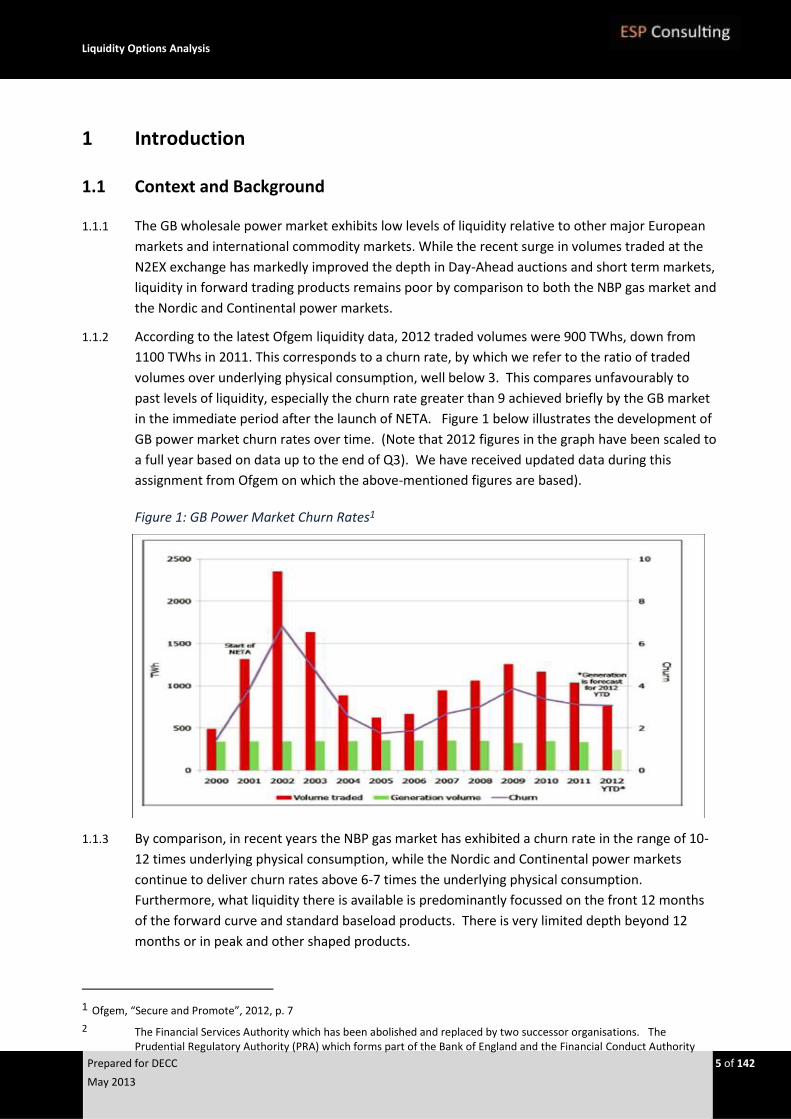
1.1.2 According to the latest Ofgem liquidity data, 2012 traded volumes were 900 TWhs, down from
1100 TWhs in 2011. This corresponds to a churn rate, by which we refer to the ratio of traded
volumes over underlying physical consumption, well below 3. This compares unfavourably to
past levels of liquidity, especially the churn rate greater than 9 achieved briefly by the GB market
in the immediate period after the launch of NETA. Figure 1 below illustrates the development of
GB power market churn rates over time. (Note that 2012 figures in the graph have been scaled to
a full year based on data up to the end of Q3). We have received updated data during this
assignment from Ofgem on which the above-mentioned figures are based).
Figure 1: GB Power Market Churn Rates1
1.1.3 By comparison, in recent years the NBP gas market has exhibited a churn rate in the range of 10-
12 times underlying physical consumption, while the Nordic and Continental power markets
continue to deliver churn rates above 6-7 times the underlying physical consumption.
Furthermore, what liquidity there is available is predominantly focussed on the front 12 months
of the forward curve and standard baseload products. There is very limited depth beyond 12
months or in peak and other shaped products.
1 Ofgem, “Secure and Promote”, 2012, p. 7
2 The Financial Services Authority which has been abolished and replaced by two successor organisations. The Prudential Regulatory Authority (PRA) which forms part of the Bank of England and the Financial Conduct Authority
Liquidity Options Analysis
Prepared for DECC 6 of 142
May 2013
1.1.4 Ofgem first identified low liquidity as an issue in 2008 and since then it has undertaken a number
of market assessments and consultations to identify options to address it. In its most recent
consultation (December, 2012), Ofgem explored a range of options primarily designed to ‘secure
and promote’ recent industry led developments including “locking-in” the recent surge in Day-
Ahead auction volumes.
1.1.5 Low liquidity obscures investment signals and reduces risk management and route to market
opportunities. It represents a potentially significant barrier to entry, growth and greater
competition in generation and supply markets. A liquid wholesale power market is also a key
enabler of the Government’s Electricity Market Reform programme which aims to bring forward
new investment from a range of sources.
1.1.6 The relatively higher liquidity of the NBP gas market together with its correlation to the GB power
market creates the possibility for participants to achieve certain hedging and risk management
objectives through the NBP market. Nonetheless, reliance on the gas market as a proxy increases
costs and risks and therefore the lack of power market liquidity continues to be a concern.
1.1.7 Given the importance of liquidity to meeting Government’s competition objectives, the
government is seeking powers in the Energy Bill to allow it to intervene if necessary. We
understand that such powers may be deployed should the Government conclude that Ofgem’s
proposed interventions need to go further and/or can be more quickly delivered through
secondary legislation.
1.2 Purpose and Scope
Purpose
1.2.1 The Department of Energy and Climate Change (DECC) has commissioned ESP Consulting to carry
out an assessment of the options for intervening. Such an assessment will be used to support
ministers during the passage of the Energy Bill and to help identify the Government’s preferred
approach to provide a basis for consultation, if appropriate. The primary purpose and objectives
of this work is to:
i) Define a clear and concise framework for analyzing and assessing different options for
intervening in the GB power market. This framework needs to balance the potential
liquidity benefits against the costs and risks associated with the intervention (both
implementation and ongoing) as well as with the fit and compliance with ongoing and
forthcoming market reforms and regulations;
ii) Detail the primary intervention options and the manner and degree to which design
features can be flexed to achieve different outcomes (e.g. to achieve liquidity in different
areas of the curve, minimise delivery risk, impact on the trading requirements of different
business models);
iii) Set out a clearly defined menu of interventions for consideration supported by:
- Clear choices and recommendations relating to the design detail;
- An analysis/explanation of the rationale for particular design choices; and

Liquidity Options Analysis
Prepared for DECC 7 of 142
May 2013
- Where relevant, descriptions of how these options have been employed in other
sectors/markets.
This menu should include not just primary intervention options, but also supplementary
measures, which on their own may not be sufficient to meet Government objectives, but
which nonetheless might be worth including as part of a wider package; and
iv) Provide technical advice on the implementation and ongoing arrangements (regulatory
and/or operational, e.g. trading platforms) necessary under each option for the
Government, regulator and obligated parties.
Scope
1.2.2 The Government’s primary objective is to promote competition and market access in a way that
supports well-functioning wholesale and retail markets and the delivery of EMR. In this context, a
well-functioning wholesale market is one which affords participants across a variety of different
business models with:
i) Sufficient access and routes to the market to allow them to enter and compete;
ii) An effective suite of instruments which supports trading and hedging activities as well as
robust management of wholesale market risks; and
iii) Transparent, clear and unbiased market information and data against which to base
trading and commercial decision making.
1.2.3 This implies a longer term and broader focus on removing structural barriers to entry and
competition which extends well beyond (short term) measures which potentially deliver an
immediate impact on GB market traded volumes. It also implies a focus on the forward markets
where liquidity is currently low. While impacts on other areas of the curve are considered and
within scope of this report, the Government recognises the recent progress in improving liquidity
in the prompt markets.
1.3 Structure of this document
1.3.1 The remainder of this PART I of the report presents a summary of our findings and conclusions in
Chapter 2. The main body of the report is divided into two overall parts.
PART II – Liquidity Drivers
1.3.2 Any analysis of potential intervention options must necessarily start from a robust understanding
of the issues and factors which have led to the current state of the market. In PART II we therefore
examine the key drivers of liquidity in the GB power market as well as the many challenges and
headwinds facing DECC and Ofgem in this area:
Chapter 3 presents a brief overview of the recent liquidity levels in the GB power market
and a summary of the key drivers further elaborated in the following chapters;
Chapter 4 considers the influence of market structure and trading arrangements including
the potential impact of the EMR and Ofgem reform initiatives;
Liquidity Options Analysis
Prepared for DECC 8 of 142
May 2013
Chapter 5 analyses the industry structure in the GB power sector and the impact of
vertically integrated business models deployed by the large GB players; and
Chapter 6 finally examines the impact of margining and credit requirements in light of new
financial regulations such as EMIR;
Part III – Intervention options
1.3.3 Having considered the key drivers of GB power market liquidity, PART III identifies and evaluates a
wide-ranging suite of potential interventions:
Chapter 7 provides a brief overview of the primary and supplementary intervention
options considered;
Chapter 8 sets out the Analytical Framework for assessing different intervention options
consistently and comprehensively as agreed with DECC;
Chapters 9 through to 12 define and evaluate each of the primary intervention options
comprising:
- Partial or full Restrictions on Self Supply (SSRs) within Vertically Integrated Utilities
(VIUs);
- Options for supporting SSRs with additional constraints on the VIUs’ internal
organisation aimed at separating up- and downstream trading activities and
commercial decision making;
- Mandatory obligations on large players to participate in auctions for forward products;
and
- Mandatory obligations to offer Market Marking services.
Chapter 13 defines and evaluates each of the supplementary intervention options which in
themselves are unlikely to deliver the desired outcome, but which nonetheless support and
augment the primary interventions; and
Chapter 14 finally presents our conclusions and recommendations across all (primary and
supplementary) liquidity intervention options.
Appendices
1.3.4 A number of appendices which provide additional or supplementary data and information are
included:
Appendix A provides guidelines for the assignment of ratings to each of the individual
assessment criteria defined in the Analytical Framework introduced in Chapter 7;
Appendix B outlines typical VIU business models (and some common variations thereof) to
support the discussion of VIU liquidity drivers in Chapter 5 and the definition of
intervention options in Chapter 5;
Appendix C details the analysis which supports the estimates of potential churn
contribution under Partial and Full Self-Supply Restrictions (SSRs) discussed in Chapter 9;
Appendix D includes two case studies from other markets which illustrate SSR
interventions as well as interventions which (in addition to an SSR) place additional

Liquidity Options Analysis
Prepared for DECC 9 of 142
May 2013
constraints on the functional (internal) operation of the business in line with the Agency
and Full Separation Models defined in Chapters 9 and 10;
Appendix E provides background information and explanations to support those who are
less familiar with the credit and margining concepts discussed in Chapters 6 and 13;
Appendix F details the assessment of each of the intervention options summarised in
Chapters 9 to 12; and
Appendix G finally provides a summary of the scores across all Primary and Supplementary
interventions of each individual assessment criteria to support the conclusions set out in
Chapter 14.
Liquidity Options Analysis
Prepared for DECC 10 of 142
May 2013
2 Executive Summary
2.1.1 Levels of liquidity in the GB wholesale power market have declined from levels observed in the
past, and are currently low in comparison with the NBP gas market and with other major
continental European power markets. While market depth in the Day-Ahead and short-term
markets has recently improved, liquidity in forward-traded products remains low. Low liquidity is
perceived to be a barrier to entry and competition, to obscure investment signals, and to reduce
opportunities for hedging and risk management.
2.1.2 The Department of Energy and Climate Change (DECC) has commissioned ESP Consulting to carry
out a study of the options for intervening in the wholesale power market with the objective of
improving liquidity. The purpose of this study is to detail the potential options for intervention;
to analyse and assess the benefits, costs, and risks of these interventions; and to outline the
technical arrangements required for the implementation and maintenance of the interventions in
practice. This report outlines the results of this study.
2.2 Liquidity Drivers
2.2.1 GB power market liquidity is influenced by a number of factors and drivers, such as the industry
structure as well as the structure of the GB wholesale market and of trading arrangements. The
study identifies a number of the most important constraints on liquidity. These include, first of
all, a relatively small number of market participants compounded by the low level of connectivity
of the GB market to other markets. Both the Continental and the Nordic markets benefit from far
larger numbers of active participants as well as better connectivity with other markets, and we
believe this leads directly to higher levels of liquidity observed. Secondly, the NBP gas market is
much more liquid than the power market, and because it is correlated with the power market it
provides a substitute (although imperfect) for hedging GB power. Thirdly, vertically-integrated
(VI) organisations are the dominant structures in the GB market, and as a result of internal
netting, they have relatively fewer reasons to participate in wholesale markets. While VI is a
common feature across the European power industry, the greater number of participants and
stronger connectivity in, for example, the Continental and Nordic markets, may serve to dilute
the liquidity impact of such business models. Finally, the financial arrangements in the power
market, such as credit or collateral requirements, create barriers to participation and therefore
reduce liquidity. Reforms of financial market regulation, such as EMIR, are expected to further
dampen market liquidity.
2.3 Intervention Options
2.3.1 The study considers a wide range of potential intervention options targeted to mitigate low levels
of liquidity. These options were identified during a number of workshops with DECC. We
distinguish between primary intervention options, which are assessed to have the potential to
significantly impact market liquidity, and supplementary intervention options, which, while not
likely to completely mitigate low liquidity as a stand-alone solution, would nonetheless support
or augment the primary interventions.
Liquidity Options Analysis
Prepared for DECC 11 of 142
May 2013
2.3.2 An analytic framework to support the consistent evaluation of the primary and supplementary
intervention options was also developed and agreed with DECC. Criteria for the assessment of
the interventions are established under three high-level objectives, namely to reduce barriers to
entry and competition; to minimise costs, complexity, and risks; and to align and comply with
reform and regulation.
2.3.3 The primary intervention options include Self-Supply Restrictions (restricting the volume of
power a company can supply from its own generation), Functional Separation (constraints on the
internal organisation of vertically-integrated companies), Mandatory Auctions (obligations on
certain players to participate in auctions of forward products) and Mandatory Market Making
(obligations on certain players to continually offer to both buy and sell volumes of power in the
forward market).
2.3.4 Applying the analytical framework to the primary intervention options, we find that the
assessment of the Mandatory Auction and Mandatory Market Making interventions is overall
positive. These interventions have greater scope to direct the forward products (tenor and shape)
onto which the intervention is focused, compared to other primary interventions, and therefore
to directly support the goals of transparency of price signals and availability of hedging products.
The Mandatory Market Making intervention is judged to be the superior option as it is the sole
intervention which facilitates market participants to decide for themselves the volumes and
products they require, as opposed to a target set of volumes and products determined in advance
by the regulator.
2.3.5 In contrast, the interventions which constrain vertical integration (Self-Supply Restrictions and
Functional Separation) score negatively on the analytical framework. At first sight these
interventions have potential to increase liquidity, assuming trading behaviour (i.e. churn rates) is
unaffected by the restriction. However, as discussed in this report, we doubt that this assumption
holds. There are a number of advantages which accrue to vertically-integrated companies which
experience suggests lead them to churn their underlying (net) positions more actively than non-
integrated players (not least independent suppliers). These include diversification along the value
chain, collateral-free off-take and sourcing channels within the business, a relatively balanced
market risk position, advantages in the short-term market relating to balancing and shaping, and
a tendency towards higher credit/debt ratings due to perceived higher stability. Actions which
constrain vertical integration are disruptive to these benefits and therefore disproportionally
increase costs and there is no guarantee that such interventions will lead to sustainable
improvements in liquidity.
2.3.6 Among the supplementary intervention options, a proposal by Ofgem to oblige participants to
gross-bid 30% of annual generation into the Day-Ahead auction is judged to be positive overall
but insufficient to influence forward liquidity, as is another Ofgem proposal to modify license
conditions to require “fair and reasonable terms” when trading with small suppliers. The choice
of the low-carbon baseload CfD reference price is very likely to be supportive of liquidity in the
particular product selected as the reference. Measures to improve the availability and
transparency of market data have the potential to reduce barriers to entry. In contrast, our initial
analysis of selected interventions to mitigate credit risk or support smaller players in obtaining
credit and managing collateral requirements suggest these initiatives would be either inequitable
or impractical. However, more work is required in this area.
Liquidity Options Analysis
Prepared for DECC 12 of 142
May 2013
PART II – LIQUIDITY DRIVERS
Liquidity Options Analysis
Prepared for DECC 13 of 142
May 2013
3 Overview
3.1 Introduction
3.1.1 The intervention options considered in Part III of this report must necessarily be analysed and
evaluated in the context of the underlying factors leading to the current market state as well as
consider potential new challenges and headwinds which may impact the market and its ability to
deliver a satisfactory level of liquidity going forward.
3.1.2 In this part we therefore first examine the key drivers of liquidity in the GB power market which
we have grouped as follows:
i) GB market structure and trading arrangement such as gas market correlation, changes in
generation mix brought about as a result of EMR, impact of NWE market coupling and the
EU target model as well as Ofgem’s and DECC’s ongoing reform initiatives (Chapter 4);
ii) GB industry structure in terms of the number of independent active participants, the
different types of business models deployed and the level of vertical integration amongst
the Big Six (Chapter 5); and
iii) Margining and Credit arrangements in light of recent developments in European financial
regulation (Chapter 6).
3.1.3 Before addressing each of these driver groups in depth in chapters 4 to 6, we first briefly
summarise our main findings and conclusions in the remainder of this chapter.
3.2 Summary of Findings
Drivers leading to Current Market State
3.2.1 The low level of liquidity currently observed in the UK power market is the result of a number of
factors. We have identified the following to be the most important:
i) The GB power market has a low level of interconnectivity to other markets, especially the
continental market. Interconnection as a proportion of installed capacity is low compared
to the Nordpool market and to other markets on the continent. A direct consequence of
the isolation of the GB market is a relatively small number of market participants.
ii) The GB power market is dominated by vertically integrated utilities, active in both the
generation and supply markets. This industry structure brings a number of inherent
benefits to the vertically integrated companies: natural hedges stabilise cashflows and
financial results, shaping and balancing risks are mitigated, credit risk and cash collateral
requirements are avoided, etc. While some other countries also have a significant level of
vertical integration while maintaining market liquidity, the GB market combines high levels
of vertical integration, a small number of participants, and low interconnection to other
markets.
Liquidity Options Analysis
Prepared for DECC 14 of 142
May 2013
iii) The NBP gas market is much more liquid than the GB power market. At the same time, the
two markets are highly correlated. Market participants therefore frequently use the NBP
gas market as a proxy for the power market, using gas transactions as a hedge against
power exposures.
iv) The GB market has relatively complex market arrangements and a penal Balancing Market
(BM) mechanism compared to Nordic and North Western European markets, which are
direct barriers to entry for new participants.
v) More recently, margining has become more and more common as a mitigation for credit
risk (although this is not specific to the GB market).
Potential Future Liquidity Drivers
3.2.2 Looking forward, there are a number of additional drivers that may impact liquidity in part
brought about as a result of the many reforms and regulations being introduced over the coming
years. While some of these may, in fact, enhance liquidity, others present additional challenges
and liquidity “headwinds”. Most notably:
i) Changes in the generation mix brought about by EMR, namely a greater volume of
intermittent generation, will likely reduce incentives for forward trading and hence (on its
own) impact liquidity negatively.
ii) Association of the CfD reference price for intermittent generation with the Day-Ahead
market will focus trading efforts in the spot market to the detriment of the forward
market.
iii) European financial regulations, and especially the EMIR regulation, have the potential to
impact churn in the power market. The EMIR regulation defines a threshold for nominal
trading volumes, above which companies would have additional compliance requirements
imposed on them. Large companies are expected to reduce their trading activities to
remain under the threshold, while those that exceed the threshold will be required to
collateralise a greater proportion of their trades.
iv) We expect that market coupling and the EU Target Model will be a positive market
development, but the low level of interconnection will mean that the impact will be
limited.
3.2.3 These drivers, and the mechanisms by which they impact power market liquidity, are elaborated
in the following chapters.
Liquidity Options Analysis
Prepared for DECC 15 of 142
May 2013
4 Market Structure & Trading Arrangements
4.1 Introduction
4.1.1 This chapter examines elements of the GB market structure together with accompanying trading
arrangements which impact trading market liquidity:
Section 4.2 discusses the importance of proxy (dirty) hedging strategies and hence whether
the observed power market liquidity necessarily paints a true picture of liquidity as well as
the impact of recent low price volatility;
Section 4.3 considers the current level of power market price volatility and relates this to
levels of power market liquidity;
Section 4.4 analyses the impact of changes in generation mix and in particular the increase
in the share of intermittent generation as a result of EMR;
Section 4.5 assesses the impact of market coupling and alignment to the EU target model
within the NWE Region;
Section 4.6 considers the influence of Ofgem’s ongoing reform of the cash-out mechanism
as well as the introduction of capacity payments under the EMR programme; and
Section 4.7 finally considers the potential impact of ongoing low carbon reforms.
4.2 Gas Market Correlation
4.2.1 The GB power market is highly correlated with the NBP gas market due to the extent of gas-fired
generation. While causality may vary short term, on average and over the longer term the gas
price tends to drive the power price. As a result of the strong and stable correlation between
these markets, some industry parties use the liquid NBP market as a means to hedge their
electricity exposure in preference to the more illiquid wholesale electricity market. Anecdotally, it
is our experience that such proxy or “dirty” hedging and trading strategies are common and
widely used across the GB power sector.
4.2.2 The FSA2 data presented in the figure below compares the reported market size in both gas and
power. Note that these data are compiled for financial year intervals and hence are not directly
comparable to Ofgem’s data on traded power volumes (which reflect calendar years). While one
cannot infer a firm causal connection purely on the grounds of traded volumes, these data do
lend some support to the hypothesis that liquidity and observed churn rates in these markets
potentially are linked:
2 The Financial Services Authority which has been abolished and replaced by two successor organisations. The
Prudential Regulatory Authority (PRA) which forms part of the Bank of England and the Financial Conduct Authority (FCA) which will cover firms interaction with consumers.

Liquidity Options Analysis
Prepared for DECC 16 of 142
May 2013
Figure 2: UK gas and Power Traded Volumes
Source: FSA
4.2.3 In so far that the gas market is a potential outlet for the lack of power liquidity, this raises a
fundamental question as to whether power liquidity on its own should be considered a major
concern. If participants can achieve their hedging and risk management through the NBP market,
low liquidity in the power market may be considered a lesser problem.
4.2.4 Ofgem remains of the view that stimulating and improving liquidity in the electricity market is an
important stand-alone objective. We agree with this view as the current correlation between gas
and power cannot be relied on over the long term. The current extent of proxy-hedging depends
critically on the current stable correlations between NBP and GB power which in turn rely on:
i) Gas-fired plant remaining the dominant marginal (price-setting) capacity; and
ii) Future developments in the EU ETS and the carbon price floor, which forms a potentially
volatile component of the spread between gas and power.
4.2.5 There are many factors which could, and in all likelihood will, destabilise these assumptions
including (but not limited to):
i) The decrease in gas fired-generation overall as predicted by DECC’s own Central generation
scenarios (refer Section 4.4 below). Even if gas-fired generation remains the main price-
setting capacity in the GB system, the diminishing importance of generation as a key source
of gas demand will likely to dilute the current level of coupling and in particular the stability
of spark spreads;
ii) Changes in relative fuel prices in the GB system which pushes gas out of the marginal
(price-setting) segment. There is no guarantee or inherent reason which dictates that gas
will remain marginal and factors which potentially could change relative fuel prices include:
- Changes in coal prices resulting from changes in global supply/ demand balance in the
coal and freight markets;
- Changes in the price of CO2 emission rights;
- Further depression of NBP prices, for example, in response to increased LNG imports
or the possible impact of shale gas;
- Increased competition on the margin as a result of NWE market coupling (although we
believe this impact to be fairly limited as discussed in the following section); and
- Deterioration of recent stable plant reliability performance (e.g. major outages) which
could push more efficient CCGTs back into the baseload segment.
iii) The ongoing EMR reforms as well as Ofgem’s regulatory initiatives which impact the power
leg, but not the gas leg, of the spark spread.
0
50
100
150
200
250
300
350
0
100,000
200,000
300,000
400,000
500,000
600,000
2011/12 2010/11 2009/10 2008/09 2007/08 2006/07 2005/06 2004/05 2003/04
£b
n, p
p/t
h
mill
ion
th
erm
s
UK gas
UK gas Reported size of market
UK gas Estimates notional value of annual traded market
UK gas average ICE Futures Europe (ICE) front month settlement price
0
10
20
30
40
50
60
70
0
200,000
400,000
600,000
800,000
1,000,000
1,200,000
1,400,000
2011/12 2010/11 2009/10 2008/09 2007/08 2006/07 2005/06 2004/05 2003/04
£, £
bn
GW
h
UK power
UK power Reported size of market
UK power Estimates notional value of annual traded market
UK power average ICE Futures Europe (ICE) front month baseload settlement prices
Liquidity Options Analysis
Prepared for DECC 17 of 142
May 2013
4.2.6 For these reasons, it is not in our view sound to rely on the NBP as an outlet for power liquidity.
Failure to develop the GB power market could expose smaller participants to a future scenario in
which they suddenly find themselves struggling to access the forward markets and suitable
products. Furthermore, while some smaller participants have started using proxy-hedging
strategies, not all may want to, or be equipped to, manage the multiple commodity positions and
basis risk that such strategies necessarily entail.
4.2.7 We conclude that over-reliance on NBP is neither a robust nor safe option and that Ofgem and
Government therefore are correct in seeking to ensure a well-functioning power market in its
own right.
4.3 Power Market Volatility
4.3.1 Volatility is the propensity for market prices to change. A market with relatively stable prices has
low volatility, while prices in a market with high volatility (a “volatile market”) frequently increase
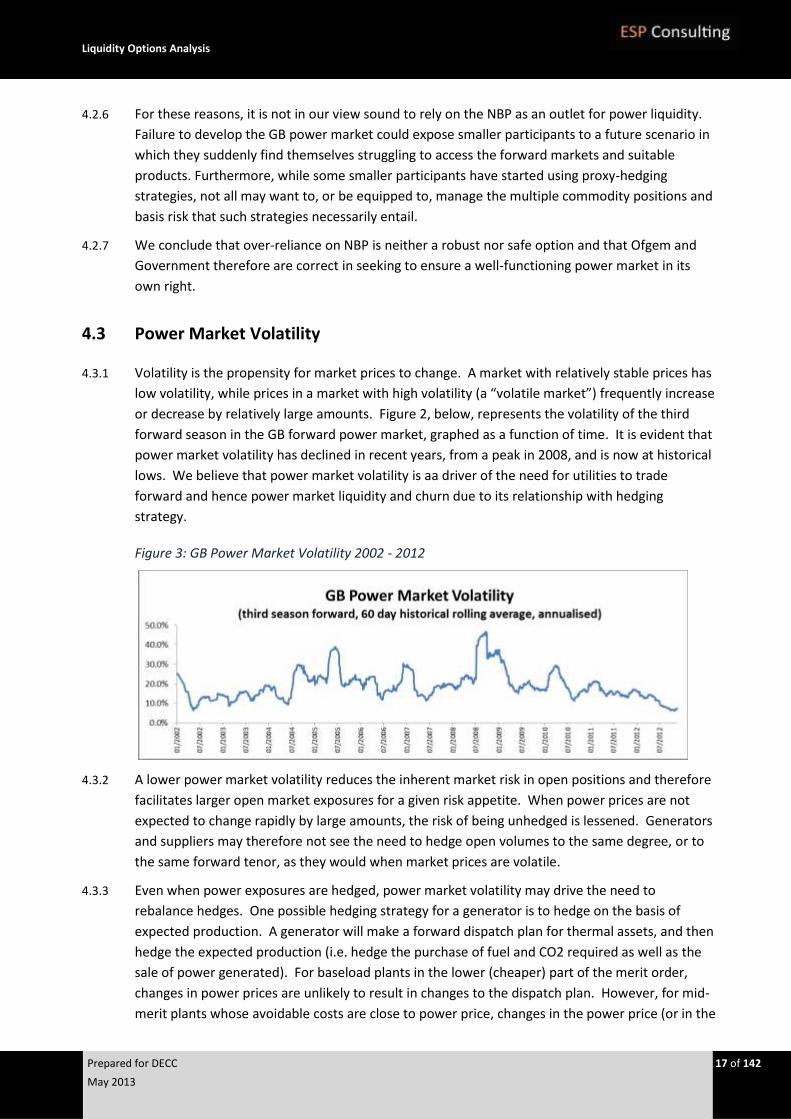
or decrease by relatively large amounts. Figure 2, below, represents the volatility of the third
forward season in the GB forward power market, graphed as a function of time. It is evident that
power market volatility has declined in recent years, from a peak in 2008, and is now at historical
lows. We believe that power market volatility is aa driver of the need for utilities to trade
forward and hence power market liquidity and churn due to its relationship with hedging
strategy.
Figure 3: GB Power Market Volatility 2002 - 2012
4.3.2 A lower power market volatility reduces the inherent market risk in open positions and therefore
facilitates larger open market exposures for a given risk appetite. When power prices are not
expected to change rapidly by large amounts, the risk of being unhedged is lessened. Generators
and suppliers may therefore not see the need to hedge open volumes to the same degree, or to
the same forward tenor, as they would when market prices are volatile.
4.3.3 Even when power exposures are hedged, power market volatility may drive the need to
rebalance hedges. One possible hedging strategy for a generator is to hedge on the basis of
expected production. A generator will make a forward dispatch plan for thermal assets, and then
hedge the expected production (i.e. hedge the purchase of fuel and CO2 required as well as the
sale of power generated). For baseload plants in the lower (cheaper) part of the merit order,
changes in power prices are unlikely to result in changes to the dispatch plan. However, for mid-
merit plants whose avoidable costs are close to power price, changes in the power price (or in the
Liquidity Options Analysis
Prepared for DECC 18 of 142
May 2013
underlying cost of generation) will change the dispatch planning and therefore hedging
requirements. In a volatile market, marginal plant will move into and out of a generator’s
forward dispatch planning. A generator will respond by rebalancing existing hedges (selling
hedges as plant moves out of the dispatch or re-hedging volumes as plant moves in). This activity
obviously creates churn in the market. The current low level of GB power market volatility
decreases the requirement for the rebalancing of the hedges of generators. We note here that
power demand is very inelastic, and consumers do not generally demand less power in response
to increases in the power price. Suppliers therefore do not generally need to rebalance hedges in
response to changing power prices.
4.3.4 Some thermal generators have a more sophisticated approach to the hedging of marginal plant.
Recognising their asset position as a real option, i.e. financial position that may or may not have
an associated cashflow depending on market outcomes, they employ a technique called “delta-
hedging” for their expected forward generation. A delta-hedging strategy for a power plant is
usually applied only for marginal plants and involves hedging a portion of the expected the
generation, depending on the time to deliver and the probability of dispatch, which itself
depends on the level of power market volatility. For low levels of power market volatility, the
delta-hedge position will be rebalanced less frequently.
4.3.5 Low levels of power market volatility therefore lead directly to low levels of churn, either by
reducing the need for power generators to rebalance their hedges on mid-merit generation plant,
or by permitting all market players to keep a larger open generation or supply position for a given
level of risk appetite.
4.4 Generation Mix & Intermittency
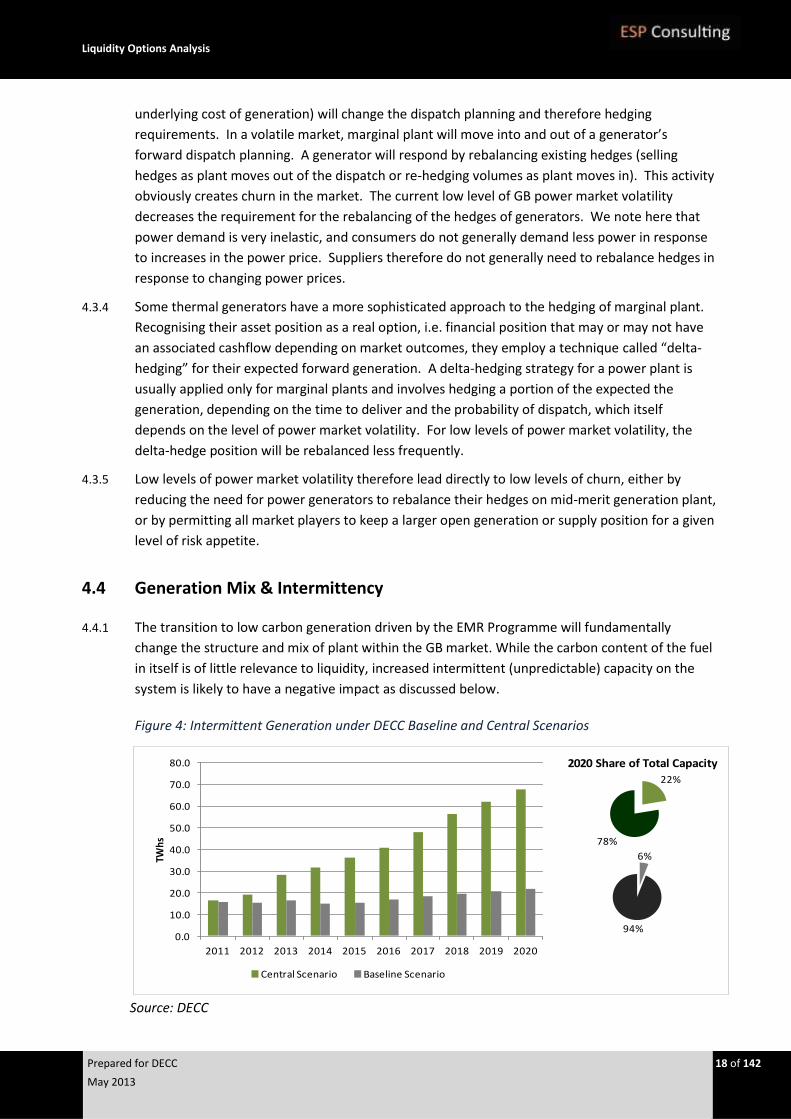
4.4.1 The transition to low carbon generation driven by the EMR Programme will fundamentally
change the structure and mix of plant within the GB market. While the carbon content of the fuel
in itself is of little relevance to liquidity, increased intermittent (unpredictable) capacity on the
system is likely to have a negative impact as discussed below.
Figure 4: Intermittent Generation under DECC Baseline and Central Scenarios
Source: DECC
0.0
10.0
20.0
30.0
40.0
50.0
60.0
70.0
80.0
2011 2012 2013 2014 2015 2016 2017 2018 2019 2020
TWh
s
Central Scenario Baseline Scenario
22%
78%
6%
94%
2020 Share of Total Capacity
Liquidity Options Analysis
Prepared for DECC 19 of 142
May 2013
4.4.2 Figure 4 above presents estimates of the amount of generation delivered by intermittent capacity
under DECC’s Baseline and Central Scenarios, respectively3. For the purpose of this estimate,
intermittent generation capacity is defined as all on and off-shore wind plus small Hydro and
Solar4. As illustrated, the EMR programme will almost quadruple the share of intermittent
capacity in the GB system by 2020 (and this trend will continue post 2020). This change in the
generation mix will likely reduce incentives for forward trading and hence (on its own) impact
liquidity negatively. There are three principal reasons for this conclusion.
Reduced demand for forward trading
4.4.3 Intermittent generators tend to spill their power into the day ahead and intra-day markets. This
reflects the inherent uncertainty of generation as a function of (constant) wind speed.
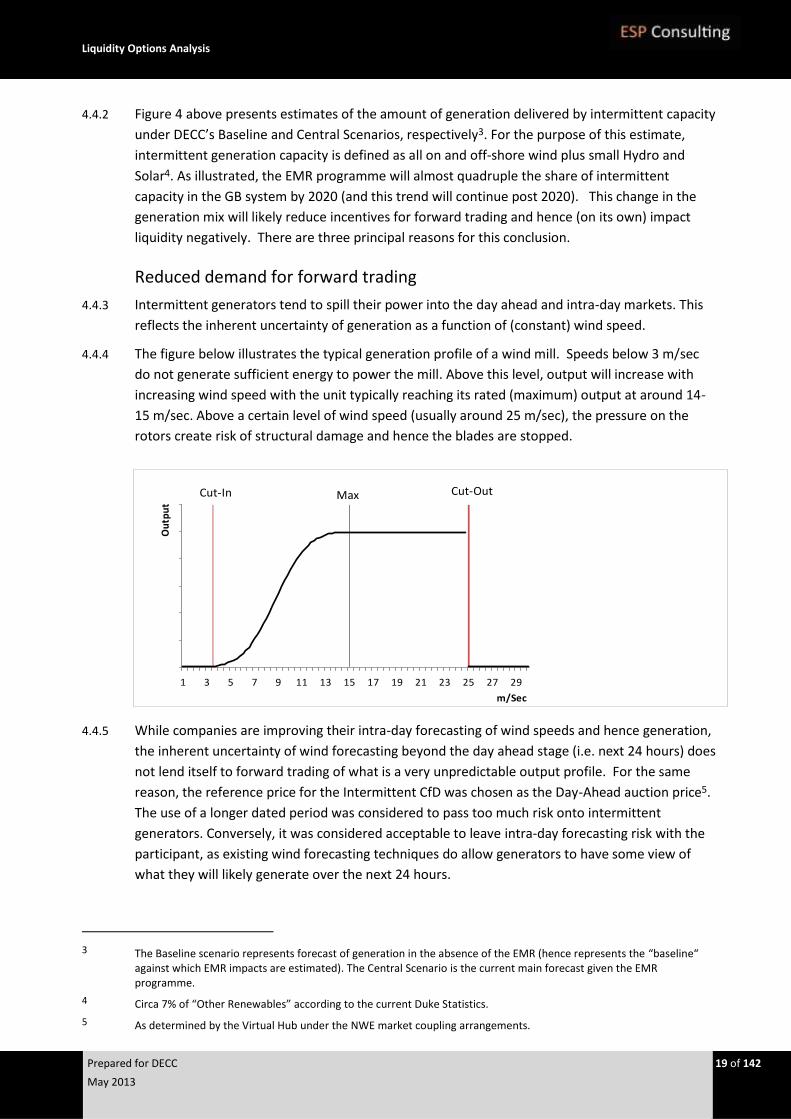
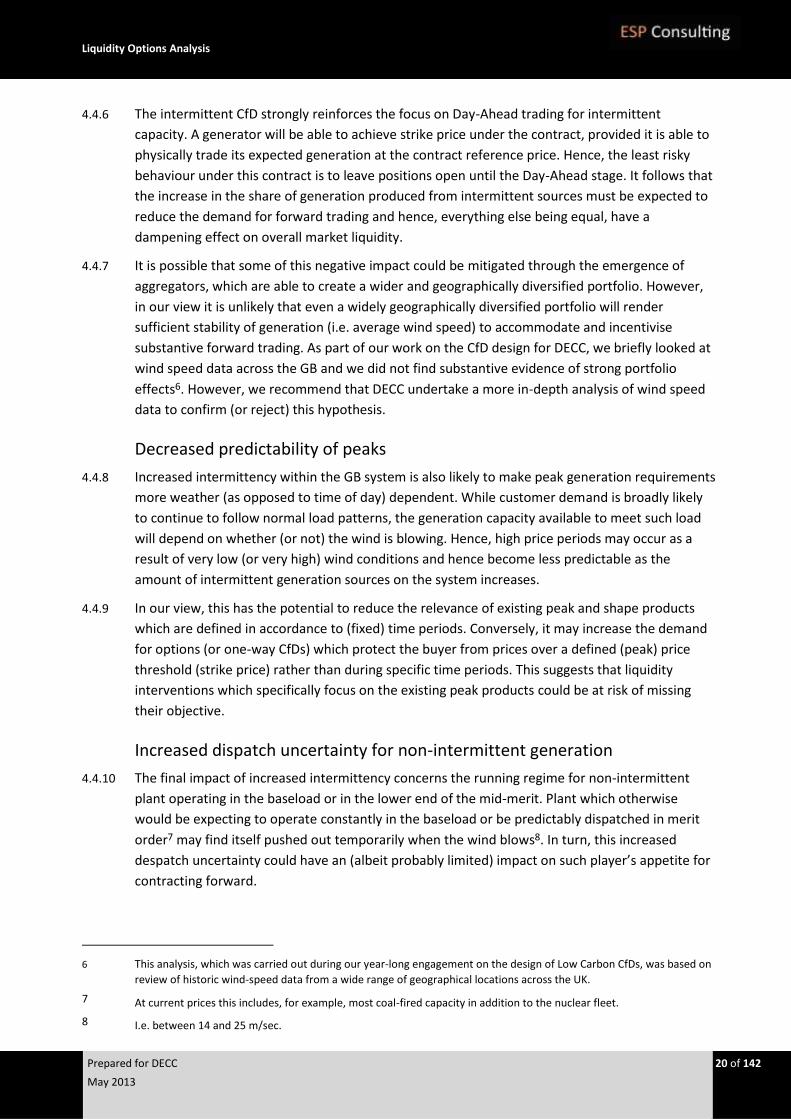
4.4.4 The figure below illustrates the typical generation profile of a wind mill. Speeds below 3 m/sec
do not generate sufficient energy to power the mill. Above this level, output will increase with
increasing wind speed with the unit typically reaching its rated (maximum) output at around 14-
15 m/sec. Above a certain level of wind speed (usually around 25 m/sec), the pressure on the
rotors create risk of structural damage and hence the blades are stopped.
4.4.5 While companies are improving their intra-day forecasting of wind speeds and hence generation,
the inherent uncertainty of wind forecasting beyond the day ahead stage (i.e. next 24 hours) does
not lend itself to forward trading of what is a very unpredictable output profile. For the same
reason, the reference price for the Intermittent CfD was chosen as the Day-Ahead auction price5.
The use of a longer dated period was considered to pass too much risk onto intermittent
generators. Conversely, it was considered acceptable to leave intra-day forecasting risk with the
participant, as existing wind forecasting techniques do allow generators to have some view of
what they will likely generate over the next 24 hours.
3 The Baseline scenario represents forecast of generation in the absence of the EMR (hence represents the “baseline“
against which EMR impacts are estimated). The Central Scenario is the current main forecast given the EMR programme.
4 Circa 7% of “Other Renewables” according to the current Duke Statistics.
5 As determined by the Virtual Hub under the NWE market coupling arrangements.
0
0.2
0.4
0.6
0.8
1
1.2
1 3 5 7 9 11 13 15 17 19 21 23 25 27 29
Ou
tpu
t
m/Sec
Cut-In Max Cut-Out
Liquidity Options Analysis
Prepared for DECC 20 of 142
May 2013
4.4.6 The intermittent CfD strongly reinforces the focus on Day-Ahead trading for intermittent
capacity. A generator will be able to achieve strike price under the contract, provided it is able to
physically trade its expected generation at the contract reference price. Hence, the least risky
behaviour under this contract is to leave positions open until the Day-Ahead stage. It follows that
the increase in the share of generation produced from intermittent sources must be expected to
reduce the demand for forward trading and hence, everything else being equal, have a
dampening effect on overall market liquidity.
4.4.7 It is possible that some of this negative impact could be mitigated through the emergence of
aggregators, which are able to create a wider and geographically diversified portfolio. However,
in our view it is unlikely that even a widely geographically diversified portfolio will render
sufficient stability of generation (i.e. average wind speed) to accommodate and incentivise
substantive forward trading. As part of our work on the CfD design for DECC, we briefly looked at
wind speed data across the GB and we did not find substantive evidence of strong portfolio
effects6. However, we recommend that DECC undertake a more in-depth analysis of wind speed
data to confirm (or reject) this hypothesis.
Decreased predictability of peaks
4.4.8 Increased intermittency within the GB system is also likely to make peak generation requirements
more weather (as opposed to time of day) dependent. While customer demand is broadly likely
to continue to follow normal load patterns, the generation capacity available to meet such load
will depend on whether (or not) the wind is blowing. Hence, high price periods may occur as a
result of very low (or very high) wind conditions and hence become less predictable as the
amount of intermittent generation sources on the system increases.
4.4.9 In our view, this has the potential to reduce the relevance of existing peak and shape products
which are defined in accordance to (fixed) time periods. Conversely, it may increase the demand
for options (or one-way CfDs) which protect the buyer from prices over a defined (peak) price
threshold (strike price) rather than during specific time periods. This suggests that liquidity
interventions which specifically focus on the existing peak products could be at risk of missing
their objective.
Increased dispatch uncertainty for non-intermittent generation
4.4.10 The final impact of increased intermittency concerns the running regime for non-intermittent
plant operating in the baseload or in the lower end of the mid-merit. Plant which otherwise
would be expecting to operate constantly in the baseload or be predictably dispatched in merit
order7 may find itself pushed out temporarily when the wind blows8. In turn, this increased
despatch uncertainty could have an (albeit probably limited) impact on such player’s appetite for
contracting forward.
6 This analysis, which was carried out during our year-long engagement on the design of Low Carbon CfDs, was based on
review of historic wind-speed data from a wide range of geographical locations across the UK.
7 At current prices this includes, for example, most coal-fired capacity in addition to the nuclear fleet.
8 I.e. between 14 and 25 m/sec.
Liquidity Options Analysis
Prepared for DECC 21 of 142
May 2013
A rough estimate
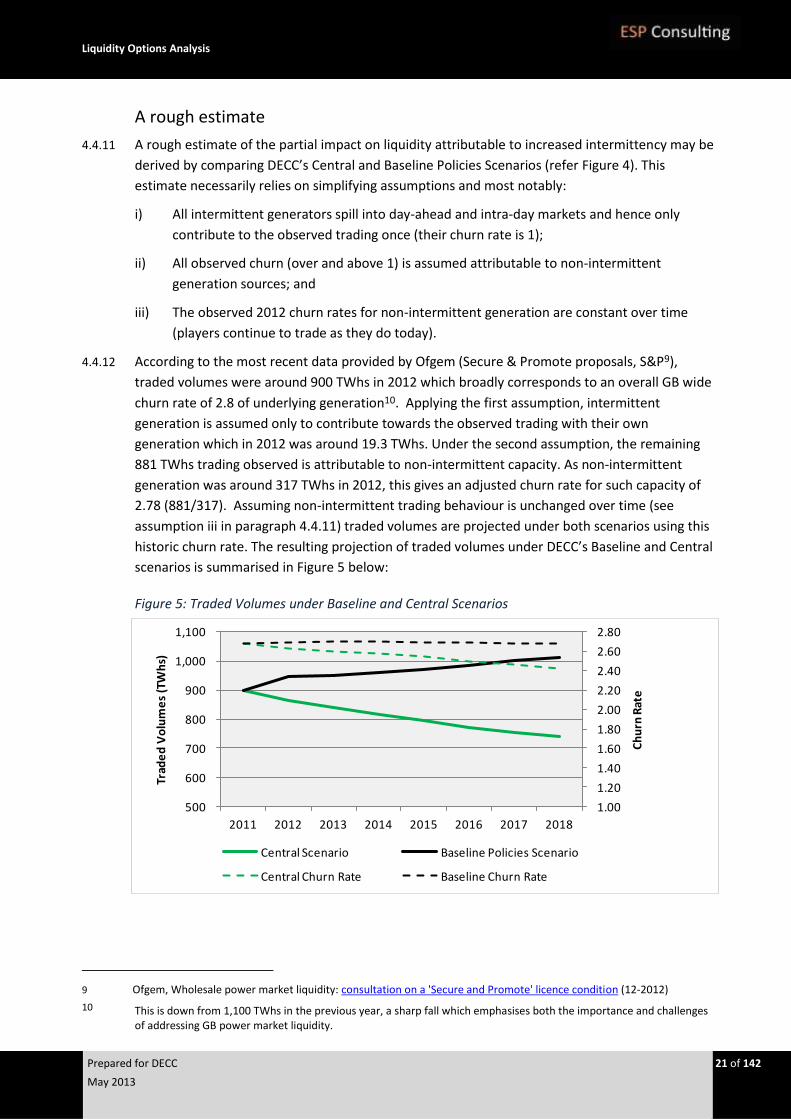
4.4.11 A rough estimate of the partial impact on liquidity attributable to increased intermittency may be
derived by comparing DECC’s Central and Baseline Policies Scenarios (refer Figure 4). This
estimate necessarily relies on simplifying assumptions and most notably:
i) All intermittent generators spill into day-ahead and intra-day markets and hence only
contribute to the observed trading once (their churn rate is 1);
ii) All observed churn (over and above 1) is assumed attributable to non-intermittent
generation sources; and
iii) The observed 2012 churn rates for non-intermittent generation are constant over time
(players continue to trade as they do today).
4.4.12 According to the most recent data provided by Ofgem (Secure & Promote proposals, S&P9),
traded volumes were around 900 TWhs in 2012 which broadly corresponds to an overall GB wide
churn rate of 2.8 of underlying generation10. Applying the first assumption, intermittent
generation is assumed only to contribute towards the observed trading with their own
generation which in 2012 was around 19.3 TWhs. Under the second assumption, the remaining
881 TWhs trading observed is attributable to non-intermittent capacity. As non-intermittent
generation was around 317 TWhs in 2012, this gives an adjusted churn rate for such capacity of
2.78 (881/317). Assuming non-intermittent trading behaviour is unchanged over time (see
assumption iii in paragraph 4.4.11) traded volumes are projected under both scenarios using this
historic churn rate. The resulting projection of traded volumes under DECC’s Baseline and Central
scenarios is summarised in Figure 5 below:
Figure 5: Traded Volumes under Baseline and Central Scenarios
9 Ofgem, Wholesale power market liquidity: consultation on a 'Secure and Promote' licence condition (12-2012)
10 This is down from 1,100 TWhs in the previous year, a sharp fall which emphasises both the importance and challenges of addressing GB power market liquidity.
1.00
1.20
1.40
1.60
1.80
2.00
2.20
2.40
2.60
2.80
500
600
700
800
900
1,000
1,100
2011 2012 2013 2014 2015 2016 2017 2018
Ch
urn
Rat
e
Trad
ed
Vo
lum
es
(TW
hs)
Central Scenario Baseline Policies Scenario
Central Churn Rate Baseline Churn Rate
Liquidity Options Analysis
Prepared for DECC 22 of 142
May 2013
4.4.13 In conclusion, assuming intermittent generation does not trade forward, while all other players
continue to trade as they do today, then increased intermittency is likely to reduce liquidity
materially.
4.5 Market Coupling and Physical Interconnection
4.5.1 Market coupling and alignment to the EU Target Model is due to be implemented across the
North Western European (NWE) region from 2014, with the exception of the Single Electricity
Market (SEM) region11 which will join in 2016. This initiative will introduce:
i) A single (Nordpool-inspired) price algorithm for Day-Ahead auctions across the entire NWE
region;
ii) Implicit allocation of interconnection capacity consistent with zonal price differentials
resulting from the daily auction process (so no more capacity bookings); and
iii) A single GB hub for Day-Ahead trading which consolidates the N2EX and APX exchanges to
create a single GB wide Day-Ahead bid/offer curve (which is then submitted to the central
price algorithm).
4.5.2 In terms of general market development, this is undoubtedly a very significant and positive step.
However, in our view any positive impact on GB liquidity is likely to be relatively modest in the
foreseeable future (next 4-6 years) and mainly limited to:
i) The creation of a single Day-Ahead hub which may serve to solidify and lock-in recent
progress in (N2EX) Day-Ahead volumes12 since access to the interconnections will be via
one of the day-ahead auctions (APX in addition to N2EX) ;
ii) Avoiding counter-flows against prevailing price differentials with the introduction of
implicit capacity allocations; and
iii) The creation of a single integrated price zone across the GB and SEM regions post 2016.
4.5.3 While these improvements are important, market coupling will not deliver the same magnitude
of stimulus seen, for example, when Nordpool was expanded to include the entire Nordic region.
There are two principal reasons for this conclusion:
i) The GB interconnections are already close to maximum utilisation; and
ii) Relative to domestic generation, both existing and planned expansions of GB
interconnection capacity is nowhere near the levels enjoyed in the Nordic region or
between the major Continental price regions.
4.5.4 Table 1 below compares national interconnection capacities in the Nordpool and GB/SEM regions
as a proportion of the total domestic generation capacity. As illustrated, the level of
interconnection to surrounding markets is far greater across the Nordics. For the GB market to
enjoy similar level of interconnection, 10-15 GWs of additional interconnection capacity to the
Continent would be required. This is vastly more than current level of planned (or remotely likely)
11 The SEM region comprises Northern Ireland and the Republic of Ireland.
12 In particular as access to the interconnections now go through the Day-Ahead auctions.

Liquidity Options Analysis
Prepared for DECC 23 of 142
May 2013
investments over the next 4-6 years. Hence, we conclude the spot prices will substantially remain
determined by local GB system conditions and forward liquidity will likewise mainly be
determined by local liquidity. By the same token, however, it is also likely that the convergence
between the SEM and GB markets with the commissioning of the East-West interconnection will
continue to gather pace once both are aligned to the EU Target model13.
Table 1: Interconnection in Proportion of Total Domestic Generation Capacity1
1) Source: NordReg - Nordic Market Report 2012
4.6 GB Trading Arrangements
Cash-Out Reform
4.6.1 While cash-out arrangements in the balancing market (BM) typically are viewed as a serious risk
by market participants, recent history has been relatively benign. Figure 6 below compares the
distribution of the spreads between System Buy (SBP) and System Sell (SSP) prices from May
2010 to February 2013 and from September 2008 to September 200914. As illustrated, the
distribution of the more recent SBP/SSP data is considerably narrower, generally suggesting a
lower level of balancing market risk.
Figure 6: SBP/SSP Spreads
4.6.2 While there are a number of factors that contribute to this development, the most important is in
our view the current high levels of excess (flexible) CCGT capacity in the GB power system. With
Flue Gas Desulphurisation (FDG) equipped coal units running baseload and the reliability of the
13 We understand from industry sources that the East-West Interconnection in its early days of trading are already seeing
lower SEM/GB spreads than previously.
14 The SBP/SSP distributions in each graph are computed from the individual half-hours within each of the two periods.
Nordpool GB/SEM
Denmark Finland Norway Sweden Lithuania Estonia GB SEM
Denmark 0% 3% 7% 0% 0% GB 9%
Finland 0% 0% 7% 0% 13% SEM 1%
Norway 7% 0% 10% 0% 0% Continent 4% 0%
Sweden 14% 17% 13% 0% 0% Total 5% 9%
Lithuania 0% 0% 0% 0% 28%
Estonia 0% 2% 0% 0% 21%1) Where import and export capacities
Nordpool 22% 19% 16% 24% 21% 41% differ, import capacities are applied
Continent 11% 0% 2% 3% 0% 0%
Total 33% 19% 18% 27% 21% 41%
0.0%
10.0%
20.0%
30.0%
40.0%
50.0%
0 -10
10 -20
20 -30
30 -40
40 -50
50 -60
60 -70
70 -80
80 -90
90 -100
100 -200
200 -210
>300
0.0%
10.0%
20.0%
30.0%
40.0%
0 -
10
10 -
20
20 -
30
30 -
40
40 -
50
50 -
60
60 -
70
70 -
80
80 -
90
90 -
100
100 -
200
200 -
300
>300
£/MWh
SBP/SSP SpreadSep 2008 - Sep 2009
Sep 2008 - Sep 2009May 2010 - Feb 2013
Source: Elexon and ESP analysis
Liquidity Options Analysis
Prepared for DECC 24 of 142
May 2013
GB nuclear fleet much improved in recent years, CCGTs are being pushed out of merit. Some gas
plants are forced to rely on the SBP/SSP spread to make (any) money, leading to highly
competitive bidding behaviour in the balancing market.
4.6.3 In our view, the current benign market state cannot be relied upon to persist. While the impact of
the Large Combustible Plant Directive (LCDP) on non-FDG units is probably already factored into
the market, the current glut of CCGT capacity is not commercially viable in the longer term. It
seems likely that such capacity will increasingly become candidate for mothballing15. Combined
with increased intermittency on the system resulting from EMR, withdrawal of significant
amounts of capacity could increase the risk of experiencing periods with serious pressure on
system margins.
4.6.4 Notwithstanding the current benign state of the market, balancing market risk remains a driver of
VI business models (refer next section) and a potential barrier to entry, in particular in the
upstream. Operators of few, but large, units are particularly exposed to significant market
imbalances when experiencing forced outages. The dual price design of the balancing market can
expose such players to material financial penalties in particular as:
i) A large imbalance may take multiple bids into the balancing market stack to clear the
volume lost due to a big outage event; and
ii) Return to “normal” market prices can take hours or even days due to prompt feedback
loops.
4.6.5 While the balancing market incentivises reliability, such events are certainly not entirely
controllable and represent ex-ante a stochastic risk for all generators. Likewise, for intermittent
generation balancing market risk is a continuous additional cost which in turn is a key rationale
for the (often steep) PPA discounts charged by the larger players in return for taking on third
party developed and owned wind capacity. In our view, balancing market risk remains a material
concern to market participants and a potential barrier to entry as well as investment.
4.6.6 This conclusion is not inconsistent with the “missing money” problem, namely that the monies
available across the industry are insufficient to remunerate sufficient capacity to be available. We
understand that Ofgem, as part of its ongoing Significant Code Review, is considering a further
sharpening of balancing market price incentives in part in view of this concern. In our view,
however, the increased risk accompanying such a change would likely serve to increase barriers
to entry for new players in both generation and supply and potentially also exacerbate the
missing money problem itself. Investors are unlikely to invest on very spiky, but equally very rare,
prices and may well require larger capacity payments as insurance against the associated higher
balancing market risk.
4.6.7 The missing money problem is not just a question of the total level of remuneration, but also a
function of the uncertainty (risk) on revenue streams. In our view, any reform of the cash-out
mechanism therefore needs to distinguish clearly between the total monies required to
remunerate sufficient capacity to ensure system reliability and how such monies are factored into
market prices. Addressing the missing money problem need not require imposition of increased
15 In so far that this is viewed as an undesirable outcome, it is in itself a reason for the introduction of capacity payments.
Liquidity Options Analysis
Prepared for DECC 25 of 142
May 2013
(and to some extent uncontrollable) price risk on participants. Indeed, we suspect this is likely to
lead to less efficient outcomes for the industry as a whole.
Capacity Payments
4.6.8 The introduction of capacity payments is a fundamental change in the GB market design. In our
view, it is arguably the single biggest market event, since the launch of NETA, with structural
impact that extends far beyond other EMR components including the introduction of low carbon
CfDs.
4.6.9 A change of this nature will almost certainly impact liquidity, but the direction of such impacts is
not certain. Prima facie, increased P&L certainty for generators may:
i) Reduce entry barriers (hence support long term liquidity generation)
ii) Take some of the pressure off the cash-out mechanism (refer discussion above) if more
flexible plant are able to continue to operate, as well as help address the “missing money
problem”; but also
iii) Diminish incentives for hedging of generation positions making generators more willing to
“ride” short term markets.
4.6.10 The net sum of these impacts is hard to predict, although other power markets with capacity
payments tend to exhibit low forward churn (e.g. SEM). However, in most cases these markets
have developed around mandatory gross pools, a market design that inherently struggles to
generate forward liquidity.
4.6.11 The move away from an “energy only” market to a dual market for energy and capacity may also
impact:
i) Product pricing and definition as the reference prices are adjusted to account for capacity
payments (and may reopen existing contracts at cut-over to new arrangements);
ii) Spark spreads in the GB power market and hence the interface to NBP; and
iii) Interconnection flows with coupled neighbouring energy only markets.
4.6.12 These impacts depend critically on whether these payments:
i) In one extreme add what is currently “missing money” – i.e. increases the cake; or
ii) In the other extreme, leave total industry revenues unchanged but split value into two
components reducing energy price levels relative to the “energy only” market.
4.6.13 While neither of these extremes is likely to eventuate, an outcome closer to the first extreme is in
our view less likely to create distortions on the commercial incentives and dispatch on trading
with neighbouring markets . Since the capacity payments (in this scenario) adds monies, the
drivers of relative prices (spreads) to NBP and neighbouring power markets are (broadly)
maintained. In contrast, outcomes closer to the second extreme scenario have the potential to
materially change relative prices as the current level of revenue is split into two components.
4.6.14 In this (extreme) scenario, spark (and other fuel) spreads would be reduced potentially distorting
despatch signals for international trades. Likewise, the spreads to (as yet) energy-only continental
markets would favour exports and GB capacity payments could end up subsidising generation
Liquidity Options Analysis
Prepared for DECC 26 of 142
May 2013
costs in those markets. This type of structural inconsistency already exists between the SEM and
GB market, which is why Irish exports/imports are subject to a surcharge/uplift, but such
corrections will not be possible under the implicit capacity allocations required by the EU Target
Model. Of course, this concern rests on the near-continental market continuing to trade on an
energy-only basis. However, the UK is not alone in contemplating introduction of capacity
payments. Were all neighbouring countries to adopt such an approach, this would mitigate (and
possibly eliminate) the potential for such distortions. Having chosen to go down this route, in our
view, it is now in DECCs interest to argue strongly for inclusion of capacity payments under the EU
Target Model (to ensure consistent design and application).
4.7 Low Carbon Reforms
Low Carbon CfDs
4.7.1 While the Low Carbon CfDs depend on robust (liquid) reference prices, these contracts will also
stimulate liquidity in the products they reference.
4.7.2 The amount of (basis) risk under any CfD depends critically on the access to trade/hedge the
underlying reference price. Provided that the CfD owner is able to trade the underlying reference
price, the hedge remains intact and the CfD owner will receive the strike price for the contract
volume. In contrast, if the CfD Owner is not able to trade at the reference price, basis risk is
created between the value of the market revenue received and the difference payments16.
4.7.3 Provided that the CfD reference price benchmark is tradable and avoids products that cannot be
readily accessed, these instruments will direct liquidity towards their own benchmark. While this
does not necessarily increase traded volume, it provides DECC with a strong instrument for
directing liquidity along the curve as further discussed in Chapter 13.
GB Carbon price Floor
4.7.4 While the carbon price floor will not impact liquidity directly, it may indirectly influence trading
through:
i) Changing relative prices between the GB and neighbouring markets (making the GB market
a relatively higher priced market); and
ii) The uncertainty that exists with respect to how the floor is revised and set following the
initial 2 year window.
4.7.5 In our view, the second item above does potentially constrain forward trading. We are aware of
companies which have prohibited their traders to trade beyond the point at which the carbon
floor is certain.
16 i.e. these components will not add up to the strike price value.
Liquidity Options Analysis
Prepared for DECC 27 of 142
May 2013
5 Industry Structure & Business Models
5.1 Introduction
5.1.1 This section examines the liquidity impact of the GB industry structure including typical business
models and the level of vertical integration:
Section 5.2 compares the GB industry structure with the Nordic and Continental markets;
Section 5.3 considers the trading incentives under typical business models deployed within
the GB market;
Section 5.4 summarises the main drivers for vertical integration; and
Section 5.5 finally provides estimates of the level of integration across the Big 6.
5.2 GB Industry Structure & Concentration
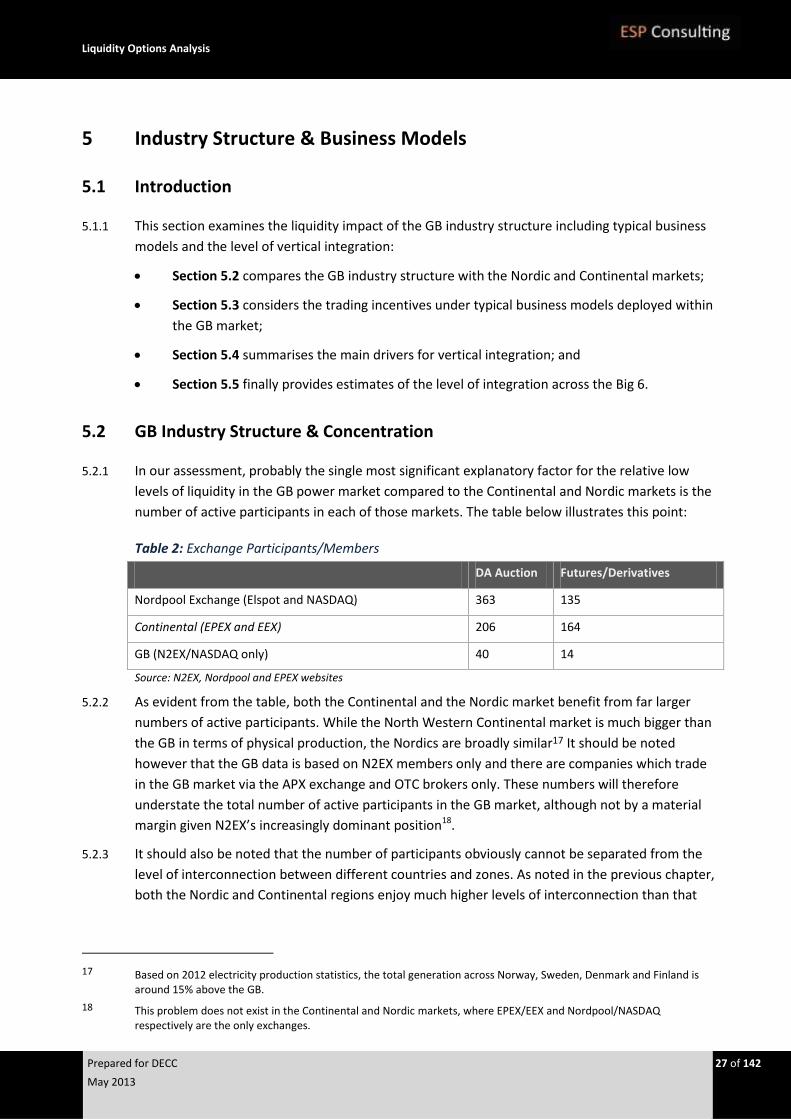
5.2.1 In our assessment, probably the single most significant explanatory factor for the relative low
levels of liquidity in the GB power market compared to the Continental and Nordic markets is the
number of active participants in each of those markets. The table below illustrates this point:
Table 2: Exchange Participants/Members
DA Auction Futures/Derivatives
Nordpool Exchange (Elspot and NASDAQ) 363 135
Continental (EPEX and EEX) 206 164
GB (N2EX/NASDAQ only) 40 14
Source: N2EX, Nordpool and EPEX websites
5.2.2 As evident from the table, both the Continental and the Nordic market benefit from far larger
numbers of active participants. While the North Western Continental market is much bigger than
the GB in terms of physical production, the Nordics are broadly similar17 It should be noted
however that the GB data is based on N2EX members only and there are companies which trade
in the GB market via the APX exchange and OTC brokers only. These numbers will therefore
understate the total number of active participants in the GB market, although not by a material
margin given N2EX’s increasingly dominant position18.
5.2.3 It should also be noted that the number of participants obviously cannot be separated from the
level of interconnection between different countries and zones. As noted in the previous chapter,
both the Nordic and Continental regions enjoy much higher levels of interconnection than that
17 Based on 2012 electricity production statistics, the total generation across Norway, Sweden, Denmark and Finland is
around 15% above the GB.
18 This problem does not exist in the Continental and Nordic markets, where EPEX/EEX and Nordpool/NASDAQ respectively are the only exchanges.

Liquidity Options Analysis
Prepared for DECC 28 of 142
May 2013
available between the GB and the Continent. By the same token, however, this does not explain
the stark differences in the table above.
5.2.4 The large number of active participants within the Nordic region owes much to the historically
disaggregated and dispersed industry structure of the Norwegian power sector comprising
numerous municipality operations and smaller independent participants including large
consumers. Nordpool, which was founded in Norway (then as Statnett Market), was initially
established and developed to serve this wide community. Furthermore, while the power industry
in other Nordic countries have consolidated much as in the GB, concession rules and municipal
ownership have limited this process in Norway.
5.2.5 Another reason is the presence of large reservoir hydro capacity. Such capacity offers great
physical flexibility in the despatch horizon which tends to smooth spot price volatility compared
to a thermal dominated system. This more benign pricing environment improves the ability of
smaller trading entities to enter and operate in the market.. It has also encouraged far more
consumers to participate in the market (typically via retail brokers). This combination of the
physical flexibility of the Norwegian system and a diverse industry structure was an essential
ingredient in the birth and initial growth of this exchange. The extent of interconnection was
critical for its subsequent highly successful expansion across the Nordic region.
5.2.6 While the French and the Belgium power sectors were historically highly concentrated, the
German market was also dominated by numerous small municipalities and Statwerke at the time
of liberalisation. These numbered in the hundreds and this diverse industry structure has
undoubtedly benefited the development of what later would become the EPEX exchange. As in
the case of Nordpool (and even more so), the high level of interconnection was subsequently
critical to the merger of the French and Belgium exchanges with EEX. Today, the EEX and EPEX
exchanges dominates pricing far beyond the borders of the founding countries (e.g. into
Switzerland, Austria and Czech Republic).
5.2.7 While the GB wholesale market is not particularly concentrated (based on competition
measures), it never benefitted from the participation of numerous smaller players, so critical to
the initial growth of the Norwegian and German markets. Undoubtedly, this is in part a reflection
of the industry structure pre privatisation and the absence of smaller independent players at the
time of liberalisation. Following the influx of US merchant generators in the late nineties and the
subsequent launch of NETA, liquidity did improve considerably as explained in the introduction to
this report. However, this stimulus was subsequently lost in the wake of the demise of Enron and
the exit of the US players. Apart from major investments in interconnection capacity to the
Continent (refer previous chapter), the key sustainable solution to the underlying industry
structure outlined above is to encourage new entry and we agree with the Government’s
prioritisation of this objective. In this regard we note that there are signs of a revival in merchant
generation operations as discussed in the following section. With the commodity trader Vitol’s
very recent announcement of their acquisition of the Immingham power plant, this positive
development seems to be gathering pace.
Liquidity Options Analysis
Prepared for DECC 29 of 142
May 2013
5.3 Typical GB Business Models
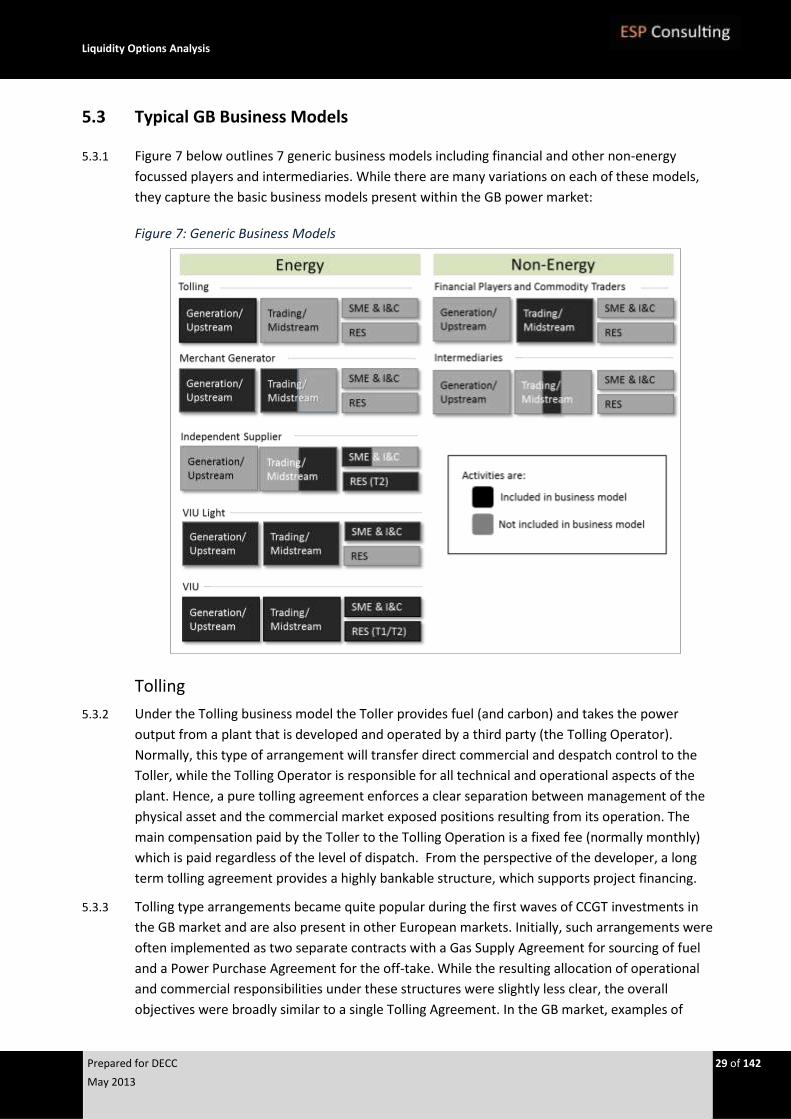
5.3.1 Figure 7 below outlines 7 generic business models including financial and other non-energy
focussed players and intermediaries. While there are many variations on each of these models,
they capture the basic business models present within the GB power market:
Figure 7: Generic Business Models
Tolling
5.3.2 Under the Tolling business model the Toller provides fuel (and carbon) and takes the power
output from a plant that is developed and operated by a third party (the Tolling Operator).
Normally, this type of arrangement will transfer direct commercial and despatch control to the
Toller, while the Tolling Operator is responsible for all technical and operational aspects of the
plant. Hence, a pure tolling agreement enforces a clear separation between management of the
physical asset and the commercial market exposed positions resulting from its operation. The
main compensation paid by the Toller to the Tolling Operation is a fixed fee (normally monthly)
which is paid regardless of the level of dispatch. From the perspective of the developer, a long
term tolling agreement provides a highly bankable structure, which supports project financing.
5.3.3 Tolling type arrangements became quite popular during the first waves of CCGT investments in
the GB market and are also present in other European markets. Initially, such arrangements were
often implemented as two separate contracts with a Gas Supply Agreement for sourcing of fuel
and a Power Purchase Agreement for the off-take. While the resulting allocation of operational
and commercial responsibilities under these structures were slightly less clear, the overall
objectives were broadly similar to a single Tolling Agreement. In the GB market, examples of
Liquidity Options Analysis
Prepared for DECC 30 of 142
May 2013
existing CCGTs operated on a tolling basis include ESB International’s (ESBI) Marchwood plant, for
which SSE is the Toller, as well as InterGen’s Spalding plant, which is contracted to Centrica under
a long term PPA19. The PPA structures backing various renewable projects are also based on this
premise, namely clear separation of the construction of the wind and other renewable capacity
and the commercial management and optimisation.
5.3.4 The demand for standard tolling structures for large scale thermal capacity is drying out and
there are few recent examples (Marchwood being the latest we are aware of). In part, this
reflects that the Big 6 today have the expertise necessary to develop and construct such plants.
From their perspective, a tolling agreement imposes unwarranted and unnecessary contractual
complexity which (however well drafted) inevitably reduces commercial flexibility and control
compared to own operated capacity. In today’s market, tolling arrangements will typically
require special features (i.e. green power, ROCs and/or location) or grant the Toller an equity
share in the asset. For example, the ESBI developed Marchwood CCGT is owned 50% by SSE.
5.3.5 While the Tolling Operator, which developed and constructed the plant, will not trade the output,
such plant will contribute to liquidity as part of the Toller’s (off-taker’s) asset and contractual
portfolio. In this respect the liquidity impact of this type of contractual structure is broadly
neutral and dependent on the trading activities of the particular Toller.
Merchant Generator
5.3.6 By a Merchant Generator, we refer to a generator without a (material) downstream business
which seeks to earn its revenues directly in the wholesale market (i.e. has no long term PPA or
tolling agreement). While this model became very popular in the late 90s and early 00s, the
slump in wholesale prices in 2002-2004 demonstrated its inherent vulnerability which in turn led
to exit of many of the US merchant players as well as the sale of British Energy, the single largest
merchant operation. Combined with the consolidation of much of this capacity within wider VIU
(Big Six) portfolios, the demise of these players coincided with, and was undoubtedly a significant
cause of, the sharp drop in churn rates witnessed in the aftermath of the launch of NETA market.
5.3.7 In the current market, Drax remains the largest single Merchant Generator, notwithstanding that
the company acquired the Haven supply business as well as entered into long term off-take
agreements with Centrica. Arguably, one might also classify the tolling arrangement for
Eggborouogh as a merchant position under Bank of America Merrill Lynch’s management since
this plant has not been merged into a wider portfolio. Likewise, Macquarie Bank has recently
bought thermal stations, namely Baglan (from GE) and Sutton Bridge (from EDF) while also
upgrading its GB power trading team. The recent Macquarie acquisitions may suggest a revival of
the merchant model led by pension funds and infra-structure developers. As the sharp reduction
in liquidity following Neta suggest, in our view little doubt that such capacity did, and still do,
contribute positively to liquidity in the GB market. Managing a physical spark or dark spread
exposure in the GB market which is in-the-money (i.e. in base or mid-merit) will require frequent
adjustment of hedges in response to changes in expected generation. The amount of trading
stimulated by such changes as well as delta hedging strategies will in general greatly exceed that
of stand-alone downstream operations
19 ESB International is an example of a company which has pursued a tolling strategy to support its CCGT development
programme and, for example, also owns and operates CCGTs on a tolling basis in Spain.
Liquidity Options Analysis
Prepared for DECC 31 of 142
May 2013
Independent Supplier
5.3.8 The Independent Supplier business model covers sales of power to retail and commercial
customers sourced directly in the wholesale market, without the backing of substantial upstream
asset positions. Hence, this business model incorporates trading (purchasing) and sales
functionsas well as all back-office operations required to manage, settle and bill customers. While
the Trading/Purchasing function will include hedging and sourcing of sales positions it need not
include full 24/7 operations, as such services can (and are) acquired through intermediaries such
as E2420.
5.3.9 The Independent Supplier is dependent on the downstream margin between end-customer prices
and the wholesale cost of sourcing and delivering such power (including transmission and
distribution costs, as well as balancing and management of volume risks in the delivery
timeframe). A number of Independent Suppliers emerged post full deregulation in 1998, but
many of these subsequently failed and had their licence revoked by Ofgem or transferred to a
larger entity21. For a while this left only specialist (green) operations such as Smartest, but more
recently general supply operations have re-emerged. Most notably this includes Ovo Energy, Co-
op and Good Energy which have succeeded in acquiring and retaining portfolios of domestic
power and gas customers as well as smaller SMEs in direct competition with the Big 6. These new
entrants have emerged during a period of relative calm in the wholesale market and may face
additional challenges in more volatile conditions. In these circumstances, limited access to
products to hedge peaks and shape ahead of delivery could expose these companies to material
risks. Likewise, more volatile prices would increase exposure to greater and more onerous margin
calls for collateralised positions.
5.3.10 Irrespective of the success of Ovo and Good Energy, the Independent Supplier remains an
exposed business model. Firstly, all customers on the Independent Suppliers’ books have (by
definition) moved supplier at least once. In general, acquiring such “Tier 2” customers is a highly
competitive and low margin business. In contrast, the Big 6 still retain a sizeable “Tier 1” portfolio
comprising customers which have never changed supplier. Tier 2 customers are far more price
sensitive and do not (remotely) yield the price stability enjoyed by the Big 6 on their Tier 1
portfolio which tend to exhibit “stickiness” when prices fall.
5.3.11 Secondly, the Independent Supplier is far more exposed to internal shifts in the value chain than
an integrated player. Whereas the VIU can absorb shifts in wholesale prices, which are partially or
wholly offset by up- and downstream margins, the Independent Supplier model is exposed to the
full impact of such shifts. Hence, the Independent Supplier will need to follow wholesale prices up
(and down) to retain positive margins and will in general not have scope for under-recovery of
margins over any sustained period of time. It is important to note that the VIU’s ability to absorb
internal value chain shocks is a genuine advantage of this business model (which does not rely on
cross-subsidisation or other discriminatory behaviour).
5.3.12 Finally, Independent Suppliers are invariably cash constrained. While some may require pre-
payment under direct debit mandates, these companies have to manage their working capital
20 See http://www.pxlimited.com/index.php/services/energy-management.html
21 For example, Atlantic, Eledor, Maverick, Utility Link and Zest had their licences revoked while Energy 4’s licence was transferred to Centrica.
Liquidity Options Analysis
Prepared for DECC 32 of 142
May 2013
tightly. Truly independent operations, which are not supported by a larger parent22, will in
general be rated well below investment grade and hence have limited recourse to external
finance at competitive rates. As such, management of cash flow uncertainty under margining
terms is a key concern.
5.3.13 With respect to trading, we would expect that most Independent Suppliers contribute less to
churn than the industry on average. While these operations may engage in more sophisticated
trading and hedging strategies than simply outright purchasing, by and large the overall objective
is to lock in margin at the time of customer acquisition. Hence, we would expect churn rates in
this segment to be relatively low (i.e. below 2) and lower than Merchant Generators.
VIU Light
5.3.14 The VIU Light business model effectively combines the Merchant Generator with a supply
business, typically (but not necessarily) focussed on larger I&C and commercial accounts. These
customer segments are both highly price competitive and the main motivation for adopting this
model is to improve the ability of structurally-long players to:
i) Manage collateral and liquidity risks: As discussed above, the margining risk on a long
structural position under a pure merchant business model is potentially very substantial.
However, the addition of a supply business provides a channel to market for the generation
output which is essentially collateral and margining free; and
ii) Camouflage Trading Intentions: Bringing a (naked) structural long position into a market
with limited depth may expose the merchant generator to unfavourable pricing terms. As
the market knows a merchant generator has a structurally long underlying position which
must be sold, counterparties may identify a distressed seller and therefore not feel the
need to bid their most competitive prices. Adding a supply business to a structural long
position improves the ability to camouflage trading intentions and hence manage these
risks.
5.3.15 These benefits were a key reason British Energy (BE, prior to the take-over by EDF Energy)
developed what ended up being the single largest I&C portfolio23. Without the ability to push a
large portion of the nuclear generation through this channel, BE would have been in even greater
difficulty. Other previously pure-merchant players have also moved downstream including, for
example, Drax with the acquisition of Haven Energy.
5.3.16 While the VIU Light model reduces the need to trade/sell all of the structural long positions
through the wholesale market, it equally increases the ability to manage market exposed
positions and resulting collateral positions more effectively. It is difficult to judge the net result of
these two impacts, but we suspect that the VIU Light model, if anything, contributes more to
churn than the pure merchant model.
22 Smartest Energy is an example of an Independent Supplier which is backed by a strong parent (Marubeni).
23 Around 35 TWhs and hence over 50% of the annual nuclear output.

Liquidity Options Analysis
Prepared for DECC 33 of 142
May 2013
VIU
5.3.17 The VIU business model extends the VIU Light model, discussed above, to include residential
customers. The VIU model describes the Big 6 in the UK market and is discussed in-depth in the
section 5.4 below.
Financial Players and Commodity Traders
5.3.18 The main financial players involved in GB power include Morgan Stanley, Merrill Lynch, Barclays
and JP Morgan. Deutsche Bank recently closed their London desk, but other players such as
Macquarie Bank appear to be gearing up on the back of upstream acquisitions. Our industry
sources suggest that financial players currently trade somewhere between 10%-20% of total
markets volumes. Another related, but distinct, category of players is commodity trading houses
such as Vitol and Glencore. While very big in oil, gas and coal internationally, we understand
(from the same source) that their involvement in the GB market is very limited at present. In our
view, this is a fairly strong signal that the GB power market liquidity is not considered sufficient to
support the type of outright commodities trading these companies specialise in.
5.3.19 Finally, some new funds have started trading GB power, although these players do not make up
for the loss of similar players over the last 2-3 years.
5.3.20 The very nature of the business of both financial players and commodity trading houses is trade
and churn (proprietary) positions. While the contribution from this segment at present is limited,
they represent a considerable potential for bolstering market churn rates and liquidity. By the
same token, it is noteworthy that some of these players now are acquiring upstream asset
positions and hence no longer rely solely on (proprietary) trading. Given the physical nature of
the BETTA market, without any liquidity interventions, we struggle to see why the financial
players and commodity houses would materially increase their current level of activity.
Intermediaries
5.3.21 We take the Intermediary business model to cover three categories of players in the GB power
market:
i) Brokers;
ii) Companies that offer dedicated operational and transaction services on an agency basis;
and
iii) Existing (typically large) industry players which in addition to their own business, offer third
party risk management and transaction services.
5.3.22 While OTC brokers’ business models are self-explanatory, the second category is less well
defined. This category covers companies which offer market access and trading, optimisation and
operational/logistic services for third parties. In the current GB market, one of the more
prominent examples of such service offerings is Energy 24 (the PX Group). Energy24 is particularly
aimed at supporting smaller participants and new entrants with both electricity and gas trading
and operations. In power, their services include 24/7 trading optimisation of generation &
demand positions as well as wider risk management and trading related services. Hence, a new
Liquidity Options Analysis
Prepared for DECC 34 of 142
May 2013
entrant supplier or generator can use such services in lieu of setting up their own 24/7 operation
from the outset.
5.3.23 The final category is those larger players which in addition to managing their own positions also
offer third party risk management, transaction services and market access. A typical client to such
service might be a large consumer who wishes to make its own trading and risk management
decisions, but does not wish to man a 24/7 desk nor develop a full suite of market access
channels. This is a well-established model in the Nordic and Central European regions, which has
played a critical role in extending wholesale market participation to large consumers and smaller
municipalities and Statwerke. It is also a model that exists in the GB market although it is less
prevalent here. Arguably, however, one might also include the PPA market for wind within this
category as a type of intermediary service24.
5.3.24 While these intermediary roles typically do not directly generate churn in their own right, there is
no doubt that such players are critical in facilitating market access for smaller players and new
entrants.
5.4 Drivers of Vertical Integration
5.4.1 While a variety of business models can be observed within the GB market, VIU and VIU Light
models are the dominant structure amongst the larger players both here and across the Nordic
and Continental markets. There are a number of sub-models of how VIUs organise themselves
internally as briefly outlined in Appendix B, but today most VIUs integrated their operations
around one centralised trading and midstream hub for all of Europe. Indeed, 3 of the Big 6 (EDF,
RWE and E.ON) trade and manage the GB wholesale market activities from a desk within a much
larger pan-European trading operations.
5.4.2 The move towards VIU models have been driven by a number of factors as outlined below in
Figure 10 and briefly discussed in the remainder of this section:
24 Albeit the PPA transfers title of power and associated volume risk to the PPA provider, so in this sense it is not a true
intermediary arrangement.
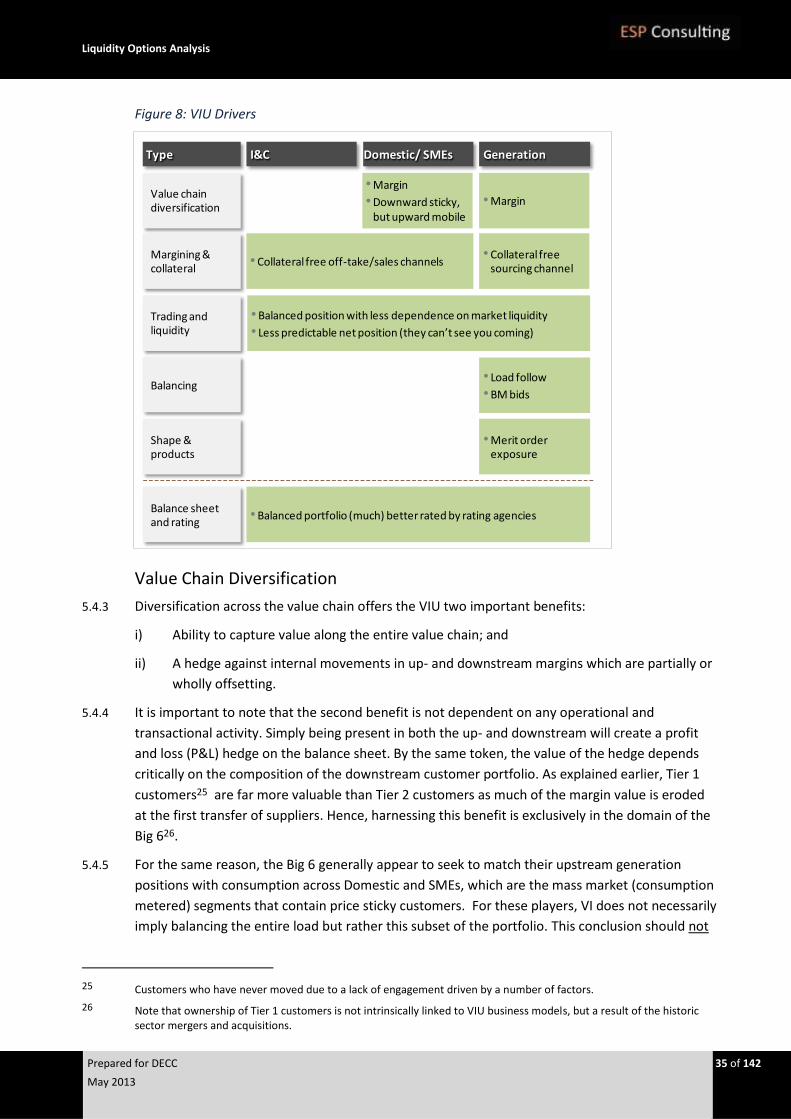
Liquidity Options Analysis
Prepared for DECC 35 of 142
May 2013
Figure 8: VIU Drivers
Value Chain Diversification
5.4.3 Diversification across the value chain offers the VIU two important benefits:
i) Ability to capture value along the entire value chain; and
ii) A hedge against internal movements in up- and downstream margins which are partially or
wholly offsetting.
5.4.4 It is important to note that the second benefit is not dependent on any operational and
transactional activity. Simply being present in both the up- and downstream will create a profit
and loss (P&L) hedge on the balance sheet. By the same token, the value of the hedge depends
critically on the composition of the downstream customer portfolio. As explained earlier, Tier 1
customers25 are far more valuable than Tier 2 customers as much of the margin value is eroded
at the first transfer of suppliers. Hence, harnessing this benefit is exclusively in the domain of the
Big 626.
5.4.5 For the same reason, the Big 6 generally appear to seek to match their upstream generation
positions with consumption across Domestic and SMEs, which are the mass market (consumption
metered) segments that contain price sticky customers. For these players, VI does not necessarily
imply balancing the entire load but rather this subset of the portfolio. This conclusion should not
25 Customers who have never moved due to a lack of engagement driven by a number of factors.
26 Note that ownership of Tier 1 customers is not intrinsically linked to VIU business models, but a result of the historic sector mergers and acquisitions.
Type I&C Generation
Value chain diversification
Domestic/ SMEs
•Margin
•Downward sticky, but upward mobile
Margining & collateral
•Collateral free off-take/sales channels •Collateral free
sourcing channel
Trading and liquidity
•Merit order exposure
Shape & products
•Balanced position with less dependence on market liquidity
• Less predictable net position (they can’t see you coming)
Balance sheet and rating
•Balanced portfolio (much) better rated by rating agencies
Balancing• Load follow
•BM bids
•Margin
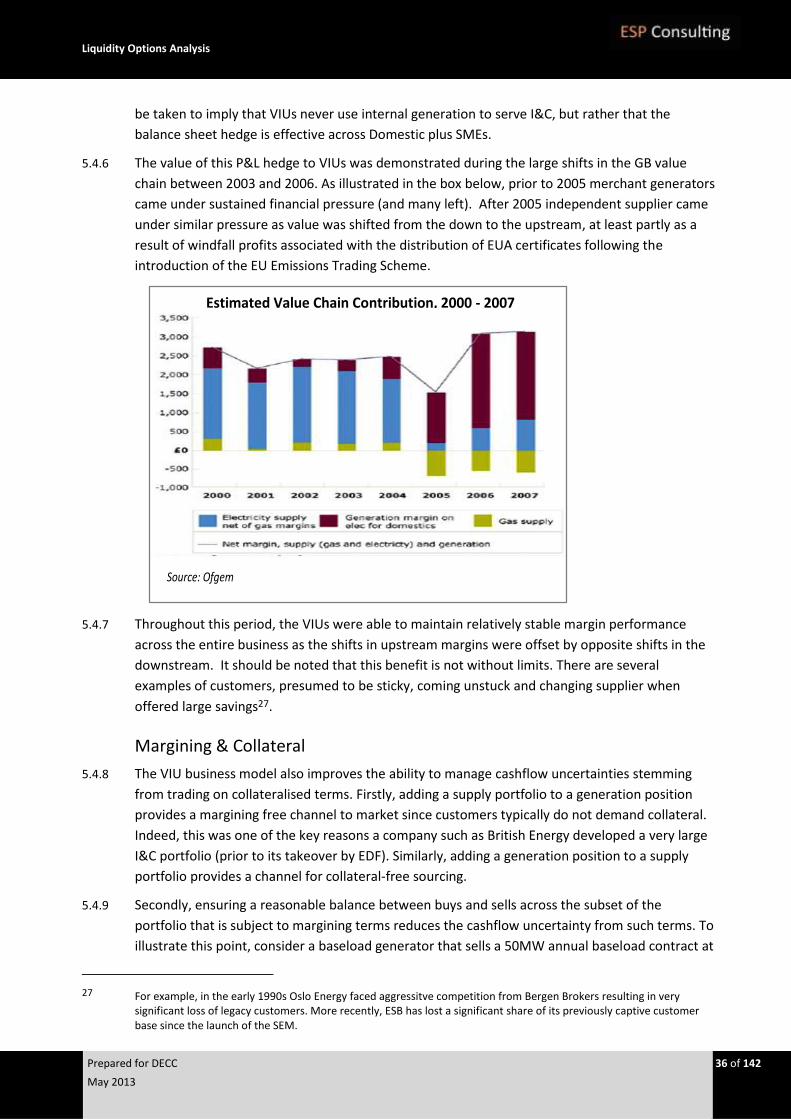
Liquidity Options Analysis
Prepared for DECC 36 of 142
May 2013
be taken to imply that VIUs never use internal generation to serve I&C, but rather that the
balance sheet hedge is effective across Domestic plus SMEs.
5.4.6 The value of this P&L hedge to VIUs was demonstrated during the large shifts in the GB value
chain between 2003 and 2006. As illustrated in the box below, prior to 2005 merchant generators
came under sustained financial pressure (and many left). After 2005 independent supplier came
under similar pressure as value was shifted from the down to the upstream, at least partly as a
result of windfall profits associated with the distribution of EUA certificates following the
introduction of the EU Emissions Trading Scheme.
5.4.7 Throughout this period, the VIUs were able to maintain relatively stable margin performance
across the entire business as the shifts in upstream margins were offset by opposite shifts in the
downstream. It should be noted that this benefit is not without limits. There are several
examples of customers, presumed to be sticky, coming unstuck and changing supplier when
offered large savings27.
Margining & Collateral
5.4.8 The VIU business model also improves the ability to manage cashflow uncertainties stemming
from trading on collateralised terms. Firstly, adding a supply portfolio to a generation position
provides a margining free channel to market since customers typically do not demand collateral.
Indeed, this was one of the key reasons a company such as British Energy developed a very large
I&C portfolio (prior to its takeover by EDF). Similarly, adding a generation position to a supply
portfolio provides a channel for collateral-free sourcing.
5.4.9 Secondly, ensuring a reasonable balance between buys and sells across the subset of the
portfolio that is subject to margining terms reduces the cashflow uncertainty from such terms. To
illustrate this point, consider a baseload generator that sells a 50MW annual baseload contract at
27 For example, in the early 1990s Oslo Energy faced aggressitve competition from Bergen Brokers resulting in very
significant loss of legacy customers. More recently, ESB has lost a significant share of its previously captive customer base since the launch of the SEM.
Estimated Value Chain Contribution, 2000 - 2007
Source: Ofgem
Liquidity Options Analysis
Prepared for DECC 37 of 142
May 2013
£50/MWh. The contract value is therefore £219 million28. Now assume that market prices rise to
£60/MWhs before deliveries start under the contract. In this scenario, the generator will have to
post £43.8 million in variation margin29.
5.4.10 Likewise, consider a supplier which buys the same contract. In this case, should prices fall by
£10/MWh (before deliveries commence), the supplier would have to post £43.8 million. Of
course prices cannot both fall and rise at the same time, but at the time of entering into the
contract neither the generator nor the supplier have any certainty about future price
movements. Hence, even if they actually traded with one another, both would have to ensure
that they have access to sufficient cash on or off balance sheet to meet and withstand such
collateral calls.
5.4.11 We now assume that the generator and the supplier are within the same VIU and that this VIU
both sold and bought the contract. Since prices cannot both go up and down at the same time,
any cash calls under one of the contracts are offset by incoming collateral postings under the
other. In practice, VIUs with large up and downstream positions will engage in the market from
both sides and the example illustrates how margining risk is reduced if the sub-set of the portfolio
which is subject to such terms is reasonably balanced.
5.4.12 Hence, the VIU model provides improved ability to balance (and, if needed, minimise) trading on
margin terms. In this respect, it is a more efficient model able to operate with lower collateral
costs. We discuss and illustrate the liquidity impact of cash margining further in Chapter 6. As
discussed below, the VIU model is also generally favoured by rating agencies over structurally
exposed players and hence tend to have better (and cheaper) access to capital.
Trading & Liquidity
5.4.13 The VIU model is also less dependent on the liquidity (depth) of the market along the curve. A
stand-alone generation or supply position is very visible to the market and this can place such
players at a disadvantage. In contrast, the VIU’s net portfolio position is far less predictable and
hence such business models are not at the mercy of the market to the same extent. As a result,
they are less likely to suddenly find themselves as a distressed buyer or seller. Furthermore, the
VIU model may retain the bid/ask spreads in-house.
Balancing
5.4.14 Flexible mid-merit and peak capacity may support balancing market bids. To the extent that such
capacity therefore is load following, such bids can provide some financial hedge of balancing
market risks on the supply side (albeit by no means a complete hedge of such risks).
Shape & Products
5.4.15 With market liquidity very much concentrating on standard baseload and (some) peak products, a
stand-alone supplier can struggle to acquire the shape and profile required to match their
residential and SME customer portfolios. In today’s market some independent suppliers have
28 50MW * 8760 hours = 438,000 MWhs * £50/MWh = £219 million.
29 This can be in addition to an additional initial margin which we however ignore here to keep the example simple.
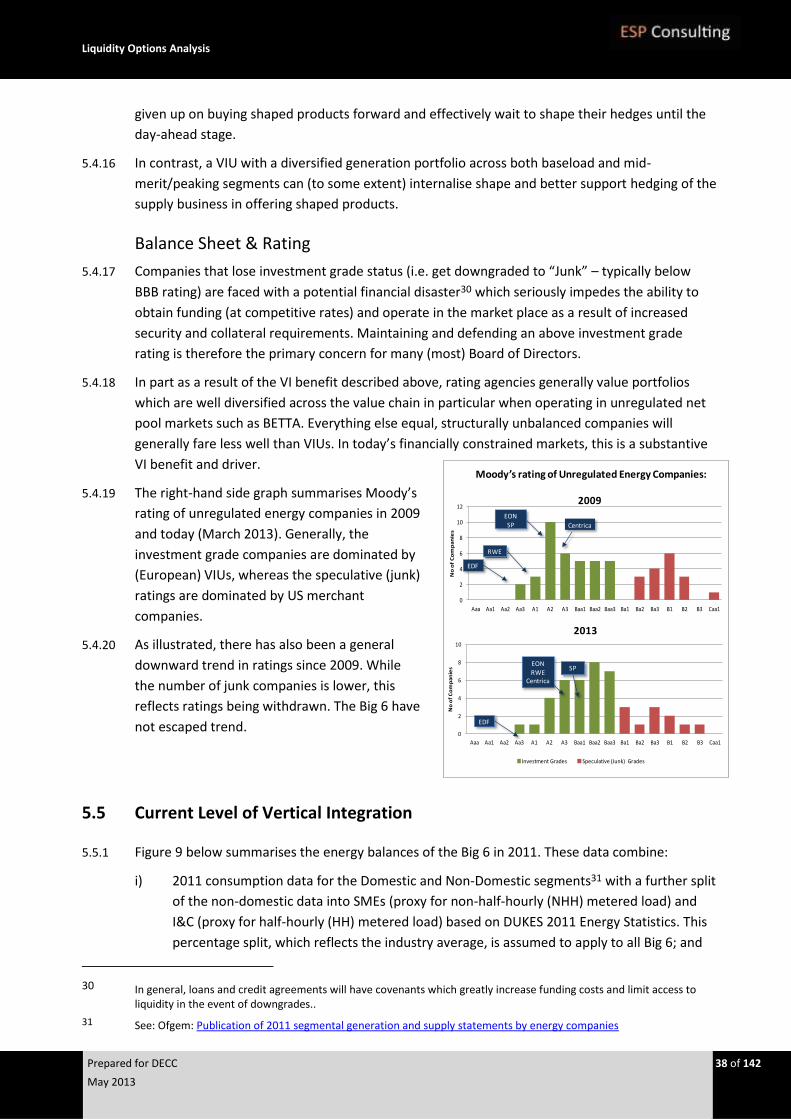
Liquidity Options Analysis
Prepared for DECC 38 of 142
May 2013
given up on buying shaped products forward and effectively wait to shape their hedges until the
day-ahead stage.
5.4.16 In contrast, a VIU with a diversified generation portfolio across both baseload and mid-
merit/peaking segments can (to some extent) internalise shape and better support hedging of the
supply business in offering shaped products.
Balance Sheet & Rating
5.4.17 Companies that lose investment grade status (i.e. get downgraded to “Junk” – typically below
BBB rating) are faced with a potential financial disaster30 which seriously impedes the ability to
obtain funding (at competitive rates) and operate in the market place as a result of increased
security and collateral requirements. Maintaining and defending an above investment grade
rating is therefore the primary concern for many (most) Board of Directors.
5.4.18 In part as a result of the VI benefit described above, rating agencies generally value portfolios
which are well diversified across the value chain in particular when operating in unregulated net
pool markets such as BETTA. Everything else equal, structurally unbalanced companies will
generally fare less well than VIUs. In today’s financially constrained markets, this is a substantive
VI benefit and driver.
5.4.19 The right-hand side graph summarises Moody’s
rating of unregulated energy companies in 2009
and today (March 2013). Generally, the
investment grade companies are dominated by
(European) VIUs, whereas the speculative (junk)
ratings are dominated by US merchant
companies.
5.4.20 As illustrated, there has also been a general
downward trend in ratings since 2009. While
the number of junk companies is lower, this
reflects ratings being withdrawn. The Big 6 have
not escaped trend.
5.5 Current Level of Vertical Integration
5.5.1 Figure 9 below summarises the energy balances of the Big 6 in 2011. These data combine:
i) 2011 consumption data for the Domestic and Non-Domestic segments31 with a further split
of the non-domestic data into SMEs (proxy for non-half-hourly (NHH) metered load) and
I&C (proxy for half-hourly (HH) metered load) based on DUKES 2011 Energy Statistics. This
percentage split, which reflects the industry average, is assumed to apply to all Big 6; and
30 In general, loans and credit agreements will have covenants which greatly increase funding costs and limit access to liquidity in the event of downgrades..
31 See: Ofgem: Publication of 2011 segmental generation and supply statements by energy companies
0
2
4
6
8
10
12
Aaa Aa1 Aa2 Aa3 A1 A2 A3 Baa1 Baa2 Baa3 Ba1 Ba2 Ba3 B1 B2 B3 Caa1
No
of
Co
mp
an
ies
Investment Grades Speculative (Junk) Grades
0
2
4
6
8
10
Aaa Aa1 Aa2 Aa3 A1 A2 A3 Baa1 Baa2 Baa3 Ba1 Ba2 Ba3 B1 B2 B3 Caa1
No
of
Co
mp
an
ies
Investment Grades Speculative (Junk) Grades
EDF
SPEON
RWECentrica
EDF
RWE
EONSP Centrica
2009
2013
Moody’s rating of Unregulated Energy Companies:
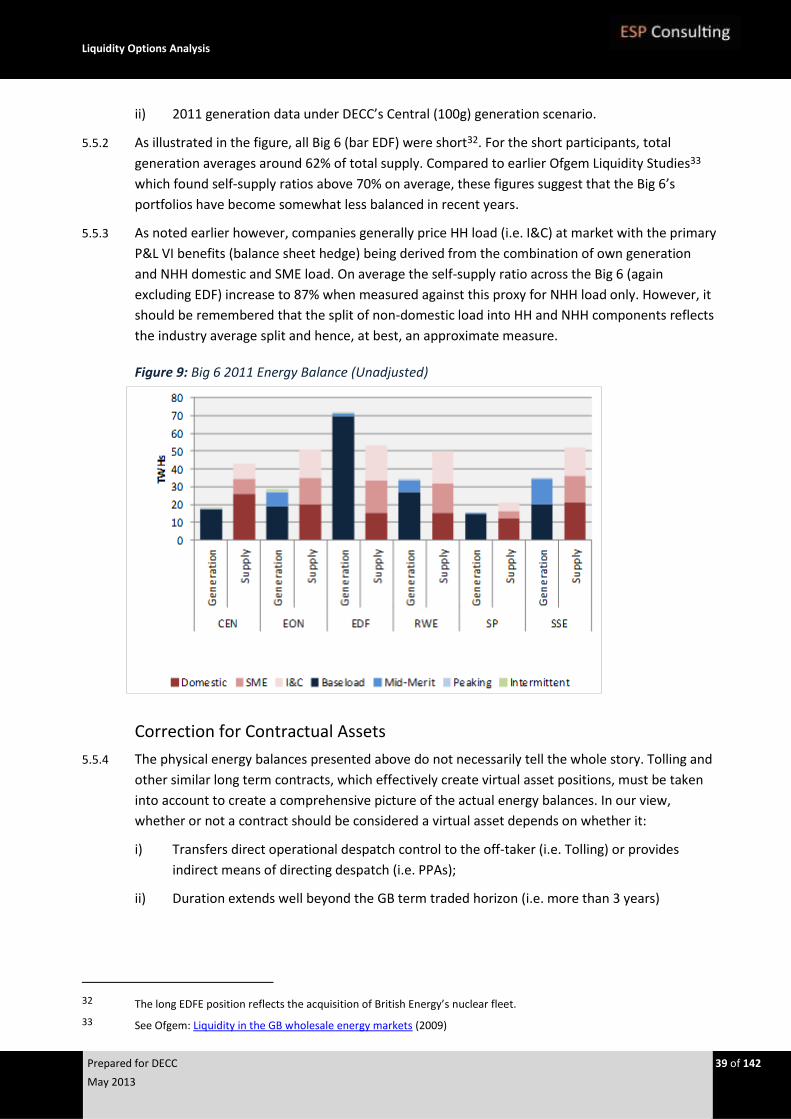
Liquidity Options Analysis
Prepared for DECC 39 of 142
May 2013
ii) 2011 generation data under DECC’s Central (100g) generation scenario.
5.5.2 As illustrated in the figure, all Big 6 (bar EDF) were short32. For the short participants, total
generation averages around 62% of total supply. Compared to earlier Ofgem Liquidity Studies33
which found self-supply ratios above 70% on average, these figures suggest that the Big 6’s
portfolios have become somewhat less balanced in recent years.
5.5.3 As noted earlier however, companies generally price HH load (i.e. I&C) at market with the primary
P&L VI benefits (balance sheet hedge) being derived from the combination of own generation
and NHH domestic and SME load. On average the self-supply ratio across the Big 6 (again
excluding EDF) increase to 87% when measured against this proxy for NHH load only. However, it
should be remembered that the split of non-domestic load into HH and NHH components reflects
the industry average split and hence, at best, an approximate measure.
Figure 9: Big 6 2011 Energy Balance (Unadjusted)
Correction for Contractual Assets
5.5.4 The physical energy balances presented above do not necessarily tell the whole story. Tolling and
other similar long term contracts, which effectively create virtual asset positions, must be taken
into account to create a comprehensive picture of the actual energy balances. In our view,
whether or not a contract should be considered a virtual asset depends on whether it:
i) Transfers direct operational despatch control to the off-taker (i.e. Tolling) or provides
indirect means of directing despatch (i.e. PPAs);
ii) Duration extends well beyond the GB term traded horizon (i.e. more than 3 years)
32 The long EDFE position reflects the acquisition of British Energy’s nuclear fleet.
33 See Ofgem: Liquidity in the GB wholesale energy markets (2009)
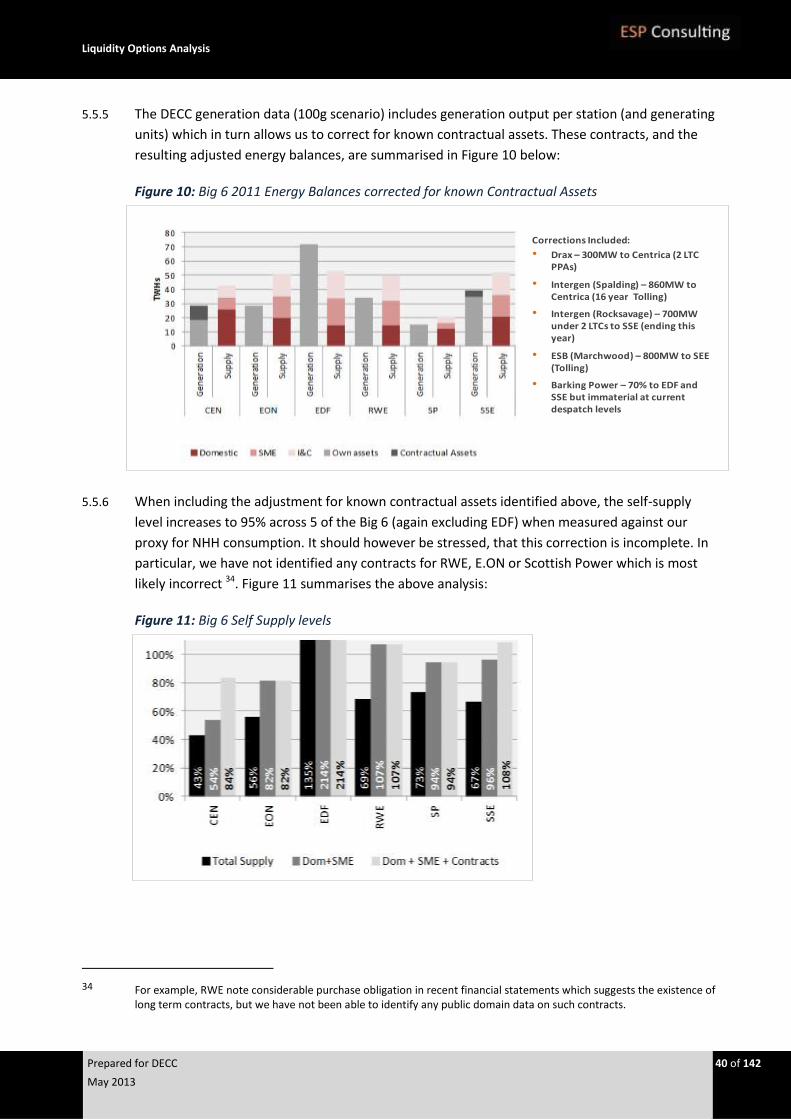
Liquidity Options Analysis
Prepared for DECC 40 of 142
May 2013
5.5.5 The DECC generation data (100g scenario) includes generation output per station (and generating
units) which in turn allows us to correct for known contractual assets. These contracts, and the
resulting adjusted energy balances, are summarised in Figure 10 below:
Figure 10: Big 6 2011 Energy Balances corrected for known Contractual Assets
5.5.6 When including the adjustment for known contractual assets identified above, the self-supply
level increases to 95% across 5 of the Big 6 (again excluding EDF) when measured against our
proxy for NHH consumption. It should however be stressed, that this correction is incomplete. In
particular, we have not identified any contracts for RWE, E.ON or Scottish Power which is most
likely incorrect 34. Figure 11 summarises the above analysis:
Figure 11: Big 6 Self Supply levels
34 For example, RWE note considerable purchase obligation in recent financial statements which suggests the existence of
long term contracts, but we have not been able to identify any public domain data on such contracts.
Corrections Included:
• Drax – 300MW to Centrica (2 LTC PPAs)
• Intergen (Spalding) – 860MW to Centrica (16 year Tolling)
• Intergen (Rocksavage) – 700MW under 2 LTCs to SSE (ending this year)
• ESB (Marchwood) – 800MW to SEE (Tolling)
• Barking Power – 70% to EDF and SSE but immaterial at current despatch levels
Liquidity Options Analysis
Prepared for DECC 41 of 142
May 2013
6 Margining and Financial Regulation
6.1 Introduction
6.1.1 Recent developments in European financial regulation with the objective of reducing systemic
risk in the financial services industry have important implications for liquidity in the energy
markets. In this section we examine the potential consequences for GB wholesale power markets
of two pieces of regulation: European Market Infrastructure Regulation (EMIR35); and Markets in
Financial Instruments Directive/ Regulation (MiFID / MiFIR36).
Section 6.2 discusses the key components of EMIR, before focusing in more detail on the
clearing obligation, which is anticipated to have significant consequences for power
trading.
Section 6.3 outlines how this clearing obligation can be expected to influence the
behaviour of power market participants, and thus power market liquidity.
Section 6.4 introduces the recent proposed changes to MiFID (i.e. the “MiFID II” proposals)
and the resulting impact on energy companies and consequences for power markets.
6.2 European Market Infrastructure Regulation (EMIR)
6.2.1 EMIR aims to create greater stability, transparency and efficiency in derivatives markets, in order
to reduce the risk of a future financial crisis. In seeking increased stability of the over-the-counter
derivative market, the regulation primarily targets financial derivatives, but also includes
commodity derivatives within its scope. As such, both financial counterparties (such as banks,
insurers, commodity trading houses and investment firms) and non-financial counterparties (such
as energy firms participating in OTC commodity derivatives markets) are affected.
6.2.2 From the point of view of an energy market participant, the three key features of EMIR are:
i) Reporting Obligation37 applying to both financial and non-financial counterparties, which
gives regulators overall visibility of activity in derivatives markets, thus allowing them to
monitor systemic risk;
ii) Clearing Obligation removing counterparty risk from trading of derivatives. The clearing
obligation applies to all financial counterparties and some non-financial counterparties,
depending upon the volume and type of derivatives in which they trade; and
35 See REGULATION (EU) No 648/2012 OF THE EUROPEAN PARLIAMENT AND OF THE COUNCIL of 4 July 2012 on OTC
derivatives, central counterparties and trade repositories. Available online, here: EMIR Regulation
36 The existing directive / regulations are as follows: Directive 2004/39/EC (MiFID Framework Directive); Directive 2006/73/EC (MiFID Implementing Directive); and Regulation No 1287/2006 (MiFID Implementing Regulation). Proposals for amendment are underway, with latest documentation available online, here: MiFID Directive / Regulation
37 The minimum set of information, required by EMIR, to be reported in trade repositories includes: the parties to the contract, beneficiary of the rights and obligations arising from it, and the main details of the contract including the type, underlying, maturity, notional value, price and settlement date.
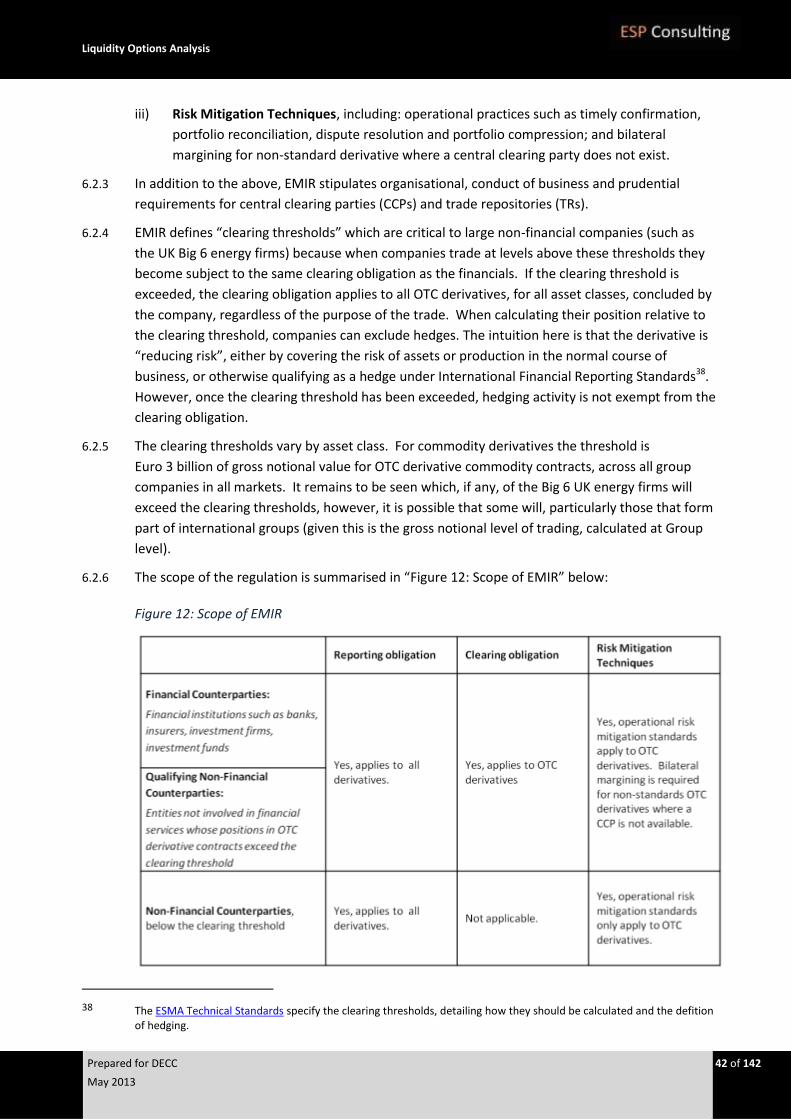
Liquidity Options Analysis
Prepared for DECC 42 of 142
May 2013
iii) Risk Mitigation Techniques, including: operational practices such as timely confirmation,
portfolio reconciliation, dispute resolution and portfolio compression; and bilateral
margining for non-standard derivative where a central clearing party does not exist.
6.2.3 In addition to the above, EMIR stipulates organisational, conduct of business and prudential
requirements for central clearing parties (CCPs) and trade repositories (TRs).
6.2.4 EMIR defines “clearing thresholds” which are critical to large non-financial companies (such as
the UK Big 6 energy firms) because when companies trade at levels above these thresholds they
become subject to the same clearing obligation as the financials. If the clearing threshold is
exceeded, the clearing obligation applies to all OTC derivatives, for all asset classes, concluded by
the company, regardless of the purpose of the trade. When calculating their position relative to
the clearing threshold, companies can exclude hedges. The intuition here is that the derivative is
“reducing risk”, either by covering the risk of assets or production in the normal course of
business, or otherwise qualifying as a hedge under International Financial Reporting Standards38.
However, once the clearing threshold has been exceeded, hedging activity is not exempt from the
clearing obligation.
6.2.5 The clearing thresholds vary by asset class. For commodity derivatives the threshold is
Euro 3 billion of gross notional value for OTC derivative commodity contracts, across all group
companies in all markets. It remains to be seen which, if any, of the Big 6 UK energy firms will
exceed the clearing thresholds, however, it is possible that some will, particularly those that form
part of international groups (given this is the gross notional level of trading, calculated at Group
level).
6.2.6 The scope of the regulation is summarised in “Figure 12: Scope of EMIR” below:
Figure 12: Scope of EMIR
38 The ESMA Technical Standards specify the clearing thresholds, detailing how they should be calculated and the defition
of hedging.
Liquidity Options Analysis
Prepared for DECC 43 of 142
May 2013
6.2.7 There are certain exemptions to the above scope, including intragroup transactions. Trades
between companies in the same Group do not need to be cleared and, if agreed in advance with
the regulator (see national competent authorities, NCAs, below), risk mitigation techniques need
not apply. However, no trades are exempt from the reporting obligation.
6.2.8 Although EMIR entered into force in August 2012, the obligations will be phased in over the next
two years. The implementation timetable, which stretches to summer 2014, was triggered by the
entry into force of delegated “regulatory technical standards”, drawn up by the European
Securities and Markets Authority (ESMA). These regulatory technical standards notably contain
details of the data to be reported (in relation to the reporting obligation) and the obligations of
non-financial counterparties (including defined thresholds from which clearing obligations apply),
as well as requirements for central counterparties. National legislation will enable the
implementation of the regulation with “national competent authorities” (NCAs) with supervisory,
investigatory and enforcement powers. In the UK, the NCAs are the Bank of England, Financial
Conduct Authority and Prudential Regulation Authority39.
6.3 Liquidity Impact of EMIR
6.3.1 In terms of drivers of liquidity in power markets, the clearing obligation and bilateral margining
requirements under EMIR are most noteworthy, as they can be expected to have significant
impact on the behaviour of the major market participants: large vertically integrated energy
companies (assuming they are above the clearing threshold) and financial players. The objective
of clearing is to reduce credit risk, by ensuring a trade will always be honoured even if the
counterparty to the trade is insolvent (or otherwise unable to perform). It is a process of
collateral exchange with a central clearing party, an institution created to process and hold
collateral. After a trade is made between two counterparties, the central clearing party takes
both sides of the deal and both parties exchange cash (an initial margin plus variation margin)
with the central clearing party on a daily basis as a guarantee of performance.
6.3.2 Under EMIR, all “eligible” OTC derivatives traded between financial counterparties and qualifying
non-financials will need to be cleared. These “eligible” OTC derivatives are those that are
available for trading on an exchange or multilateral trading facility (such as broker screens), even
if traded bilaterally, or have the potential to be cash-settled (even if intended for physical
settlement). MiFID/MiFIR (see section 6.4 below) will require standard commodity derivatives to
be traded through exchanges. Even where no central counterparty exists (i.e. for non-standard
derivatives) EMIR requires bilateral margining, meaning that the variation margin will be
exchanged between the two counterparties directly.
6.3.3 Although reducing credit risk EMIR increases cash liquidity risk40 for market participants. The
amount of cash tied up in margining can be considerable with potentially disastrous
consequences for a company’s cash flow. Such consequences include restrictions on the ability to
39 See http://www.legislation.gov.uk/uksi/2013/504/contents/made for details of the UK legislation: The Financial
Services and Markets Act 2000 (Over the Counter Derivatives, Central Counterparties and Trade Repositories) Regulations 2013.
40 See Appendix E for an explanation of the interaction between Credit Risk, Liquidity Risk and Market Risk.
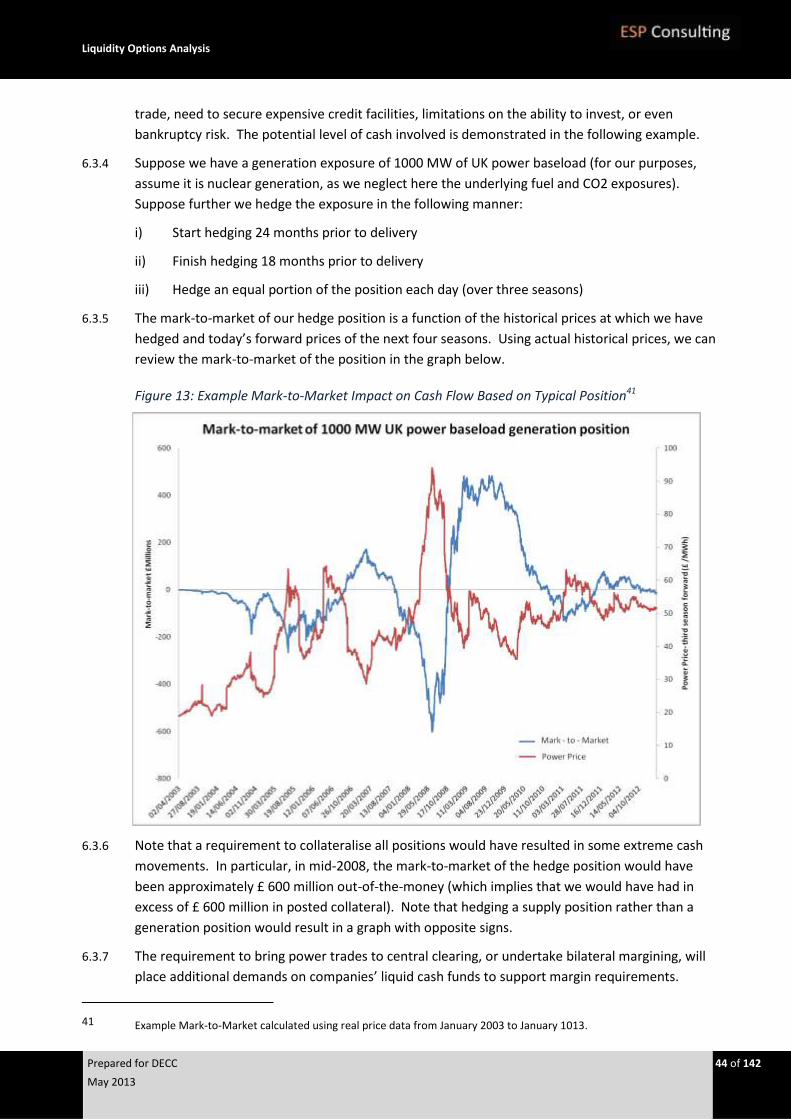
Liquidity Options Analysis
Prepared for DECC 44 of 142
May 2013
trade, need to secure expensive credit facilities, limitations on the ability to invest, or even
bankruptcy risk. The potential level of cash involved is demonstrated in the following example.
6.3.4 Suppose we have a generation exposure of 1000 MW of UK power baseload (for our purposes,
assume it is nuclear generation, as we neglect here the underlying fuel and CO2 exposures).
Suppose further we hedge the exposure in the following manner:
i) Start hedging 24 months prior to delivery
ii) Finish hedging 18 months prior to delivery
iii) Hedge an equal portion of the position each day (over three seasons)
6.3.5 The mark-to-market of our hedge position is a function of the historical prices at which we have
hedged and today’s forward prices of the next four seasons. Using actual historical prices, we can
review the mark-to-market of the position in the graph below.
Figure 13: Example Mark-to-Market Impact on Cash Flow Based on Typical Position41
6.3.6 Note that a requirement to collateralise all positions would have resulted in some extreme cash
movements. In particular, in mid-2008, the mark-to-market of the hedge position would have
been approximately £ 600 million out-of-the-money (which implies that we would have had in
excess of £ 600 million in posted collateral). Note that hedging a supply position rather than a
generation position would result in a graph with opposite signs.
6.3.7 The requirement to bring power trades to central clearing, or undertake bilateral margining, will
place additional demands on companies’ liquid cash funds to support margin requirements.
41 Example Mark-to-Market calculated using real price data from January 2003 to January 1013.

Liquidity Options Analysis
Prepared for DECC 45 of 142
May 2013
Rather than maintain this short-term cash liquidity, we expect many companies will modify their
trading behaviour to mitigate this cash liquidity risk.
6.3.8 The potential or actual requirement to hold large balances of cash to support collateral
requirements is expected to have a number of negative consequences for power market liquidity:
i) Big 6 energy companies may limit their proprietary trading or “churn” of hedge positions in
an effort to remain below the clearing threshold;
ii) Financial counterparties and qualifying non-financials may trade less in order to constrain
cash required to support their proprietary trading activities;
iii) Financial counterparties and qualifying non-financials may trade only in near-dated
contracts, as these generally have lower cash liquidity requirements because they settle
sooner and therefore have less time for the mark-to-market of the trade to grow large;
iv) Large energy companies, having exceeded the clearing threshold, may seek intragroup
exemptions, thus reinforcing vertical integration in the industry and reducing power
volumes brought to market by companies with both generation and distribution
businesses;
v) Those large energy companies may also potentially reduce their hedging activities,
preferring the risk of earnings variability to the risk of a cash liquidity crisis.
6.3.9 Despite these negative consequences for power market liquidity, EMIR may also have some
positive impacts in the context of the objective of removing barriers to trade and encouraging
market entrants. The clearing obligation applies only to trades between two financial
counterparties or qualifying non-financial counterparties. When one counterparty is a non-
financial counterparty (below the clearing threshold), neither party is obliged to clear.
Therefore, by trading with non-qualifying non-financial companies, large qualifying energy
companies will reduce the cash required for margining. This will create incentives for companies
subject to the clearing obligation to trade with smaller energy companies. Note that this
behaviour (i.e. tending to trade with smaller counterparties) would overall increase the credit risk
of a company’s trading portfolio.
6.4 Markets in Financial Instruments Directive and Capital Requirements
6.4.1 MiFID, which was implemented at the end of 2004, is a foundation of the EU regulation of
financial markets. MiFID strengthens competition through the integration of Europe’s financial
markets and sets out provisions on business conduct to protect customers of investment services.
Its scope covers investment banks; portfolio managers; stockbrokers and broker dealers;
corporate finance firms; many futures and options firms; and some commodities firms.
6.4.2 In October 2011, the European Commission proposed a number of changes to MiFID and
accompanying regulation “MiFIR”, to address the recognised need to improve transparency and
oversight of less regulated markets and the issue of excessive price volatility in commodity
derivatives markets. The final framework for legislation is yet to be agreed between the European
Parliament, the Council of the European Union and the European Commission. With final
Liquidity Options Analysis
Prepared for DECC 46 of 142
May 2013
agreement on the “level I” proposals expected in 2013, the FCA predicts implementation of the
new measures no earlier than the end of 201442.
6.4.3 It appears likely that the implications for the energy sector will be significant. The current
directive provides a number of exemptions, many of which are useful to energy trading firms in
avoiding regulation by national financial regulators, but draft revisions to MiFID will restrict or
eliminate many exemptions. As a result, energy firms that also engage in proprietary trading in
energy markets, or which act as intermediaries in providing portfolio management services to
clients in the sector, may become subject to MiFID.
6.4.4 In addition to facing the costs and operational constraints associated with compliance to the
additional regulation, energy firms that become subject to MiFID will also become subject to the
Capital Requirement Directive (CRD). As a consequence of becoming subject to CRD, energy firms
would become subject to Basel II – soon becoming Basel III – capital requirements43. The capital
requirements oblige companies to reserve high quality capital against potential market losses,
the amount of which is a function of the risk in the trading position.
6.4.5 The impact of MiFID and the CRD on power market liquidity has the potential to be significant.
First of all, energy companies may curtail certain market trading activities in order to qualify for
any remaining exemptions and thus avoid becoming regulated as financial entities. Secondly, to
the extent that a company is subject to MiFID, it is likely to eliminate activities which contribute
to risk (such as proprietary trading) in order to minimise capital requirements under the CRD.
Finally, to the extent that a company is unable to minimise the impact of the CRD, some of the
capital held in reserve will no longer be available for new investments in tangible assets, such as
generation capacity. Taken together, these impacts of the MiFID revisions are likely to have a
negative impact on power market liquidity. In mitigation, it is worth noting that it is a legal entity
that is licensed under MiFID, unlike EMIR, which applies to the entire consolidated group of
companies. We expect therefore that companies can segregate their MiFID-regulated activities
into a separate company while more “corporate” activities, such as sourcing power for delivery to
end-customers, would be conducted in non-regulated companies.
42 The Financial Conduct Authority (FCA) website [published 02/04/2013] states that implementation of the proposed
changes to MiFID are expected at the end of 2014, at the earliest. However, other [press] sources predict implementation as late as 2016.
43 The CRD legislation currently enforce (that reflects Basel II guidelines can be found online: Capital Requirements Directive. Proposals for a new legislative package, CRD IV, that will reflect Basel III guidelines were adopted in 2011, the latest documentation is available online, here: CRD IV
Liquidity Options Analysis
Prepared for DECC 47 of 142
May 2013
PART III - INTERVENTION OPTIONS
Liquidity Options Analysis
Prepared for DECC 48 of 142
May 2013
7 Overview
7.1 Introduction
7.1.1 Having considered the key drivers of GB power market liquidity as well as the challenges facing
DECC and Ofgem in this area, the remainder of this report evaluates a wide ranging suite of
potential interventions. These options were identified during a number of workshops with DECC
during which we also developed and agreed an Analytical Framework to support consistent and
comprehensive assessment and scoring of each individual option.
7.1.2 The Analytical Framework is presented in Chapter 8. Chapters 9 to 13 define and evaluate each of
the intervention options identified in this section. Finally Chapter 14 sets out our conclusions and
recommendations across all options.
7.2 Intervention Options
7.2.1 In presenting and assessing the various options, we distinguish between:
Primary Options, by which we mean interventions which in themselves have the potential
to significantly impact the functioning of the market (and hence liquidity); and
Supplementary Options, which in themselves are unlikely to deliver the desired outcome,
but which nonetheless support and augment the primary interventions.
Primary Options
7.2.2 The Primary Options are defined and evaluated in Chapters 9 to 12. Overall these may be
grouped as follows:
i) Self-Supply Restrictions (SSR) which either partially or completely restrict the amount of
physical consumption a company can supply from its own internal generation sources (or
vice versa);
ii) Functional Separation (FS) which supports SSRs with additional constraints on the VIUs’
internal organisation aimed at separating (ring-fencing) up- and downstream trading
activities and commercial decision making;
iii) Mandatory Auctions (MA) which obliges the large players to participate in regular auctions
for forward products; and
iv) Mandatory Market-Making (MM) which oblige selected participants to make the market
in a suite of forward products by continually offering to buy or sell these products within a
defined bid/ask spread.
Supplementary Options
7.2.3 The Supplementary Options are defined and assessed in Chapter 13. These options include the
interventions set out in the Ofgem’s “Secure and Promote” consultation, namely a minimum Day-
Ahead trading requirement and inclusion of additional license conditions to promote fair and
Liquidity Options Analysis
Prepared for DECC 49 of 142
May 2013
reasonable trading terms. While both important, we do not consider these interventions
sufficient in scale and scope to deliver the Government’s wider objectives as set out in the
Introduction to this report and they are therefore classified as Supplementary. These options
include:
The reference price in the Baseload Low Carbon CfDs, a choice we see as an important
(supplementary) instrument for directing liquidity along the curve;
Two potential credit interventions, namely mutualisation of credit losses and government
backing of credit insurance;
Interventions aimed at ensuring effective collateral and margining arrangements; and
Various potential interventions for increasing the general transparency of the GB market.
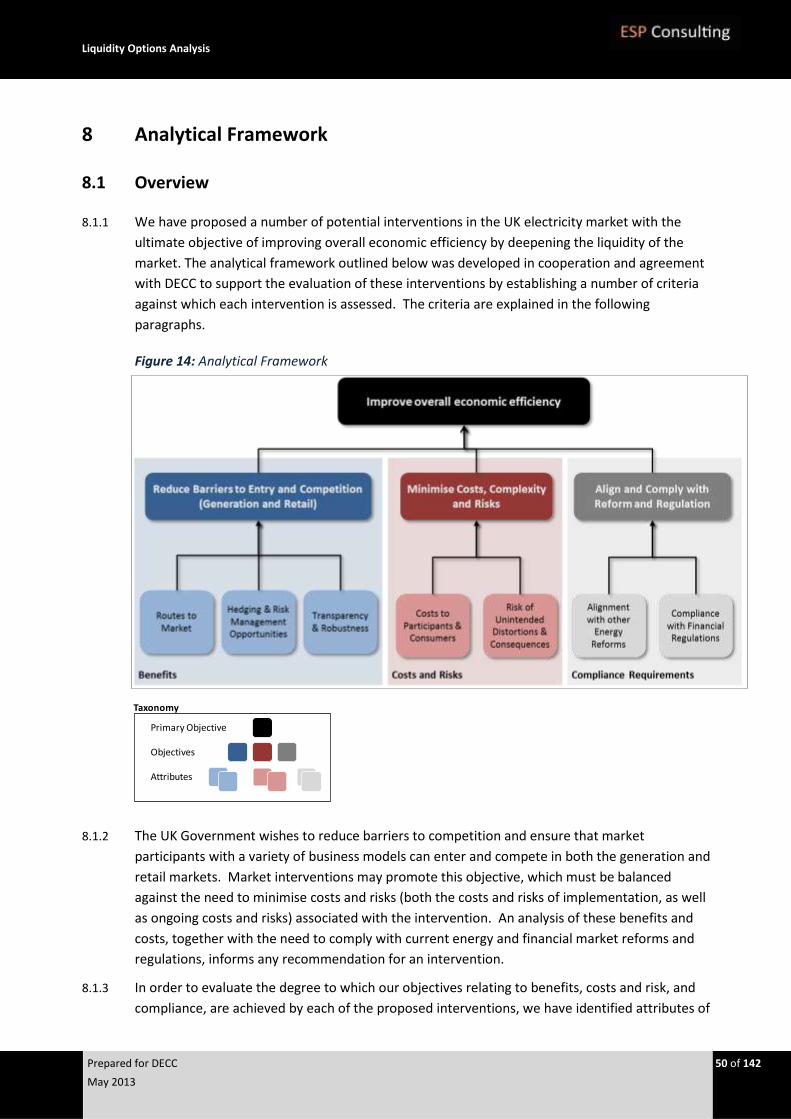
Liquidity Options Analysis
Prepared for DECC 50 of 142
May 2013
8 Analytical Framework
8.1 Overview
8.1.1 We have proposed a number of potential interventions in the UK electricity market with the
ultimate objective of improving overall economic efficiency by deepening the liquidity of the
market. The analytical framework outlined below was developed in cooperation and agreement
with DECC to support the evaluation of these interventions by establishing a number of criteria
against which each intervention is assessed. The criteria are explained in the following
paragraphs.
Figure 14: Analytical Framework
8.1.2 The UK Government wishes to reduce barriers to competition and ensure that market
participants with a variety of business models can enter and compete in both the generation and
retail markets. Market interventions may promote this objective, which must be balanced
against the need to minimise costs and risks (both the costs and risks of implementation, as well
as ongoing costs and risks) associated with the intervention. An analysis of these benefits and
costs, together with the need to comply with current energy and financial market reforms and
regulations, informs any recommendation for an intervention.
8.1.3 In order to evaluate the degree to which our objectives relating to benefits, costs and risk, and
compliance, are achieved by each of the proposed interventions, we have identified attributes of
Objectives
Attributes
Primary Objective
Taxonomy
Liquidity Options Analysis
Prepared for DECC 51 of 142
May 2013
each of these pillars in level ‘3’ of Figure 14 above. Each of these attributes is evaluated by a
number of assessment criteria (level ‘4’, not shown above). We describe the attributes and
assessment criteria for each objective in more detail below.
8.2 Reduce Barriers to Entry and Competition:
Attributes
8.2.1 As illustrated in Figure 14, three attributes of the wholesale markets are considered key to
facilitate the overarching objective of market entry and competition:
i) Routes to Market: It is important that participants (both on the retail and generation sides
of the market) can find a route to market, i.e. a platform or vehicle whereby participants
can buy or sell power at a fair price. Existing routes to market include exchanges, the over-
the-counter (OTC) market (perhaps facilitated by brokers), and structured long-term supply
arrangements, as well as indirect access to the same via intermediaries (such as PPA
providers). One major inhibitor to trading directly in the market can be the inability of
participants, especially smaller participants, to be offered credit arrangements by
counterparties. The most common mitigation for poor credit is the posting of collateral,
but again many participants (not only smaller suppliers and generators, but other market
parties as well) may face financial constraints on the amount of liquid cash which can be
made available to support collateral.
ii) Hedging and Risk Management Opportunities: Suppliers and generators both require
access to risk management tools to manage their risks responsibly. Different market
participants (suppliers, generators, large energy consumers, etc.) will require a variety of
tools which include prompt energy and balancing services; traded products at a range of
maturities along the curve; baseload, peak, and other shaped products; and a range of clip
sizes to facilitate access by smaller parties.
iii) Transparency and Robustness: The market requires robust and clear signals to drive
operations and support confidence. In particular, opaqueness and information asymmetry
increase costs and risks for smaller and less sophisticated participants and thus remain
barriers to effective competition.
Assessment Criteria
8.2.2 The benefits of the proposed market interventions will be assessed against a set of defined
criteria which support the wholesale market attributes described above. Figure 15 below
summarises these criteria and their linkage to these attributes:
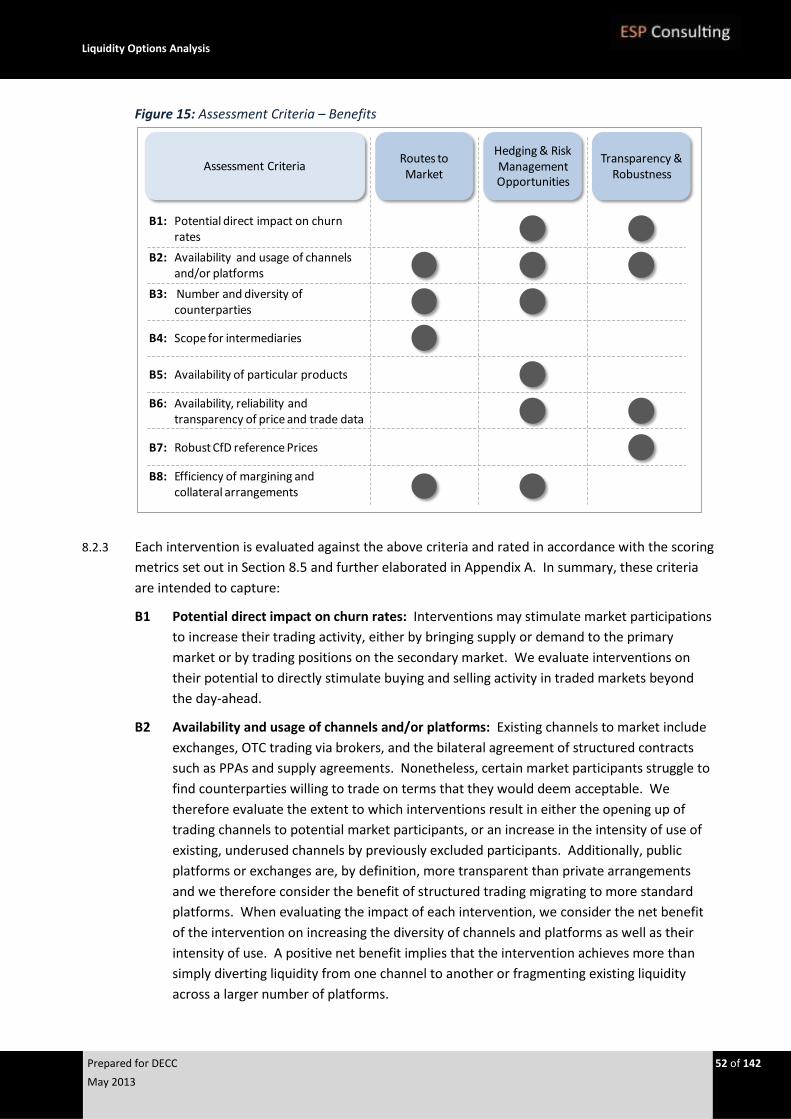
Liquidity Options Analysis
Prepared for DECC 52 of 142
May 2013
Figure 15: Assessment Criteria – Benefits
8.2.3 Each intervention is evaluated against the above criteria and rated in accordance with the scoring
metrics set out in Section 8.5 and further elaborated in Appendix A. In summary, these criteria
are intended to capture:
B1 Potential direct impact on churn rates: Interventions may stimulate market participations
to increase their trading activity, either by bringing supply or demand to the primary
market or by trading positions on the secondary market. We evaluate interventions on
their potential to directly stimulate buying and selling activity in traded markets beyond
the day-ahead.
B2 Availability and usage of channels and/or platforms: Existing channels to market include
exchanges, OTC trading via brokers, and the bilateral agreement of structured contracts
such as PPAs and supply agreements. Nonetheless, certain market participants struggle to
find counterparties willing to trade on terms that they would deem acceptable. We
therefore evaluate the extent to which interventions result in either the opening up of
trading channels to potential market participants, or an increase in the intensity of use of
existing, underused channels by previously excluded participants. Additionally, public
platforms or exchanges are, by definition, more transparent than private arrangements
and we therefore consider the benefit of structured trading migrating to more standard
platforms. When evaluating the impact of each intervention, we consider the net benefit
of the intervention on increasing the diversity of channels and platforms as well as their
intensity of use. A positive net benefit implies that the intervention achieves more than
simply diverting liquidity from one channel to another or fragmenting existing liquidity
across a larger number of platforms.
B2: Availability and usage of channels and/or platforms
B5: Availability of particular products
B8: Efficiency of margining and collateral arrangements
B6: Availability, reliability and transparency of price and trade data
B4: Scope for intermediaries
B7: Robust CfD reference Prices
Routes to Market
Hedging & Risk Management Opportunities
Transparency & Robustness
B3: Number and diversity of counterparties
Assessment Criteria
B1: Potential direct impact on churn rates
Liquidity Options Analysis
Prepared for DECC 53 of 142
May 2013
B3 Number and diversity of counterparties: Facilitating the entry of more counterparties to
the market will directly increase liquidity by creating a larger pool of market participants
willing to take the other side of a deal. Participants will more readily take an open risk
position if they are assured they can close it in a competitive market on reasonable terms.
Additionally, an increase in the diversity of counterparties, including independent suppliers
and independent generators, intermediaries and aggregators, financial participants, and
large energy consumers, will also boost liquidity and will diversify the patterns of
behaviours in terms of timing of trading activity, tenors of products, etc.
B4 Scope for intermediaries: Small, independent market participants do not have the scope
of operations of larger companies and therefore benefit from the support of market
intermediaries. These may include, for example, PPA aggregators, who encourage
independent developers of intermittent generation, or balancing aggregators, who can
handle the nominations and balancing activities of small physical players. Interventions
score highly on this benefit where they support and facilitate the work of intermediaries
who in turn provide risk management opportunities to participants.
B5 Availability of particular products and clip sizes: Ensuring relevant hedging and risk
management opportunities are available to suppliers and generators, of varying size,
requires particular products and clip sizes to be traded readily. We consider both short and
longer-dated products, as well as both baseload and peakload products to be important.
Interventions score most highly on this benefit where they are expected to result in a
material increase in the availability in many of these products.
B6 Availability, reliability and transparency of price and trade data: Hedging and risk
management not only requires the availability of certain products, but the data required to
analyse and accurately quantify risk. The availability of robust data also drives
transparency and the associated market confidence. Substantial benefit will be gained
from an intervention where it leads to the publishing of not only a greater quantity of
previously unavailable data, but where that data will be deemed robust and consistent by
the market.
B7 Robust CfD reference prices: Robust CfD reference prices are particularly important for
transparency because only a well-functioning CfD market will attract new, low-carbon
investment from a diverse source of counterparties.
B8 Efficiency of credit and collateral arrangements: Credit and collateral arrangements can
prove a significant barrier to access to the power forward market. We assess interventions
on the extent to which they reduce or remove the credit and collateral barriers to access,
especially for small participants. Interventions may also have secondary effects in
mitigating credit and collateral barriers. For example, a wide choice of products and routes
to market enable participants to choose to trade cleared or non-cleared products
depending on risk management preference. Additionally, a diversity of counterparties will
help avoid a concentration of credit risk in portfolios and also help ensure competitive
trading terms.
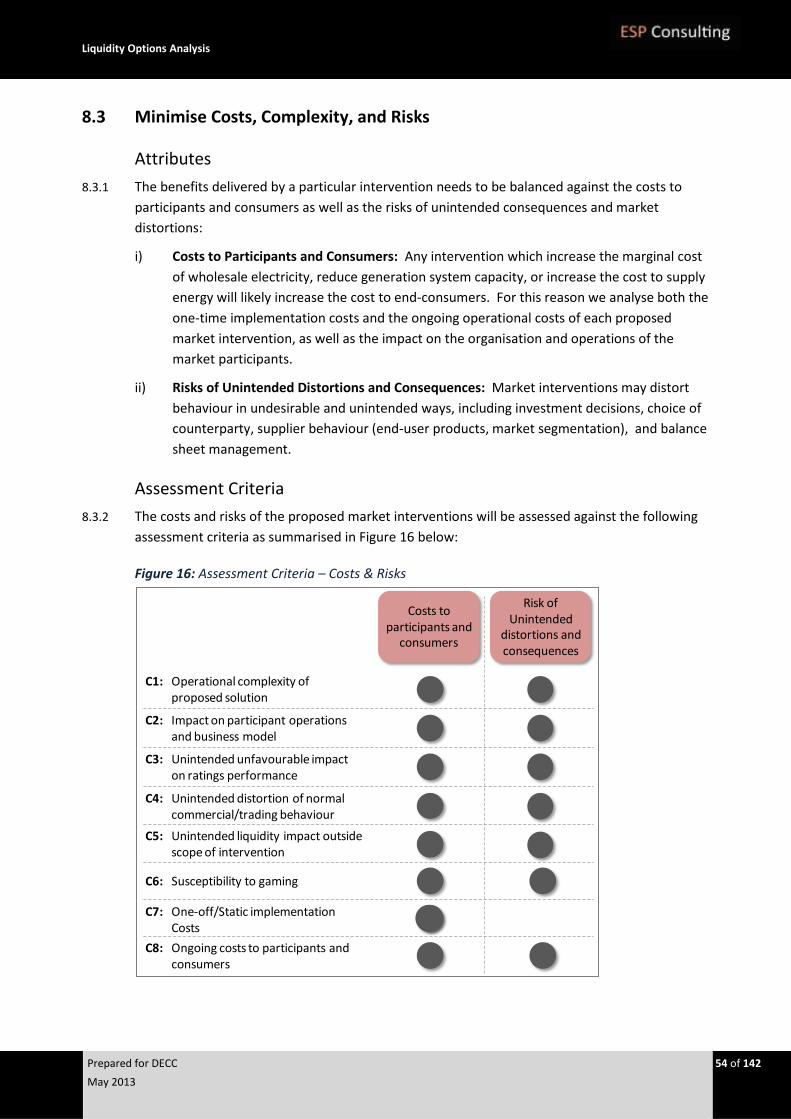
Liquidity Options Analysis
Prepared for DECC 54 of 142
May 2013
8.3 Minimise Costs, Complexity, and Risks
Attributes
8.3.1 The benefits delivered by a particular intervention needs to be balanced against the costs to
participants and consumers as well as the risks of unintended consequences and market
distortions:
i) Costs to Participants and Consumers: Any intervention which increase the marginal cost
of wholesale electricity, reduce generation system capacity, or increase the cost to supply
energy will likely increase the cost to end-consumers. For this reason we analyse both the
one-time implementation costs and the ongoing operational costs of each proposed
market intervention, as well as the impact on the organisation and operations of the
market participants.
ii) Risks of Unintended Distortions and Consequences: Market interventions may distort
behaviour in undesirable and unintended ways, including investment decisions, choice of
counterparty, supplier behaviour (end-user products, market segmentation), and balance
sheet management.
Assessment Criteria
8.3.2 The costs and risks of the proposed market interventions will be assessed against the following
assessment criteria as summarised in Figure 16 below:
Figure 16: Assessment Criteria – Costs & Risks
C1: Operational complexity of proposed solution
C2: Impact on participant operations and business model
C3: Unintended unfavourable impact on ratings performance
Costs to participants and
consumers
Risk of Unintended
distortions and consequences
C4: Unintended distortion of normal commercial/trading behaviour
C7: One-off/Static implementation Costs
C8: Ongoing costs to participants and consumers
C5: Unintended liquidity impact outside scope of intervention
C6: Susceptibility to gaming
Liquidity Options Analysis
Prepared for DECC 55 of 142
May 2013
8.3.3 As for benefits, each intervention is evaluated against the above criteria and rated in accordance
with the scoring metrics set out in Section 8.5 and further elaborated in Appendix A. In summary,
these criteria are intended to capture:
C1 Operational complexity of proposed solution: Most interventions will require a degree of
change to market standards and conventions. The cost of such change will be material
where it requires changes to organisations’ processes or systems, or if an intervention
requires fundamental changes to market platforms or processes (such as monitoring
physical nominations to enforce a self-supply restriction) or entirely new platforms (such as
the set-up and operation of an auction platform). Intervention options are assessed in
terms of complexity of changes required and the scope of the impact on participants (i.e. in
terms of number of parties required to implement change).
C2 Impact on participant operations and business model: Costs will be incurred and
inefficiencies may be introduced if market interventions require either legal or structural
changes to the internal organisation of market participants, or changes to the way that
organisations communicate and interact internally.
C3 Unintended unfavourable impact on financial performance and ratings: Credit ratings are
of particular importance to the market, as this directly impacts on the cost of investment in
generation assets, the ability to seek favourable trading terms with counterparties, and the
overall financial security of the firm. We evaluate intervention options for their direct
impact on credit ratings (because we believe an intervention will be likely to cause a rating
agency to view certain participants less favourable) or their indirect impact44. We also
consider the liquidity impacts of additional collateral requirements, either because the
intervention is likely to require some or all participants to margin a greater number or
proportion of deals, or because the intervention will lead to increased churn and thus have
the potential to push the participant’s derivative position above the EMIR threshold.
C4 Unintended distortion of normal commercial / trading behaviour: Intervening to promote
liquidity may distort the natural and beneficial incentives for market participants to behave
in a certain manner. While some interventions will deliberately incentivise the use of
particular tools or instruments, there is a risk that these will have an indirect negative
consequence on other areas that may be costly or impossible to mitigate. These changed
behaviours may be in the wholesale trading area (e.g. a greater propensity to trade with
certain types of counterparties to the exclusion of others) or in other parts of the value
chain (e.g. a change in strategy with respect to investment in new generation)
C5 Unintended liquidity impact outside scope of intervention: An intervention may increase
liquidity overall yet shift trading patterns in unexpected ways, for example a shift from
longer maturity to shorter maturity deals.
C6 Susceptibility to gaming: Any chosen intervention should be designed such that gaming
opportunities are limited and effectively monitored. The cost to mitigate gaming may be
material, beyond normal monitoring measures by regulators. In some cases it may be
impossible from a practical standpoint to mitigate gaming effectively.
44 Because we expect an intervention to cause a deterioration in financial performance over time.
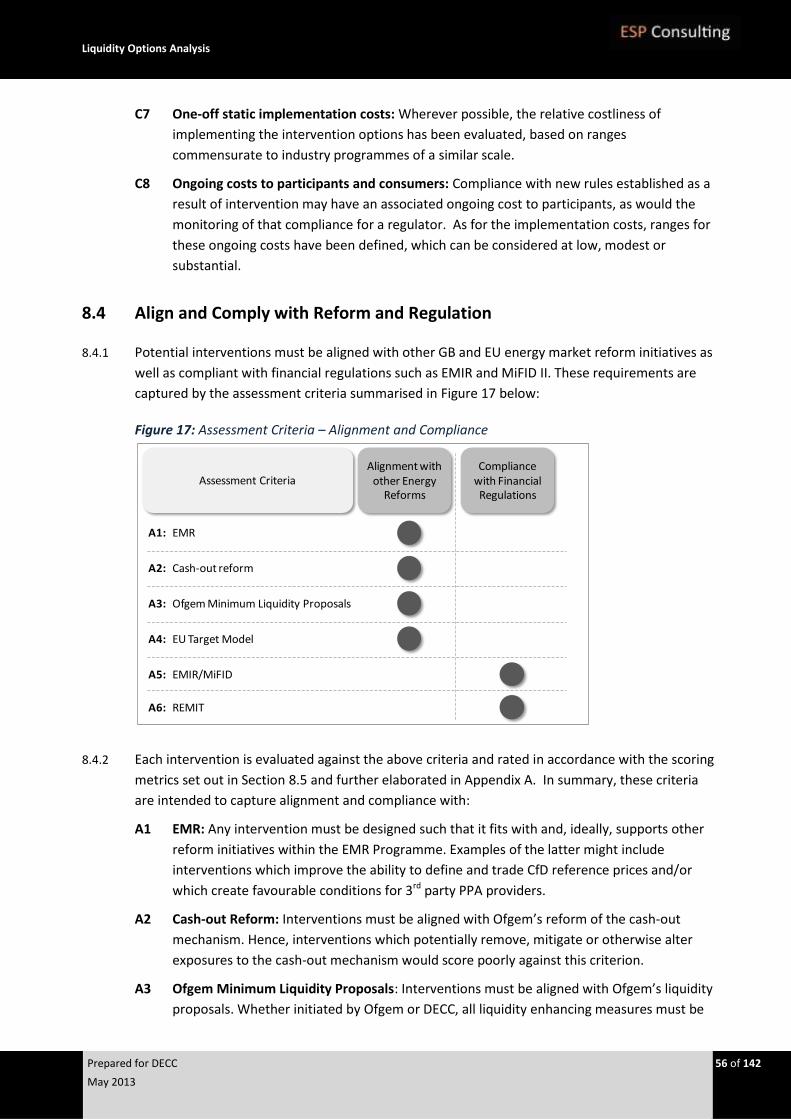
Liquidity Options Analysis
Prepared for DECC 56 of 142
May 2013
C7 One-off static implementation costs: Wherever possible, the relative costliness of
implementing the intervention options has been evaluated, based on ranges
commensurate to industry programmes of a similar scale.
C8 Ongoing costs to participants and consumers: Compliance with new rules established as a
result of intervention may have an associated ongoing cost to participants, as would the
monitoring of that compliance for a regulator. As for the implementation costs, ranges for
these ongoing costs have been defined, which can be considered at low, modest or
substantial.
8.4 Align and Comply with Reform and Regulation
8.4.1 Potential interventions must be aligned with other GB and EU energy market reform initiatives as
well as compliant with financial regulations such as EMIR and MiFID II. These requirements are
captured by the assessment criteria summarised in Figure 17 below:
Figure 17: Assessment Criteria – Alignment and Compliance
8.4.2 Each intervention is evaluated against the above criteria and rated in accordance with the scoring
metrics set out in Section 8.5 and further elaborated in Appendix A. In summary, these criteria
are intended to capture alignment and compliance with:
A1 EMR: Any intervention must be designed such that it fits with and, ideally, supports other
reform initiatives within the EMR Programme. Examples of the latter might include
interventions which improve the ability to define and trade CfD reference prices and/or
which create favourable conditions for 3rd party PPA providers.
A2 Cash-out Reform: Interventions must be aligned with Ofgem’s reform of the cash-out
mechanism. Hence, interventions which potentially remove, mitigate or otherwise alter
exposures to the cash-out mechanism would score poorly against this criterion.
A3 Ofgem Minimum Liquidity Proposals: Interventions must be aligned with Ofgem’s liquidity
proposals. Whether initiated by Ofgem or DECC, all liquidity enhancing measures must be
A1: EMR
A2: Cash-out reform
A3: Ofgem Minimum Liquidity Proposals
A5: EMIR/MiFID
A4: EU Target Model
Alignment with other Energy
Reforms
Compliance with Financial Regulations
Assessment Criteria
A6: REMIT
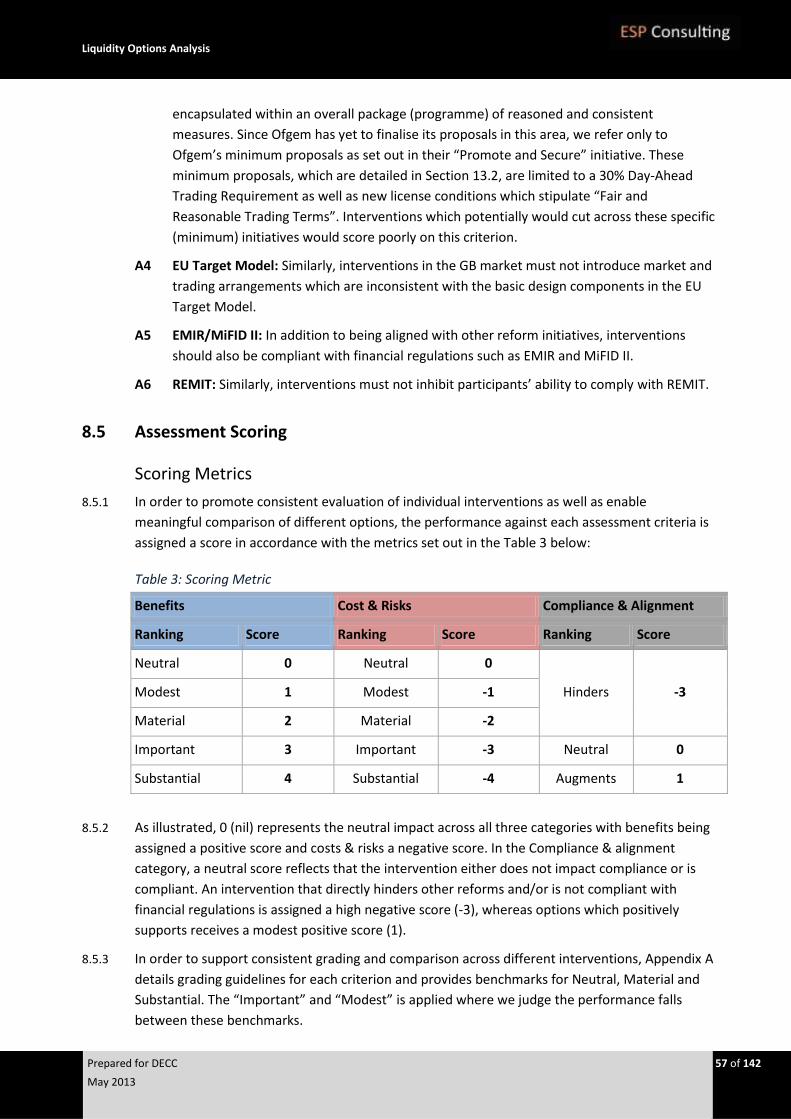
Liquidity Options Analysis
Prepared for DECC 57 of 142
May 2013
encapsulated within an overall package (programme) of reasoned and consistent
measures. Since Ofgem has yet to finalise its proposals in this area, we refer only to
Ofgem’s minimum proposals as set out in their “Promote and Secure” initiative. These
minimum proposals, which are detailed in Section 13.2, are limited to a 30% Day-Ahead
Trading Requirement as well as new license conditions which stipulate “Fair and
Reasonable Trading Terms”. Interventions which potentially would cut across these specific
(minimum) initiatives would score poorly on this criterion.
A4 EU Target Model: Similarly, interventions in the GB market must not introduce market and
trading arrangements which are inconsistent with the basic design components in the EU
Target Model.
A5 EMIR/MiFID II: In addition to being aligned with other reform initiatives, interventions
should also be compliant with financial regulations such as EMIR and MiFID II.
A6 REMIT: Similarly, interventions must not inhibit participants’ ability to comply with REMIT.
8.5 Assessment Scoring
Scoring Metrics
8.5.1 In order to promote consistent evaluation of individual interventions as well as enable
meaningful comparison of different options, the performance against each assessment criteria is
assigned a score in accordance with the metrics set out in the Table 3 below:
Table 3: Scoring Metric
Benefits Cost & Risks Compliance & Alignment
Ranking Score Ranking Score Ranking Score
Neutral 0 Neutral 0
Hinders -3 Modest 1 Modest -1
Material 2 Material -2
Important 3 Important -3 Neutral 0
Substantial 4 Substantial -4 Augments 1
8.5.2 As illustrated, 0 (nil) represents the neutral impact across all three categories with benefits being
assigned a positive score and costs & risks a negative score. In the Compliance & alignment
category, a neutral score reflects that the intervention either does not impact compliance or is
compliant. An intervention that directly hinders other reforms and/or is not compliant with
financial regulations is assigned a high negative score (-3), whereas options which positively
supports receives a modest positive score (1).
8.5.3 In order to support consistent grading and comparison across different interventions, Appendix A
details grading guidelines for each criterion and provides benchmarks for Neutral, Material and
Substantial. The “Important” and “Modest” is applied where we judge the performance falls
between these benchmarks.
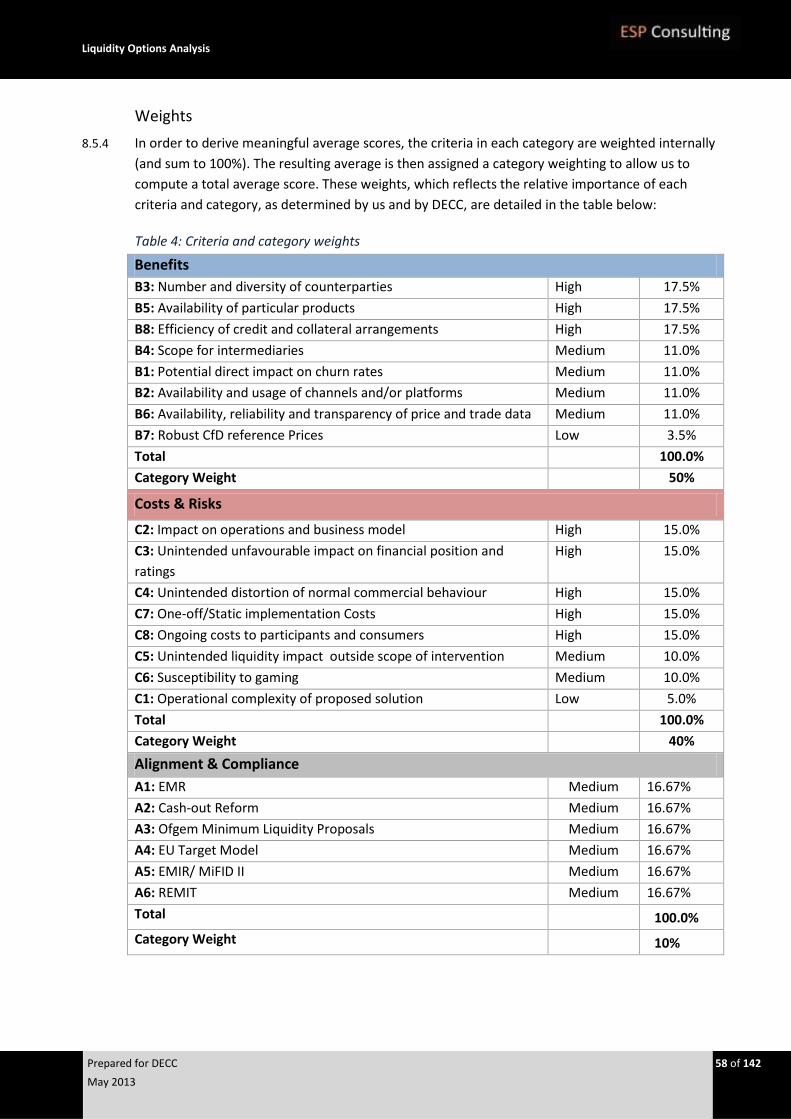
Liquidity Options Analysis
Prepared for DECC 58 of 142
May 2013
Weights
8.5.4 In order to derive meaningful average scores, the criteria in each category are weighted internally
(and sum to 100%). The resulting average is then assigned a category weighting to allow us to
compute a total average score. These weights, which reflects the relative importance of each
criteria and category, as determined by us and by DECC, are detailed in the table below:
Table 4: Criteria and category weights
Benefits
B3: Number and diversity of counterparties High 17.5%
B5: Availability of particular products High 17.5%
B8: Efficiency of credit and collateral arrangements High 17.5%
B4: Scope for intermediaries Medium 11.0%
B1: Potential direct impact on churn rates Medium 11.0%
B2: Availability and usage of channels and/or platforms Medium 11.0%
B6: Availability, reliability and transparency of price and trade data Medium 11.0%
B7: Robust CfD reference Prices Low 3.5%
Total 100.0%
Category Weight 50%
Costs & Risks
C2: Impact on operations and business model High 15.0%
C3: Unintended unfavourable impact on financial position and
ratings
High 15.0%
C4: Unintended distortion of normal commercial behaviour High 15.0%
C7: One-off/Static implementation Costs High 15.0%
C8: Ongoing costs to participants and consumers High 15.0%
C5: Unintended liquidity impact outside scope of intervention Medium 10.0%
C6: Susceptibility to gaming Medium 10.0%
C1: Operational complexity of proposed solution Low 5.0%
Total 100.0%
Category Weight 40%
Alignment & Compliance
A1: EMR Medium 16.67%
A2: Cash-out Reform Medium 16.67%
A3: Ofgem Minimum Liquidity Proposals Medium 16.67%
A4: EU Target Model Medium 16.67%
A5: EMIR/ MiFID II Medium 16.67%
A6: REMIT Medium 16.67%
Total 100.0%
Category Weight 10%

Liquidity Options Analysis
Prepared for DECC 59 of 142
May 2013
9 Physical Self-Supply Restrictions
9.1 Option Definition
Introduction
9.1.1 We define a Self-Supply Restriction (SSR) as a partial or complete restriction on the amount of
physical consumption a company can supply from its own internal generation sources (or vice
versa). It is assumed that the SSR itself can be monitored and controlled through the subject
companies’ Elexon generation and consumption accounts. Hence, the SSR will require the subject
companies to demonstrate that their supply and generation accounts were sourced externally in
line with the required SSR threshold which in practice amounts to a restriction on the extent of
inter-company trades between these accounts.
9.1.2 Tying the SSR to the Elexon accounts offers significant practical advantages, as the monitoring
and reporting infrastructure required to control the SSR broadly already exists. However, we do
question the possibility of monitoring generation and consumption positions where the entity in
question transfers such positions to a separate trading function with its own Elexon accounts.
While we suspect that this potential issue is solvable, the mechanics of monitoring SSRs would
need to be explored further with Elexon prior to decision to proceed with this intervention.
9.1.3 The remainder of this chapter and the chapter following assume that the SSR primarily would be
targeted at the Big Six. However, the Big Six might well argue that such a SSR is discriminatory as
it places them at a disadvantage relative to other (non Big-Six) players, some of whom also enjoy
some degree of VI. Notwithstanding the focus on the remainder of this section, one could in
principle imagine a much wider scope encapsulating any market participant with both up- and
downstream positions.
9.1.4 The SSR is aimed at stimulating liquidity by forcing the subject companies (e.g. the Big Six) to
trade their up- and downstream positions separately. However, this restriction does not remove
or constrain the fundamental value of the VI P&L hedge (one of the key VI benefits discussed in
Section 5.4). Even with a complete (100%) SSR, the company’s overall financial performance
would ultimately be a function of the margin between fuel and carbon prices and end customer
tariffs/prices. The wholesale power price itself has limited impact on the overall P&L
performance at Group level, provided the entity in question manages to sell (generation) and buy
(supplies) at roughly the same prices. This can obviously be achieved by hedging both generation
and supply volumes at the same rate.
9.1.5 This observation potentially leaves the SSR susceptible to gaming. It also creates a risk that a
subject company might decide to dump all its volume in a particular products and/or market
platform. The SSR therefore requires supplementary restrictions on the choice of market
channels as well as the tenor of trading. These additional restrictions, which we discuss further
later in this section, add considerable operational complexity to the SSR as neither can be
monitored (and hence controlled) via the Elexon accounts.
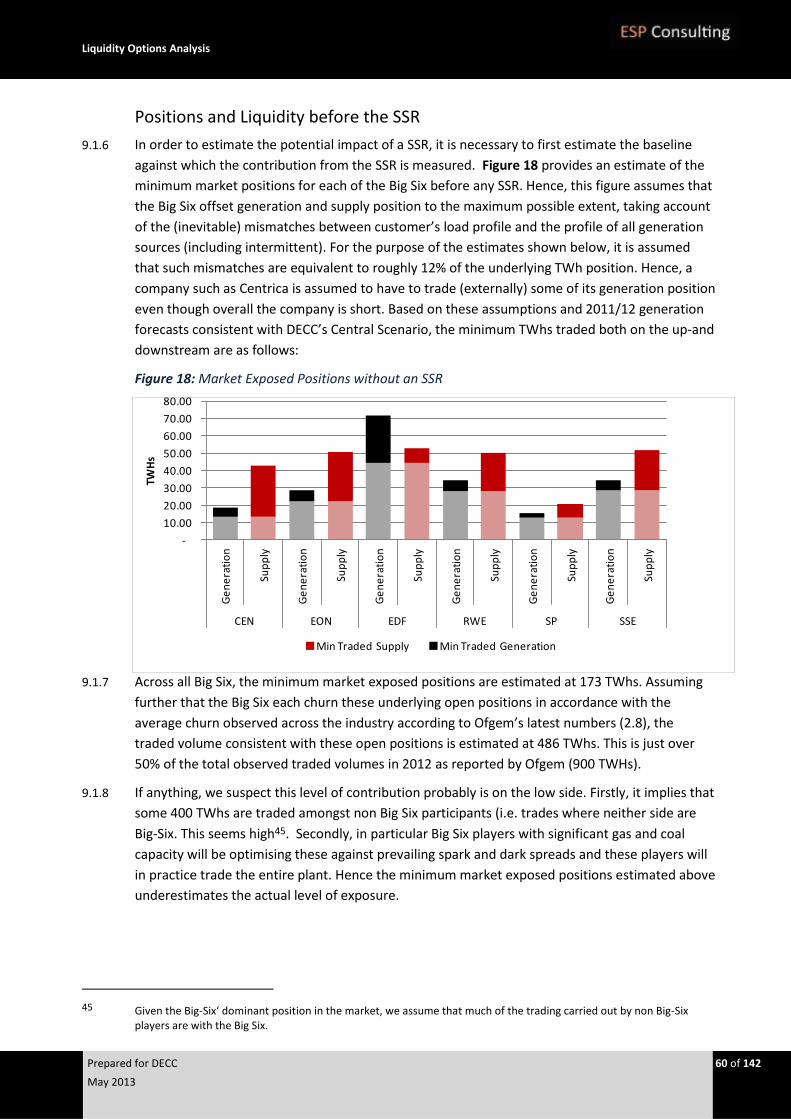
Liquidity Options Analysis
Prepared for DECC 60 of 142
May 2013
Positions and Liquidity before the SSR
9.1.6 In order to estimate the potential impact of a SSR, it is necessary to first estimate the baseline
against which the contribution from the SSR is measured. Figure 18 provides an estimate of the
minimum market positions for each of the Big Six before any SSR. Hence, this figure assumes that
the Big Six offset generation and supply position to the maximum possible extent, taking account
of the (inevitable) mismatches between customer’s load profile and the profile of all generation
sources (including intermittent). For the purpose of the estimates shown below, it is assumed
that such mismatches are equivalent to roughly 12% of the underlying TWh position. Hence, a
company such as Centrica is assumed to have to trade (externally) some of its generation position
even though overall the company is short. Based on these assumptions and 2011/12 generation
forecasts consistent with DECC’s Central Scenario, the minimum TWhs traded both on the up-and
downstream are as follows:
Figure 18: Market Exposed Positions without an SSR
9.1.7 Across all Big Six, the minimum market exposed positions are estimated at 173 TWhs. Assuming
further that the Big Six each churn these underlying open positions in accordance with the
average churn observed across the industry according to Ofgem’s latest numbers (2.8), the
traded volume consistent with these open positions is estimated at 486 TWhs. This is just over
50% of the total observed traded volumes in 2012 as reported by Ofgem (900 TWHs).
9.1.8 If anything, we suspect this level of contribution probably is on the low side. Firstly, it implies that
some 400 TWhs are traded amongst non Big Six participants (i.e. trades where neither side are
Big-Six. This seems high45. Secondly, in particular Big Six players with significant gas and coal
capacity will be optimising these against prevailing spark and dark spreads and these players will
in practice trade the entire plant. Hence the minimum market exposed positions estimated above
underestimates the actual level of exposure.
45 Given the Big-Six‘ dominant position in the market, we assume that much of the trading carried out by non Big-Six
players are with the Big Six.
-
10.00
20.00
30.00
40.00
50.00
60.00
70.00
80.00
Ge
ne
rati
on
Sup
ply
Ge
ne
rati
on
Sup
ply
Ge
ne
rati
on
Sup
ply
Ge
ne
rati
on
Sup
ply
Ge
ne
rati
on
Sup
ply
Ge
ne
rati
on
Sup
ply
CEN EON EDF RWE SP SSE
TWH
s
Min Traded Supply Min Traded Generation
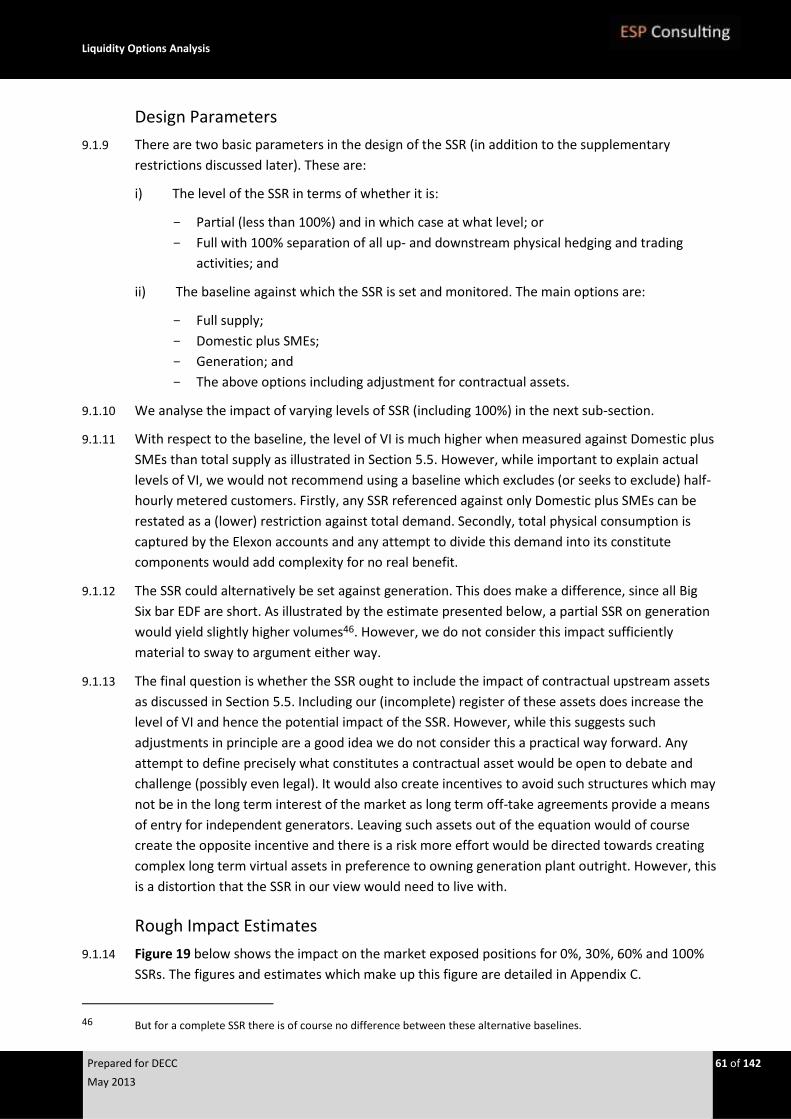
Liquidity Options Analysis
Prepared for DECC 61 of 142
May 2013
Design Parameters
9.1.9 There are two basic parameters in the design of the SSR (in addition to the supplementary
restrictions discussed later). These are:
i) The level of the SSR in terms of whether it is:
- Partial (less than 100%) and in which case at what level; or
- Full with 100% separation of all up- and downstream physical hedging and trading
activities; and
ii) The baseline against which the SSR is set and monitored. The main options are:
- Full supply;
- Domestic plus SMEs;
- Generation; and
- The above options including adjustment for contractual assets.
9.1.10 We analyse the impact of varying levels of SSR (including 100%) in the next sub-section.
9.1.11 With respect to the baseline, the level of VI is much higher when measured against Domestic plus
SMEs than total supply as illustrated in Section 5.5. However, while important to explain actual
levels of VI, we would not recommend using a baseline which excludes (or seeks to exclude) half-
hourly metered customers. Firstly, any SSR referenced against only Domestic plus SMEs can be
restated as a (lower) restriction against total demand. Secondly, total physical consumption is
captured by the Elexon accounts and any attempt to divide this demand into its constitute
components would add complexity for no real benefit.
9.1.12 The SSR could alternatively be set against generation. This does make a difference, since all Big
Six bar EDF are short. As illustrated by the estimate presented below, a partial SSR on generation
would yield slightly higher volumes46. However, we do not consider this impact sufficiently
material to sway to argument either way.
9.1.13 The final question is whether the SSR ought to include the impact of contractual upstream assets
as discussed in Section 5.5. Including our (incomplete) register of these assets does increase the
level of VI and hence the potential impact of the SSR. However, while this suggests such
adjustments in principle are a good idea we do not consider this a practical way forward. Any
attempt to define precisely what constitutes a contractual asset would be open to debate and
challenge (possibly even legal). It would also create incentives to avoid such structures which may
not be in the long term interest of the market as long term off-take agreements provide a means
of entry for independent generators. Leaving such assets out of the equation would of course
create the opposite incentive and there is a risk more effort would be directed towards creating
complex long term virtual assets in preference to owning generation plant outright. However, this
is a distortion that the SSR in our view would need to live with.
Rough Impact Estimates
9.1.14 Figure 19 below shows the impact on the market exposed positions for 0%, 30%, 60% and 100%
SSRs. The figures and estimates which make up this figure are detailed in Appendix C.
46 But for a complete SSR there is of course no difference between these alternative baselines.
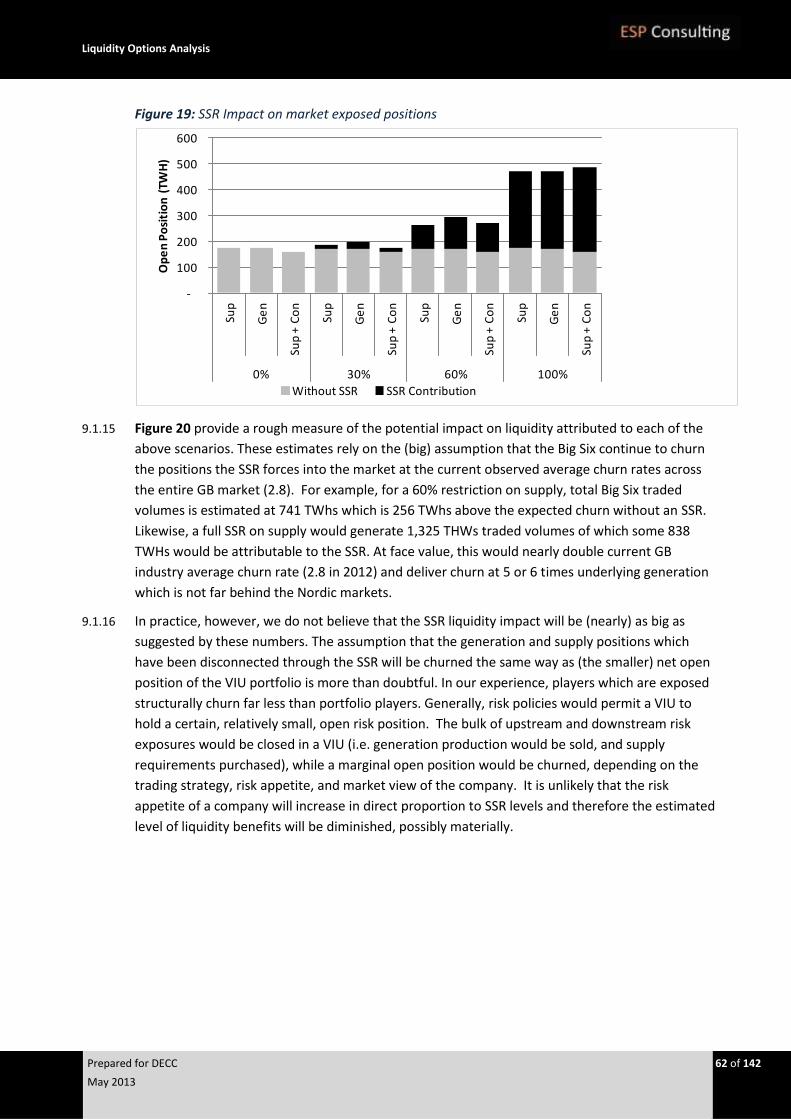
Liquidity Options Analysis
Prepared for DECC 62 of 142
May 2013
Figure 19: SSR Impact on market exposed positions
9.1.15 Figure 20 provide a rough measure of the potential impact on liquidity attributed to each of the
above scenarios. These estimates rely on the (big) assumption that the Big Six continue to churn
the positions the SSR forces into the market at the current observed average churn rates across
the entire GB market (2.8). For example, for a 60% restriction on supply, total Big Six traded
volumes is estimated at 741 TWhs which is 256 TWhs above the expected churn without an SSR.
Likewise, a full SSR on supply would generate 1,325 THWs traded volumes of which some 838
TWHs would be attributable to the SSR. At face value, this would nearly double current GB
industry average churn rate (2.8 in 2012) and deliver churn at 5 or 6 times underlying generation
which is not far behind the Nordic markets.
9.1.16 In practice, however, we do not believe that the SSR liquidity impact will be (nearly) as big as
suggested by these numbers. The assumption that the generation and supply positions which
have been disconnected through the SSR will be churned the same way as (the smaller) net open
position of the VIU portfolio is more than doubtful. In our experience, players which are exposed
structurally churn far less than portfolio players. Generally, risk policies would permit a VIU to
hold a certain, relatively small, open risk position. The bulk of upstream and downstream risk
exposures would be closed in a VIU (i.e. generation production would be sold, and supply
requirements purchased), while a marginal open position would be churned, depending on the
trading strategy, risk appetite, and market view of the company. It is unlikely that the risk
appetite of a company will increase in direct proportion to SSR levels and therefore the estimated
level of liquidity benefits will be diminished, possibly materially.
-
100
200
300
400
500
600
Sup
Ge
n
Sup
+ C
on
Sup
Ge
n
Sup
+ C
on
Sup
Ge
n
Sup
+ C
on
Sup
Ge
n
Sup
+ C
on
0% 30% 60% 100%
Op
en
Po
siti
on
(TW
H)
Without SSR SSR Contribution
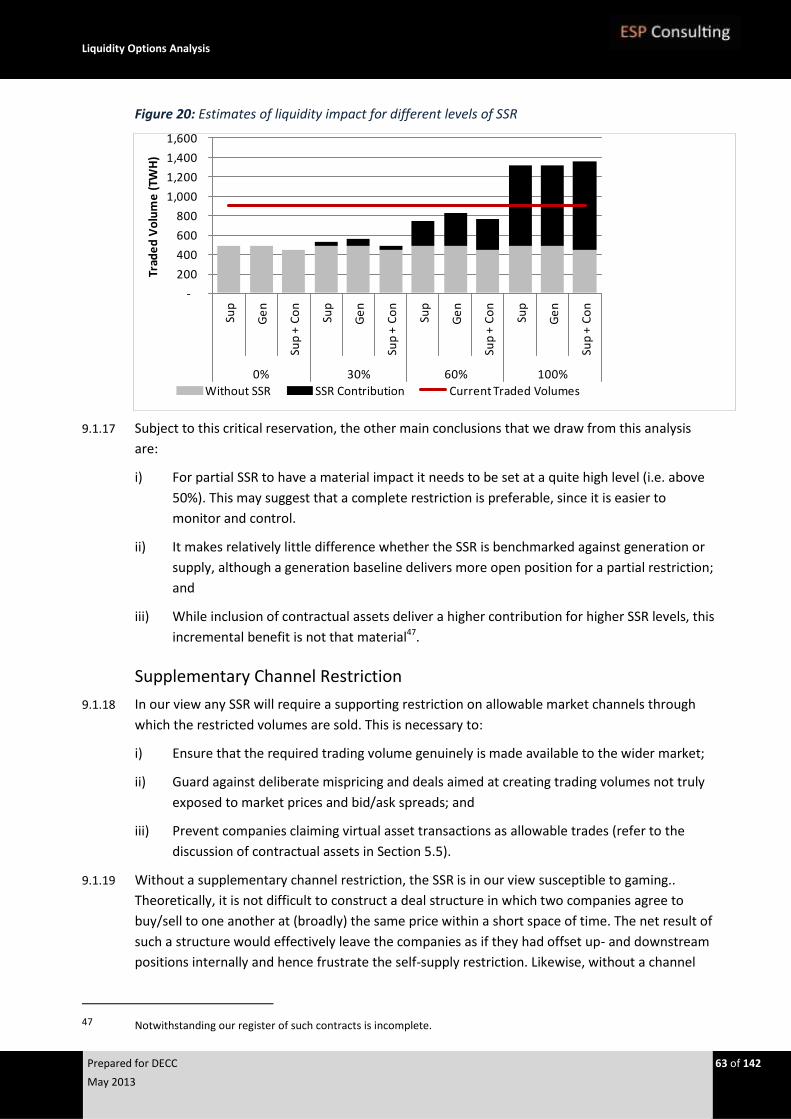
Liquidity Options Analysis
Prepared for DECC 63 of 142
May 2013
Figure 20: Estimates of liquidity impact for different levels of SSR
9.1.17 Subject to this critical reservation, the other main conclusions that we draw from this analysis
are:
i) For partial SSR to have a material impact it needs to be set at a quite high level (i.e. above
50%). This may suggest that a complete restriction is preferable, since it is easier to
monitor and control.
ii) It makes relatively little difference whether the SSR is benchmarked against generation or
supply, although a generation baseline delivers more open position for a partial restriction;
and
iii) While inclusion of contractual assets deliver a higher contribution for higher SSR levels, this
incremental benefit is not that material47.
Supplementary Channel Restriction
9.1.18 In our view any SSR will require a supporting restriction on allowable market channels through
which the restricted volumes are sold. This is necessary to:
i) Ensure that the required trading volume genuinely is made available to the wider market;
ii) Guard against deliberate mispricing and deals aimed at creating trading volumes not truly
exposed to market prices and bid/ask spreads; and
iii) Prevent companies claiming virtual asset transactions as allowable trades (refer to the
discussion of contractual assets in Section 5.5).
9.1.19 Without a supplementary channel restriction, the SSR is in our view susceptible to gaming..
Theoretically, it is not difficult to construct a deal structure in which two companies agree to
buy/sell to one another at (broadly) the same price within a short space of time. The net result of
such a structure would effectively leave the companies as if they had offset up- and downstream
positions internally and hence frustrate the self-supply restriction. Likewise, without a channel
47 Notwithstanding our register of such contracts is incomplete.
-
200
400
600
800
1,000
1,200
1,400
1,600
Sup
Ge
n
Sup
+ C
on
Sup
Ge
n
Sup
+ C
on
Sup
Ge
n
Sup
+ C
on
Sup
Ge
n
Sup
+ C
on
0% 30% 60% 100%
Trad
ed
Vo
lum
e (
TWH
)
Without SSR SSR Contribution Current Traded Volumes
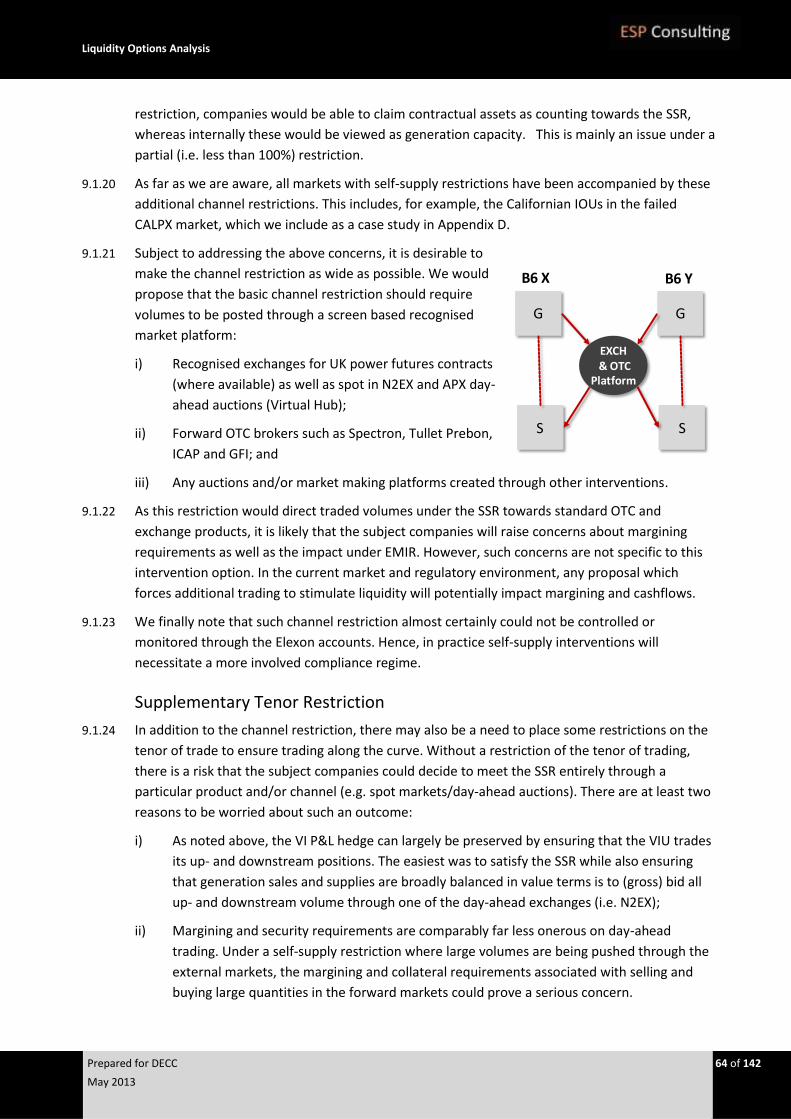
Liquidity Options Analysis
Prepared for DECC 64 of 142
May 2013
restriction, companies would be able to claim contractual assets as counting towards the SSR,
whereas internally these would be viewed as generation capacity. This is mainly an issue under a
partial (i.e. less than 100%) restriction.
9.1.20 As far as we are aware, all markets with self-supply restrictions have been accompanied by these
additional channel restrictions. This includes, for example, the Californian IOUs in the failed
CALPX market, which we include as a case study in Appendix D.
9.1.21 Subject to addressing the above concerns, it is desirable to
make the channel restriction as wide as possible. We would
propose that the basic channel restriction should require
volumes to be posted through a screen based recognised
market platform:
i) Recognised exchanges for UK power futures contracts
(where available) as well as spot in N2EX and APX day-
ahead auctions (Virtual Hub);
ii) Forward OTC brokers such as Spectron, Tullet Prebon,
ICAP and GFI; and
iii) Any auctions and/or market making platforms created through other interventions.
9.1.22 As this restriction would direct traded volumes under the SSR towards standard OTC and
exchange products, it is likely that the subject companies will raise concerns about margining
requirements as well as the impact under EMIR. However, such concerns are not specific to this
intervention option. In the current market and regulatory environment, any proposal which
forces additional trading to stimulate liquidity will potentially impact margining and cashflows.
9.1.23 We finally note that such channel restriction almost certainly could not be controlled or
monitored through the Elexon accounts. Hence, in practice self-supply interventions will
necessitate a more involved compliance regime.
Supplementary Tenor Restriction
9.1.24 In addition to the channel restriction, there may also be a need to place some restrictions on the
tenor of trade to ensure trading along the curve. Without a restriction of the tenor of trading,
there is a risk that the subject companies could decide to meet the SSR entirely through a
particular product and/or channel (e.g. spot markets/day-ahead auctions). There are at least two
reasons to be worried about such an outcome:
i) As noted above, the VI P&L hedge can largely be preserved by ensuring that the VIU trades
its up- and downstream positions. The easiest was to satisfy the SSR while also ensuring
that generation sales and supplies are broadly balanced in value terms is to (gross) bid all
up- and downstream volume through one of the day-ahead exchanges (i.e. N2EX);
ii) Margining and security requirements are comparably far less onerous on day-ahead
trading. Under a self-supply restriction where large volumes are being pushed through the
external markets, the margining and collateral requirements associated with selling and
buying large quantities in the forward markets could prove a serious concern.
G
S
G
S
EXCH& OTC
Platform
B6 YB6 X

Liquidity Options Analysis
Prepared for DECC 65 of 142
May 2013
9.1.25 With respect to item i) above, we note that this is not a concern about the gross bidding
arrangements currently deployed by the Big Six on N2EX. As discussed in Section 13.2, in our view
gross bidding does not remove the incentive to submit economically correct bids and offers into a
cleared day-ahead auction. Hence, the concern is not manipulation of auction prices, but simply
that an SSR without a tenor restriction might incentivise short-term over forward trading.
9.1.26 Combined with the margining and collateral concern, there is in our view a risk that an SSR could
end up destroying forward liquidity, creating serious market distortions which, for example, could
see hedging opportunities for independent suppliers severely restricted. Therefore it is necessary
to supplement the SSR with a tenor requirement which ensures that a share of trading takes
place in forward instruments. However, such a supplementary requirement could clearly not be
monitored or controlled via the Elexon accounts, adding to the complexity of monitoring and
controlling the SSR.
9.2 Assessment of Partial SSR
9.2.1 Our assessment of a Partial SSR is detailed in Appendix F.
9.2.2 As explained above, within the current industry structure a Partial SSR needs to be fairly
significant in order to have any real impact. We have therefore assumed an SSR level of 60% (or
above) for the purpose of this assessment. It is further assumed that channel and tenor
restrictions are implemented as described above. Applying the Analytical Framework as
summarised below and detailed in Appendix F, the Partial SSR scores negatively overall on both
an un-weighted and weighted basis.
Benefits:
9.2.3 Based on our analysis, a 60% restriction on self-supply would increase Big Six traded volumes by
around 250 TWhs (assuming that companies churn these additional positions in line with current
average industry churn rates). This is clearly a material support to market liquidity. However,
churn rates for these positions may differ from current industry averages. In fact we believe it is
likely that the average churn (per MWh open position) will decrease with increasing restriction
levels, thus offsetting some of the benefit of enlarging the VIUs open positions through the SSR.
It is our opinion that for a 60% restriction such effects will most likely be relatively small.
Costs and Risks:
9.2.4 The cost of implementing a Partial restriction depends critically on whether or not such a
restriction can be readily monitored and controlled via the existing Elexon generation and
consumption accounts and reporting capabilities48. Provided this assumption holds, the main
operational complexity stems from controlling the accompanying channel and tenor restrictions,
neither of which can be monitored via the Elexon accounts. We believe these requirements
would place material compliance and reporting burdens on the subject companies. However, we
do not expect that this assumption holds for companies which transfer their position to a central
48 The systems operated by Elexon record the net quantities traded between parties as well as the physical quantities
delivered. This information is required to verify any SSR.
Liquidity Options Analysis
Prepared for DECC 66 of 142
May 2013
trading function (i.e. most of the Big Six) in advance of delivery. Where the Partial SSR cannot be
controlled via the Elexon accounts, material implementation costs could be required to modify
Elexon’s internal systems. In any event, we assume that the channel and tenor restrictions
mainly will be monitored through obligations on the subject companies to demonstrate
compliance. We suspect that these reporting and accompanying modifications to existing trading
systems may not be entirely trivial. Companies with significant contractual assets may be able to
understate their true generation position and therefore limit the proportion of their total
nominal generation volume subject to this intervention.
9.2.5 Additionally, the Partial SSR erodes some of the benefits associated with VI business models (e.g.
ability to net up and downstream positions internally with a resulting savings on the bid/ask
spread) and will require a number of new business processes to support the compliance and
monitoring regime. The additional churn associated with the Partial SSR could contribute to
pushing a company above the EMIR thresholds and more generally imposes additional margining
requirements, but does not fundamentally erode the VI business model and would not likely in
itself expose the subject companies to the risk of a ratings downgrade.
Alignment & Compliance
9.2.6 A Partial SSR does not conflict with or hinder the various EU and GB reform initiatives, nor
financial regulations such as EMIR or REMIT. While any intervention which increases liquidity and
churn also increases the risk of breaching the EMIR thresholds, it does not hinder or prevent a
company from complying with the regulation. However, we do find that a SSR potentially could
conflict with Ofgem’s minimum liquidity proposals, which includes a Day-Ahead gross bidding
requirement. It is possible that the level of the SSR under a Partial SSR intervention would still
leave sufficient room to accommodate Ofgem’s minimum Day-Ahead gross bidding requirement,
but such a solution would nonetheless impose divergent and inconsistent trading requirements49
.
9.3 Assessment of Full SSR
9.3.1 Our assessment of a Full SSR is detailed in Appendix F.
9.3.2 The Full SSR, by which we refer to a SSR with a 100% restriction, scores negatively overall on both
an un-weighted and weighted basis under the Analytical Framework, as summarised below and
detailed in Appendix F. Both measures are very close to the average scores achieved by the
Partial options, but this similarity camouflages a number of differences in the scoring of individual
criteria.
Benefits:
9.3.3 At face value, implementation of a Full SSR would nearly double the current GB industry average
churn rate (2.8 in 2012) and deliver churn at 5 or 6 times underlying generation, a factor which is
not far behind the Nordic markets. However, as noted above, these estimates assume that
trading behaviour and churn rates are unchanged by the SSR itself. The assumption that the
49 Under gross bidding arrangements the portfolio is kept together to enable trading on both sides of the market whereas
under the SSR the requirement is to separate up- and downstream trading requirements.
Liquidity Options Analysis
Prepared for DECC 67 of 142
May 2013
generation and supply positions which have been disconnected through the SSR will be churned
the same way as (the smaller) net open position of the VIU portfolio is more than doubtful. In our
experience, players who have structural exposures will churn far less than portfolio players, as
they are not able to use proprietary trading to disguise whether they are entering the market
from a long or short position (their underlying position is known to all). Hence, we believe it is
likely that the trading behaviour will change in response to a Full SSR and that this will materially
diminish the estimated level of liquidity benefits relative to a simplistic assumption where churn
behaviour is unchanged.
Costs and Risks
9.3.4 A Full SSR will eliminate the need to segregate the GB market portfolio into SSR and non-SSR
components and will therefore simplify the monitoring and reporting requirements associated
with the SSR itself as well as the supplementary Channel and Tenor restrictions compared to the
Partial SSR option. This simplification of the monitoring and control regime holds for both Elexon
as well as within the subject companies. As in the case of the Partial option, we assume that the
SSR restriction itself can be monitored (and hence controlled) via the Elexon generation and
consumption accounts. Greater costs will obviously be incurred should this not prove to be
correct. Furthermore, the Full SSR exacerbates the erosion of VIU benefits compared to the
Partial option, leaving a larger nominal amount of bid/ask spread in the market, and increasing
the risk that higher trading volumes leaves the company above the EMIR threshold.
Alignment & Compliance
9.3.5 In our assessment, a Full SSR does not conflict with or hinder the various EU and GB reform
initiatives, nor does it conflict with financial regulations such as EMIR or REMIT. While increasing
the SSR to 100% may further increase the risk that the affected participants may breach the EMIR
thresholds (addressed above), it does not prevent compliance with the regulation itself. In
contrast to the Partial option, however, a Full SSR will not in any circumstances be consistent with
a minimum Day-Ahead gross bidding requirement. Hence, we judge this option to conflict with
and hinder Ofgem’s minimum liquidity proposals.
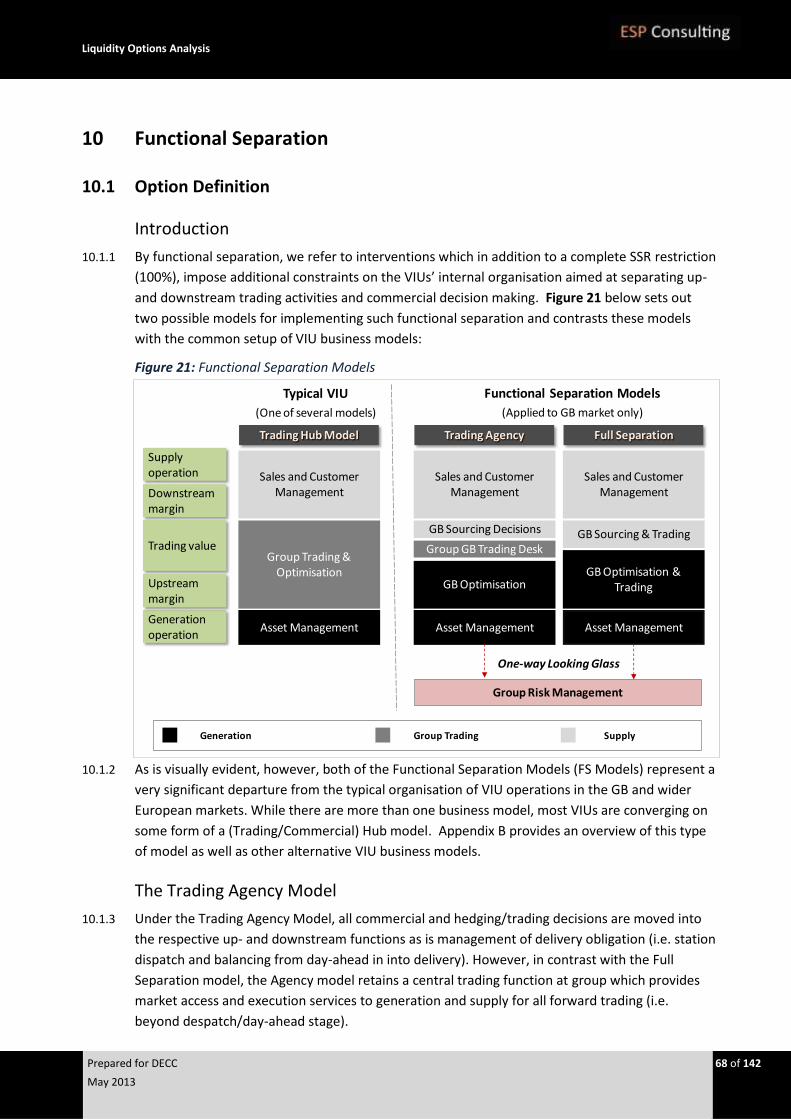
Liquidity Options Analysis
Prepared for DECC 68 of 142
May 2013
10 Functional Separation
10.1 Option Definition
Introduction
10.1.1 By functional separation, we refer to interventions which in addition to a complete SSR restriction
(100%), impose additional constraints on the VIUs’ internal organisation aimed at separating up-
and downstream trading activities and commercial decision making. Figure 21 below sets out
two possible models for implementing such functional separation and contrasts these models
with the common setup of VIU business models:
Figure 21: Functional Separation Models
10.1.2 As is visually evident, however, both of the Functional Separation Models (FS Models) represent a
very significant departure from the typical organisation of VIU operations in the GB and wider
European markets. While there are more than one business model, most VIUs are converging on
some form of a (Trading/Commercial) Hub model. Appendix B provides an overview of this type
of model as well as other alternative VIU business models.
The Trading Agency Model
10.1.3 Under the Trading Agency Model, all commercial and hedging/trading decisions are moved into
the respective up- and downstream functions as is management of delivery obligation (i.e. station
dispatch and balancing from day-ahead in into delivery). However, in contrast with the Full
Separation model, the Agency model retains a central trading function at group which provides
market access and execution services to generation and supply for all forward trading (i.e.
beyond despatch/day-ahead stage).
Trading Agency
Generation operation
Supply operation
Downstream margin
Trading value
Upstream margin
Full Separation
Sales and Customer Management
Asset Management
Sales and Customer Management
Group GB Trading Desk
Asset Management
Group Risk Management
One-way Looking Glass
Trading Hub Model
Sales and Customer Management
Group Trading & Optimisation
Asset Management
GB Sourcing & Trading
GB Optimisation & Trading
Typical VIU
(One of several models)
Functional Separation Models
(Applied to GB market only)
GB Optimisation
GB Sourcing Decisions
Generation Group Trading Supply
Liquidity Options Analysis
Prepared for DECC 69 of 142
May 2013
10.1.4 In effect, the central trading function acts as an internal broker which takes orders from the up-
and downstream division, but has no visibility of the underlying asset or sales positions and
accompanying hedging and trading decisions which such orders serve. In contrast to a normal
agency model (refer Appendix B), the trading function is not allowed to settle orders internally50 .
It is however allowed to manage credit and margining risk across all counterparties.
10.1.5 In the immediate aftermath of NETA, one or two GB VIUs did implement a version of the Trading
Agency model51, but these were subsequently abandoned in part in light of the risk management
concerns discussed later in this section. There are some current examples of the agency model.
The Full Separation Model
10.1.6 As the label suggests, the Full Separation model requires complete operational and commercial
separation of up- and downstream business functions. Under this model generation and supply
operates as completely separate businesses, each with fully equipped trading functions (and
accompanying analytical and operational support systems and business processes).
10.1.7 These separate trading functions are responsible for all market interfaces through to delivery
and settlement on behalf of their respective “parent” business. Hence, they effectively operate as
independent third parties, but with the added requirement that they cannot trade with one
another. In order to facilitate complete separation of all market and settlement processes (i.e.
Elexon), these trading functions have to operate from separate legal entities.
10.1.8 To our knowledge, no VIU has ever adopted this model on a commercial voluntary basis.
However, the current agency type model imposed on ESB in Ireland was preceded by stronger
regulatory ring-fencing obligations which mirror the Full Separation model. Likewise, Japan has
recently announced its intension to break up incumbent VIU structures into separate generation
and supply businesses. Both these examples are described in further detail in Appendix D.
10.1.9 In addition to the basic setup outlined above, both Functional Separation models create
requirements for the setup of risk management, compliance and operations.
Risk management requirements
10.1.10 Under either of the FS Models, some risk management oversight at group level will be required in
order to:
i) Protect the company against accidental (unintended) speculative positions emerging; and
ii) Coordinate credit and collateral exposures (which can only be managed at group level)
10.1.11 Figure22 below illustrates how speculative positions might occur accidentally in the absence of
overarching control and monitoring by a Group Risk Management function:
50 Hence, the trading function cannot utilise portfolio offsets and must source all orders from the external markets.
51 In part motivated by a desire to lessen or eliminate internal tensions and arguments about the benchmark for transfers asset and sales positions into the Trading Books.
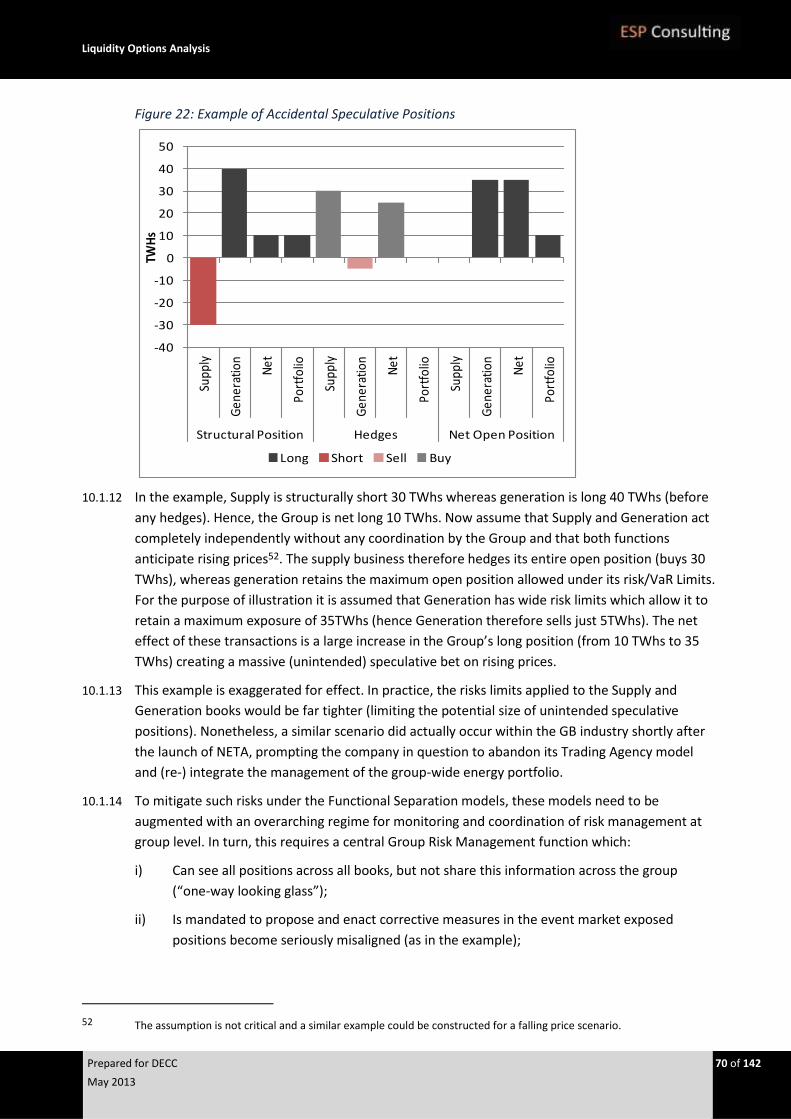
Liquidity Options Analysis
Prepared for DECC 70 of 142
May 2013
Figure 22: Example of Accidental Speculative Positions
10.1.12 In the example, Supply is structurally short 30 TWhs whereas generation is long 40 TWhs (before
any hedges). Hence, the Group is net long 10 TWhs. Now assume that Supply and Generation act
completely independently without any coordination by the Group and that both functions
anticipate rising prices52. The supply business therefore hedges its entire open position (buys 30
TWhs), whereas generation retains the maximum open position allowed under its risk/VaR Limits.
For the purpose of illustration it is assumed that Generation has wide risk limits which allow it to
retain a maximum exposure of 35TWhs (hence Generation therefore sells just 5TWhs). The net
effect of these transactions is a large increase in the Group’s long position (from 10 TWhs to 35
TWhs) creating a massive (unintended) speculative bet on rising prices.
10.1.13 This example is exaggerated for effect. In practice, the risks limits applied to the Supply and
Generation books would be far tighter (limiting the potential size of unintended speculative
positions). Nonetheless, a similar scenario did actually occur within the GB industry shortly after
the launch of NETA, prompting the company in question to abandon its Trading Agency model
and (re-) integrate the management of the group-wide energy portfolio.
10.1.14 To mitigate such risks under the Functional Separation models, these models need to be
augmented with an overarching regime for monitoring and coordination of risk management at
group level. In turn, this requires a central Group Risk Management function which:
i) Can see all positions across all books, but not share this information across the group
(“one-way looking glass”);
ii) Is mandated to propose and enact corrective measures in the event market exposed
positions become seriously misaligned (as in the example);
52 The assumption is not critical and a similar example could be constructed for a falling price scenario.
-40
-30
-20
-10
0
10
20
30
40
50
Supp
ly
Gen
erat
ion
Net
Port
folio
Supp
ly
Gen
erat
ion
Net
Port
folio
Supp
ly
Gen
erat
ion
Net
Port
folio
Structural Position Hedges Net Open Position
TWH
s
Long Short Sell Buy
Liquidity Options Analysis
Prepared for DECC 71 of 142
May 2013
iii) Is operational responsible for managing all credit risk as well as collateral and margining
exposures across the group.
10.1.15 ESB in Ireland, which as explained in Appendix D has been operating at different times under
regulatory ring-fencing obligations similar to both Function Separation models, have deployed
such monitoring and supervision at group level to mitigate such risks and control deficiencies.
Compliance requirements
10.1.16 The FS Models require additional compliance controls, over and above the monitoring of Elexon
generation and consumption accounts for inter-company (physical) trades. These controls need
to enable monitoring and ensure that communications and data passing between the restricted
entities do not extend beyond what such entities naturally would exchange were they truly
separate competing market participants. For example, in the Trading Agency model,
communications between the Trading Function and the up- and downstream businesses should
be limited to the order placement and confirmation process that such participants typically would
exchange with a third party broker. In particular, there can be no communication or sharing of
generation or supply forecasts or other information a truly independent company would not
want to share with a broker.
10.1.17 In practice it is nearly impossible to monitor and enforce such compliance externally. Where
similar requirements have been put in place (for example ESB), they are typically implemented
and enforced by obliging the company to create an internal Compliance Office role. To ensure
that this role “has teeth” and is taken seriously internally, deliberate non-compliance or failure to
act on material compliance issues subsequently identified must result in:
i) Serious disciplinary consequences for the Compliance Office (i.e. he or she is fired); and
ii) Substantive financial penalties (as well as non-financial disciplinary remedies) being
imposed on the company.
10.2 Assessment of Functional Separation – Agency Model
10.2.1 Our assessment of the Agency Model is detailed in Appendix F.
10.2.2 Under this model all commercial and hedging/trading decisions are moved into the respective up-
and downstream functions as is management of delivery obligation (i.e. station dispatch and
balancing from Day-ahead in into delivery). However, a central trading function is retained at
group level which provides market access and execution services to generation and supply for all
forward trading (i.e. beyond despatch/day-ahead stage). Applying the Analytical Framework as
summarised below and detailed in Appendix F, we evaluate the Agency Model negatively overall
on both an un-weighted and weighted basis. Our assessment of Functional Separation is more
unfavourable than the pure SSR options discussed in the chapter above.
Benefits
10.2.3 The Agency Model embeds a Full SSR, and thus limits (or, rather, eliminates) a company’s ability
to net positions internally, obliging the company to take all purchases and sales to the wholesale
market and thus, in theory, increasing market churn and liquidity. However, we believe this
Liquidity Options Analysis
Prepared for DECC 72 of 142
May 2013
option is likely to deliver a somewhat smaller contribution to trading volumes and churn than the
Full SSR intervention, and hence, by comparison, reduce the positive impact. With the delegation
of all commercial and trading decision making to the up- and downstream businesses,
respectively, it is in our experience likely that such decisions will become highly focused on (one-
directional) simple hedging activities. The fact that these decisions are transacted through a
central trading function does not, in our view, change this picture. Under the (ring-fenced)
Trading Agency model, this function has no visibility of the underlying generation and
consumption forecasts and no way of knowing (in advance) what trading orders the up- and
downstream businesses are likely to be and, in particular, when such orders will hit the trading
books. Hence, the central trading function will not be in a position to churn the underlying asset
and customer positions.
Costs and Risks
10.2.4 The Agency model marks a clear departure from the internal business model that unfettered VIUs
would pursue and seriously begins to erode the benefits associated with VI. As discussed in
Appendix B, many European VIUs operate commercial hubs which concentrate and consolidate
all trading and commercial decisions as well as all optimisation activities. Implementation of the
Agency model would therefore require some substantial re-engineering of processes, systems
and organisation to set up the new local up- and downstream optimisation functions, equip these
functions to act on their own, and create an interface to the central Trading Hub. In addition to
changes to operational systems and core business processes, it would force a subject company to
change its internal organisation, roles, and responsibilities for part of its business. It will also
entail some duplication of capabilities across each of the two separate optimisation functions.
These functions will, for example, need to be able to capture and record their internal trades with
the central Trading Hub as well as maintain separate position and risk reporting functionality. The
end result would essentially be a separate, and distinctly different, business models for GB, while
presumably the remainder of the company’s European business continues to operate with a
larger degree of vertical integration. Furthermore, as explained above, this model would also
require participants to implement a new compliance function as well as develop specific risk
management processes to enable the “one-way looking glass”. It is in our view a complex and
expensive solution for the participants to implement. Direct costs arise both through duplication
of systems and processes as well as through having to man two separate optimisation functions
as well as a new compliance functions.
10.2.5 While margining risks can still be managed and offset at group level, we believe it possible and
even probable that the Rating Agencies will be quite concerned about such an intervention. We
believe this type of model, in and of itself, could put genuine pressure on ratings performance.
10.2.6 As discussed above, all our experience suggests that portfolio players typically will churn a smaller
net open position more than directionally exposed players with large open generation or supply
positions. Participants who are structurally long or short cannot disguise their position in the
market by buying and selling, and they can adjust their exposure in the market by the timing
decisions of their hedging activities, rather than trading in and out of a position. In all likelihood,
the commercial and trading decision making in the separated up- and downstream optimization
functions will become highly focused on (one-directional) simple hedging activities.
Liquidity Options Analysis
Prepared for DECC 73 of 142
May 2013
Alignment & Compliance
10.2.7 We conclude that this intervention neither materially augments nor hinders the application of the
reforms and regulations set out in the Analytical Framework with two exceptions. Firstly, the
Agency Model, which delegates spot and delivery management to the new separate optimisation
functions, is not consistent with the 30% Day-Ahead gross-bidding requirement included within
Ofgem’s Minimum Liquidity Proposals as defined in Section 13.2. Secondly, REMIT requires
separate reporting for all generation and upstream activities, a requirement that this intervention
supports by separating these activities from the rest of the portfolio (although only in the GB).
10.3 Assessment of Functional Separation – Full Separation Model
10.3.1 Our assessment of the Full Separation Model is detailed in Appendix F.
10.3.2 As explained above, in this model all commercial and hedging/trading activities are restructured
from the trading function into the respective up- and downstream functions together with
management of the delivery obligation (i.e. station dispatch and balancing from Day-ahead into
delivery). Applying the Analytical Framework as summarised below and detailed in Appendix F,
the Full Separation Model scores negatively overall on both an un-weighted and weighted basis
based on our assessment of each individual criterion.
Benefits:
10.3.3 As for the other separation models (whether supply restrictions or constraints on the functional
organisation), the Full Separation Model obliges the company to take all purchases and sales to
the wholesale market, creating large, open generation and supply positions which previously did
not exist within the VIU. However, for the same reasons as given above for the Agency Model
intervention, we believe this option is likely to deliver a somewhat smaller contribution to trading
volumes and churn than the Full SSR intervention, and hence, by comparison, reduce the positive
impact. When all commercial and trading decision-making is delegated to the up- and
downstream businesses, in our experience it is likely that such decisions will become highly
focused on simple (one-directional) hedging activities. Hence, the benefit of separating up- and
downstream positions will be somewhat eroded.
Costs and Risks:
10.3.4 Complexity and financial costs are higher for the Full Separation Model than for the Agency
Model. The latter “just” requires ensuring that local GB Optimisation functions do not
communicate asset and sales positions to the central trading hub. In contrast, the Full Separation
Model is a complete departure from the typical VIU business model requiring that two new
trading entities for the GB region are extracted from the central hub. This will add considerable
operational complexity to the overall VIU operations as well as to costs. These new trading
functions will require their own systems (instances of the main VIU trading system), back-office
and middle office processes, separate and additional staff and so on. For settlement and
compliance purposes, we also assume that this option will require the new trading companies to
be set up in separate legal entities, something that adds material costs and reporting complexity.
Splitting the external market interface into three legal entities (two GB entities and a central
Liquidity Options Analysis
Prepared for DECC 74 of 142
May 2013
entity for other markets) will potentially also complicate group wide credit risk and margining
management. In addition to changes to operational systems and processes, it would force the
subject companies to radically change their internal organisation, roles, and responsibilities
within the new GB business areas and also with respect to the interface to the central functions
and group functions such as risk management. Even more so than under the Agency Model, the
end result would essentially be separate, and distinctly different, business models for the GB and
the rest of Europe.
10.3.5 The Full Separation Model would place some real and concerning constraints on a company’s
ability to manage collateral and margining (as well as EMIR thresholds). While in and outgoing
cash collateral will continue to be consolidated at group level, the ability to actively manage such
calls, for example through selective choice of counter-parties to exploit netting benefits, will be
restricted. Since the two GB trading functions must act independently of one another, they
cannot be allowed to see the total GB or group credit position. Hence, utilising group wide cross-
netting agreements effectively will become an issue.
10.3.6 This Full Separation Model would significantly erode VI benefits by (re-) introducing a business
model which is far more geared towards gross pools (e.g. SEM)53. In our view, rating agencies will
worry about the impact on competitiveness in the BETTA as well as EU Target model (as currently
defined). Rating agency credit assessments will normally include and give material weight to
company structure and competitive fit. In addition, agencies are likely to be concerned about the
trading and operational inefficiencies introduced by this model as well as the risk of further
regulatory interventions in other parts of their business. For VIUs with a substantial business in
the GB, this type of model would in our assessment put companies at risk of a (1 notch)
downgrade.
Alignment & Compliance
10.3.7 In line with our assessment of these criteria for the Agency model, we conclude that the Full
Separation model is inconsistent with Ofgem’s Minimum Liquidity Proposals while being
modestly supporting to the REMIT obligations.
53 Gross pools can and often are specifically designed to accommodate stand-alone operations on either side of the value
chain
Liquidity Options Analysis
Prepared for DECC 75 of 142
May 2013
11 Mandatory Auctions
11.1 Option Definition
11.1.1 The mandatory auction intervention would require large generators or large VIUs to offer power
volumes in a periodic auction. By forcing certain large generators to put volume through a
transparent market, an auction would support robust reference prices along the curve (at a
minimum, around the times of the auction). Additionally, the auction would direct the mix of
baseload and peak products and tenors, thus ensuring a range of hedging products are available
to the market. We outline our recommendations regarding the design of a mandatory auction
below, which broadly follow the design outlined in the Ofgem consultation54. We then assess the
intervention against the analytical framework.
Participants
11.1.2 A fundamental feature of the auction is the mandatory participation on the sell-side for certain
companies. Appropriate criteria will oblige large, vertically integrated utilities to offer a specified
proportion of their generation for sale in the auction. Assuming the intention is to have the Big
Six, and only the Big Six, participate on a mandatory basis, we propose to require participation
from any company both generates and supplies at least 20 TWh per annum in the GB market. In
addition to the mandatory participants, any other qualified (i.e. meeting minimum standards)
market participant may also offer volumes for sale, including independent generators,
independent suppliers, financial participants, etc.
11.1.3 On the buy-side, any market participant can bid for volumes, subject to the buy-side rules (see
11.1.8 below), including suppliers, financial traders, and large energy consumers acting through a
nominated supplier. We additionally note that parties for whom participation is mandatory on
the sell-side are also permitted to purchase volumes in the auction, mitigating the necessity of
allowing an auction reserve price.
Products
11.1.4 Auctioned products are for physical delivery, not (purely) financial settlement, in order to better
suit the requirements of small suppliers needing ultimately to deliver energy to their customers.
While financial products may allow suppliers to hedge out their market price exposure, they
would still need to go into the physical market at a later date to bring them back into physical
balance, incurring bid-offer spreads twice. In terms of tenor, we propose the front four Seasons,
the first front Quarter, and the first one to three front Months of baseload power, with perhaps
somewhat shorter maturity offerings for peakload. Small suppliers will also require small clip sizes
(i.e. the minimum volume of energy available for purchase/sale in each transaction) in order to
hedge new customer volumes as they are acquired. We propose a minimum volume of 0.5 MW.
54 Retail Market Review: Intervention to enhance liquidity in the GB power market, Ofgem, 22 February 2012
Liquidity Options Analysis
Prepared for DECC 76 of 142
May 2013
Auction frequency
11.1.5 Key considerations in determining the frequency of auctions are the objectives of increasing price
transparency and making available products for hedging and risk management. Although we do
expect a boost to secondary markets, price transparency is only guaranteed around the time of
the auction (in the absence of other liquidity interventions). Therefore, compared to a quarterly
auction for example, a monthly auction would increase the minimum frequency with which a
transparent forward price curve is visible to market participants, and would lead to better risk
management among both buy-side (independent suppliers) and sell-side (independent
generators) participants by making available hedging products on a more regular basis.
Increasing the frequency of auctions beyond monthly will likely have negative consequences.
These include increased costs, comprising both direct costs in hosting the auction platform and
activities, as well as the costs borne by participants to prepare and submit their bids in the
auction. Additionally, we believe that auctions which are mandated to be held more frequently
than monthly will fragment liquidity.
Mandatory volumes
11.1.6 The auction must carry a reasonable volume in order to be effective and drive prices to reflect
the market fundamentals. We suggest the mandated participants be obliged to offer 10% of the
GB market on an annualised basis (equating to ~35TWh, or approximately 2.5TWh per monthly
auction). For each product (i.e. baseload and peakload at each tenor), mandatory quantities will
be specified for obligated parties. Additional voluntary quantities may be offered, by any market
participant.
Auction form
11.1.7 A common design choice in European power auctions is the simultaneous ascending-clock
auction with a discrete round structure, where each of the auction products are auctioned
separately but simultaneously. In each round, bidders specify their demand for each product, at
all prices from the product’s start-of-round price to the end-of-round price. At the end of each
round, the excess demand at the end-of-round price is reported to all bidders, thus helping to
improve price transparency. A proxy bidding facility will enable unsophisticated bidders to treat
the auction as if it were a sealed-bid auction, by submitting in advance a single price and
quantity. The clearing price, paid by all successful bidders, is the lowest price at which
aggregated demand is less than or equal to the volume of offered supply. At the end of the
auction, the exact clearing price is reported to all participants.
Buy-side rules
11.1.8 Buy-side rules are required to protect against market manipulation. An important provision to
limit price manipulation and the potential for collusion is a restriction preventing any single buyer
from bidding for more than 50% of the mandatory auction volume of each product. Additionally,
we would recommend a further provision to prevent mandatory participants from bidding for
between 80% and 120% of their own volume. Among other objectives, these restrictions will
ensure that mandatory auction participants have some “skin in the game”, i.e. that they cannot
structure a bidding strategy leaving them indifferent to the auction outcome. Note that the
Liquidity Options Analysis
Prepared for DECC 77 of 142
May 2013
restrictions cannot completely eliminate the residual gaming risk related to a contract struck
outside the auction, but indexed to the auction price.
Reserve Price
11.1.9 Many auctions permit sellers to set a reserve price. We expect mandated sellers to argue
strongly in favour of being allowed a reserve price for offered volumes but a reserve price is not
necessary if the mandated sellers are allowed to participate on the buy-side, subject to buy-side
rules. If the obligated participants are neither allowed to set a reserve price nor to participate on
the buy-side of the auction, then there remains the risk that the auction clears at distressed sale
prices.
Choice of auction platform
11.1.10 We strongly recommend requiring a single auction which pools volumes from all mandatory
participants (as well as from others joining voluntarily) in contrast to allowing each mandatory
supplier host a separate auction for their own volumes. For reasons outlined above in our
discussion of the frequency of auctions (see 11.1.5), having all volumes concentrated in a single
auction will increase liquidity and decrease costs. Additionally, a single auction will remove
barriers to the participation of smaller counterparties, who will avoid having to guess at which
auctions their attendance may be most beneficial. Finally, a single auction will reduce the
potential for gaming by eliminating opportunities for reciprocal arrangements whereby two
parties agree to buy volumes at each other’s auctions at off-market prices. Furthermore we do
not necessarily see that the auction platform necessarily needs to be an existing exchange. A
stand-alone web portal for administering the auction can be established relatively easily, as has
been demonstrated by previous VPP auctions mandated by regulators in the past.
Contract terms
11.1.11 Auction terms and conditions must be common to all participants and should not be far from
market standard if they are to be accepted by market participants. We recommend that any
power awarded in the auction should be governed by the GTMA, which are the standard contract
terms used in the UK Power market. The GTMA defines elements such as payment terms,
nomination procedures and delivery point. The use of a standard contract provides easier auction
access for existing market players and ensures that power contracted in the auction can be easily
re-sold on the secondary market without residual risk being retained by the original auction
participant.
Credit risk mitigation
11.1.12 In the absence of mitigations, any seller successful in placing volumes through the auction will be
exposed to the credit risk of their counterparty, as will any buyer successful in purchasing
volumes in the auction (see Appendix E for a discussion of credit risk). Auction participants, and
above all mandatory participants, will rightly resist having to accept, via the auction, credit risk on
parties that they deem uncreditworthy or otherwise ineligible of having credit extended. It is
common practice for auction participants to post a guarantee, the amount of which depends on
the maximum volume for which the participant intends to bid and whether the participant is a
buyer or a seller (noting here that sellers are exposed to settlement risk whereas buyers are not).
Liquidity Options Analysis
Prepared for DECC 78 of 142
May 2013
11.1.13 An alternative approach to credit risk mitigation would be to have a central clearing party stand
behind all trades completed in the auction and require all participants to post variation margin on
a daily basis in support of volumes transacted on the platform, similar to trades transacted on an
exchange.
Pre-qualification
11.1.14 In addition to minimum requirements relating to credit (i.e. minimum credit rating, guarantee
bond, associating with a clearing bank which is a member at the central clearing party, etc.) an
auction participant must demonstrate that it is a signatory to the Balancing and Settlement Code.
Additionally there will be a financial pre-qualification due diligence including Know Your
Customer, Anti-Money Laundering, solvency checks, etc.
Auction monitoring and Trustee
11.1.15 Auction monitoring is usually done by an independent trustee. The trustee performs a number of
functions, including conducting the pre-qualification process for participants, oversee the auction
to ensure a level playing field, scrutinise behaviour for evidence of collusion and gaming,
communicate with participants including dissemination of auction results, allocate successful
bidders to sellers, and produce any required reporting.
11.2 Assessment of Mandatory Auctions
11.2.1 Our assessment of Mandatory Auctions is detailed in Appendix F.
11.2.2 We consider an auction designed along the lines described above, i.e. a monthly auction for
forward power products which obliges the Big Six to offer volumes in the auction, and
additionally permits any other pre-qualified seller to participate. Pre-qualified buyers may
include the mandatory sellers. A Mandatory Auction intervention then scores positively under
the Analytical Framework on both an un-weighted and weighted basis based on our assessment
of each individual criterion, as elaborated in Appendix F.
Benefits:
11.2.3 By definition, a mandatory auction of forward products creates a new channel to market and thus
offers an additional sourcing and hedging opportunity to market players over and above existing
channels. Furthermore, we expect the auction products to be traded in the secondary market,
thus supporting liquidity in existing OTC markets. There is the obvious scope within the auction
design to mandate and direct the particular products desired in the auction in terms of tenor and
shape, and the volumes provided. Auction clearing prices for these products will be publicly
available and thus the auction products will facilitate transparent and robust reference prices.
Although clearing prices from a discrete auction will by definition be visible only at the time of
each auction rather than on a continuous basis, we expect that increased activity in secondary
markets will enhance price transparency in continuous time. Published auction results can
produce a benchmark for the pricing of other transactions, including a CfD with reference price
linked to auction outcomes (or, better yet, linked to an OTC or exchange price for a product that
mirrors a product offered in the auctions).
Liquidity Options Analysis
Prepared for DECC 79 of 142
May 2013
Costs and Risks:
11.2.4 We consider the operational complexity of the Mandatory Auction intervention to be material.
We would need to consider designing the auction, tendering for a platform and trustees, auction
system development and testing, drafting the legal documents, producing documentation of the
detailed auction rules and a bidder manual, conducting bidder seminars and mock auctions, and
communicating with mandated and voluntary participants. Individual participants would need to
first qualify to participate and then, on a monthly basis, prepare and execute their bidding
strategy for each auction. This operational complexity may prevent the smallest participants
from participating, or more likely they may be excluded from the auction because of their
inability to pre-qualify on the basis of insufficient credit, their reluctance to post a bond of
sufficient size, or their preference to avoid the cash liquidity risk of bringing volumes to clearing.
11.2.5 As with all interventions that mandate participation or action, there is the risk in the context of
EMIR that a company has a level of churn beyond that which it would prefer, thus causing the
company to exceed the clearing threshold. To the extent that auction products are cleared, there
would be a requirement for a company to have sufficient cash liquidity to support the
collateralisation of the mandatory volumes, and no clear escape from mandatory participation in
the market in times of constrained liquidity.
Alignment & Compliance:
11.2.6 We have considered the interaction between the Mandatory Auction intervention and current
market reform and financial regulation initiatives. To the extent that a Mandatory Auction directs
liquidity toward a product which is the reference for the baseload CfD, the intervention would be
supportive of EMR, but as this considered above under “Benefits” we neglect it here to avoid
double counting. Although the additional transactions required by the Big Six may push them
closer to the EMIR threshold, the Mandatory Auction intervention in no way contradicts or
violates the application of the EMIR regulation. With respect to the other regulations and
reforms, we do not consider Mandatory Auctions to either augment or hinder their application.
Liquidity Options Analysis
Prepared for DECC 80 of 142
May 2013
12 Mandatory Market Making
12.1 Option Definition
Market Making
12.1.1 Market making involves a commitment to continually show bid and offer prices for a minimum
volume of a commodity within a defined bid-offer spread. For example, a market maker (i.e. the
party doing the market making) in first season baseload UK power may commit to continually
offer to both buy and sell on their own account a given volume at bid and ask prices which differ
by at most £ 1/ MWh. If another party accepts the bid or offer, the market maker must
immediately replace the volume. Market making is typically done on an exchange or via broker
screens.
12.1.2 Market making increases liquidity by ensuring volumes are continually available for purchase or
sale. As for an auction, a market making intervention could direct the mix of baseload and peak
products and tenors, thus ensuring a range a hedging products are available to the market.
However, unlike an auction, market making ensures that reference prices along the curve are
continually visible (even in the case where no trading occurs, we can assume that the “actual”
market level is generally bounded by the bid and ask prices). We outline our recommendations
regarding market making below.
Rewards and Risks of Market Making
12.1.3 Market making is an activity with both risks and rewards. The obvious benefit of market making
is the opportunity to earn the bid-ask spread on all volumes churned. This benefit is offset
(perhaps more than offset) by the risk of mispricing. In an illiquid market where there may not be
current price benchmarks for a particular product, a market maker may not know at what level to
set his bid and offer prices. The correct market level will only be found by a costly “trial and
error” process as other market parties hit bids which are too high or offers which are too low.
Even where the market level is known, a fast-moving market (resulting, for example, from news
arising, or some other market shock) may leave the market-maker’s bid and ask prices outside
the actual price level.
12.1.4 Despite the risks, companies in some markets may choose to be market makers voluntarily. In
addition to earning the bid/ask spread (as mentioned above), they may also be motivated by a
desire to stimulate liquidity in a particular product. A market maker often attracts new
participants to trade in a product and a large incumbent may find the resulting new hedging
opportunities sufficiently compelling to undertake itself the market making responsibility.
Exchanges, which make money based on the volume of trades performed on their platform and
therefore benefit from enhanced market liquidity, may offer reduced exchange fees to a
company which enters a market making agreement and therefore commits to making a market
(with minimum volumes and maximum spreads specified in the agreement).
Liquidity Options Analysis
Prepared for DECC 81 of 142
May 2013
Voluntary or Mandatory Participation as Market Makers
12.1.5 Any current market participant could potentially decide to act as a market maker in UK power.
The fact that no parties are currently willing to do this indicates that participants perceive the
risks of market making to exceed any benefits. A market intervention to stimulate market making
would therefore need to either compel or incentivise certain participants. We propose that the
Big Six are mandated (as opposed to incentivised) to be market makers in UK power. As for
mandatory auctions, the intention to oblige the Big Six (and only the Big Six) to make a market
could be stated as an obligation to act as market maker for all companies that both generate and
supply at least 20 TWh per annum in the GB market.
12.1.6 The alternative to an obligation on the Big Six to make a market would be an incentive to parties
to become market makers. For example, a tender could invite parties to bid for compensation in
return for making a market (for certain products according to pre-defined requirements, as
outlined below), with the two lowest bidders selected as market makers. The compensation for
tender winners would be funded by an annual, industry-wide, compulsory levy. In our opinion,
we do not expect an incentivised intervention to be effective. We believe that compensation in
the range of, for example, £2 million would be insufficient to compensate any of Big Six for the
risks and effort of making a market, especially if such company were one of only one or two
market makers showing prices. On the other hand, compensation substantially greater than this
amount (for example, an order of magnitude larger) would be difficult to raise as a compulsory
levy on participants. We therefore assess a market making intervention where participation by
the Big Six is obligatory.
Products and Volumes
12.1.7 As we recommended for mandatory auctions, we propose that the products targeted in a market
making intervention are for physical delivery in order to meet the balancing needs of small
suppliers. We propose the front four Seasons, the first front Quarter, and the first one to three
front Months of baseload power, with perhaps somewhat shorter maturity offerings for
peakload. We recommend 5 MW of bids and offers (to be continuously replenished if required)
for each of Big Six, with a minimum clip size of 0.5 MW.
12.1.8 We recommend further that market making in short-term products (for example, within one
week maturity) should not be obliged on market participants. The risks of market making in
shorter term power products are significantly greater than in longer term products. Because
electricity is (for the purposes of wholesale markets) a non-storable commodity, supply or
delivery obligations cannot be serviced from inventory. This means in practice that the market
reacts strongly to news which alters the supply-demand balance. In particular, an expected
generation outage must be covered, i.e. if a generator has committed to generate power and has
sold the volume forward, and the generation unit fails, then that power must be bought back on
short-term markets. This is disruptive to the supply-demand balance and potentially moves the
marginal generation unit up the stack. The result will be a large jump in short-term prices. A
market marker will likely not react sufficiently quickly to adjust bid and ask prices before existing
offers are hit, and will anyway not know at what new level the market will settle. The result is
potentially large losses for the market maker. Longer dated products are not subject to the same
risks as long-term prices and are not as volatile in response to short-term news.
Liquidity Options Analysis
Prepared for DECC 82 of 142
May 2013
Market Making Rules
12.1.9 A key design parameter in a market-making intervention would be the rules governing the
maximum bid-ask spread permitted. A restriction on the bid-ask spread is important, as offering
to sell at a ridiculously high price or bidding to buy at a ridiculously low price is equivalent to
making no offer or bid. Considering NordPool or EEX market makers as a benchmark, we would
propose a maximum spread of £1 - £2/MWh under normal market conditions. The maximum
spread could be varied as a function of potential market depth, for example a tighter spread
could be imposed on shorter-maturity baseload products than on longer-dated peakload.
12.1.10 Typically, the rules governing the bid-ask spread are relaxed for a “fast” moving market. A fast
market is defined by rapidly changing traded prices. For example, when the difference of two
traded prices differs by more than the allowable bid-ask spread within a period of 60 minutes, a
“fast market” may be declared. It is assumed that during a fast market the equilibrium level of
market prices is less transparent to market makers and therefore they have more difficulty to set
their bids and offers. “Fast Market Rules” may permit a wider bid-ask spread than during normal
market conditions, or may even completely waive the maximum difference between the bid and
offer prices.
12.1.11 Finally, we recommend that any market making intervention specify the trading hours for market
makers, for example 9h to 16h on business days (except during “fast market” conditions).
Choice of Platform
12.1.12 Generally, a market can be made on an exchange or in the OTC market via broker screens. We
recommend that any intervention be designed around market making on an exchange. This has
two main advantages. First of all, an exchange that hosts the market makers can also serve to
monitor compliance with the market making rules (with respect to offered products and volumes,
maximum bid-ask spread, determination of a “fast market”, etc.). In addition, we believe that an
exchange may offer better access to small, independents than a broker market. To participate on
an exchange, small parties would need a relationship with a clearing bank and sufficient collateral
to support margining. In the case of OTC trading via broker screens, small participants would
need access to the screens (for which brokers charge all but their best customers) as well as
trading agreements (comprising credit and payment terms, collateral support, etc.) with the
various parties making the market. We therefore conclude that exchange trading may be an
easier route to market for small or independent parties.
Contract terms
12.1.13 If we assume that market making is conducted on an exchange, then all trades will be via the
central clearing party and fully collateralised with initial and variation margin. Alternatively if
market making is conducted on OTC markets then it is be expected that counterparties have
completed due diligence (Know Your Customer, Anti-Money Laundering), concluded a trading
agreement (GTMA), have assessed each other’s credit and agreed credit terms, etc.
Liquidity Options Analysis
Prepared for DECC 83 of 142
May 2013
12.2 Assessment of Mandatory Market-Making
12.2.1 Our assessment of Mandatory Auctions is detailed in Appendix F.
12.2.2 We consider a Mandatory Market Marking intervention designed along the lines described above,
namely an obligation on all Big Six companies to continually offer to buy and sell a number of
mandated products on an exchange, subject to normal market making rules. Such an
intervention scores positively overall on both an un-weighted and weighted basis based on our
assessment of each individual criterion in the Analytical Framework, as elaborated in Appendix F
below.
Benefits:
12.2.3 In our opinion, Mandatory Market Making has the largest scope in increase churn rates in the GB
power market. With a Mandatory Market Making intervention, market participants will be able
to purchase and/or sell as much volume as they require (although market makers can adjust their
prices in response, subject to restrictions on the bid-ask spread). This contrasts with Mandatory
Auctions, where (minimum) volumes for mandatory participants are determined in advance.
Mandatory Market Making does not create a new channel to market, but instead increases the
intensity of use of an existing channel (namely futures trading on exchanges). This is a key
advantage of this intervention compared to others described above, in the fact it introduces the
least amount of change and conforms most closely to existing market practices and channels. It
therefore has the least scope for gaming or other unintended consequences. Market making
liquidity in the mandated products on the exchange and thus gives certainty for participants that
any open position can be closed. We expect this feature to be attractive to financial participants
(or other non-physical participants, such as foreign utilities with neither customers nor
generation in the GB market) because the presence of market makers will give assurance that
open positions entered speculatively can always be closed at competitive prices, rather than
taken to delivery (or closed at distressed prices).
12.2.4 As for mandatory auctions, there is the potential to mandate and direct the particular products
desired. However, we do note the current lack of price transparency to enable market makers to
set their bid and ask prices may cause mandatory participants to resist a requirement to make a
market in long-dated products or complex shapes. Transparent price information for the
products in which markets are made will be continuously available. Even in the event that no
trades are made, the published bid and ask prices across all market makers can be averaged to
give an indication of the market assessment of the price level. CfD contracts can reference a
traded price for a product for which market making is mandated.
Costs and Risks:
12.2.5 System and infrastructure costs to establish the Mandatory Market Making intervention are low.
There will be a requirement for a small supervision function to monitor market making rules such
as maximum bid-ask spreads, which could be performed by the exchange hosting the market
making activity. We do not include here any costs to incentivise market makers, as our design
assumption is that market makers are required, rather than incentivised, to participate.
However, we do anticipate a tender to choose an exchange or broker platform to host the market
Liquidity Options Analysis
Prepared for DECC 84 of 142
May 2013
making activity and monitor compliance with market making rules. From the point of view of the
mandated participants, direct costs (as opposed to risks) related to performing market making
desk are assumed to be small. Typically, companies large enough to be considered for mandated
market making would already have established UK power trading desks. Market makers will need
to ensure their desk is covered during business hours, so that bid and ask prices can be adjusted
up and down as the market moves, and bought and sold volumes must be replaced in the market.
12.2.6 Risks to market participants related to mispricing are noted in the description of the intervention
above in this chapter. The participation of mandated market makers in the market is not capped,
as they are required to replace any volumes purchased or sold. This has the potential to generate
a high level of churn in the portfolio of a mandated market maker. Because we recommend the
market making activity be conducted on an exchange, the net open position for each product
would be therefore subject to daily margining, with associated cash liquidity risks resulting from
the requirement to post collateral. We observe, however, that by an appropriate choice of bid
and ask prices for each product, it is well within the control of each market maker to keep their
net open position close to zero if they so wish. For example, if they find far more buyers than
sellers, they can raise their offer price (to discourage buyers) and simultaneously raise their bid
price (to attract sellers and also to keep within the required bid-ask spread). Therefore, although
there would be a requirement for a company to have sufficient cash liquidity to support the
collateralisation of the resulting trades, and no clear escape from mandatory participation in the
market in times of constrained liquidity, the burden is manageable through active balancing of
bid and ask prices to ensure relatively equal volumes of buys and sells. The requirement to post
collateral is most burdensome on small generators or small suppliers, who are likely to be cash
constrained and whose activity will be almost entirely one-way (i.e. all buys or all sells).
12.2.7 As with all interventions that mandate participation or action, there is the risk in the context of
EMIR that a company has a level of churn beyond that which it would prefer, thus causing it to
exceed the EMIR clearing threshold when otherwise it would remain under. We note that the
detailed technical application of the clearing threshold to portfolios is not yet tested. However, it
seems reasonable to us that for exchange trades, only the net position in each product (as
opposed to the history of buys and sells) is considered to determine a company’s position relative
to the threshold. We contrast this with OTC trading, where we believe that the gross position,
rather than the net position, will be considered unless steps are proactively taken to close out
and settle offsetting trades. With this observation, we conclude that the risk of mandatory
market making in the context of the EMIR threshold, while non-trivial, is not unduly burdensome.
Alignment & Compliance:
12.2.8 We have reviewed the interaction between the Mandatory Market Making intervention and
current market reform and financial regulation initiatives. Just as for the Mandatory Auction
intervention discussed in the chapter above, we find that the Mandatory Market Making
intervention could help direct and reinforce liquidity in the product which is referenced by the
baseload CfD, but we score this support above in the “Benefits” section of the Analytical
Framework. Similarly, additional churn in the portfolios of the Big Six which results directly from
market making could have a detrimental impact with respect to the EMIR clearing threshold, but
the intervention does not in itself contradict the application of the EMIR regulation. We judge
Mandatory Market Making to neither augment nor hinder other current reforms and regulations.

Liquidity Options Analysis
Prepared for DECC 85 of 142
May 2013
13 Supplementary Intervention Options
13.1 Introduction
13.1.1 This chapter outlines a number of supplementary intervention options, by which we refer to
interventions that might aid and support the overall objectives, but which in themselves are
unlikely to be sufficient to achieve the desired level of change. It is structured as follows:
Sections 13.2 outlines two interventions currently under consideration by Ofgem, namely
a minimum Day-Ahead trading requirement and inclusion of additional license conditions
to promote fair and reasonable trading terms;
Section 13.3 considers the reference price in the Low Carbon CfDs, a choice we see as an
important (supplementary) instrument for directing liquidity along the curve;
Section 13.4 outlines two potential credit interventions, namely mutualisation or credit
losses and government backing of credit insurance;
Section 13.5 similarly considers an intervention aimed at ensuring effective collateral and
margining arrangements; and
Section 13.6 finally sets out various potential interventions for increasing the general
transparency of the GB market.
13.2 Ofgem Minimum Proposals
13.2.1 Ofgem is currently considering two interventions, both of which would be implemented through
additional license conditions. Collectively, these two proposals make up what we in the Analytical
Framework refer to as being “Ofgem’s Minimum Proposals”
Minimum Day-Ahead Trading Requirement
13.2.2 The first of the minimum interventions is additional license terms which oblige participants to
gross-bid 30% of annual generation into one of the Day-Ahead Auctions (N2EX or APX). The
objective is to secure and lock-in the progress in developing liquidity in Day-Ahead traded
volumes (mainly on N2EX), by requiring the licensee to transact both sides of the market (gross
bidding).
13.2.3 The table overleaf details Ofgem’s proposal:

Liquidity Options Analysis
Prepared for DECC 86 of 142
May 2013
Table 5: Minimum Day-Ahead Trading Requirement
Fair and Reasonable Terms
13.2.4 Ofgem is also considering including a number of license conditions which aim to promote fair and
reasonable trading terms as detailed in the below table. However, it important to note that as
currently drafted (refer to “Scope” in the table) these conditions would only apply selectively to
trading with smaller independent suppliers defined as suppliers with less than 1TWh in annual
sales.
Table 6: Fair and Reasonable Terms

Liquidity Options Analysis
Prepared for DECC 87 of 142
May 2013
Assessment of Minimum Day-Ahead Trading Requirement
13.2.5 Our assessment of Ofgem’s proposal to establish a minimum Day-Ahead Trading requirement
corresponding to 30% of annual generation is detailed in Appendix F.
13.2.6 Overall we judge this intervention positively, but it is insufficient as a stand-alone solution. We
agree that it is worthwhile to lock-in the recent progress in spot and day-ahead trading,
something which will also serve to support NWE market coupling arrangements by ensuring
robust bid and offer volumes in NG’s Virtual Hub. By the same token, this intervention:
i) Does not add liquidity and churn above what the market already delivers today; and
ii) Addresses only the spot market and hence the delivery end of the curve.
13.2.7 With respect to the second item, we note that whilst the existence of active spot markets may be
a necessary condition for forward market liquidity, it is a not a sufficient condition. On its own,
this intervention does not reduce barriers to entry or provide small suppliers or independent
generators with a market in which to hedge.
13.2.8 In taking an overall modestly positive view, we are cognisant that the current N2EX volumes and
the proposed intervention would rely extensively on gross bidding. In our view, however, such
arrangements are not a material concern in an SMP cleared auction, where deliberate mis-pricing
could lead to large imbalances 24 hours before delivery. For price manipulation to work in these
circumstances, significant market power would need to be present. While the old GB gross pool
was open to manipulation, concentration levels are much lower today. In particular, there are a
number of other significant players both locally and through the interconnections in addition to
the Big Six.
13.2.9 This conclusion does not imply that gross bidding never could be a problem, but that such
arrangements are a far bigger potential issue when deployed on “pay-as-bid” OTC platforms as
opposed to cleared auctions55.
Assessment of Fair and Reasonable Terms
13.2.10 Our assessment of Ofgem’s proposal to include license conditions which promote fair and
reasonable trading is detailed in Appendix F.
13.2.11 While this intervention appears sensible and easy to implement, it does not achieve an overall
positive score in our assessment. We recognise that Ofgem is continuing to develop this option
further, but as currently drafted it is in our view likely to prove ineffective. Firstly, it is aimed only
at independent suppliers and hence would not support new entrant generators nor address
general liquidity issues56. Secondly, we have a number of concerns with respect to the individual
conditions as drafted:
i) Clip-Size and Product Range: The suggested specifications are sensible but unlikely to be
effective without a general trade requirement (obligation to trade with any qualifying
supplier) or some minimum limits on volumes offered;
55 And even then, we struggle to see how deliberate mispricing would be advantageous.
56 But generators and non-Big Six players could easily set up a small supply business to qualify (and existing generators with supply businesses (e.g. Drax) would also qualify).

Liquidity Options Analysis
Prepared for DECC 88 of 142
May 2013
ii) Fair Pricing: Recognised price assessments (such as Platts, Argus, etc.) are published for the
previous trade day. If the market were to move significantly (e.g. following a significant
market event), these indexes would no longer be reflective of the market level and
therefore the Big Six could be exposed to being “cherry-picked”. Furthermore, it is
inevitable (and legitimate) that the Big Six will want to include risk premia in their pricing
(hence pricing formula is index plus premium), but is it not trivial to assess and control the
validity of such premiums;
iii) Credit and Collateral: Twenty days is not remotely sufficient time to adequately assess
new counterparties and this limit might simply prompt the Big Six to offer boiler plate
terms with full margining (which cannot be deemed unreasonable given EMIR etc). This
could be counter-productive from the perspective of small suppliers, some of whom today
have managed to negotiate less than full collateralisation. Conversely, for established
counter-relationships 5 days from request to offer is far too long a period and not reflective
of actual trading practices;
iv) Transparency: While these requirements appear sensible, they will likely at best simply set
expectations for negotiations. Where detailed terms are published, a further question is
whether such actually could be restricted only to independent suppliers under UK
Competition Law; and
v) Scope: Some independent suppliers are already at or approaching 1TWh in annual
consumption. Where such players are genuinely independent, it is in our view questionable
whether is it sensible to exclude them and create a cliff-edge. An alternatively would be to
cap total purchases under the arrangement to 1 TWh.
13.2.12 A further scope related question concerns whether the supplier definition would allow
generators and non-Big Six players to set up a small supply arm to qualify for sourcing power
under the license condition. If so, traders such as BarCap or J ARON could gain access to these
arrangements by setting up such entities. In our view, a qualification process to vet who is
allowed to trade under these conditions including what constitutes an “independent” supplier
would be required.
13.2.13 A final question concerns the governance and control of these conditions. It is not clear who
would be able to intervene in the event that a supplier claims not to have been treated fairly nor
how “fairness” would be evaluated. Overall, the current broad conditions are in our view open to
gaming.
13.2.14 While we appreciate that Ofgem continues to develop these terms, as currently drafted we
consider them insufficient as a stand-alone solution. Overall, Ofgem’s minimum proposals
comprising this and the previous intervention are in our view unlikely to counter the many head-
winds discussed in the chapter on liquidity drivers, let alone increase liquidity materially above
current levels.
13.3 CfD Reference Price
13.3.1 As discussed in 4.7, the choice of reference prices in the Low Carbon CfDs will have a significant
impact on how liquidity is distributed along the curve in the GB market. In this regard, the choice

Liquidity Options Analysis
Prepared for DECC 89 of 142
May 2013
of the Day-Ahead GB auction price as the reference price for the Intermittent CfD will incentivise
intermittent generators to bid into these auctions. Combined with the NWE market coupling,
these contracts will therefore also serve to secure the recent progress in day-ahead trading.
13.3.2 The ultimate choice of the reference price for the baseload contract is probably one of the most
significant decisions DECC has yet to make which will have direct bearing on how GB liquidity is
allocated across the curve.
13.3.3 With the progress in Day-Ahead volumes, we recognise that there could be a temptation to align
both the intermittent and baseload contracts on the same reference. However, whereas
intermittent generators naturally spill into the spot and prompt markets, baseload generators
will, if left to their own devices, tend to contract forward. Choosing Day-Ahead reference for this
category of generators would therefore materially change and distort their normal commercial
behaviour and potentially destroy GB forward market liquidity. In turn this would disadvantage
players such as independent suppliers which rely on access to forward contracting to back fixed
priced offerings in the retail and commercial customer segments. It would also result in very large
volumes, that would otherwise have been traded forward, being solely traded through the Day-
Ahead markets.
13.3.4 Notwithstanding that we recognise the difficulties presented by the absence of a pre-existing
robust forward reference price we continue to believe that a forward product is the right choice.
For the purpose defining this intervention option more precisely to support our assessment, we
therefore assume that the baseload reference price will be:
i) Directly tradable or based on an index which readily can be tracked; and
ii) Based on a forward/term product, although it need not be an annual product (i.e. could be
season).
Assessment of CfD Reference Prices
13.3.5 Appendix F details our assessment of this option. While it does not increase liquidity, it scores
positively on its ability to support particular products and direct liquidity along the curve. By the
same token however, there is a (modest) risk that this could drain liquidity in other products
which are not referenced by the CfD. However, this risk exists with any CfD intervention and does
not, in our view, offset the benefits from ensuring that the baseload CfD reference price and
liquidity objectives are aligned (as assumed by the intervention).
13.4 Credit Interventions
13.4.1 The reluctance of companies to bear credit risk is a barrier to trading in the UK energy market
(see Appendix E for an explanation of credit risk in energy trading). Market parties are often
unwilling to offer credit terms to their potential counterparties, especially to smaller parties, such
as independent generators and independent suppliers. These parties lack strong balance sheets
and financial ratios and therefore are perceived to have a higher probability of default.
Independent Suppliers offer little opportunity for recovery of credit losses.
Liquidity Options Analysis
Prepared for DECC 90 of 142
May 2013
13.4.2 We outline below two possible market interventions to mitigate credit risk as a barrier to trading.
These suggested interventions are in addition to existing market mitigations for credit risk, which
are described in Appendix E.
Mutualisation of Credit Losses
13.4.3 A possible market intervention to overcome parties’ reluctance to grant credit terms would
require the mutualisation (joint and several liability) of credit default losses. With this
intervention, market participants would be collectively responsible for assuming any losses
resulting from a default of one of the participants. We expect that with the introduction of the
scheme, small contributions per transaction would contribute to a reserve fund over time, from
which credit losses would be refunded in the event of a default of one of the participants. Any
losses beyond the level of the reserve fund would be refunded from levies on all participants (we
propose a levy in proportion to each participant’s net open positions, but other methods of
contribution could be devised).
13.4.4 We note that the scope of mutualisation must be well-defined, i.e. must apply to a specific set of
transactions which are subject to the scheme (for example, all transactions resulting from a
particular series of auctions). We further expect that EMIR will take precedence over any
intervention to enable credit loss mutualisation. Only products or participants not subject to
mandatory clearing may be included for loss mutualisation, as companies subject to mandatory
clearing will collateralise their eligible transactions under EMIR.
Government-backed Insurance of Credit Exposures
13.4.5 An alternative intervention to mitigate credit risk is the facilitation of government-backed
insurance of credit exposure against an up-front premium. An insurance could be structured in
such a way to mitigate the actual level of credit risk (considering the dynamic mark-to-market
exposure which is a function of market prices). This intervention potentially has a wider scope
than mutualisation of credit losses, as it would be up to each party insured to decide which
instruments (including structured deals, supply deals, etc.) it wanted covered under the scheme.
Assessment of Mutualisation of Credit Losses
13.4.6 We see the benefits (in terms of easing entry and expansion) of an intervention to mutualise
credit losses on a segment of market transactions being primarily with respect to counterparty
access to the market. The intervention would mitigate specific credit barriers faced by smaller
participants in accessing trading.
13.4.7 The costs and risks of an intervention to mutualise credit losses relate primarily to distortions of
normal market behaviour. The intervention would very likely suffer from adverse selection, as
the least credit-worthy companies would be the most likely to participate, while stronger
companies would be more likely to try to escape from the scope of the intervention, for example
by trading highly-structured products not subject to loss mutualisation. Additionally, the
intervention removes incentives for companies to be credit worthy and maintain good financial
ratios.
13.4.8 The intervention hinders alignment with regulation, specifically with EMIR. A key objective of
EMIR is to increase stability in financial markets by improving risk management practice, while
Liquidity Options Analysis
Prepared for DECC 91 of 142
May 2013
the mutualisation of credit losses would likely increase the rate of default in the market by
removing correct incentives.
Assessment of Government-backed Insurance of Credit Exposures
13.4.9 As for the mutualisation of credit losses, we see the benefits of an intervention to offer
government-backed insurance of credit exposures as facilitating counterparty access to the
market, especially for market parties who already create substantial market-to-market exposure
for their counterparties. If pre-existing mark-to-market exposure can be mitigated, parties would
be willing to add incremental trades to the portfolio.
13.4.10 However, unlike for the mutualisation intervention, the costs and risks of government-backed
credit insurance relate more to the cost of insurance rather than market distortions. The cost of
the insurance will have to be borne, either by the company that has credit risk and is seeking
mitigation, or the company to whom the counterparty is exposed, and who would like additional
access to markets. Assuming that the true cost of credit risk is reflected in the insurance
premium (meaning that premia are higher to insure companies more likely to default), then
smaller, less credit-worthy parties are less likely to benefit from this intervention.
13.5 Collateral Interventions
Government Guarantees of Collateral
13.5.1 A possible barrier to trading, especially among smaller firms, is a lack of cash or other liquid
instruments to support calls for variation margin for collateralised deals, or else a fear that cash
could become constrained in the future. A possible market intervention to mitigate cash liquidity
risk could be the government provision of liquidity to market participants (e.g. guarantees which
are acceptable as collateral by CCPs) against a pledge of generation assets or other illiquid assets
on the balance sheet. The intervention could be modelled after bank guarantees, which are often
acceptable as collateral. Companies would pay a fee to reserve the guarantees.
Assessment of Collateral Interventions
13.5.2 An intervention to provide government-backed collateral against acceptable guarantees to
market participants will directly increase access to collateral for parties able to offer the
guarantees (and who have need of the additional liquidity). Such additional collateral is a
tangible benefit, although we expect that only a limited number of companies could benefit from
this intervention because we assume generally only generators would have assets to pledge
against liquid collateral, and only a portion of these parties would have assets that are
unencumbered. A secondary beneficial effect of the intervention would be to intensify the
trading on exchanges and with OTC counterparties who demand collateral as a condition of
trading.
13.5.3 A key risk of the intervention is the potential negative impact on a company’s rating as a result of
the additional encumbrance of any balance sheet pledges.
13.5.4 We consider the intervention to be broadly supportive of financial regulation, especially EMIR,
which aims to avoid systemic risk in financial markets by reducing credit risk and ensuring that an
Liquidity Options Analysis
Prepared for DECC 92 of 142
May 2013
increasing proportion of derivatives trading is collateralised. We note, however, that EMIR
specifies the quality of collateral that will be acceptable to Central Clearing Parties under the
regulation, and therefore the collateral enabled by this intervention must qualify under EMIR.
13.6 Transparency Interventions
13.6.1 Market transparency refers to the amount of information regarding market conditions made
public on a timely basis. Opaque markets tend to benefit relatively well informed dealers and
discriminate against smaller, less active, and less sophisticated participants. In particular, energy
companies dealing in the “physical” market have ready access to proprietary information relating
to the behaviour of their own generation units and the offtake of their own customers. These
data on the supply/ demand balance provide an advantage to large, vertically integrated energy
companies compared to smaller companies which have fewer data or financial players who lack
insight into physical energy flows.
13.6.2 Market information could include both trade information (e.g. price of completed trades, traded
volumes, price quotes, etc.) as well as fundamental supply/ demand data (planned and
unplanned outages, capacities, generator load factors, customer offtake profiles etc.)
13.6.3 Market transparency therefore levels the playing field for market participants, by reducing
information advantage. Transparency makes the relevant information available to participants so
that they can efficiently evaluate the benefits and costs associated with their choices. More
specifically, improved transparency lowers the cost of searching for information and reduces the
risk of mispricing a transaction. For these reasons, improved transparency is expected to improve
market liquidity by attracting new participants to the market and encouraging existing
participants to transact more frequently. In particular, financial participants have other inherent
advantages such as advanced computer modelling systems and relatively efficient allocation of
capital, and therefore removing the barrier of asymmetrical market information may entice banks
and other financial participants to be more active in the market.
13.6.4 Certain price information (e.g. Argus and Heren price assessments) and fundamental data (e.g.
Elexon’s Balancing Mechanism Reporting Service, bmreports.com or Leba market indicies) are
available to participants. However, market participants typically have lower confidence in price
assessments than in actual trade price data, associated with a trading time and trading volume.
Furthermore, the Elexon reporting service, while useful, focuses on prompt/ spot information.
Overall, we conclude that the GB market presently lacks basic transparency compared to, for
example, the Nordpool market.
13.6.5 We note that both trade data and fundamental data are subject to increased reporting
requirements. REMIT, EMIR, and MiFID require trade data to be passed to the FSA and
ACER/Ofgem. Additionally REMIT requires market participants to publish (with some exceptions)
certain fundamental data to be published by market participants, most notably “inside
information” which is defined as information likely to significantly affect prices of wholesale
energy products, or other information that a reasonable market participant would be likely to use
as part of its decision to enter a wholesale energy market transaction.
13.6.6 We observe that making this data available (anonymously) to the wider market will clearly
improve transparency. However, the use of trade data submitted to regulators under the
Liquidity Options Analysis
Prepared for DECC 93 of 142
May 2013
financial and energy market regulations is heavily restricted by the regulations, i.e. publication of
the trade data collected under REMIT, for example, even anonymously or in aggregate, is unlikely
to be permissible under the regulation. There is nonetheless the potential to require GM market
participants to additionally submit trade data to a data aggregator/ consolidator at the same time
that submissions are made to ACER, in order to provide market participants with improved
visibility of the market.
Assessment of Transparency Interventions
13.6.7 The transparency intervention above will have a significant and positive impact on the availability
and reliability of price data. Additionally, the intervention will support robust CfD reference
prices. We consider a lack of price transparency to be a barrier to market entry and therefore
improved transparency will increase the number and diversity of counterparties.
13.6.8 We assume that trade reporting submitted to trade repositories under the REMIT and EMIR
regulation cannot be republished or re-used for other purposes. Considering this, the
intervention would require participants to additionally report trade data to another
“transparency” agency. Although there are obviously synergies in terms of data format, system
technologies, etc., the intervention as designed will create additional costs for each participant as
well as costs for the central administration of the intervention.
13.6.9 We do not expect this intervention to conflict with any other proposed market reforms or
regulation.
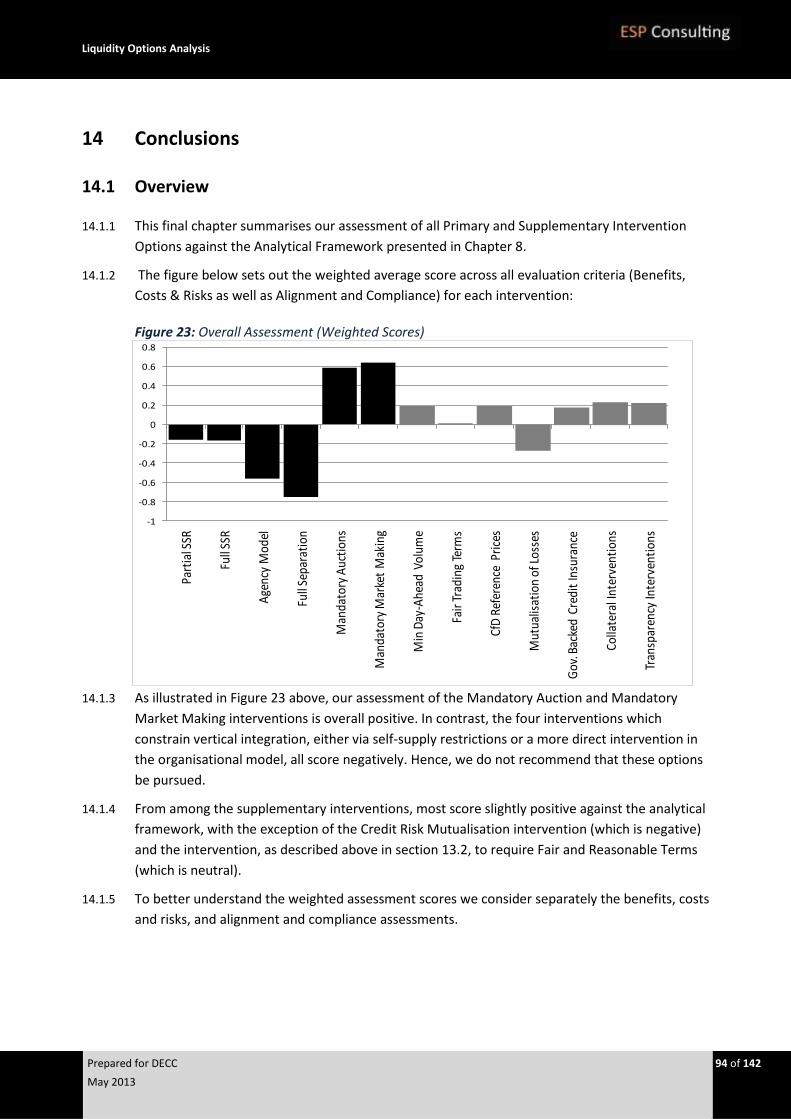
Liquidity Options Analysis
Prepared for DECC 94 of 142
May 2013
14 Conclusions
14.1 Overview
14.1.1 This final chapter summarises our assessment of all Primary and Supplementary Intervention
Options against the Analytical Framework presented in Chapter 8.
14.1.2 The figure below sets out the weighted average score across all evaluation criteria (Benefits,
Costs & Risks as well as Alignment and Compliance) for each intervention:
Figure 23: Overall Assessment (Weighted Scores)
14.1.3 As illustrated in Figure 23 above, our assessment of the Mandatory Auction and Mandatory
Market Making interventions is overall positive. In contrast, the four interventions which
constrain vertical integration, either via self-supply restrictions or a more direct intervention in
the organisational model, all score negatively. Hence, we do not recommend that these options
be pursued.
14.1.4 From among the supplementary interventions, most score slightly positive against the analytical
framework, with the exception of the Credit Risk Mutualisation intervention (which is negative)
and the intervention, as described above in section 13.2, to require Fair and Reasonable Terms
(which is neutral).
14.1.5 To better understand the weighted assessment scores we consider separately the benefits, costs
and risks, and alignment and compliance assessments.
-1
-0.8
-0.6
-0.4
-0.2
0
0.2
0.4
0.6
0.8
Part
ial S
SR
Full
SSR
Age
ncy
Mod
el
Full
Sepa
rati
on
Man
dato
ry A
ucti
ons
Man
dato
ry M
arke
t M
akin
g
Min
Day
-Ahe
ad V
olum
e
Fair
Tra
ding
Ter
ms
CfD
Ref
eren
ce P
rice
s
Mut
ualis
atio
n of
Los
ses
Gov
. Bac
ked
Cred
it In
sura
nce
Colla
tera
l Int
erve
ntio
ns
Tran
spar
ency
Inte
rven
tion
s
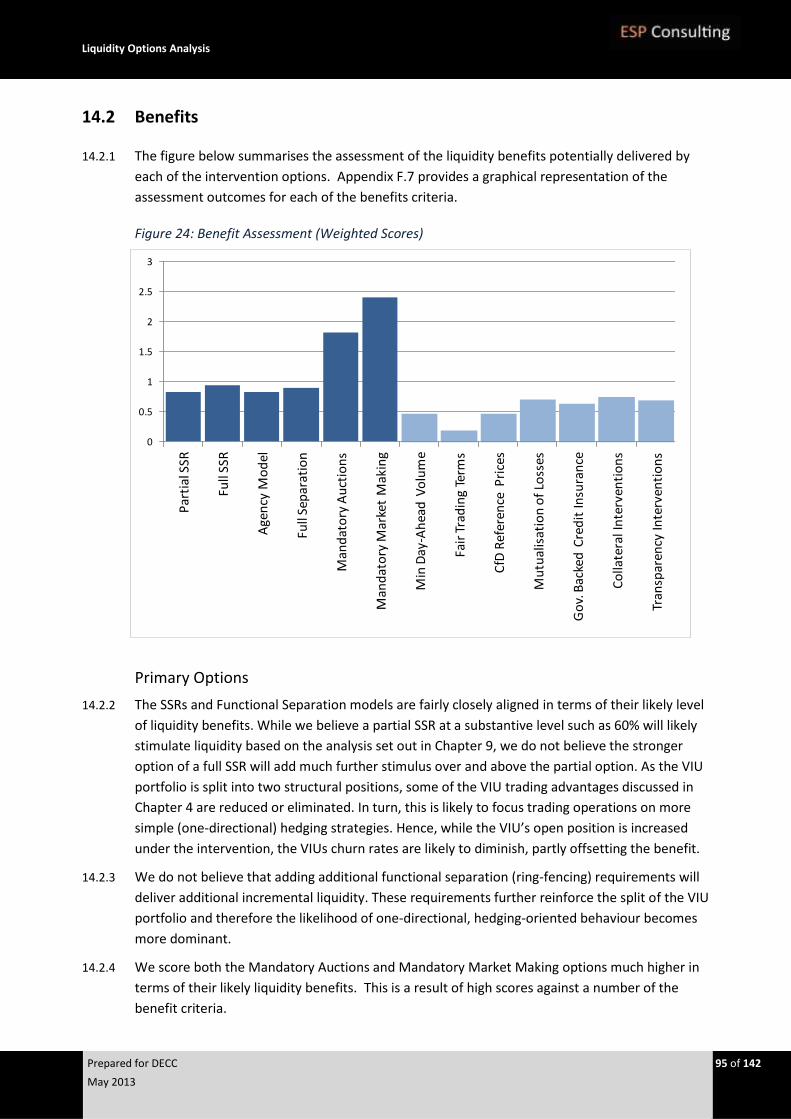
Liquidity Options Analysis
Prepared for DECC 95 of 142
May 2013
14.2 Benefits
14.2.1 The figure below summarises the assessment of the liquidity benefits potentially delivered by
each of the intervention options. Appendix F.7 provides a graphical representation of the
assessment outcomes for each of the benefits criteria.
Figure 24: Benefit Assessment (Weighted Scores)
Primary Options
14.2.2 The SSRs and Functional Separation models are fairly closely aligned in terms of their likely level
of liquidity benefits. While we believe a partial SSR at a substantive level such as 60% will likely
stimulate liquidity based on the analysis set out in Chapter 9, we do not believe the stronger
option of a full SSR will add much further stimulus over and above the partial option. As the VIU
portfolio is split into two structural positions, some of the VIU trading advantages discussed in
Chapter 4 are reduced or eliminated. In turn, this is likely to focus trading operations on more
simple (one-directional) hedging strategies. Hence, while the VIU’s open position is increased
under the intervention, the VIUs churn rates are likely to diminish, partly offsetting the benefit.
14.2.3 We do not believe that adding additional functional separation (ring-fencing) requirements will
deliver additional incremental liquidity. These requirements further reinforce the split of the VIU
portfolio and therefore the likelihood of one-directional, hedging-oriented behaviour becomes
more dominant.
14.2.4 We score both the Mandatory Auctions and Mandatory Market Making options much higher in
terms of their likely liquidity benefits. This is a result of high scores against a number of the
benefit criteria.
0
0.5
1
1.5
2
2.5
3
Par
tial
SSR
Full
SSR
Age
ncy
Mo
del
Full
Sep
arat
ion
Man
dat
ory
Au
ctio
ns
Man
dat
ory
Mar
ket
Mak
ing
Min
Day
-Ah
ead
Vo
lum
e
Fair
Tra
din
g Te
rms
CfD
Ref
eren
ce P
rice
s
Mu
tual
isat
ion
of
Loss
es
Go
v. B
acke
d C
red
it In
sura
nce
Co
llate
ral I
nte
rven
tio
ns
Tran
spar
ency
Inte
rven
tio
ns
Liquidity Options Analysis
Prepared for DECC 96 of 142
May 2013
14.2.5 Both the Mandatory Auction intervention and the Mandatory Market Making intervention have a
much greater scope to direct the products (tenor and shape) onto which the intervention is
focused, compared to the SSRs and Functional Separation interventions. Although the SSR and
Functional Separation interventions could be designed with a tenor restriction (as we
recommend), this is an inferior solution to simply mandating specifically which products must be
auctioned or made a market. The tenor restriction gives no indication of shape, is a blunt tool for
directing liquidity to particular tenors, and is difficult to monitor and enforce.
14.2.6 With respect to the Mandatory Auction and Mandatory Market Making interventions, the ability
to specify particular forward products is also an elegant solution for the question of a reference
product for the baseload CfD.
14.2.7 The Mandatory Auction and Mandatory Market Making interventions ensure that the mandated
products are regularly available for purchase and sale in the market. This assurance that a
market in certain products will be available on a regular basis, is especially attractive to
participants who require the confidence that a net open position can always be closed on short
notice (e.g. financial players). On this point, the market making intervention scores highest with
continually available products, while the Mandatory Auction assures that products are
periodically available (with, we believe, additional availability on secondary markets).
14.2.8 The SSRs and Functional Separation interventions give no such assurance. In an extreme case,
the self-supply restriction interventions are not incompatible with the Big Six refraining from any
activity at all in the forward market for long periods of time. It’s feasible (although unlikely) that
even with a tenor restriction, vertically integrated companies could concentrate their price
hedging activities on discrete interventions in the market, separated by long periods of no market
activity. We consider this outcome to be neither likely nor optimal for VIUs, but we feel it
illustrates the contrast between the four interventions concentrating primarily on the vertically
integrated nature of the market and the two interventions that take a more direct approach
toward mandating the offer of volumes in the market.
14.2.9 While we attribute significant benefits to both Mandatory Auctions and Mandatory Market
Making interventions, the latter option is clearly the strongest in our view. This is fundamentally
a reflection that this option is the only intervention which pulls, rather than pushes, liquidity. The
Mandatory Auction option sets in advance the volume of power which must be included in the
auction (e.g. 10% of annual generation). Although participants can bring additional volume to the
market voluntarily, and we do expect secondary effects, this intervention would seem to have a
somewhat pre-determined impact on churn. In contrast, with the Mandatory Market Making
intervention, the surrounding market (i.e. all other participants) will decide which products they
require and in which quantities. Hence, this option is unique in that its success does not depend
on how the subject companies (i.e. VIUs) respond to the interventions, but rather on what all
other participants want from the intervention.
14.2.10 The Mandatory Market Making intervention is driven by the surrounding market demand for
liquidity rather than a pre-determined, mandated volume. This is a very strong feature. While the
VIU’s dominate trading in the current market, achieving churn rate and liquidity at the level of the
Nordic or Continental markets will likely require far greater participation from other players. The
Mandatory Market Making solution is better equipped to stimulate these players.
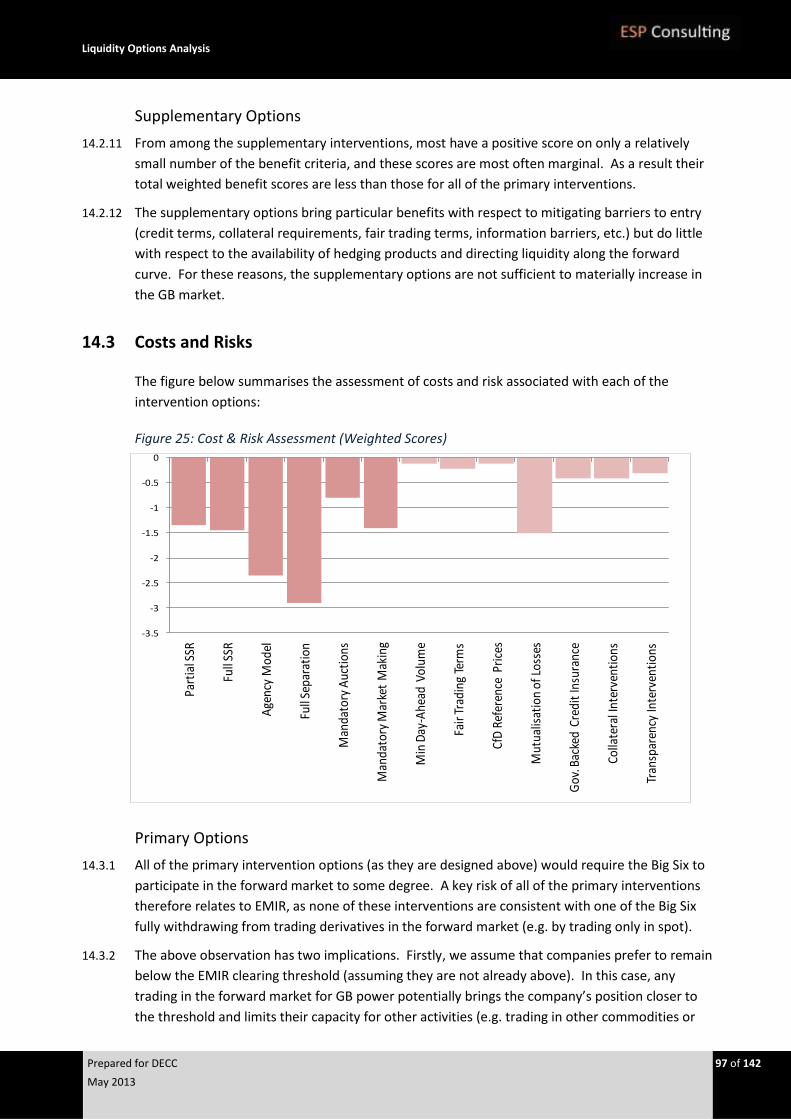
Liquidity Options Analysis
Prepared for DECC 97 of 142
May 2013
Supplementary Options
14.2.11 From among the supplementary interventions, most have a positive score on only a relatively
small number of the benefit criteria, and these scores are most often marginal. As a result their
total weighted benefit scores are less than those for all of the primary interventions.
14.2.12 The supplementary options bring particular benefits with respect to mitigating barriers to entry
(credit terms, collateral requirements, fair trading terms, information barriers, etc.) but do little
with respect to the availability of hedging products and directing liquidity along the forward
curve. For these reasons, the supplementary options are not sufficient to materially increase in
the GB market.
14.3 Costs and Risks
The figure below summarises the assessment of costs and risk associated with each of the
intervention options:
Figure 25: Cost & Risk Assessment (Weighted Scores)
Primary Options
14.3.1 All of the primary intervention options (as they are designed above) would require the Big Six to
participate in the forward market to some degree. A key risk of all of the primary interventions
therefore relates to EMIR, as none of these interventions are consistent with one of the Big Six
fully withdrawing from trading derivatives in the forward market (e.g. by trading only in spot).
14.3.2 The above observation has two implications. Firstly, we assume that companies prefer to remain
below the EMIR clearing threshold (assuming they are not already above). In this case, any
trading in the forward market for GB power potentially brings the company’s position closer to
the threshold and limits their capacity for other activities (e.g. trading in other commodities or
-3.5
-3
-2.5
-2
-1.5
-1
-0.5
0
Part
ial S
SR
Full
SSR
Age
ncy
Mod
el
Full
Sepa
rati
on
Man
dato
ry A
ucti
ons
Man
dato
ry M
arke
t M
akin
g
Min
Day
-Ahe
ad V
olum
e
Fair
Tra
ding
Ter
ms
CfD
Ref
eren
ce P
rice
s
Mut
ualis
atio
n of
Los
ses
Gov
. Bac
ked
Cred
it In
sura
nce
Colla
tera
l Int
erve
ntio
ns
Tran
spar
ency
Inte
rven
tion
s
Liquidity Options Analysis
Prepared for DECC 98 of 142
May 2013
markets). In the worst case, the mandated participation in the intervention results in the
company having a position above the EMIR clearing threshold. Recalling that hedging trades may
be exempted from the calculation of the position with respect to the EMIR clearing threshold, we
note that market activity resulting from the SSRs, Functional Separation intervention, and
Mandatory Auction may be classified as a hedge, as this trading would be set against the
generation or supply position. However, the Mandatory Market Making intervention is not
directly tied to a generation or supply position and therefore would be unlikely to quality as a
hedge (in our opinion). It is also this intervention which is likely to generate the most amount of
churn. The risk of Mandatory Market Making causing a participant to breach the thresholds is to
a large degree mitigated by assuming that market makers will set their bid and ask prices
appropriately to keep their net position relatively flat, together with the assumption that
positions on exchanges are measured on a net basis with respect to the clearing threshold.
14.3.3 Secondly, we consider the case where a mandated participant is already above the clearing
threshold. In this case, all trading with financial counterparties and qualified non-financial
counterparties is subject to mandatory clearing or the bilateral exchange of collateral. The
impact depends on the particular intervention. It is here that the Mandatory Market Making
intervention is somewhat less onerous, given our assumptions that market making uses an
exchange platform (as we recommend) and the market makers set their bid and ask prices in such
a way as to have a relatively balanced portfolio of buys and sells (which is very likely). In this
case, margin calls on short and long positions are likely to offset each other and the net cashflow
impact will be small. However, for the other interventions, we assume that they will be met by
trading on a variety of platforms and with a variety of counterparties, some of whom will
exchange margin, and some of whom will not. It will be difficult or impossible to maintain a
balanced portfolio of short and long positions with margining counterparties, and therefore
difficult to avoid the cashflow impacts of variation margining. It will be particularly difficult to
manage the margin cashflow implications of the Mandatory Auction intervention, because a
company cannot choose whether to trade with a margining or non-margining counterparty as
buyers are assigned to sellers depending on the clearing price of the auction. It becomes difficult
or impossible for a company subject to the clearing requirement to avoid further requirements
for variation margining during a cash liquidity crisis by ceasing all new trading, as trading is
mandated by the interventions.
14.3.4 Apart from the cash liquidity risks related to EMIR, the interventions which address vertical
integration had higher costs and risks than the Mandatory Auction and Mandatory Market
Making interventions. Across all primary options, the agency and full separation models
generally score poorly. This reflects that these models:
Impact the operations and business model internally within the subject companies (i.e
VIUs);
Will require changes to the existing organisation, business processes and systems with the
added complexity that such changes only apply to a subset of the wider pan-European
portfolios that these companies typically operate;
Will require additional risk management processes to guard against accidental speculative
positions emerging at group level;
Liquidity Options Analysis
Prepared for DECC 99 of 142
May 2013
Will require new internal compliance functions;
14.3.5 As a result, these options will also impose significant implementation costs as well as some
ongoing additional costs incurred due to the process and staffing duplication these models
necessarily entail.
14.3.6 Of the two functional separation models, the Full Separation Model fares the worst with respect
to costs and complexity, since this option as explained in Chapter 10 requires not only separate
optimisation and commercial functions but also stand-alone trading functions (to be split out
from the existing centralised hubs). These models, and in particular the Full Separation model
may also expose the subject companies to significant incremental cashflow risk under margining
terms. In contrast, the success of SSR and functional separation interventions rely heavily on how
the VIUs react to the constraints on their business model and internal operations. This cannot be
known with any certainty and these models are therefore far more susceptible to unintended
consequences.
14.3.7 Based on our experience of assisting companies with internal assessment of their credit
worthiness and ratings performance, we believe that agencies would view the commercial
inefficiencies introduced with these models with concern. As these models break up and
eliminate key VIU benefits, they will be viewed as having a negative financial impact. In particular
the Full Separation model might be a sufficiently drastic intervention to create a material risk of a
(one-notch) downgrade.
14.3.8 Both Functional Separation models, and again in particular the Full Separation model, are judged
as being quite exposed to unintended consequences. This primarily reflects that these models are
likely to prompt changes in current trading behaviour as discussed in Chapter 10. By the same
token, however, both options score well against the gaming criteria compared with, for example,
the pure SSR options and Mandatory Auctions since the functional ring-fencing and
accompanying compliance processes provides added controls.
14.3.9 In contrast, the Mandatory Auction and Mandatory Market Making interventions comprise
solutions which also exist naturally in a commercial context and hence fit well within the existing
normal market structure. These interventions do not impact the VIU’s business model materially
and are far less likely to lead to fundamental changes in trading behaviour which in turn may
dampen or negate the intended stimulus.
14.4 Alignment and Compliance
14.4.1 The figure below summarises the assessment of the Alignment and Compliance evaluation
criteria defined in the Analytical Framework:

Liquidity Options Analysis
Prepared for DECC 100 of 142
May 2013
Figure 26: Alignment & Compliance Assessment (Weighted Scores)
Primary Options
14.4.2 We note that a SSR potentially could conflict with Ofgem’s minimum liquidity proposals, which
includes a Day-Ahead gross bidding requirement. In contrast to the partial option, however, a
Full SSR will not in any circumstances be consistent with a minimum Day-Ahead gross bidding
requirement. Hence, we judge this option to conflict with and hinder Ofgem’s minimum liquidity
proposals.
14.5 Recommendations
14.5.1 Our assessment of the Mandatory Auction and Mandatory Market Making interventions is overall
positive. In contrast, the four interventions which constrain vertical integration, either via self-
supply restrictions or a more direct intervention in the organisational model, all score negatively.
The SSRs and Functional Separation interventions were assessed to have large and negative
consequences for the organisation and business model, with associated costs to set up and
maintain the interventions. Hence, we do not recommend that these options be pursued.
14.5.2 Mandatory Auctions and Mandatory Market Making, while forcing some changes on the
organisation, were both evaluated to fit much better within “business as usual” and therefore to
be lower cost and lower risk solutions. We recommend the Mandatory Market Making option
above all other, given its unique potential to deliver liquidity in line with market demand.
14.5.3 From among the supplementary interventions, most score slightly positive against the analytical
framework, with the exception of the Credit Risk Mutualisation intervention (which is negative)
and the intervention, as described above in section 13.2, to require Fair and Reasonable Terms
(which is neutral).
-0.6
-0.5
-0.4
-0.3
-0.2
-0.1
0
0.1
0.2
0.3
Part
ial S
SR
Full
SSR
Age
ncy
Mod
el
Full
Sepa
rati
on
Man
dato
ry A
ucti
ons
Man
dato
ry M
arke
t M
akin
g
Min
Day
-Ahe
ad V
olum
e
Fair
Tra
ding
Ter
ms
CfD
Ref
eren
ce P
rice
s
Mut
ualis
atio
n of
Los
ses
Gov
. Bac
ked
Cred
it In
sura
nce
Colla
tera
l Int
erve
ntio
ns
Tran
spar
ency
Inte
rven
tion
s

Liquidity Options Analysis
Prepared for DECC 101 of 142
May 2013
APPENDICES
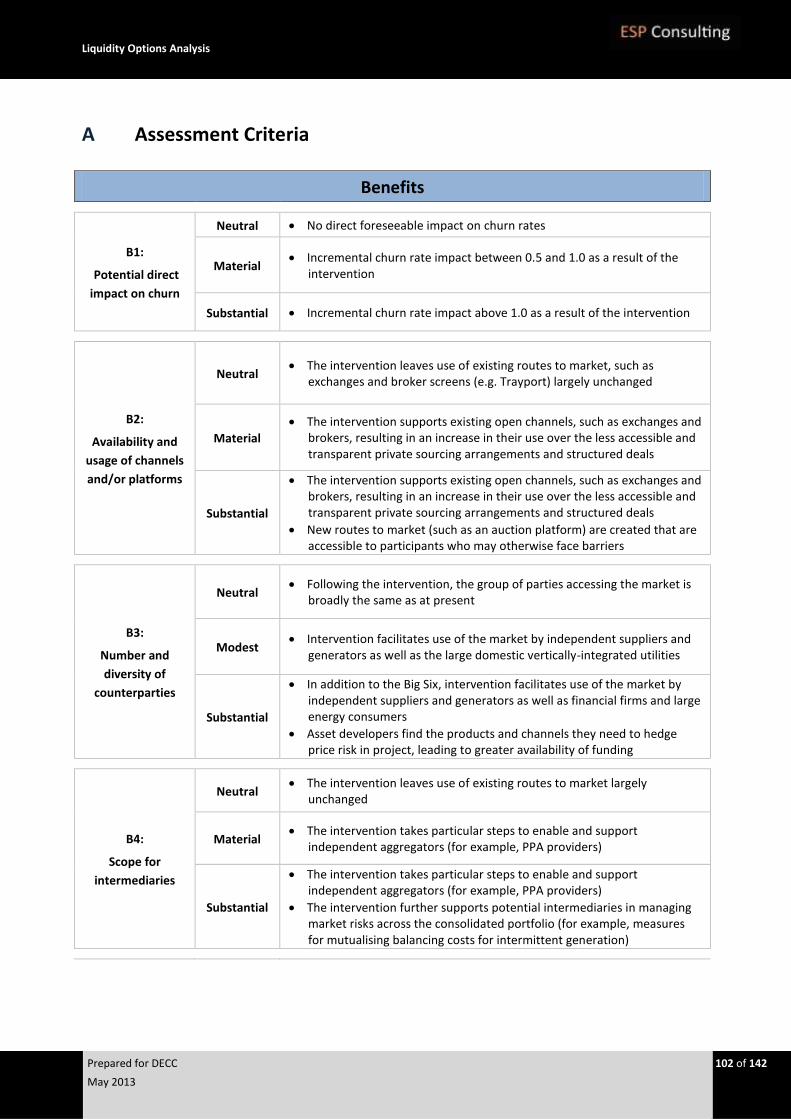
Liquidity Options Analysis
Prepared for DECC 102 of 142
May 2013
A Assessment Criteria
Benefits
B1:
Potential direct
impact on churn
Neutral No direct foreseeable impact on churn rates
Material Incremental churn rate impact between 0.5 and 1.0 as a result of the
intervention
Substantial Incremental churn rate impact above 1.0 as a result of the intervention
B2:
Availability and
usage of channels
and/or platforms
Neutral The intervention leaves use of existing routes to market, such as
exchanges and broker screens (e.g. Trayport) largely unchanged
Material
The intervention supports existing open channels, such as exchanges and brokers, resulting in an increase in their use over the less accessible and transparent private sourcing arrangements and structured deals
Substantial
The intervention supports existing open channels, such as exchanges and brokers, resulting in an increase in their use over the less accessible and transparent private sourcing arrangements and structured deals
New routes to market (such as an auction platform) are created that are accessible to participants who may otherwise face barriers
B3:
Number and
diversity of
counterparties
Neutral Following the intervention, the group of parties accessing the market is
broadly the same as at present
Modest Intervention facilitates use of the market by independent suppliers and
generators as well as the large domestic vertically-integrated utilities
Substantial
In addition to the Big Six, intervention facilitates use of the market by independent suppliers and generators as well as financial firms and large energy consumers
Asset developers find the products and channels they need to hedge price risk in project, leading to greater availability of funding
B4:
Scope for
intermediaries
Neutral The intervention leaves use of existing routes to market largely
unchanged
Material The intervention takes particular steps to enable and support
independent aggregators (for example, PPA providers)
Substantial
The intervention takes particular steps to enable and support independent aggregators (for example, PPA providers)
The intervention further supports potential intermediaries in managing market risks across the consolidated portfolio (for example, measures for mutualising balancing costs for intermittent generation)
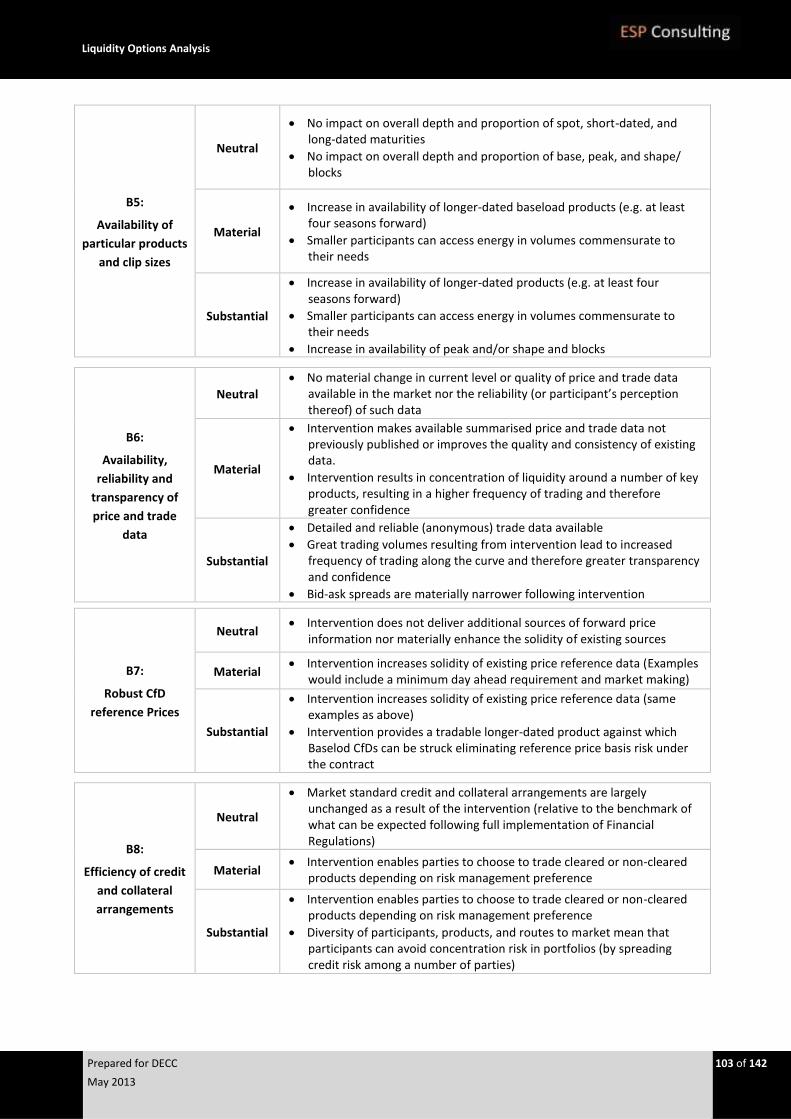
Liquidity Options Analysis
Prepared for DECC 103 of 142
May 2013
B5:
Availability of
particular products
and clip sizes
Neutral
No impact on overall depth and proportion of spot, short-dated, and long-dated maturities
No impact on overall depth and proportion of base, peak, and shape/ blocks
Material
Increase in availability of longer-dated baseload products (e.g. at least four seasons forward)
Smaller participants can access energy in volumes commensurate to their needs
Substantial
Increase in availability of longer-dated products (e.g. at least four seasons forward)
Smaller participants can access energy in volumes commensurate to their needs
Increase in availability of peak and/or shape and blocks
B6:
Availability,
reliability and
transparency of
price and trade
data
Neutral
No material change in current level or quality of price and trade data available in the market nor the reliability (or participant’s perception thereof) of such data
Material
Intervention makes available summarised price and trade data not previously published or improves the quality and consistency of existing data.
Intervention results in concentration of liquidity around a number of key products, resulting in a higher frequency of trading and therefore greater confidence
Substantial
Detailed and reliable (anonymous) trade data available
Great trading volumes resulting from intervention lead to increased frequency of trading along the curve and therefore greater transparency and confidence
Bid-ask spreads are materially narrower following intervention
B7:
Robust CfD
reference Prices
Neutral Intervention does not deliver additional sources of forward price
information nor materially enhance the solidity of existing sources
Material Intervention increases solidity of existing price reference data (Examples
would include a minimum day ahead requirement and market making)
Substantial
Intervention increases solidity of existing price reference data (same examples as above)
Intervention provides a tradable longer-dated product against which Baselod CfDs can be struck eliminating reference price basis risk under the contract
B8:
Efficiency of credit
and collateral
arrangements
Neutral
Market standard credit and collateral arrangements are largely unchanged as a result of the intervention (relative to the benchmark of what can be expected following full implementation of Financial Regulations)
Material Intervention enables parties to choose to trade cleared or non-cleared
products depending on risk management preference
Substantial
Intervention enables parties to choose to trade cleared or non-cleared products depending on risk management preference
Diversity of participants, products, and routes to market mean that participants can avoid concentration risk in portfolios (by spreading credit risk among a number of parties)
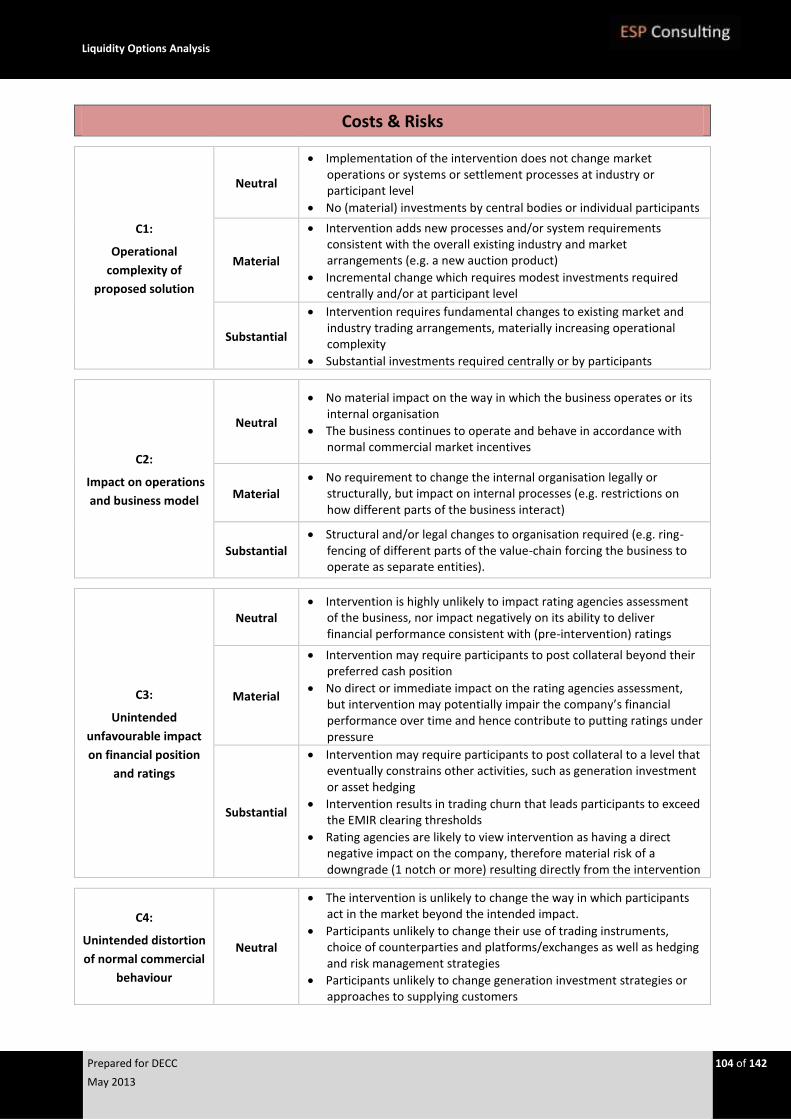
Liquidity Options Analysis
Prepared for DECC 104 of 142
May 2013
Costs & Risks
C1:
Operational
complexity of
proposed solution
Neutral
Implementation of the intervention does not change market operations or systems or settlement processes at industry or participant level
No (material) investments by central bodies or individual participants
Material
Intervention adds new processes and/or system requirements consistent with the overall existing industry and market arrangements (e.g. a new auction product)
Incremental change which requires modest investments required centrally and/or at participant level
Substantial
Intervention requires fundamental changes to existing market and industry trading arrangements, materially increasing operational complexity
Substantial investments required centrally or by participants
C2:
Impact on operations
and business model
Neutral
No material impact on the way in which the business operates or its internal organisation
The business continues to operate and behave in accordance with normal commercial market incentives
Material
No requirement to change the internal organisation legally or structurally, but impact on internal processes (e.g. restrictions on how different parts of the business interact)
Substantial
Structural and/or legal changes to organisation required (e.g. ring-fencing of different parts of the value-chain forcing the business to operate as separate entities).
C3:
Unintended
unfavourable impact
on financial position
and ratings
Neutral Intervention is highly unlikely to impact rating agencies assessment
of the business, nor impact negatively on its ability to deliver financial performance consistent with (pre-intervention) ratings
Material
Intervention may require participants to post collateral beyond their preferred cash position
No direct or immediate impact on the rating agencies assessment, but intervention may potentially impair the company’s financial performance over time and hence contribute to putting ratings under pressure
Substantial
Intervention may require participants to post collateral to a level that eventually constrains other activities, such as generation investment or asset hedging
Intervention results in trading churn that leads participants to exceed the EMIR clearing thresholds
Rating agencies are likely to view intervention as having a direct negative impact on the company, therefore material risk of a downgrade (1 notch or more) resulting directly from the intervention
C4:
Unintended distortion
of normal commercial
behaviour
Neutral
The intervention is unlikely to change the way in which participants act in the market beyond the intended impact.
Participants unlikely to change their use of trading instruments, choice of counterparties and platforms/exchanges as well as hedging and risk management strategies
Participants unlikely to change generation investment strategies or approaches to supplying customers
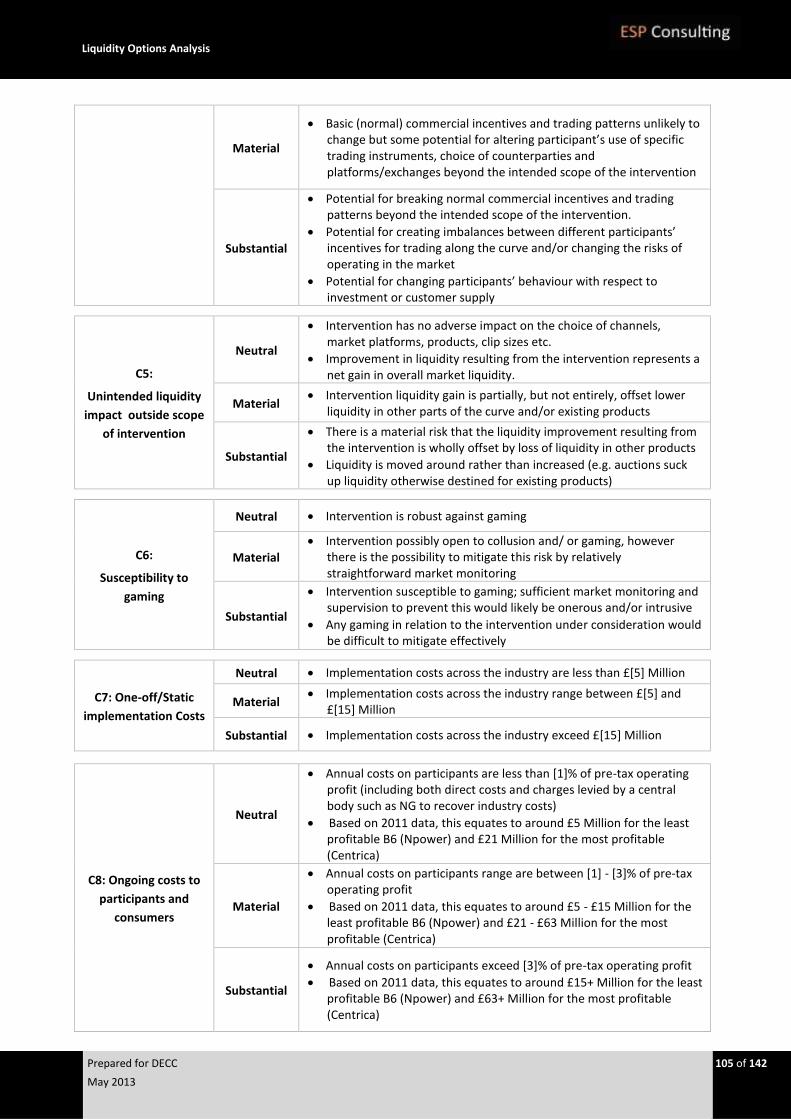
Liquidity Options Analysis
Prepared for DECC 105 of 142
May 2013
Material
Basic (normal) commercial incentives and trading patterns unlikely to change but some potential for altering participant’s use of specific trading instruments, choice of counterparties and platforms/exchanges beyond the intended scope of the intervention
Substantial
Potential for breaking normal commercial incentives and trading patterns beyond the intended scope of the intervention.
Potential for creating imbalances between different participants’ incentives for trading along the curve and/or changing the risks of operating in the market
Potential for changing participants’ behaviour with respect to investment or customer supply
C5:
Unintended liquidity
impact outside scope
of intervention
Neutral
Intervention has no adverse impact on the choice of channels, market platforms, products, clip sizes etc.
Improvement in liquidity resulting from the intervention represents a net gain in overall market liquidity.
Material Intervention liquidity gain is partially, but not entirely, offset lower
liquidity in other parts of the curve and/or existing products
Substantial
There is a material risk that the liquidity improvement resulting from the intervention is wholly offset by loss of liquidity in other products
Liquidity is moved around rather than increased (e.g. auctions suck up liquidity otherwise destined for existing products)
C6:
Susceptibility to
gaming
Neutral Intervention is robust against gaming
Material
Intervention possibly open to collusion and/ or gaming, however there is the possibility to mitigate this risk by relatively straightforward market monitoring
Substantial
Intervention susceptible to gaming; sufficient market monitoring and supervision to prevent this would likely be onerous and/or intrusive
Any gaming in relation to the intervention under consideration would be difficult to mitigate effectively
C7: One-off/Static
implementation Costs
Neutral Implementation costs across the industry are less than £[5] Million
Material Implementation costs across the industry range between £[5] and
£[15] Million
Substantial Implementation costs across the industry exceed £[15] Million
C8: Ongoing costs to
participants and
consumers
Neutral
Annual costs on participants are less than [1]% of pre-tax operating profit (including both direct costs and charges levied by a central body such as NG to recover industry costs)
Based on 2011 data, this equates to around £5 Million for the least profitable B6 (Npower) and £21 Million for the most profitable (Centrica)
Material
Annual costs on participants range are between [1] - [3]% of pre-tax operating profit
Based on 2011 data, this equates to around £5 - £15 Million for the least profitable B6 (Npower) and £21 - £63 Million for the most profitable (Centrica)
Substantial
Annual costs on participants exceed [3]% of pre-tax operating profit
Based on 2011 data, this equates to around £15+ Million for the least profitable B6 (Npower) and £63+ Million for the most profitable (Centrica)
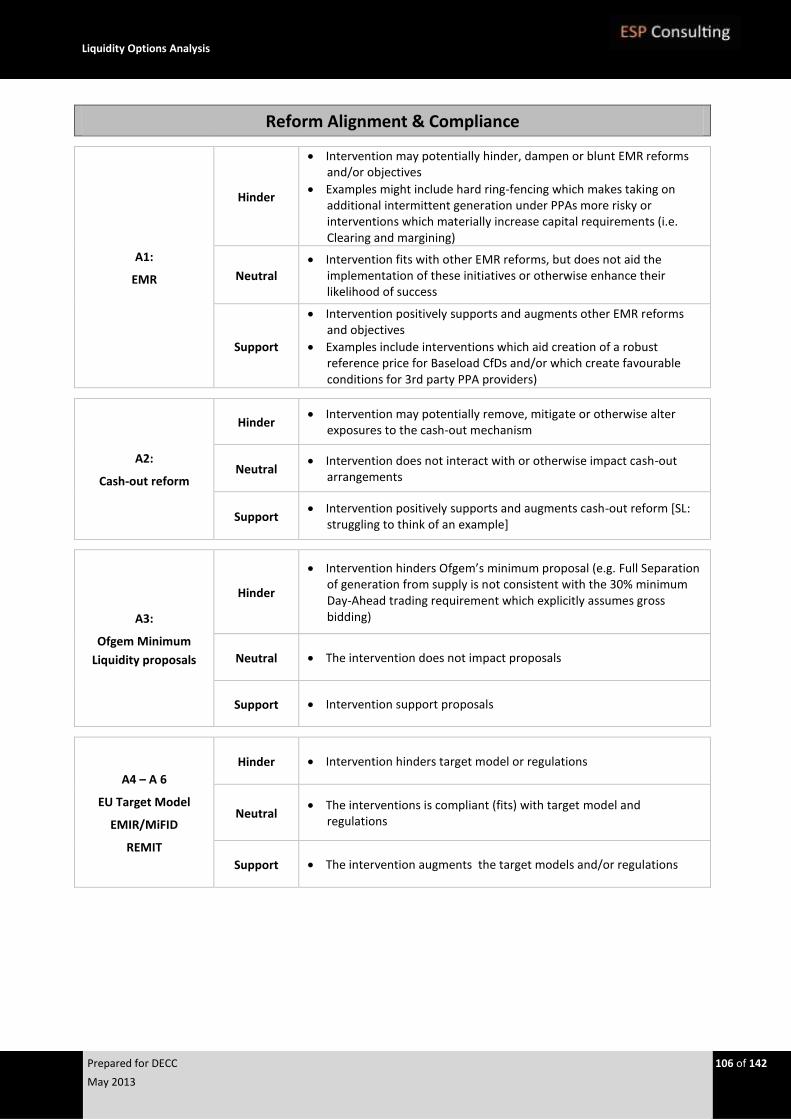
Liquidity Options Analysis
Prepared for DECC 106 of 142
May 2013
Reform Alignment & Compliance
A1:
EMR
Hinder
Intervention may potentially hinder, dampen or blunt EMR reforms and/or objectives
Examples might include hard ring-fencing which makes taking on additional intermittent generation under PPAs more risky or interventions which materially increase capital requirements (i.e. Clearing and margining)
Neutral Intervention fits with other EMR reforms, but does not aid the
implementation of these initiatives or otherwise enhance their likelihood of success
Support
Intervention positively supports and augments other EMR reforms and objectives
Examples include interventions which aid creation of a robust reference price for Baseload CfDs and/or which create favourable conditions for 3rd party PPA providers)
A2:
Cash-out reform
Hinder Intervention may potentially remove, mitigate or otherwise alter
exposures to the cash-out mechanism
Neutral Intervention does not interact with or otherwise impact cash-out
arrangements
Support Intervention positively supports and augments cash-out reform [SL:
struggling to think of an example]
A3:
Ofgem Minimum
Liquidity proposals
Hinder
Intervention hinders Ofgem’s minimum proposal (e.g. Full Separation of generation from supply is not consistent with the 30% minimum Day-Ahead trading requirement which explicitly assumes gross bidding)
Neutral The intervention does not impact proposals
Support Intervention support proposals
A4 – A 6
EU Target Model
EMIR/MiFID
REMIT
Hinder Intervention hinders target model or regulations
Neutral The interventions is compliant (fits) with target model and
regulations
Support The intervention augments the target models and/or regulations
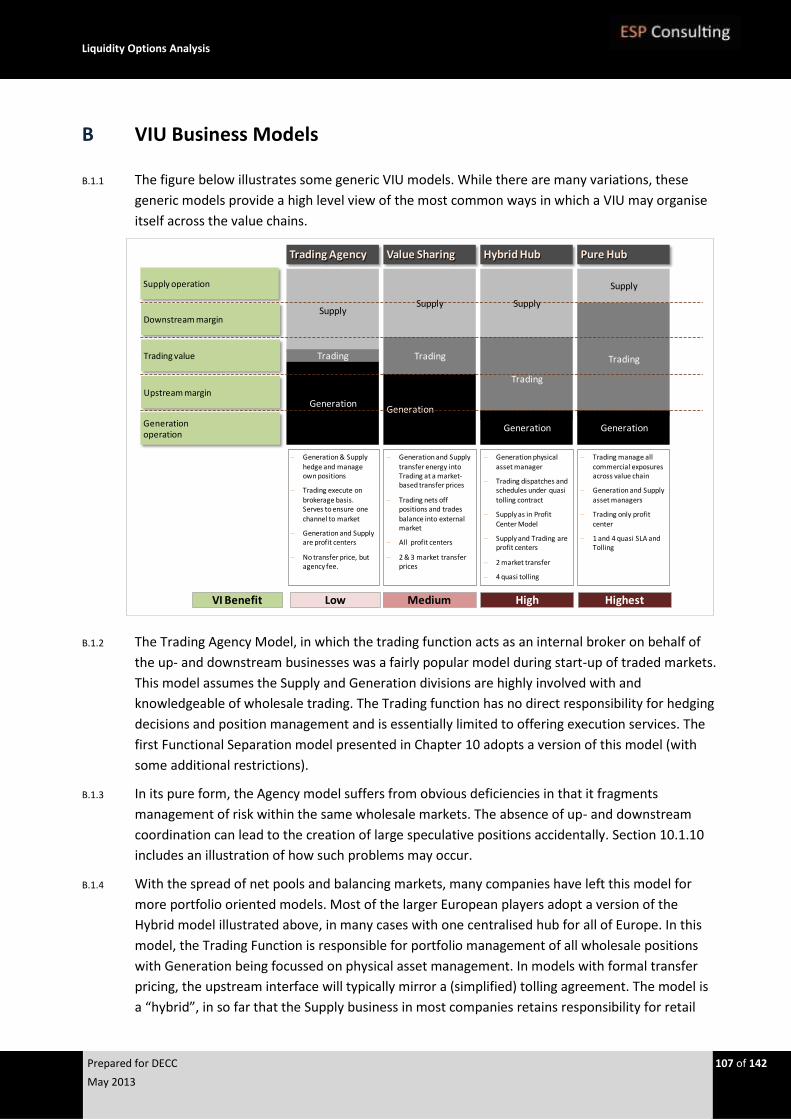
Liquidity Options Analysis
Prepared for DECC 107 of 142
May 2013
B VIU Business Models
B.1.1 The figure below illustrates some generic VIU models. While there are many variations, these
generic models provide a high level view of the most common ways in which a VIU may organise
itself across the value chains.
B.1.2 The Trading Agency Model, in which the trading function acts as an internal broker on behalf of
the up- and downstream businesses was a fairly popular model during start-up of traded markets.
This model assumes the Supply and Generation divisions are highly involved with and
knowledgeable of wholesale trading. The Trading function has no direct responsibility for hedging
decisions and position management and is essentially limited to offering execution services. The
first Functional Separation model presented in Chapter 10 adopts a version of this model (with
some additional restrictions).
B.1.3 In its pure form, the Agency model suffers from obvious deficiencies in that it fragments
management of risk within the same wholesale markets. The absence of up- and downstream
coordination can lead to the creation of large speculative positions accidentally. Section 10.1.10
includes an illustration of how such problems may occur.
B.1.4 With the spread of net pools and balancing markets, many companies have left this model for
more portfolio oriented models. Most of the larger European players adopt a version of the
Hybrid model illustrated above, in many cases with one centralised hub for all of Europe. In this
model, the Trading Function is responsible for portfolio management of all wholesale positions
with Generation being focussed on physical asset management. In models with formal transfer
pricing, the upstream interface will typically mirror a (simplified) tolling agreement. The model is
a “hybrid”, in so far that the Supply business in most companies retains responsibility for retail
Trading manage all commercial exposures across value chain
Generation and Supply
asset managers
Trading only profit
center
1 and 4 quasi SLA and Tolling
Hybrid Hub Trading Agency Pure Hub
Generation and Supply transfer energy into Trading at a market-based transfer prices
Trading nets off positions and trades balance into external market
All profit centers
2 & 3 market transfer prices
Supply
Generation operation
Supply operation
Downstream margin
Trading value
Upstream margin
Trading
Generation
Value Sharing
Supply
Generation
Trading
Supply
Trading
Generation
Supply
Trading
Generation
Generation & Supply hedge and manage own positions
Trading execute on
brokerage basis. Serves to ensure one channel to market
Generation and Supply are profit centers
No transfer price, but agency fee.
Generation physical asset manager
Trading dispatches and schedules under quasi
tolling contract
Supply as in Profit
Center Model
Supply and Trading are profit centers
2 market transfer
4 quasi tolling
Low Medium High HighestVI Benefit

Liquidity Options Analysis
Prepared for DECC 108 of 142
May 2013
margin management (and transfer prices being based on a wholesale market index). The
convergence towards this type of model was driven by:
i) Desire to have a “clean” cut between physical and commercial responsibilities
ii) Real time trading and need to manage imbalances across portfolio 24/7
iii) Increasing focus on commercial exploitation of embedded optionality
iv) Integration with fuels markets and move to spread management
B.1.5 EMIR and squeeze on liquidity adds additional impetus for such models
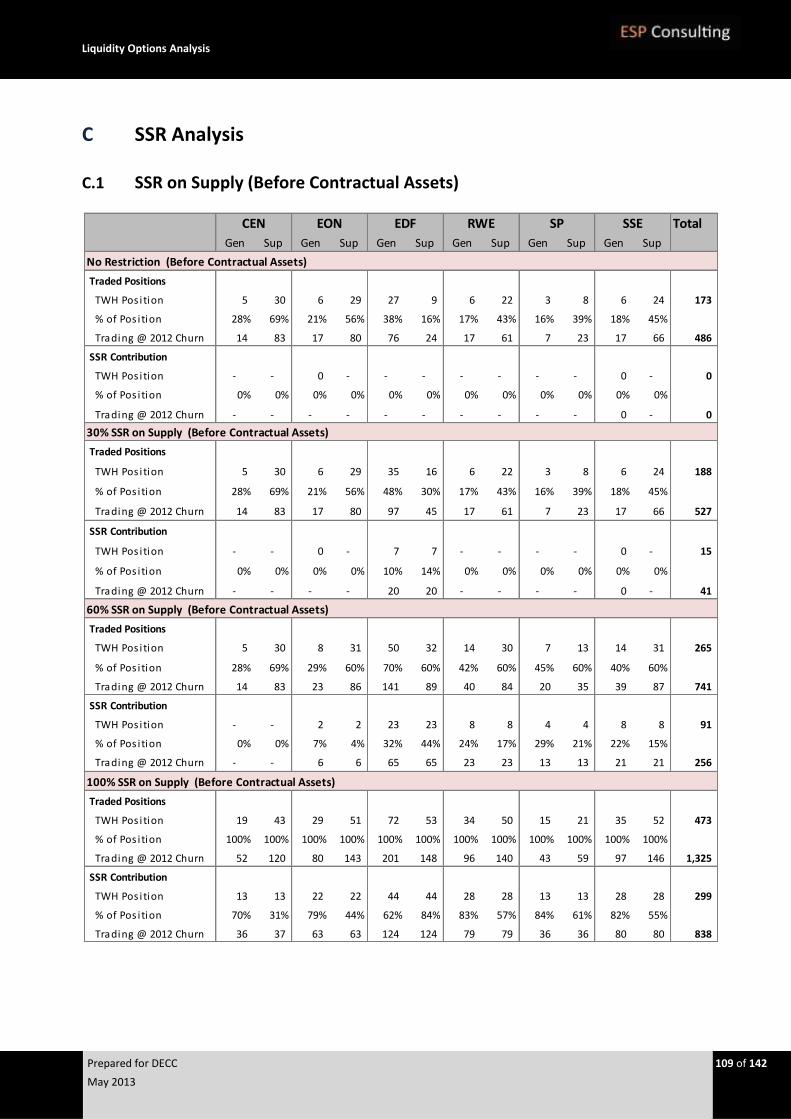
Liquidity Options Analysis
Prepared for DECC 109 of 142
May 2013
C SSR Analysis
C.1 SSR on Supply (Before Contractual Assets)
Total
Gen Sup Gen Sup Gen Sup Gen Sup Gen Sup Gen Sup
Traded Positions
TWH Pos i tion 5 30 6 29 27 9 6 22 3 8 6 24 173
% of Pos i tion 28% 69% 21% 56% 38% 16% 17% 43% 16% 39% 18% 45%
Trading @ 2012 Churn 14 83 17 80 76 24 17 61 7 23 17 66 486
SSR Contribution
TWH Pos i tion - - 0 - - - - - - - 0 - 0
% of Pos i tion 0% 0% 0% 0% 0% 0% 0% 0% 0% 0% 0% 0%
Trading @ 2012 Churn - - - - - - - - - - 0 - 0
Traded Positions
TWH Pos i tion 5 30 6 29 35 16 6 22 3 8 6 24 188
% of Pos i tion 28% 69% 21% 56% 48% 30% 17% 43% 16% 39% 18% 45%
Trading @ 2012 Churn 14 83 17 80 97 45 17 61 7 23 17 66 527
SSR Contribution
TWH Pos i tion - - 0 - 7 7 - - - - 0 - 15
% of Pos i tion 0% 0% 0% 0% 10% 14% 0% 0% 0% 0% 0% 0%
Trading @ 2012 Churn - - - - 20 20 - - - - 0 - 41
Traded Positions
TWH Pos i tion 5 30 8 31 50 32 14 30 7 13 14 31 265
% of Pos i tion 28% 69% 29% 60% 70% 60% 42% 60% 45% 60% 40% 60%
Trading @ 2012 Churn 14 83 23 86 141 89 40 84 20 35 39 87 741
SSR Contribution
TWH Pos i tion - - 2 2 23 23 8 8 4 4 8 8 91
% of Pos i tion 0% 0% 7% 4% 32% 44% 24% 17% 29% 21% 22% 15%
Trading @ 2012 Churn - - 6 6 65 65 23 23 13 13 21 21 256
Traded Positions
TWH Pos i tion 19 43 29 51 72 53 34 50 15 21 35 52 473
% of Pos i tion 100% 100% 100% 100% 100% 100% 100% 100% 100% 100% 100% 100%
Trading @ 2012 Churn 52 120 80 143 201 148 96 140 43 59 97 146 1,325
SSR Contribution
TWH Pos i tion 13 13 22 22 44 44 28 28 13 13 28 28 299
% of Pos i tion 70% 31% 79% 44% 62% 84% 83% 57% 84% 61% 82% 55%
Trading @ 2012 Churn 36 37 63 63 124 124 79 79 36 36 80 80 838
CEN EON EDF RWE SP SSE
No Restriction (Before Contractual Assets)
30% SSR on Supply (Before Contractual Assets)
60% SSR on Supply (Before Contractual Assets)
100% SSR on Supply (Before Contractual Assets)
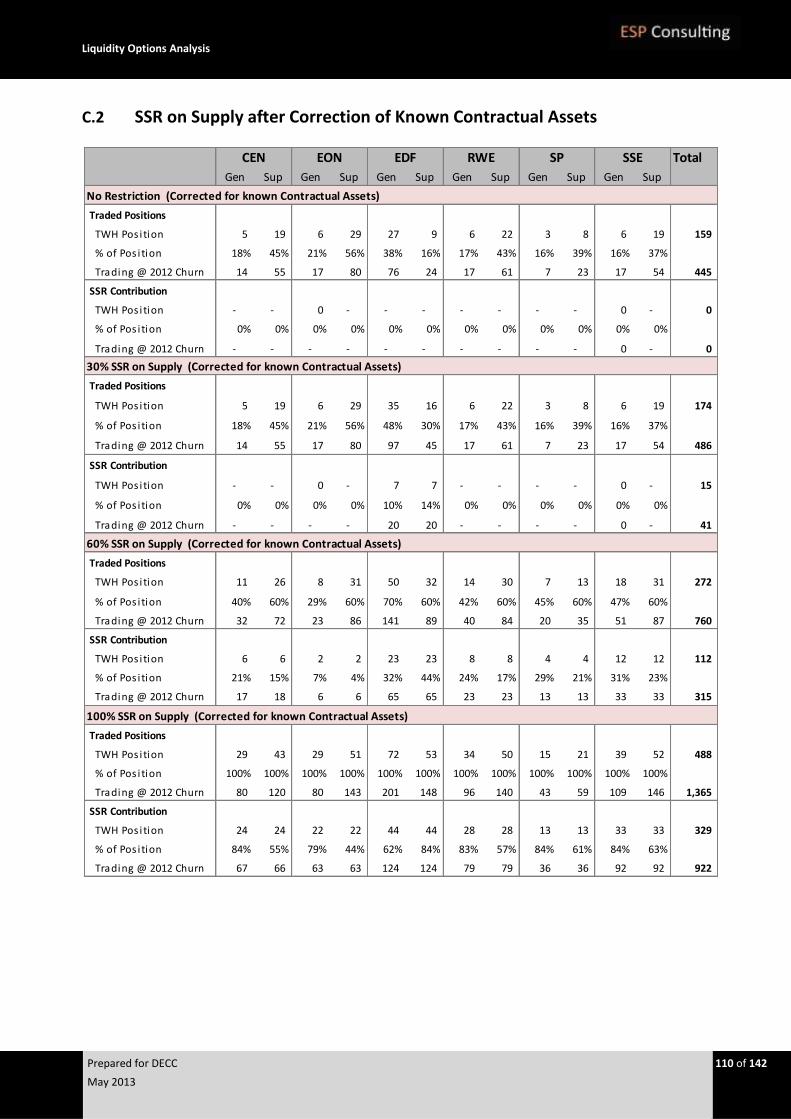
Liquidity Options Analysis
Prepared for DECC 110 of 142
May 2013
C.2 SSR on Supply after Correction of Known Contractual Assets
Total
Gen Sup Gen Sup Gen Sup Gen Sup Gen Sup Gen Sup
Traded Positions
TWH Pos i tion 5 19 6 29 27 9 6 22 3 8 6 19 159
% of Pos i tion 18% 45% 21% 56% 38% 16% 17% 43% 16% 39% 16% 37%
Trading @ 2012 Churn 14 55 17 80 76 24 17 61 7 23 17 54 445
SSR Contribution
TWH Pos i tion - - 0 - - - - - - - 0 - 0
% of Pos i tion 0% 0% 0% 0% 0% 0% 0% 0% 0% 0% 0% 0%
Trading @ 2012 Churn - - - - - - - - - - 0 - 0
Traded Positions
TWH Pos i tion 5 19 6 29 35 16 6 22 3 8 6 19 174
% of Pos i tion 18% 45% 21% 56% 48% 30% 17% 43% 16% 39% 16% 37%
Trading @ 2012 Churn 14 55 17 80 97 45 17 61 7 23 17 54 486
SSR Contribution
TWH Pos i tion - - 0 - 7 7 - - - - 0 - 15
% of Pos i tion 0% 0% 0% 0% 10% 14% 0% 0% 0% 0% 0% 0%
Trading @ 2012 Churn - - - - 20 20 - - - - 0 - 41
Traded Positions
TWH Pos i tion 11 26 8 31 50 32 14 30 7 13 18 31 272
% of Pos i tion 40% 60% 29% 60% 70% 60% 42% 60% 45% 60% 47% 60%
Trading @ 2012 Churn 32 72 23 86 141 89 40 84 20 35 51 87 760
SSR Contribution
TWH Pos i tion 6 6 2 2 23 23 8 8 4 4 12 12 112
% of Pos i tion 21% 15% 7% 4% 32% 44% 24% 17% 29% 21% 31% 23%
Trading @ 2012 Churn 17 18 6 6 65 65 23 23 13 13 33 33 315
Traded Positions
TWH Pos i tion 29 43 29 51 72 53 34 50 15 21 39 52 488
% of Pos i tion 100% 100% 100% 100% 100% 100% 100% 100% 100% 100% 100% 100%
Trading @ 2012 Churn 80 120 80 143 201 148 96 140 43 59 109 146 1,365
SSR Contribution
TWH Pos i tion 24 24 22 22 44 44 28 28 13 13 33 33 329
% of Pos i tion 84% 55% 79% 44% 62% 84% 83% 57% 84% 61% 84% 63%
Trading @ 2012 Churn 67 66 63 63 124 124 79 79 36 36 92 92 922
CEN EON EDF RWE SP SSE
No Restriction (Corrected for known Contractual Assets)
30% SSR on Supply (Corrected for known Contractual Assets)
60% SSR on Supply (Corrected for known Contractual Assets)
100% SSR on Supply (Corrected for known Contractual Assets)
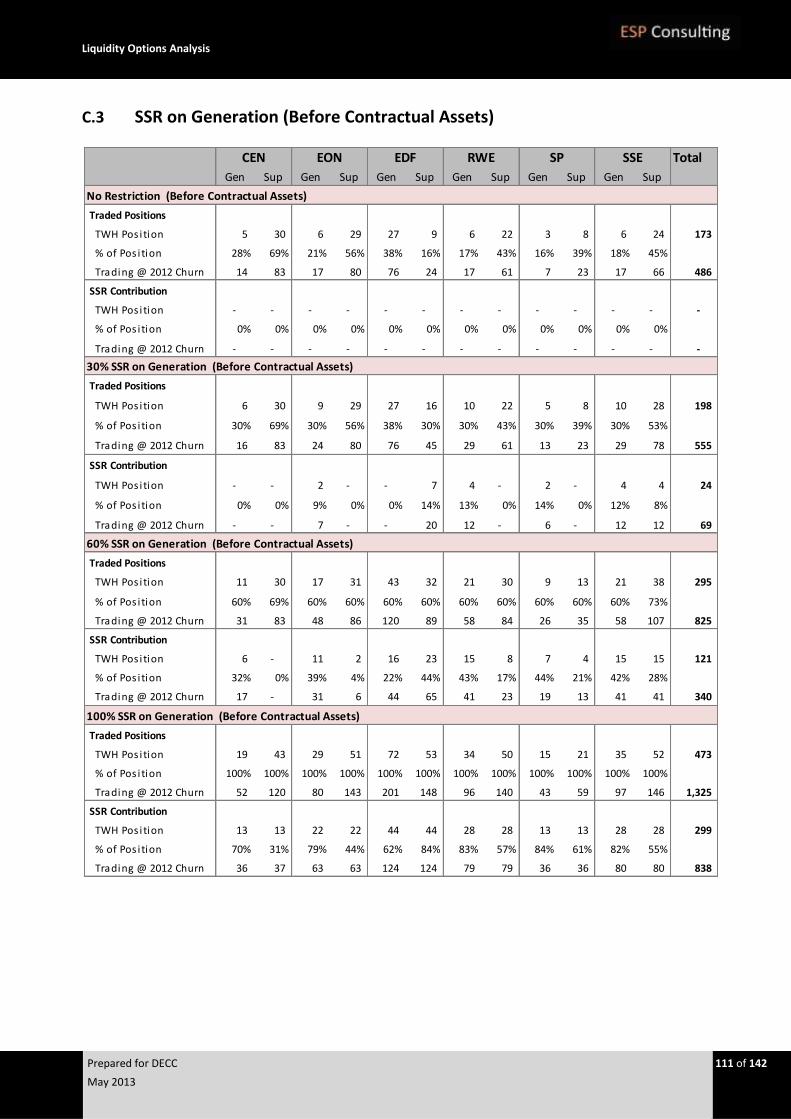
Liquidity Options Analysis
Prepared for DECC 111 of 142
May 2013
C.3 SSR on Generation (Before Contractual Assets)
Total
Gen Sup Gen Sup Gen Sup Gen Sup Gen Sup Gen Sup
Traded Positions
TWH Pos i tion 5 30 6 29 27 9 6 22 3 8 6 24 173
% of Pos i tion 28% 69% 21% 56% 38% 16% 17% 43% 16% 39% 18% 45%
Trading @ 2012 Churn 14 83 17 80 76 24 17 61 7 23 17 66 486
SSR Contribution
TWH Pos i tion - - - - - - - - - - - - -
% of Pos i tion 0% 0% 0% 0% 0% 0% 0% 0% 0% 0% 0% 0%
Trading @ 2012 Churn - - - - - - - - - - - - -
Traded Positions
TWH Pos i tion 6 30 9 29 27 16 10 22 5 8 10 28 198
% of Pos i tion 30% 69% 30% 56% 38% 30% 30% 43% 30% 39% 30% 53%
Trading @ 2012 Churn 16 83 24 80 76 45 29 61 13 23 29 78 555
SSR Contribution
TWH Pos i tion - - 2 - - 7 4 - 2 - 4 4 24
% of Pos i tion 0% 0% 9% 0% 0% 14% 13% 0% 14% 0% 12% 8%
Trading @ 2012 Churn - - 7 - - 20 12 - 6 - 12 12 69
Traded Positions
TWH Pos i tion 11 30 17 31 43 32 21 30 9 13 21 38 295
% of Pos i tion 60% 69% 60% 60% 60% 60% 60% 60% 60% 60% 60% 73%
Trading @ 2012 Churn 31 83 48 86 120 89 58 84 26 35 58 107 825
SSR Contribution
TWH Pos i tion 6 - 11 2 16 23 15 8 7 4 15 15 121
% of Pos i tion 32% 0% 39% 4% 22% 44% 43% 17% 44% 21% 42% 28%
Trading @ 2012 Churn 17 - 31 6 44 65 41 23 19 13 41 41 340
Traded Positions
TWH Pos i tion 19 43 29 51 72 53 34 50 15 21 35 52 473
% of Pos i tion 100% 100% 100% 100% 100% 100% 100% 100% 100% 100% 100% 100%
Trading @ 2012 Churn 52 120 80 143 201 148 96 140 43 59 97 146 1,325
SSR Contribution
TWH Pos i tion 13 13 22 22 44 44 28 28 13 13 28 28 299
% of Pos i tion 70% 31% 79% 44% 62% 84% 83% 57% 84% 61% 82% 55%
Trading @ 2012 Churn 36 37 63 63 124 124 79 79 36 36 80 80 838
CEN EON EDF RWE SP SSE
No Restriction (Before Contractual Assets)
30% SSR on Generation (Before Contractual Assets)
60% SSR on Generation (Before Contractual Assets)
100% SSR on Generation (Before Contractual Assets)
Liquidity Options Analysis
Prepared for DECC 112 of 142
May 2013
D Case Studies
D.1 Electricity Supply Board (ESB)
Background
D.1.1 ESB in Ireland have been subject to hard ring-fencing regulations since the launch of the Single
Electricity Market (SEM) for Northern Ireland and the Republic of Ireland. These restrictions were
aimed at curtailing market power (rather than stimulating liquidity) and focused on the on
forward market as the SEM gross pool already embeds full separation of retail and generation
physical positions.
D.1.2 As ESB’s previous dominant market position is eroding, the ring-fencing obligations are being
lessened (the obligations are not intended to be permanent). Whereas the Initial restrictions
effectively mirrored the Full Separation model, the current (lessened) obligations is more akin the
Trading Agency model.
Initial Ringfence Obligations
D.1.3 The initial ring-fence separated all power supply and generation activities completely and hence
mirrors the Full Separation model. These arrangements included:
i) A requirement on ESB PG to conduct mandatory annual auctions of ESB Generation (CfDs);
ii) Setup of separate trading and commercial operations for ESB’s SEM generation portfolio,
its Northern Ireland operations and its supply activities within separate legal entities;
iii) Prohibition on coordinating or sharing of commercial sensitive information across the three
legal entities;
iv) Completely separate business processes and IT including separate trading systems within
each of the 3 entities;
v) Mandatory “garden leave” imposed on all transfers of commercial staff between the legal
entities
vi) Establishment of an internal compliance function within the ESB Corporate to oversee ring-
fencing obligations; and
vii) Setup of core commercial systems and reports to allow ESB Group Risk Management
Function to have a one-way looking glass in which they can monitor positions across all
entities (but cannot disseminate this data back to be businesses).
D.1.4 As ESB’s market SEM position has eroded horizontal re-integration has been allowed and is
currently under implementation:
i) Generation (ESB PG) and all Northern Ireland generation activities are now merged within a
central commercial trading function; while
ii) Power supply (now Electric Ireland) remains a ring-fenced activity.
Liquidity Options Analysis
Prepared for DECC 113 of 142
May 2013
Impact on operations and liquidity
D.1.5 While we have not been able to access any public domain data on the cost of implementing and
managing the ring-fence obligations, it is very clear that they are considerable. Amongst other,
the ring-fence has required:
i) Establishment of separate legal entities;
ii) Separate instances of trading systems (and supporting analytical and optimisation tools);
iii) Duplication of core business processes and staff roles (i.e. three entity risk managers,
heads of trading etc); and
iv) Establishment of separate compliance and risk management processes and monitoring
systems.
D.1.6 In addition to these operational costs, the ring-fence has (and was intended to) prevent
exploitation of synergies across the portfolio. The gradual re-integration of positions currently
under way clearly demonstrates the inefficiency and in-optimal nature of this restricted
environment from a commercial and risk management perspective. Furthermore, this conclusion
must be appreciated in the context of the SEM market environment which explicitly is designed
to accommodate stand-alone generators and suppliers. In contrast, the BETTA environment is far
more risky for structurally exposed positions and similar ring-fence arrangements would present
even greater challenges and complexities.
D.1.7 It is difficult to assess the impact of these obligations, which mainly sought to address market
power, on SEM forward liquidity. Arguably, the single biggest impact was the mandatory
auctions of Directed Contracts. However, alongside these mandatory auctions, ESB has also
conducted voluntary auctions of commercial contracts57. It seems likely (but impossible to prove)
that the ring-fence positively contributed the volumes offered through this route.
D.2 Japan
Background
D.2.1 The Japanese incumbent VIUs have generally exercised considerable market and political power.
Amongst other, this power was expressed through imposition of unreasonably heavy distribution
charges on outsiders, making it hard for new entrants and the resulting high cost of power that is
seen as a disincentive to investing in Japan
D.2.2 Following the Fukushima incident and the nationalization of Tepco, the government was forced
to allow the VIUs to raise rates to cover increased fuel costs. In turn, this lead to debates about
the need to conduct a more radical overhaul of the power sector.
Reform Plans
D.2.3 In April 2012, the Prime Minister’s cabinet approved a plan to split utilities’ generation and
transmission businesses and open the residential electricity market to competition – to be
implemented over five years from 2015. Reforms were specifically intended to address the
57 These commercial contracts are normally referred to as Non-Directed Contracts (NDCs)
Liquidity Options Analysis
Prepared for DECC 114 of 142
May 2013
problem of excessive charges on external investors. Around the time of the announcement of the
proposed plan, Tepco (now nationalized) also announced that it is planning to divide its power
generation and transmission sectors
D.2.4 The plan includes a provision directing the government to guarantee the “stability” of electricity
supplies before allowing new entrants into the market – critics suggest this provision and
potential delays may make the proposals ineffectual. Nonetheless, potential competitors have
started to position themselves following the 2012 debate. For example:
i) Marubeni , which operates independent power plants outside Japan, announced plans to
build a floating wind farm off the coast of Fukushima
ii) SoftBank, a telecoms group, is looking to build a network of commercial-scale solar energy
generating stations around the country; and
iii) Various gas companies are reported as “eyeing expansion” opportunities.
Liquidity Options Analysis
Prepared for DECC 115 of 142
May 2013
E Credit Risk Management, Collateral, and Margining
E.1 Credit Risk Mechanics
E.1.1 The mark-to-market of an energy forward trade (or, generally, of any derivative trade) is the
value of the position considering the current price of the underlying asset. The concept of mark-
to-market is perhaps best explained by an example. Suppose a seller has previously agreed to
deliver to a buyer 5 MW of baseload UK power for the first season forward at a price of
£ 50/ MWh. Suppose further that the current price for baseload first season is £ 54/ MWh. The
difference between the agreed contract price and the current market price is £ 4, and therefore
the contract is £ 4 “in-the-money” for the buyer (who has previously agreed a more favourable
price than the current market price) and £ 4 “out-of-the-money” for the seller. From the point of
view of the buyer, the mark-to-market of the trade is £ 8736058, which is £ 4/ MWh times 5 MW
baseload delivery times 4368 hours in one UK delivery season. From the point of view of the
seller, the mark-to-market of the contract has an opposite sign (in this case, negative).
E.1.2 Credit risk is the risk of loss resulting from the failure of a counterparty to a contract to perform
their obligations under the contract. When a forward contract for physical delivery is traded, the
two parties to the deal are both potentially exposed to credit risk. This credit risk59 has two
components: settlement risk (sometimes called delivery risk or payment risk) and mark-to-market
risk (sometimes called replacement risk). Settlement risk is the value of energy delivered to a
counterparty for which payment has not yet been received. Mark-to-market risk is the loss that
would be incurred when energy is traded for future delivery at a price fixed in advance, and one
of the parties subsequently is unable or unwilling to honour the terms of the contract. The party
with the positive mark-to-market value will therefore not realise that value.
E.1.3 Settlement risk is generally much easier to treat. First of all, for a power forward contract it is
only the seller’s risk, as it is the buyer who must pay the seller. Secondly, the amount of
settlement risk is normally known in advance, as it is a function of the delivery schedule, delivery
quantity, contract price, and payment terms, all of which are agreed in the contract. Mitigations
for settlement risk are generally straightforward and include decreasing the payment terms (i.e.
the amount of time allowed for the buyer to pay following receipt of the invoice) and increasing
the invoicing frequency to collect payment more often, or requiring prepayment or some other
fixed amount of collateral or guarantee from the buyer.
E.1.4 In contrast to settlement risk, the amount and direction of mark-to-market risk is not known in
advance at the beginning of contract, and changes unpredictably as a function of market price
movements. Mitigations are often more complex. These are discussed in more detail below.
58 Ignoring discounting effects, i.e. neglecting the “time value of money”
59 Note that here we often use credit risk when in fact we mean credit exposure. Credit exposure is the amount of potential loss, while credit risk considers both the amount and probability of loss.

Liquidity Options Analysis
Prepared for DECC 116 of 142
May 2013
E.2 Common Market Mitigations for Credit Risk
E.2.1 A number of “market” solutions to mitigate credit risk and facilitate trading are currently
available in energy trading markets.
Credit Insurance: Bank Guarantees and Credit Default Swaps
E.2.2 Credit Insurance is the third-party guarantee of credit losses, against an upfront premium. We
consider here two common approaches to credit insurance: bank guarantees and credit default
swaps.
E.2.3 A bank guarantee is issued by a bank on behalf of a client of the bank to the client’s creditor (the
beneficiary). The issuing bank will guarantee to the beneficiary to indemnify credit losses
associated with a particular contract, up to a pre-agreed cap. The bank’s client (i.e. the party
whose credit risk is insured by the bank) pays a fee to the bank for issuing the guarantee. Bank
guarantees are a common credit risk mitigation tool in energy markets, especially for energy
supply contracts. An energy supplier will often require a bank guarantee from a client to cover
the expected settlement risk, and sometimes a portion of the potential mark-to-market risk.
E.2.4 Another form of credit insurance is the credit default swap. A CDS is a contract between a buyer
and a seller which references a particular third-party company which underlies the CDS. The CDS
buyer typically has credit exposure to the referenced company, in the form of bonds, trade
receivables, or outstanding mark-to-market of derivatives contracts. The buyer makes periodic
(e.g. monthly) payments to the seller, and in return the seller of the CDS guarantees a fixed
notional payment to the buyer in case of the insolvency of the third-party company referenced by
the CDS.
E.2.5 Unlike a bank guarantee, where the cost is typically paid by the party insured, the buyer (and
premium payer) of a CDS is the beneficiary party. While bank guarantees are negotiated at the
time the contract is agreed, a CDS is often purchased ex-post after mark-to-market risk has
accumulated on the deal.
E.2.6 A CDS is a common and liquid instrument in financial markets, and is easily traded and
administered. Although some energy trading market participants occasionally use CDS
instruments to mitigate credit risk in energy trading markets, we cannot describe their use as
widespread. Because the amount of mark-to-market is a function of market prices and therefore
dynamic, while the payoff of a CDS is more often a fixed notional amount, the CDS is a somewhat
mismatched mitigation for credit risk in energy trading.
E.2.7 We note finally the dependency of the mitigation on solvency of the seller of the CDS, i.e. from
the point of view of the buyer, credit risk is transferred from the underlying referenced company
to the seller of the CDS. In the case where many market participants buy CDS instruments from a
common issuer, there is the potential for systemic risk in the market.
Portfolio Compression
E.2.8 Portfolio compression is a specific mitigation for mark-to-market risk in trading portfolios with a
high volume of churn. It involves the early close-out of offsetting trades, with early cash
settlement, to reduce the outstanding mark-to-market in a portfolio of trades.

Liquidity Options Analysis
Prepared for DECC 117 of 142
May 2013
E.2.9 Again, portfolio compression is best explained by an example. Consider two trades for the same
underlying product and volume, e.g. 5 MW of first season baseload UK power. Suppose Party A
has sold to Party B at £ 50/ MWh, and then, at a later date, Party B has sold the same contract
(underlying product, delivery period, and volume) to Party A at £ 54/ MWh. Having completed
the second trade, Party B has locked in a profit of £ 8736060. Neither Party A nor Party B has any
longer a net market risk exposure to the price of first season baseload. Physical flows are also
netted out: power will neither be delivered nor received. However, the trades will not be
invoiced until the delivery period. Until settlement, Party B is exposed to credit risk.
E.2.10 In order to mitigate the credit risk of Party B, the two counterparties could agree to portfolio
compression. This exercise would first identify these two offsetting trades in the portfolios of the
companies. The two parties would then negotiate the early settlement of these trades, and
calculate the settlement amount (in the above example, £ 87360 adjusted for the discounting
effects to find the present value of the future payment). Party A would then make a cash
settlement to Party B.
E.2.11 A multilateral portfolio compression is also possible, where more than two parties are considered
when identifying trades which net out (e.g A delivers to B, B delivers to C, C delivers to A). In
practice, multilateral portfolio compression considers simultaneously many participants and
thousands of trades. Typically, trade books are examined to find a smaller set of trades with
equivalent power flows but reduced credit risk.
E.2.12 Portfolio compression is a practical, and relatively common, mitigation for credit risk in a trading
portfolio. We expect portfolio compression to become more common because EMIR mandates
certain companies to attempt period portfolio compression for non-cleared trades.
E.2.13 However, we note that not all portfolios have the opportunity for compression. For example, a
supply company would be expected to be purchasing energy on the wholesale market, and
seldom or never sell. In this case, the company’s portfolio would be “one-way”, i.e. offer little or
no opportunity to identify offsetting deals. The exercise of performing portfolio compression is
an administrative burden to examine portfolios for offsetting deals and negotiate settlement.
Although multilateral close-outs are facilitated by third parties, a large degree of back-office
support is required. Once the close-out is negotiated, early settlement of trades requires
sufficient cash liquidity to make these payments. Companies with poor cashflow may resist early
close-out of deals in order to preserve cash.
Central Clearing and Bilateral Margining
E.2.14 Bilateral margining and central clearing involve the exchange of collateral (normally liquid
collateral, especially cash) to mitigate credit risk. In case a party to a contract fails to perform,
the counterparty will have access to the collateral as compensation. The exchange of collateral,
either by bilateral margining or central clearing, is at present the most common way of mitigating
mark-to-market risk in wholesale energy markets.
E.2.15 Central clearing is the process of exchanging cash with a central clearing party (CCP), which is a
financial institution created for the purposes of holding collateral to secure a trade. Two
60 £87360 is equal to £ 4/ MWh moneyness of the contract, times 5 MW, times 4368 delivery hours in one season in the
UK EFA calendar.
Liquidity Options Analysis
Prepared for DECC 118 of 142
May 2013
counterparties, having completed a deal, agree with a CCP to clear the deal. This means the CCP
becomes the counterparty to both of the other parties. The CCP has no net market risk exposure,
but instead bears the credit risk to both parties. To mitigate this credit risk, the CCP demands
collateral.
E.2.16 Collateral posted to a CCP includes both initial margin and variation margin. Initial margin is an
amount of collateral posted at the inception of the trade, when the mark-to-market of the trade
is zero for all parties. The initial margin protects the CCP from future changes in the mark-to-
market. Variation margin is additional collateral posted daily to the CCP, or received back from
the CCP, depending on the underlying daily price movements. The total of the initial margin and
variation margin posted to the CCP normally exceeds the negative mark-to-market of the deal.
E.2.17 In contrast, bilateral margining is the exchange of collateral directly between two parties without
the intermediation of a CCP. The initial margin is often neglected, and in fact companies often
agree a “margin threshold”, and exchange collateral only for credit risk exceeding the threshold.
E.2.18 EMIR mandates compulsory clearing for certain “eligible” products when traded amongst
financial counterparties and non-financial counterparties with positions above the clearing
threshold. For products which are not eligible products (because they are non-standard or
because central clearing is not available), EMIR mandates bilateral margining for those
counterparties otherwise subject to compulsory clearing.
E.3 Margining and Cash Liquidity Risk
E.3.1 The common market practice of securing trades by requiring the posting of collateral (either
bilaterally or through a central clearing party) is effective in mitigating credit risk but in turn
generates cash liquidity risk. The requirement to post collateral requires companies to have
sufficient cash (or alternative, acceptable financial instruments) on hand to meet calls for
variation margin. Cash liquidity risk is the risk that available cash or liquid instruments should
prove insufficient to meet calls for variation margin. Possible consequences of not meeting a
margin call include, at best, exclusion from wholesale markets and liquidation (i.e. close out and
immediate settlement) of the trades for which margin is not posted, jeopardising both the
effectiveness of market price hedges and the security of physical energy flows. At worst, failure
to meet a margin call is deemed as a default and results in bankruptcy, regardless of the
underlying profitability of the firm.
E.3.2 Companies must therefore manage their cash liquidity risk by both monitoring carefully their
portfolio of trades subject to clearing and by ensuring sufficient liquidity to meet collateral calls.
E.3.3 Companies which use clearing and bilateral margining to mitigate credit risk commonly rely on
liquidity support from bank guarantees or revolving lines of credit. In both cases, companies pay
a fee to a bank to reserve the right to draw credit (up to an agreed maximum) for a fixed term.
As additional liquidity is required to support margining beyond cash-on-hand in the company’s
treasury, the guarantee or line of credit may be used to provide collateral to a counterparty. In
addition to the reservation fee, client companies pay interest for the amount drawn under the
guarantee.
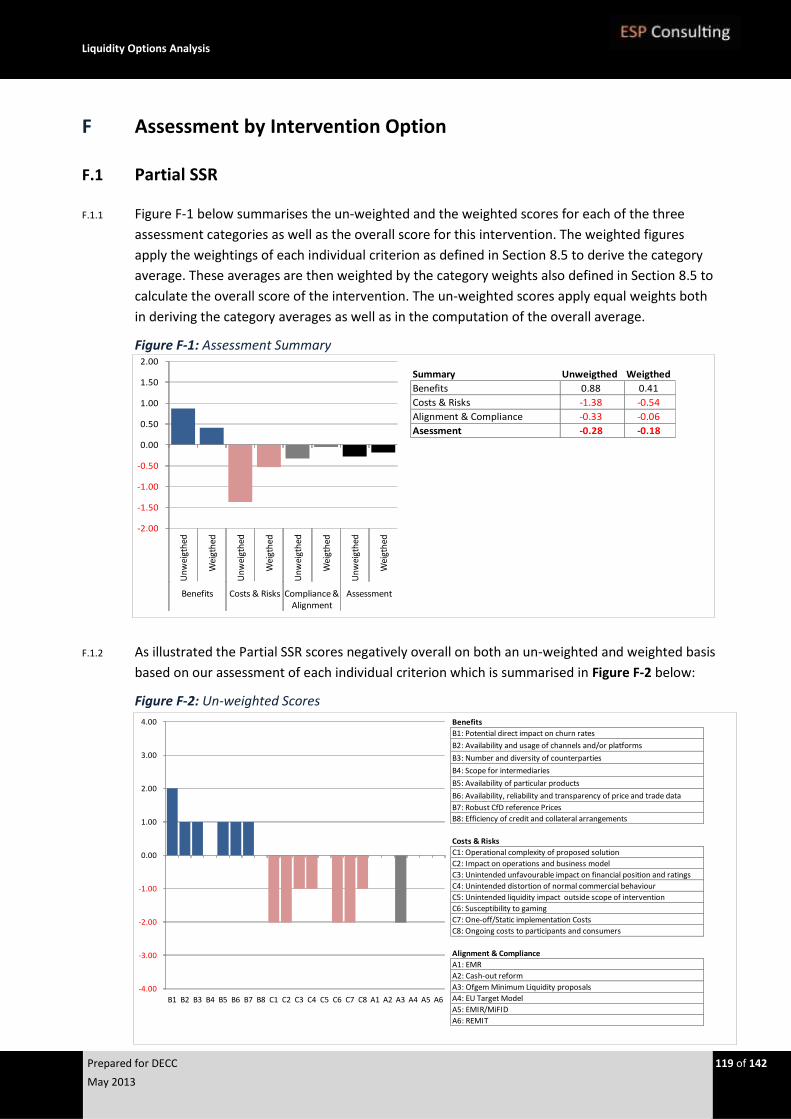
Liquidity Options Analysis
Prepared for DECC 119 of 142
May 2013
F Assessment by Intervention Option
F.1 Partial SSR
F.1.1 Figure F-1 below summarises the un-weighted and the weighted scores for each of the three
assessment categories as well as the overall score for this intervention. The weighted figures
apply the weightings of each individual criterion as defined in Section 8.5 to derive the category
average. These averages are then weighted by the category weights also defined in Section 8.5 to
calculate the overall score of the intervention. The un-weighted scores apply equal weights both
in deriving the category averages as well as in the computation of the overall average.
Figure F-1: Assessment Summary
F.1.2 As illustrated the Partial SSR scores negatively overall on both an un-weighted and weighted basis
based on our assessment of each individual criterion which is summarised in Figure F-2 below:
Figure F-2: Un-weighted Scores
Summary Unweigthed Weigthed
Benefits 0.88 0.41
Costs & Risks -1.38 -0.54
Alignment & Compliance -0.33 -0.06
Asessment -0.28 -0.18
-2.00
-1.50
-1.00
-0.50
0.00
0.50
1.00
1.50
2.00
Un
wei
gth
ed
Wei
gth
ed
Un
wei
gth
ed
Wei
gth
ed
Un
wei
gth
ed
Wei
gth
ed
Un
wei
gth
ed
Wei
gth
ed
Benefits Costs & Risks Compliance & Alignment
Assessment
Benefits
B1: Potential direct impact on churn rates
B2: Availability and usage of channels and/or platforms
B3: Number and diversity of counterparties
B4: Scope for intermediaries
B5: Availability of particular products
B6: Availability, reliability and transparency of price and trade data
B7: Robust CfD reference Prices
B8: Efficiency of credit and collateral arrangements
Costs & Risks
C1: Operational complexity of proposed solution
C2: Impact on operations and business model
C3: Unintended unfavourable impact on financial position and ratings
C4: Unintended distortion of normal commercial behaviour
C5: Unintended liquidity impact outside scope of intervention
C6: Susceptibility to gaming
C7: One-off/Static implementation Costs
C8: Ongoing costs to participants and consumers
Alignment & Compliance
A1: EMR
A2: Cash-out reform
A3: Ofgem Minimum Liquidity proposals
A4: EU Target Model
A5: EMIR/MiFID
A6: REMIT
-4.00
-3.00
-2.00
-1.00
0.00
1.00
2.00
3.00
4.00
B1 B2 B3 B4 B5 B6 B7 B8 C1 C2 C3 C4 C5 C6 C7 C8 A1 A2 A3 A4 A5 A6
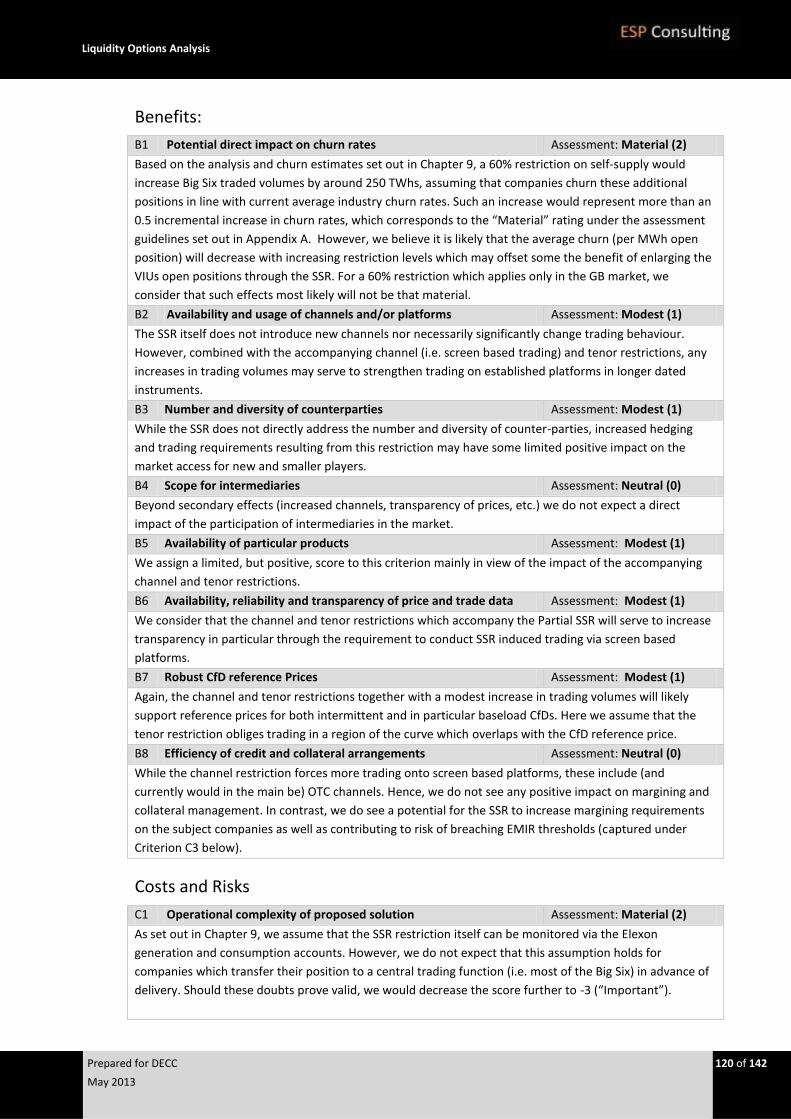
Liquidity Options Analysis
Prepared for DECC 120 of 142
May 2013
Benefits:
B1 Potential direct impact on churn rates Assessment: Material (2)
Based on the analysis and churn estimates set out in Chapter 9, a 60% restriction on self-supply would
increase Big Six traded volumes by around 250 TWhs, assuming that companies churn these additional
positions in line with current average industry churn rates. Such an increase would represent more than an
0.5 incremental increase in churn rates, which corresponds to the “Material” rating under the assessment
guidelines set out in Appendix A. However, we believe it is likely that the average churn (per MWh open
position) will decrease with increasing restriction levels which may offset some the benefit of enlarging the
VIUs open positions through the SSR. For a 60% restriction which applies only in the GB market, we
consider that such effects most likely will not be that material.
B2 Availability and usage of channels and/or platforms Assessment: Modest (1)
The SSR itself does not introduce new channels nor necessarily significantly change trading behaviour.
However, combined with the accompanying channel (i.e. screen based trading) and tenor restrictions, any
increases in trading volumes may serve to strengthen trading on established platforms in longer dated
instruments.
B3 Number and diversity of counterparties Assessment: Modest (1)
While the SSR does not directly address the number and diversity of counter-parties, increased hedging
and trading requirements resulting from this restriction may have some limited positive impact on the
market access for new and smaller players.
B4 Scope for intermediaries Assessment: Neutral (0)
Beyond secondary effects (increased channels, transparency of prices, etc.) we do not expect a direct
impact of the participation of intermediaries in the market.
B5 Availability of particular products Assessment: Modest (1)
We assign a limited, but positive, score to this criterion mainly in view of the impact of the accompanying
channel and tenor restrictions.
B6 Availability, reliability and transparency of price and trade data Assessment: Modest (1)
We consider that the channel and tenor restrictions which accompany the Partial SSR will serve to increase
transparency in particular through the requirement to conduct SSR induced trading via screen based
platforms.
B7 Robust CfD reference Prices Assessment: Modest (1)
Again, the channel and tenor restrictions together with a modest increase in trading volumes will likely
support reference prices for both intermittent and in particular baseload CfDs. Here we assume that the
tenor restriction obliges trading in a region of the curve which overlaps with the CfD reference price.
B8 Efficiency of credit and collateral arrangements Assessment: Neutral (0)
While the channel restriction forces more trading onto screen based platforms, these include (and
currently would in the main be) OTC channels. Hence, we do not see any positive impact on margining and
collateral management. In contrast, we do see a potential for the SSR to increase margining requirements
on the subject companies as well as contributing to risk of breaching EMIR thresholds (captured under
Criterion C3 below).
Costs and Risks
C1 Operational complexity of proposed solution Assessment: Material (2)
As set out in Chapter 9, we assume that the SSR restriction itself can be monitored via the Elexon
generation and consumption accounts. However, we do not expect that this assumption holds for
companies which transfer their position to a central trading function (i.e. most of the Big Six) in advance of
delivery. Should these doubts prove valid, we would decrease the score further to -3 (“Important”).
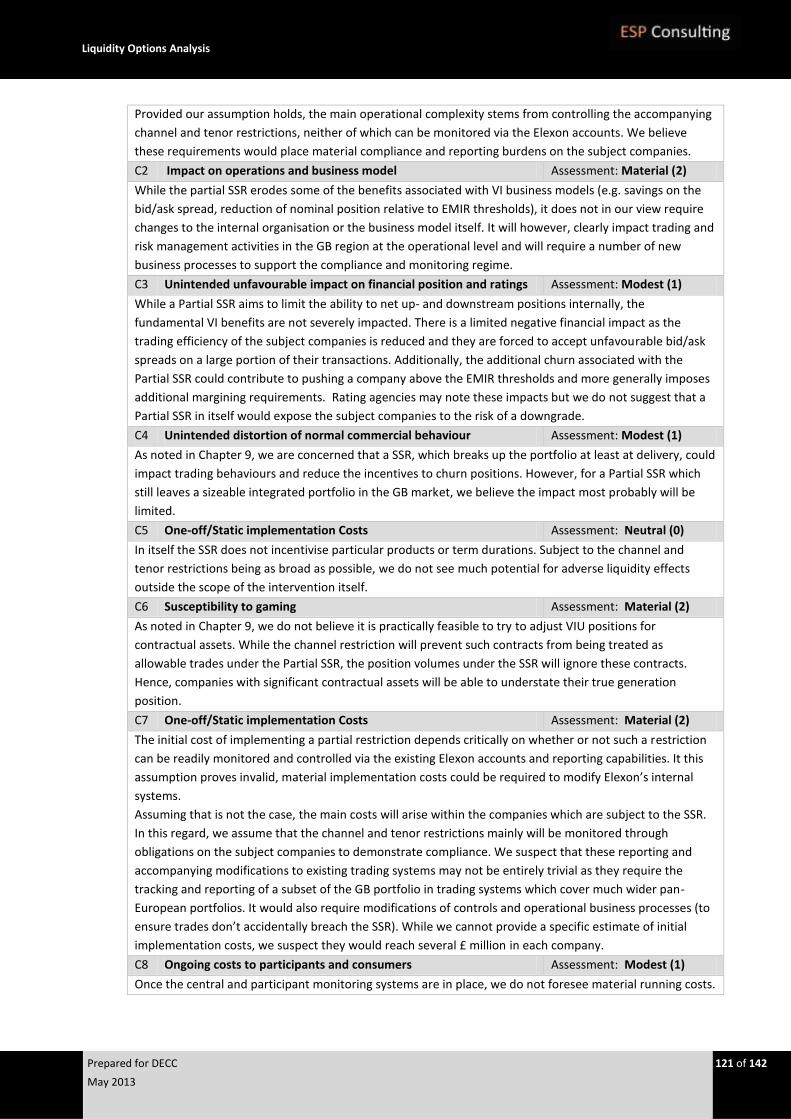
Liquidity Options Analysis
Prepared for DECC 121 of 142
May 2013
Provided our assumption holds, the main operational complexity stems from controlling the accompanying
channel and tenor restrictions, neither of which can be monitored via the Elexon accounts. We believe
these requirements would place material compliance and reporting burdens on the subject companies.
C2 Impact on operations and business model Assessment: Material (2)
While the partial SSR erodes some of the benefits associated with VI business models (e.g. savings on the
bid/ask spread, reduction of nominal position relative to EMIR thresholds), it does not in our view require
changes to the internal organisation or the business model itself. It will however, clearly impact trading and
risk management activities in the GB region at the operational level and will require a number of new
business processes to support the compliance and monitoring regime.
C3 Unintended unfavourable impact on financial position and ratings Assessment: Modest (1)
While a Partial SSR aims to limit the ability to net up- and downstream positions internally, the
fundamental VI benefits are not severely impacted. There is a limited negative financial impact as the
trading efficiency of the subject companies is reduced and they are forced to accept unfavourable bid/ask
spreads on a large portion of their transactions. Additionally, the additional churn associated with the
Partial SSR could contribute to pushing a company above the EMIR thresholds and more generally imposes
additional margining requirements. Rating agencies may note these impacts but we do not suggest that a
Partial SSR in itself would expose the subject companies to the risk of a downgrade.
C4 Unintended distortion of normal commercial behaviour Assessment: Modest (1)
As noted in Chapter 9, we are concerned that a SSR, which breaks up the portfolio at least at delivery, could
impact trading behaviours and reduce the incentives to churn positions. However, for a Partial SSR which
still leaves a sizeable integrated portfolio in the GB market, we believe the impact most probably will be
limited.
C5 One-off/Static implementation Costs Assessment: Neutral (0)
In itself the SSR does not incentivise particular products or term durations. Subject to the channel and
tenor restrictions being as broad as possible, we do not see much potential for adverse liquidity effects
outside the scope of the intervention itself.
C6 Susceptibility to gaming Assessment: Material (2)
As noted in Chapter 9, we do not believe it is practically feasible to try to adjust VIU positions for
contractual assets. While the channel restriction will prevent such contracts from being treated as
allowable trades under the Partial SSR, the position volumes under the SSR will ignore these contracts.
Hence, companies with significant contractual assets will be able to understate their true generation
position.
C7 One-off/Static implementation Costs Assessment: Material (2)
The initial cost of implementing a partial restriction depends critically on whether or not such a restriction
can be readily monitored and controlled via the existing Elexon accounts and reporting capabilities. It this
assumption proves invalid, material implementation costs could be required to modify Elexon’s internal
systems.
Assuming that is not the case, the main costs will arise within the companies which are subject to the SSR.
In this regard, we assume that the channel and tenor restrictions mainly will be monitored through
obligations on the subject companies to demonstrate compliance. We suspect that these reporting and
accompanying modifications to existing trading systems may not be entirely trivial as they require the
tracking and reporting of a subset of the GB portfolio in trading systems which cover much wider pan-
European portfolios. It would also require modifications of controls and operational business processes (to
ensure trades don’t accidentally breach the SSR). While we cannot provide a specific estimate of initial
implementation costs, we suspect they would reach several £ million in each company.
C8 Ongoing costs to participants and consumers Assessment: Modest (1)
Once the central and participant monitoring systems are in place, we do not foresee material running costs.
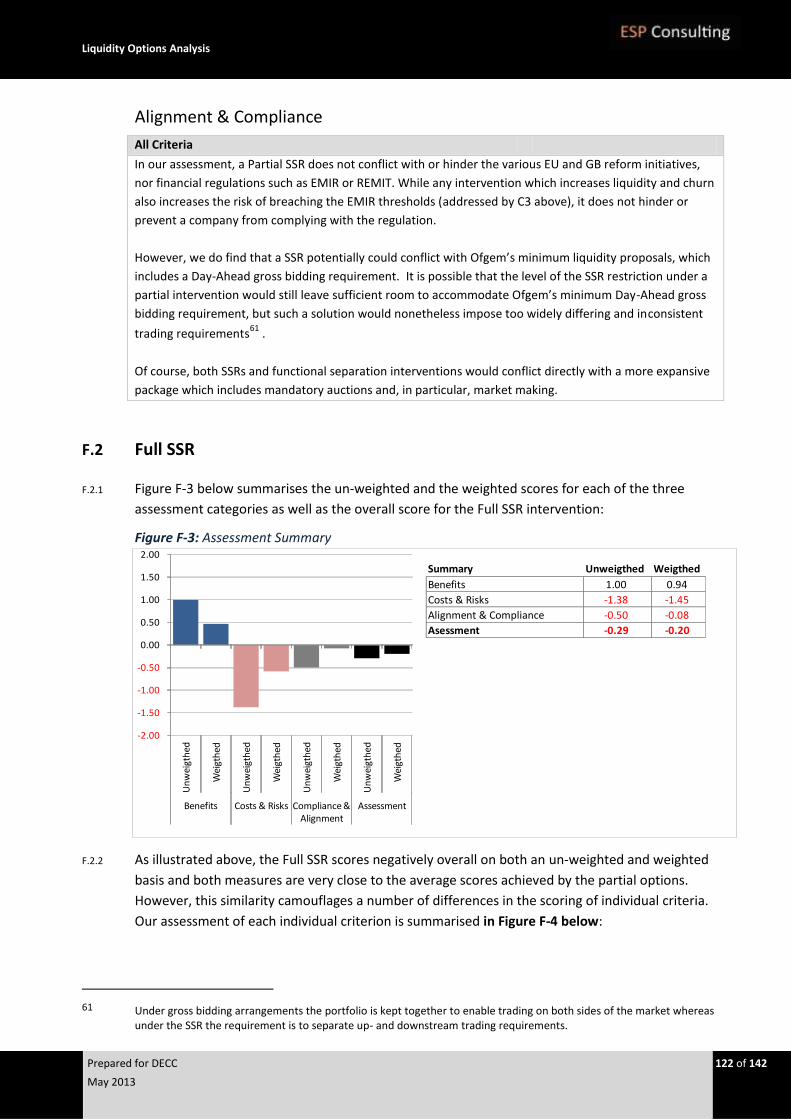
Liquidity Options Analysis
Prepared for DECC 122 of 142
May 2013
Alignment & Compliance
All Criteria
In our assessment, a Partial SSR does not conflict with or hinder the various EU and GB reform initiatives,
nor financial regulations such as EMIR or REMIT. While any intervention which increases liquidity and churn
also increases the risk of breaching the EMIR thresholds (addressed by C3 above), it does not hinder or
prevent a company from complying with the regulation.
However, we do find that a SSR potentially could conflict with Ofgem’s minimum liquidity proposals, which
includes a Day-Ahead gross bidding requirement. It is possible that the level of the SSR restriction under a
partial intervention would still leave sufficient room to accommodate Ofgem’s minimum Day-Ahead gross
bidding requirement, but such a solution would nonetheless impose too widely differing and inconsistent
trading requirements61
.
Of course, both SSRs and functional separation interventions would conflict directly with a more expansive
package which includes mandatory auctions and, in particular, market making.
F.2 Full SSR
F.2.1 Figure F-3 below summarises the un-weighted and the weighted scores for each of the three
assessment categories as well as the overall score for the Full SSR intervention:
Figure F-3: Assessment Summary
F.2.2 As illustrated above, the Full SSR scores negatively overall on both an un-weighted and weighted
basis and both measures are very close to the average scores achieved by the partial options.
However, this similarity camouflages a number of differences in the scoring of individual criteria.
Our assessment of each individual criterion is summarised in Figure F-4 below:
61 Under gross bidding arrangements the portfolio is kept together to enable trading on both sides of the market whereas
under the SSR the requirement is to separate up- and downstream trading requirements.
Summary Unweigthed Weigthed
Benefits 1.00 0.94
Costs & Risks -1.38 -1.45
Alignment & Compliance -0.50 -0.08
Asessment -0.29 -0.20
-2.00
-1.50
-1.00
-0.50
0.00
0.50
1.00
1.50
2.00
Un
wei
gth
ed
Wei
gth
ed
Un
wei
gth
ed
Wei
gth
ed
Un
wei
gth
ed
Wei
gth
ed
Un
wei
gth
ed
Wei
gth
ed
Benefits Costs & Risks Compliance & Alignment
Assessment
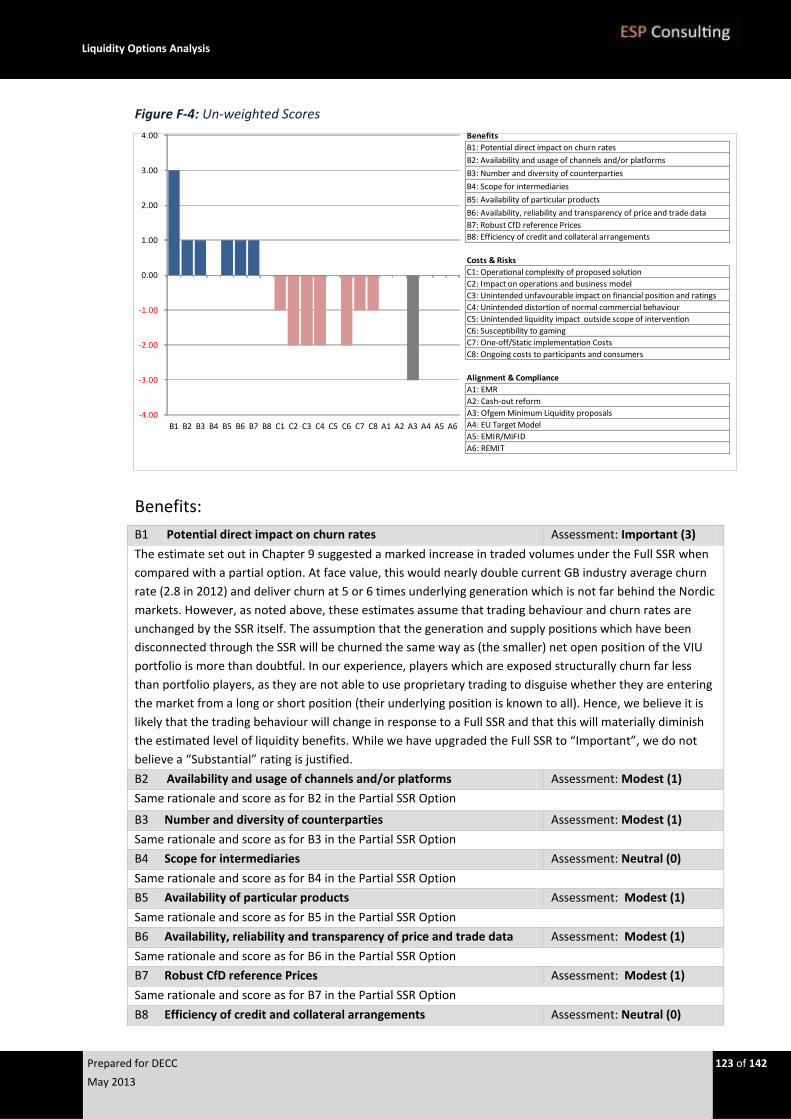
Liquidity Options Analysis
Prepared for DECC 123 of 142
May 2013
Figure F-4: Un-weighted Scores
Benefits:
B1 Potential direct impact on churn rates Assessment: Important (3)
The estimate set out in Chapter 9 suggested a marked increase in traded volumes under the Full SSR when
compared with a partial option. At face value, this would nearly double current GB industry average churn
rate (2.8 in 2012) and deliver churn at 5 or 6 times underlying generation which is not far behind the Nordic
markets. However, as noted above, these estimates assume that trading behaviour and churn rates are
unchanged by the SSR itself. The assumption that the generation and supply positions which have been
disconnected through the SSR will be churned the same way as (the smaller) net open position of the VIU
portfolio is more than doubtful. In our experience, players which are exposed structurally churn far less
than portfolio players, as they are not able to use proprietary trading to disguise whether they are entering
the market from a long or short position (their underlying position is known to all). Hence, we believe it is
likely that the trading behaviour will change in response to a Full SSR and that this will materially diminish
the estimated level of liquidity benefits. While we have upgraded the Full SSR to “Important”, we do not
believe a “Substantial” rating is justified.
B2 Availability and usage of channels and/or platforms Assessment: Modest (1)
Same rationale and score as for B2 in the Partial SSR Option
B3 Number and diversity of counterparties Assessment: Modest (1)
Same rationale and score as for B3 in the Partial SSR Option
B4 Scope for intermediaries Assessment: Neutral (0)
Same rationale and score as for B4 in the Partial SSR Option
B5 Availability of particular products Assessment: Modest (1)
Same rationale and score as for B5 in the Partial SSR Option
B6 Availability, reliability and transparency of price and trade data Assessment: Modest (1)
Same rationale and score as for B6 in the Partial SSR Option
B7 Robust CfD reference Prices Assessment: Modest (1)
Same rationale and score as for B7 in the Partial SSR Option
B8 Efficiency of credit and collateral arrangements Assessment: Neutral (0)
Benefits
B1: Potential direct impact on churn rates
B2: Availability and usage of channels and/or platforms
B3: Number and diversity of counterparties
B4: Scope for intermediaries
B5: Availability of particular products
B6: Availability, reliability and transparency of price and trade data
B7: Robust CfD reference Prices
B8: Efficiency of credit and collateral arrangements
Costs & Risks
C1: Operational complexity of proposed solution
C2: Impact on operations and business model
C3: Unintended unfavourable impact on financial position and ratings
C4: Unintended distortion of normal commercial behaviour
C5: Unintended liquidity impact outside scope of intervention
C6: Susceptibility to gaming
C7: One-off/Static implementation Costs
C8: Ongoing costs to participants and consumers
Alignment & Compliance
A1: EMR
A2: Cash-out reform
A3: Ofgem Minimum Liquidity proposals
A4: EU Target Model
A5: EMIR/MiFID
A6: REMIT
-4.00
-3.00
-2.00
-1.00
0.00
1.00
2.00
3.00
4.00
B1 B2 B3 B4 B5 B6 B7 B8 C1 C2 C3 C4 C5 C6 C7 C8 A1 A2 A3 A4 A5 A6
Liquidity Options Analysis
Prepared for DECC 124 of 142
May 2013
Same rationale and score as for B8 in the Partial SSR Option
Costs and Risks
C1 Operational complexity of proposed solution Assessment: Modest (1)
We have scored the Full SSR one notch better than the Partial option. This reflects simplification of the
monitoring and control regime both centrally (i.e. Elexon) and within the subject companies. Eliminating
the need to segregate the GB market portfolio into SSR and non-SSR components, will ease the monitoring
and reporting requirements associated with the SSR itself as well as the supplementary Channel and Tenor
restrictions.
As is the case with the Partial Option, this score assumes that the SSR restriction itself can be monitored
(and hence controlled) via the Elexon generation and consumption accounts. Should this not prove correct,
we would decrease the score further to a -2 “Material”.
C2 Impact on operations and business model Assessment: Material (2)
While the requirement to completely split the (physical) trading of up- and downstream positions further
erodes some of the benefits associated with VI business models (e.g. retaining the bid/ask spread in the
company), it does not in our view fundamentally change the operational impacts over and above that
implied by the Partial Option. Hence, the scores are the same for this criterion.
C3 Unintended unfavourable impact on financial position and ratings Assessment: Material (2)
The Full SSR will further expose the VIUs to trading inefficiencies and unfavourable bid/ask spreads on all
up- and downstream positions. We also believe that the rating agencies are likely to view a Full SRR with
concern. While this intervention only concerns the GB part of the business, this is significant across all Big
Six (and dominant for SSE). Furthermore, both the participant and the agencies would be even more
concerned that the intervention could push the company above the EMIR threshold.
C4 Unintended distortion of normal commercial behaviour Assessment: Material (2)
A Full SSR, which fully breaks up the portfolio at delivery, could impact trading behaviours and reduce the
incentives to churn positions and more so than under the partial option. We therefore upgrade this
criterion to “Material”.
C5 One-off/Static implementation Costs Assessment: Neutral (0)
Same rationale as C5 for the Partial SSR.
C6 Susceptibility to gaming Assessment: Material (2)
While the Full SSR is simpler to monitor, we still believe it is fairly open to gaming in particular through use
of contractual assets as a proxy for own generation positions. We therefore retain the “Material” rating.
C7 One-off/Static implementation Costs Assessment: Modest (1)
Compared with the partial option, the lesser operational complexity of the full option (refer C1 above) will
likely reduce initial investments required compared to a partial SSR. We have therefore downgraded this
criterion from “Material” to “Modest” for the Full SSR. We note again that this assumes the SSR can be
monitored via the Elexon accounts.
C8 Ongoing costs to participants and consumers Assessment: Modest (1)
Same rationale as C8 for the Partial SSR.
Alignment & Compliance
All Criteria
In our assessment, a Full SSR does not conflict with or hinder the various EU and GB reform initiatives, nor
financial regulations such as EMIR or REMIT. While increasing the SSR to 100% may further increase the risk
that the affected participants may breach the EMIR thresholds (addressed by C3 above), it does not
prevent compliance with the regulation itself.
In contrast to the partial option, however, a Full SSR will not in any circumstances be consistent with a
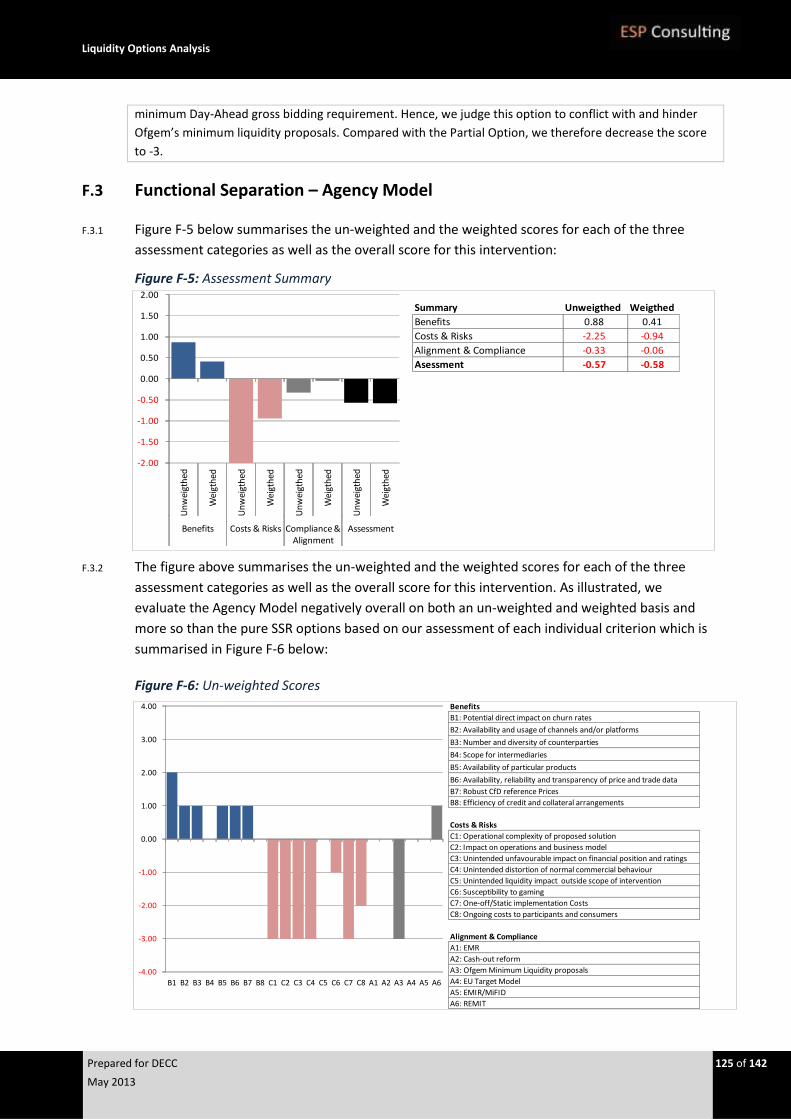
Liquidity Options Analysis
Prepared for DECC 125 of 142
May 2013
minimum Day-Ahead gross bidding requirement. Hence, we judge this option to conflict with and hinder
Ofgem’s minimum liquidity proposals. Compared with the Partial Option, we therefore decrease the score
to -3.
F.3 Functional Separation – Agency Model
F.3.1 Figure F-5 below summarises the un-weighted and the weighted scores for each of the three
assessment categories as well as the overall score for this intervention:
Figure F-5: Assessment Summary
F.3.2 The figure above summarises the un-weighted and the weighted scores for each of the three
assessment categories as well as the overall score for this intervention. As illustrated, we
evaluate the Agency Model negatively overall on both an un-weighted and weighted basis and
more so than the pure SSR options based on our assessment of each individual criterion which is
summarised in Figure F-6 below:
Figure F-6: Un-weighted Scores
Summary Unweigthed Weigthed
Benefits 0.88 0.41
Costs & Risks -2.25 -0.94
Alignment & Compliance -0.33 -0.06
Asessment -0.57 -0.58
-2.00
-1.50
-1.00
-0.50
0.00
0.50
1.00
1.50
2.00
Un
wei
gth
ed
Wei
gth
ed
Un
wei
gth
ed
Wei
gth
ed
Un
wei
gth
ed
Wei
gth
ed
Un
wei
gth
ed
Wei
gth
ed
Benefits Costs & Risks Compliance & Alignment
Assessment
Benefits
B1: Potential direct impact on churn rates
B2: Availability and usage of channels and/or platforms
B3: Number and diversity of counterparties
B4: Scope for intermediaries
B5: Availability of particular products
B6: Availability, reliability and transparency of price and trade data
B7: Robust CfD reference Prices
B8: Efficiency of credit and collateral arrangements
Costs & Risks
C1: Operational complexity of proposed solution
C2: Impact on operations and business model
C3: Unintended unfavourable impact on financial position and ratings
C4: Unintended distortion of normal commercial behaviour
C5: Unintended liquidity impact outside scope of intervention
C6: Susceptibility to gaming
C7: One-off/Static implementation Costs
C8: Ongoing costs to participants and consumers
Alignment & Compliance
A1: EMR
A2: Cash-out reform
A3: Ofgem Minimum Liquidity proposals
A4: EU Target Model
A5: EMIR/MiFID
A6: REMIT
-4.00
-3.00
-2.00
-1.00
0.00
1.00
2.00
3.00
4.00
B1 B2 B3 B4 B5 B6 B7 B8 C1 C2 C3 C4 C5 C6 C7 C8 A1 A2 A3 A4 A5 A6
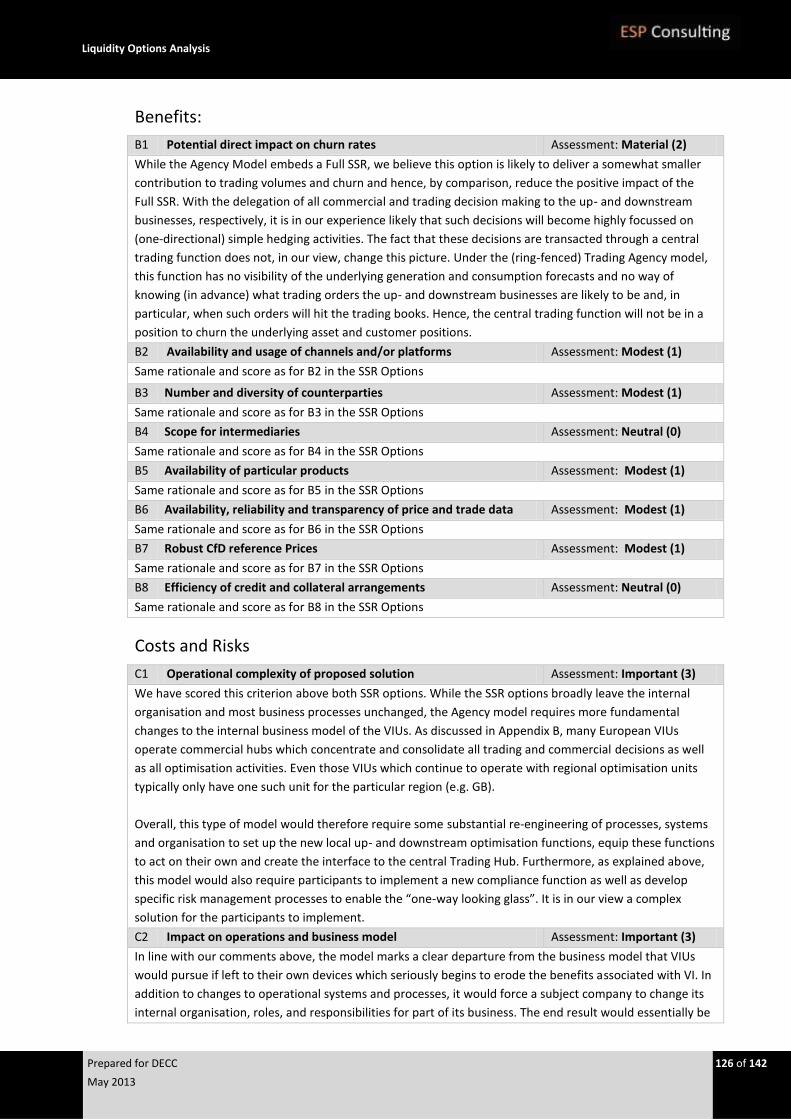
Liquidity Options Analysis
Prepared for DECC 126 of 142
May 2013
Benefits:
B1 Potential direct impact on churn rates Assessment: Material (2)
While the Agency Model embeds a Full SSR, we believe this option is likely to deliver a somewhat smaller
contribution to trading volumes and churn and hence, by comparison, reduce the positive impact of the
Full SSR. With the delegation of all commercial and trading decision making to the up- and downstream
businesses, respectively, it is in our experience likely that such decisions will become highly focussed on
(one-directional) simple hedging activities. The fact that these decisions are transacted through a central
trading function does not, in our view, change this picture. Under the (ring-fenced) Trading Agency model,
this function has no visibility of the underlying generation and consumption forecasts and no way of
knowing (in advance) what trading orders the up- and downstream businesses are likely to be and, in
particular, when such orders will hit the trading books. Hence, the central trading function will not be in a
position to churn the underlying asset and customer positions.
B2 Availability and usage of channels and/or platforms Assessment: Modest (1)
Same rationale and score as for B2 in the SSR Options
B3 Number and diversity of counterparties Assessment: Modest (1)
Same rationale and score as for B3 in the SSR Options
B4 Scope for intermediaries Assessment: Neutral (0)
Same rationale and score as for B4 in the SSR Options
B5 Availability of particular products Assessment: Modest (1)
Same rationale and score as for B5 in the SSR Options
B6 Availability, reliability and transparency of price and trade data Assessment: Modest (1)
Same rationale and score as for B6 in the SSR Options
B7 Robust CfD reference Prices Assessment: Modest (1)
Same rationale and score as for B7 in the SSR Options
B8 Efficiency of credit and collateral arrangements Assessment: Neutral (0)
Same rationale and score as for B8 in the SSR Options
Costs and Risks
C1 Operational complexity of proposed solution Assessment: Important (3)
We have scored this criterion above both SSR options. While the SSR options broadly leave the internal
organisation and most business processes unchanged, the Agency model requires more fundamental
changes to the internal business model of the VIUs. As discussed in Appendix B, many European VIUs
operate commercial hubs which concentrate and consolidate all trading and commercial decisions as well
as all optimisation activities. Even those VIUs which continue to operate with regional optimisation units
typically only have one such unit for the particular region (e.g. GB).
Overall, this type of model would therefore require some substantial re-engineering of processes, systems
and organisation to set up the new local up- and downstream optimisation functions, equip these functions
to act on their own and create the interface to the central Trading Hub. Furthermore, as explained above,
this model would also require participants to implement a new compliance function as well as develop
specific risk management processes to enable the “one-way looking glass”. It is in our view a complex
solution for the participants to implement.
C2 Impact on operations and business model Assessment: Important (3)
In line with our comments above, the model marks a clear departure from the business model that VIUs
would pursue if left to their own devices which seriously begins to erode the benefits associated with VI. In
addition to changes to operational systems and processes, it would force a subject company to change its
internal organisation, roles, and responsibilities for part of its business. The end result would essentially be
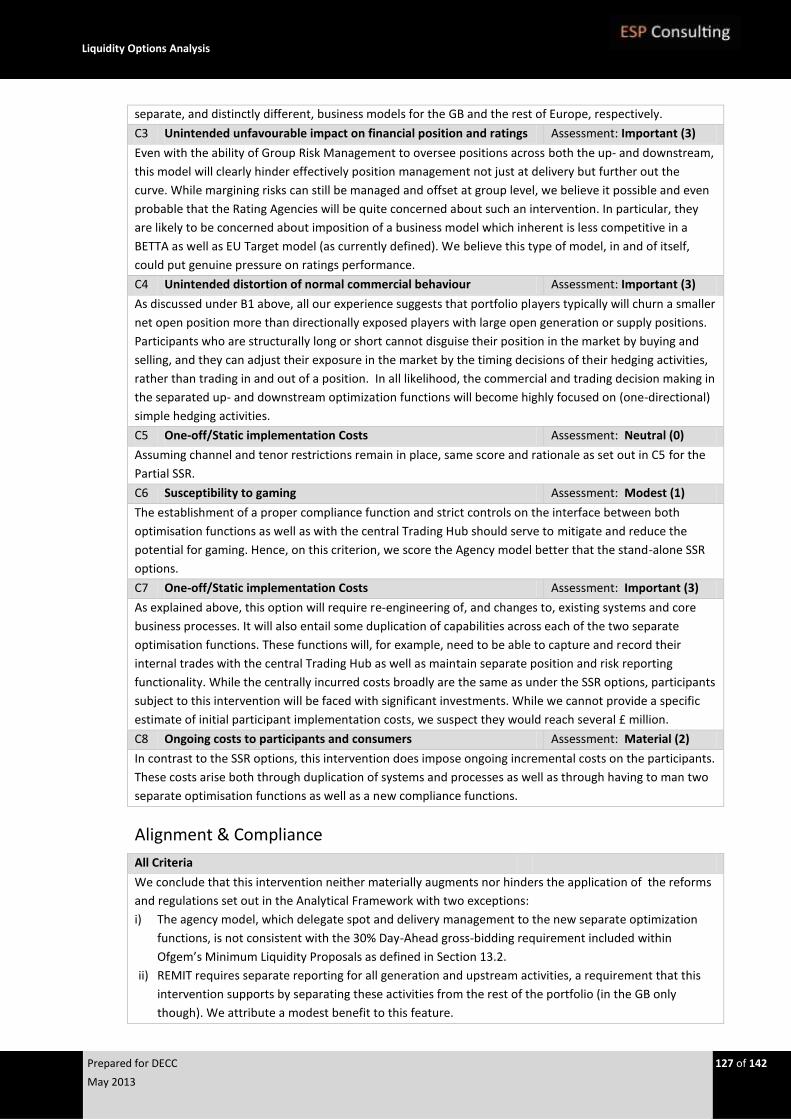
Liquidity Options Analysis
Prepared for DECC 127 of 142
May 2013
separate, and distinctly different, business models for the GB and the rest of Europe, respectively.
C3 Unintended unfavourable impact on financial position and ratings Assessment: Important (3)
Even with the ability of Group Risk Management to oversee positions across both the up- and downstream,
this model will clearly hinder effectively position management not just at delivery but further out the
curve. While margining risks can still be managed and offset at group level, we believe it possible and even
probable that the Rating Agencies will be quite concerned about such an intervention. In particular, they
are likely to be concerned about imposition of a business model which inherent is less competitive in a
BETTA as well as EU Target model (as currently defined). We believe this type of model, in and of itself,
could put genuine pressure on ratings performance.
C4 Unintended distortion of normal commercial behaviour Assessment: Important (3)
As discussed under B1 above, all our experience suggests that portfolio players typically will churn a smaller
net open position more than directionally exposed players with large open generation or supply positions.
Participants who are structurally long or short cannot disguise their position in the market by buying and
selling, and they can adjust their exposure in the market by the timing decisions of their hedging activities,
rather than trading in and out of a position. In all likelihood, the commercial and trading decision making in
the separated up- and downstream optimization functions will become highly focused on (one-directional)
simple hedging activities.
C5 One-off/Static implementation Costs Assessment: Neutral (0)
Assuming channel and tenor restrictions remain in place, same score and rationale as set out in C5 for the
Partial SSR.
C6 Susceptibility to gaming Assessment: Modest (1)
The establishment of a proper compliance function and strict controls on the interface between both
optimisation functions as well as with the central Trading Hub should serve to mitigate and reduce the
potential for gaming. Hence, on this criterion, we score the Agency model better that the stand-alone SSR
options.
C7 One-off/Static implementation Costs Assessment: Important (3)
As explained above, this option will require re-engineering of, and changes to, existing systems and core
business processes. It will also entail some duplication of capabilities across each of the two separate
optimisation functions. These functions will, for example, need to be able to capture and record their
internal trades with the central Trading Hub as well as maintain separate position and risk reporting
functionality. While the centrally incurred costs broadly are the same as under the SSR options, participants
subject to this intervention will be faced with significant investments. While we cannot provide a specific
estimate of initial participant implementation costs, we suspect they would reach several £ million.
C8 Ongoing costs to participants and consumers Assessment: Material (2)
In contrast to the SSR options, this intervention does impose ongoing incremental costs on the participants.
These costs arise both through duplication of systems and processes as well as through having to man two
separate optimisation functions as well as a new compliance functions.
Alignment & Compliance
All Criteria
We conclude that this intervention neither materially augments nor hinders the application of the reforms
and regulations set out in the Analytical Framework with two exceptions:
i) The agency model, which delegate spot and delivery management to the new separate optimization
functions, is not consistent with the 30% Day-Ahead gross-bidding requirement included within
Ofgem’s Minimum Liquidity Proposals as defined in Section 13.2.
ii) REMIT requires separate reporting for all generation and upstream activities, a requirement that this
intervention supports by separating these activities from the rest of the portfolio (in the GB only
though). We attribute a modest benefit to this feature.
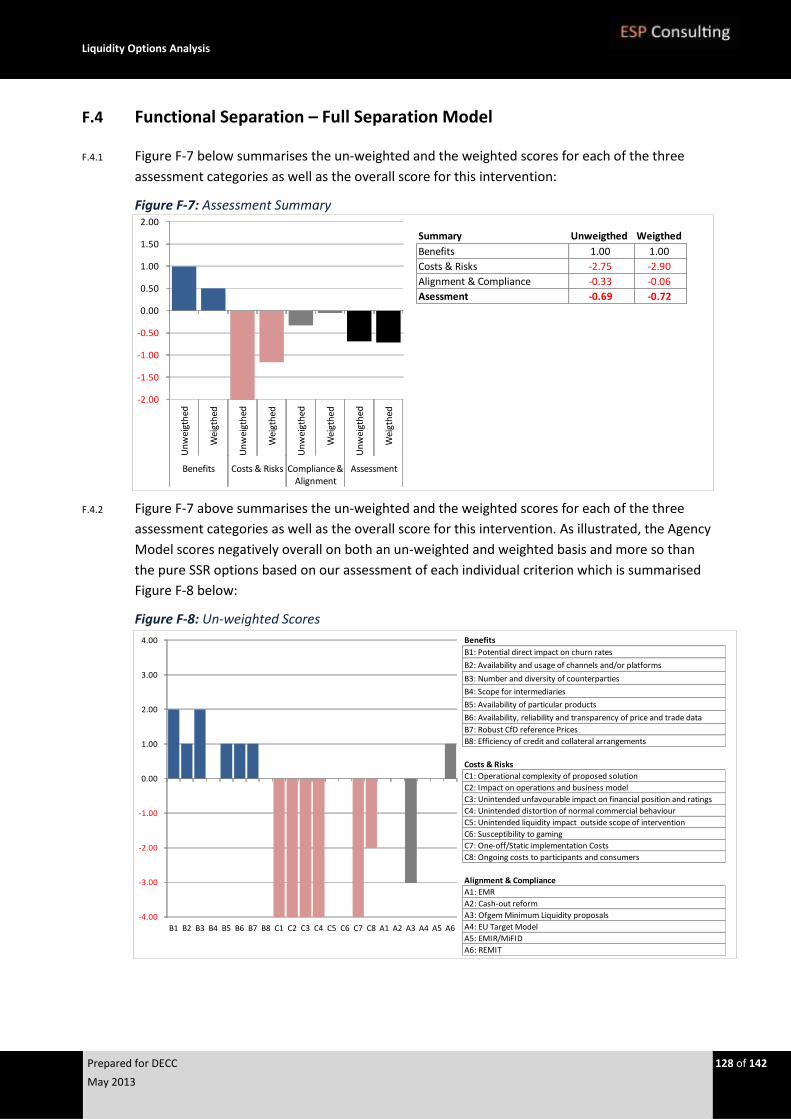
Liquidity Options Analysis
Prepared for DECC 128 of 142
May 2013
F.4 Functional Separation – Full Separation Model
F.4.1 Figure F-7 below summarises the un-weighted and the weighted scores for each of the three
assessment categories as well as the overall score for this intervention:
Figure F-7: Assessment Summary
F.4.2 Figure F-7 above summarises the un-weighted and the weighted scores for each of the three
assessment categories as well as the overall score for this intervention. As illustrated, the Agency
Model scores negatively overall on both an un-weighted and weighted basis and more so than
the pure SSR options based on our assessment of each individual criterion which is summarised
Figure F-8 below:
Figure F-8: Un-weighted Scores
Summary Unweigthed Weigthed
Benefits 1.00 1.00
Costs & Risks -2.75 -2.90
Alignment & Compliance -0.33 -0.06
Asessment -0.69 -0.72
-2.00
-1.50
-1.00
-0.50
0.00
0.50
1.00
1.50
2.00
Un
wei
gth
ed
Wei
gth
ed
Un
wei
gth
ed
Wei
gth
ed
Un
wei
gth
ed
Wei
gth
ed
Un
wei
gth
ed
Wei
gth
ed
Benefits Costs & Risks Compliance & Alignment
Assessment
Benefits
B1: Potential direct impact on churn rates
B2: Availability and usage of channels and/or platforms
B3: Number and diversity of counterparties
B4: Scope for intermediaries
B5: Availability of particular products
B6: Availability, reliability and transparency of price and trade data
B7: Robust CfD reference Prices
B8: Efficiency of credit and collateral arrangements
Costs & Risks
C1: Operational complexity of proposed solution
C2: Impact on operations and business model
C3: Unintended unfavourable impact on financial position and ratings
C4: Unintended distortion of normal commercial behaviour
C5: Unintended liquidity impact outside scope of intervention
C6: Susceptibility to gaming
C7: One-off/Static implementation Costs
C8: Ongoing costs to participants and consumers
Alignment & Compliance
A1: EMR
A2: Cash-out reform
A3: Ofgem Minimum Liquidity proposals
A4: EU Target Model
A5: EMIR/MiFID
A6: REMIT
-4.00
-3.00
-2.00
-1.00
0.00
1.00
2.00
3.00
4.00
B1 B2 B3 B4 B5 B6 B7 B8 C1 C2 C3 C4 C5 C6 C7 C8 A1 A2 A3 A4 A5 A6
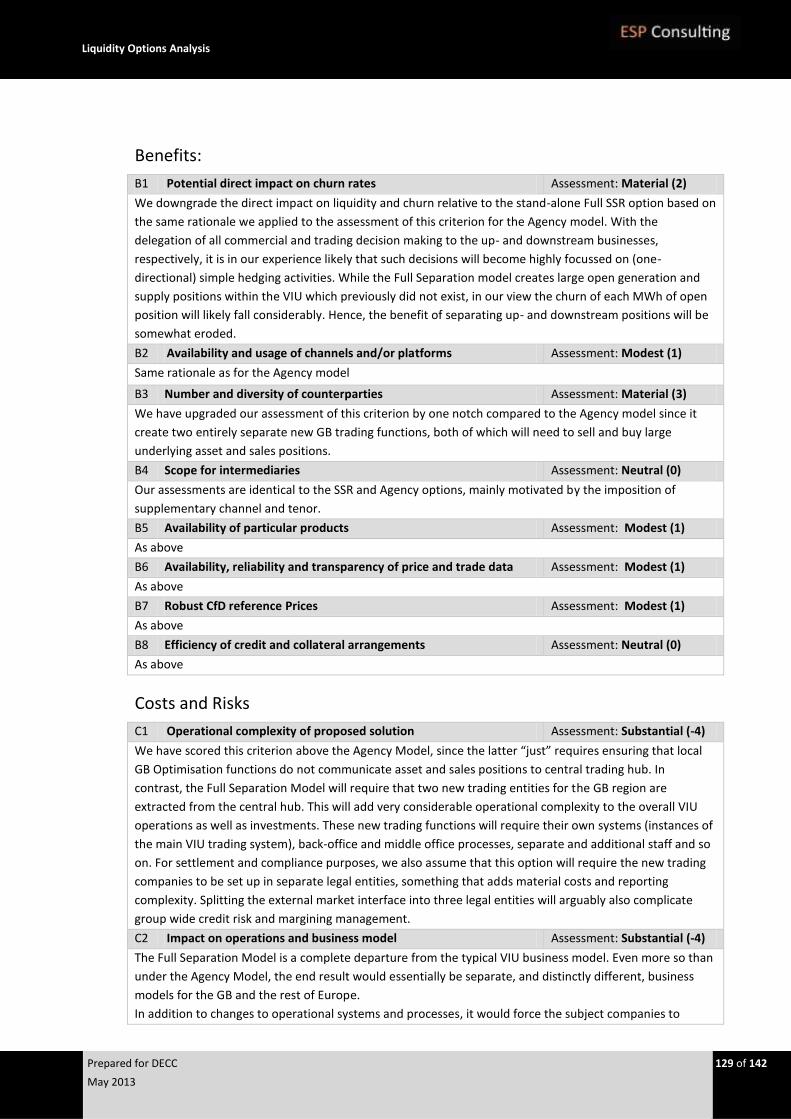
Liquidity Options Analysis
Prepared for DECC 129 of 142
May 2013
Benefits:
B1 Potential direct impact on churn rates Assessment: Material (2)
We downgrade the direct impact on liquidity and churn relative to the stand-alone Full SSR option based on
the same rationale we applied to the assessment of this criterion for the Agency model. With the
delegation of all commercial and trading decision making to the up- and downstream businesses,
respectively, it is in our experience likely that such decisions will become highly focussed on (one-
directional) simple hedging activities. While the Full Separation model creates large open generation and
supply positions within the VIU which previously did not exist, in our view the churn of each MWh of open
position will likely fall considerably. Hence, the benefit of separating up- and downstream positions will be
somewhat eroded.
B2 Availability and usage of channels and/or platforms Assessment: Modest (1)
Same rationale as for the Agency model
B3 Number and diversity of counterparties Assessment: Material (3)
We have upgraded our assessment of this criterion by one notch compared to the Agency model since it
create two entirely separate new GB trading functions, both of which will need to sell and buy large
underlying asset and sales positions.
B4 Scope for intermediaries Assessment: Neutral (0)
Our assessments are identical to the SSR and Agency options, mainly motivated by the imposition of
supplementary channel and tenor.
B5 Availability of particular products Assessment: Modest (1)
As above
B6 Availability, reliability and transparency of price and trade data Assessment: Modest (1)
As above
B7 Robust CfD reference Prices Assessment: Modest (1)
As above
B8 Efficiency of credit and collateral arrangements Assessment: Neutral (0)
As above
Costs and Risks
C1 Operational complexity of proposed solution Assessment: Substantial (-4)
We have scored this criterion above the Agency Model, since the latter “just” requires ensuring that local
GB Optimisation functions do not communicate asset and sales positions to central trading hub. In
contrast, the Full Separation Model will require that two new trading entities for the GB region are
extracted from the central hub. This will add very considerable operational complexity to the overall VIU
operations as well as investments. These new trading functions will require their own systems (instances of
the main VIU trading system), back-office and middle office processes, separate and additional staff and so
on. For settlement and compliance purposes, we also assume that this option will require the new trading
companies to be set up in separate legal entities, something that adds material costs and reporting
complexity. Splitting the external market interface into three legal entities will arguably also complicate
group wide credit risk and margining management.
C2 Impact on operations and business model Assessment: Substantial (-4)
The Full Separation Model is a complete departure from the typical VIU business model. Even more so than
under the Agency Model, the end result would essentially be separate, and distinctly different, business
models for the GB and the rest of Europe.
In addition to changes to operational systems and processes, it would force the subject companies to

Liquidity Options Analysis
Prepared for DECC 130 of 142
May 2013
radically change their internal organisation, roles and responsibilities not just within the new GB business
areas, but equally with respect to the interface to the central functions and group functions such as risk
management.
Finally, this model will place some real and concerning constraints on the ability to manage collateral and
margining (as well as EMIR thresholds). While in- and outgoing cash collateral will continue to be
consolidated at group level, the ability to actively manage such calls, for example through selective choice
of counter-parties to exploit netting benefits, will be restricted. Since the two GB trading functions must act
independently of one another, they cannot be allowed to see the total GB or group credit position. Hence,
utilising group wide cross-netting agreements effectively will become an issue.
C3 Unintended unfavourable impact on financial position and ratings Assessment: Substantial (-4)
This model would significantly erode VI benefits by (re-) introducing a business model which is far more
geared towards gross pools (e.g. SEM) . In our view, rating agencies will worry about the impact on
competitiveness in the BETTA as well as EU Target model (as currently defined). Rating agency credit
assessments will normally include and give material weight to company structure and competitive fit. In
addition, agencies are likely to be concerned about the trading and operational inefficiencies introduced by
this model as well as the risk of further regulatory interventions in other parts of their business. For VIUs
with a substantial business in the GB, this type of model could in our assessment put companies at risk of a
(1 notch) downgrade.
C4 Unintended distortion of normal commercial behaviour Assessment: Substantial (-4)
As discussed above, this model will fundamentally change the way in which the subject companies operate
within the GB and introduce a partial business model at odds with both the GB BETTA market as well as
other parts of the VIU business. As the subject companies try to manage the consequences of such a
change, the scope for unforeseen and unintended changes in commercial behaviour is in our view very
significant. In particular, we believe it is highly likely that the new GB trading functions will churn their
(one-directional) asset and sales positions far less than the previous integrated operation.
C5 One-off/Static implementation Costs Assessment: Neutral (0)
Assuming channel and tenor restrictions remain in place, same score and rationale as set out in the
preceding interventions.
C6 Susceptibility to gaming Assessment: Neutral (0)
While we consider the potential for unintended consequence very significant, such consequences are most
likely to result from allowable changes in commercial and trading behaviour, as opposed to gaming. Indeed,
the complete separation of all trading activities and market access under this model will further serve to
reduce the scope for gaming (subject to a compliance requirement outlined in Section 10.1.16). We
therefore score this option as “Neutral”.
C7 One-off/Static implementation Costs Assessment: Substantial (-4)
As explained in B1 above, this option will require substantial re-engineering and duplication of existing
systems and core business processes. In addition to the requirements listed under the Agency model, the
Full Separation model requires separate trading floors with all what this entails in terms of systems and
accompanying business processes. Our experience from companies which have operate under similar ring-
fencing obligations (refer for example the ESB Case Study in Appendix D) suggests that this is not a cheap
exercise. While we cannot provide a specific estimate of initial participant implementation costs, we
suspect they would be in the order of 10s of £ millions.
C8 Ongoing costs to participants and consumers Assessment: Material (-2)
The process and staff duplication implied by the model does in our view entail material ongoing costs on
the participants.
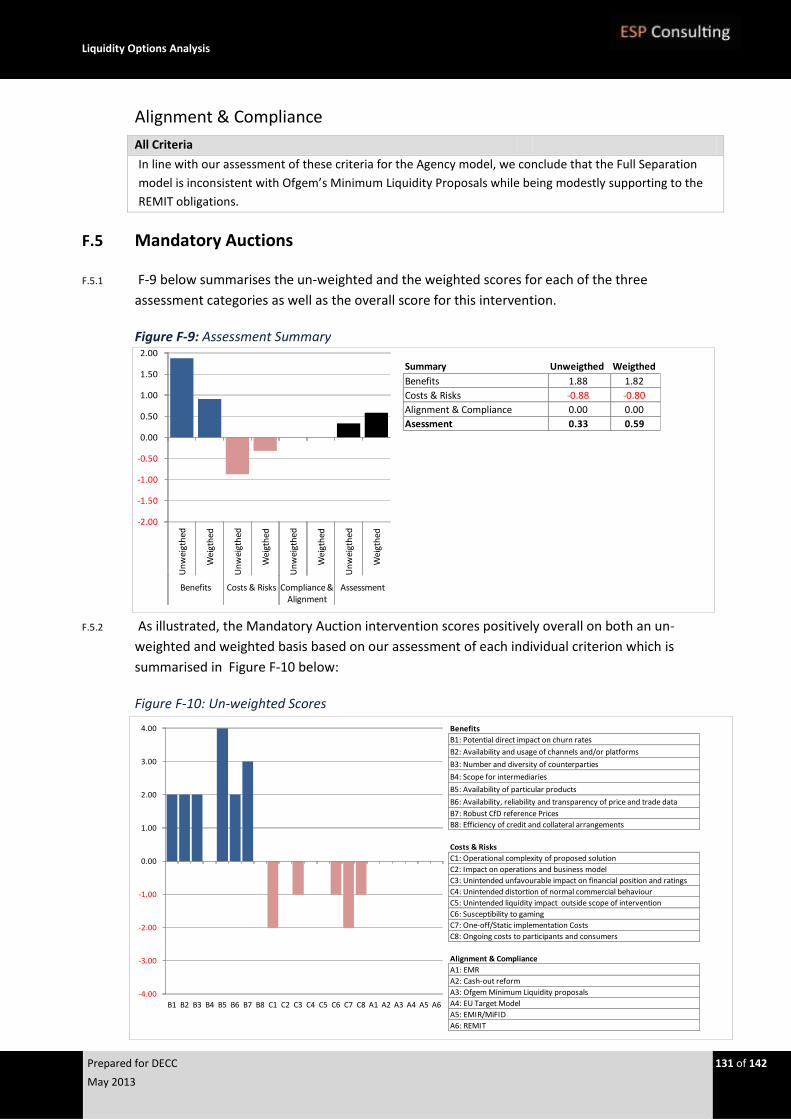
Liquidity Options Analysis
Prepared for DECC 131 of 142
May 2013
Alignment & Compliance
All Criteria
In line with our assessment of these criteria for the Agency model, we conclude that the Full Separation
model is inconsistent with Ofgem’s Minimum Liquidity Proposals while being modestly supporting to the
REMIT obligations.
F.5 Mandatory Auctions
F.5.1 F-9 below summarises the un-weighted and the weighted scores for each of the three
assessment categories as well as the overall score for this intervention.
Figure F-9: Assessment Summary
F.5.2 As illustrated, the Mandatory Auction intervention scores positively overall on both an un-
weighted and weighted basis based on our assessment of each individual criterion which is
summarised in Figure F-10 below:
Figure F-10: Un-weighted Scores
Summary Unweigthed Weigthed
Benefits 1.88 1.82
Costs & Risks -0.88 -0.80
Alignment & Compliance 0.00 0.00
Asessment 0.33 0.59
-2.00
-1.50
-1.00
-0.50
0.00
0.50
1.00
1.50
2.00
Un
wei
gth
ed
Wei
gth
ed
Un
wei
gth
ed
Wei
gth
ed
Un
wei
gth
ed
Wei
gth
ed
Un
wei
gth
ed
Wei
gth
ed
Benefits Costs & Risks Compliance & Alignment
Assessment
Benefits
B1: Potential direct impact on churn rates
B2: Availability and usage of channels and/or platforms
B3: Number and diversity of counterparties
B4: Scope for intermediaries
B5: Availability of particular products
B6: Availability, reliability and transparency of price and trade data
B7: Robust CfD reference Prices
B8: Efficiency of credit and collateral arrangements
Costs & Risks
C1: Operational complexity of proposed solution
C2: Impact on operations and business model
C3: Unintended unfavourable impact on financial position and ratings
C4: Unintended distortion of normal commercial behaviour
C5: Unintended liquidity impact outside scope of intervention
C6: Susceptibility to gaming
C7: One-off/Static implementation Costs
C8: Ongoing costs to participants and consumers
Alignment & Compliance
A1: EMR
A2: Cash-out reform
A3: Ofgem Minimum Liquidity proposals
A4: EU Target Model
A5: EMIR/MiFID
A6: REMIT
-4.00
-3.00
-2.00
-1.00
0.00
1.00
2.00
3.00
4.00
B1 B2 B3 B4 B5 B6 B7 B8 C1 C2 C3 C4 C5 C6 C7 C8 A1 A2 A3 A4 A5 A6
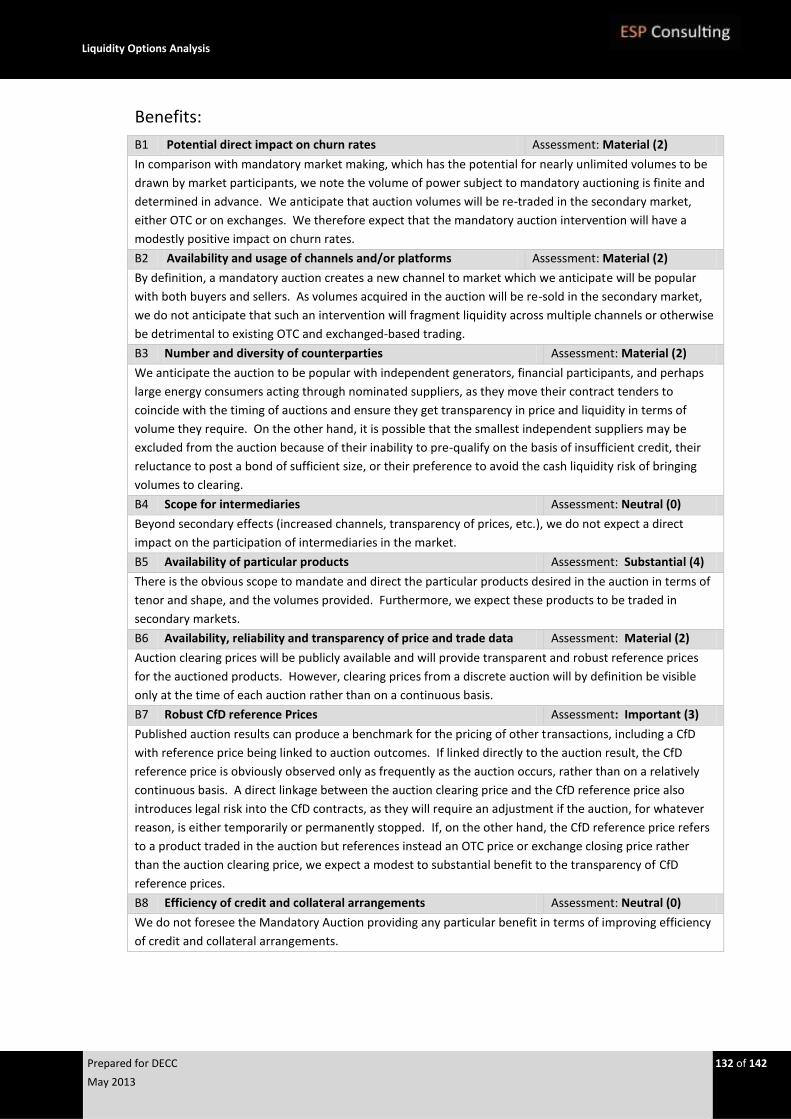
Liquidity Options Analysis
Prepared for DECC 132 of 142
May 2013
Benefits:
B1 Potential direct impact on churn rates Assessment: Material (2)
In comparison with mandatory market making, which has the potential for nearly unlimited volumes to be
drawn by market participants, we note the volume of power subject to mandatory auctioning is finite and
determined in advance. We anticipate that auction volumes will be re-traded in the secondary market,
either OTC or on exchanges. We therefore expect that the mandatory auction intervention will have a
modestly positive impact on churn rates.
B2 Availability and usage of channels and/or platforms Assessment: Material (2)
By definition, a mandatory auction creates a new channel to market which we anticipate will be popular
with both buyers and sellers. As volumes acquired in the auction will be re-sold in the secondary market,
we do not anticipate that such an intervention will fragment liquidity across multiple channels or otherwise
be detrimental to existing OTC and exchanged-based trading.
B3 Number and diversity of counterparties Assessment: Material (2)
We anticipate the auction to be popular with independent generators, financial participants, and perhaps
large energy consumers acting through nominated suppliers, as they move their contract tenders to
coincide with the timing of auctions and ensure they get transparency in price and liquidity in terms of
volume they require. On the other hand, it is possible that the smallest independent suppliers may be
excluded from the auction because of their inability to pre-qualify on the basis of insufficient credit, their
reluctance to post a bond of sufficient size, or their preference to avoid the cash liquidity risk of bringing
volumes to clearing.
B4 Scope for intermediaries Assessment: Neutral (0)
Beyond secondary effects (increased channels, transparency of prices, etc.), we do not expect a direct
impact on the participation of intermediaries in the market.
B5 Availability of particular products Assessment: Substantial (4)
There is the obvious scope to mandate and direct the particular products desired in the auction in terms of
tenor and shape, and the volumes provided. Furthermore, we expect these products to be traded in
secondary markets.
B6 Availability, reliability and transparency of price and trade data Assessment: Material (2)
Auction clearing prices will be publicly available and will provide transparent and robust reference prices
for the auctioned products. However, clearing prices from a discrete auction will by definition be visible
only at the time of each auction rather than on a continuous basis.
B7 Robust CfD reference Prices Assessment: Important (3)
Published auction results can produce a benchmark for the pricing of other transactions, including a CfD
with reference price being linked to auction outcomes. If linked directly to the auction result, the CfD
reference price is obviously observed only as frequently as the auction occurs, rather than on a relatively
continuous basis. A direct linkage between the auction clearing price and the CfD reference price also
introduces legal risk into the CfD contracts, as they will require an adjustment if the auction, for whatever
reason, is either temporarily or permanently stopped. If, on the other hand, the CfD reference price refers
to a product traded in the auction but references instead an OTC price or exchange closing price rather
than the auction clearing price, we expect a modest to substantial benefit to the transparency of CfD
reference prices.
B8 Efficiency of credit and collateral arrangements Assessment: Neutral (0)
We do not foresee the Mandatory Auction providing any particular benefit in terms of improving efficiency
of credit and collateral arrangements.
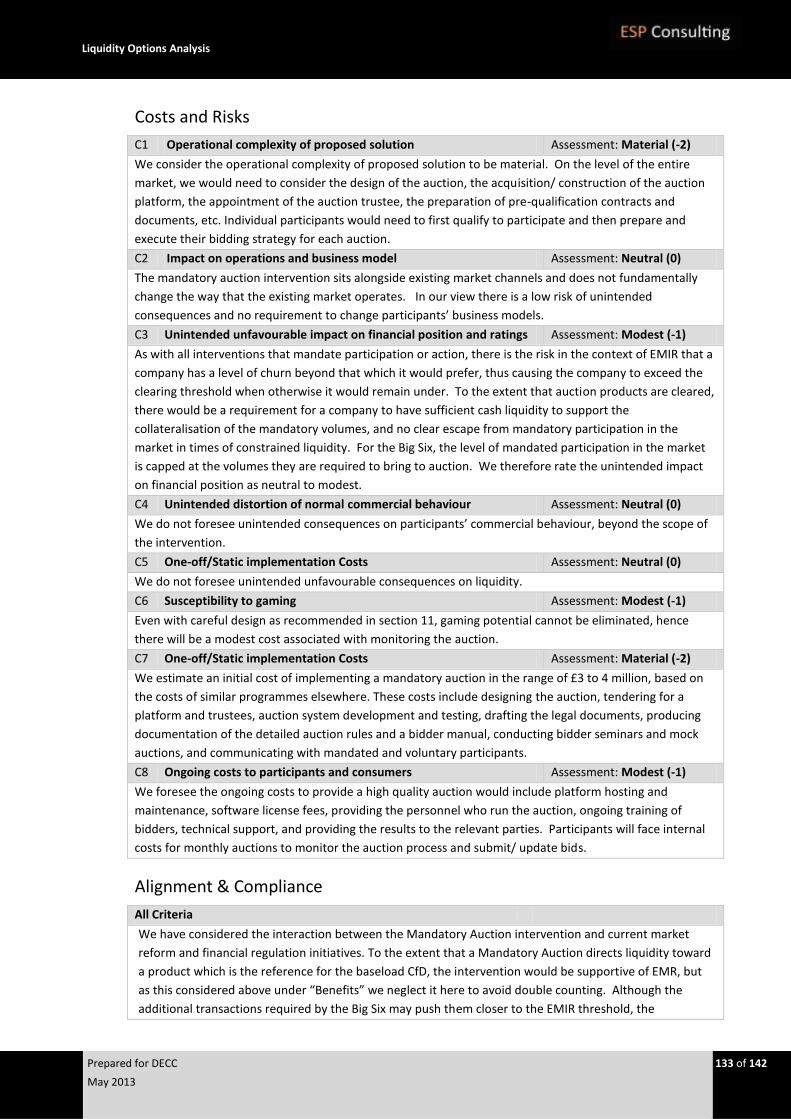
Liquidity Options Analysis
Prepared for DECC 133 of 142
May 2013
Costs and Risks
C1 Operational complexity of proposed solution Assessment: Material (-2)
We consider the operational complexity of proposed solution to be material. On the level of the entire
market, we would need to consider the design of the auction, the acquisition/ construction of the auction
platform, the appointment of the auction trustee, the preparation of pre-qualification contracts and
documents, etc. Individual participants would need to first qualify to participate and then prepare and
execute their bidding strategy for each auction.
C2 Impact on operations and business model Assessment: Neutral (0)
The mandatory auction intervention sits alongside existing market channels and does not fundamentally
change the way that the existing market operates. In our view there is a low risk of unintended
consequences and no requirement to change participants’ business models.
C3 Unintended unfavourable impact on financial position and ratings Assessment: Modest (-1)
As with all interventions that mandate participation or action, there is the risk in the context of EMIR that a
company has a level of churn beyond that which it would prefer, thus causing the company to exceed the
clearing threshold when otherwise it would remain under. To the extent that auction products are cleared,
there would be a requirement for a company to have sufficient cash liquidity to support the
collateralisation of the mandatory volumes, and no clear escape from mandatory participation in the
market in times of constrained liquidity. For the Big Six, the level of mandated participation in the market
is capped at the volumes they are required to bring to auction. We therefore rate the unintended impact
on financial position as neutral to modest.
C4 Unintended distortion of normal commercial behaviour Assessment: Neutral (0)
We do not foresee unintended consequences on participants’ commercial behaviour, beyond the scope of
the intervention.
C5 One-off/Static implementation Costs Assessment: Neutral (0)
We do not foresee unintended unfavourable consequences on liquidity.
C6 Susceptibility to gaming Assessment: Modest (-1)
Even with careful design as recommended in section 11, gaming potential cannot be eliminated, hence
there will be a modest cost associated with monitoring the auction.
C7 One-off/Static implementation Costs Assessment: Material (-2)
We estimate an initial cost of implementing a mandatory auction in the range of £3 to 4 million, based on
the costs of similar programmes elsewhere. These costs include designing the auction, tendering for a
platform and trustees, auction system development and testing, drafting the legal documents, producing
documentation of the detailed auction rules and a bidder manual, conducting bidder seminars and mock
auctions, and communicating with mandated and voluntary participants.
C8 Ongoing costs to participants and consumers Assessment: Modest (-1)
We foresee the ongoing costs to provide a high quality auction would include platform hosting and
maintenance, software license fees, providing the personnel who run the auction, ongoing training of
bidders, technical support, and providing the results to the relevant parties. Participants will face internal
costs for monthly auctions to monitor the auction process and submit/ update bids.
Alignment & Compliance
All Criteria
We have considered the interaction between the Mandatory Auction intervention and current market
reform and financial regulation initiatives. To the extent that a Mandatory Auction directs liquidity toward
a product which is the reference for the baseload CfD, the intervention would be supportive of EMR, but
as this considered above under “Benefits” we neglect it here to avoid double counting. Although the
additional transactions required by the Big Six may push them closer to the EMIR threshold, the

Liquidity Options Analysis
Prepared for DECC 134 of 142
May 2013
Mandatory Auction intervention in no way contradicts or violates the application of the EMIR regulation.
With respect to the other regulations and reforms, we do not consider Mandatory Auctions to either
augment or hinder their application.
F.6 Mandatory Market Making
F.6.1 Figure F-11 below summarises the un-weighted and the weighted scores for each of the three
assessment categories as well as the overall score for this intervention.
Figure F-11: Assessment Summary
F.6.2 As illustrated, the Mandatory Market Marking intervention scores positively overall on both an
un-weighted and weighted basis based on our assessment of each individual criterion which is
summarised in Figure F-12 below:
Figure F-12: Un-weighted Scores
Summary Unweigthed Weigthed
Benefits 2.63 2.40
Costs & Risks -1.25 -1.40
Alignment & Compliance 0.00 0.00
Asessment 0.46 0.64
-2.00
-1.50
-1.00
-0.50
0.00
0.50
1.00
1.50
2.00
Un
wei
gth
ed
Wei
gth
ed
Un
wei
gth
ed
Wei
gth
ed
Un
wei
gth
ed
Wei
gth
ed
Un
wei
gth
ed
Wei
gth
ed
Benefits Costs & Risks Compliance & Alignment
Assessment
Benefits
B1: Potential direct impact on churn rates
B2: Availability and usage of channels and/or platforms
B3: Number and diversity of counterparties
B4: Scope for intermediaries
B5: Availability of particular products
B6: Availability, reliability and transparency of price and trade data
B7: Robust CfD reference Prices
B8: Efficiency of credit and collateral arrangements
Costs & Risks
C1: Operational complexity of proposed solution
C2: Impact on operations and business model
C3: Unintended unfavourable impact on financial position and ratings
C4: Unintended distortion of normal commercial behaviour
C5: Unintended liquidity impact outside scope of intervention
C6: Susceptibility to gaming
C7: One-off/Static implementation Costs
C8: Ongoing costs to participants and consumers
Alignment & Compliance
A1: EMR
A2: Cash-out reform
A3: Ofgem Minimum Liquidity proposals
A4: EU Target Model
A5: EMIR/MiFID
A6: REMIT
-4.00
-3.00
-2.00
-1.00
0.00
1.00
2.00
3.00
4.00
B1 B2 B3 B4 B5 B6 B7 B8 C1 C2 C3 C4 C5 C6 C7 C8 A1 A2 A3 A4 A5 A6
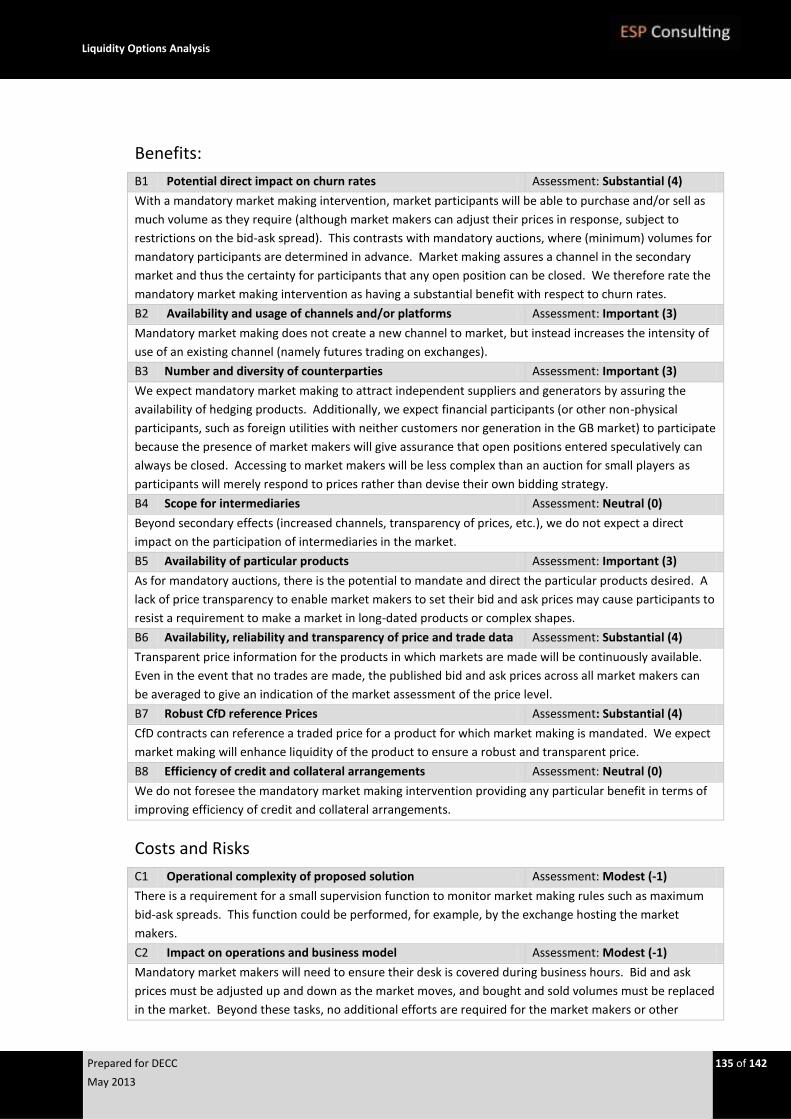
Liquidity Options Analysis
Prepared for DECC 135 of 142
May 2013
Benefits:
B1 Potential direct impact on churn rates Assessment: Substantial (4)
With a mandatory market making intervention, market participants will be able to purchase and/or sell as
much volume as they require (although market makers can adjust their prices in response, subject to
restrictions on the bid-ask spread). This contrasts with mandatory auctions, where (minimum) volumes for
mandatory participants are determined in advance. Market making assures a channel in the secondary
market and thus the certainty for participants that any open position can be closed. We therefore rate the
mandatory market making intervention as having a substantial benefit with respect to churn rates.
B2 Availability and usage of channels and/or platforms Assessment: Important (3)
Mandatory market making does not create a new channel to market, but instead increases the intensity of
use of an existing channel (namely futures trading on exchanges).
B3 Number and diversity of counterparties Assessment: Important (3)
We expect mandatory market making to attract independent suppliers and generators by assuring the
availability of hedging products. Additionally, we expect financial participants (or other non-physical
participants, such as foreign utilities with neither customers nor generation in the GB market) to participate
because the presence of market makers will give assurance that open positions entered speculatively can
always be closed. Accessing to market makers will be less complex than an auction for small players as
participants will merely respond to prices rather than devise their own bidding strategy.
B4 Scope for intermediaries Assessment: Neutral (0)
Beyond secondary effects (increased channels, transparency of prices, etc.), we do not expect a direct
impact on the participation of intermediaries in the market.
B5 Availability of particular products Assessment: Important (3)
As for mandatory auctions, there is the potential to mandate and direct the particular products desired. A
lack of price transparency to enable market makers to set their bid and ask prices may cause participants to
resist a requirement to make a market in long-dated products or complex shapes.
B6 Availability, reliability and transparency of price and trade data Assessment: Substantial (4)
Transparent price information for the products in which markets are made will be continuously available.
Even in the event that no trades are made, the published bid and ask prices across all market makers can
be averaged to give an indication of the market assessment of the price level.
B7 Robust CfD reference Prices Assessment: Substantial (4)
CfD contracts can reference a traded price for a product for which market making is mandated. We expect
market making will enhance liquidity of the product to ensure a robust and transparent price.
B8 Efficiency of credit and collateral arrangements Assessment: Neutral (0)
We do not foresee the mandatory market making intervention providing any particular benefit in terms of
improving efficiency of credit and collateral arrangements.
Costs and Risks
C1 Operational complexity of proposed solution Assessment: Modest (-1)
There is a requirement for a small supervision function to monitor market making rules such as maximum
bid-ask spreads. This function could be performed, for example, by the exchange hosting the market
makers.
C2 Impact on operations and business model Assessment: Modest (-1)
Mandatory market makers will need to ensure their desk is covered during business hours. Bid and ask
prices must be adjusted up and down as the market moves, and bought and sold volumes must be replaced
in the market. Beyond these tasks, no additional efforts are required for the market makers or other
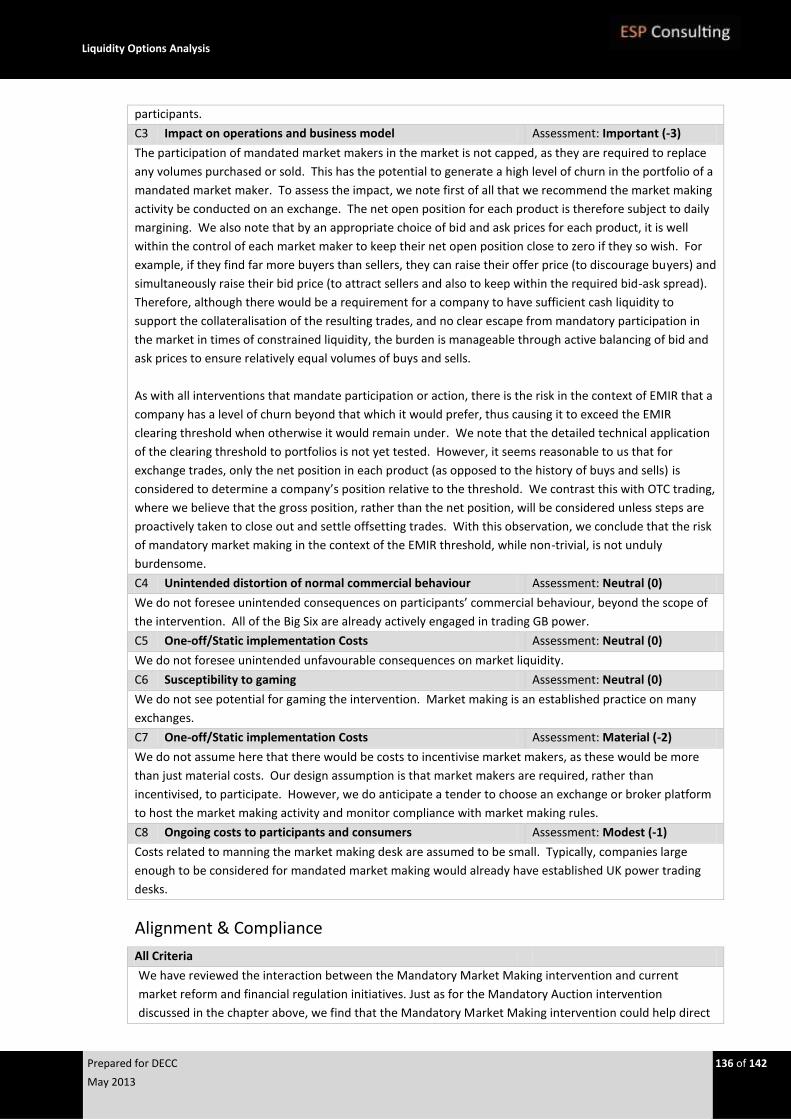
Liquidity Options Analysis
Prepared for DECC 136 of 142
May 2013
participants.
C3 Impact on operations and business model Assessment: Important (-3)
The participation of mandated market makers in the market is not capped, as they are required to replace
any volumes purchased or sold. This has the potential to generate a high level of churn in the portfolio of a
mandated market maker. To assess the impact, we note first of all that we recommend the market making
activity be conducted on an exchange. The net open position for each product is therefore subject to daily
margining. We also note that by an appropriate choice of bid and ask prices for each product, it is well
within the control of each market maker to keep their net open position close to zero if they so wish. For
example, if they find far more buyers than sellers, they can raise their offer price (to discourage buyers) and
simultaneously raise their bid price (to attract sellers and also to keep within the required bid-ask spread).
Therefore, although there would be a requirement for a company to have sufficient cash liquidity to
support the collateralisation of the resulting trades, and no clear escape from mandatory participation in
the market in times of constrained liquidity, the burden is manageable through active balancing of bid and
ask prices to ensure relatively equal volumes of buys and sells.
As with all interventions that mandate participation or action, there is the risk in the context of EMIR that a
company has a level of churn beyond that which it would prefer, thus causing it to exceed the EMIR
clearing threshold when otherwise it would remain under. We note that the detailed technical application
of the clearing threshold to portfolios is not yet tested. However, it seems reasonable to us that for
exchange trades, only the net position in each product (as opposed to the history of buys and sells) is
considered to determine a company’s position relative to the threshold. We contrast this with OTC trading,
where we believe that the gross position, rather than the net position, will be considered unless steps are
proactively taken to close out and settle offsetting trades. With this observation, we conclude that the risk
of mandatory market making in the context of the EMIR threshold, while non-trivial, is not unduly
burdensome.
C4 Unintended distortion of normal commercial behaviour Assessment: Neutral (0)
We do not foresee unintended consequences on participants’ commercial behaviour, beyond the scope of
the intervention. All of the Big Six are already actively engaged in trading GB power.
C5 One-off/Static implementation Costs Assessment: Neutral (0)
We do not foresee unintended unfavourable consequences on market liquidity.
C6 Susceptibility to gaming Assessment: Neutral (0)
We do not see potential for gaming the intervention. Market making is an established practice on many
exchanges.
C7 One-off/Static implementation Costs Assessment: Material (-2)
We do not assume here that there would be costs to incentivise market makers, as these would be more
than just material costs. Our design assumption is that market makers are required, rather than
incentivised, to participate. However, we do anticipate a tender to choose an exchange or broker platform
to host the market making activity and monitor compliance with market making rules.
C8 Ongoing costs to participants and consumers Assessment: Modest (-1)
Costs related to manning the market making desk are assumed to be small. Typically, companies large
enough to be considered for mandated market making would already have established UK power trading
desks.
Alignment & Compliance
All Criteria
We have reviewed the interaction between the Mandatory Market Making intervention and current
market reform and financial regulation initiatives. Just as for the Mandatory Auction intervention
discussed in the chapter above, we find that the Mandatory Market Making intervention could help direct
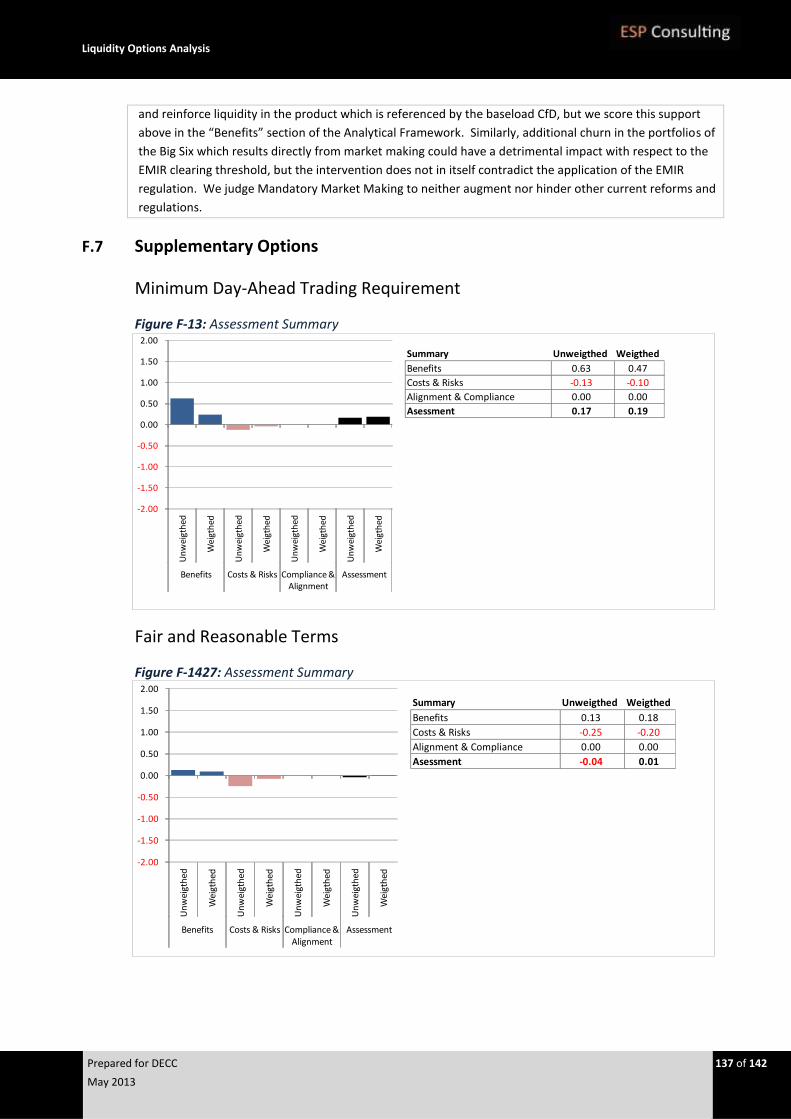
Liquidity Options Analysis
Prepared for DECC 137 of 142
May 2013
and reinforce liquidity in the product which is referenced by the baseload CfD, but we score this support
above in the “Benefits” section of the Analytical Framework. Similarly, additional churn in the portfolios of
the Big Six which results directly from market making could have a detrimental impact with respect to the
EMIR clearing threshold, but the intervention does not in itself contradict the application of the EMIR
regulation. We judge Mandatory Market Making to neither augment nor hinder other current reforms and
regulations.
F.7 Supplementary Options
Minimum Day-Ahead Trading Requirement
Figure F-13: Assessment Summary
Fair and Reasonable Terms
Figure F-1427: Assessment Summary
Summary Unweigthed Weigthed
Benefits 0.63 0.47
Costs & Risks -0.13 -0.10
Alignment & Compliance 0.00 0.00
Asessment 0.17 0.19
-2.00
-1.50
-1.00
-0.50
0.00
0.50
1.00
1.50
2.00
Un
wei
gth
ed
Wei
gth
ed
Un
wei
gth
ed
Wei
gth
ed
Un
wei
gth
ed
Wei
gth
ed
Un
wei
gth
ed
Wei
gth
ed
Benefits Costs & Risks Compliance & Alignment
Assessment
Summary Unweigthed Weigthed
Benefits 0.13 0.18
Costs & Risks -0.25 -0.20
Alignment & Compliance 0.00 0.00
Asessment -0.04 0.01
-2.00
-1.50
-1.00
-0.50
0.00
0.50
1.00
1.50
2.00
Un
wei
gth
ed
Wei
gth
ed
Un
wei
gth
ed
Wei
gth
ed
Un
wei
gth
ed
Wei
gth
ed
Un
wei
gth
ed
Wei
gth
ed
Benefits Costs & Risks Compliance & Alignment
Assessment
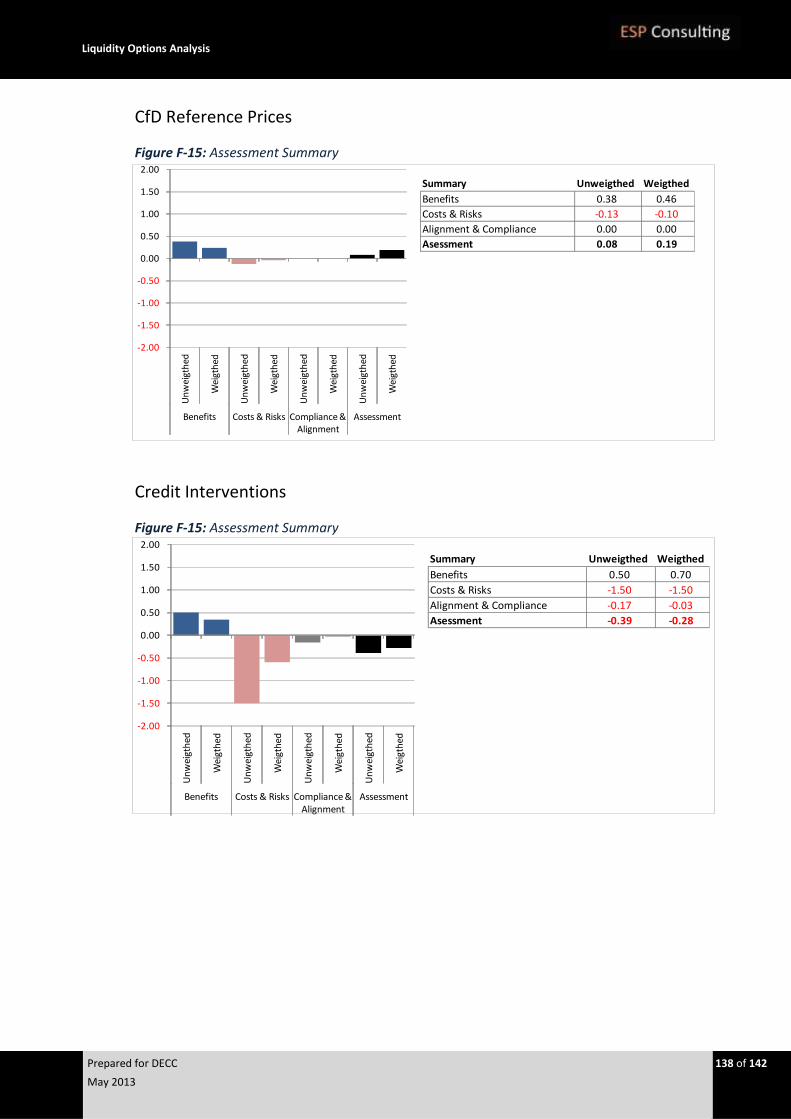
Liquidity Options Analysis
Prepared for DECC 138 of 142
May 2013
CfD Reference Prices
Figure F-15: Assessment Summary
Credit Interventions
Figure F-15: Assessment Summary
Summary Unweigthed Weigthed
Benefits 0.38 0.46
Costs & Risks -0.13 -0.10
Alignment & Compliance 0.00 0.00
Asessment 0.08 0.19
-2.00
-1.50
-1.00
-0.50
0.00
0.50
1.00
1.50
2.00
Un
wei
gth
ed
Wei
gth
ed
Un
wei
gth
ed
Wei
gth
ed
Un
wei
gth
ed
Wei
gth
ed
Un
wei
gth
ed
Wei
gth
ed
Benefits Costs & Risks Compliance & Alignment
Assessment
Summary Unweigthed Weigthed
Benefits 0.50 0.70
Costs & Risks -1.50 -1.50
Alignment & Compliance -0.17 -0.03
Asessment -0.39 -0.28
-2.00
-1.50
-1.00
-0.50
0.00
0.50
1.00
1.50
2.00
Un
wei
gth
ed
Wei
gth
ed
Un
wei
gth
ed
Wei
gth
ed
Un
wei
gth
ed
Wei
gth
ed
Un
wei
gth
ed
Wei
gth
ed
Benefits Costs & Risks Compliance & Alignment
Assessment
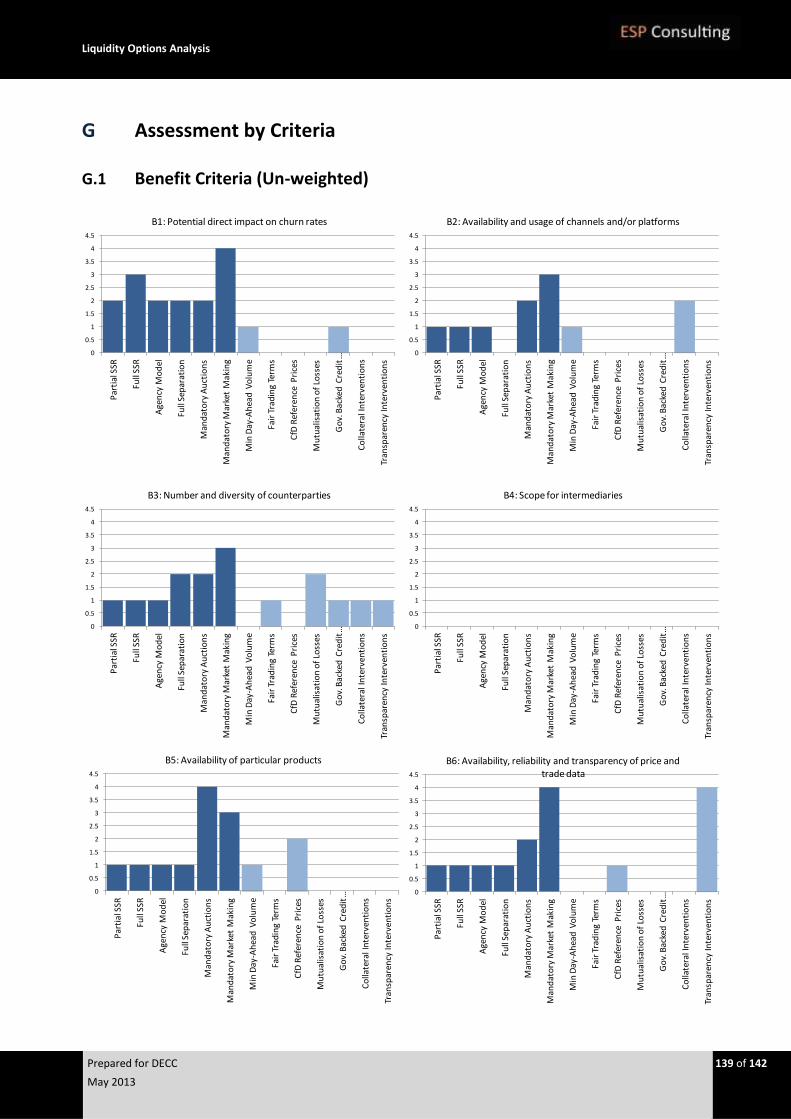
Liquidity Options Analysis
Prepared for DECC 139 of 142
May 2013
G Assessment by Criteria
G.1 Benefit Criteria (Un-weighted)
0
0.5
1
1.5
2
2.5
3
3.5
4
4.5
Par
tial
SSR
Full
SSR
Age
ncy
Mo
del
Full
Sep
arat
ion
Man
dat
ory
Au
ctio
ns
Man
dat
ory
Mar
ket
Mak
ing
Min
Day
-Ah
ead
Vo
lum
e
Fair
Tra
din
g Te
rms
CfD
Ref
eren
ce P
rice
s
Mu
tual
isat
ion
of
Loss
es
Go
v. B
acke
d C
red
it …
Co
llate
ral I
nte
rven
tio
ns
Tran
spar
ency
Inte
rven
tio
ns
B1: Potential direct impact on churn rates
0
0.5
1
1.5
2
2.5
3
3.5
4
4.5
Par
tial
SSR
Full
SSR
Age
ncy
Mo
del
Full
Sep
arat
ion
Man
dat
ory
Au
ctio
ns
Man
dat
ory
Mar
ket
Mak
ing
Min
Day
-Ah
ead
Vo
lum
e
Fair
Tra
din
g Te
rms
CfD
Ref
eren
ce P
rice
s
Mu
tual
isat
ion
of
Loss
es
Go
v. B
acke
d C
red
it …
Co
llate
ral I
nte
rven
tio
ns
Tran
spar
ency
Inte
rven
tio
ns
B2: Availability and usage of channels and/or platforms
0
0.5
1
1.5
2
2.5
3
3.5
4
4.5
Par
tial
SSR
Full
SSR
Age
ncy
Mo
del
Full
Sep
arat
ion
Man
dat
ory
Au
ctio
ns
Man
dat
ory
Mar
ket
Mak
ing
Min
Day
-Ah
ead
Vo
lum
e
Fair
Tra
din
g Te
rms
CfD
Ref
eren
ce P
rice
s
Mu
tual
isat
ion
of
Loss
es
Go
v. B
acke
d C
red
it …
Co
llate
ral I
nte
rven
tio
ns
Tran
spar
ency
Inte
rven
tio
ns
B3: Number and diversity of counterparties
0
0.5
1
1.5
2
2.5
3
3.5
4
4.5
Par
tial
SSR
Full
SSR
Age
ncy
Mo
del
Full
Sep
arat
ion
Man
dat
ory
Au
ctio
ns
Man
dat
ory
Mar
ket
Mak
ing
Min
Day
-Ah
ead
Vo
lum
e
Fair
Tra
din
g Te
rms
CfD
Ref
eren
ce P
rice
s
Mu
tual
isat
ion
of
Loss
es
Go
v. B
acke
d C
red
it …
Co
llate
ral I
nte
rven
tio
ns
Tran
spar
ency
Inte
rven
tio
ns
B5: Availability of particular products
0
0.5
1
1.5
2
2.5
3
3.5
4
4.5
Par
tial
SSR
Full
SSR
Age
ncy
Mo
del
Full
Sep
arat
ion
Man
dat
ory
Au
ctio
ns
Man
dat
ory
Mar
ket
Mak
ing
Min
Day
-Ah
ead
Vo
lum
e
Fair
Tra
din
g Te
rms
CfD
Ref
eren
ce P
rice
s
Mu
tual
isat
ion
of
Loss
es
Go
v. B
acke
d C
red
it …
Co
llate
ral I
nte
rven
tio
ns
Tran
spar
ency
Inte
rven
tio
ns
B4: Scope for intermediaries
0
0.5
1
1.5
2
2.5
3
3.5
4
4.5
Par
tial
SSR
Full
SSR
Age
ncy
Mo
del
Full
Sep
arat
ion
Man
dat
ory
Au
ctio
ns
Man
dat
ory
Mar
ket
Mak
ing
Min
Day
-Ah
ead
Vo
lum
e
Fair
Tra
din
g Te
rms
CfD
Ref
eren
ce P
rice
s
Mu
tual
isat
ion
of
Loss
es
Go
v. B
acke
d C
red
it …
Co
llate
ral I
nte
rven
tio
ns
Tran
spar
ency
Inte
rven
tio
ns
B6: Availability, reliability and transparency of price and trade data
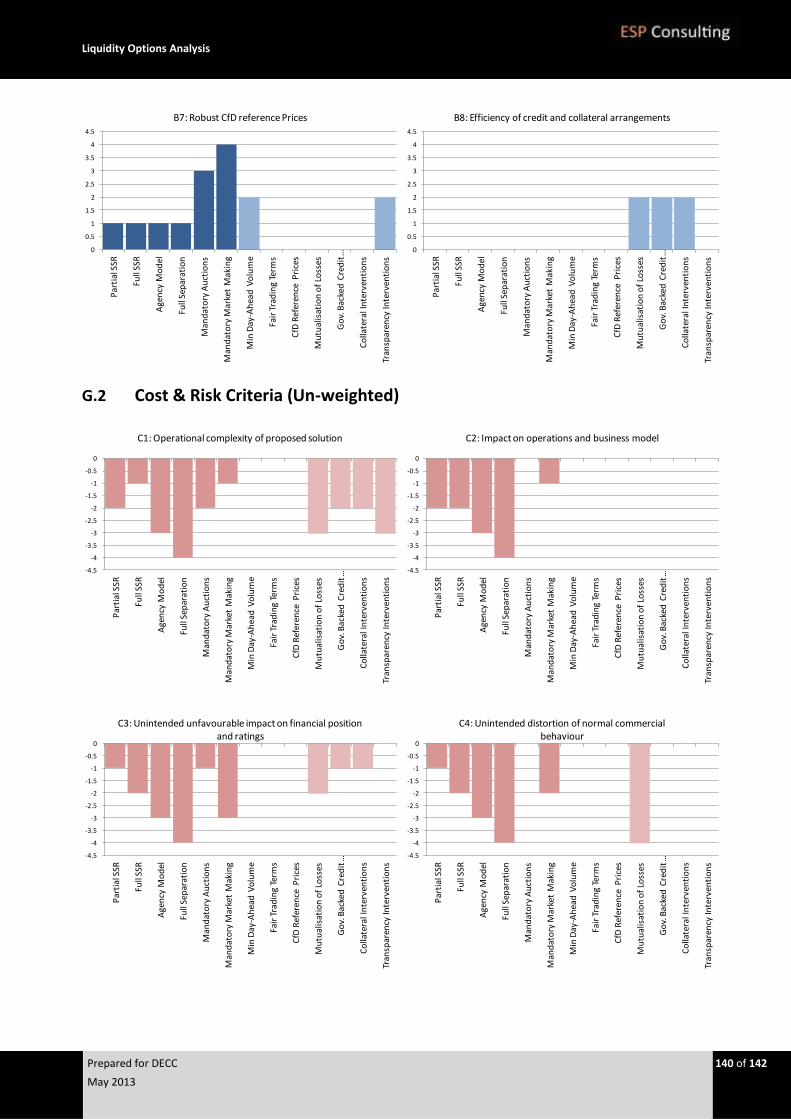
Liquidity Options Analysis
Prepared for DECC 140 of 142
May 2013
G.2 Cost & Risk Criteria (Un-weighted)
0
0.5
1
1.5
2
2.5
3
3.5
4
4.5
Par
tial
SSR
Full
SSR
Age
ncy
Mo
del
Full
Sep
arat
ion
Man
dat
ory
Au
ctio
ns
Man
dat
ory
Mar
ket
Mak
ing
Min
Day
-Ah
ead
Vo
lum
e
Fair
Tra
din
g Te
rms
CfD
Ref
eren
ce P
rice
s
Mu
tual
isat
ion
of
Loss
es
Go
v. B
acke
d C
red
it …
Co
llate
ral I
nte
rven
tio
ns
Tran
spar
ency
Inte
rven
tio
ns
B7: Robust CfD reference Prices
0
0.5
1
1.5
2
2.5
3
3.5
4
4.5
Par
tial
SSR
Full
SSR
Age
ncy
Mo
del
Full
Sep
arat
ion
Man
dat
ory
Au
ctio
ns
Man
dat
ory
Mar
ket
Mak
ing
Min
Day
-Ah
ead
Vo
lum
e
Fair
Tra
din
g Te
rms
CfD
Ref
eren
ce P
rice
s
Mu
tual
isat
ion
of
Loss
es
Go
v. B
acke
d C
red
it …
Co
llate
ral I
nte
rven
tio
ns
Tran
spar
ency
Inte
rven
tio
ns
B8: Efficiency of credit and collateral arrangements
-4.5
-4
-3.5
-3
-2.5
-2
-1.5
-1
-0.5
0
Par
tial
SSR
Full
SSR
Age
ncy
Mo
del
Full
Sep
arat
ion
Man
dat
ory
Au
ctio
ns
Man
dat
ory
Mar
ket
Mak
ing
Min
Day
-Ah
ead
Vo
lum
e
Fair
Tra
din
g Te
rms
CfD
Ref
eren
ce P
rice
s
Mu
tual
isat
ion
of
Loss
es
Go
v. B
acke
d C
red
it …
Co
llate
ral I
nte
rven
tio
ns
Tran
spar
ency
Inte
rven
tio
ns
C1: Operational complexity of proposed solution
-4.5
-4
-3.5
-3
-2.5
-2
-1.5
-1
-0.5
0
Par
tial
SSR
Full
SSR
Age
ncy
Mo
del
Full
Sep
arat
ion
Man
dat
ory
Au
ctio
ns
Man
dat
ory
Mar
ket
Mak
ing
Min
Day
-Ah
ead
Vo
lum
e
Fair
Tra
din
g Te
rms
CfD
Ref
eren
ce P
rice
s
Mu
tual
isat
ion
of
Loss
es
Go
v. B
acke
d C
red
it …
Co
llate
ral I
nte
rven
tio
ns
Tran
spar
ency
Inte
rven
tio
ns
C2: Impact on operations and business model
-4.5
-4
-3.5
-3
-2.5
-2
-1.5
-1
-0.5
0
Par
tial
SSR
Full
SSR
Age
ncy
Mo
del
Full
Sep
arat
ion
Man
dat
ory
Au
ctio
ns
Man
dat
ory
Mar
ket
Mak
ing
Min
Day
-Ah
ead
Vo
lum
e
Fair
Tra
din
g Te
rms
CfD
Ref
eren
ce P
rice
s
Mu
tual
isat
ion
of
Loss
es
Go
v. B
acke
d C
red
it …
Co
llate
ral I
nte
rven
tio
ns
Tran
spar
ency
Inte
rven
tio
ns
C3: Unintended unfavourable impact on financial position and ratings
-4.5
-4
-3.5
-3
-2.5
-2
-1.5
-1
-0.5
0
Par
tial
SSR
Full
SSR
Age
ncy
Mo
del
Full
Sep
arat
ion
Man
dat
ory
Au
ctio
ns
Man
dat
ory
Mar
ket
Mak
ing
Min
Day
-Ah
ead
Vo
lum
e
Fair
Tra
din
g Te
rms
CfD
Ref
eren
ce P
rice
s
Mu
tual
isat
ion
of
Loss
es
Go
v. B
acke
d C
red
it …
Co
llate
ral I
nte
rven
tio
ns
Tran
spar
ency
Inte
rven
tio
ns
C4: Unintended distortion of normal commercial behaviour
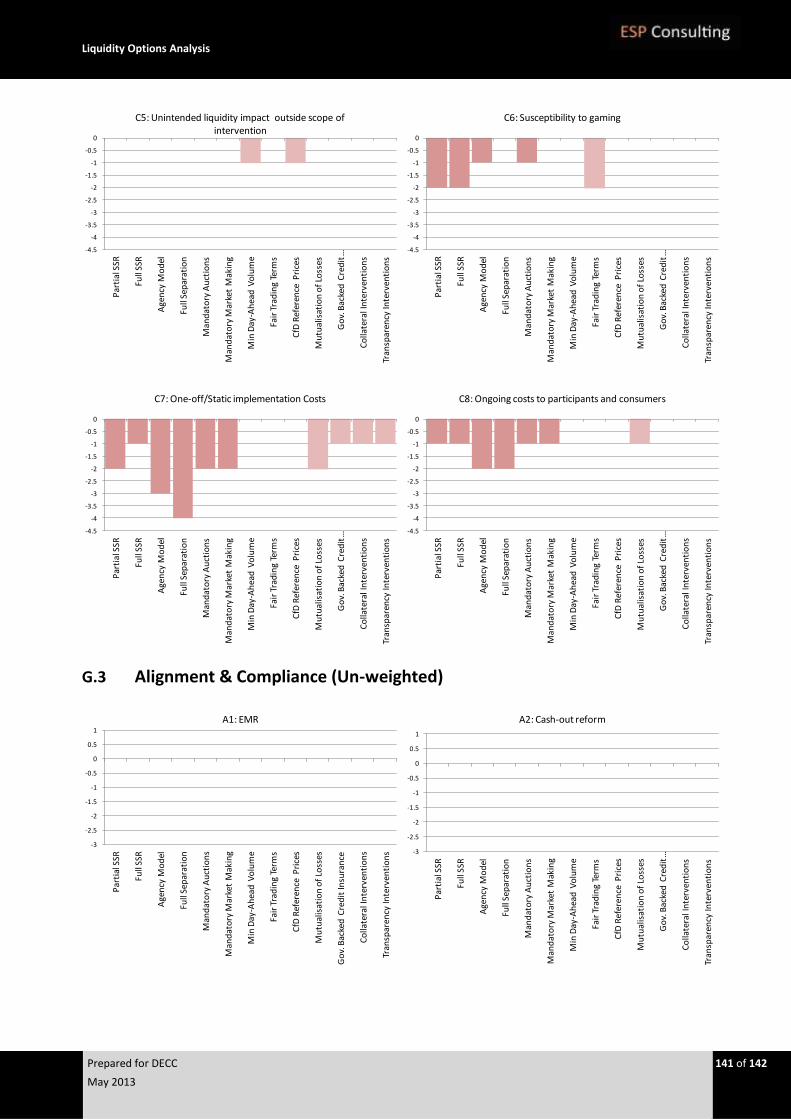
Liquidity Options Analysis
Prepared for DECC 141 of 142
May 2013
G.3 Alignment & Compliance (Un-weighted)
-4.5
-4
-3.5
-3
-2.5
-2
-1.5
-1
-0.5
0
Par
tial
SSR
Full
SSR
Age
ncy
Mo
del
Full
Sep
arat
ion
Man
dat
ory
Au
ctio
ns
Man
dat
ory
Mar
ket
Mak
ing
Min
Day
-Ah
ead
Vo
lum
e
Fair
Tra
din
g Te
rms
CfD
Ref
eren
ce P
rice
s
Mu
tual
isat
ion
of
Loss
es
Go
v. B
acke
d C
red
it …
Co
llate
ral I
nte
rven
tio
ns
Tran
spar
ency
Inte
rven
tio
ns
C5: Unintended liquidity impact outside scope of intervention
-4.5
-4
-3.5
-3
-2.5
-2
-1.5
-1
-0.5
0
Par
tial
SSR
Full
SSR
Age
ncy
Mo
del
Full
Sep
arat
ion
Man
dat
ory
Au
ctio
ns
Man
dat
ory
Mar
ket
Mak
ing
Min
Day
-Ah
ead
Vo
lum
e
Fair
Tra
din
g Te
rms
CfD
Ref
eren
ce P
rice
s
Mu
tual
isat
ion
of
Loss
es
Go
v. B
acke
d C
red
it …
Co
llate
ral I
nte
rven
tio
ns
Tran
spar
ency
Inte
rven
tio
ns
C6: Susceptibility to gaming
-4.5
-4
-3.5
-3
-2.5
-2
-1.5
-1
-0.5
0
Par
tial
SSR
Full
SSR
Age
ncy
Mo
del
Full
Sep
arat
ion
Man
dat
ory
Au
ctio
ns
Man
dat
ory
Mar
ket
Mak
ing
Min
Day
-Ah
ead
Vo
lum
e
Fair
Tra
din
g Te
rms
CfD
Ref
eren
ce P
rice
s
Mu
tual
isat
ion
of
Loss
es
Go
v. B
acke
d C
red
it …
Co
llate
ral I
nte
rven
tio
ns
Tran
spar
ency
Inte
rven
tio
ns
C7: One-off/Static implementation Costs
-4.5
-4
-3.5
-3
-2.5
-2
-1.5
-1
-0.5
0
Par
tial
SSR
Full
SSR
Age
ncy
Mo
del
Full
Sep
arat
ion
Man
dat
ory
Au
ctio
ns
Man
dat
ory
Mar
ket
Mak
ing
Min
Day
-Ah
ead
Vo
lum
e
Fair
Tra
din
g Te
rms
CfD
Ref
eren
ce P
rice
s
Mu
tual
isat
ion
of
Loss
es
Go
v. B
acke
d C
red
it …
Co
llate
ral I
nte
rven
tio
ns
Tran
spar
ency
Inte
rven
tio
ns
C8: Ongoing costs to participants and consumers
-3
-2.5
-2
-1.5
-1
-0.5
0
0.5
1
Par
tial
SSR
Full
SSR
Age
ncy
Mo
del
Full
Sep
arat
ion
Man
dat
ory
Au
ctio
ns
Man
dat
ory
Mar
ket
Mak
ing
Min
Day
-Ah
ead
Vo
lum
e
Fair
Tra
din
g Te
rms
CfD
Ref
eren
ce P
rice
s
Mu
tual
isat
ion
of
Loss
es
Go
v. B
acke
d C
red
it In
sura
nce
Co
llate
ral I
nte
rven
tio
ns
Tran
spar
ency
Inte
rven
tio
ns
A1: EMR
-3
-2.5
-2
-1.5
-1
-0.5
0
0.5
1
Par
tial
SSR
Full
SSR
Age
ncy
Mo
del
Full
Sep
arat
ion
Man
dat
ory
Au
ctio
ns
Man
dat
ory
Mar
ket
Mak
ing
Min
Day
-Ah
ead
Vo
lum
e
Fair
Tra
din
g Te
rms
CfD
Ref
eren
ce P
rice
s
Mu
tual
isat
ion
of
Loss
es
Go
v. B
acke
d C
red
it …
Co
llate
ral I
nte
rven
tio
ns
Tran
spar
ency
Inte
rven
tio
ns
A2: Cash-out reform

Liquidity Options Analysis
Prepared for DECC 142 of 142
May 2013
-3
-2.5
-2
-1.5
-1
-0.5
0
0.5
1
Par
tial
SSR
Full
SSR
Age
ncy
Mo
del
Full
Sep
arat
ion
Man
dat
ory
Au
ctio
ns
Man
dat
ory
Mar
ket
Mak
ing
Min
Day
-Ah
ead
Vo
lum
e
Fair
Tra
din
g Te
rms
CfD
Ref
eren
ce P
rice
s
Mu
tual
isat
ion
of
Loss
es
Go
v. B
acke
d C
red
it In
sura
nce
Co
llate
ral I
nte
rven
tio
ns
Tran
spar
ency
Inte
rven
tio
ns
A3: Ofgem Minimum Liquidity proposals
-3
-2.5
-2
-1.5
-1
-0.5
0
0.5
1
Par
tial
SSR
Full
SSR
Age
ncy
Mo
del
Full
Sep
arat
ion
Man
dat
ory
Au
ctio
ns
Man
dat
ory
Mar
ket
Mak
ing
Min
Day
-Ah
ead
Vo
lum
e
Fair
Tra
din
g Te
rms
CfD
Ref
eren
ce P
rice
s
Mu
tual
isat
ion
of
Loss
es
Go
v. B
acke
d C
red
it …
Co
llate
ral I
nte
rven
tio
ns
Tran
spar
ency
Inte
rven
tio
ns
A4: EU Target Model
-3
-2.5
-2
-1.5
-1
-0.5
0
0.5
1
Par
tial
SSR
Full
SSR
Age
ncy
Mo
del
Full
Sep
arat
ion
Man
dat
ory
Au
ctio
ns
Man
dat
ory
Mar
ket
Mak
ing
Min
Day
-Ah
ead
Vo
lum
e
Fair
Tra
din
g Te
rms
CfD
Ref
eren
ce P
rice
s
Mu
tual
isat
ion
of
Loss
es
Go
v. B
acke
d C
red
it In
sura
nce
Co
llate
ral I
nte
rven
tio
ns
Tran
spar
ency
Inte
rven
tio
ns
A5: EMIR/MiFID
-3
-2.5
-2
-1.5
-1
-0.5
0
0.5
1
Par
tial
SSR
Full
SSR
Age
ncy
Mo
del
Full
Sep
arat
ion
Man
dat
ory
Au
ctio
ns
Man
dat
ory
Mar
ket
Mak
ing
Min
Day
-Ah
ead
Vo
lum
e
Fair
Tra
din
g Te
rms
CfD
Ref
eren
ce P
rice
s
Mu
tual
isat
ion
of
Loss
es
Go
v. B
acke
d C
red
it …
Co
llate
ral I
nte
rven
tio
ns
Tran
spar
ency
Inte
rven
tio
ns
A6: REMIT