liquidity and asset prices in rational expectations
TRANSCRIPT

Liquidity and Asset Prices in Rational Expectations
Equilibrium with Ambiguous Information∗
Han Ozsoylev
University of Oxford
Jan Werner†
University of Minnesota
Abstract: The quality of information in financial asset markets is often hard to estimate. Rem-
iniscent of the famous Ellsberg paradox, investors may be unable to form a single probability
belief about asset returns conditional on information signals, and act on the basis of ambiguous
(or multiple) probability beliefs. This paper analyzes information transmission in asset markets
when agents’ information is ambiguous. We consider a marketwith risk-averse informed in-
vestors, risk-neutral competitive arbitrageurs, and noisy supply of the risky asset, first studied
in Vives (1995a,b) with unambiguous information. Ambiguous information gives rise to the
possibility of illiquid market where arbitrageurs choose not to trade in a rational expectations
equilibrium. When market is illiquid, small informationalor supply shocks have relatively large
effects on asset prices.
∗We benefited from comments by seminar audiences at Queen’s University, University of Minnesota, Cornell
University, HEC Paris, 2007 CARESS-Cowles Conference and 2007 SAET Conference. We are grateful to the
editors of this Special Issue for useful suggestions.†Corresponding author. Address: Department of Economics, Hanson Hall 4-139, Minneapolis, MN 55455.
Email: [email protected]. Fax: (612) 6240209.
1

1. Introduction
Information in financial markets is plentiful. There are earnings reports, announcements of
macroeconomic indices, political news, expert opinions, and many others. Investors use various
pieces of information to update their expectations about asset returns. In standard models of asset
markets, agents update their prior probabilistic beliefs about asset returns in Bayesian fashion
upon observing an information signal drawn from a preciselyknown distribution. The quality
of some information signals in the markets may be difficult tojudge. Investors may not have a
single probability belief about the information signal.
The situation of insufficient knowledge of probability distribution is, of course, reminiscent
of the famous Ellsberg (1961) paradox where agents have to choose between bets based on draws
from an urn with a specified mix of balls of different colors and an urn with an unspecified mix.
Many agents choose bets with known odds over the bets with thesame stakes but unknown odds.
A decision criterion which - unlike the standard expected utility - is compatible with this pattern
of preferences is the maxmin (or multiple-prior) expected utility. Under the maxmin expected
utility, an agent has a set of probability beliefs (priors) instead of a single one, and evaluates an
action, such as taking a bet, according to the minimum expected utility over the set of priors.
Such behavior is often referred to as ambiguity aversion, for it indicates the dislike of uncertainty
with unknown or ambiguous odds. Axiomatic foundations of maxmin expected utility are due to
Gilboa and Schmeidler (1987).
This paper analyzes information transmission in asset markets when the quality of some in-
formation signals is unknown and agents treat information of unknown quality as ambiguous.
The questions we ask are: how does ambiguity of information affect the process of information
transmission in markets, and how does ambiguous information affect asset prices and trading in
equilibrium.
Information transmission in financial markets has been extensively studied when information
is of precisely known quality. Models of competitive markets with asymmetric information that is
partially revealed by asset prices have been developed by Grossman and Stiglitz (1980), Hellwig
(1980), Diamond and Verecchia (1981), Admati (1985) and others. Our paper extends this line of
research to ambiguous information. We consider a competitive market with risk-averse informed
investors, risk-neutral uninformed arbitrageurs and random supply of a single risky asset, first
studied in Vives (1995a,b) with unambiguous information. Prior to the arrival of information, all
2

investors have ambiguous beliefs about probability distribution of the asset payoff. Ambiguous
beliefs are described by a set of probability distributions. Informed agents receive a private
information signal about the payoff. The signal reveals thepayoff only partially so that the
payoff remains uncertain, but it removes the ambiguity of informed investors’ beliefs. They know
precisely the conditional distribution of the payoff. Uninformed arbitrageurs do not observe
the signal and extract information from prices. Their beliefs about payoff distribution remain
ambiguous.1
The model has CARA-normal specification. Informed investors’ utility of wealth has CARA
form and all random variables are normally distributed. Theset of multiple prior beliefs about the
distribution of the asset payoff consists of normal distributions with means and variances from
some bounded intervals. Informed investors and arbitrageurs behave as competitive price-takers.
Arbitrageurs, who have linear utility of wealth, take arbitrary positive or negative positions in the
asset if the price equals the minimum expected payoff over their set of beliefs or, respectively,
the maximum expected payoff. If the price is between the maximum and the minimum expected
values, they do not trade. Arbitrageurs are uninformed and extract information from market
prices.
We show that there exists a rational expectations equilibrium. Equilibrium price function is
not linear, but is piecewise linear. It is partially revealing as long as the asset supply is non-
deterministic. Otherwise it is fully revealing. Rational expectations equilibrium prices in CARA-
normal models with unambiguous information are typically linear and partially revealing.
If there is ambiguity about the mean of the information signal, there exists a range of values of
the signal and random asset supply such that the arbitrageurs choose not to trade in equilibrium.
Since arbitrageurs provide liquidity to the market whenever they trade, we identify this range as
the event of market illiquidity. Non-participation in trade by uninformed arbitrageurs (i.e., market
illiquidity) is a random event that depends on information signal and asset supply. We show that
sensitivities of equilibrium prices to information signaland asset supply are lower when market
is illiquid than when it is liquid. Using reciprocals of price sensitivities as measures of market
depth, the depth is low in the event of illiquidity and high otherwise. This is a typical feature of
1This description of ambiguous information is different from the one seen in Epstein and Schneider (2008) where
investors have unambiguous beliefs prior to the arrival of information but their posterior beliefs after receiving
information signals are ambiguous.
3

market liquidity, see Kyle (1985).
We study the effects of ambiguity on market depth, liquidityrisk, and trading volume. We
compare rational expectations equilibrium under ambiguity with equilibrium under no ambiguity.
We find that market depth is lower when there is ambiguity. Trading volume also decreases
with ambiguity. Another interesting property concerns volatility of prices. While volatility of
equilibrium prices is lower than volatility of payoff when there is no ambiguity, the relation can
be reversed if there is sufficiently large ambiguity about the variance of the signal. Thus there
can beexcess volatility in the sense of LeRoy and Porter (1981) and Shiller (1981).
The plan of the paper is as follows: In the next subsection we briefly discuss the existing
literature related to this paper. The model of asset marketswith ambiguous and asymmetric
information is introduced in Section 2. In Section 3 we derive the rational expectations equilibria
under ambiguity and with no ambiguity. Market liquidity is introduced and discussed in Section
4. Section 5 contains comparative statics results on the effects of ambiguity, and Section 6 is
about the possibility of excess volatility under ambiguity. Section 7 concludes the paper.
1.1 Related Literature
Implications of ambiguous beliefs and ambiguity aversion in financial markets have been exten-
sively studied over the past two decades. When ambiguity aversion is modeled, as in this paper,
by multiple-prior expected utility of Gilboa and Schmeidler (1989) or Choquet non-additive ex-
pected utility of Schmeidler (1989), ambiguous beliefs about asset payoffs may lead to “inertia”
in portfolio choice. That is, an agent may choose not to tradean asset for some range of prices as
first pointed out by Dow and Werlang (1992). The higher the ambiguity of beliefs, the greater is
that range of prices. Portfolio choice inertia may lead to limited participation in trade when am-
biguity of beliefs is heterogenous. Cao, Wang and Zhang (2005) present a model of asset markets
where in equilibrium agents with the highest ambiguity do not participate in trade. They study
the effects of limited market participation on asset prices. Easley and O’Hara (2009) study the
role of regulation in mitigating the effects of limited participation induced by ambiguous beliefs.
Mukerji and Tallon (2001, 2004) show that ambiguous beliefsconcerning idiosyncratic risk may
lead to break down of trade of some assets and thereby impede risk sharing among investors. Ef-
ficient risk sharing under ambiguity has been studied in Dana(2004) and Strzalecki and Werner
(2010), among others.
4

Our paper belongs to the growing literature on implicationsof ambiguous information on
trade and prices in asset markets. Epstein and Schneider (2008) study properties of asset prices
in dynamic asset markets where investors receive an ambiguous information signal. Illeditsch
(2010) shows that ambiguous information may lead to excess volatility of asset prices. In those
papers the information signal is publicly observed. Investors in our model have asymmetric
information that is privately observed. We analyze the rational expectations equilibrium and
study market liquidity, trade volume and price volatility.A recent paper by Mele and Sangiorgi
(2010) extends the analysis of rational expectations equilibrium with ambiguous information by
introducing information acquisition. Their focus is primarily on the effects of ambiguity on in-
formation acquisition. Ui (2010) studies limited market participation in rational expectations
equilibrium with asymmetric information. Implications ofinvestors’ ambiguity on market liq-
uidity have been studied by Routledge and Zin (2009) (see also Easley and O’Hara (2006)) in a
market microstructure model. Caskey (2009) (see also Ju andMiao (2009)) studies information
aggregation and properties of asset prices in rational expectations equilibrium using the Klibanoff
et al (2005) model of smooth ambiguity averse preferences.
Condie and Ganguli (2010a, 2010b) study informational efficiency of rational expectations
equilibria with ambiguity averse investors when information signals have discrete distribution
and there is no noise. Their analysis is in the tradition of Radner (1979) who proved that rational
expectations equilibria are generically fully revealing when information is unambiguous.2 Condie
and Ganguli (2010b) extend this result to ambiguous information and ambiguity averse prefer-
ences described by the Choquet non-additive expected utility. In a companion paper, Condie
and Ganguli (2010a) provide a robust example of partially revealing equilibria in Radner (1979)
model with ambiguous information. This shows that equilibria with different degrees of infor-
mational efficiency may co-exist. Our model is in the tradition of Grossman and Stiglitz (1980)
with CARA-normal specification and noisy asset supply. The rational expectations equilibrium
in our model is partially revealing.
2. Asset Markets with Ambiguous Information
There are two assets: a single risky asset, and a risk-free bond. The payoff of the risky asset
2Correia da Silva and Herves-Beloso (2009) study implications of ambiguity in the Radner (1968) model of
equilibrium with private information.
5

is described by random variablev. The bond has deterministic payoff equal to one. Assets are
traded in a market with risk-averse informed agents, risk-neutral uninformed arbitrageurs, and
noise traders. The price of the risky asset is denoted byp. The bond price is normalized to1.
There is a single informed agent, called thespeculator, whose utility of end-of period wealth
w has the CARA form−eρw, whereρ > 0 is the Arrow-Pratt measure of absolute risk aversion.
Thearbitrageur has linear utility of end-of-period wealth equal tow. These two agents should
be thought of as representative agents for large numbers of two types of traders. Initial wealth is
ws for the speculator andwa for the arbitrageur.
The payoff of the risky asset is the sum of two random variables,
v = θ + ω. (1)
Random variablesθ andω are independent and have normal distributions with respective means
µ andm and variancesσ2 andτ 2.
The informed speculator observes realizationθ of random variableθ. Observation ofθ re-
solves partially, but not fully, the riskiness of payoff of the risky asset. The arbitrageur does
not observeθ. Further, she has ambiguous beliefs about the distribution of θ. The ambiguity of
beliefs aboutθ is described by a setP of probability distributions. Each probability distribution
in P is assumed normal and independent ofω. More specific, we takeP to be the set of normal
distributions with mean lying in an interval[µ, µ] and variance in an interval[σ2, σ2]. We assume
that the true distribution with meanµ and varianceσ2 lies in the setP, henceµ ∈ [µ, µ] and
σ2 ∈ [σ2, σ2]. These intervals of means and variances could be confidence intervals resulting
from statistical estimation of moments (see Cao, Wang, and Zhang (2005) and Garlappi, Uppal
and Wang (2007)), or they could reflect investor’s subjective aversion to ambiguity.
We assume that the supply of the risky asset is random. Randomasset supply serves as an
additional source of uncertainty, other than information signal, and prevents asset prices from
fully revealing agents’ information. Randomness inL can be thought as resulting from trade by
noise traders. We assume thatL is normally distributed, independent ofθ andω, with mean zero
and varianceσ2L. Assuming zero mean of asset supplyL is inessential (see a remark at the end of
Section 3.)
The speculator’s random wealth resulting from purchasingx shares of the risky security at
pricep is w = ws +(v−p)x. Upon observing realizationθ of θ her information isIs = {θ = θ}.
6
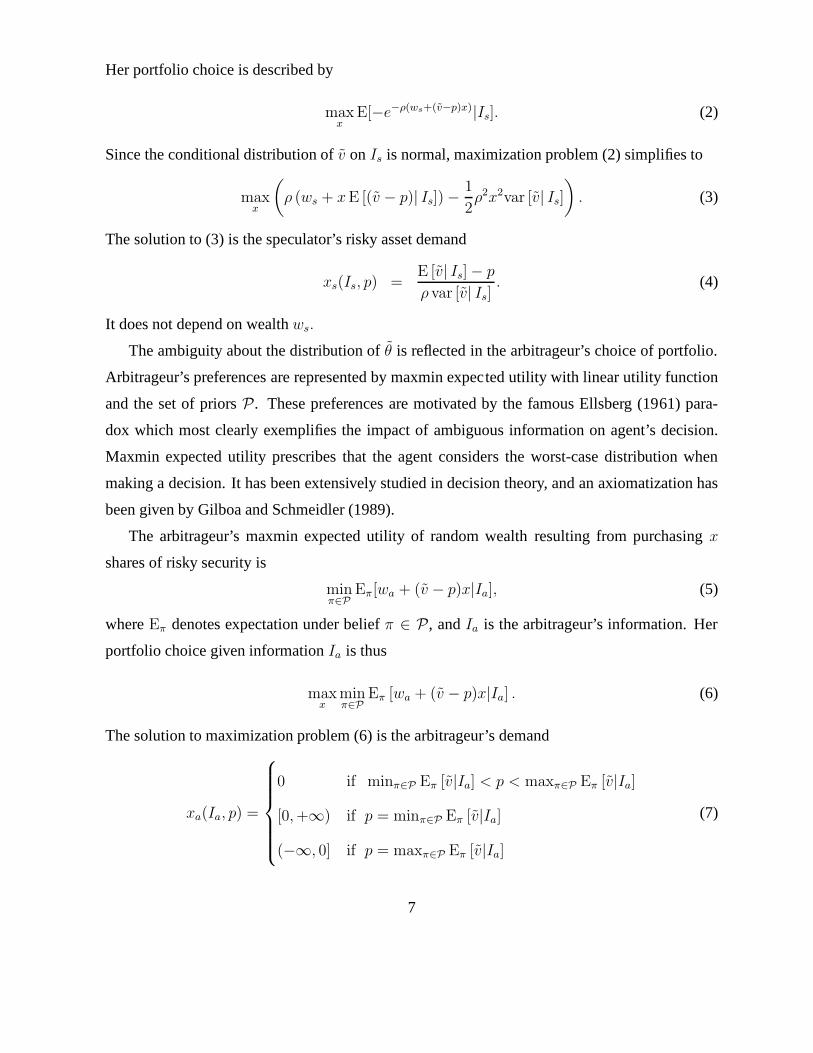
Her portfolio choice is described by
maxx
E[−e−ρ(ws+(v−p)x)|Is]. (2)
Since the conditional distribution ofv on Is is normal, maximization problem (2) simplifies to
maxx
(
ρ (ws + x E [(v − p)| Is]) −1
2ρ2x2var [v| Is]
)
. (3)
The solution to (3) is the speculator’s risky asset demand
xs(Is, p) =E [v| Is] − p
ρ var [v| Is]. (4)
It does not depend on wealthws.
The ambiguity about the distribution ofθ is reflected in the arbitrageur’s choice of portfolio.
Arbitrageur’s preferences are represented by maxmin expected utility with linear utility function
and the set of priorsP. These preferences are motivated by the famous Ellsberg (1961) para-
dox which most clearly exemplifies the impact of ambiguous information on agent’s decision.
Maxmin expected utility prescribes that the agent considers the worst-case distribution when
making a decision. It has been extensively studied in decision theory, and an axiomatization has
been given by Gilboa and Schmeidler (1989).
The arbitrageur’s maxmin expected utility of random wealthresulting from purchasingx
shares of risky security is
minπ∈P
Eπ[wa + (v − p)x|Ia], (5)
whereEπ denotes expectation under beliefπ ∈ P, andIa is the arbitrageur’s information. Her
portfolio choice given informationIa is thus
maxx
minπ∈P
Eπ [wa + (v − p)x|Ia] . (6)
The solution to maximization problem (6) is the arbitrageur’s demand
xa(Ia, p) =
0 if minπ∈P Eπ [v|Ia] < p < maxπ∈P Eπ [v|Ia]
[0, +∞) if p = minπ∈P Eπ [v|Ia]
(−∞, 0] if p = maxπ∈P Eπ [v|Ia]
(7)
7

It does not depend on wealthwa. The arbitrageur’s portfolio choice problem has no solution
for other values of pricep. Arbitrageur’s demand shows an “inertia” that is typical tomaxmin
expected utilities, as first pointed out by Dow and Werlang (1992). For a range of prices, the
agent chooses not to trade the asset at all.
3. Rational Expectations Equilibrium
The definition of rational expectations equilibrium in our model is standard (see Grossman
and Stiglitz (1980), Hellwig (1980), and Diamond and Verecchia (1981) among many others.)
Rational expectations equilibrium consists of anequilibrium price function P (θ, L) andequilib-
rium demand functions Xs(θ, L) andXa(θ, L) such that, forp = P (θ, L), it holds
Xs(θ, L) = xs(I∗
s , p), Xa(θ, L) ∈ xa(I∗
a , p) (8)
Xa(θ, L) = L − Xs(θ, L), (9)
for almost every realizationsθ andL of θ andL. Condition (8) expresses optimality of agents’
portfolio demands. Condition (9) is the market clearing condition. Information setI∗s of the spec-
ulator andI∗a of the arbitrageur reflect rational expectations, that is, they result from observations
of private signals and equilibrium prices. We describe these information sets next.
The speculator observes realizationθ of θ. Equilibrium price could reveal extra information
about realization of asset supplyL, but such information would be irrelevant for the speculator.
This is so because the probability distribution of risky part ω of the asset payoff is independent
of the supplyL. Consequently, the information setI∗s is equal to{θ = θ}. We write I∗
s = {θ}for short. The arbitrageur does not observeθ and extracts information aboutθ from equilibrium
price. Her information setI∗a is {P (θ, L) = p}.
Let us consider information revealed to the arbitrageur by the order flow against her, instead
of the equilibrium price. If the observed order flow isf and asset price isp, that information
is described by the set{L − xs(I∗s , p) = f}. Conditions (8) and (9) imply that in equilibrium,
that is, if p = P (θ, L) andf = L − Xs(θ, L), information revealed by order flow is the same
as information revealed by price. We will use this observation when deriving an equilibrium and
verify it again at the end of this section for the derived equilibrium.
The equivalence between information revealed in equilibrium by order flow and information
revealed by price has been pointed out by Vives (1995b) (see also Romer (1993)). In the absence
8

of ambiguity, this equivalence and the fact that the arbitrageur has linear utility permit a differ-
ent interpretation of the model. Instead of competitive market with price-taking speculator and
arbitrageur, one could imagine the arbitrageur acting as a market maker who sets asset price us-
ing zero-expected-profit rule and executes orders submitted by the speculator and noise traders.
The arbitrageur sets price equal to the expected payoff conditional on information revealed by
total order flow. This zero-expected-profit condition couldbe justified by Bertrand competition
among many risk-neutral market makers. Speculator’s orders are price-dependent “limit orders”
determined by competitive demand. Such market structure resembles Kyle’s (1985) auction, an
important difference being that speculator’s order is competitive instead of monopolistic.
We proceed now to derive a rational expectations equilibrium. The demand function of the
speculator at informationI∗s = {θ} can be obtained from (4),
xs(I∗
s , p) =m + θ − p
ρτ 2. (10)
The information revealed by the order flowL − xs(I∗s , p) when its observed value isf is
{L − m + θ − p
ρτ 2= f}.
This information set can be written as{ρτ 2L− θ = a}, wherea = m− p + ρτ 2f is a parameter
known to the arbitrageur. Thus the content of information revealed by the order flow against the
arbitrageur is the same as the content of observing random variableρτ 2L − θ. We have
I∗
a = {ρτ 2L − θ}. (11)
The arbitrageur’s information under rational expectations is ambiguous.
Conditional expectation of asset payoffv onI∗a under a probability distributionπ from the set
of multiple priorsP can be obtained using the Projection Theorem. We have
Eπ[v| I∗
a ] = Eπ[v|ρτ 2L − θ]
= m + Eπ[θ] +covπ
(
θ, ρτ 2L − θ)
varπ
(
ρτ 2L − θ)
(
ρτ 2L − θ − Eπ
[
ρτ 2L − θ])
= m + µπ − σ2π
σ2π + σ2
Lρ2τ 4
(
ρτ 2L + µπ − θ)
, (12)
whereµπ andσπ denote the mean and the variance of distributionπ of θ.
9

Equation (12) allows us to find the maximum and the minimum expected payoffs over the set
of priorsP needed for the arbitrageur’s asset demand (7). Market clearing condition (9) is then
used to determine equilibrium price function and equilibrium asset demands. These calculations
have been relegated to the Appendix.
Our main result is
Theorem 1 There exists a unique rational expectations equilibrium with price function given by
P (θ, L) =
m + µ + σ2
σ2+ρ2τ4σ2L
(
θ − ρτ 2L − µ)
, if θ − ρτ 2L ≤ µ
m + θ − ρτ 2L, if µ < θ − ρτ 2L < µ
m + µ + σ2
σ2+ρ2τ4σ2L
(θ − ρτ 2L − µ) , if θ − ρτ 2L ≥ µ,
(13)
speculator’s demand given by
Xs(θ, L) =
ρτ2σ2L
σ2+ρ2τ4σ2L
(θ − µ) + σ2
σ2+ρ2τ4σ2L
L, if θ − ρτ 2L ≤ µ
L, if µ < θ − ρτ 2L < µ
ρτ2σ2L
σ2+ρ2τ4σ2L
(θ − µ) + σ2
σ2+ρ2τ4σ2L
L, if θ − ρτ 2L ≥ µ,
(14)
and arbitrageur’s demand given by
Xa(θ, L) =
− ρτ2σ2L
σ2+ρ2τ4σ2L
(
θ − ρτ 2L − µ)
, if θ − ρτ 2L ≤ µ
0, if µ < θ − ρτ 2L < µ
− ρτ2σ2L
σ2+ρ2τ4σ2L
(θ − ρτ 2L − µ) , if θ − ρτ 2L ≥ µ.
(15)
Equilibrium price functionP of (13) is piecewise linear. It depends onθ andL only through
the value ofρτ 2L − θ and is strictly increasing in it. This implies that information revealed by
equilibrium price functionP is the same as observing realization ofρτ 2L − θ which in turn is
the same as observing order flowL − xs(I∗s , p) against the arbitrageur. This verifies again that
(11) holds and shows that the price and the demand functions of Theorem 1 are indeed a rational
expectations equilibrium.
Price functionP is partially revealing, that is, it reveals signalθ to the uninformed arbitrageur
only partially. If asset supply is deterministic, that is, if σ2L = 0, then the equilibrium fully reveals
signalθ.
We can use Theorem 1 to derive rational expectations equilibrium with no ambiguity. Setting
µ = µ = µ and ,σ2 = σ2 = σ2, we obtain
10

θ − ρτ 2L
-
p 6
µ µ
m + µ
m + µ
�����������������������������
P
P na
Figure 1:Equilibrium price functionsPna andP .
Corollary 2 If there is no ambiguity, then the unique rational expectations equilibrium has
linear price function given by
P na(θ, L) = m + µ +σ2
σ2 + ρ2σ2Lτ 4
(
θ − ρτ 2L − µ)
, (16)
and demand functions given by
Xnas (θ, L) =
ρτ 2σ2L
σ2 + ρ2τ 4σ2L
(θ − µ) +σ2
σ2 + ρ2τ 4σ2L
L
Xnaa (θ, L) = − ρτ 2σ2
L
σ2 + ρ2τ 4σ2L
(
θ − ρτ 2L − µ)
.
The equilibrium of Corollary 2 is a modification of the one obtained by Vives (1995, Proposi-
tion 1). Equilibrium price functionP na is linear and partially revealing as long as the asset supply
is non-deterministic. Otherwise,P na is fully revealing. Conditions for partial and full revelation
are therefore the same without ambiguity as they are with ambiguity. Figure 1 shows equilibrium
price functions with and without ambiguity.
It is interesting to note that if there is ambiguity about thevariance but not about the mean of
the information signal, that is ifµ = µ, then the equilibrium takes exactly the same form as the
equilibrium with no ambiguity, but with variance of the signal set at the upper boundσ2. Loosely
speaking, market behaves as if the variance were unambiguously known as the upper bound.
11
Equilibrium price functionP na equals the expected payoff conditional on arbitrageur’s in-
formationI∗a . Expression (16) can be decomposed in two parts: the first part, m + µ, is the un-
conditional expected payoff and the remaining part is theinformation premium for arbitrageur’s
information. The premium is proportional to the order flow against the arbitrageur. It is positive
when the order flow is positive, and negative (a discount) when the order flow is negative. The
information premium increases with the variance of signalθ, or, in other words, decreases with
the signal’s precision.
Equilibrium price functionP can take one of three values as indicated in (13). Ifθ− ρτ 2L ≤µ, then the equilibrium price equals the minimum over the set ofpriors of expected payoff con-
ditional on informationI∗a . In this case equilibrium order flow against the arbitrageur is positive,
see (15). Similarly, the equilibrium price equals maximum expected payoff conditional onI∗a
when the order flow is negative. The price lies between the maximum and the minimum values
when the order flow is zero. Therefore equilibrium prices satisfy a multiple-prior version of the
zero-expected-profit condition. If the order flow against the arbitrageur is positive, equilibrium
price is the sum of minimum expected payoff and information premium. The information pre-
mium is positive and proportional to the order flow. If the order flow is negative, the price is
the sum of maximum expected payoff and negative informationpremium (i.e., discount). The
discount is proportional to the order flow. Information premium per unit of order flow is greater
when there is ambiguity than when there is no ambiguity.
4. Market Liquidity and Price Sensitivities
The rational expectations equilibrium (13) has the following interesting feature: If the arbi-
trageur participates in trade, then she is indifferent among all long or all short positions in the
asset depending on whether the price equals her minimum or maximum expected payoff. Her
trade is determined by matching the order flow of the speculator and noise traders. Thus the arbi-
trageur provides liquidity to the market whenever she participates in trade. She does not always
do so. If signalθ and asset supplyL are such that
µ ≤ θ − ρτ 2L ≤ µ, (17)
12

then the arbitrageur does not trade. We say that the market isilliquid if (17) holds. The probability
of market illiqudity is strictly positive as long as there isambiguity about the mean of the payoff.
A good reason for there being ambiguity about the mean is thatit is usually quite difficult to
estimate expected payoff of an asset.
Non-participation in trade by arbitrageur who has ambiguous beliefs is reminiscent of Cao,
Wang and Zhang’s (2005) result that agents with the highest ambiguity choose not to trade in
a market with symmetric information and heterogeneous ambiguity. Unlike their condition for
non-participation, condition (17) does not require that asset supply be close to zero and it depends
on information signal.3
Figure 1 indicates that equilibrium price function is more sensitive to changes in information
and asset supply when market is illiquid than when it is liquid. We define price sensitivities as
∂∂θ
P and | ∂∂L
P |, where we take the absolute value of the latter to have positive number. Since
information signalθ directly affects the asset payoff, the sensitivity of priceto informational
shocks (i.e., changes in information signal) can be considered as fundamental. In contrast, the
sensitivity of price to supply shocks (i.e., changes in asset supply) is non-fundamental since asset
supply changes are uncorrelated with the payoff.
Sensitivities of equilibrium price functionP to changes in information and asset supply de-
pend on whether the asset market is liquid or illiquid. They are
∂
∂θP (θ, L) =
1, if µ < θ − ρτ 2L < µ,
σ2
σ2+ρ2τ4σ2L
, otherwise.(18)
and
∣
∣
∣
∣
∂
∂LP (θ, L)
∣
∣
∣
∣
=
ρτ 2, if µ < θ − ρτ 2L < µ
ρτ2σ2
σ2+ρ2τ4σ2L
, otherwise.(19)
Price sensitivities change in a discontinuous way as the market switches from liquid to illiquid.
3It can be shown using (27) and (28) that condition (17) is equivalent to minπ∈P Eπ [v|I∗a] − (m + θ) ≤
−ρτ2L ≤ maxπ∈P Eπ [v|I∗a] − (m + θ). This roughly says that (the negative of) the asset supply adjusted for risk
aversion lies between the maximum and the minimum differences of ex-post expected payoffs of arbitrageur and
speculator.
13

It follows from (18) and (19) that
Proposition 3 Assume that µ > µ. Sensitivities of equilibrium asset price to informational and
supply shocks are higher when market is illiquid than when it is liquid.
Reciprocals of price sensitivities are measures of market depth. Kyle (1985) identifies market
depth as one of the main characteristics of liquidity. In Kyle’s model with price-setting market
maker, market depth is the reciprocal of sensitivity of price to changes in order flow. When
market depth is high, or in other words, price sensitivity islow, market can absorb a shock to the
order flow without large effect on the price. When all agents are price takers, as in our model,
sensitivities of price to informational and supply shocks can be used to define market depth since
these shocks induce changes in equilibrium order flow (see Vives (1985a)). Proposition 3 says
that market depth is low when market is illiquid and high whenit is liquid.
Price sensitivities or related measures of price fluctuations are often used in empirical research
as measures of market liquidity. Pastor and Stambaugh (2003) construct a measure of liquidity
for US stocks, both individual and aggregate. They show thattheir measure is a significant factor
in explaining expected stock returns. They find several episodes of extremely low aggregate
liquidity, including the October-1987 crash and the LTCM crisis of September 1998.
5. Effects of Ambiguity on Liquidity Risk, Price Sensitivity, and Trading Volume
In this section we study the effects of ambiguity on liquidity risk, price sensitivity, and trading
volume. For each of these market characteristics we first compare equilibrium when there is no
ambiguity with equilibrium under ambiguity. There is no ambiguity if the arbitrageur know the
true distribution ofθ. Recall that the true distribution has meanµ and varianceσ2 such that
µ ∈ [µ, µ] andσ2 ∈ [σ2, σ2]. Second, we conduct comparative statics of changes in ambiguity.
To fix ideas, we consider changes in the upper bounds of the intervals of ambiguous mean and
variance of signalθ. The higher isµ, the greater is ambiguity about the mean, keeping all other
parameters fixed. The higher isσ2, the greater is ambiguity about variance.
The analysis of the effects of ambiguity has potential policy implications. Ambiguity of
beliefs can be influenced in a variety of ways ranging from investors’ education to payoff guaran-
14

tees, transparency of disclosure, and microstructure of markets. Easley and O’Hara (2009) (see
also Easley and O’Hara (2006)) provide an extensive discussion of these factors and how they
affect ambiguity.
5.1. Liquidity Risk
Liquidity risk is measured by the probability of market illiquidity, that is, the probability that
µ ≤ θ − ρτ 2L ≤ µ under true probability distribution ofθ andL. Of course, liquidity risk is
strictly positive only if there is ambiguity about the mean of θ.
Proposition 4 Liquidity risk increases with ambiguity about the mean but does not depend on
ambiguity about the variance.
Furthermore, liquidity risk decreases with varianceτ 2, variance of asset supplyσ2L, and spec-
ulator’s risk aversionρ.
5.2. Price Sensitivity
If there is no ambiguity, sensitivities of equilibrium price are
∂
∂θP na =
σ2
σ2 + ρ2τ 4σ2L
and
∣
∣
∣
∣
∂
∂LP na
∣
∣
∣
∣
=ρτ 2σ2
σ2 + ρ2τ 4σ2L
(20)
Comparing equations (18, 19) with (20) reveals that
Proposition 5 Sensitivities of asset price to informational and supply shocks are greater in equi-
librium under ambiguity than with no ambiguity.
Sensitivities of equilibrium price depend on ambiguity about the mean only in so far as the
event of illiquidity expands with ambiguity about the mean.The values of price sensitivities when
market is liquid and when it is illiquid remain unchanged. Inother words, market depth remain
unchanged. Price sensitivities increase (and market depthdecreases) with ambiguity about the
variance when market is liquid.
15

5.3. Trading Volume
The total trading volume is defined as
V (θ, L) = |Xa(θ, L)| + |Xs(θ, L)| + |L| (21)
and is a function of information signal and asset supply. It consists of trading volume of arbi-
trageur|Xa(θ, L)|, trading volume of speculator|Xa(θ, L)| and the volume of supply|L|. The
expected total trading volumeE[V (θ, L)] – with the expectation taken under the true distribution
of θ andL – is an ex-ante measure of trading volume.
First, we consider the effects of ambiguity about the mean. We have
Proposition 6 Total trading volume V (θ, L) weakly decreases with ambiguity about the mean,
for every θ and L. The expected total trading volume decreases with ambiguity about the mean.
It follows that total trading volume is lower in equilibriumunder ambiguity about the mean
than with no ambiguity. The proof of Proposition 6 (see Appendix) shows that trading volume
of the arbitrageur weakly decreases while trading volume ofspeculator may increase or decrease
with ambiguity about the mean, depending on realization of information signal and supply. The
former effect overweights that latter and the total tradingvolume decreases.
Figure 2 shows results of numerical simulations of expectedtrading volume. All graphs have
µ on the horizontal axes. The dotted red curve shows the expected trading volume of arbitrageur,
the dashed blue curve shows the expected trading volume of speculator, and the orange curve
shows the expected total volume. The true mean and variance of θ areµ = 1 andσ = 1. Other
parameters areµ = 1, σ = 1, τ = 1, σL = 1, andρ = 1.
We turn our attention now to the effects of ambiguity about the variance. We have
Proposition 7 Total trading volume V (θ, L) weakly decreases with ambiguity about the vari-
ance for every θ and L. The expected total trading volume decreases with ambiguity about the
variance.
It follows that total trading volume is higher in equilibrium under ambiguity about the vari-
ance than with no ambiguity.
16

1 2 3 4 5
0.30
0.35
0.40
0.45
0.50
0.55
1 2 3 4 5
0.40
0.45
0.50
0.55
0.60
0.65
1 2 3 4 5
1.65
1.70
1.75
1.80
1.85
1.90
Figure 2:Expected trading volumes of arbitrageur, speculator, and total as functions ofµ.
1.0 1.5 2.0 2.5 3.0 3.5 4.0
0.25
0.30
0.35
0.40
0.45
0.50
0.55
1.0 1.5 2.0 2.5 3.0 3.5 4.0
0.35
0.40
0.45
0.50
0.55
0.60
0.65
1.0 1.5 2.0 2.5 3.0 3.5 4.0
1.60
1.65
1.70
1.75
1.80
1.85
1.90
Figure 3:Expected trading volumes of arbitrageur, speculator, and total as functions ofσ2.
Figure 3 shows results of numerical simulations of expectedtrading volumes of arbitrageur
and speculator, and expected total trading volume as functions of σ2 (from left to right). It is
assumed that there is no ambiguity about the mean. More precisely, we setµ = µ = µ = 1.
Other parameters are as in Figure 2.
Summarizing the results of the section we can say that high ambiguity about the mean leads
to high liquidity risk and low trading volume, but it does notaffect market depth. High ambiguity
about the variance leads to low trading volume and low marketdepth, but it does not affect
liquidity risk. Johnson (2008) argues that market depth andtrading volume are positively related
in cross-section of stocks although no such relation is observed in time-series data. Johnson’s
main finding is a positive relation between liquidity risk and trading volume, but his dynamic
measure of liquidity risk is quite different from our measure which is the probability of market
illiquidity.
6. Excess Volatility
The conventional efficient markets hypothesis asserts thatchanges in asset prices are driven
17

by arrival of new information about future payoffs. If prices equal discounted expected value of
future payoffs, then volatility of prices should be relatedto volatility of payoffs. Shiller (1981)
and LeRoy and Porter (1981) developed a variance-bound inequality between the two volatilities
and used it in empirical tests. They found systematic violations of the inequality in the U.S.
stock markets. Thisexcess volatility of stock prices has been confirmed by other studies such as
Campbell and Shiller (1988a, b), LeRoy and Parke (1992), Mankiw, Romer and Shapiro (1985,
1991).
Dow and Werlang (1992b) showed that the presence of ambiguous information may account
for violations of the variance-bound inequality. They gavean example of an equilibrium in asset
markets with investors having multiple-prior preferencessuch that the variance of asset prices
exceeds the variance of dividends where variances are takenunder some probability measure
from the set of priors. If that measure represents the true distribution of payoffs and prices, then
excess volatility would be observed. In the Dow and Werlang (1992b) example investors have
symmetric information and asset supply is deterministic. We show that excess volatility may
arise in a rational expectations equilibrium under ambiguity with asymmetric information and
noisy asset supply.
First, we demonstrate that there is no excess volatility in rational expectations equilibrium
with no ambiguity. Volatilities of payoff and price are measured by the respective variances. The
variance of payoffv is σ2 + τ 2. The variance of equilibrium priceP na given by (16) is
var[P na] =σ4
(σ2 + ρ2σ2Lτ 4)
(22)
One can easily check thatvar[P na] < σ2 + τ 2, so that there is no excess volatility.
Excess volatility may arise in equilibrium if there is sufficiently high ambiguity about the
variance of signalθ. To illustrate this, suppose that there is ambiguity about the variance but not
about the mean ofθ. Volatilities of payoff and price are measured by variances taken under the
true distribution ofθ, with meanµ and varianceσ2. As discussed in Section 3, equilibrium price
P is given by (16) with variance of signal set atσ2. The variance ofP under the true distribution
18

of signal with varianceσ2 is
varµ,σ[P ] =σ4
(σ2 + ρ2σ2Lτ 4)2
(σ2 + ρ2σ2Lτ 4). (23)
For large values ofσ, expression (23) approachesσ2 + ρ2σ2Lτ 4. If ρτσL > 1, then this limiting
value exceedsσ2 +τ 2 which is the variance of payoff under the true distribution.Thus, ifρτσL >
1, then there is excess volatility for large enough ambiguity about the variance. This argument
applies if there is small ambiguity about the mean ofθ.
Proposition 8 provides an explicit bound on varianceσ that is is sufficient for excess volatility.
Proposition 8 If ρτσL > 1 and σ2 > A(σ), then
varµ,σ[P ] > σ2 + τ 2 (24)
for every µ ∈ [µ, µ].
BoundA(σ) is defined by equation (40) in the Appendix. It depends onµ and is a decreasing
function of µ. This implies that high ambiguity about the mean makes excessvolatility more
likely.
1.0 1.5 2.0 2.5 3.0 3.5 4.0
1.5
2.0
2.5
3.0
3.5
Figure 4:Excess volatility.
The possibility of excess volatility is illustrated by Figure 4 which has the upper boundσ
of the interval of ambiguous variance on horizontal axis andvariance of price on vertical axis.
19

Solid red curve shows the variancevarµ,σ[P ] as function ofσ2 for µ = 1 andσ = 1. Other
parameters areµ = 2, µ = 0, m = 0, τ = 1, σL = 1, andρ = 2. The variance of payoff
equals 2 and is marked by the green solid line. For values ofσ2 greater than1.72 the variance of
price exceeds the variance of payoff and there is excess volatility. Dashed blue curve shows the
variancevarµ,σ[P ] for µ = 1 andσ = 1 when there is no ambiguity about the mean, that is, when
µ = µ = 1.
7. Concluding Remarks
Investors in our model have ambiguous prior beliefs about the asset payoff. Ambiguity is fully
resolved for informed investors upon their observing information signal, but it remains present
for uninformed investors. One could, of course, imagine different scenarios. Making the infor-
mation signal only partially resolve ambiguity about the payoff, for instance, would lead to both
informed and uninformed investors having ambiguous posterior beliefs in rational expectations
equilibrium. We have not been able to find a closed-form solution for such a variation of the
model.
Further, the equilibrium derived in this paper has the feature that information revealed by
prices is the same with and without ambiguity. Condie and Ganguli (2010a) show that this may
not hold in the Radner (1979) model of asset markets with asymmetric information (see Section
1.1). Whether or not ambiguity can change the informationalcontent of equilibrium prices in the
CARA-normal model remains to be seen.
20
Appendix
Proof of Theorem 1. We deriveminπ∈P Eπ [v|I∗a ] andmaxπ∈P Eπ [v|I∗
a ] using (12). We have:
• If θ − ρτ 2L < µ, then
minπ∈P
Eπ [v|I∗
a ] = m + µ +σ2
σ2 + ρ2τ 4σ2L
(
θ − ρτ 2L − µ)
, (25)
maxπ∈P
Eπ [v|I∗
a ] = m + µ +σ2
σ2 + ρ2τ 4σ2L
(
θ − ρτ 2L − µ)
. (26)
• If µ ≤ θ − ρτ 2L ≤ µ, then
minπ∈P
Eπ [v|I∗
a ] = m + µ +σ2
σ2 + ρ2τ 4σ2L
(
θ − ρτ 2L − µ)
, (27)
maxπ∈P
Eπ [v|I∗
a ] = m + µ +σ2
σ2 + ρ2τ 4σ2L
(
θ − ρτ 2L − µ)
. (28)
• If θ − ρτ 2L > µ, then
minπ∈P
Eπ [v|I∗
a ] = m + µ +σ2
σ2 + ρ2τ 4σ2L
(
θ − ρτ 2L − µ)
, (29)
maxπ∈P
Eπ [v|I∗
a ] = m + µ +σ2
σ2 + ρ2τ 4σ2L
(
θ − ρτ 2L − µ)
. (30)
Next, we calculate speculator’s demandxs(I∗s , p) using (10) forp = minπ∈P Eπ [v|I∗
a ] andp =
maxπ∈P Eπ [v|I∗a ] . Sinceminπ∈P Eπ [v|I∗
a ] can take either one of two values (25) or (27), we
obtain two possible values of speculator’s demand:
• If p = m + µ + σ2
σ2+ρ2τ4σ2L
(
θ − ρτ 2L − µ)
, then
xs(I∗
s , p) =ρτ 2σ2
L
σ2 + ρ2τ 4σ2L
(θ − µ) +σ2
σ2 + ρ2τ 4σ2L
L, (31)
• If p = m + µ + σ2
σ2+ρ2τ4σ2L
(
θ − ρτ 2L − µ)
, then
xs(I∗
s , p) =ρτ 2σ2
L
σ2 + ρ2τ 4σ2L
(θ − µ) +σ2
σ2 + ρ2τ 4σ2L
L, (32)
21

Similarly, maxπ∈P Eπ [v|I∗a ] can take one of two values (26) or (30). Speculator’s demand is
• If p = m + µ + σ2
σ2+ρ2τ4σ2L
(θ − ρτ 2L − µ), then
xs(I∗
s , p) =ρτ 2σ2
L
σ2 + ρ2τ 4σ2L
(θ − µ) +σ2
σ2 + ρ2τ 4σ2L
L, (33)
• If p = m + µ + σ2
σ2+ρ2τ4σ2L
(θ − ρτ 2L − µ), then
xs(I∗
s , p) =ρτ 2σ2
L
σ2 + ρ2τ 4σ2L
(θ − µ) +σ2
σ2 + ρ2τ 4σ2L
L, (34)
If p = m + µ + σ2
σ2+ρ2τ4σ2L
(
θ − ρτ 2L − µ)
, then the net order flow of noise traders and the spec-
ulatorL − xs(I∗a , p) is positive. Sincep = minπ∈P Eπ [v|I∗
a ] holds in this case, the arbitrageur’s
demand is arbitrarily positive, see (7). Thusp = m + µ + σ2
σ2+ρ2τ4σ2L
(
θ − ρτ 2L − µ)
is a rational
equilibrium price forθ − ρτ 2L ≤ µ. Similarly, p = m + µ + σ2
σ2+ρ2τ4σ2L
(θ − ρτ 2L − µ) is the
equilibrium price forθ−ρτ 2L ≥ µ with negative equilibrium demand of the arbitrageur. Finally,
if µ < θ−ρτ 2L < µ, thenp = m+θ−ρτ 2L satisfiesminπ∈P Eπ [v|I∗a ] < p < maxπ∈P Eπ [v|I∗
a ]
and is an equilibrium price with the corresponding arbitrageur’s demand equal to zero. Summing
up, the rational expectations equilibrium is as specified in(13), (14) and (15). �
Proof of Proposition 4. The probability of market illiquidity (i.e., liquidity risk) under probabil-
ity distribution of θ with meanµ and varianceσ2 is
Pr(
µ < θ − ρτ 2L < µ)
=1
2
erf
µ − E[θ − ρτ 2L]√
2var[θ − ρτ 2L]
− erf
µ − E[θ − ρτ 2L]√
2var[θ − ρτ 2L]
=1
2
(
erf
(
µ − µ√
2(σ2 + ρ2τ 4σ2L)
)
− erf
(
µ − µ√
2(σ2 + ρ2τ 4σ2L)
))
(35)
whereerf is the Gauss error function defined by
erf(x) :=2√π
∫ x
0
exp(−u2)du (36)
for x ≥ 0, and erf(x) = −erf(−x) for x ≤ 0.
22

Clearly,Pr(
µ < θ − ρτ 2L < µ)
increases withµ. By differentiating (35) with respect toτ 2,
σ2L andρ, it can be seen thatPr
(
µ < θ − ρτ 2L < µ)
decreases with these parameters.�
Proof of Proposition 6. Let V (µ) denote the total trading volume (21) as function of the upper
boundµ of the interval of ambiguous mean of the signal. We need to show that V is a non-
increasing function ofµ for µ ≥ µ, for every(θ, L) (which we suppressed from the notation).
We will repeatedly use (15) and (14) in our calculations.
We consider two cases:
• First, if θ − ρτ 2L ≤ µ, thenV does not depend onµ for µ ≥ µ. Hence, it is a constant
function ofµ.
• Second, ifθ − ρτ 2L > µ, then
V (µ) = 2|L| (37)
for µ ≥ θ − ρτ 2L, and
V (µ) =
2 |L|, if ρτ 2σ2L(θ − µ) + σ2L < 0,
2ρτ2σ2L
σ2+ρ2τ4σ2L
(θ − µ) +σ2−ρ2τ4σ2
L
σ2+ρ2τ4σ2L
L + |L|, if ρτ 2σ2L(θ − µ) + σ2L ≥ 0,
(38)
for µ < θ−ρτ 2L. In this case,V is a piece-wise linear continuous function ofµ. The linear
pieces are either constant or decreasing inµ.
This shows thatV (µ) is a non-increasing function ofµ for µ ≥ µ, for every(θ, L). SinceV is
decreasing inµ for a set of(θ, L) that has strictly positive probability, the expected valueE[V (µ)]
is decreasing.�
To provide additional insight, we show that trading volume of the arbitrageur∣
∣Xa(θ, L; µ)∣
∣ is a
non-increasing function ofµ. If follows from (15) that∣
∣Xa
∣
∣ does not depend onµ if θ− ρτ 2L ≤µ. If θ − ρτ 2L > µ, then
∣
∣Xa
∣
∣ is a decreasing function ofµ for µ ≥ θ − ρτ 2L and is constant
equal to zero forµ < θ − ρτ 2L. Trading volume of the speculator∣
∣Xs
∣
∣may increase or decrease
with µ depending on(θ, L).
23

Proof of Proposition 7. Let V (σ) denote the total trading volume (21) as function of the upper
boundσ of the interval of ambiguous variance of the signal. We need to show thatV (σ) is a
non-increasing function ofσ for σ ≥ σ, for every(θ, L). We will repeatedly use (15) and (14) in
our calculations.
We consider three cases:
• If θ − ρτ 2L ≤ µ, then
V (σ) =
2 |L|, if ρτ 2σ2L(θ − µ) + σ2L ≥ 0,
− 2ρτ2σ2L
σ2+ρ2τ4σ2L
(θ − µ) − σ2−ρ2τ4σ2L
σ2+ρ2τ4σ2L
L + |L|, if ρτ 2σ2L(θ − µ) + σ2L < 0,
for σ ≥ σ. If σ is such thatρτ 2σ2L(θ − µ) + σ2L > 0, then ∂V
∂σ2 = 0. If, on the other hand,
ρτ 2σ2L(θ − µ) + σ2L < 0, then
∂V
∂σ2=
2ρτ 2σ2L
(
θ − µ − ρτ 2L)
(σ2 + ρ2τ 4σ2L)
2 ≤ 0. (39)
V is a continuous function ofσ and differentiable except for one point. Therefore it is
non-increasing inσ.
• If µ < θ − ρτ 2L < µ, thenV (σ) = 2|L| andV does not depend onσ.
• If θ − ρτ 2L ≥ µ, then
V (σ) =
2 |L|, if ρτ 2σ2L(θ − µ) + σ2L < 0,
2ρτ2σ2L
σ2+ρ2τ4σ2L
(θ − µ) +σ2−ρ2τ4σ2
L
σ2+ρ2τ4σ2L
L + |L|, if ρτ 2σ2L(θ − µ) + σ2L ≥ 0.
for σ ≥ σ. If σ is such thatρτ 2σ2L(θ−µ)+σ2L < 0, then ∂V
∂σ2 = 0. If ρτ 2σ2L(θ−µ)+σ2L ≥
0, then
∂V
∂σ2= −
2ρτ 2σ2L
(
θ − µ − ρτ 2L)
(σ2 + ρ2τ 4σ2L)
2 ≤ 0.
It follows thatV (σ) non-increasing inσ2 for everyθ andL. SinceV is decreasing inσ for a set
of (θ, L) that has strictly positive probability, the expected valueE[V (σ)] is decreasing.�
24
Proof of Proposition 8. We first give a definition of boundA(σ):
A(σ) =ρ2τ2σ2
L
“
(2−b)q
(σ2+τ2) (σ2+ρ2τ4σ2L)+((2−b)σ2+(2−bρ2τ2σ2
L)τ2)
”
2(ρ2τ2σ2L−1)
, (40)
whereb is
b = erf
(
µ − µ√
2(σ2 + ρ2τ 4σ2L)
)
, (41)
anderf is the Gauss error function (36).A(σ) is a decreasing function ofµ.
The proof of Proposition 8 relies on the following lemma:
Lemma I. Let Z be a normally distributed random variable and g : ℜ → ℜ a differentiable
function. Suppose that var[g(Z)] < ∞ and E[|g′(Z)|] < ∞, where g′ is the derivative of g. Then
var[g(Z)] ≥(
E[g′(Z)])2
var(Z). (42)
Further, (42) holds with equality if and only if g is linear.
The proof can be found in Cacoullos (1982), Proposition 3.2.Lemma I continues to hold for
functionsg that are differentiable except for a finite set of points.
We apply Lemma I toZ = θ − ρτ 2L andg(Z) = P (θ, L) given by (13). Using (42), we obtain
varµ,σ
[
P (θ, L)]
≥ 12π
(
σ2
σ2+ρ2τ4σL2
(∫ µ
−∞
e−
(Z−µ)2
2(σ2+ρ2τ4σL2) dZ +
∫
∞
µ
e−
(Z−µ)2
2(σ2+ρ2τ4σL2) dZ
)
+
∫ µ
µ
e−
(Z−µ)2
2(σ2+ρ2τ4σL2) dZ
)2
=
(
2σ2 + Bρ2τ 4σ2L
2(σ2 + ρ2τ 4σ2L)
)2(
σ2 + ρ2τ 4σ2L
)
, (43)
where
B = erf
(
µ − µ√
2(σ2 + ρ2τ 4σ2L)
)
+ erf
(
µ − µ√
2(σ2 + ρ2τ 4σ2L)
)
. (44)
For everyµ ∈ [µ, µ], it holdsB ≥ b, whereb is defined by (41). Thus (43) implies
varµ,σ
[
P (θ, L)]
≥(
2σ2 + bρ2τ 4σ2L
2(σ2 + ρ2τ 4σ2L)
)2(
σ2 + ρ2τ 4σ2L
)
. (45)
Calculation shows that inequality(
2σ2 + bρ2τ 4σ2L
2(σ2 + ρ2τ 4σ2L)
)2(
σ2 + ρ2τ 4σ2L
)
> σ2 + τ 2 (46)
25

holds if
σ2 ≥ A(σ) and ρτσL > 1. (47)
Using (45) and (46), we conclude that (47) implies that
varµ,σ[P (θ, L)] > σ2 + τ 2
for everyµ ∈ [µ, µ]. �
26

References
Admati, A. (1985), “A Noisy Rational Expectations Equilibrium for Multi-Asset Securities Mar-
kets,”Econometrica, 53, 629–57.
Cacoullos, T. (1982), “On Upper and Lower Bounds for the Variance of a Function of a Random
Variable,”Annals of Probability, 10, 799–809.
Campbell, J.Y. and R.J. Shiller (1988a), “Stock Prices, Earnings, and Expected Dividends,”Jour-
nal of Finance, 43, 661–676.
Campbell, J.Y. and R.J. Shiller (1988b), “The Dividend-Price Ratio and Expectations of Future
Dividends and Discount Factors,”Review of Financial Studies, 1, 195–227.
Cao, H.H., T. Wang and H.H. Zhang (2005), ”Model Uncertainty, Limited Market Participation
and Asset Prices,”Review of Financial Studies, 18, 1219–1251.
Caskey, J.A. (2009), ”Information in Equity Markets with Ambiguity-Averse Investors,”Review
of Financial Studies, 22, 3595–3627.
Condie, S. and J. Ganguli (2010a), “Ambiguity and Rational Expectations Equilibria,”Review of
Economic Studies, forthcoming.
Condie, S. and J. Ganguli (2010b), “Informational Efficiency with Ambiguous Information,”
Economic Theory, this issue.
Correia da Silva, J. and C. Herves-Beloso (2009), “Prudent Expectations Equilibrium in Economies
with Uncertain Delivery,”Economic Theory, 39, 67–92.
Dana, R.A. (2004), “Ambiguity, Uncertainty Aversion and Equilibrium Welfare,”Economic The-
ory, 23, 569–587.
Diamond, D. and R. Verrecchia (1981), “Information Aggregation in a Noisy Rational Expecta-
tions Economy,”Journal of Financial Economics, 9, 221–235.
Dow, J. and S. Werlang (1992), “Ambiguity Aversion, Risk Aversion, and the Optimal Choice of
Portfolio,” Econometrica, 60, 197–204.
Dow, J. and S. Werlang (1992b), “Excess Volatility of Stock Prices and Knightian Uncertainty,”
European Economic Review, 36, 631–638.
Easley, D. and M. O’Hara (2006), “Microstructure and Ambiguity,” Journal of Finance, forth-
27

coming.
Easley, D. and M. O’Hara (2009), “Ambiguity and Nonparticipation: The Role of Regulation,”
Review of Financial Studies, 22, 593–624.
Ellsberg, D. (1961), “Risk, Ambiguity, and the Savage Axioms,” Quarterly Journal of Eco-
nomics, 75, 643-?669.
Epstein L. and M. Schneider (2008), “Ambiguity, Information Quality and Asset Pricing,”Jour-
nal of Finance, 63 197-228.
Garlappi, L., R. Uppal and T. Wang (2007), “Portfolio Selection with Parameter and Model
Uncertainty: A Multi-Prior Approach,”Review of Financial Studies, 20, 41–81.
Gilboa, I. and D. Schmeidler (1989), “Maxmin expected utility with non unique prior,”Journal
of Mathematical Economics, 18, 141-153.
Grossman, S. and J. Stiglitz (1980), “On the Impossibility of Informationally Efficient Markets,”
American Economic Review, 70, 393–408.
Hellwig, M. (1980), “On the Aggregation of Information in Competitive Markets,”Journal of
Economic Theory, 22, 477–498.
Illeditsch, Ph. (2010), “Ambiguous Information, Portfolio Inertia, and Excess Volatility,” mimeo.
Johnson, T.C. (2008), “Volume, Liquidity, and Liquidity Risk,” Journal of Financial Economics,
87, 388–417.
Ju, N. and J. Miao (2009), “Ambiguity, Learning, and Asset Returns,” mimeo.
Klibanoff, P., M. Marinacci and S. Mukherji (2005), “A Smooth Model of Decision Making under
Ambiguity,” Econometrica, 73, No. 6, 1849-92,
Kyle, A. (1985), “Continuous Auctions and Insider Trading,” Econometrica, 53, pp. 1315–37.
LeRoy, S.F. and W.R. Parke (1992), “Stock Price Volatility:Tests Based on the Geometric Ran-
dom Walk,”American Economic Review, 82, 981–992.
LeRoy, S.F. and R.D. Porter (1981), “The Present-Value Relation: Tests Based on Implied Vari-
ance Bounds,”Econometrica, 49, 555–574.
Mankiw, N.G., D. Romer and M.D. Shapiro (1985), “An UnbiasedReexamination of Stock Mar-
ket Volatility,” Journal of Finance, 40, 677–687.
28

Mankiw, N.G., D. Romer and M.D. Shapiro (1991), “Stock Market Forecastability and Volatility:
A Statistical Appraisal,”Review of Economic Studies, 58, 455–477.
Mele, A. and F. Sangiorgi (2010), “Uncertainty, Information Acquisition and Price Swings in
Asset Markets,” mimeo.
Mukerji S. and J.M. Tallon (2001), “Ambiguity Aversion and Incompleteness of Financial Mar-
kets,”Review of Economic Studies, 68, 883–904.
Mukerji S. and J.M. Tallon (2004), “Ambiguity Aversion and the Absence of Indexed Debt,”
Economic Theory, 24, 665–685.
Pastor, L. and R. Stambaugh (2003) “Liquidity Risk and Expected Stock Returns,”Journal of
Political Economy, 111, 642–685.
Radner, R. (1968), “Competitive Equilibrium under Uncertainty,” Econometrica, 36, 31?-58.
Radner, R. (1979), “Rational Expectations Equilibrium: Generic Existence and the Information
Revealed by Prices,”Econometrica, 47, 655-678.
Romer, D. (1993), “Rational Asset-Price Movements withoutNews,” American Economic Re-
view, 83, 1112–1130.
Routledge, B. and S. Zin (2009), “Model Uncertainty and Liquidity,” Review of Economic Dy-
namics, 12, 543–566.
Schmeidler, D. (1989), “Subjective Probability and Expected Utility Without Additivity,” Econo-
metrica, 57, 571–587.
Shiller, R.J. (1981), “Do Stock Prices Move Too Much to be Justified by Subsequent Changes in
Dividends?,”American Economic Review, 71, 421-?436.
Strzalecki, T. and J. Werner (2010), “Efficient Allocationsunder Ambiguity,”Journal of Eco-
nomic Theory, forthcoming.
Ui, T. (2010), “The Ambiguity Premium vs. the Risk Premium under Limited Market Participa-
tion,” Review of Finance, forthcoming.
Vives, X. (1995a), “Short Term Investment and the Information Efficiency of the Market,”Review
of Financial Studies, 8, 3–40.
Vives, X. (1995b), “The Speed of Information Revelation in aFinancial Market Mechanism,”
29

Journal of Economic Theory, 67, 178–204.
30