liquid chromatography: tools for improving resolution ... · pdf fileimproving resolution,...
TRANSCRIPT
Technical Note
www.appliedbiosystems.com
Liquid Chromatography: Tools for Improving Resolution, Sample Throughput and Sensitivity for LC/MS/MS Applications
Overview The separation of an analyte from potential interferences is often a vital step in quantitative analytical measurements. The separation of components of complex mixtures typically enhances the detection capabilities of an analyzer. Many tools are available for the chromatographer to obtain the desired separation, including: different column packing chemistries, column and particle sizes, mobile phase composition, flow rates and of course the hardware to complete the process. The following note describes the basics of the chromatographic separation process and provides several options to achieve improved chromatographic resolution, sample throughput and sensitivity for LC/MS/MS applications. Introduction
To the chromatographer, the most important aspect of any analytical separation technique is specificity through separation. The mass spectrometrist may have a somewhat contrary opinion however; as specificity gained through MS/MS filtering techniques may relax the requirements of the chromatographic separation of analytes prior to MS detection. In truth, the combination of both analytical techniques together can achieve greater specificity than either technique on its own.
Without question, chromatographic separation can help address many of the common problems related to the coupling of LC and MS, such as matrix effects, ionization suppression and differentiating isobaric species. The need for chromatographic separation can however, result in a much longer sample analysis time and thus becomes a bottleneck in applications where achieving higher sample throughput and increasing the information collected per analysis are key drivers. Optimization of the chromatographic separation step involves the adjustment of column packings, mobile phase composition and flow rates.
In this Note we discuss the basics of chromatography with a key focus on what tools are available to achieve improved chromatographic resolution, speed of analysis and sensitivity in LC/MS/MS applications.
Chromatography Basics The ultimate goals of chromatography are to separate important analytes from matrix and potential interferences, provide ideal conditions for identification of those analytes, and allow precise quantification of those analytes if needed. One of the key goals in optimization is to remove or separate the matrix and other compounds that can interfere with the separation or ionization of the compounds of interest. The ability to identify and confirm the presence of a particular analyte is closely related to the key characteristics of the peak for that analyte. The overall performance of the chromatographic system is generally measured in terms of a number of peak parameters, which describe the speed, resolution, reproducibility, reliability and sensitivity of the system. In the most simplified model, the separation process can be viewed as going through the following stages (see Figure 1):

Technical Note
www.appliedbiosystems.com
• Sample is introduced into the liquid stream (mobile phase) traveling through a column packed with particles of uniform size (stationary phase).
• While traversing the column packing, all analyte molecules interact with the mobile phase in exactly the same way.
• All molecules travel an identical path through the column (perfect frontal flow). • Perfect separation of analytes achieved with the same response by the detector at the end.
Figure 1: Theoretical separation process In the real world however (see Figure 2), the liquid flow is not the same at all radii in the column, dispersion occurs in the analyte sample bands as molecules travel different paths and interact differently with an imperfect stationary phase, and the detection typically shows different responses for each compound.
Figure 2: Typical separation process To obtain the optimal performance from HPLC techniques, separation efficiency and dispersion are important aspects to keep in mind. Ultimately, it is desirable to minimize individual peak widths, maximize individual peak heights, maximize the separation between analyte peaks and minimize the analysis runtime. How is this done? The “Van Deemter” equation hints at column parameters that can be controlled in order to achieve the desired chromatographic separation.
The Van Deemter Equation The classic rate equation that describes chromatographic separation efficiency based on a number of key physical column parameters is known as the “Van Deemter” equation. It incorporates the kinetic theory of chromatography to relate the migration and dispersion of solute “bands” through a column packed with spherical particles in a constant mobile phase flow. The goal in understanding the separation process is to improve column efficiency by understanding how to reduce band broadening. The Van Deemter equation highlights several parameters in a chromatographic run that can be manipulated to reduce band broadening.
Mobile Phase Flow
Samplewith
Analyte 1Analyte 2
Column
MS Signal
Analyte 1 Analyte 2
Separated Analytes
Mobile Phase Flow
Samplewith
Analyte 1Analyte 2
Column
MS Signal
Analyte 1 Analyte 2
Separated Analytes
Mobile Phase Flow
Samplewith
Analyte 1Analyte 2
Column
MS Signal
Analyte 1 Analyte 2
Separated Analytes
Mobile Phase Flow
Samplewith
Analyte 1Analyte 2
Column
MS Signal
Analyte 1 Analyte 2
Separated Analytes

Technical Note
www.appliedbiosystems.com
According to the Van Deemter equation, column band broadening originates from three main sources:
1. multiple paths that an analyte can travel through the column packing; 2. molecular diffusion; 3. effect of mass transfer between phases.
The Van Deemter equation (Equation 1) combines all three sources of band broadening (major column parameters) and represents them as the ”height equivalent of a theoretical plate”, HETP, or H:
This equation simplifies to the following (Equation 2):
The HETP is a theoretical construct (which can trace its origins to industrial steam distillation columns) used to characterize the efficiency of a separation column. The smaller the value of HETP, the larger the number of theoretical plates in a column, and the greater the separation efficiency. The A-term is used to describe eddy diffusion, which allows for the different paths a solute may follow. The B-term captures the contribution from molecular diffusion of the solute while passing through the column. The C term is the contribution of mass transfer and allows for the finite rate of transfer of the solute between the stationary phase and mobile phase. This equation assumes that the composition of the mobile is constant (isocratic elution). The theoretical graph below (Figure 3) highlights the contribution of each term of the main equation. The resulting summed curve is the theoretical Van Deemter plot; a hyperbolic function which has a minimum value of plate height (or maximum efficiency) at a specific value of flow velocity (µ).
Figure 3: Theoretical Van Deemter plot
Maximum EfficiencyMaximum Efficiency
Equation 1
Equation 2
Technical Note
www.appliedbiosystems.com
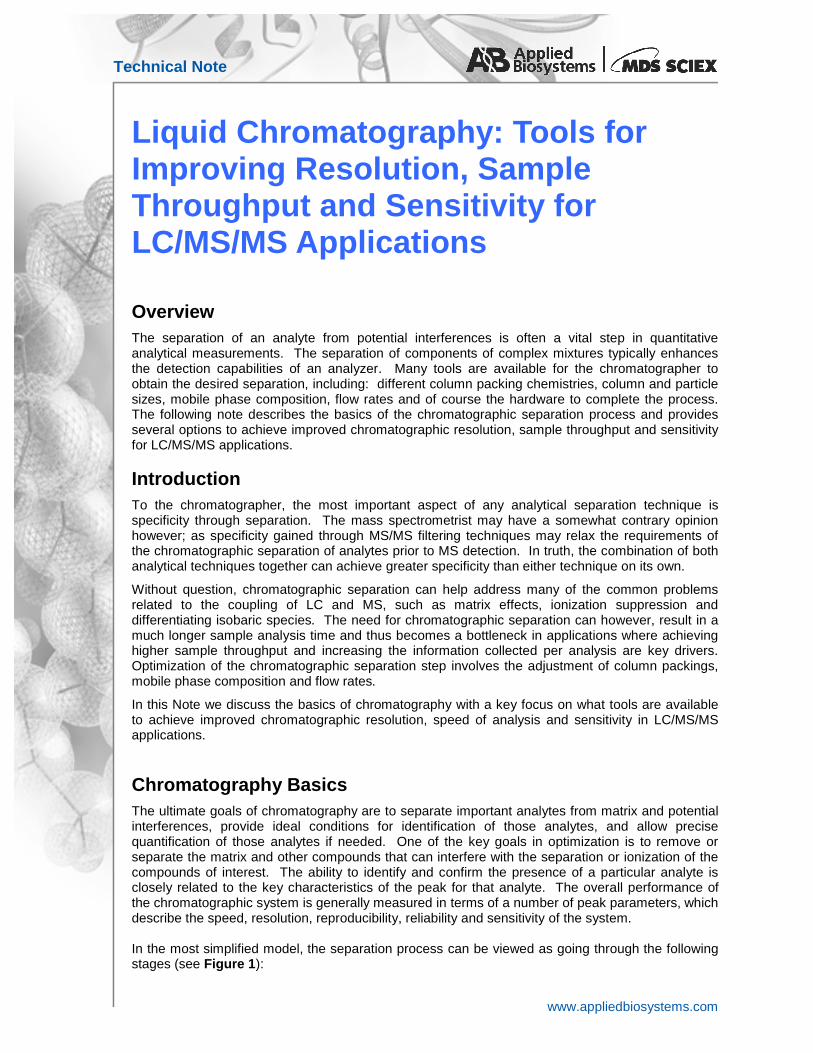
Key Parameters Influencing Chromatographic Separations According to the Van Deemter equation (Equation 1), several parameters influence H. Recently, small particle size has been a focus as a tool for improving column efficiency. While particle size of the column packing is an important parameter (dp term in Equation 1, A term in Equation 2 - considered the main advantage of UPLC separations), it isn’t the only factor which can be optimized to provide higher efficiency. There are other parameters that can be controlled and optimized to provide the same, if not better chromatographic efficiency (resolution and speed) than particle size alone. For optimal chromatographic performance, here are many parameters that should be considered:
ü Particle size
ü Column dimensions
ü Column packing chemistries
ü Mobile phase flow rate (linear velocity)
ü Mass transfer (stationary phase and mobile phase)
ü Gradient elution
ü Hardware improvements
Figure 4: Effect of particle size on Van Deemter plot
Particle Size
Figure 4 shows that by reducing the particle size diameter, the A term in the Van Deemter equation is reduced effectively lowering the theoretical HETP curve. Now, at a higher mobile phase linear velocity the same HETP value can be achieved, resulting in faster separation. As a result, with smaller diameter particles, speed of separation can be increased without sacrificing resolution.
Mass Transfer and Longitudinal Diffusion
The same result can be observed by manipulating the B & C terms of the Van Deemter equation (Figure 5). Techniques like small particles, turbulent flow chromatography, capillary columns and monolithic phases all take advantage of changes in the mass transfer and flow dynamics within the column to “flatten” the Van Deemter curve, allowing increased efficiency at higher velocity.
Gradient Elution
Gradient elution changes everything. The Van Deemter equation assumes that separations are by isocratic elution only. Gradients add another dimension to the van Deemter equation basically allowing the B diffusion term and the partition value k’ (Equation 1) to vary with time (mobile phase
Figure 5: Effect of changes to the mass transfer chromatography on Van Deemter plot

Technical Note
www.appliedbiosystems.com
composition). This introduces a whole new set of terms to describe band broadening related to the mobile phase composition and distribution in the column. In this case, the contribution to band broadening (and reduction of column efficiency) from imprecision in the gradient becomes more significant than the B & C terms of the Van Deemter equation. Because of this, the ability to generate a high precision gradient can significantly impact column efficiency. Figure 6 shows how a high precision gradient elution can influence peak width on a typical column.
Figure 6: Effect of high precision gradient on peak elution
Hardware Improvements
Several pumping technologies have been introduced over the years to improve the separation process with the precise delivery of solvents (Figure 7). Employing a single solvent of constant composition is termed an isocratic elution, and is typically only used for the simplest separations, applications which require no separation, or for method development. More typically, separation efficiency requirements necessitate enhancement by gradient elution. The main objective of a pump used for gradient elution is to precisely deliver the correct mobile phase composition at the right time throughout the analytical run. High precision gradient HPLC pumping systems need to; 1) be capable of accurate mixing of 2 or more solvents, 2) have a pulse-free output, 3) have a wide flow rate range, and 4) control the flow rate and flow composition reproducibility. Three typical types of gradient pumping systems are shown in Figure 7; A) reciprocating pump low pressure mixing, B) reciprocating pump with high pressure mixing, and C) a dual syringe low flow, high pressure mixing pump.
There are several elements of the pump design which are critical to achieving the desired flow characteristics with the binary pumps described in figure 7. In all of the designs, there is some sort of mixing device which is used to combine the two solvents. In every design, the volume of the mixing device is critical in determining the maximum slew rate for any gradient delivered to the system at a particular flow rate. Low pressure mixing pumps in particular tend to have high volume mixers utilizing a single inlet which is electronically switched through a valve to select an input solvent. The proportion of time for which each solvent is selected determines the mobile phase composition. At low flow rates, the maximum slew rate is drastically reduced, whereas at high flow rates the composition of the mobile phase may oscillate, dispersing the gradient composition. The problem is not as pronounced with high pressure mixing pumps, in which each solvent is continuously pumped at the required fractional flow, however the mixing volume is still critical for gradient stability. High pressure mixing pumps generally outperform low pressure mixing systems in terms of gradient dispersion, but again there is a critical slew rate/flow rate relationship to consider. A technique which may be employed to help address this issue is the use of a dynamic mixing volume, in which the volume is optimized for the flow rate. In all pump designs which utilize reciprocating pumps (those that require more than a single pump stroke for an analytical run) the presence of check valves and pressure dampers is critical for two reasons. The first is that the
1.00
0.75
0.50
0.25
6002520151050
Time (seconds)
High-precision gradient
Isocratic elution
Standard Gradient

Technical Note
www.appliedbiosystems.com
there must be a mechanism in place to prevent the high pressure solvent from flowing from one pump into the other during refill of the cylinder. The second reason is to remove the pressure spike from the system, which can damage the check valves and cause band broadening on the column. The pressure damper volume is also critical for the same reasons as the volume of the mixing volume is important. Regardless of the design, the mixer and pressure dampers affect the gradient stability and slew rates possible. The problems caused by the mixing and damper volumes contribute equally to systems which have been developed to deliver nano and capillary flows for advanced separation techniques, while using flow splitting to reduce the flow from the pumps to the applicable range. This not only provides poor reproducibility and separation, but wastes a great deal of non-recoverable solvent in most cases.
A more recent design involves the use of single stroke pumps with a low volume high pressure mixer. At low flow rates, the volume required for adequate mixing may be quite low, relying on diffusion only to achieve good solvent mixing. With single stroke pumps however, the total volume available for the analytical run is determined by the volume of the pumps. For this reason, these types of pumps are generally restricted to low flow applications, where it is physically easier to construct mechanisms and syringes that can deliver the required volumes at the elevated pressures needed. Historically, the first capillary and nano-flow systems used pneumatically driven liquid columns to deliver very consistent flow rates. This approach suffered greatly from the lack of feedback and accurate flow rate controls. Systems have been available that used mechanically driven syringe pumps and flow feedback to overcome this problem, however these systems can also suffer from small pressure pulses generated by the mechanical systems used to drive the syringe pistons. Recently, a technology has emerged which combines the advantages of the very smooth and consistent flows available with pneumatic pumping systems and sophisticated gas flow controls with electronic flow feedback to provide extremely high precision flow and gradient control at low flow rates. This technology is available in the Tempo™ LC systems from Applied Biosystems.
The Tempo™ LC products utilize a unique, electronically controlled pneumatically driven single stroke, dual pump system with high speed flow feedback and low volume mixing to provide the most precise and aggressive gradients possible. The Tempo™ LC system design eliminates all of the gradient dispersion elements present in traditional pump designs. There is no need at all for pressure dampers, as the pumps only deliver a single, smooth (no mechanically introduced “bumps”) stroke per run. To address the required volume per run, two designs are available in which the stroke volume is optimized to provide enough volume for typical nano and capillary applications. Furthermore, the mixing volume is extremely low, allowing for very fast gradients and rapid column equilibration. Since the system design replaces all of the mechanical components (motors, gears, cams, etc.) with electronically controlled gas flows and electronic flow monitoring, the potential for mechanical failure and mechanically induce pressure spikes is eliminated.
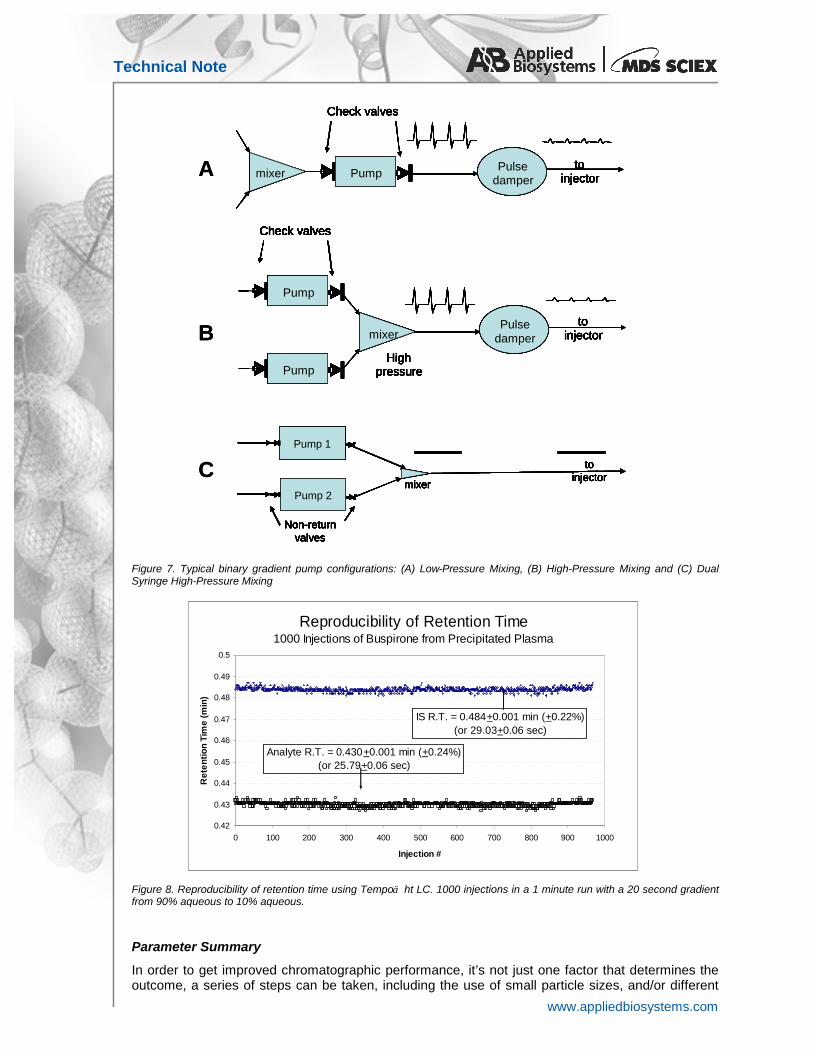
With the Tempo™ LC products, rapid gradients, such as complete aqueous to organic changes, can be done extremely fast (<30 seconds) and the “turnaround” time, i.e. equilibration time, can also be on the order of seconds (depending on the injector, tubing and column volumes). Figure 8 shows the reproducibility of retention time for buspirone from precipitated plasma for ~1000 injections using the Tempo ht LC system. The gradient method used for the separation was from 90% aqueous to 90% organic over 20 seconds. The total runtime was less than one minute.
Technical Note
www.appliedbiosystems.com
Figure 7. Typical binary gradient pump configurations: (A) Low-Pressure Mixing, (B) High-Pressure Mixing and (C) Dual Syringe High-Pressure Mixing
Figure 8. Reproducibility of retention time using Tempo ht LC. 1000 injections in a 1 minute run with a 20 second gradient from 90% aqueous to 10% aqueous.
Parameter Summary
In order to get improved chromatographic performance, it’s not just one factor that determines the outcome, a series of steps can be taken, including the use of small particle sizes, and/or different
Pulsedampermixer
toinjectorPump
Check valves
Pulsedampermixer
toinjectorPump
Check valves
Pulsedamper
toinjector
Pump
Check valves
PumpHigh
pressure
mixerPulse
damperto
injector
Pump
Check valves
Pump
Check valves
PumpHigh
pressure
mixer
toinjector
Pump 1
Pump 2
Non-returnvalves
mixer
toinjector
Pump 1
Pump 2
Non-returnvalves
mixer
A
B
C
Pulsedampermixer
toinjectorPump
Check valves
Pulsedampermixer
toinjectorPump
Check valves
Pulsedamper
toinjector
Pump
Check valves
PumpHigh
pressure
mixerPulse
damperto
injector
Pump
Check valves
Pump
Check valves
PumpHigh
pressure
mixer
toinjector
Pump 1
Pump 2
Non-returnvalves
mixer
toinjector
Pump 1
Pump 2
Non-returnvalves
mixer
Pulsedampermixer
toinjectorPump
Check valves
Pulsedampermixer
toinjectorPump
Check valves
Pulsedampermixer
toinjectorPump
Check valves
Pulsedampermixer
toinjectorPump
Check valves
Pulsedamper
toinjector
Pump
Check valves
PumpHigh
pressure
mixerPulse
damperto
injector
Pump
Check valves
Pump
Check valves
PumpHigh
pressure
mixerPulse
damperto
injector
Pump
Check valves
PumpHigh
pressure
mixerPulse
damperto
injector
Pump
Check valves
Pump
Check valves
PumpHigh
pressure
mixer
toinjector
Pump 1
Pump 2
Non-returnvalves
mixer
toinjector
Pump 1
Pump 2
Non-returnvalves
mixer
toinjector
Pump 1
Pump 2
Non-returnvalves
mixer
toinjector
Pump 1
Pump 2
Non-returnvalves
mixer
A
B
C
Reproducibility of Retention Time1000 Injections of Buspirone from Precipitated Plasma
0.42
0.43
0.44
0.45
0.46
0.47
0.48
0.49
0.5
0 100 200 300 400 500 600 700 800 900 1000
Injection #
Ret
entio
n Ti
me
(min
)
IS R.T. = 0.484+0.001 min (+0.22%)(or 29.03+0.06 sec)
Analyte R.T. = 0.430+0.001 min (+0.24%)(or 25.79+0.06 sec)

Technical Note
www.appliedbiosystems.com
column dimensions and packing chemistries, and/or high precision/resolution gradient elutions. Table 1 summarizes some critical factors that can be considered in order to achieve significant improvements in chromatographic resolution, sample throughput and sensitivity.
Factor Advantages Disadvantages
Longer column length Better separation, more theoretical plates Longer run times, higher back pressure
Smaller particle size Higher efficiency, shorter run times Higher back pressure, possible column robustness problems
Monolithic stationary phases Higher efficiency, shorter run times Higher flow rates
Smaller diameter columns Higher efficiency, better separations in shorter time
Smaller column loading, possible robustness problems
Higher flow rates Faster run times Reduced efficiency, higher back pressures, difficulty interface for ESI
Better gradient precision More efficient, faster separations Requires improved pumping technology
Higher pump pressure Faster runs at high efficiency Requires improved pumps & valves possible column stability issues
Higher temperature Reduced back pressure Column, analyte stability and reproducibility issues
Tools for Improving Chromatographic Separations: Examples As discussed above, there are many ways to optimize chromatographic separations for optimal resolution and speed of analysis, and these will be highlighted with the following examples:
ü Optimizing conventional chromatography
ü Smaller (1.8 µm particle size) column packings
ü Monolithic column technology
ü High precision low flow chromatography
Optimizing Conventional Chromatography
With any method development scenario, individual parameter optimization can have a significant impact on the overall quality of the data. As with mass spectral optimization, chromatographic optimization at the front end is just as critical. Optimizing conventional chromatography involves selection of any combination of parameters listed in Table 1, including column type, mobile phase, flow rate, etc. As old as chromatographic separation techniques are, there are continually new options available to develop a method that can produce a significant increase in sample throughput, resolution and sensitivity. One of the measures of chromatographic resolution typically employed by separation scientists is shown in Equation 3.
For low specificity detectors like UV, this was a necessary measure to keep in mind. If two adjacent peaks have an Rs value of 1.5 or greater, the two peaks would be baseline separated as a minimum. Any value less than 1.5 indicated some level of overlap of the adjacent peaks. Ultimately, for mass spectral detection, overlap of adjacent peaks is largely inconsequential because of the high level of specificity in MS/MS analysis, where individual MRM transitions typically don’t have any significant level of interference possibilities. Figure 9 shows this calculation on an LC/MS/MS analysis of benzodiazeines.
Rs = 2[(tr)B – (tr)A]____________
WA + WBRs =
2[(tr)B – (tr)A]____________WA + WB
Equation 3

Technical Note
www.appliedbiosystems.com
By monitoring the Rs value, one can evaluate many of the parameters responsible in the separation process, and ultimately decide on the best conditions possible for the analysis. An example of this is speeding up the elution process on the same column by simply increasing the flow rate of the mobile phase (Figure 10).
Figure 9 shows 8 analytes separated in 4.0 minutes under conventional chromatographic conditions (2.1x50 mm, 3 µm column, 250
µL/min). Figure 10 takes the same 8 analytes, column and mobile phase and increases the flow rate from 250 µL/min to 1000 µL/min. While there is a minor reduction in the Rs value, the analysis time was significantly improved from 4.0 minutes to less than 1.0 minute. This is a 4x improvement in throughput, without any significant loss in chromatographic resolution. Of importance here is the fact that MRM transitions are highly specific, which reduces the requirement of resolution and allows even faster chromatography. In general, the ability of a triple quadrupole mass spectrometer to utilize MS/MS to selectively monitor only a specific product ion of a parent compound can be used to reduce separation requirements unless (i) the number of MRM transitions which need to be monitored simultaneously begins to reduce the peak integrity by limiting the number of data points collected across the peak, or (ii), the MRM transitions used do not provide enough specificity due to interfering compounds (i.e. those with similar transitions) and the resolution of either the first or second quadrupole cannot be increased to reduce the overlap of interfering compounds. Typically, the flow rate increases which are practical are limited by the need to chromatographically separate compounds of interest from sample matrix, which can interfere with the ionization or MRM selectivity.
Rs = 1.0Rs = 1.0Rs = 1.0Rs = 1.0
Figure 10. 8 analyte separation at 250 µL/min (top) and 1000 µL/min (bottom).
Rs = 1.3Rs =
2[(tr)B – (tr)A]____________WA + WB
Rs = 2[(tr)B – (tr)A]____________
WA + WB
Rs = 1.3Rs =
2[(tr)B – (tr)A]____________WA + WB
Rs = 2[(tr)B – (tr)A]____________
WA + WB
Rs = 1.3Rs =
2[(tr)B – (tr)A]____________WA + WB
Rs = 2[(tr)B – (tr)A]____________
WA + WB
Rs = 1.3Rs =
2[(tr)B – (tr)A]____________WA + WB
Rs = 2[(tr)B – (tr)A]____________
WA + WB
Figure 9. Calculation of resolution on an LC/MS/MS analysis of benzodiazepines

Technical Note
www.appliedbiosystems.com
Small (1.8 µm) particle size column packing
Small particle size column packings can increase the speed of separations with higher linear velocities through the column, or increase the separation efficiency for a fixed analysis time. In
order to reduce the pressure required to drive the mobile phase, very narrow particle size distributions become critical as the particles become smaller; particularly as high pressure can cause issues with phase cracking and stability. Figure 11 shows the analysis of Alprazolam under conventional LC conditions using a standard binary pumping system and a comparative analysis using the same hardware, but a with an Agilent 1.8 µm rrHT column at double the flow rate.
Monolithic Column Technology
Monolithic column technology, which has only recently become commercially available, consists of one piece of an organic polymer or silica in which the continuous skeleton is laced with multimodal pores providing flow paths through the column as well as adsorption sites. This technology leads to higher separation efficiencies with higher flow rate capabilities than conventional 4.6 mm columns (1 – 9
mL/min) with little strain on pumping systems due to reduced backpressures. Furthermore the monolithic nature of these columns requires no frits or screens at the column ends, and the problems with column robustness due to the collection of fines and shifting are not observed.
Also during this time (ca 2001), the Turbo V™ source technology was developed. The major benefit of this new source technology was the ability to accept higher flow rates without the need to split
the flow prior to entering the MS system. The mass sensitive regime was extended to at least 1.0 mL/min which enabled significant increases in sensitivity. The extremely efficient ionization process led to significantly lower background conditions and hence S:N improvements. This development allowed conventional 4.6 mm columns and Monolithic column technology to be used without any flow splitting; taking full advantage of the high flow capabilities of the Turbo V™ source.
With the monolithic columns and the higher flow rates allowable, improvements in sample throughput and chromatographic resolution were realized. Figure 12 shows six analytes separated over a series of different flow rates through a monolithic column.
0.5 1.0 1.5 2.0 2.5 3.0 3.5 4.0 4.5Time, min
0.0
1.0e5
2.0e5
3.0e5
4.0e5
5.0e5
6.0e5
7.0e5
8.0e5
9.0e5
1.0e6
1.1e6
1.2e6
1.3e6
1.4e6
Intensity, cpsChromolith speedrodat 3mL/min
Chromolith speedrodat 6mL/min
Chromolith speedrodat 1mL/min
0.5 1.0 1.5 2.0 2.5 3.0 3.5 4.0 4.5Time, min
0.0
1.0e5
2.0e5
3.0e5
4.0e5
5.0e5
6.0e5
7.0e5
8.0e5
9.0e5
1.0e6
1.1e6
1.2e6
1.3e6
1.4e6
Intensity, cpsChromolith speedrodat 3mL/minChromolith speedrodat 3mL/min
Chromolith speedrodat 6mL/min
Chromolith speedrodat 1mL/min
Figure 12. Six analytes separated over a range of different flow rates through a monolithic column using the Turbo V Source
Conventional LC
Agilent 1.8 µm Columns& 1100 System600 µL/min
Conventional LC
Agilent 1.8 µm Columns& 1100 System600 µL/min
Figure 11. Alprazolam under conventional LC conditions (top) and using the same hardware with a 1.8 µm column (bottom).

Technical Note
www.appliedbiosystems.com
High Precision Low-Flow Chromatography with the Tempo™ ht LC System
Historically, increases in sensitivity and separation capabilities have been demonstrated with nano-LC and capillary LC. These techniques are attractive for quantitative studies, especially when the sample volumes available for analysis are limited and increased sensitivity is required. However, both techniques are also viewed as requiring more sophisticated operation and show poor throughput capabilities due to long re-equilibration times of the column under gradient conditions. The low volumes required for nano-LC and capillary LC have dictated that split-flow pumping mechanisms are required when conventional LC pump hardware is used. This approach suffers from reduced separation efficiency and precision because of impaired gradient reproducibility and band broadening.
Recently a novel front-end capillary LC system, the Tempo™ ht LC System, was introduced by Applied Biosystems/MDS Sciex. This chromatography system uses the pneumatic low flow mixing pump technology described earlier. It offers high precision and highly reproducible gradient delivery for efficient chromatographic separation for the quantification of small molecules.
Precise, accurate and reproducible gradients are critical for LC/MS/MS analyses, especially when comparing results from sample-to-sample, run-to-run, and lab-to-lab. The Tempo™ ht LC System combines Microfluidic Flow Control (MFC) with continuous, independent flow rate feedback for each mobile phase to maintain precise flow rate control. This advanced flow control eliminates flow splitting and the inherent flow inaccuracies associated with flow splitting, resulting in more accurate and reproducible gradients with less solvent consumption. The entire line of Tempo™ LC Systems use pressure modulated flow control as opposed to traditional reciprocating pumps, and require only one stroke per sample. There is no need for degassing or pulse damping.
The Tempo™ ht LC System was evaluated on speed of sample analysis, chromatographic resolution (separation) and quality of data (sensitivity, reproducibility and linear dynamic range). Comparison against conventional chromatography showed several key advantages;
ü shorter analysis times while maintaining resolution
ü reduction in solvent consumption,
ü better sensitivity (S:N)
ü smaller sample consumption due to the smaller injection volumes possible.
Several examples of these are shown below.
Chromatographic Speed & Resolution
The benzodiazepine sample set was run under several conventional LC conditions, including 250 µL/min and 2.0 mL/min flow rates. Figure 13 shows the difference between the 250 µL/min flow rate method and that achieved with the new Tempo™ ht LC System at 30 µL/min.
The separation was achieved using a rapid gradient on the Tempo™ ht LC System, which provided a turnaround time for the complete separation of less than 2 minutes, including the autosampler injection cycle. Furthermore, for the same injection volume, the capillary separation provided higher signal to noise ratios for all peaks, due to the narrower peak widths exhibited. The resolution obtained with the capillary separation was nearly identical to that achieved with the standard LC approach.

Technical Note
www.appliedbiosystems.com
Data Quality
Data quality is measured by a few, but important factors in quantitative LC/MS/MS applications; sensitivity of the technique, how reproducible the results are from injection-to-injection and the linear dynamic range of the analysis. Typical for LC/MS/MS applications, these factors are mainly a function of the front-end LC system employed to deliver the sample to the mass spectrometer. The LC system determines how fast the analysis can be done and how much solvent is required to complete the separation and delivery.
ü Sensitivity and Reproducibility Figure 14. Five replicate injections of 1.5 pg on column of prazepam. The %CV for the five replicate injections is 10%. Based on this level, the estimated limit of detection (LOD) is between 250 and 500 fg on column.
Conventional ChromatographyColumn: 2.1 x 50 mm, 3 µm C18Flow Rate: 250 µL/minRuntime: 4.0 minutesPeak widths: 6-7 sec FWHH30 pg on column
Tempo ht LC Column: 0.3 x 50 mm, 3 µm C18Flow Rate: 30 µL/minRuntime: 1.0 minutePeak widths: 1-2 sec FWHH30 pg on column
Conventional ChromatographyColumn: 2.1 x 50 mm, 3 µm C18Flow Rate: 250 µL/minRuntime: 4.0 minutesPeak widths: 6-7 sec FWHH30 pg on column
Tempo ht LC Column: 0.3 x 50 mm, 3 µm C18Flow Rate: 30 µL/minRuntime: 1.0 minutePeak widths: 1-2 sec FWHH30 pg on column
Figure 13. Conventional chromatographic separation techniques allowed a 4.0 minute runtime with sufficient separation from the void volume for the mixture of 8 benzodiazepines. Transferring this method to the Tempo ht LC system results in a 4x faster analysis time with better sensitivity, while maintaining chromatographic resolution and using >30x less solvent to do the separation.

Technical Note
www.appliedbiosystems.com
ü Linear Dynamic Range
Figure 15. A sample calibration curve for alprazolam with 5 replicate injections at each concentration level. The linear dynamic range shown is 4 orders of magnitude on a log/log scale.
Table 2. Analysis time and consumables are significantly reduced using the Tempo ht LC system. For the high flow rate scenario, 2.0 mL/min were used with a monolithic column. While the runtime was cut in half compared to the 250 µL/min analysis, a significantly larger amount of solvent was used. The Tempo ht LC system exceeds the other two techniques in terms of analysis time and solvent usage.
Important Considerations for Low Flow Chromatography
ü Requires training or experience with Capillary LC techniques • Fused Silica • Connections & Fittings
ü Requires change from standard HPLC methodology • Lower flow rates • Smaller injection volumes
ü Niche application areas • Metabolomics • Traditional Met ID approaches • High throughput screening
ü New Technology for small molecule applications
Tempo ht LC2.1 mm Column Monolithic Column
Flow (µL/min) 30 250 2000Analysis time (min) 1.0 4.0 2.0Solvent consumption (µL) 30 1000 4000# of Injection 35 35 35Total solvent consumption (µL) 1050 35000 140000Total solvent consumption (mL) 1.05 35 140Total Analysis Time (min) 35 140 70
Conventional LC

Technical Note
www.appliedbiosystems.com
Summary ü Many options are available to optimize throughput and data quality with readily available
hardware for chromatography
o Existing pumping systems can be used to elute from a wide range of columns (sizes, phases and particle sizes)
ü Small particle size columns available on the market can improve throughput and chromatographic resolution
ü Monolithic column technology allow much higher flow rate capabilities that lead to higher throughput and chromatographic resolution and can be used without splitting with the high efficiency Turbo V source technology
o Low backpressure leads to less stress on the pumping system
ü The Tempo™ LC systems are high precision, low flow chromatography systems that maintain chromatographic resolution with increased speed. Other advantages are, better sensitivity (S:N because of sharper peaks), low solvent consumption and the ability to inject lower sample volumes.
Applera is a trademark and Applied Biosystems and AB (design) are registered trademarks of Applera Corporation or its subsidiaries in the US and/or certain other countries.
Tempo and Turbo V are trademarks of Applied Biosystems/MDS SCIEX, a joint venture between Applera Corporation and MDS Inc.
All other trademarks are the sole property of their respective owners.
© 2006 Applera Corporation and MDS Inc. All Rights Reserved.