liquefied natural gas valuation approaches · liquefied natural gas | 20 august 2014 3 to continue...
TRANSCRIPT

20 August 2014
Liquefied Natural Gas is a research client of Edison Investment Research Limited
ADR research
Liquefied Natural Gas Limited (LNGL) ADRs have increased significantly in 2014, on the back of greater confidence in the Magnolia LNG project in Lake Charles and the proposed acquisition of the Bear Head LNG export project site. We review the Bear Head transaction (subject to standard closing) potential value and update our valuation, while taking the opportunity to assess the potential long-term value. While our current risked valuation of the company is below the ADR price, our analysis indicates long-term value well above. If LNGLY can deliver on its targets in Magnolia, there is still material upside, even if we discount the Bear Head acquisition, which could more than double the size of the company in time.
Year end Revenue (US$m)
PBT (US$m)
CFO (US$m)
Net (debt)/ cash (US$m)
Capex (US$m)
06/13 0.0 (12.1) (7.0) 1.4 (0.0) 06/14e 0.0 (12.7) (12.6) 45.8 (6.0) 06/15e 0.0 (18.8) (18.8) 45.1 (15.0)
Source: Edison Investment Research. Note: Converted at A$1.11/US$. Investors should consult their tax advisor regarding the application of any domestic and foreign tax laws.
Magnolia continues to progress Magnolia LNG continues to tick along in development. Since our initiation, the FERC application has been accepted and an EPC contract term sheet signed with SKEC. Next steps are completion of the FEED, development of a LSTK EPC price and finalization of a binding LSTK EPC Contract, after which debt finance has to be arranged. The company remains on track to deliver financial close in mid-2015.
Bear Head could be a compelling acquisition The US$11m acquisition of the Bear Head LNG project has the potential to more than double the size of the company in time. With a (current) 100% WI, LNGL could build a 4mtpa plant (or more), to supply the energy-hungry European market. The company can employ all its experience and contacts on Magnolia LNG to accelerate the project (already partially developed by Anadarko as an LNG import site) and it expects first LNG in 2019, leap-frogging others such as Goldboro LNG.
Valuation: Still long-term value LNGL shares have increased markedly in recent months, and reflect the market’s confidence in management and the technology to become a major LNG player. We have adjusted our risked DCF approach, which leads to an increase in value to US$70/ADR. However, we look into the future (2020-22) and the value implied by peer multiples. This backs up DCF analysis, confirming that multiples of the current value can be justified given the expected cash flows. If LNGL hits its targets, current investors will be well rewarded in the long term, but we caution that the first meaningful revenues from the projects will be in 2018 or later.
Liquefied Natural Gas Valuation approaches
Long-term value available
ADR price US$151 Market cap US$1,685m
ADR/Ord conversion ratio 1:40 Net cash (US$m) December 2014e
58.7
No. of ADRs in issue ADRs currently in circulation
11.16m 82,769
Free float N/A
ADR code LNGLY
ADR exchange OTC Pink
Underlying ASX
Depository Deutsche Bank
ADR price performance
52-week high/low N/A N/A
Business description
LNG Ltd is an ASX-listed company devoted to the development of LNG export terminals. The first project, Magnolia LNG, is planned to reach financial close in mid-2015 and start production in 2018. It has just acquired a further site in Nova Scotia, Bear Head LNG.
Next events
Final open-book cost estimates Q414
Binding tolling agreements Q414
Analysts
Will Forbes +44 (0)20 3077 5749
Ian McLelland +44 (0)20 3077 5756
Edison Profile Page
Oil & gas

Liquefied Natural Gas | 20 August 2014 2
Progress made at Magnolia
Magnolia LNG continues to tick along, and the company remains on track to hit financial close in mid-2015. We highlight the key milestones:
Approvals
On 30 April, Magnolia LNG filed a formal application with FERC (Federal Energy Regulatory Commission) for siting, construction, ownership and operation of Magnolia. This was accepted by FERC on 14 May. A similar FERC application was submitted by Kinder Morgan in mid-July.
The company expects that FERC will prepare a Draft EIS (DEIS) for public consultation in 2014, and then a Final Environmental Impact Statement (FEIS) will be published four months after. According to LNGL, FERC normally issues a conditional authorization 30-45 days after the FEIS. LNGL expects financial close in mid-2015.
We are particularly encouraged by the revised DOE process, which LNGL believes will enable it to “advance more quickly to its non-FTA authorisation because the trigger for commencement of the non-FTA process now is based on completion of the FERC NEPA process, rather than the old queue”.
Engineering and construction
In July, a lump sum turnkey EPC contract term sheet was signed for the first phase of Magnolia LNG. The next step is the final design to enable open-book EPC (engineering, procurement and construction) costs with a bankable lump sum turnkey EPC contract ready for execution at the end of November 2014.
Tolling agreements and financing
The company has four non-binding tolling agreements covering the 20-year life of the plants, agreeing fixed monthly capacity payments to Magnolia LNG. The contracts cover fixed and variable opex. Binding contracts are expected to be signed in Q414.
BNP Paribas was appointed as debt partner, and it is currently envisaged that it will be able to source the debt required for the remainder of the capex costs of the project (after Stonepeak’s c >$660m contribution). The company had indicated that the capital cost of Phase 1 would be US$2.2bn, of which the EPC cost component was estimated to be US$1.8bn. This compares with the preliminary cost estimate from SKEC (which will construct the facility) of US$1.54bn, which would imply an increased ownership of the project by LNGL, and higher NAV. At this stage, we retain our capex estimate and will revise it when the contract is signed, although we give sensitivities in the valuation section.
Bear Head acquisition
LNGL announced its acquisition (subject to standard closing conditions and consents) of the Bear Head LNG export terminal site (previously partially developed as an import terminal by an Anadarko subsidiary) in early June. For US$11m, LNGL gains the first leg of expansion from Magnolia and a project with many permits and approvals in place, and with a partially prepared site with deep-water access on the Atlantic coast. The company holds a 100% WI in the project at this time (and intends

Liquefied Natural Gas | 20 August 2014 3
to continue to hold this until at least FID in 2016) – the potential value of the first 4mtpa development could therefore equal the c 50% interest LNGL holding the 8mtpa Magnolia project, and there is scope for expansion. This is therefore a major acquisition.
Exhibit 1: Location of Bear Head is advantageous for export of gas discoveries
Source: LNGL
The existing site
The Bear Head project is located in Nova Scotia, close to Port Hawkesbury, and was initially developed by Anadarko as an LNG import terminal in 2005 and 2006. The site has been levelled and foundations for key items such as tankage have been laid as well as roads and drainage. The deep water harbor area is ice free and requires no dredging. These factors are complemented by a number of approvals and permits for the original project that should be able to be adapted for the proposed export terminal, saving time and money.
Exhibit 2: Partially developed site at Bear Head
Source: LNG Ltd

Liquefied Natural Gas | 20 August 2014 4
Exhibit 3: Initial project site – clearly space for future expansion
Source: LNGL
Gas supply
Before the Magnolia LNG project, the company had a number of disappointments where gas suppliers let it down (most recently in the Fisherman’s Landing project in Australia). As a result, the management resolved to invest in projects where either it could own the gas or where gas supply in the area was so large that the gas supply risk was minimized. This was a key reason for the location of Magnolia close to the shale gas plays (and extensive pipeline network) in the Southern US, and again key in Bear Head.
The site is just 36 miles from existing gas pipeline infrastructure linking Nova Scotia to Massachusetts, and from there the Marcellus Shale play. However, according to the company the pipeline is underutilized and gas flows away from Nova Scotia, implying it is an exporter of gas towards the US north-east. Additionally, the region has nascent shale and coal-seam gas exploration and the offshore is the focus of majors’ exploration programs (BP and Shell own significant offshore exploration acreage). On a national level, Canada produces 15bcf/d of gas, the fifth largest globally, while consuming only 10bcf/d (source BP Statistical Review), so gas sourcing from elsewhere is also possible.
The proposed Goldboro LNG plant nearby (a Pieridae Energy project), targeting 10mtpa with 2019 or 2020 start-up, is also being developed and underlines the volume of gas available in the area for export. The newest plant announcement is from Quicksilver Resources, which has announced
Liquefied Natural Gas | 20 August 2014 5
plans for a 20mtpa plant on the West Coast. It joins more than 10 other projects including from players such as Petronas and Shell.
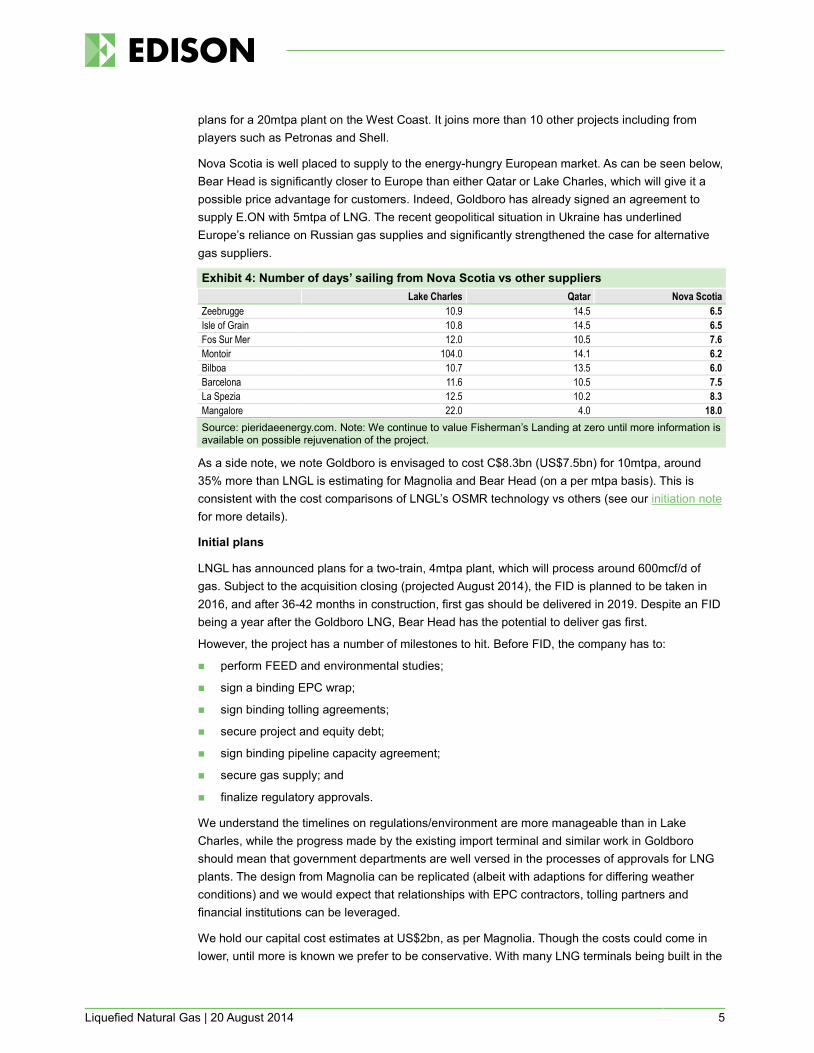
Nova Scotia is well placed to supply to the energy-hungry European market. As can be seen below, Bear Head is significantly closer to Europe than either Qatar or Lake Charles, which will give it a possible price advantage for customers. Indeed, Goldboro has already signed an agreement to supply E.ON with 5mtpa of LNG. The recent geopolitical situation in Ukraine has underlined Europe’s reliance on Russian gas supplies and significantly strengthened the case for alternative gas suppliers.
Exhibit 4: Number of days’ sailing from Nova Scotia vs other suppliers Lake Charles Qatar Nova Scotia Zeebrugge 10.9 14.5 6.5 Isle of Grain 10.8 14.5 6.5 Fos Sur Mer 12.0 10.5 7.6 Montoir 104.0 14.1 6.2 Bilboa 10.7 13.5 6.0 Barcelona 11.6 10.5 7.5 La Spezia 12.5 10.2 8.3 Mangalore 22.0 4.0 18.0 Source: pieridaeenergy.com. Note: We continue to value Fisherman’s Landing at zero until more information is available on possible rejuvenation of the project.
As a side note, we note Goldboro is envisaged to cost C$8.3bn (US$7.5bn) for 10mtpa, around 35% more than LNGL is estimating for Magnolia and Bear Head (on a per mtpa basis). This is consistent with the cost comparisons of LNGL’s OSMR technology vs others (see our initiation note for more details).
Initial plans
LNGL has announced plans for a two-train, 4mtpa plant, which will process around 600mcf/d of gas. Subject to the acquisition closing (projected August 2014), the FID is planned to be taken in 2016, and after 36-42 months in construction, first gas should be delivered in 2019. Despite an FID being a year after the Goldboro LNG, Bear Head has the potential to deliver gas first.
However, the project has a number of milestones to hit. Before FID, the company has to:
perform FEED and environmental studies;
sign a binding EPC wrap;
sign binding tolling agreements;
secure project and equity debt;
sign binding pipeline capacity agreement;
secure gas supply; and
finalize regulatory approvals.
We understand the timelines on regulations/environment are more manageable than in Lake Charles, while the progress made by the existing import terminal and similar work in Goldboro should mean that government departments are well versed in the processes of approvals for LNG plants. The design from Magnolia can be replicated (albeit with adaptions for differing weather conditions) and we would expect that relationships with EPC contractors, tolling partners and financial institutions can be leveraged.
We hold our capital cost estimates at US$2bn, as per Magnolia. Though the costs could come in lower, until more is known we prefer to be conservative. With many LNG terminals being built in the

Liquefied Natural Gas | 20 August 2014 6
coming years, there is a danger of cost escalation, as per Australian LNG schemes. We will be watchful.
Scope for expansion – 4mtpa almost certainly just the start
We believe the site has space for a further two trains of LNG, while acquisition of additional land could also be envisaged if required. This means that in the fullness of time, Bear Head could equal or surpass Magnolia in terms of capacity (8mtpa). With a (current) 100% WI, the project could also surpass Magnolia’s earnings.

Liquefied Natural Gas | 20 August 2014 7
Valuation
We have included the Bear Head acquisition in the valuation, though at a low CoS at this point given the very early stage of the project. We assume the Canadian corporate tax rate of 38% and a project ownership of 80%, allowing for some sell down of equity to fund development in the fullness of time. We assume similar EBITDA earnings to Magnolia.
In line with the company guidance, we have increased our estimated EBITDA for each 4mtpa phase of Magnolia to be US$380m. We also increase our CoS to apply to our DCF tool for the Magnolia and link Phase II to be more in line with Phase I, given our increased confidence in Phase II progressing, which results in a material pick-up in valuation from US$39/ADR to US$70/ADR. This is still below the current share price, which we believe is anticipating the successful completion of a number of milestones and upside as well as looking ahead to the value at Bear Head.
Exhibit 5: NAV summary Asset Net risked Value (US$)
Country CoS value Risked Unrisked % US$m /ADR /ADR
Net (debt)/cash 100% 59 5.1 5.1 SG&A(NPV of 4 years’ SG&A) 100% (13) (1.2) (1.2) Project development costs 2014/2015 100% (32) (0.1) (2.2) Bear Head acquisition costs 100% (11) (1.0) (1.0) Magnolia Trains 1 & 2 United States 50% 428 37.1 74.3 Magnolia Trains 3 & 4 United States 45% 313 27.1 60.3 Fisherman's Landing Australia 0% 0 0.0 48.3 Bear Head Canada 5% 55 4.7 94.7 NAV 805 70 278 Source: Edison Investment Research
Importantly, we are keeping the overall capex requirement for the each phase of the project at over US$2bn, above the US$1.57bn estimated by the SKEC. The effect of a reduction in the capital cost would be a material uplift in the value due to LNGL, as can be seen in the sensitivities table below.
Exhibit 6: Sensitivity Sensitivity to capex – trains 1 and 2 US$m 1,600 1,800 2,000 2,200 2,400 Percentage ownership of project 61% 57% 52% 48% 43% Unrisked NPV net to LNGL (US$m) 976 925 841 801 728 Change in unrisked NPV Trains 1 and 2 16% 10% 0% (5%) (13%) Source: Edison Investment Research
Multiples and future valuation
In this section we examine the potential valuation for the company once the plants are up and running. This will serve as a double check for our DCF valuation methodology and gives long-term investors an idea of potential returns given the current share price, especially given the strong performance of the equity in recent months.
Selection of peer group
There are very few companies with LNGL’s particular niche to compare. The obvious peer is Cheniere Energy (LNG US), which is employing a very similar business model but targeting much larger volumes and is a number of years ahead in terms of development. Apart from Cheniere, we

Liquefied Natural Gas | 20 August 2014 8
believe the utilities/pipeline companies provide a reasonable comparison due to the predictable cash flows they experience over time. We include both regulated and unregulated utilities and pipeline companies to give as wide a net as possible for comparison. With this comparison we are aware that it is not a perfect fit – the LNG projects have 20-year life, vs higher for many other assets, though LNGL offers growth potential in project that many utilities cannot.
Expansion of multiples over time for peers
The multiples for the peer group have expanded consistently over the last four years, and reflect an increasing optimism following the recovery from the global financial crisis. Dividend yields have declined to 3.7% from 5.1% in 2009 against 60% increases in shares, implying a 15% increase in overall dividend payments during the period. Earnings have not been enough to fund this increase – indeed free cash flow (pre-dividends) actually turned negative in 2012. The peer group has therefore re-leveraged to provide dividends, which makes sense given low interest rates globally. While, this cannot go on indefinitely, this historical series gives us a range of multiples that the peer group have traded on, to employ for LNGL valuation purposes.
Exhibit 7: Average multiples for peer group over the last 60 months
Source: Bloomberg. Note: This analysis excludes Cheniere Energy, due to lack of historic earnings.
We do this analysis not to provide forecasts of multiples and markets, but to illustrate how multiples vary over time. Market sentiment towards utilities may not be the same in 2018 or 2019 (when LNGL earnings will start to come through from phase I). As a result, our analysis below gives a number of scenarios to better show potential pricing.
Valuation scenarios
Our primary valuation tool at this time is DCF, as material cash flows from Magnolia LNG are some time away. Below, we show the growth in DCF value over from 2014-22; this uses our de-risking timeline described in our initiation note, but with the addition of the new Bear Head acquisition. This shows material growth in the value over time.
0
5
10
15
20
25
Jun 09 Dec 09 Jun 10 Dec 10 Jun 11 Dec 11 Jun 12 Dec 12 Jun 13 Dec 13 Jun 14
Peer
grou
p ave
rage
mult
iples
Current P/E EV/EBITDA Price/CF Dividend yield

Liquefied Natural Gas | 20 August 2014 9
Exhibit 8: NAV evolution over time, LNGL
Source: Edison Investment Research
However, we can also use the multiples above to infer a valuation for the company. In the analysis below, we use the financials from the plants in 2021 to apply to the ranges of multiples identified in the historical series above. We use cash flows from three scenarios: (i) Magnolia Phase I only, (ii) Magnolia Phase I and II, and (iii) Magnolia LNG and Bear Head. Naturally these result in ranges in the suggested valuations that may be expected once cash flows start. We note P/CFs imply lower valuations for LNGL – we suggest this is in part due to a higher tax rate than peers, which average c 20% to Magnolia LNG’s 38%.
Exhibit 9: Valuations implied by 2010-14 multiples for 2020 earnings
Source: Edison Investment Research, Bloomberg. Note: Ranges employed in analysis (min-average-max): EV/EBITDA 5.0-7.3-9.7, P/E 8.4-13.0-20.1, P/CF 5.8-6.6-9.4. Min/max represent the minimum average multiple seen across the peer group over the time period chosen (2009 to present).
The rough averages of the metrics employed suggest valuations in 2020 of around US$180/ADR for phase I alone with US$250/ADR for Phase II, though if we were to apply the current multiples (at the high range), these would be higher. These valuations expand further if we look ahead at cash flows in 2022, and the inclusion of cash flows from Bear Head (first 4mtpa).
70125
174224
274339
411479
0
100
200
300
400
500
600
2015 2016 2017 2018 2019 2020 2021 2022
Value
per A
DR $
Magnolia Trains 1&2 Magnolia Trains 3&4 Bear HeadIndicative NAV/ADR Current share price
0
100
200
300
400
500
Phas
e I:
EV/E
BITD
A 20
20
Phas
e I:
P/E
ratio
2020
Phas
e I:
P/CF
2020
DCF
valua
tion
(202
0)
Phas
e I&I
I:EV
/EBI
TDA
2020
Phas
e I&I
I:P/
E ra
tio 20
20
Phas
e I&I
I:P/
CF 20
20
DCF
valua
tion
(202
0)
Phas
e I&I
I&Be
ar:
EV/E
BITD
A 20
20
Phas
e I&I
I&Be
ar:
P/E
ratio
2020
Phas
e I&I
I&Be
ar:
P/CF
2020
DCF
valua
tion
(202
0)Valua
tions
impli
ed by
mult
iples
Range Average

Liquefied Natural Gas | 20 August 2014 10
Exhibit 10: Valuations implied by 2010-14 multiples for 2022 earnings
Source: Edison Investment Research, Bloomberg. Note: Ranges employed in analysis (min-average-max): EV/EBITDA 5.0-7.3-9.7, P/E 8.4-13.0-20.1, P/CF 5.8-6.6-9.4. Min/max represent the minimum average multiple seen across the peer group over the time period chosen (2009 to present).
This demonstrates the very material upside available from the shares in the long term if the plants come online as we expect.
Exhibit 11: Potential returns Share price/ADR price 2020 CAGR implied from current share price A$3/share : US$108/ADR -5% A$4/share : US$144/ADR 3% A$6/share : US$216/ADR 7% A$8/share : US$288/ADR 12% A$10/share : US$360/ADR 16% A$12/share : US$432/ADR 20% A$14/share : US$504/ADR 23% A$16/share : US$576/ADR 26% A$18/share : US$648/ADR 28% Source: Edison Investment Research
However, the utility of these charts/valuations are contingent on two main points: (i) the cash flow estimates being accurate, and (ii) the applicability of the multiples being used in more than five years. We are explicitly not forecasting peer group multiples more than five years in the future (we are using past multiples for framing purposes) and there are a number of uncertainties around cash flows (not least the final Bear Head ownership percentage and EBITDA contribution).
Financials Since our initiation, the company has executed two equity raises, raising a combined A$88m (gross) to fund final pre-FID costs at Magnolia, Bear Head acquisition costs, and cash to fund further development. We expect the company to receive around US$66m in success fees at financial close of Magnolia. The cash on hand and these bonuses should be enough to fund the company administration expenses for a number of years, but will not be enough to fund the equity portion of Bear Head development costs. The company has a number of options to obtain this cash: (i) an equity sell down of Bear Head, similar to Magnolia, (although we would expect better terms); (ii) a corporate bond may be possible; and (iii) equity raise at the parent company level – at current valuations, such a raise would not be hugely dilutive. With FID not until 2016, the company has plenty of time to consider the options.
0100200300400500600700800900
Phas
e I:
EV/E
BITD
A 20
22
Phas
e I:
P/E
ratio
2022
Phas
e I:
P/CF
2022
DCF
valua
tion
(202
2)
Phas
e I&I
I:EV
/EBI
TDA
2022
Phas
e I&I
I:P/
E ra
tio 20
22
Phas
e I&I
I:P/
CF 20
22
DCF
valua
tion
(202
2)
Phas
e I&I
I&Be
ar:
EV/E
BITD
A 20
22
Phas
e I&I
I&Be
ar:
P/E
ratio
2022
Phas
e I&I
I&Be
ar:
P/CF
2022
DCF
valua
tion
(202
2)
Valua
tions
impli
ed by
mult
iples
Range Average

Liquefied Natural Gas | 20 August 2014 11
Exhibit 12: Financial summary US$000s 2011 2012 2013 2014e 2015e Year end June IFRS IFRS IFRS IFRS IFRS PROFIT & LOSS Revenue 0 0 0 0 0 Cost of Sales 605 748 171 107 263 Gross Profit 605 748 171 107 263 EBITDA (8,546) (15,688) (12,186) (12,746) (19,017) Operating Profit (before amort. and except.) (8,617) (15,748) (12,236) (12,771) (19,067) Intangible Amortisation 0 0 0 0 0 Exceptionals 0 0 0 0 0 Other 0 0 0 0 0 Operating Profit (8,617) (15,748) (12,236) (12,771) (19,067) Net Interest (2,170) 748 170 104 263 Profit Before Tax (norm) (10,786) (15,000) (12,066) (12,666) (18,803) Profit Before Tax (FRS 3) (10,786) (15,000) (12,066) (12,666) (18,803) Tax 0 0 0 0 0 Profit After Tax (norm) (10,786) (15,000) (12,066) (12,666) (18,803) Profit After Tax (FRS 3) (10,786) (15,000) (12,066) (12,666) (18,803) Average Number of ADRs (m) 5.3 6.7 6.7 11.2 11.5 EPS - normalised (2.0) (2.2) (1.8) (1.1) (1.6) EPS - normalised and fully diluted (2.0) (2.2) (1.8) (1.1) (1.6) EPS - (IFRS) (2.0) (2.2) (1.8) (1.1) (1.6) Dividend per share 0.0 0.0 0.0 0.0 0.0 Gross Margin (%) N/A N/A N/A N/A N/A EBITDA Margin (%) N/A N/A N/A N/A N/A Operating Margin (before GW and except.) (%) N/A N/A N/A N/A N/A BALANCE SHEET Fixed Assets 3,658 6,761 544 6,083 21,019 Intangible Assets 0 0 0 5,327 18,814 Tangible Assets 332 226 111 756 2,205 Investments 3,325 6,534 434 0 0 Current Assets 7,384 8,260 2,372 47,179 46,443 Stocks 0 0 0 0 0 Debtors 266 159 36 398 398 Cash 5,233 6,203 1,425 45,845 45,110 Other 1,885 1,898 911 936 936 Current Liabilities (816) (1,085) (1,236) (1,652) (1,652) Creditors (809) (1,085) (1,236) (1,650) (1,650) Short term borrowings (7) 0 0 (2) (2) Long Term Liabilities (184) (291) (271) (341) (341) Long term borrowings 0 0 0 0 0 Other long term liabilities (184) (291) (271) (341) (341) Net Assets 10,042 13,644 1,410 51,269 65,469 CASH FLOW Operating Cash Flow (9,315) (8,308) (6,961) (12,570) (18,754) Net Interest 0 0 0 0 0 Tax 0 0 0 0 0 Capex (20) (29) (9) (5,955) (14,985) Acquisitions/disposals 0 0 0 0 0 Financing (5,528) 9,314 2,185 62,812 33,003 Dividends (255) (6) 8 146 0 Net Cash Flow (15,118) 970 (4,777) 44,432 (736) Opening net debt/(cash) (20,336) (5,226) (6,203) (1,425) (45,843) HP finance leases initiated 0 0 0 0 0 Other 8 6 (1) (14) 0 Closing net debt/(cash) (5,226) (6,203) (1,425) (45,843) (45,107) Source: Company accounts, Edison Investment Research

Liquefied Natural Gas | 20 August 2014 12
Edison, the investment intelligence firm, is the future of investor interaction with corporates. Our team of over 100 analysts and investment professionals work with leading companies, fund managers and investment banks worldwide to support their capital markets activity. We provide services to more than 400 retained corporate and investor clients from our offices in London, New York, Frankfurt, Sydney and Wellington. Edison is authorised and regulated by the Financial Conduct Authority (www.fsa.gov.uk/register/firmBasicDetails.do?sid=181584). Edison Investment Research (NZ) Limited (Edison NZ) is the New Zealand subsidiary of Edison. Edison NZ is registered on the New Zealand Financial Service Providers Register (FSP number 247505) and is registered to provide wholesale and/or generic financial adviser services only. Edison Investment Research Inc (Edison US) is the US subsidiary of Edison and is regulated by the Securities and Exchange Commission. Edison Investment Research Limited (Edison Aus) [46085869] is the Australian subsidiary of Edison and is not regulated by the Australian Securities and Investment Commission. Edison Germany is a branch entity of Edison Investment Research Limited [4794244]. www.edisongroup.com DISCLAIMER Copyright 2014 Edison Investment Research Limited. All rights reserved. This report has been commissioned by Liquefied Natural Gas and prepared and issued by Edison for publication globally. All information used in the publication of this report has been compiled from publicly available sources that are believed to be reliable, however we do not guarantee the accuracy or completeness of this report. Opinions contained in this report represent those of the research department of Edison at the time of publication. The securities described in the Investment Research may not be eligible for sale in all jurisdictions or to certain categories of investors. This research is issued in Australia by Edison Aus and any access to it, is intended only for "wholesale clients" within the meaning of the Australian Corporations Act. The Investment Research is distributed in the United States by Edison US to major US institutional investors only. Edison US is registered as an investment adviser with the Securities and Exchange Commission. Edison US relies upon the "publishers' exclusion" from the definition of investment adviser under Section 202(a)(11) of the Investment Advisers Act of 1940 and corresponding state securities laws. As such, Edison does not offer or provide personalised advice. We publish information about companies in which we believe our readers may be interested and this information reflects our sincere opinions. The information that we provide or that is derived from our website is not intended to be, and should not be construed in any manner whatsoever as, personalised advice. Also, our website and the information provided by us should not be construed by any subscriber or prospective subscriber as Edison’s solicitation to effect, or attempt to effect, any transaction in a security. The research in this document is intended for New Zealand resident professional financial advisers or brokers (for use in their roles as financial advisers or brokers) and habitual investors who are “wholesale clients” for the purpose of the Financial Advisers Act 2008 (FAA) (as described in sections 5(c) (1)(a), (b) and (c) of the FAA). This is not a solicitation or inducement to buy, sell, subscribe, or underwrite any securities mentioned or in the topic of this document. This document is provided for information purposes only and should not be construed as an offer or solicitation for investment in any securities mentioned or in the topic of this document. A marketing communication under FCA Rules, this document has not been prepared in accordance with the legal requirements designed to promote the independence of investment research and is not subject to any prohibition on dealing ahead of the dissemination of investment research. Edison has a restrictive policy relating to personal dealing. Edison Group does not conduct any investment business and, accordingly, does not itself hold any positions in the securities mentioned in this report. However, the respective directors, officers, employees and contractors of Edison may have a position in any or related securities mentioned in this report. Edison or its affiliates may perform services or solicit business from any of the companies mentioned in this report. The value of securities mentioned in this report can fall as well as rise and are subject to large and sudden swings. In addition it may be difficult or not possible to buy, sell or obtain accurate information about the value of securities mentioned in this report. Past performance is not necessarily a guide to future performance. Forward-looking information or statements in this report contain information that is based on assumptions, forecasts of future results, estimates of amounts not yet determinable, and therefore involve known and unknown risks, uncertainties and other factors which may cause the actual results, performance or achievements of their subject matter to be materially different from current expectations. For the purpose of the FAA, the content of this report is of a general nature, is intended as a source of general information only and is not intended to constitute a recommendation or opinion in relation to acquiring or disposing (including refraining from acquiring or disposing) of securities. The distribution of this document is not a “personalised service” and, to the extent that it contains any financial advice, is intended only as a “class service” provided by Edison within the meaning of the FAA (ie without taking into account the particular financial situation or goals of any person). As such, it should not be relied upon in making an investment decision. To the maximum extent permitted by law, Edison, its affiliates and contractors, and their respective directors, officers and employees will not be liable for any loss or damage arising as a result of reliance being placed on any of the information contained in this report and do not guarantee the returns on investments in the products discussed in this publication. FTSE International Limited (“FTSE”) © FTSE 2014. “FTSE®” is a trade mark of the London Stock Exchange Group companies and is used by FTSE International Limited under license. All rights in the FTSE indices and/or FTSE ratings vest in FTSE and/or its licensors. Neither FTSE nor its licensors accept any liability for any errors or omissions in the FTSE indices and/or FTSE ratings or underlying data. No further distribution of FTSE Data is permitted without FTSE’s express written consent.
Frankfurt +49 (0)69 78 8076 960 Schumannstrasse 34b 60325 Frankfurt Germany
London +44 (0)20 3077 5700 280 High Holborn London, WC1V 7EE United Kingdom
New York +1 646 653 7026 245 Park Avenue, 39th Floor 10167, New York US
Sydney +61 (0)2 9258 1161 Level 25, Aurora Place 88 Phillip St, Sydney NSW 2000, Australia
Wellington +64 (0)48 948 555 Level 15, 171 Featherston St Wellington 6011 New Zealand