lipidomics profiling of goose granulosa cell model of
TRANSCRIPT

Yuan et al. Cell Biosci (2021) 11:95 https://doi.org/10.1186/s13578-021-00604-6
RESEARCH
Lipidomics profiling of goose granulosa cell model of stearoyl-CoA desaturase function identifies a pattern of lipid droplets associated with follicle developmentXin Yuan , Shenqiang Hu, Liang Li, Chunchun Han, Hehe Liu, Hua He, Lu Xia, Jiwei Hu, Bo Hu, Mingxia Ran, Yali Liu and Jiwen Wang*
Abstract
Background: Despite their important functions and nearly ubiquitous presence in cells, an understanding of the biology of intracellular lipid droplets (LDs) in goose follicle development remains limited. An integrated study of lipi-domic and transcriptomic analyses was performed in a cellular model of stearoyl-CoA desaturase (SCD) function, to determine the effects of intracellular LDs on follicle development in geese.
Results: Numerous internalized LDs, which were generally spherical in shape, were dispersed throughout the cytoplasm of granulosa cells (GCs), as determined using confocal microscopy analysis, with altered SCD expression affecting LD content. GC lipidomic profiling showed that the majority of the differentially abundant lipid classes were glycerophospholipids, including PA, PC, PE, PG, PI, and PS, and glycerolipids, including DG and TG, which enriched glycerophospholipid, sphingolipid, and glycerolipid metabolisms. Furthermore, transcriptomics identified differentially expressed genes (DEGs), some of which were assigned to lipid-related Gene Ontology slim terms. More DEGs were assigned in the SCD-knockdown group than in the SCD-overexpression group. Integration of the significant differen-tially expressed genes and lipids based on pathway enrichment analysis identified potentially targetable pathways related to glycerolipid/glycerophospholipid metabolism.
Conclusions: This study demonstrated the importance of lipids in understanding follicle development, thus provid-ing a potential foundation to decipher the underlying mechanisms of lipid-mediated follicle development.
Keywords: SCD, Gene expression, Goose granulosa cells, Ovarian follicles, Lipid droplets
© The Author(s) 2021. This article is licensed under a Creative Commons Attribution 4.0 International License, which permits use, sharing, adaptation, distribution and reproduction in any medium or format, as long as you give appropriate credit to the original author(s) and the source, provide a link to the Creative Commons licence, and indicate if changes were made. The images or other third party material in this article are included in the article’s Creative Commons licence, unless indicated otherwise in a credit line to the material. If material is not included in the article’s Creative Commons licence and your intended use is not permitted by statutory regulation or exceeds the permitted use, you will need to obtain permission directly from the copyright holder. To view a copy of this licence, visit http:// creat iveco mmons. org/ licen ses/ by/4. 0/. The Creative Commons Public Domain Dedication waiver (http:// creat iveco mmons. org/ publi cdoma in/ zero/1. 0/) applies to the data made available in this article, unless otherwise stated in a credit line to the data.
BackgroundLipids are a highly diverse class of molecules key to many cellular processes, including energy storage, structural moieties, signaling molecules, and protein modifica-tion [1, 2]. Lipids have been loosely defined as biological
substances that are generally hydrophobic in nature and, in many cases, soluble in organic solvents. These chemi-cal properties include a broad range of molecules, includ-ing fatty acids, phospholipids, sterols, sphingolipids, terpenes, with each having a role in living systems [3]. Lipid metabolism involves numerous interwoven path-ways; these networks are essential for regulating cell function, which is influenced by many external factors. Imbalanced changes in lipid composition can even affect various physiological functions of the cell [4]. Lipid over-load results in lipotoxicity, which initially manifests as
Open Access
Cell & Bioscience
*Correspondence: [email protected] Farm Animal Genetic Resources Exploration and Innovation Key Laboratory of Sichuan Province, College of Animal Science and Technology, Sichuan Agricultural University, Chengdu 611130, People’s Republic of China

Page 2 of 17Yuan et al. Cell Biosci (2021) 11:95
organelle dysfunction, ultimately leading to cell death and tissue damage [5, 6]. Evidently, deregulation of this network contributes to the onset of pathology as lipids are tightly regulated, both spatially and temporally, in various parts of the organism [7, 8]. Many lipid molecu-lar species have been identified as potential biomarkers involved in several diseases, including, epidemic diseases, cancers, inflammation, and genetic diseases [9].
Intracellular lipid droplets (LDs) occur through the deposition of lipid complex molecular pathways. They are found in a wide variety of cell types, and are viewed as highly dynamic organelles with unique spherical struc-tures, of which primary neutral lipids are mainly sterol esters and triacylglycerols (TGs) [10, 11]. LDs affect cell and organ health and contribute to the dynamics of bio-logical membranes, energy storage and expenditure, and conveying messages at all cellular levels, including in the nucleus [12, 13]. Despite their important functions and nearly ubiquitous presence in cells, many aspects of LD biology are unknown. We have previously confirmed that de novo lipogenesis occurs in goose GCs [14] and that LD accumulation capacity depends on the stage of granu-losa cells (GCs) during goose follicle development [15]. It has been reported that lipid metabolism in bovine, sheep, and human GCs is pivotal for oocyte maturation, fertili-zation, and early embryonic development [16–19]. Lipid content in follicles differs among species, as reported in studies performed in porcine [20], bovine [21], and canine oocytes [22], wherein LD number, size, and dis-tribution were analyzed. However, an understanding of the biology of LDs in GCs remains limited. Recently, the role of stearoyl-CoA desaturase (SCD) as a regulator of fatty acid desaturation in goose GCs was identified, whereby metabolite changes in lipid-related metabolism were found to be closely related to follicular development [23]. Although this observation indicated that such links might exist, it is unclear whether LDs play a role in goose follicle development and which lipid species or classes might be affected. It is therefore hypothesized that lipi-domic analysis of the goose GCs at the level of individual lipid molecular species might help to elucidate such a mechanism.
Lipidomics comprises the characterization of an organ-ism’s differences in individual lipid molecular species and their biological roles with respect to the expression of proteins involved in lipid metabolism and function [24, 25]. Thus, to obtain a detailed view of lipid metabolism, it is crucial to analyze the full lipid profiles of the individual lipids using a lipidomics approach. This is the first time that a combination of lipidomics and transcriptomics analysis has been applied to the GC model of SCD func-tion to identify alterations in the regulation of specific gene, lipid classes, and lipid-mediated signaling processes
that are involved in LDs associated with follicle devel-opment in geese. The detailed characterization of lipid classes and species provided in this study might be useful to understand the mechanism of intramyocellular LDs, and an analysis based on integrating two-omics datasets will broaden our understanding of lipid alterations with respect to lipid-gene networks in GCs associated with follicle development.
ResultsLD distribution in goose GCsPrevious studies have demonstrated that de novo lipo-genesis occurs in goose ovarian GCs, which have lipid accumulation capacity [15]. To investigate the locali-zation of LDs in goose GCs, confocal microscopy was used to analyze LD location in goose GCs stained with BODIPY (500/510, green). GCs contained numerous internalized LDs that were generally spherical in shape and dispersed throughout the cytoplasm (Fig. 1). The dis-persed LDs clumped to form clusters. The mobility of the dispersed LDs was from the perinuclear regions to the extracellular domain.
Altered SCD expression affects LD contentTo further investigate the effect of SCD expression on LDs in GCs, the LDs were stained with Oil Red O after SCD-overexpression and knockdown (Fig. 2a, b). The accumulation of LD content was quantified using appro-priate equations (see “Materials and methods” section for details). Compared with that in the control group, the overexpression of SCD significantly stimulated the accu-mulation of LD content. However, SCD knockdown sig-nificantly inhibited the accumulation of LDs (Fig. 2c).
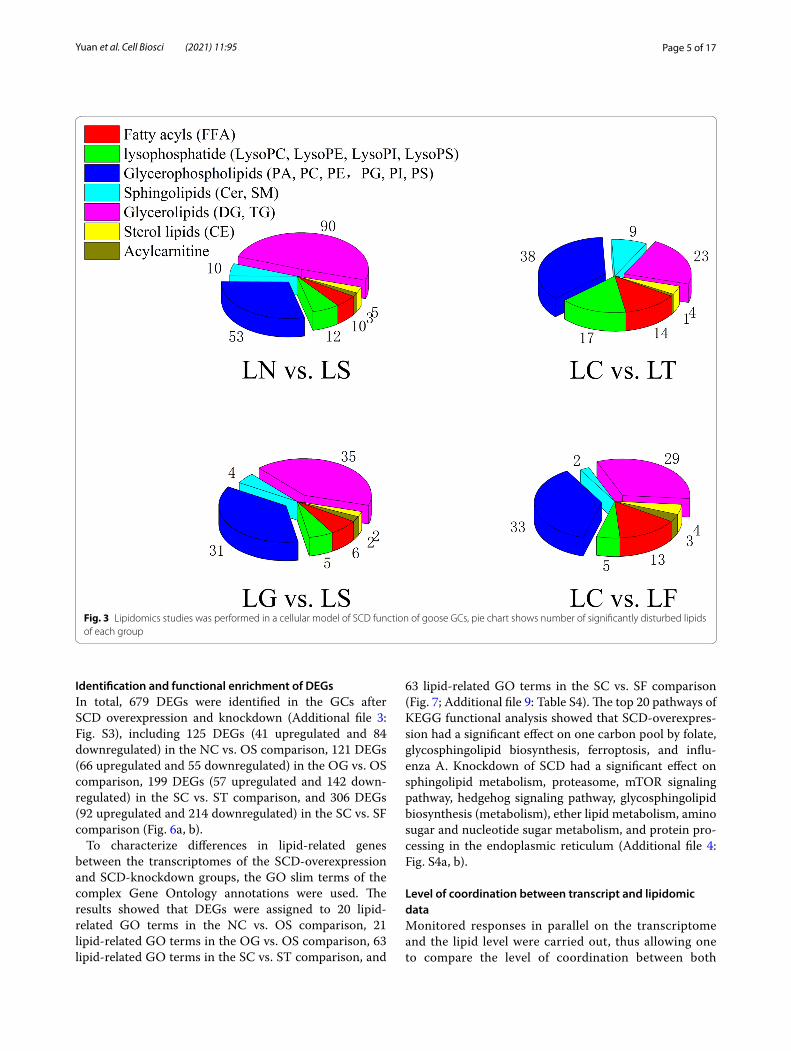
Analysis of lipid classesIn total, 662 species of lipids were identified in the GC samples using LC–MS/MS analysis (Additional file 1: Fig. S1). There were 183 different lipids identified in the control group (referred to as LN) vs. SCD-overexpres-sion group (referred to as LS) comparison (165 upreg-ulated and 18 downregulated) based on fold-change analysis (variable importance in projection [VIP] > 1, fold-change [FC] > 1.2), 85 lipids in the GFP vector group (referred to as LG) vs. LS comparison (36 upreg-ulated and 49 downregulated), 90 lipids in the scram-bled siRNA group (referred to as LC) vs. siRNA-210 (referred to as LT) comparison (45 upregulated and 45 downregulated), and 106 lipids in the LC vs. siRNA-470 (referred to as LF) comparison (86 upregulated and 20 downregulated). Glycerophospholipids and glycerolip-ids were the predominant lipid species (Fig. 3; Addi-tional file 6: Table S1). Venn diagram analysis revealed 26 overlapping lipids in the SCD-overexpression group,

Page 3 of 17Yuan et al. Cell Biosci (2021) 11:95
35 overlapping lipids in the SCD-knockdown group, and nine overlapping lipids in the SCD-overexpression and SCD-knockdown groups (Additional file 2: Fig. S2). As shown in Table 1 and Fig. 4, 19 lipids followed the same trend, whereas seven lipids showed the opposite pattern, as compared to that of the two overexpress-ing groups (LN vs. LS comparison and LG vs. LS com-parison). Thirty-three lipids followed the same trend, whereas two lipids showed the opposite pattern, as compared to that of the two knockdown groups (LC vs. LT comparison and LC vs. LF comparison). Seven lipids followed the same trend, whereas two lipids showed the opposite pattern between the overexpressed and knockdown groups.
Cross comparisons between and within each groupWith the aid of the KEGG database, metabolic pathways are summarized in Additional file 7: Table S2 based on the identified lipids. In total, 183 lipids were associated with 57 metabolic pathways in the LN vs. LS compari-son, 85 lipids with 40 metabolic pathways in the LG vs. LS comparison, 90 lipids with 46 metabolic pathways in the LC vs. LT comparison, and 106 lipids with 42 meta-bolic pathways in the LC vs. LF comparison. Figures 5a, b represent the perturbed SCD-associated pathways, the results of which are as follows: for LN vs. LS, glyc-erophospholipid, arachidonic, sphingolipid, and glyc-erolipid metabolisms altered significantly; for LG vs. LS, glycerophospholipid, sphingolipid, glycerolipid, and
Fig. 1 Distribution of lipid droplets (LDs) and their colocalization in live goose granulosa cells. LDs were stained with the neutral lipid dye Bodipy 500/510 (green), cell membrane were stained with WGA (red), the nuclei were stained with Hoechst 33258 (blue). All images are equal magnification, scale bar indicates 40 μm

Page 4 of 17Yuan et al. Cell Biosci (2021) 11:95
inositol phosphate metabolisms altered significantly; for LC vs. LT, glycerophospholipid, sphingolipid, glyc-erolipid, and inositol phosphate metabolisms altered significantly; and for LC vs. LF, glycerophospholipid, sphingolipid, glycerolipid, and inositol phosphate metab-olisms altered significantly.
RNA‑seq investigation of overexpression and knockdown of SCD expression in GCsTo obtain a comprehensive view of the role of the SCD gene in GCs, the six groups of cells (SCD-over-expression group [referred to as OS], GFP vector
group [referred to as OG], control group [referred to as LN], siRNA-210 group [referred to as ST], siRNA-470 group [referred to as SF], scrambled siRNA group [referred to as LC]) were subjected to RNA-seq anal-ysis. According to the RNA-seq data, 51.56, 53.78, 55.70, 57.70, 51.65, and 56.19 million clean reads were obtained from the NC, OS, OG, SC, ST, and SF sam-ples, respectively. For each sample, 37.69, 38.67, 40.04, 42.60, 37.88, and 41.30 million unique reads could be mapped to the current version of the goose genome (Anser cygnoides) (Table 2). The basic characteristics of the tags in each sample library are shown in Addi-tional file 8: Table S3.
Fig. 2 After culturing, cells were fixed with formaldehyde and stained with Oil red O, scale bar indicates 200 μm. a The cells were after SCD expression. b The cells were after SCD knockdown. c Relative LD content. The results are shown as mean ± SD from six experiments, the data were analyzed by ANOVA and Tukey’s test. The lowercase letter indicates significant differences between each group (P < 0.05)
Page 5 of 17Yuan et al. Cell Biosci (2021) 11:95
Identification and functional enrichment of DEGsIn total, 679 DEGs were identified in the GCs after SCD overexpression and knockdown (Additional file 3: Fig. S3), including 125 DEGs (41 upregulated and 84 downregulated) in the NC vs. OS comparison, 121 DEGs (66 upregulated and 55 downregulated) in the OG vs. OS comparison, 199 DEGs (57 upregulated and 142 down-regulated) in the SC vs. ST comparison, and 306 DEGs (92 upregulated and 214 downregulated) in the SC vs. SF comparison (Fig. 6a, b).
To characterize differences in lipid-related genes between the transcriptomes of the SCD-overexpression and SCD-knockdown groups, the GO slim terms of the complex Gene Ontology annotations were used. The results showed that DEGs were assigned to 20 lipid-related GO terms in the NC vs. OS comparison, 21 lipid-related GO terms in the OG vs. OS comparison, 63 lipid-related GO terms in the SC vs. ST comparison, and
63 lipid-related GO terms in the SC vs. SF comparison (Fig. 7; Additional file 9: Table S4). The top 20 pathways of KEGG functional analysis showed that SCD-overexpres-sion had a significant effect on one carbon pool by folate, glycosphingolipid biosynthesis, ferroptosis, and influ-enza A. Knockdown of SCD had a significant effect on sphingolipid metabolism, proteasome, mTOR signaling pathway, hedgehog signaling pathway, glycosphingolipid biosynthesis (metabolism), ether lipid metabolism, amino sugar and nucleotide sugar metabolism, and protein pro-cessing in the endoplasmic reticulum (Additional file 4: Fig. S4a, b).
Level of coordination between transcript and lipidomic dataMonitored responses in parallel on the transcriptome and the lipid level were carried out, thus allowing one to compare the level of coordination between both
Fig. 3 Lipidomics studies was performed in a cellular model of SCD function of goose GCs, pie chart shows number of significantly disturbed lipids of each group

Page 6 of 17Yuan et al. Cell Biosci (2021) 11:95
Table 1 Statistical analysis of differential lipids for four cross-comparisons
Molecular species Vip Fold change p‑vaule Vip Fold change p‑vauleComparison I: LN vs. LS comparison Comparison II: LG vs. LS comparison
FFA(22:2) 1.64 1.81 0.094 2.38 1.54 0.141
PC(18:0/14:1) 1.56 0.83 0.219 1.21 0.83 0.467
PC(16:0/20:3) 2.10 0.68 0.038 2.83 0.71 0.054
PC(18:1/18:4) 1.97 0.61 0.032 2.07 0.77 0.168
PC(20:5/18:0) 1.25 1.28 0.251 1.81 1.29 0.224
PC(18:2/20:3) 1.46 0.64 0.259 1.12 1.26 0.626
CE(20:4) 1.42 1.52 0.198 1.71 1.32 0.321
DG(18:2/22:4/0:0) 1.38 0.79 0.341 1.37 1.27 0.440
LPC(18:3/0:0) 1.21 1.52 0.334 1.04 1.23 0.503
PC(18:2/20:4) 1.38 0.67 0.163 1.46 0.75 0.354
PC(O-18:2/20:2) 1.28 1.53 0.228 1.16 1.24 0.480
PE(22:2/12:0) 1.37 0.55 0.158 2.01 0.43 0.171
PE(22:2/14:0) 1.70 1.55 0.145 1.36 1.21 0.386
PE(20:1/20:5) 1.52 1.87 0.081 2.33 1.55 0.131
PS(20:4/20:0) 1.04 1.23 0.359 2.23 1.22 0.199
PS(20:5/18:0) 1.36 1.40 0.239 1.33 1.23 0.389
SM(d18:0/18:0) 1.13 0.71 0.306 1.14 0.71 0.444
SM(d18:0/18:1) 1.52 1.42 0.156 2.20 0.78 0.195
TG(14:0/18:0/18:0) 1.53 1.41 0.154 1.52 0.83 0.315
TG(14:0/22:0/22:2) 1.94 2.12 0.035 2.13 1.48 0.195
TG(14:0/22:1/22:2) 1.20 1.57 0.251 2.13 1.48 0.233
TG(12:0/18:1/18:3) 1.73 1.42 0.107 1.95 0.79 0.196
TG(14:0/18:2/18:3) 2.09 1.60 0.012 1.58 0.76 0.369
TG(16:0/16:1/18:4) 1.87 1.51 0.048 1.61 0.82 0.288
TG(14:0/18:4/20:1) 1.38 1.51 0.195 2.09 0.64 0.179
TG(14:0/18:3/22:3) 1.06 1.80 0.404 1.08 1.56 0.488
Comparison III: LC vs. LT comparison Comparison IV: LC vs. LF comparison
15-oxoETE 1.49 1.41 0.465 1.32 1.52 0.376
FFA(4:0) 2.58 0.63 0.048 2.20 0.71 0.707
FFA(22:1) 1.61 1.38 0.389 1.05 1.22 0.510
FFA(20:2) 1.62 1.50 0.560 1.38 1.66 0.458
FFA(22:2) 2.44 1.65 0.089 2.01 1.66 0.077
FFA(22:3) 1.81 1.26 0.331 1.97 1.44 0.105
FFA(24:6) 2.06 2.41 0.154 1.75 2.51 0.074
LPG(16:0/0:0) 1.37 0.66 0.459 1.91 1.73 0.091
PC(16:0/20:3) 1.78 0.63 0.300 1.34 0.63 0.331
PC(18:1/18:4) 2.59 0.66 0.092 1.48 0.76 0.304
PC(18:2/20:3) 2.22 1.63 0.155 2.48 1.97 0.016
PC(20:1/20:4) 1.37 1.22 0.646 1.19 1.27 0.583
PE(18:2/16:0) 1.71 1.20 0.375 1.79 1.35 0.183
PE(20:4/14:0) 1.73 1.49 0.341 2.21 1.65 0.019
PG(18:0/18:1) 1.90 0.72 0.230 1.80 0.63 0.141
PI(20:3/18:0) 1.84 0.64 0.336 1.96 0.65 0.133
PI(20:4/16:0) 1.77 0.67 0.212 1.36 0.74 0.482
PI(18:1/20:4) 1.56 0.77 0.336 1.83 0.65 0.205
CE(18:2) 1.91 1.36 0.214 2.11 1.40 0.079
CE(20:4) 2.68 1.48 0.037 1.40 1.27 0.310
Cer(d18:1/22:0) 1.87 1.25 0.251 1.81 1.33 0.184

Page 7 of 17Yuan et al. Cell Biosci (2021) 11:95
molecular readouts. To perform this analysis, a holis-tic co-clustering approach was performed, as shown in Fig. 8. Perturbed SCD in GCs influenced mRNAs and lipids in glycerolipid/glycerophospholipid metabo-lism, glycine, serine, and threonine metabolism, and
sphingolipid metabolism, which are associated with lipid-related metabolism pathways. However, SCD knockdown in GCs influenced more complicated lipid-related metabolism pathways, including fatty acid deg-radation/elongation, inositol phosphate metabolism,
Table 1 (continued)
Comparison III: LC vs. LT comparison Comparison IV: LC vs. LF comparison
DG(16:0/18:0/0:0) 2.70 0.75 0.076 1.66 0.82 0.181
DG(14:0/18:2/0:0) 1.42 1.37 0.356 2.08 1.51 0.068
DG(20:0/18:2/0:0) 1.47 1.32 0.319 1.77 1.55 0.102
LPC(18:3/0:0) 1.75 1.62 0.276 1.05 1.20 0.578
LPE(0:0/22:4) 2.32 1.20 0.081 2.18 1.25 0.045
PC(18:0/22:0) 1.82 1.21 0.338 2.12 1.31 0.063
PC(20:5/12:0) 1.82 0.80 0.236 1.48 0.82 0.279
PE(22:2/12:0) 2.47 1.37 0.127 2.12 1.45 0.079
PS(20:4/20:0) 1.12 0.79 0.417 1.19 1.24 0.391
TG(14:0/16:0/22:0) 1.33 1.31 0.701 1.14 1.37 0.643
TG(16:0/20:0/22:0) 1.57 1.67 0.332 1.26 1.48 0.465
TG(14:0/22:0/22:2) 1.78 0.77 0.273 1.16 0.80 0.429
TG(14:0/18:1/20:3) 2.33 1.65 0.082 1.26 1.42 0.364
p-vaule from Student’s t test
VIP variable importance in the projection, FFA free fat acid, CE cholesteryl ester, DG diacylglycerol, TG triglyceride, PC phosphatidylcholine, PE glycerophosphoethanolamine, PS glycerophosphoserine, PG glycerophosphoglycerol, PI glycerophosphoinositol, LPC lysophosphatidylcholine, LPG lysophosphatidylglycerol, Cer ceramide, SM sphingomyelin
Fig. 4 Heat map from the hierarchical clustering of differential overlapping lipid in the (a) SCD-overexpression group. b SCD-knockdown group. c SCD-overexpression and SCD-knockdown groups. The scaled expression by row (lipids) is shown as a heat map and is reordered by a hierarchical clustering analysis (Pearson’s distance and Ward’s method) on both rows and columns. The color scale indicates the relative amounts of metabolites: red, higher levels; green, lower levels

Page 8 of 17Yuan et al. Cell Biosci (2021) 11:95
phosphatidylinositol signaling system, alpha-linolenic acid metabolism, arachidonic acid metabolism, and linoleic acid metabolism. Additionally, a targeted approach using prior biological knowledge in con-junction with canonical correlation analysis (CCA) revealed that lipids from glycerolipid/glycerophospho-lipid metabolism were subjected to a CCA together
with transcript data of all those pathways as derived from SCD knockdown in GCs (Fig. 9, Additional file 10: Table S5). We were also interested in other lipid-related pathways subjected to a CCA together with transcript data (Additional file 4: Fig. S4). However, no similar CCA results were observed with SCD overexpression in GCs.
Fig. 5 Disturbed metabolic pathways. Metaboanalyst (http:// www. metab oanal yst. ca) generated topology map described the impact of baseline metabolites identified with high VIP values (VIP > 1) on metabolic pathways between (a) Overexpressed group, LN vs. LS comparison and LG vs. LS comparison. b Knockdown group, LC vs. LT comparison and LC vs. LF comparison

Page 9 of 17Yuan et al. Cell Biosci (2021) 11:95
DiscussionIn the present study, we used a GC model of SCD func-tion and performed a detailed study on cellular lipid metabolism using lipidomic profiling to evaluate the lipid molecular changes in a detailed manner. The method is based on ultra-high performance liquid chromatography combined with quadrupole-time-of-flight mass spec-trometry and gas chromatography mass spectrometry, which allow for the analysis of hundreds of molecular lipids from a single sample run [26]. More than 660 lipids were identified, including phospholipids, ceramides, dia-cylglycerol and triacylglycerols, cholesterol esters, and fatty acid compositions (Fig. 3). Among these lipids, glyc-erophospholipids and glycerolipids were the predomi-nant species. Additionally, altered SCD expression had the greatest impact on glycerophospholipid metabolism, this lipid-related pathway contains the most key lipids, with more than six representative metabolites as fol-lows: PC (16:0/20:3); PC (18:1/18:4); PC (18:2/20:3); LPC
(18:3/0:0); PE (22:2/12:0); and PS (20:4/20:0). FFA (22:2) and TG (14:0/22:0/22:2) were representative metabolites of glycerolipid metabolism, and sphingolipid metabolism (Figs. 4, 5).
There is great diversity in the structures and functions of the vast array of lipid species, with intracellular levels of lipids tightly regulated by a network of metabolic path-ways to sustain normal cellular functions [27]. Glycer-ophospholipids make up phospholipids, which play both structural and metabolic roles in cells. Therefore, the level and species of phospholipids might reflect the bio-chemical and physiological conditions of cells [28]. Phos-pholipids are important for determining LD formation and are attributed to the formation of large LD fusions [29]. Glycerolipid metabolism is altered by fatty acids and, induces LD formation [30]. Blocking PC synthesis causes elevated SREBP-1-dependent gene transcription and LD accumulation in mouse liver and human cells, and the ratio of PE to PC in the LD surface tends to affect
Table 2 Statistic of the mapping of sequence to the reference genome goose
a The number of clean reading frames of total raw reading framesb The number of all mapped reads out of total clean reads
Terms NC OG OS SC ST SF
Clean reads (percentagea)
51,566,021 (96.10%) 53,774,948 (96.57%) 55,702,230 (96.37%) 57,694,766 (96.62%) 51,644,681 (96.54%) 56,187,441 (96.41%)
Reads mapped (percentageb)
38,589,491 (74.91%) 39,550,763 (73.60%) 40,979,329 (73.37) 43,575,018 (75.62%) 38,710,384 (75.00%) 42,250,540 (75.19%)
Uniquely mapped 37,687,479 (73.16%) 38,664,803 (71.96%) 40,043,890 (71.69) 42,597,240 (73.92%) 37,884,321 (73.40%) 41,295,405 (73.49%)
Fig. 6 Transcriptomics studies was performed in a cellular model of SCD function of goose GCs. a Pie chart shows number of significantly disturbed DEGs of each group. b Venn diagram of overlapping and unique of DEGs altered in each group

Page 10 of 17Yuan et al. Cell Biosci (2021) 11:95
the LD number and size [31, 32]. The present study pro-vided the lipid species composition and lipid metabolism of the GC model of SCD function. Given the important biological activities of many lipids, such information could provide potential insights into the mechanisms of internalized lipid-mediated follicle development.
We further investigated whether altered SCD expres-sion of GCs affects gene expression involved in lipid metabolism. We observed that altered SCD expression resulted in many DEGs assigned to lipid-related GO terms, including lipid binding, lipid transport, lipid localization, and LDs. Compared with those in the
Fig. 7 Histogram presentation of the lipid-related gene ontology classification of the DEGs. a NC vs. OS comparison. b OG vs. OS comparison. c SC vs. ST comparison. d SC vs. SF comparison. The results of GO classifications are provided in Additional file 9: Table S4

Page 11 of 17Yuan et al. Cell Biosci (2021) 11:95
SCD-overexpression group, more DEGs were identi-fied and assigned to lipid-related GO terms in the SCD-knockdown group (Fig. 7; Additional file 9: Table S4). These results indicated that SCD regulates the lipid metabolic processes during goose follicle development. Particularly, SCD knockdown might mobilize more genes associated with lipid metabolism. Combined analysis of lipid and gene expression profiles showed that more complicated lipid-related metabolism
pathways were significantly clustered, especially in the SCD-knockdown group.
Numerous internalized LDs were dispersed through-out the cytoplasm of GCs (Figs. 1, 2). However, in steroi-dogenic tissues such as the ovary, the ovarian follicles of almost all mammals contain LDs, which are prominently and generally non-pathogenic, except in cases of genetic disorders of steroidogenesis [33]. We speculate that there is a relationship between LDs and energy supply or the
Fig. 8 Two-omics datasets into pathway enrichment analysis. a LN-NC vs. LS-OS comparison and LG-OG vs. LS-OS comparison. b LC-SC vs. LT-ST comparison and LC-SC vs. LF-SF comparison

Page 12 of 17Yuan et al. Cell Biosci (2021) 11:95
storage of cholesteryl esters during goose follicle devel-opment. Cholesterol esters, particularly CE (20:4), were significantly upregulated in SCD-overexpression and knockdown groups (Fig. 4c). Previous results demon-strated intracellular metabolite changes in which choles-terol was mostly upregulated in the SCD-overexpression group, whereas androsterone was upregulated in the SCD-knockdown group [23].
LDs make dynamic contact with nearly every other organelle. Some contact activity might exist among the ER, endosomes, mitochondria, and peroxisomes in the cell. This contact is believed to mediate the transfer of lipids (including phospholipids, sterols, and fatty acids) between the different cellular compartments [34, 35]. Pharmacological inhibition of the enzymatic activity of fatty acid synthase significantly reduces the production of progesterone in bovine GCs, suggesting that ovarian steroidogenesis relies on lipid metabolism in GCs [16, 36]. Additionally, LD accumulation capacity of goose GCs depends on the different stages of follicle develop-ment, with the stage of the highest accumulation capacity being F1 GCs, followed by F4–F2 GCs and pre-hierarchi-cal GCs [15]. As ovarian follicles grow with changes in both the size and number of LDs in bovines [37], the total intracellular LD content increases gradually with follicu-lar growth. This exponential increase was demonstrated in large antral follicles in rats and goats [38, 39], with an increase in LD numbers and size in GCs within one day
after ovulation in rabbits [40]. These results confirm that LDs are considered a source of energy for oocyte matura-tion [41, 42].
SCD catalyzes the rate-limiting step in the production of monounsaturated fatty acids, which are major sub-strates for the synthesis of triglycerides, wax esters, cho-lesterol esters, and phospholipids [56]. Recent research has revealed that alterations in SCD expression change the fatty acid profile of these lipids and have a significant role in lipid metabolism [43]. The integrated optical den-sity of the LDs is related to the amount of triglycerides in the LDs. Our results showed that altered SCD expression affected LDs in GCs. The overexpression of SCD stimu-lated the accumulation of LD content, whereas SCD knockdown inhibited the accumulation of LD content (Fig. 2c). Previous research has demonstrated that SCD is an important control point in lipid homeostasis in goose GCs [23]. Similar results suggest that increased hepatic SCD activity accelerates the last stage of TG synthesis and stimulates lipid accumulation [44]. These results pro-vide direct evidence that SCD expression plays a major role in the triacylglycerol and phospholipid secretion processes. Much evidence indicates that the direct anti-steatotic effect of SCD deficiency stems from increased fatty acid oxidation and reduced lipid synthesis [45] and that the inhibition of SCD decreases the proliferation and apoptosis of cells [46]. Additionally, a link between SCD activity and LD size was previously observed in the
Fig. 9 Visualization of the CCA results of lipids and DEGs involved in (a) glycerolipid metabolism and (b) glycerophospholipid metabolism under SCD knockdown. The results of lipids are provided in Additional file 10: Table S5

Page 13 of 17Yuan et al. Cell Biosci (2021) 11:95
nematode Caenorhabditis elegans [47]; and experiments on cell lines cultured from patients with Berardinelli-Seip congenital lipodystrophy [48] demonstrated that SCD activity is necessary for large-sized LDs. Recent studies have indicated that the size of LDs might influ-ence the balance of lipogenesis and lipolysis in adipocytes and hepatic cells [49], with decreased SCD expression resulting in reduced accumulation of oleic and palmit-oleic acids and consequently fat cells with small LDs [50]. However, the functional implications of the diverse sizes of LDs in goose GCs are poorly understood.
In summary, these results provide new evidence that altered SCD expression changes GC lipid profiles, genes, and regulated relevant metabolic pathways, which might implicate SCD as one of the major genes in the regulation of lipid secretion by goose GCs.
MethodsAnimals and granulosa layer isolationGeese (from a maternal line of Tianfu goose) were raised under natural temperature and light conditions at the experimental station of waterfowl breeding at Sichuan Agricultural University. Six geese with regular laying sequences were randomly selected as experimental sam-ples and sacrificed by cervical bleeding under anesthe-sia, 2 h after oviposition. A pool of ovarian follicles was immediately collected from the goose abdominal cavities and divided into prehierarchal follicles and hierarchal preovulatory follicles according to previously reported nomenclature [51]. For granulosa layer collection, the outer connective tissue was removed from the preovu-latory follicles, and the preovulatory follicles were dis-sected to allow the yolk and adhered granulosa layer to flow out [52].
Cell culture and transfectionThe granulosa layer was dispersed by incubation in 0.1% type II collagenase (Sigma, USA) in Dulbecco’s modified Eagle’s medium (DMEM, HyClone, USA) for 10 min in a 37 °C water bath. After incubation, cells were dispersed with a pipette and pelleted by centrifugation at 1000×g for 10 min (20 °C). The supernatant was discarded and the cells were resuspended in 3 mL of fresh basic medium without collagenase and centrifuged. The washing pro-cedure was repeated twice. The GCs were dispersed in DMEM supplemented with 1% antibiotic/antimy-cotic solution (Solarbio, China) and 3% fetal bovine serum (Gibco, USA). Transient transfections based on the GC cellular model of SCD function (SCD-specific overexpression and knockdown) were performed using Lipofectamine® 3000 and Lipofectamine™ RNAiMAX Transfection Reagent (Invitrogen), according to manu-facturer’s protocol. SCD siRNA-210 and siRNA-405 were
used to achieve SCD mRNA knockdown, with scrambled siRNA as a negative control. The extent of SCD mRNA knockdown was measured as a percentage compared to that the scrambled siRNA. SCD-specific overexpression was used to achieve SCD mRNA overexpression, termed pEGFP-N1/SCD, and the pEGFP-N1/empty vector (GFP vector) served as the negative control, and another con-trol with no transfection components was also included. The extent of SCD mRNA overexpression was measured as a percentage compared to that with the GFP vector and no transfection components conditions. Transfec-tion efficiency was determined as previously described [23].
Oil red O stainingTo determine LD accumulation in GCs after transfection, the cells were stained with Oil Red O solution (Sigma Chemical Co., St. Louis, MO, USA). After 48 h of trans-fection, the cultured GCs were washed with phosphate-buffered saline (PBS) and fixed with 10% formaldehyde at room temperature. Then, the cells were washed twice with PBS, and were subsequently stained with 0.5 μg/mL Oil Red O solution in the dark for 1 h at room tempera-ture. Then, cells were washed with PBS and photographed using an optical microscope system (Nikon ECLIPSE 90i) at 200 × magnification. Finally, the LDs were dissolved in isopropanol and the optical density (OD) value was determined at a wavelength of 540 nm using a microplate reader (Thermo Varioskan, USA). The relative lipid con-tent was calculated using the following equation: relative LD content (%) = sample OD/mg × mL−1 protein.
Immunofluorescence staining and confocal microscopyFor the photographic documentation of LD localization in goose GCs, live cells were stained with 4,4-difluoro-3a,4a-diaza-s-indacene (Bodipy 500/510, Thermo Fisher), wheat germ agglutinin (WGA, Alexa Fluor 594 conju-gate, Invitrogen), and Hoechst dyes (33258, Invitrogen) for labeling the LDs, membrane, and nucleus, respec-tively. Briefly, cells on culture plates were rinsed with PBS and stained for 5 min with 2 μg/mL Bodipy 500/510. After staining, cells were washed three times with PBS for 5 min. The cells were then stained for 5 min with 5 μg/mL WGA and 5 μg/mL Hoechst 33,342. After stain-ing and incubation, the cells were washed thrice with PBS for 5 min each. Finally, cells were fixed in formaldehyde for 10 min. The fixed cells were imaged using a confocal laser scanning microscope (FV1200, Olympus) mounted on an IX83 inverted microscope (Olympus). For treble-color images, a 550-nm laser line was used to image cells stained with Bodipy 500/510, a 635-nm laser line was used to image cells stained with WGA, and a 543-nm

Page 14 of 17Yuan et al. Cell Biosci (2021) 11:95
laser line was used to image cells stained with Hoechst 33258.
Sample preparation and extractionFor lipidomic analysis, each group of cells (LS, LG, LN, and two independent siRNA groups [siRNA-210 and siRNA-470, referred to as LT and LF, respectively], as well as the LC) were placed in liquid nitrogen for 2 min, then thawed on ice for 5 min and vortexed. The cells were centrifuged at 12,000 rpm at 4 °C for 10 min. The super-natants (300 µL) were homogenized with a 1 mL mixture containing methanol, MTBE, and an internal standard. This mixture was stirred for 2 min, followed by the addi-tion of 500 µL water, stirring for 1 min, and centrifuga-tion at 12,000 rpm at 4 °C for 10 min. A total of 500 µL of the supernatant obtained was extracted and concen-trated. The powder was dissolved with 100 µL mobile phase B (0.1% acetic acid), and the supernatant (200 μL) was transferred to an LC–MS sampling vial with an inner liner, for LC–MS analysis. Quality control (QC) samples were produced by pooling equal aliquots taken from each individual sample in the analytical run together. These QC samples were used to monitor the stability and reproducibility of the analytes in the samples during the analysis.
For RNA-sequencing analysis, each group of cells was extracted from three independent biological replicates using TRIzol reagent (Invitrogen, USA) according to the manufacturer’s instructions. RNA quality was confirmed on 1% agarose gels. RNA purity and concentration were determined using a NanoPhotometer® spectrophotom-eter (IMPLEN, CA, USA) and Qubit® RNA Assay Kit with a Qubit® 2.0 Fluorometer (Life Technologies, CA, USA) according to the manufacturer’s instructions. RNA integrity was assessed using an RNA 6000 Nano Assay Kit (Bioanalyzer 2100 system; Agilent Technologies, CA, USA).
Lipidomics profilingLipidomics profiling was performed by MetWare (Wuhan, China) using an LC–ESI–MS/MS system (UPLC, Shim-pack UFLC SHIMADZU CBM A system, https:// www. shima dzu. com/; MS, QTRAP® System, https:// sciex. com/). LIT and triple quadrupole (QQQ) scans were acquired on a triple quadrupole-linear ion trap mass spectrometer (QTRAP®) LC–MS/MS System, equipped with an ESI Turbo Ion-Spray interface, operat-ing in positive and negative ion mode, and controlled by Analyst 1.6.3 software (Sciex). Qualitative analysis of pri-mary and secondary MS data was carried out by a com-parison of the accurate precursor ions (Q1), product ions (Q3), retention time (RT), and fragmentation patterns with those obtained by injecting standards at the same
conditions if the standards were available (Sigma-Aldrich, USA), or was conducted using the self-compiled database MWDB (MetWare, China). The quantitative analysis of metabolites was based on the MRM mode. The charac-teristic ions of each metabolite were screened using a QQQ mass spectrometer to obtain the signal strengths. Integration and correction of chromatographic peaks was performed using Progenesis QI software (Waters Co., Milford, MA, USA). The corresponding relative metab-olite contents were represented as chromatographic peak area integrals. In addition, accurate masses of fea-tures representing significant differences were searched against the METLIN, Kyoto Encyclopedia of Genes and Genomes (KEGG), HMDB, and LIPIDMAPS databases.
RNA‑sequencingSequencing libraries were generated by Novogene (Bei-jing, China) using a NEBNext® Ultra™ RNA Library Prep Kit (Illumina®, NEB, USA) following the manufacturer’s instructions. Clustering of the index-coded samples was performed on a cBot Cluster Generation System by using a TruSeq PE Cluster Kit v3-cBot-HS (Illumina) according to the manufacturer’s instructions. After cluster genera-tion, the library preparations were sequenced on an Illu-mina HiSeq (Illumina, USA) platform and 125 bp/150 bp paired-end reads were generated.
Bioinformatic and statistical analyses of dataRaw LC–MS data were filtered, identified, integrated, corrected, aligned, and normalized using Progenesis QI software (Waters Co., Milford, MA, USA). A data matrix of RT, mass-to-charge ratio, and peak intensity was obtained. The processed data were analyzed using princi-pal component analysis and orthogonal correction partial least squares discriminant analysis (PC) using SIMCA-P14.0 software (Umetrics, Umeå, Sweden). Differen-tially abundant metabolites between dietary treatments were identified from variable importance in projection (VIP) from OPLS-DA and Student’s t tests (VIP > 1 and P < 0.05). Metabolites were identified from public data-bases, including MassBank (http:// www. massb ank. jp/), KNApSAcK (http:// kanaya. naist. jp/ KNApS AcK/), Human Metabolome Database (http:// www. hmdb. ca/), and METLIN (https:// metlin. scrip ps. edu/). The KEGG database (http:// www. genome. jp/ kegg/) was used to view the enriched pathways of the different metabolites. Hier-archical clustering analysis and heat map analysis were conducted using the R package, version 3.3.1. The raw read counts were normalized considering both the dif-ferent depths of sequencing among the samples and the gene GC content. Normalization was performed using the EDASeq package. We considered all DEGs with a P value < 0.05 after false discovery rate correction. The

Page 15 of 17Yuan et al. Cell Biosci (2021) 11:95
putative functions of DEGs were investigated by Gene Ontology (GO) enrichment analysis using the R package GOseq [53], in which gene length bias was corrected. GO terms with a corrected P value < 0.05 were considered sig-nificantly enriched. KOBAS software was used to test the statistical enrichment of DEGs in KEGG pathways [54]. Statistical plots were prepared using Origin version 6.1.
AbbreviationsGCs: Granulosa cells; LDs: Intracellular lipid droplets; SCD: Stearoyl-CoA desatu-rase; CCA : Canonical correlation analysis; DEGs: Differentially expressed genes; TGs: Triacylglycerols; DMEM: Dulbecco’s modified Eagle’s medium; OD: Optical density; Bodipy: 4,4-Difluoro-3a,4a-diaza-s-indacene; WGA : Wheat germ agglu-tinin; QC: Quality control; KEGG: Kyoto Encyclopedia of Genes and Genomes; VIP: Importance in projection; GO: Gene ontology.
Supplementary InformationThe online version contains supplementary material available at https:// doi. org/ 10. 1186/ s13578- 021- 00604-6.
Additional file 1: Figure S1. Unsupervised hierarchical clustering of all lipids in each group; each column denotes one group. Increased lipids concentrations are shown in red, whereas decreased lipids concentrations are shown in blue.
Additional file 2: Figure S2. Venn diagram of overlapping and unique of lipids altered in each group.
Additional file 3: Figure S3. Unsupervised hierarchical clustering of all DEGs in each group; each column denotes one group. Increased DEGs concentrations are shown in red, whereas decreased DEGs concentrations are shown in blue.
Additional file 4: Figure S4. Topology analysis of top 20 pathways identi-fied of transcriptomics. (a) Overexpressed group, NC vs. OS comparison and OG vs. OS comparison; (b) Knockdown group, SC vs. ST comparison and SC vs. SF comparison. Advanced bubble chart shows the enrichment of differentially abundant DEGs in pathways. The x-axis represents the rich factor (rich factor = number of different DEGs enriched in the pathway/number of all DEGs in the background DEGs set). The y-axis represents represent the enriched pathways. Size of the bubble represent the num-ber of different abundant DEGs enriched in the pathway, and the color represents enrichment significance.
Additional file 5: Figure S5. Visualization of the CCA results of lipids and DEGs involved in (a) inositol phosphate metabolism, (b) arachidonic acid metabolism, (c) sphingolipid metabolism, (d) phosphatidylinositol signal-ing system and (e) glycine, serine and threonine metabolism under SCD knockdown.
Additional file 6: Table S1. Significant differential lipids involved in LN vs. LS comparison, LG vs. LS comparison, LC vs. LT comparison, and LC vs. LF comparison.
Additional file 7: Table S2. A functional analysis of pathways related to the differentially abundant lipids.
Additional file 8: Table S3. Basic characteristics of tags in each sample libraries and data of sequencing reads mapping to the reference genome.
Additional file 9: Table S4. The detail of DEGs were assigned with lipid-related GO slim terms.
Additional file 10: Table S5. The detail of lipids from glycerolipid/glycer-ophospholipid metabolism were subjected to a CCA together with tran-script data of all those pathways as derived from SCD knockdown in GCs.
AcknowledgementsNone.
Authors’ contributionsXY and JW conceptualized and designed this study, reviewed this manu-script, and supervised this study. XY, SH, LL, CH, and HL performed the main experiments and analyzed the data. HH, LX, JH, BH, MR, and YL participated in experimental animal management, tissue sampling, and data collection and analysis. XY drafted this manuscript. All authors read and approved the final manuscript.
FundingThis study was supported by a grant from the National Natural Science Foun-dation of China (No. 31672424 and 035Z2425), the China Agricultural Research System (No. CARS-42-4), the Open Fund of Farm Animal Genetic Resources Exploration and Innovation Key Laboratory of Sichuan Province (SNDK-KF-201802), the Project of National Science and Technology Plan for the Rural Development in China (No. 2015BAD03B06), and the Key Technology Support Program of Sichuan Province (No. 2016NYZ0044).
Availability of data and materialsRNA-seq data used in the current study are available at NCBI Bioproject data-base under the accession number PRJNA720652.
Declarations
Ethics approval and consent to participateThe animal experiments were reviewed and approved by the Committee of the School of Farm Animal Genetic Resources Exploration and Innovation Key Laboratory, College of Animal Science and Technology, Sichuan Agricultural University, China (Permit No. DKY20170913). The experiments were performed in accordance with the Regulations for the Administration of Affairs Concern-ing Experimental Animals (China 1988). This study was conducted in accord-ance with the requirements of the Beijing Animal Welfare Committee. All efforts were made to minimize animal suffering.
Consent for publicationAll co-authors agreed to publish the final version of the present manuscript.
Competing interestsThe authors declare that the research was conducted in the absence of any commercial or financial relationships that could be construed as a potential conflict of interest.
Received: 27 February 2021 Accepted: 4 May 2021
References 1. Storck EM, Ozbalci C, Eggert US. Lipid cell biology: a focus on lipids in cell
division. Annu Rev Biochem. 2018;87(1):839–69. 2. Santos AL, Preta G. Lipids in the cell: organisation regulates function. Cell
Mol Life Sci CMLS. 2018;75(11):1909–27. 3. Brown HA, Marnett LJ. Introduction to lipid biochemistry, metabolism,
and signaling. Chem Rev. 2011;111(10):5817–20. 4. Bochkov VN, Oskolkova OV, Birukov KG, Levonen AL, Binder CJ, Stöckl J.
Generation and biological activities of oxidized phospholipids. Antioxi-dants Redox Signaling. 2010;12(8):1009–59.
5. Ozcan U, Yilmaz E, Ozcan L, Furuhashi M, Vaillancourt E, Smith RO, Görgün CZ, Hotamisligil GS. Chemical chaperones reduce ER stress and restore glucose homeostasis in a mouse model of type 2 diabetes. Science (New York, NY). 2006;313(5790):1137–40.
6. Feldstein AE, Werneburg NW, Canbay A, Guicciardi ME, Bronk SF, Rydze-wski R, Burgart LJ, Gores GJ. Free fatty acids promote hepatic lipotoxicity by stimulating TNF-alpha expression via a lysosomal pathway. Hepatol-ogy (Baltimore, MD). 2004;40(1):185–94.
7. Goldberg IJ, Karen R, Abumrad NA, Bickel PE, Sarah C, Fisher EA, Galis ZS, Granneman JG, Douglas LE, Robert M. Deciphering the role of lipid droplets in cardiovascular disease: a report from the 2017 National Heart, Lung, and Blood Institute Workshop. Circulation. 2018;138(3):305–15.
8. Liu Z, Xun H. Lipid metabolism in Drosophila: development and dis-ease. Acta Biochim Biophys Sin. 2013;45:44–50.

Page 16 of 17Yuan et al. Cell Biosci (2021) 11:95
9. Lydic TA, Goo YH. Lipidomics unveils the complexity of the lipidome in metabolic diseases. Clin Transl Med. 2018;7(1):4.
10. Olzmann JA, Carvalho P. Dynamics and functions of lipid droplets. Nat Rev Mol Cell Biol. 2019;20(3):137–55.
11. Den Brok MH, Raaijmakers TK, Colladocamps E, Adema GJ. Lipid droplets as immune modulators in myeloid cells. Trends Immunol. 2018;39(5):380–92.
12. Onal G, Kutlu O, Gozuacik D, Dokmeci ES. Lipid droplets in health and disease. Lipids Health Dis. 2017;16(1):128.
13. Mike WH, Reese ML, Goodman JM. The assembly of lipid droplets and their roles in challenged cells. EMBO J. 2019.
14. Wen R, Gan X, Hu S, Gao S, Deng Y, Qiu J, Sun W, Li L, Han C, Hu J. Evidence for the existence of de novo lipogenesis in goose granulosa cells. Poult Sci. 2019;98(2):1023–30.
15. Gao S, Gan X, He H, Hu S, Deng Y, Chen X, Li L, Hu J, Li L, Wang J. Dynamic characteristics of lipid metabolism in cultured granulosa cells from geese follicles at different developmental stages. Biosci Rep. 2019;39(12).
16. Elis S, Desmarchais A, Maillard V, Uzbekova S, Monget P, Dupont J. Cell proliferation and progesterone synthesis depend on lipid metabolism in bovine granulosa cells. Theriogenology. 2015;83(5):840–53.
17. Campbell BK, Onions V, Kendall NR, Guo L, Scaramuzzi RJ. The effect of monosaccharide sugars and pyruvate on the differentiation and metabolism of sheep granulosa cells in vitro. Reproduction (Cam-bridge, England). 2010;140(4):541–50.
18. Hu W, Qiao J. Expression and regulation of adipocyte fatty acid binding protein in granulosa cells and its relation with clinical characteristics of polycystic ovary syndrome. Endocrine. 2011;40(2):196–202.
19. Mcevoy TG, Coull GD, Broadbent PJ, Hutchinson JS, Speake BK. Fatty acid composition of lipids in immature cattle, pig and sheep oocytes with intact zona pellucida. J Reprod Fertil. 2000;118(1):163–70.
20. Campagna C, Bailey JL, Sirard M-A, Ayotte P, Maddox-Hyttel P. An environmentally-relevant mixture of organochlorines and its vehicle control, dimethylsulfoxide, induce ultrastructural alterations in porcine oocytes. Mol Reprod Dev. 2010;73(1):83–91.
21. Abe H, Yamashita S, Satoh T, Hoshi H. Accumulation of cytoplasmic lipid droplets in bovine embryos and cryotolerance of embryos developed in different culture systems using serum-free or serum-containing media. Mol Reprod Dev. 2002;61:57–66.
22. De Lesegno CV, Reynaud K, Pechoux C, Thoumire S, Chastant-Maillard S. Ultrastructure of canine oocytes during in vivo maturation. Mol Reprod Dev. 2008;75(1):115–25.
23. Yuan X, Hu S, Li L, Liu H, He H, Wang J. Metabolomic analysis of SCD during goose follicular development: implications for lipid metabolism. Genes (Basel). 2020;11(9):1001.
24. Liu H. Special topic: metabolomics and lipidomics. J Anal Testing. 2017;1(3):185–6.
25. Lange M, Ni Z, Criscuolo A, Fedorova M. Liquid chromatography tech-niques in lipidomics research. Chromatographia. 2018;82(2):77–100.
26. Chen W, Gong L, Guo Z, Wang W, Zhang H, Liu X, Yu S, Xiong L, Luo J. A novel integrated method for large-scale detection, identification, and quantification of widely targeted metabolites: application in the study of rice metabolomics. Mol Plant. 2013;6(6):1769–80.
27. Tang QQ. Lipid metabolism and diseases 科学通报: 英文版. 2016;61(19):1471.
28. Dowhan W. The role of phospholipids in cell function. In: Gross RW, editor. Advances in lipobiology (JAI), vol. 2. Elsevier: Amsterdam; 1997. p. 79–107.
29. Han L, Pang K, Li XI, Loor JJ, Yang GY, Gao T. Lipidomic profiling analysis of the phospholipid molecules in SCAP-induced lipid droplet forma-tion in bovine mammary epithelial cells. Prostaglandins Other Lipid Media. 2020;149:106420.
30. Pathmaperuma AN, Maña P, Cheung SN, Kugathas K, Josiah A, Koina ME, Broomfield A, Delghingaro-Augusto V, Ellwood DA, Dahlstrom JE, et al. Fatty acids alter glycerolipid metabolism and induce lipid droplet formation, syncytialisation and cytokine production in human trophoblasts with minimal glucose effect or interaction. Placenta. 2010;31(3):230–9.
31. Walker AK, Jacobs RL, Watts JL, Rottiers V, Jiang K, Finnegan DM, Shioda T, Hansen M, Yang F, Niebergall L. A conserved SREBP-1/
phosphatidylcholine feedback circuit regulates lipogenesis in metazo-ans. Cell. 2011;147(4):840–52.
32. Listenberger L, Townsend E, Rickertsen C, Hains A, Brown E, Inwards EG, Stoeckman AK, Matis MP, Sampathkumar RS, Osna NA, et al. Decreasing phosphatidylcholine on the surface of the lipid droplet correlates with altered protein binding and steatosis. Cells. 2018;7(12):230.
33. Paulini F, Silva RC, Rolo JLJdP, Lucci CM. Ultrastructural changes in oocytes during folliculogenesis in domestic mammals. J Ovarian Res. 2014;7:102.
34. Gao G, Chen FJ, Zhou L, Su L, Xu D, Xu L, Li P. Control of lipid droplet fusion and growth by CIDE family proteins. Biochim Biophys Acta Mol Cell Biol Lipids. 2017;1862:1197–204.
35. Gallardo-Montejano VI, Saxena G, Kusminski CM, Yang C, Mcafee JL, Hahner L, Hoch K, Dubinsky W, Narkar VA, Bickel PE. Nuclear Perilipin 5 integrates lipid droplet lipolysis with PGC-1α/SIRT1-dependent transcriptional regulation of mitochondrial function. Nat Commun. 2016;7:12723.
36. Yenuganti VR, Viergutz T, Vanselow J. Oleic acid induces specific alterations in the morphology, gene expression and steroid hormone production of cultured bovine granulosa cells. Gen Comp Endocrinol. 2016;232:134–44.
37. Dadarwal D, Adams GP, Hyttel P, Brogliatti GM, Caldwell S, Singh J. Organelle reorganization in bovine oocytes during dominant follicle growth and regression. Reprod Biol Endocrinol. 2015;13:124–124.
38. Sangha GK, Guraya SS. Biochemical changes in lipids during follicular growth and corpora lutea formation and regression in rat ovary. Indian J Exp Biol. 1989;27(11):998–1000.
39. Sharma RK, Vats R, Sawhney AK. Changes in follicular lipids during follicular growth in the goat (Capra hircus) ovary. Small Ruminant Res. 1996;20(2):177–80.
40. Guraya SS. A histochemical study of pre-ovulatory and post-ovulatory follicles in the rabbit ovary. Reprod Fertil. 1968;15(3):381–7.
41. Silva RC, Báo SN, Jivago JLPR, Lucci CM. Ultrastructural characterization of porcine oocytes and adjacent follicular cells during follicle develop-ment: lipid component evolution. Theriogenology. 2011;76(9):1647–57.
42. Sturmey RG, O’Toole PJ, Leese HJ. Fluorescence resonance energy transfer analysis of mitochondrial:lipid association in the porcine oocyte. Reproduction (Cambridge, England). 2006;132(6):829–37.
43. Khor VK, Shen W, Kraemer FB. Lipid droplet metabolism. Curr Opin Clin Nutr Metab Care. 2013;16(6):632–7.
44. Matthew T, Flowers, James M, Ntambi. Role of stearoyl-coenzyme A desaturase in regulating lipid metabolism. Curr Opin Lipidol. 2008.
45. Dobrzyn A, Dobrzyn P, Lee SH, Miyazaki M, Cohen P, Asilmaz E, Hardie DG, Friedman JM, Ntambi JM. Stearoyl-CoA desaturase-1 deficiency reduces ceramide synthesis by downregulating serine palmitoyltrans-ferase and increasing beta-oxidation in skeletal muscle. Am J Physiol Endocrinol Metab. 2005;288(3):E599.
46. Iwai T, Kume S, Chin-Kanasaki M, Kuwagata S, Araki H, Takeda N, Sugaya T, Uzu T, Maegawa H, Araki SI. Stearoyl-CoA desaturase-1 protects cells against lipotoxicity-mediated apoptosis in proximal tubular cells. Int J Mol Sci. 2016;17(11):1868.
47. Xun S, Juan L, Xiaoju Z, Joel G, Rodkaer SV, Faergeman NJ, Bin L, Watts JL. Regulation of lipid droplet size and phospholipid composition by stearoyl-CoA desaturase. J Lipid Res. 2013;54(9):2504–14.
48. Boutet E, El Mourabit H, Prot M, Nemani M, Khallouf E, Colard O, Maurice M, Durand-Schneider A-M, Chrétien Y, Grès S, et al. Seipin deficiency alters fatty acid Delta9 desaturation and lipid droplet formation in Berardinelli-Seip congenital lipodystrophy. Biochimie. 2009;91:796–803.
49. Welte MA, Gould AP. Lipid droplet functions beyond energy storage. Biochim Biophys Acta. 2017;1862(10 Part B):1260–72.
50. Choi Y, Kim YC, Han YB, Park Y, Pariza MW, Ntambi JM. The trans-10, cis-12 isomer of conjugated linoleic acid downregulates stearoyl-CoA desaturase 1 gene expression in 3T3-L1 adipocytes. J Nutr. 2000;130(8):1920–4.
51. Gilbert A. The Ovary. In: Bell, D. J, and Freeman, BM eds. Physiology and Biochemistry of the Domestic Fowl. Vol. 3. Academic Press, London, New York; 1971
52. Gilbert A, Evans A, Perry M, Davidson M. A method for separating the granulosa cells, the basal lamina and the theca of the preovulatory

Page 17 of 17Yuan et al. Cell Biosci (2021) 11:95
• fast, convenient online submission
•
thorough peer review by experienced researchers in your field
• rapid publication on acceptance
• support for research data, including large and complex data types
•
gold Open Access which fosters wider collaboration and increased citations
maximum visibility for your research: over 100M website views per year •
At BMC, research is always in progress.
Learn more biomedcentral.com/submissions
Ready to submit your researchReady to submit your research ? Choose BMC and benefit from: ? Choose BMC and benefit from:
ovarian follicle of the domestic fowl (Gallus domesticus). J Reprod Fertil. 1977;50(1):179–81.
53. Young MD, Wakefield MJ, Smyth GK, Oshlack A. Gene ontology analysis for RNA-seq: accounting for selection bias. Genome Biol. 2010;11(2):1–12.
54. Mao X, Cai T, Olyarchuk JG, Wei L. Automated genome annotation and pathway identification using the KEGG Orthology (KO) as a controlled vocabulary. Bioinformatics. 2005;21(19):3787.
Publisher’s NoteSpringer Nature remains neutral with regard to jurisdictional claims in pub-lished maps and institutional affiliations.