lipides, métabolisme des hydrates de carbonne et … · lipides, métabolisme des hydrates de...
TRANSCRIPT

Hôpitaux Universitaires de Genève
Lipides, métabolisme des hydrates de Lipides, métabolisme des hydrates de carbonne et maladies cardiocarbonne et maladies cardio--vasculairesvasculaires
Prof. J. Philippe

Effect of estrogens on glucose metabolism : Fasting Glucose, Effect of estrogens on glucose metabolism : Fasting Glucose, HbA1c and CHbA1c and C--Peptide in subjects with NIDDM after Peptide in subjects with NIDDM after treatment withtreatment with estradiolestradiol and placebo according to (8)and placebo according to (8)
Variable Baseline After treatment p-valueGlucose (mmol/l)
Estradiol 12.1 ± 0.4 0.9 ± 0.4 P <0.001Placebo 12.2 ± 0.5 12.8 ± 0.4
HbA1c (%)Estradiol 8.7 ± 0.2 7.5 ± 0.2 P < 0.001Placebo 8.5 ± 0.2 9.0 ± 0.3
C-Peptide (nmol/l)Estradiol 1.29 ± 0.11 1.09 ± 0.11 P < 0.001Placebo 1.21 ± 0.11 1.27 ± 0.13

Glucose level and coronary heart disease rates in Glucose level and coronary heart disease rates in the Honolulu Heart Study (12the Honolulu Heart Study (12--Year FollowYear Follow--up)*up)*PostchallengeGlucose Level
Fatal CoronaryHeart Disease
Total CoronaryHeart Disease
mmol/L %2.2-6.3 9.3 35.66.4-7.4 12.2 40.07.4-8.7 17.1 48.98.7-10.5 20.7 52.610.5-29.5 30.3 59.9
* The study included 6394 Japanase-American men (exclusion criteria were previous cardiovascular disease, treated hypertension, and known diabetes) and had a 12-year, age-adjusted incidence rate per 1000.

Crude 22 years cardiovascular andCrude 22 years cardiovascular and noncardiovascularnoncardiovascularmortality according to fasting blood glucose quartiles. mortality according to fasting blood glucose quartiles.
Error bars indicate 95 % CIError bars indicate 95 % CI
0
5
10
15
20
25
Quartile I : 52-73 mg/dl Quartile II : 74-79 mg/dl Quartile III : 80-85 mg/dl Quartile IV : 86-109 mg/dl
Fasting Blood Glucose
22 Y
ears
Mor
talit
y (%
)
Cardiovascular mortalityNon-cardiovascular mortality
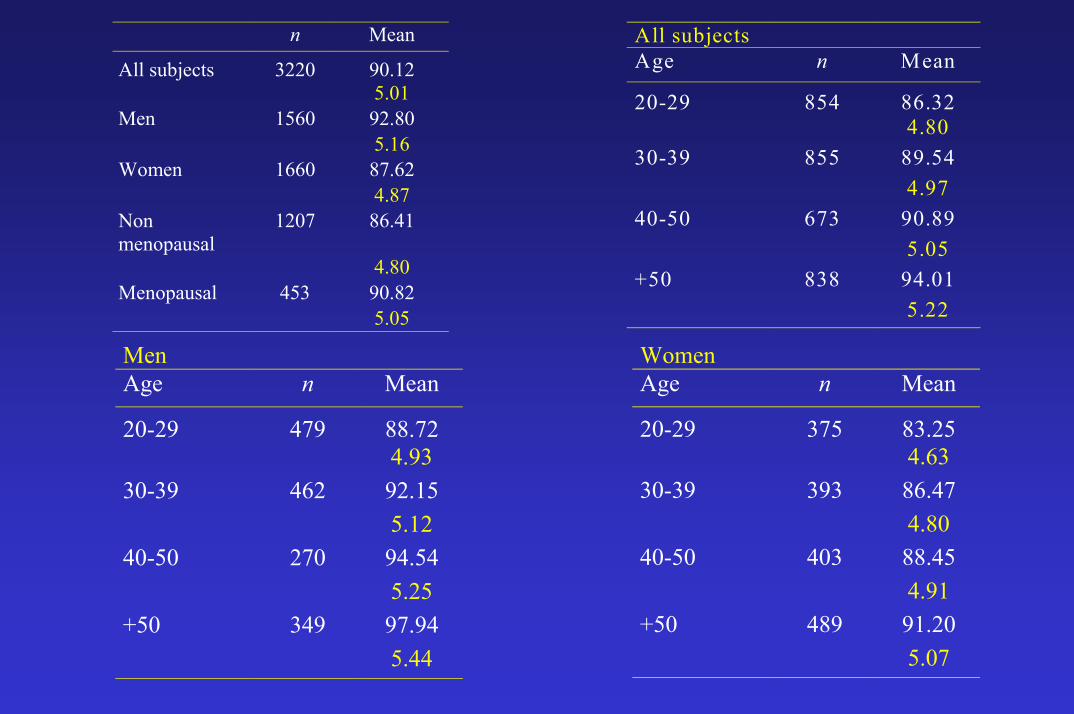
n Mean
All subjects 3220 90.125.01
Men 1560 92.805.16
Women 1660 87.624.87
Nonmenopausal
1207 86.41
4.80Menopausal 453 90.82
5.05
All subjectsAge n Mean
20-29 854 86.324.80
30-39 855 89.544.97
40-50 673 90.895.05
+50 838 94.015.22
MenAge n Mean
20-29 479 88.724.93
30-39 462 92.155.12
40-50 270 94.545.25
+50 349 97.945.44
WomenAge n Mean
20-29 375 83.254.63
30-39 393 86.474.80
40-50 403 88.454.91
+50 489 91.205.07

AnthropometricAnthropometric variables and blood pressure before and after variables and blood pressure before and after treatment withtreatment with estradiolestradiol and placebo (mean ± SEM; n = 25)and placebo (mean ± SEM; n = 25)
2 mg 172 mg 17ββ--estradiolestradiol 3 months 3 months -- 1 mg1 mg norethisteronenorethisterone acetate 10acetate 10dd
Variables Baseline After treatment P - val
Body weight (kg)Estradiol 82.1 ± 3.1 83.4 ± 3.2 P < 0.001Placebo 83.5 ± 3.2 83.2 ± 3.2
Body fat (kg)Estradiol 38.0 ± 2.0 38.4 ± 2.0 P < 0.005Placebo 40.1 ± 2.2 38.5 ± 2.2
Lean body mass (kg)Estradiol 43.9 ± 1.4 44.7 ± 1.4 nsPlacebo 43.5 ± 1.3 44.5 ± 1.4
Waist/hip ratioEstradiol 0.96 ± 0.02 0.96 ± 0.02 nsPlacebo 0.96 ± 0.02 0.96 ± 0.02
SBP (mmHg)Estradiol 139 ± 3 136 ± 3 nsPlacebo 140 ± 4 139 ± 3
DBP(mmHg)Estradiol 73 ± 2 72 ± 72 nsPlacebo 74 ± 42 74 ± 2
SBP, Systolic blood pressure; DBP, diastolic blood pressure, ns, not significant p-values for comparison between changes during estradiol treatment vs. placebo treatment

Fasting plasma glucose
0
1
2
3
1 2 3 4 5Quintiles
Inci
denc
e ra
te/1
000
2- hour plasma glucose
0
1
2
3
1 2 3 4 5Quintiles
Inci
denc
e ra
te/1
000 P < 0.01
Incidence of CVD according to fasting and 2Incidence of CVD according to fasting and 2--hour plasma glucose and insulin concentrationshour plasma glucose and insulin concentrations
Fasting plasma insulin
0
1
2
3
1 2 3 4 5Quintiles
Inci
denc
e ra
te/1
000
2- hour plasma insulin
0
1
2
3
1 2 3 4 5Quintiles
Inci
denc
e ra
te/1
000 P < 0.01

Cumulative hazard curves for ADA fasting glucose criteria and Cumulative hazard curves for ADA fasting glucose criteria and WHO 2h glucose criteria adjusted by age, sex, and study centerWHO 2h glucose criteria adjusted by age, sex, and study center
Follow-up (years)
Cum
ulat
ive
haza
rd
Known diabetesDiabetes by ADA criteriaImpaired fasting glucoseNormal
2 h glucose classification
Known diabetesDiabetes by ADA criteriaImpaired fasting glucoseNormal
Fasting glucose classification
Follow-up (years)
Cum
ulat
ive
haza
rd
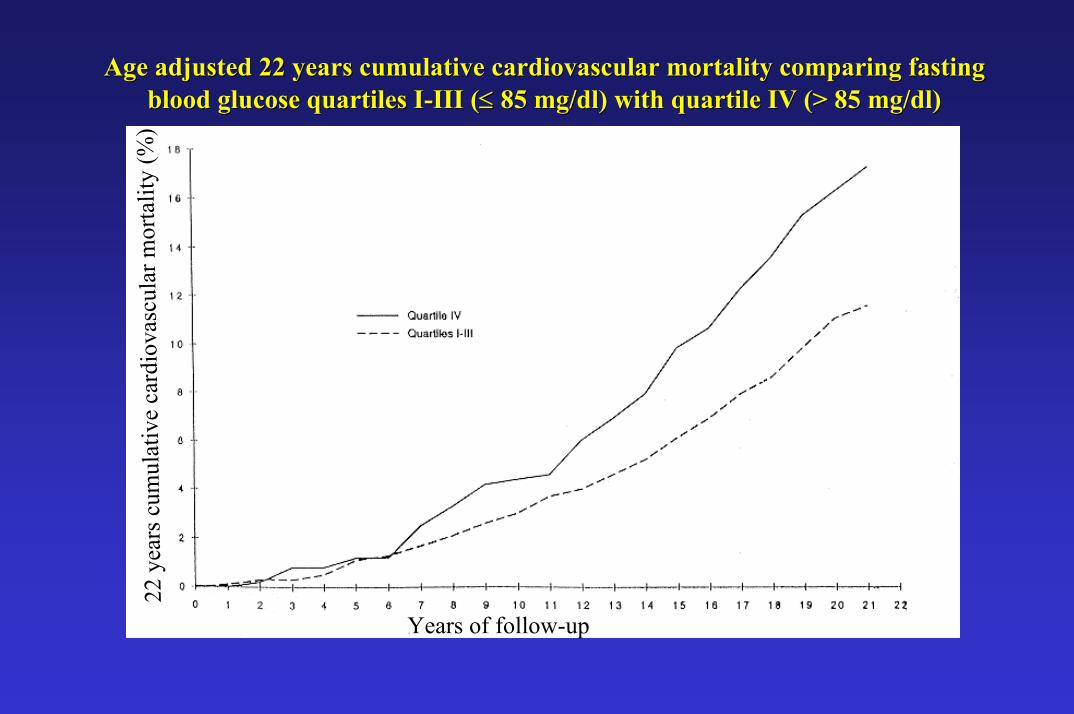
Age adjusted 22 years cumulative cardiovascular mortality comparAge adjusted 22 years cumulative cardiovascular mortality comparing fasting ing fasting blood glucose quartiles Iblood glucose quartiles I--III (III (≤≤ 85 mg/dl) with quartile IV (> 85 mg/dl)85 mg/dl) with quartile IV (> 85 mg/dl)
22 y
ears
cum
ulat
ive
card
iova
scul
ar m
orta
lity
(%)
Years of follow-up

The relationship between nonThe relationship between non--diabeticdiabetic glycemiaglycemia andand ischaemicischaemic heart disease heart disease (IHD) mortality in men ((IHD) mortality in men ( );); premenopausalpremenopausal women (women ( ); and postmenopausal ); and postmenopausal women (women ( ). Non). Non--diabetic men and women aged 40diabetic men and women aged 40--79 years were followed for 79 years were followed for
an average of 14 years. an average of 14 years. ((SchwidtSchwidt--Nave et al. Am JNave et al. Am J EpidemiolEpidemiol 1991; 133: 5651991; 133: 565--76)76)

The significance of glucose concentrations as a risk factor for The significance of glucose concentrations as a risk factor for chronic disease. Plasma chronic disease. Plasma glucose concentrations above the diabetic cut off are associatedglucose concentrations above the diabetic cut off are associated with an increasing risk with an increasing risk
of cardiovascular andof cardiovascular and microvascularmicrovascular disease; levels above the IGT cut off are associated disease; levels above the IGT cut off are associated with an increasing risk of diabetes; and elevated levels above swith an increasing risk of diabetes; and elevated levels above some, as yet undefined, ome, as yet undefined,
""dysglycaemicdysglycaemic" cut off are associated with an increasing risk of cardiovascul" cut off are associated with an increasing risk of cardiovascular disease.ar disease.

Blood lipids before and after treatment withBlood lipids before and after treatment withestradiolestradiol and placebo (mean ± SEM; n = 25)and placebo (mean ± SEM; n = 25)
Variables Baseline After treatment P - val
Cholesterol (mmol/L)Estradiol 5.7 ± 0.2 5.2 ± 0.1 P < 0.01Placebo 5.9 ± 0.2 5.8 ± .2
HDL-C (mmol/L)Estradiol 1.10 ± 0.05 1.33 ± 0.06 P < 0.001Placebo 1.11 ± 0.06 1.11 ± 0.05
LDL-C (mmol/L)Estradiol 3.74 ± 0.17 2.86 ± 0.14 P < 0.001Placebo 3.54 ± 0.19 3.72 ± 0.15
Triglycerides (mmol/L)Estradiol 2.04 ± 0.16 2.28 ± 0.17 nsPlacebo 2.39 ± 0.25 2.36 ± 0.26
HDL-C, High density lipoprotein cholesterol; LDL-C, low density lipoprotein cholesterol p-values for comparison between changes during estradiol treatment vs. placebo treatment

-1
0
1
2dH
bA1c
(%
)R=-06.4, p< 0.05

Changes inChanges in triglyceridestriglycerides in postin post--menopausal women receiving either no treatment,menopausal women receiving either no treatment, transdermal transdermal oestradioloestradiol--1717ββ 0.05 mg daily with cyclical0.05 mg daily with cyclical transdermal norethisteronetransdermal norethisterone acetate 0.25 mg daily, or acetate 0.25 mg daily, or oral conjugated equineoral conjugated equine oestrogensoestrogens 0.625 mg daily with cyclical oral dl0.625 mg daily with cyclical oral dl--norgestrelnorgestrel 0.15 mg daily. 0.15 mg daily.
3A,3A, oestrogenoestrogen alone phase; 3B, combined phase, 6, combined phase. (*p < 0.05)alone phase; 3B, combined phase, 6, combined phase. (*p < 0.05)..
-20
-15
-10
-5
0
5
10
15
20
Control Transdermal Oral
Cycle :
% c
hang
e
E EP EP E EP EP
3 6 3 6 3 6
*
*
Danazol
Tibolone
Oestradiol+desogestrel

Changes in high density lipoprotein (HDL)Changes in high density lipoprotein (HDL) subfractionssubfractions andand apolipoproteinsapolipoproteins AI and AI and AII in postAII in post--menopausal women receiving eithermenopausal women receiving either transdermal oestradioltransdermal oestradiol--1717ββ 0.05 mg 0.05 mg
daily with cyclicaldaily with cyclical transdermal norethisteronetransdermal norethisterone acetate 0.25 mg daily,or oral conjugated acetate 0.25 mg daily,or oral conjugated equineequine oestrogensoestrogens 0.625 mg daily with cyclical oral 0.625 mg daily with cyclical oral dldl--norgestrelnorgestrel 0.15 mg daily0.15 mg daily
HDL2
-20
-15
-10
-5
0
5
10
Transdermal Oral
Cycle :
% c
hang
e
3A 3B 6 3A 3B 6
HDL3
-20
-15
-10
-5
0
5
10
Transdermal Oral
Cycle :%
cha
nge
3A 3B 6 3A 3B 6
3A : oestrogen alone phase - 3B : combined phase - 6 : combined phases
** p<0.01; *** p< 0.001

Changes in high density lipoprotein (HDL)Changes in high density lipoprotein (HDL) subfractionssubfractions andand apolipoproteinsapolipoproteins AI and AI and AII in postAII in post--menopausal women receiving eithermenopausal women receiving either transdermal oestradioltransdermal oestradiol--1717ββ 0.05 mg 0.05 mg
daily with cyclicaldaily with cyclical transdermal norethisteronetransdermal norethisterone acetate 0.25 mg daily,or oral conjugated acetate 0.25 mg daily,or oral conjugated equineequine oestrogensoestrogens 0.625 mg daily with cyclical oral 0.625 mg daily with cyclical oral dldl--norgestrelnorgestrel 0.15 mg daily0.15 mg daily
apo A1
-20
-15
-10
-5
0
5
10
Transdermal Oral
Cycle :
% c
hang
e
3A 3B 6 3A 3B 6
apo AII
-20
-15
-10
-5
0
5
10
Transdermal Oral
Cycle :%
cha
nge
3A 3B 6 3A 3B 6
3A : oestrogen alone phase - 3B : combined phase - 6 : combined phases
** p<0.01; *** p< 0.001

Changes in total cholesterol in postChanges in total cholesterol in post--menopausal women receiving either no menopausal women receiving either no treatment treatment ,, trandermal oestradioltrandermal oestradiol-- 1717ββ 0.05 mg daily with cyclical0.05 mg daily with cyclical
transdermal norethisteronetransdermal norethisterone acetate 0.25 mg daily acetate 0.25 mg daily , or oral conjugated equine, or oral conjugated equineoestrogensoestrogens 0.625 mg daily with cyclical oral dl0.625 mg daily with cyclical oral dl--norgestrelnorgestrel 0.15 mg daily 0.15 mg daily ..
Total cholesterol
-20
-15
-10
-5
0
5
10
15
20
Cha
nge
from
bas
elin
e (%
)
3 6 3A 3B 6 3A 3B 6
3A : oestrogen alone phase - 3B : combined phase - 6 : combined phases
*** p< 0.001

Cholesterol
-10
-5
0
5
10
0 6 12 18 24M onths
% C
hang
e in
initi
al v
alue
LDL-Cholesterol
-25
-20
-15
-10
-5
0
5
10
15
0 6 12 18 24M onths
% C
hang
e in
initi
al v
alue

HDL-Cholesteroll
-15
-10
-5
0
5
10
15
20
0 6 12 18 24M onths
% C
hang
e in
initi
al v
alue
Apo A.-+
-15
-10
-5
0
5
10
15
20
0 6 12 18 24M onths
% C
hang
e in
initi
al v
alue

Lipoprotein(a)
-60
-50
-40
-30
-20
-10
0
10
20
30
0 6 12 18 24M onths
% C
hang
e in
initi
al v
alue
Triglycerides
-20
-10
0
10
20
30
40
50
0 6 12 18 24M onths
% C
hang
e in
initi
al v
alue

Effect of menopause on lipids and lipoproteins.Effect of menopause on lipids and lipoproteins.
-30 -20 -10 0 10 20 30
Total cholesterol
Triglycerides
LDL cholesterol
HDL cholesterol
HDL2 cholesterol
HDL3 cholesterol
% change
542 healthy, non obese caucasian females 18-70 yrs
LDL, low density lipoproteins; HDL, high density lipoproteins

Effects of sex steroids on lipid metabolism. Width of lines indiEffects of sex steroids on lipid metabolism. Width of lines indicate the rate of cate the rate of cholesterol traffic under influence of estrogen (L) orcholesterol traffic under influence of estrogen (L) or progestinprogestin/androgen (R). /androgen (R).
Question marks indicate effects for which documentation is uncerQuestion marks indicate effects for which documentation is uncertain or uncleartain or unclearESTROGENESTROGEN PROGESTIN / ANDROGENPROGESTIN / ANDROGEN
E B/E
HTGL
B/E
FC
LPL (∇)
Diet↓
Chylomicrons↓
Remnants
VLDL↓
Remnants
Bile Acids
↑ Chol
↑ CA/CDA +DC
LDL
LTP ↑ ?
HDL2 HDL3
?
E B/E
HTGL
B/E
FC
LPL (?)
Diet↓
Chylomicrons↓
Remnants
VLDL
Remnants
Bile Acids
↑ Chol
↑ CA/CDA +DC
LDL
LTP ? ?
HDL2 HDL3
?

Effect of treatment with Placebo or 17Effect of treatment with Placebo or 17ββ --Estradiol on concentrations of plasma Estradiol on concentrations of plasma lipids, lipoproteins, plasmalipids, lipoproteins, plasma nonesterified Fasnonesterified Fas, C Peptide, and HbA1c (6 weeks), C Peptide, and HbA1c (6 weeks)
BaselineAbsolute and percentage changes
after treatment
Placebo(n=20)
Estradiol(n=20)
p Placebo (n=20) Estradiol (n=20)= p
TC, mmol/L 5.28 ± 0.66(4.07-6.52)
5.25 ± 0.60(3.96-7.02)
.81 0.04 ± 0.46(1%±9%)
-0.28 ± 0.44(-5%±8%)
.02(.04)
LDL-C, mmol/L 3.36 ± 0.68(2.32-4.72)
3.30 ± 0.74(2.11-4.68)
.68 0.06 ± 0.38(2 %±11%)
-048 ± 0.44(-14 %±12 %)
.0001(.0001)
HDL-C, mmol/L 1.20 ± 0.30(0.77-1.95)
1.20 ± 0.47(0.47-2.24)
.88 0.03 ± 0.16(3 %± 13 %)
0.26 ± 0.18(23 %±14 %)
.0002(.0001)
HDL2-C, mmol/L 0.36 ± 0.19(0.13-0.85)
0.41 ± 0.29(0.06-1.18)
.89 0.02 ± 0.12(11% ± 35 %)
0.20 ± 0.17(60%±44%)
.0007(.0007)
HDL3-C, mmol/L 0.84 ± 0.14(0.62-1.10)
0.79± 0.21(0.38-1.12)
.47 0.02 ± 0.08(3 % ± 9 %)
0.07 ± 0.11(11 % ± 15 %)
.14(.10)
VLDL-C, mmol/L 0.64 ± 0.35(0.20-1.48)
0.69± 0.43(0.22-1.76)
.86 -0.04 ± 0.20(-11 % ±29 %)
-0.06 ± 0.25(-11 % ± 37 %)
.61(.70)

Effect of treatment with Placebo or 17Effect of treatment with Placebo or 17ββ --Estradiol on concentrations of plasma Estradiol on concentrations of plasma lipids, lipoproteins, plasmalipids, lipoproteins, plasma nonesterified Fasnonesterified Fas, C Peptide, and HbA1c (6 weeks), C Peptide, and HbA1c (6 weeks)
BaselineAbsolute and percentage changes
after treatment
Placebo(n=20)
Estradiol(n=20)
p Placebo (n=20) Estradiol (n=20)= p
TGs, mmol/L 1.53 ± 0.83(0.39-3.83)
1.74 ± 0.95(0.28-3.72)
.48 0.08 ± 0.48(4 % ± 24 %)
0.05 ± 0.62(13 % ± 59 %)
.65(.66)
VLDL TGs,mmol/L
1.06 ± 0.63(0.11-2.44)
1.09 ± 0.83(0.22-3.13)
.7 0.02 ± 0.32(2 % ± 31 %)
0 ± 0.32(4 % ± 41 %)
.85(.67)
ApoA-1, g/L 1.44 ± 0.18(1.16-1.81)
1.39 ± 0.28(0.81-1.85)
.68 0.05 ± 0.10(3 % ± 7 %)
0.22 ± 0.13(17 %± 10 %)
.0001(.0001)
ApoB, g/L 1.27 ± 0.28(0.87-1.88)
1.26 ± 0.36(0.72-2.09)
.89 0.03 ± 0.14(2 % ± 11 %)
-013± 0.13(-9 % ± 9 %)
.0004(.001)
Nonesterified Fas,mmol/L
0.36 ± 0.21(0.12-0.81)
0.47 ± 0.32(0.06-1.13)
.30 0.05 ± 0.29(29 % ±113 %)
-0.02 ± 0.37(37 % ± 105%)
.79(.62)
C peptide, nmol/L 0.54 ± 0.38(0-1.41)
0.38 ± 0.39(0-1.68)
.11 -0.02 ± 0.42(8 %± 90 %)
-0.14± 0.33(-16 % ± 89 %)
.26(.10)
HbA1c, % 8.1 ± 1.6(5.6-11.2)
8.7 ± 1.5(6.3-11.2)
.24 -0.34± 0.45(-4% ± 5 %)
-0.66 ± 0.67(-7 %± 7 %)
.02(.03)