linking soil o 2 , co 2 , and ch 4 concentrations in a wetland soil: implications for co 2 and ch 4...
TRANSCRIPT
Published: March 17, 2011
r 2011 American Chemical Society 3393 dx.doi.org/10.1021/es103540k | Environ. Sci. Technol. 2011, 45, 3393–3399
ARTICLE
pubs.acs.org/est
Linking Soil O2, CO2, and CH4 Concentrations in a Wetland Soil:Implications for CO2 and CH4 FluxesBo Elberling,†,* Louise Askaer,† Christian J. Jørgensen,† Hans P. Joensen,† Michael K€uhl,‡,§
Ronnie N. Glud,||,^,# and Frants R. Lauritsen3
†Department of Geography and Geology, University of Copenhagen, Copenhagen, Denmark‡Marine Biological Laboratory, Department of Biology, University of Copenhagen, Strandpromenaden 5, DK-3000Helsingør, Denmark§Plant Functional Biology and Climate Change Cluster, University of Technology, Sydney PO Box 123 Broadway NSW 2007 Australia
)The Scottish Association for Marine Science, Dunstaffnage Marine Laboratory, Oban, Argyll, PA37 1QA, United Kingdom^Institute of Biology and Nordic Center for Earth Evolution, University of Southern Denmark, Odense M, Denmark#Greenland Climate Research Centre, Kivioq 2, Box 570, 3900 Nuuk Greenland3Department of Pharmacy and Analytical Chemistry, University of Copenhagen, Universitetsparken 2, 2100 Copenhagen Ø, Denmark
bS Supporting Information
’ INTRODUCTION
Northern wetlands store about 30% of the global subsurfaceorganic carbon (C) pools and function as net sources of methane(CH4) with an annual release of 46 Tg CH4�C to the atmos-phere.1�3 Soil water content is a key regulator for diffusion of O2
into the soil. Lowering the water level increases the oxygen (O2)availability in near-surface layers and accelerates decompositionrates of organic matter, increases carbon dioxide (CO2) emis-sions, and decreases CH4 emissions due to subsurface CH4
oxidation. However, highly contrasting results in terms of theeffects of lowered water levels on gas emission are reported in theliterature and the controlling mechanisms are unclear.4 Inparticular, the temporal nature of the gas transport mechanismacross the soil-atmosphere interface remains unresolved.5,6
Subsurface O2 concentrations in wetlands have rarely beenreported at high spatiotemporal scales despite the fact that O2 is akey parameter for the biogeochemistry of soils and sediments.
Subsurface O2 concentrations can be quantified both in thelaboratory and in situ with electrochemical and optical sensors.7
Most recently, 2D distributions of O2 have been measured usingplanar optodes8�10 providing novel insights into high resolutionO2 dynamics in a range of complex and heterogeneous marineenvironments.9 In wetlands, detailed investigations on subsoil O2
distribution are important as the transport of soil gases occursboth via diffusive transport in the pores as well as through theaerenchymous tissue of many wetland plants.11,12
The quantification of soil-atmosphere gas exchange at a highspatiotemporal resolution requires detailed knowledge about themass transfer properties of the soil system. However, standard
Received: October 20, 2010Accepted: February 24, 2011Revised: February 13, 2011
ABSTRACT: Oxygen (O2) availability and diffusivity in wetlands are control-ling factors for the production and consumption of both carbon dioxide (CO2)and methane (CH4) in the subsoil and thereby potential emission of thesegreenhouse gases to the atmosphere. To examine the linkage between high-resolution spatiotemporal trends in O2 availability and CH4/CO2 dynamicsin situ, we compare high-resolution subsurface O2 concentrations, weeklymeasurements of subsurface CH4/CO2 concentrations and near continuousflux measurements of CO2 and CH4. Detailed 2-D distributions of O2
concentrations and depth-profiles of CO2 and CH4 were measured in thelaboratory during flooding of soil columns using a combination of planar O2
optodes and membrane inlet mass spectrometry. Microsensors were used to assess apparent diffusivity under both field andlaboratory conditions. Gas concentration profiles were analyzed with a diffusion-reaction model for quantifying production/consumption profiles of O2, CO2, and CH4. In drained conditions, O2 consumption exceeded CO2 production, indicating CO2
dissolution in the remaining water-filled pockets. CH4 emissions were negligible when the oxic zone was >40 cm and CH4 waspresumably consumed below the depth of detectable O2. In flooded conditions, O2 was transported by other mechanisms thansimple diffusion in the aqueous phase. This work demonstrates the importance of changes in near-surface apparent diffusivity,microscale O2 dynamics, as well as gas transport via aerenchymous plants tissue on soil gas dynamics and greenhouse gas emissionsfollowing marked changes in water level.
3394 dx.doi.org/10.1021/es103540k |Environ. Sci. Technol. 2011, 45, 3393–3399
Environmental Science & Technology ARTICLE
equations for calculating effective diffusion coefficients of wet-land soils and peat are few13,14 and limited by rapid changes in air-filled porosity as well as total porosity values following changes inwater level. High resolution measurements of the mass transferproperties under fluctuating soil moisture conditions will poten-tially help clarifying the mechanisms regulating greenhouse gasemissions from wetland soils. Therefore, this work aims to (i)quantify subsurface O2 dynamics in a protected Danish wetlandwith respect to natural water level fluctuations, and (ii) toquantify depth-specific O2, CO2, and CH4 consumption/pro-duction profiles based on observed in situ gas concentrations andapparent gas diffusivity measurements using PROFILE, a simplediffusion-reaction model15 for analysis of measured concentra-tion gradients.
’MATERIALS AND METHODS
Study Site. The study site is situated in a temperate wetlandarea, Maglemosen (55�510N, 12�320E) formed through theretreat of an ancient inlet in Vedbæk, 20 km north of Copenha-gen, Denmark (Supporting Information, SI, Figure 1S). Meanannual air temperature is 8 �C and mean annual precipitation is613 mm (normals for 1961�1990, Danish MeteorologicalInstitute). The wetland is characterized as a fen covering an areaof roughly 0.6 km2 with peat depths ranging from 0.5 to 3 m. Themean annual water level in 2007�2008 was 14 cm below thesurface and ranged from 6 cm above the surface to 73 cm belowthe surface. The study site has not been managed for >100 yearsand is dominated by graminoids, mainly reed canary grass(Phalaris arundinacea) but also common reed (Phragmites australis)and different herbs.Field Measurements and Sampling. Subsoil CO2 and CH4
concentration profiles and surface fluxes were measured on aweekly basis (January to August 2009). Ground temperature,water content, water level, and O2 concentrations were loggedcontinuously on an hourly basis. Soil CO2 fluxes (microbial androot respiration) were measured using an infrared gas analyzer(LiCor 6400�09/6262 Soil CO2 Flux Chamber, LiCor, Lincoln,USA) attached to a portable chamber, functioning as a dark andclosed soil-flux chamber and placed on top of open preinstalledsoil collars (10 cm in diameter) for 2�3 min at sites withoutplants within the collars. The CO2 efflux was calculated on thebasis of a linear increase (r2 > 0.95) in chamber CO2 concentra-tions over time on 10 replicate collars. Soil CH4 fluxes weremeasured using three replicate static collars installed to a depthof 8 cm and leaving 2 cm above the surface. These collarswere closed during measurements using a closed-end CHA-typeplumbing creating a total chamber volume of about 0.5 L.Headspace gas samples were extracted four times at 15-minintervals and stored in 2.5 mL glass injection flasks with poly-isobutylene septa. Gas samples were analyzed for CH4 within24 h using a gas chromatography (Shimadzu GC 2014 with BackFlush system, SHIMADZU EUROPA GmbH, Duisburg, Germany)equipped with a Mol Sieve 5A 80/100 mesh (1/8”� 1 m) columnconnected to an FID detector.Air in the soil pores was sampled for CO2 and CH4 analyses at
depths of 5, 10, 20, 30, 40, 50, 60, 80, 110, and 140 cm usingsilicone probes as described.16,17
Oxygen (O2) concentrations were measured at in situ 5, 10,15, 20, 25, 30, 40, 50, 60, 80, and 110 cm depth using fiber-optic O2 optodes connected to a fiber-optic oxygen meter(FIBOX 3, Presens GmbH, Germany) in combination with K-type
thermocouples connected to a thermometer (RS 206�3722).Temperature readings were made with the same spatiotemporalresolution asO2 in order to enable temperature compensation of thesensor signals. All sensors were linearly calibrated with a 2 pointtemperature and O2 concentration procedure with precisionse5%of standard deviation at standard temperature and pressure. In thelaboratory, electrochemical O2 microsensors (OX-50, 40�60 μmtip diameter; Unisense A/S, Aarhus, Denmark) connected to a pAmeter (PA2000, Unisense A/S, Aarhus, Denmark) were used tomeasure O2 concentrations under flooded conditions when O2
penetration depths were <5 cm and in soil without plants (>0.5 mfrom nearest Phalaris arundinacea).Volumetric soil water content was measured using soil mois-
ture sensors (Theta Probes ML2x, Delta-T Devices Ltd., Cam-bridge, UK) installed in 8 depths in one profile and connected toa datalogger (Campbell, CR10X Datalogger for Measurement& Control, Campbell Scientific Ltd., Loughborough, UK). Thewater level was measured by a pressure sensor (PCR 1830,Druck) submerged in a 2.5 m perforated plastic tube. All instal-lations were completed more than two months prior to measure-ments (see SI).Depth and volume-specific soil samples (∼ 100 cm3) were
collected from pits and included all major horizons (includingthe litter layer). In situ pH measurements (Metrohm 704 PocketpH meter, Metrohm Nordic, Glostrup, Denmark) were madedirectly with probes inserted into peat/sediment or after theaddition of distilled water at depths with a soil-solution ratio of∼1:2.5. Bulk density was determined on the basis of the weight ofdried volume-specific soil cores. Total organic carbon (TOC) wasmeasured after acidification, using 6MHCl to remove inorganic Cusing anEltra SC-500 analyzer (ELTRAGmbH,Neuss, Germany),with an accuracy of (0.2%. Four replicate soil columns weresampled and stored in the dark at 4 �C until analysis in the labor-atory. Three additional columnswithout living plants were sampledduring winter in circular PVC columns (id:20 cm, h:60 cm), withone side removed, where a Plexiglas sheet containing a planaroptode was fixed for laboratory experimental work. The soilcolumnopeningswere closedwith rubber-coated aluminum sheets,the upper with a large opening to ensure equilibrium with theatmosphere.Experimental Work. Gas profiling using Membrane Inlet
Mass Spectrometry (MIMS) and planar optode (PO) imagingwere made in the dark at 10 �C after >6 months preincubation toobtain steady state conditions, and with a water level 5 cm abovethe peat surface. An aquarium pump was used to aerate the watercolumn keeping it at atmospheric O2 saturation. Depth-specificanalyses of dissolved CH4, CO2, and Ar concentrations weredone with a quadrupole mass spectrometer (QMA125, Balzers,Liectenstein), where CH4 and CO2 concentrations were normal-ized using a two-point calibration with Ar as an internal standard.Details of the MIMS and PO setups have been describedelsewhere17 and are also included in the SI.Apparent Diffusivity.Microscale diffusivity sensors (DF200,
Unisense A/S, Aarhus, Denmark) with a tip diameter of 200 μmwere applied to measure apparent diffusivity, i.e., the bulkdiffusivity in partly saturated peat and sediment by measuringconcentrations of a tracer gas in an internal H2 gas (at 1 atmpartial pressure) reservoir within the sensor tip.18 In brief, thediffusivity sensor is a hydrogen transducer in which an air volumebehind a separating membrane is continuously flushed avoidingpotential interference with both O2 and CO2. A mathematicalmodel has been made18 which describes the sensor signal as a
3395 dx.doi.org/10.1021/es103540k |Environ. Sci. Technol. 2011, 45, 3393–3399
Environmental Science & Technology ARTICLE
function of diffusivity and is based on a two-point calibration.Standards for calibration in this work included: (1) stagnantwater, (2) 5�20 and 40�75 μm unsorted glass beads in water,and (3) a standard moist peat sample. The apparent diffusivityof the glass beads have previously been measured in diffusionchambers18 and the moist peat sample was previously measured.19
In the current study, mean values (n= 25) of apparent diffusivity foreach depth interval was measured in situ under drained condition.Measurements were repeated in the laboratory using intact coresand subsequently measured again after flooding (within one week).Measurements were repeated monthly on 5 replicate cores fromthe well-drained top layer monthly over 3 months following coreflooding. Tabulated values for the O2 solubility and diffusioncoefficient20 were used to calculateO2 concentrations at atmosphericsaturation and the diffusivity ofO2 in distilledwater at 10 �C(1.57�10�5 cm2 s�1). Diffusion coefficients for CO2 and CH4 werecalculated by multiplying the value for O2 by 0.7961 and 0.8495.
20,21
Oxygen Diffusion-Reaction Model. Steady-state profileanalysis was performed using the diffusion-reaction modelPROFILE15 providing estimates of net consumption/productionrates as a function of depth using measured diffusivities and gasconcentrations as input values. The diffusion-reaction modelprovides an objective selection of the simplest consumption/production profile that reproduces the measured concentrationprofiles based on Ficks’ second law. On the basis of such calculatedproduction/consumption profiles, the depth-integrated gasfluxes were estimated by PROFILE and subsequently comparedto fluxes measured in situ. Boundary conditions for simulationswere no flux at the bottom and atmospheric conditions at the top.
’RESULTS AND DISCUSSION
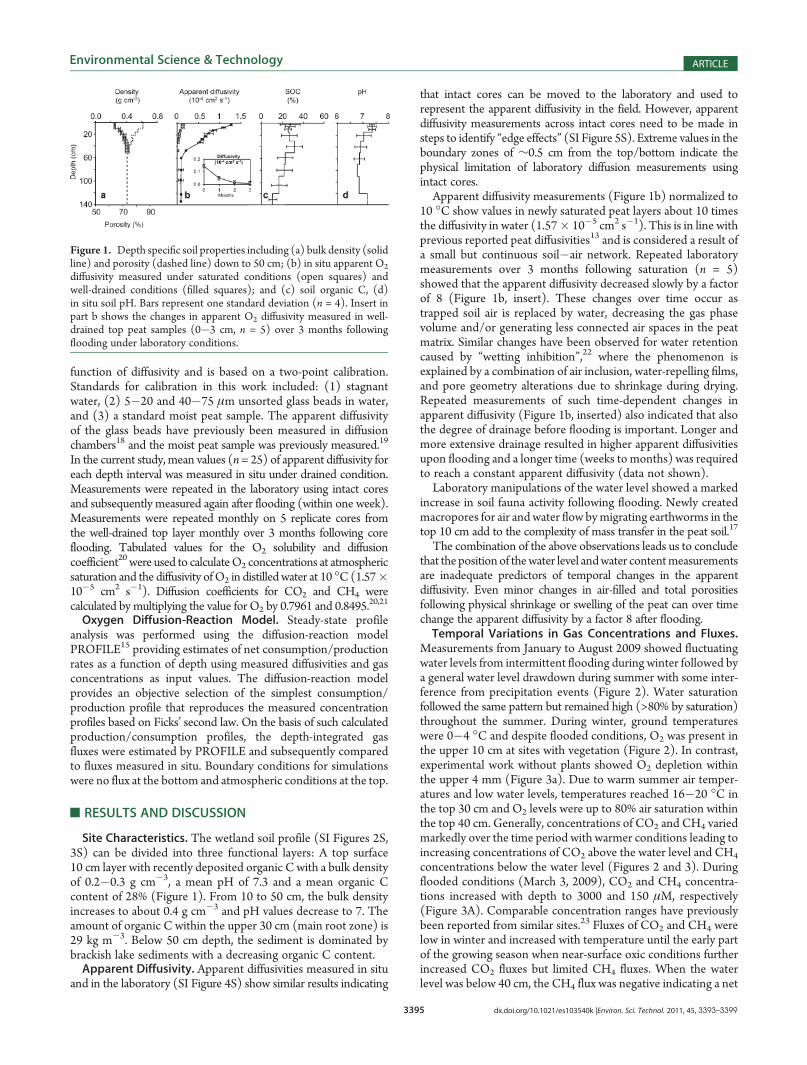
Site Characteristics. The wetland soil profile (SI Figures 2S,3S) can be divided into three functional layers: A top surface10 cm layer with recently deposited organic C with a bulk densityof 0.2�0.3 g cm�3, a mean pH of 7.3 and a mean organic Ccontent of 28% (Figure 1). From 10 to 50 cm, the bulk densityincreases to about 0.4 g cm�3 and pH values decrease to 7. Theamount of organic C within the upper 30 cm (main root zone) is29 kg m�3. Below 50 cm depth, the sediment is dominated bybrackish lake sediments with a decreasing organic C content.Apparent Diffusivity. Apparent diffusivities measured in situ
and in the laboratory (SI Figure 4S) show similar results indicating
that intact cores can be moved to the laboratory and used torepresent the apparent diffusivity in the field. However, apparentdiffusivity measurements across intact cores need to be made insteps to identify “edge effects” (SI Figure 5S). Extreme values in theboundary zones of ∼0.5 cm from the top/bottom indicate thephysical limitation of laboratory diffusion measurements usingintact cores.Apparent diffusivity measurements (Figure 1b) normalized to
10 �C show values in newly saturated peat layers about 10 timesthe diffusivity in water (1.57� 10�5 cm2 s�1). This is in line withprevious reported peat diffusivities13 and is considered a result ofa small but continuous soil�air network. Repeated laboratorymeasurements over 3 months following saturation (n = 5)showed that the apparent diffusivity decreased slowly by a factorof 8 (Figure 1b, insert). These changes over time occur astrapped soil air is replaced by water, decreasing the gas phasevolume and/or generating less connected air spaces in the peatmatrix. Similar changes have been observed for water retentioncaused by “wetting inhibition”,22 where the phenomenon isexplained by a combination of air inclusion, water-repelling films,and pore geometry alterations due to shrinkage during drying.Repeated measurements of such time-dependent changes inapparent diffusivity (Figure 1b, inserted) also indicated that alsothe degree of drainage before flooding is important. Longer andmore extensive drainage resulted in higher apparent diffusivitiesupon flooding and a longer time (weeks to months) was requiredto reach a constant apparent diffusivity (data not shown).Laboratory manipulations of the water level showed a marked
increase in soil fauna activity following flooding. Newly createdmacropores for air and water flow bymigrating earthworms in thetop 10 cm add to the complexity of mass transfer in the peat soil.17
The combination of the above observations leads us to concludethat the position of thewater level andwater contentmeasurementsare inadequate predictors of temporal changes in the apparentdiffusivity. Even minor changes in air-filled and total porositiesfollowing physical shrinkage or swelling of the peat can over timechange the apparent diffusivity by a factor 8 after flooding.Temporal Variations in Gas Concentrations and Fluxes.
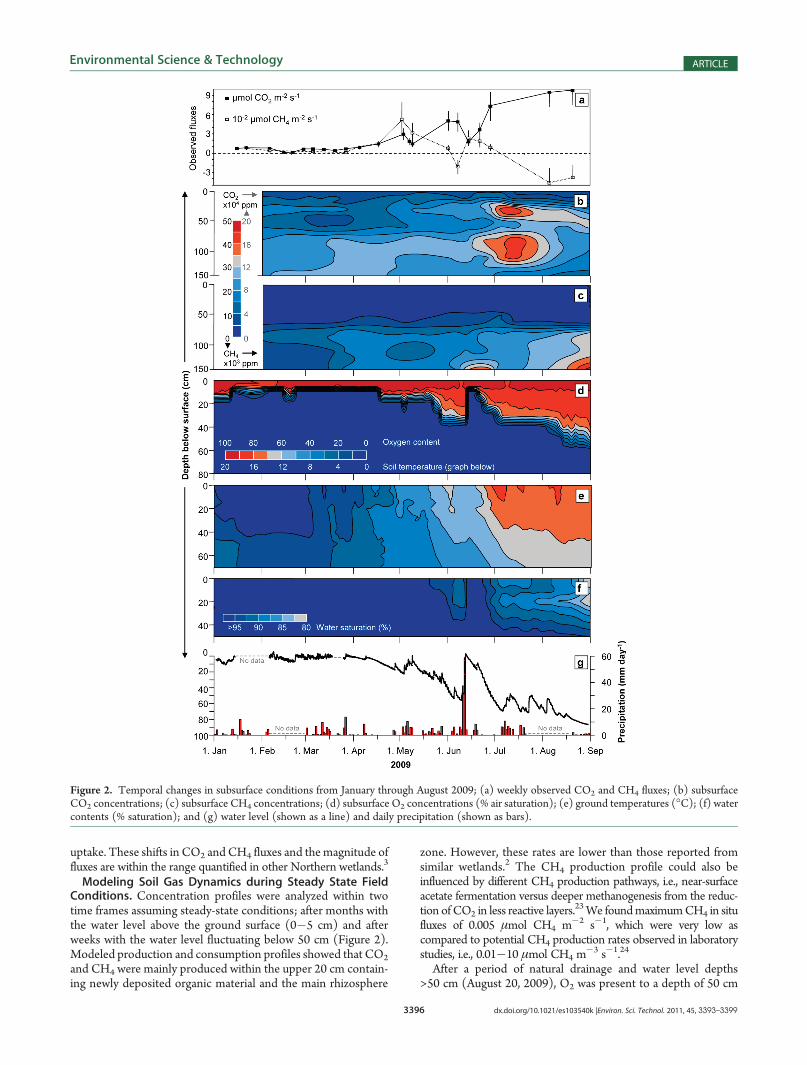
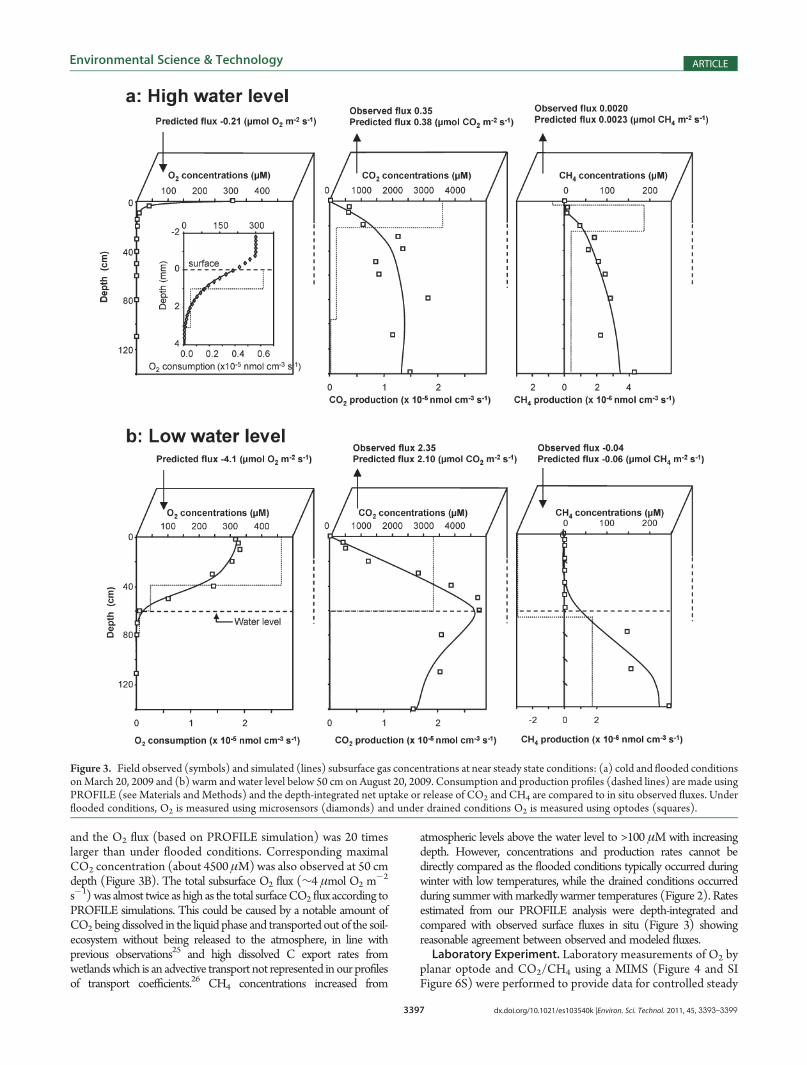
Measurements from January to August 2009 showed fluctuatingwater levels from intermittent flooding during winter followed bya general water level drawdown during summer with some inter-ference from precipitation events (Figure 2). Water saturationfollowed the same pattern but remained high (>80% by saturation)throughout the summer. During winter, ground temperatureswere 0�4 �C and despite flooded conditions, O2 was present inthe upper 10 cm at sites with vegetation (Figure 2). In contrast,experimental work without plants showed O2 depletion withinthe upper 4 mm (Figure 3a). Due to warm summer air temper-atures and low water levels, temperatures reached 16�20 �C inthe top 30 cm and O2 levels were up to 80% air saturation withinthe top 40 cm. Generally, concentrations of CO2 and CH4 variedmarkedly over the time period with warmer conditions leading toincreasing concentrations of CO2 above the water level and CH4
concentrations below the water level (Figures 2 and 3). Duringflooded conditions (March 3, 2009), CO2 and CH4 concentra-tions increased with depth to 3000 and 150 μM, respectively(Figure 3A). Comparable concentration ranges have previouslybeen reported from similar sites.23 Fluxes of CO2 and CH4 werelow in winter and increased with temperature until the early partof the growing season when near-surface oxic conditions furtherincreased CO2 fluxes but limited CH4 fluxes. When the waterlevel was below 40 cm, the CH4 flux was negative indicating a net
Figure 1. Depth specific soil properties including (a) bulk density (solidline) and porosity (dashed line) down to 50 cm; (b) in situ apparent O2
diffusivity measured under saturated conditions (open squares) andwell-drained conditions (filled squares); and (c) soil organic C, (d)in situ soil pH. Bars represent one standard deviation (n = 4). Insert inpart b shows the changes in apparent O2 diffusivity measured in well-drained top peat samples (0�3 cm, n = 5) over 3 months followingflooding under laboratory conditions.
3396 dx.doi.org/10.1021/es103540k |Environ. Sci. Technol. 2011, 45, 3393–3399
Environmental Science & Technology ARTICLE
uptake. These shifts in CO2 and CH4 fluxes and themagnitude offluxes are within the range quantified in other Northern wetlands.3
Modeling Soil Gas Dynamics during Steady State FieldConditions. Concentration profiles were analyzed within twotime frames assuming steady-state conditions; after months withthe water level above the ground surface (0�5 cm) and afterweeks with the water level fluctuating below 50 cm (Figure 2).Modeled production and consumption profiles showed that CO2
and CH4 were mainly produced within the upper 20 cm contain-ing newly deposited organic material and the main rhizosphere
zone. However, these rates are lower than those reported fromsimilar wetlands.2 The CH4 production profile could also beinfluenced by different CH4 production pathways, i.e., near-surfaceacetate fermentation versus deeper methanogenesis from the reduc-tion of CO2 in less reactive layers.
23We foundmaximumCH4 in situfluxes of 0.005 μmol CH4 m�2 s�1, which were very low ascompared to potential CH4 production rates observed in laboratorystudies, i.e., 0.01�10 μmol CH4 m
�3 s�1.24
After a period of natural drainage and water level depths>50 cm (August 20, 2009), O2 was present to a depth of 50 cm
Figure 2. Temporal changes in subsurface conditions from January through August 2009; (a) weekly observed CO2 and CH4 fluxes; (b) subsurfaceCO2 concentrations; (c) subsurface CH4 concentrations; (d) subsurface O2 concentrations (% air saturation); (e) ground temperatures (�C); (f) watercontents (% saturation); and (g) water level (shown as a line) and daily precipitation (shown as bars).
3397 dx.doi.org/10.1021/es103540k |Environ. Sci. Technol. 2011, 45, 3393–3399
Environmental Science & Technology ARTICLE
and the O2 flux (based on PROFILE simulation) was 20 timeslarger than under flooded conditions. Corresponding maximalCO2 concentration (about 4500 μM)was also observed at 50 cmdepth (Figure 3B). The total subsurface O2 flux (∼4 μmol O2 m
�2
s�1) was almost twice as high as the total surfaceCO2 flux according toPROFILE simulations. This could be caused by a notable amount ofCO2 being dissolved in the liquid phase and transported out of the soil-ecosystem without being released to the atmosphere, in line withprevious observations25 and high dissolved C export rates fromwetlandswhich is an advective transport not represented in our profilesof transport coefficients.26 CH4 concentrations increased from
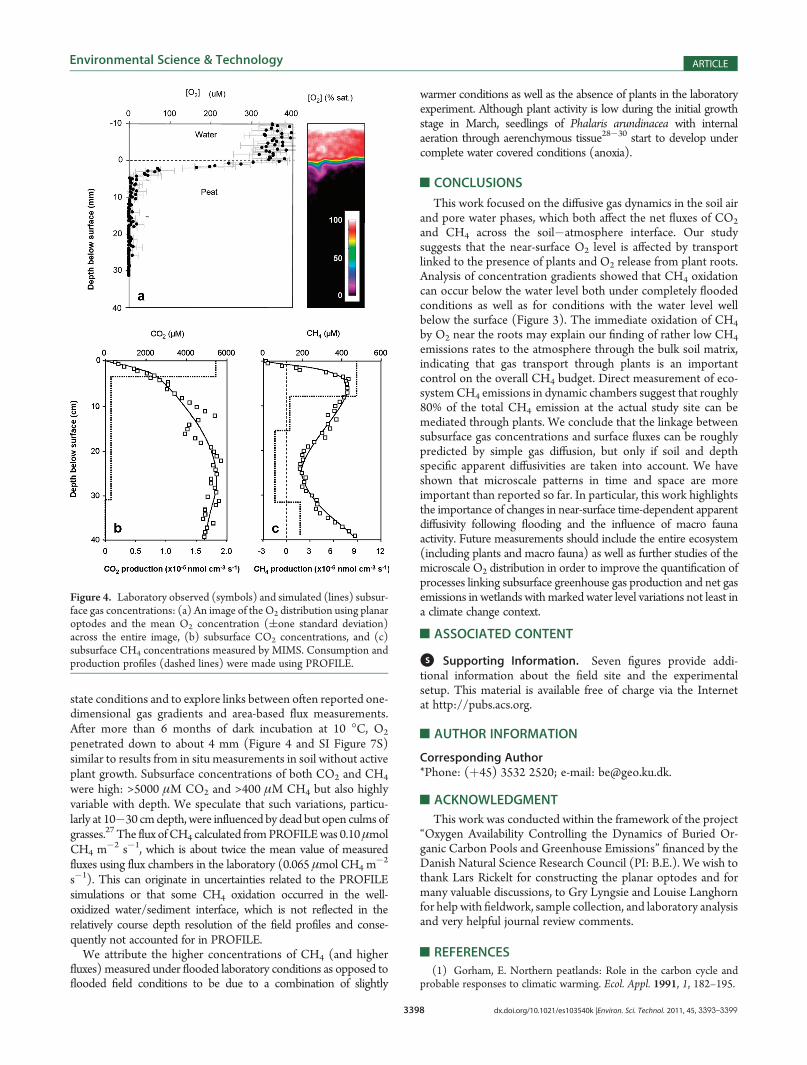
atmospheric levels above the water level to >100 μM with increasingdepth. However, concentrations and production rates cannot bedirectly compared as the flooded conditions typically occurred duringwinter with low temperatures, while the drained conditions occurredduring summer withmarkedly warmer temperatures (Figure 2). Ratesestimated from our PROFILE analysis were depth-integrated andcompared with observed surface fluxes in situ (Figure 3) showingreasonable agreement between observed and modeled fluxes.Laboratory Experiment. Laboratory measurements of O2 by
planar optode and CO2/CH4 using a MIMS (Figure 4 and SIFigure 6S) were performed to provide data for controlled steady
Figure 3. Field observed (symbols) and simulated (lines) subsurface gas concentrations at near steady state conditions: (a) cold and flooded conditionsonMarch 20, 2009 and (b) warm and water level below 50 cm on August 20, 2009. Consumption and production profiles (dashed lines) are made usingPROFILE (see Materials and Methods) and the depth-integrated net uptake or release of CO2 and CH4 are compared to in situ observed fluxes. Underflooded conditions, O2 is measured using microsensors (diamonds) and under drained conditions O2 is measured using optodes (squares).
3398 dx.doi.org/10.1021/es103540k |Environ. Sci. Technol. 2011, 45, 3393–3399
Environmental Science & Technology ARTICLE
state conditions and to explore links between often reported one-dimensional gas gradients and area-based flux measurements.After more than 6 months of dark incubation at 10 �C, O2
penetrated down to about 4 mm (Figure 4 and SI Figure 7S)similar to results from in situ measurements in soil without activeplant growth. Subsurface concentrations of both CO2 and CH4
were high: >5000 μM CO2 and >400 μM CH4 but also highlyvariable with depth. We speculate that such variations, particu-larly at 10�30 cmdepth, were influenced by dead but open culms ofgrasses.27 The flux of CH4 calculated fromPROFILEwas 0.10μmolCH4 m
�2 s�1, which is about twice the mean value of measuredfluxes using flux chambers in the laboratory (0.065 μmol CH4 m
�2
s�1). This can originate in uncertainties related to the PROFILEsimulations or that some CH4 oxidation occurred in the well-oxidized water/sediment interface, which is not reflected in therelatively course depth resolution of the field profiles and conse-quently not accounted for in PROFILE.We attribute the higher concentrations of CH4 (and higher
fluxes) measured under flooded laboratory conditions as opposed toflooded field conditions to be due to a combination of slightly
warmer conditions as well as the absence of plants in the laboratoryexperiment. Although plant activity is low during the initial growthstage in March, seedlings of Phalaris arundinacea with internalaeration through aerenchymous tissue28�30 start to develop undercomplete water covered conditions (anoxia).
’CONCLUSIONS
This work focused on the diffusive gas dynamics in the soil airand pore water phases, which both affect the net fluxes of CO2
and CH4 across the soil�atmosphere interface. Our studysuggests that the near-surface O2 level is affected by transportlinked to the presence of plants and O2 release from plant roots.Analysis of concentration gradients showed that CH4 oxidationcan occur below the water level both under completely floodedconditions as well as for conditions with the water level wellbelow the surface (Figure 3). The immediate oxidation of CH4
by O2 near the roots may explain our finding of rather low CH4
emissions rates to the atmosphere through the bulk soil matrix,indicating that gas transport through plants is an importantcontrol on the overall CH4 budget. Direct measurement of eco-systemCH4 emissions in dynamic chambers suggest that roughly80% of the total CH4 emission at the actual study site can bemediated through plants. We conclude that the linkage betweensubsurface gas concentrations and surface fluxes can be roughlypredicted by simple gas diffusion, but only if soil and depthspecific apparent diffusivities are taken into account. We haveshown that microscale patterns in time and space are moreimportant than reported so far. In particular, this work highlightsthe importance of changes in near-surface time-dependent apparentdiffusivity following flooding and the influence of macro faunaactivity. Future measurements should include the entire ecosystem(including plants and macro fauna) as well as further studies of themicroscale O2 distribution in order to improve the quantification ofprocesses linking subsurface greenhouse gas production and net gasemissions in wetlands withmarked water level variations not least ina climate change context.
’ASSOCIATED CONTENT
bS Supporting Information. Seven figures provide addi-tional information about the field site and the experimentalsetup. This material is available free of charge via the Internetat http://pubs.acs.org.
’AUTHOR INFORMATION
Corresponding Author*Phone: (þ45) 3532 2520; e-mail: [email protected].
’ACKNOWLEDGMENT
This work was conducted within the framework of the project“Oxygen Availability Controlling the Dynamics of Buried Or-ganic Carbon Pools and Greenhouse Emissions” financed by theDanish Natural Science Research Council (PI: B.E.). We wish tothank Lars Rickelt for constructing the planar optodes and formany valuable discussions, to Gry Lyngsie and Louise Langhornfor help with fieldwork, sample collection, and laboratory analysisand very helpful journal review comments.
’REFERENCES
(1) Gorham, E. Northern peatlands: Role in the carbon cycle andprobable responses to climatic warming. Ecol. Appl. 1991, 1, 182–195.
Figure 4. Laboratory observed (symbols) and simulated (lines) subsur-face gas concentrations: (a) An image of the O2 distribution using planaroptodes and the mean O2 concentration ((one standard deviation)across the entire image, (b) subsurface CO2 concentrations, and (c)subsurface CH4 concentrations measured by MIMS. Consumption andproduction profiles (dashed lines) were made using PROFILE.

3399 dx.doi.org/10.1021/es103540k |Environ. Sci. Technol. 2011, 45, 3393–3399
Environmental Science & Technology ARTICLE
(2) Blodau, C.; Moore, T. R. Micro-scale CO2 and CH4 dynamics ina peat soil during a water fluctuation and sulphate pulse. Soil Biol.Biochem. 2003, 35, 535�547, DOI: 10.1016/S0038-0717(03)00008-7.(3) Strack, M.; Waddington, J. M. Response of peatland carbon
dioxide and methane fluxes to a water table drawdown experiment.Global Biogeochem. Cycles 2007, 21, GB1007, DOI: 10.1029/2006GB002715.(4) Laiho, R. Decomposition in peatlands: Reconciling seemingly
contrasting results on the impacts of lowered water levels. Soil Biol.Biochem. 2006, 38(8), 2011�2024, DOI: 10.1016/j.soilbio.2006.02.017.(5) Wachinger, G.; Fiedler, S.; Zepp, K.; Gattinger, A.; Sommer, M.;
Roth, K. Variability of soil methane production on the micro-scale:Spatial association with hot spots of organic material and Archaealpopulations. Soil Biol. Biochem. 2000, 32, 1121�1130, DOI: 10.1016/S0038-0717(00)00024-9.(6) Le Mer, J., Roger, P. Production, oxidation, emission, and
consumption of methane by soils: A review. Eur. J. Soil Sci. 2001, 37,25�50, DOI: 10.1016/S1164-5563(01)01067-6.(7) K€uhl, M. Optical microsensors for analysis of microbial commu-
nities. Environmental Microbiology. Methods Enzymol. 2005, 397,166�199, DOI: 10.1016/S0076-6879(05)97010-9.(8) Glud, R. N.; Ramsing, N. B.; Gundersen, J. K.; et al.; Planar
optodes, a new tool for fine scale measurements of two-dimensional O2
distribution in benthic communities. Mar. Ecol.: Prog. Ser., 1996, 140,217�226; IDS Number: VJ377.(9) Glud, R. N. Oxygen dynamics of marine sediments. Mar. Biol.
Res. 2008, 4, 243�289, DOI: 10.1080/17451000801888726.(10) K€uhl, M.; Polerecky, L. Functional and structural imaging of
phototrophic microbial communities and symbioses. Aquat. Microb.Ecol. 2008, 53, 99�118, DOI: 10.3354/ame01224.(11) Armstrong, W.Oxygen diffusion from the roots of some British
bog plants. Nature 1964, 204, 801�802.(12) Colmer, T. D. Long-distance transport of gases in plants: a
perspective on internal aeration and radial oxygen loss from roots. Plant,cell Environ. 2003, 26(1), 17�36.(13) Stephen, K. D.; Arah, J. R. M.; Thomas, K. L.; Benstead, J.;
Lloyd, D. Gas diffusion coefficient profile in peat determined bymodelling mass spectrometric data: implications for gas phase distribu-tion. Soil Biol. Biochem. 1998, 30(3), 429�431, DOI:10.1016/S0038-0717(97)00118-1.(14) Iiyama, I.; Hasegawa, S. Gas diffusion coefficient of undisturbed
peat soils. Soil Sci. Plant Nutr. 2005, 51(3), 431�435, DOI: 10.1111/j.1747-0765.2005.tb00049.x.(15) Berg, P.; Risgaard-Petersen, N.; Rysgaard, S. Interpretation of
measured concentration profiles in sediment pore water. Limnol.Oceanogr. 1998, 43, 1500�1510.(16) Kammann, C.; Grunhage, L.; Jager, H.-J. A new sampling
technique to monitor concentrations of CH4, N2O and CO2 in air atwell-defined depths in soils with varied water potential. Eur. J. Soil Sci.2001, 52, 297�303, DOI: 10.1046/j.1365-2389.2001.00380.x(17) Askaer, L.; Elberling, B.; Glud, R. N.; K€uhl, M.; Lauritsen, F. R.;
Joensen, H. P. Soil heterogeneity effects on O2 distribution and CH4
emissions from wetlands: In situ and mesocosm studies with planar O2
optodes and membrane inlet mass spectrometry. . Soil Biol. Biochem.2010, 42, 2254�2265, DOI: 10.1016/j.soilbio.2010.08.026.(18) Revsbech, N. P.; Nielsen, L. P.; Ramsing, N. B. A novel
microsensor for determination of apparent diffusivity in sediments.Limnol. Oceanogr. 1998. 43, 986�992.(19) Elberling, B. Gas phase diffusion coefficients in cemented
porous media. J Hydrol. 1996, 178, 93�108.(20) Ramsing, N.; Gundersen, J. Seawater and gases—Tabulated
physical parameters of interest to people working with microsensors inmarine systems. Version 2.0. 1994, Unisense Internal Report, 16 pp.(21) Li, Y.-H.; Gregory, S. Diffusion of ions in seawater and deep-sea
sediments. Geochim. Cosmochim. Acta 1974, 38, 703�714.(22) Schw€arzel, K.; Renger, M.; Sauerbrey, R.; Wessolek, G. Soil
physical characteristics of peat soils. J. Plant Nutr. Soil Sci. 2002, 165(4),479�486, DOI: 10.1002/1522-2624(200208).
(23) Hornibrook, E. R. C.; Longstaff. F. J.; Fyfe, W. S. Spatialdistribution of microbial methane production pathways in temperatezone wetland soils: Stable carbon and hydrogen isotope evidence.Geochim. Cosmochim. Acta 1997, 61, 745�753, DOI: 10.1016/S0016-7037(96)00368-7.
(24) Segers, R. Methane production and methane consumption: Areview of processes underlying wetland methane fluxes. Biogeochem.1998, 41, 23�51, DOI: 10.1023/A:1005929032764.
(25) Iiyama, I.; Hasegawa, S. In situ CO2 profiles with complemen-tary monitoring of O2 in a drained peat layer. Soil Sci. Plant Nutr. 2009,55, 26�34, DOI: 10.1111/j.1747-0765.2008.00331.x.
(26) Fenner, N.; Freeman, C.; Lock, M. A.; Harmens, H.; Reynolds,B.; Sparks, T. Interactions between elevated CO2 and warming couldamplify DOC exports from peatland catchments. Environ. Sci. Technol.2007, 41, 3146�3152, DOI: 10.1021/es061765v.
(27) Tanaka, N.; Yutani, K.; Aye, T.; Jinadasa, K. B. S. N. Effect ofbroken dead culms of Phragmites australis on radial oxygen loss inrelation to radiation and temperature. Hydrobiol. 2007, 583, 165-172,DOI: 10.1007/s10750-006-0483-7.
(28) Brix, H.; Lorenzen, B.; Morris, J. T.; Schierup, H. H.; Sorrell,B. K. Effect of oxygen and nitrate on ammonium uptake kinetics andadenylate pools in Phalaris arundinacea L. andGlyceria maxima (Hartm)Holmb. Proc. R. Soc. Edinburgh 1994, 102B, 333–342.
(29) Kercher, S. M.; Zedler. J. B. Flood tolerance in wetlandangiosperms: A comparison of invasive and noninvasive species. AquatBot. 2004, 80, 89-102, DOI: 10.1016/j.aquabot.2004.08.003.
(30) Askaer, L.; Elberling, B.; Jørgensen, C. J.; Friborg, T.; Hansen,B. U. Plant-mediated CH4 transport and C gas dynamics quantifiedin situ in a Phalaris arundinacea-dominant wetland. Plant Soil 2011,DOI: 10.1007/s11104-011-0718-x.