linking land cover to water quality - noaa office for ...€“ nonpoint-source pollution and...
TRANSCRIPT

Linking Land Cover to Water Quality
Weeks Bay Watershed, Alabama
Jamie Carter, IMSG PSGS
NOAA Coastal Services Center
Outline
A. Land Cover and Water Quality
B. The Project at the Weeks Bay National Estuarine Research Reserve (NERR)
C. Three-Tier Strategy to Address Nonpoint Source Pollution

Understanding Runoff Generation
• Controlled by– Climate– Vegetation– Land cover and use– Soil properties– Topography– Rainfall characteristics

Land Use and Imperviousness
INTENSITY OF LAND USE
POTENTIAL WATER QUALITY ISSUES
AMOUNT OF IMPERVIOUS SURFACE
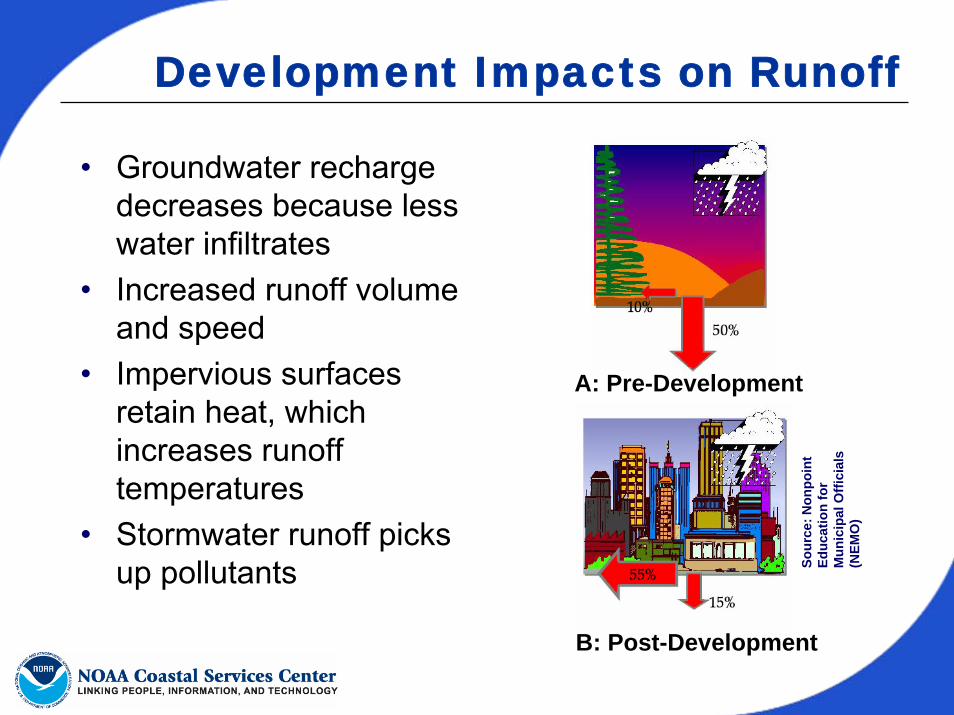
Development Impacts on Runoff
• Groundwater recharge decreases because less water infiltrates
• Increased runoff volume and speed
• Impervious surfaces retain heat, which increases runoff temperatures
• Stormwater runoff picks up pollutants So
urce
: Non
poin
t Ed
ucat
ion
for
Mun
icip
al O
ffici
als
(NEM
O)
B: Post-Development
A: Pre-Development
The Pollutants in Polluted Runoff
• Sediment: – cropland, lawns and gardens, forestry activities, roadways,
construction sites, and stream-bank erosion
• Nutrients: – cropland, lawns and gardens, livestock operations, wildlife,
septic systems, and land receiving waste application
• Pathogens: – livestock, wildlife, septic systems, land receiving waste
application, and urban runoff
• Toxic contaminants (including pesticides): – roadways, mining operations, cropland, lawns and gardens,
and forestry
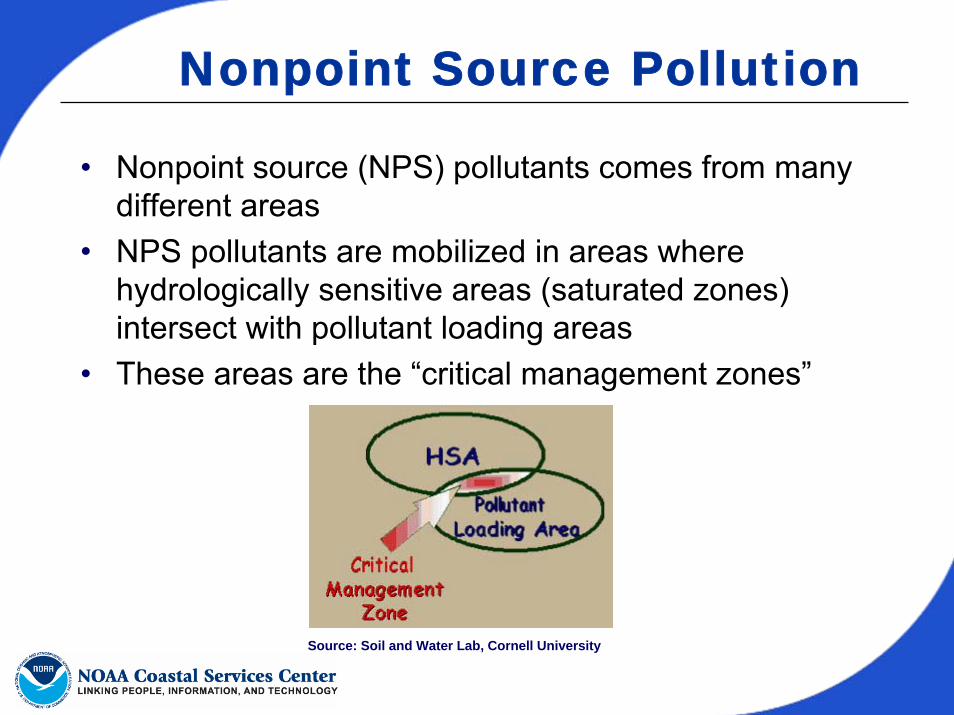
Nonpoint Source Pollution
• Nonpoint source (NPS) pollutants comes from many different areas
• NPS pollutants are mobilized in areas where hydrologically sensitive areas (saturated zones) intersect with pollutant loading areas
• These areas are the “critical management zones”
Source: Soil and Water Lab, Cornell University
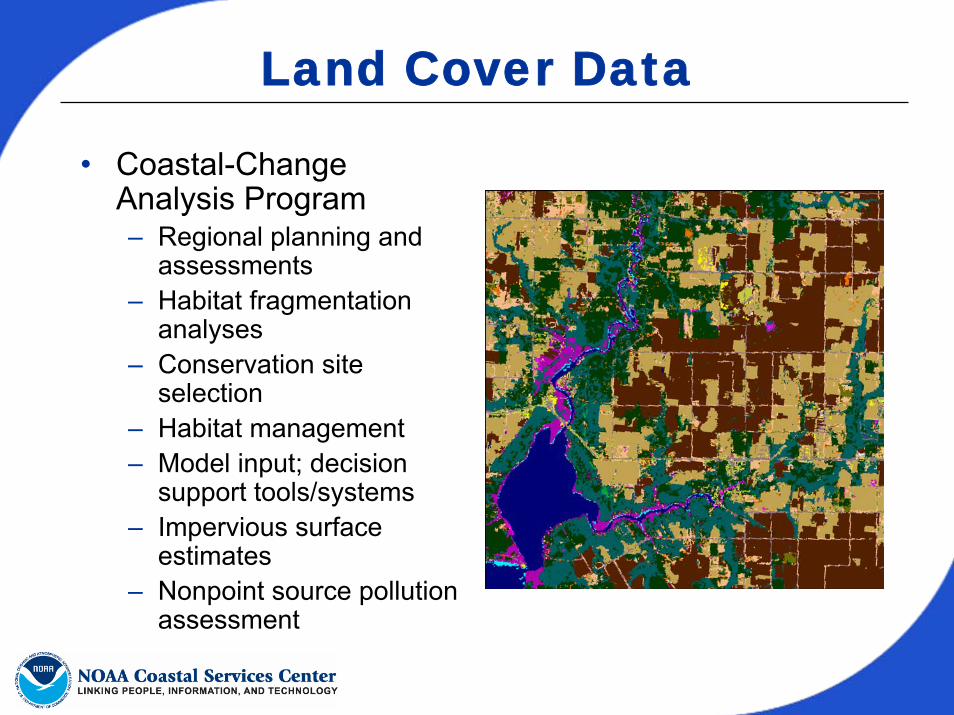
Land Cover Data
• Coastal-Change Analysis Program– Regional planning and
assessments– Habitat fragmentation
analyses– Conservation site
selection– Habitat management– Model input; decision
support tools/systems – Impervious surface
estimates– Nonpoint source pollution
assessment
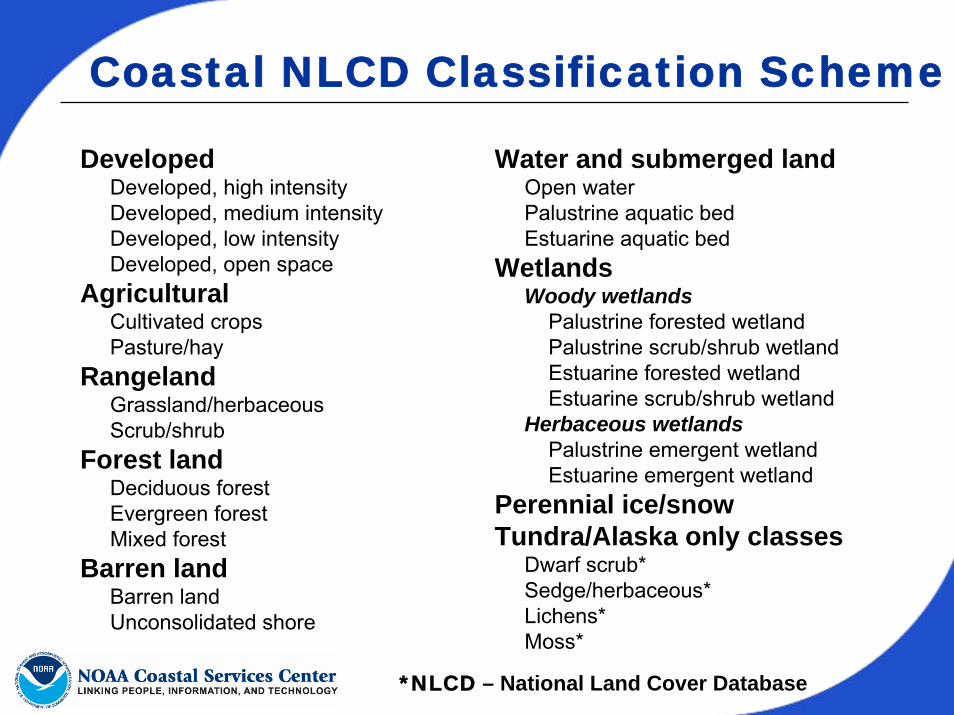
Coastal NLCD Classification Scheme
DevelopedDeveloped, high intensity Developed, medium intensityDeveloped, low intensity Developed, open space
AgriculturalCultivated crops Pasture/hay
RangelandGrassland/herbaceous Scrub/shrub
Forest landDeciduous forest Evergreen forest Mixed forest
Barren landBarren land Unconsolidated shore
Water and submerged landOpen water Palustrine aquatic bedEstuarine aquatic bed
WetlandsWoody wetlands
Palustrine forested wetlandPalustrine scrub/shrub wetlandEstuarine forested wetlandEstuarine scrub/shrub wetland
Herbaceous wetlandsPalustrine emergent wetland Estuarine emergent wetland
Perennial ice/snowTundra/Alaska only classes
Dwarf scrub*Sedge/herbaceous*Lichens*Moss*
*NLCD – National Land Cover Database
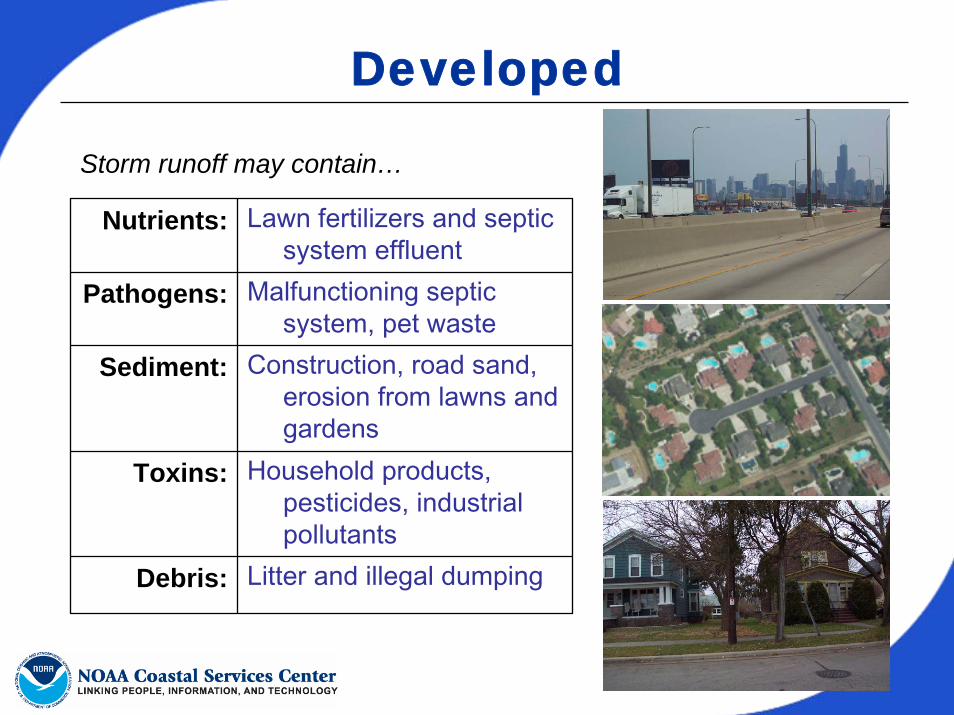
Developed
Storm runoff may contain…
Nutrients: Lawn fertilizers and septic system effluent
Pathogens: Malfunctioning septic system, pet waste
Sediment: Construction, road sand, erosion from lawns and gardens
Toxins: Household products, pesticides, industrial pollutants
Debris: Litter and illegal dumping
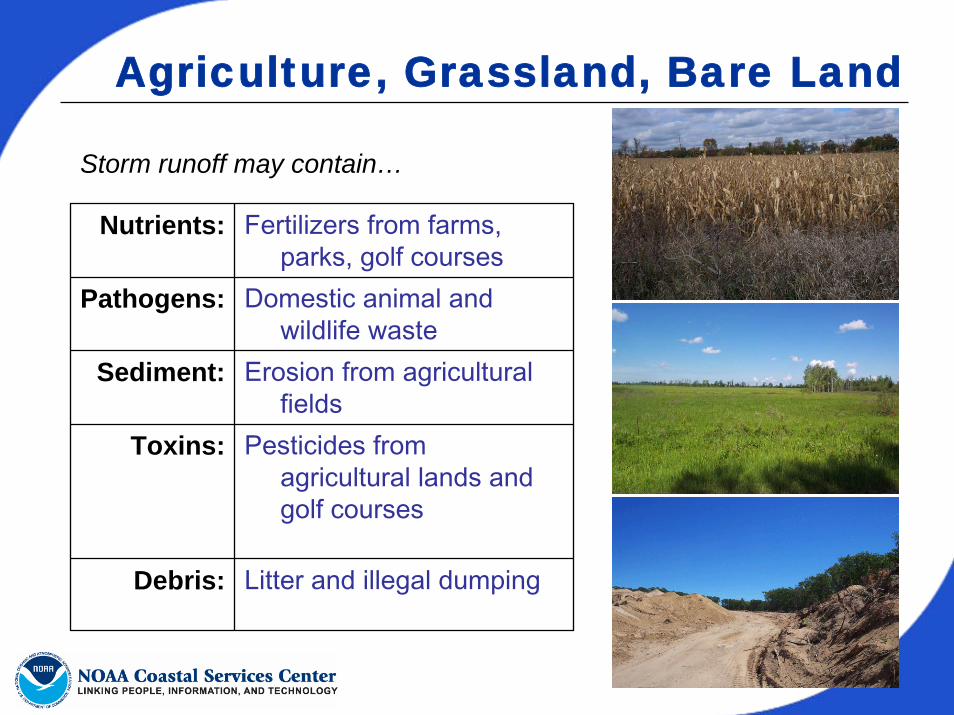
Agriculture, Grassland, Bare Land
Storm runoff may contain…
Nutrients: Fertilizers from farms, parks, golf courses
Pathogens: Domestic animal and wildlife waste
Sediment: Erosion from agricultural fields
Toxins: Pesticides from agricultural lands and golf courses
Debris: Litter and illegal dumping
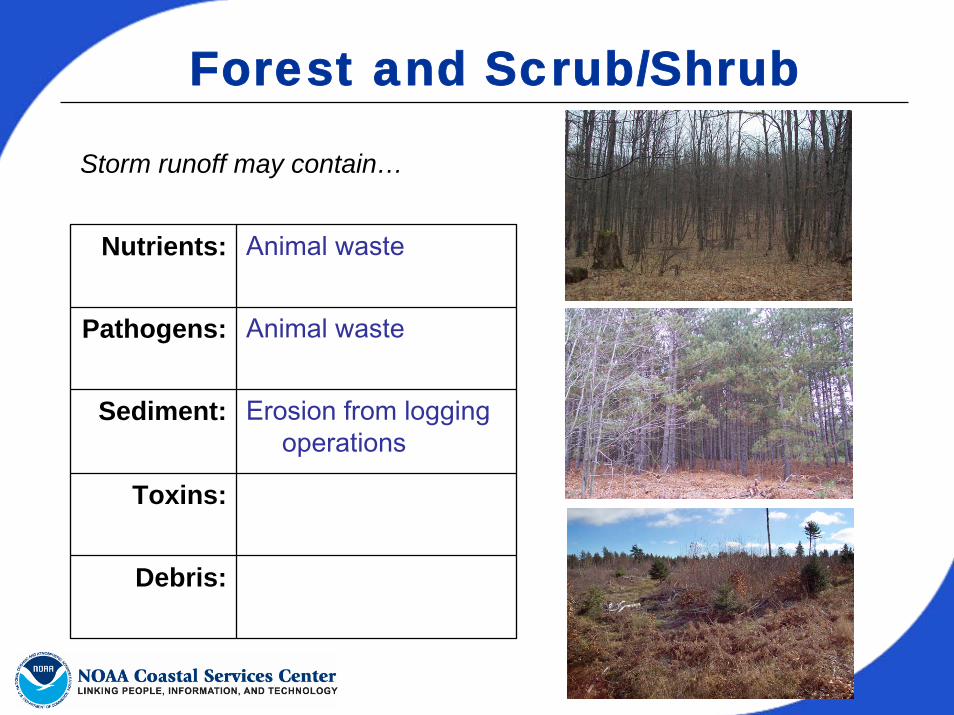
Forest and Scrub/Shrub
Storm runoff may contain…
Nutrients: Animal waste
Pathogens: Animal waste
Sediment: Erosion from logging operations
Toxins:
Debris:

Wetland
Storm runoff may contain…
Nutrients: Animal waste
Pathogens: Animal waste
Sediment: Erosion from logging operations
Toxins:
Debris:
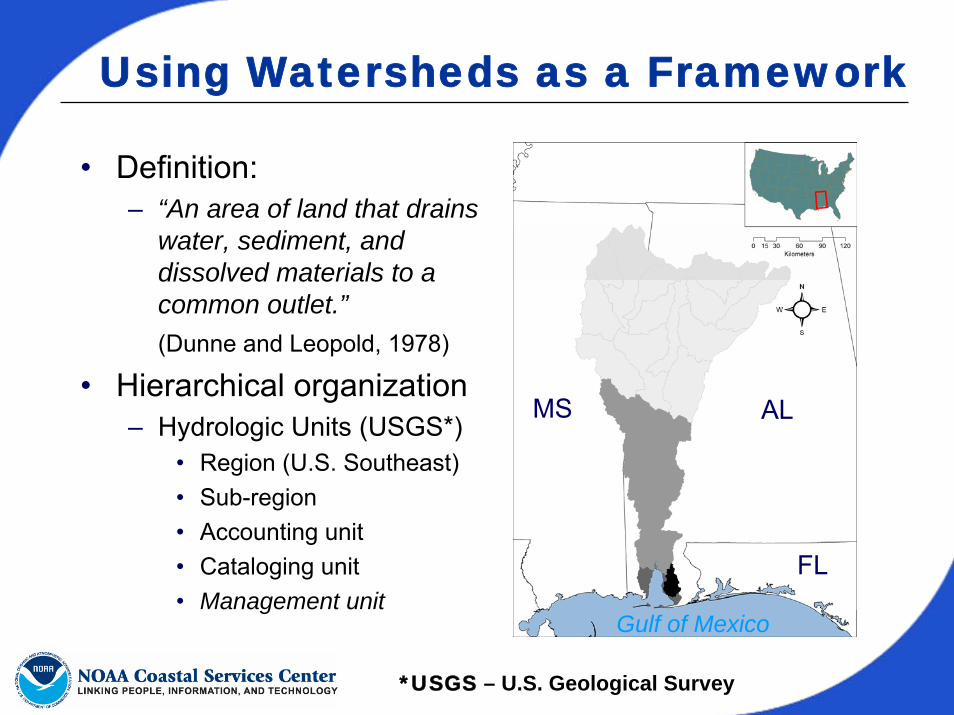
Using Watersheds as a Framework
• Definition:– “An area of land that drains
water, sediment, and dissolved materials to a common outlet.”(Dunne and Leopold, 1978)
• Hierarchical organization– Hydrologic Units (USGS*)
• Region (U.S. Southeast)• Sub-region• Accounting unit• Cataloging unit• Management unit
Gulf of Mexico
ALMS
FL
*USGS – U.S. Geological Survey

National Estuarine Research Reserves
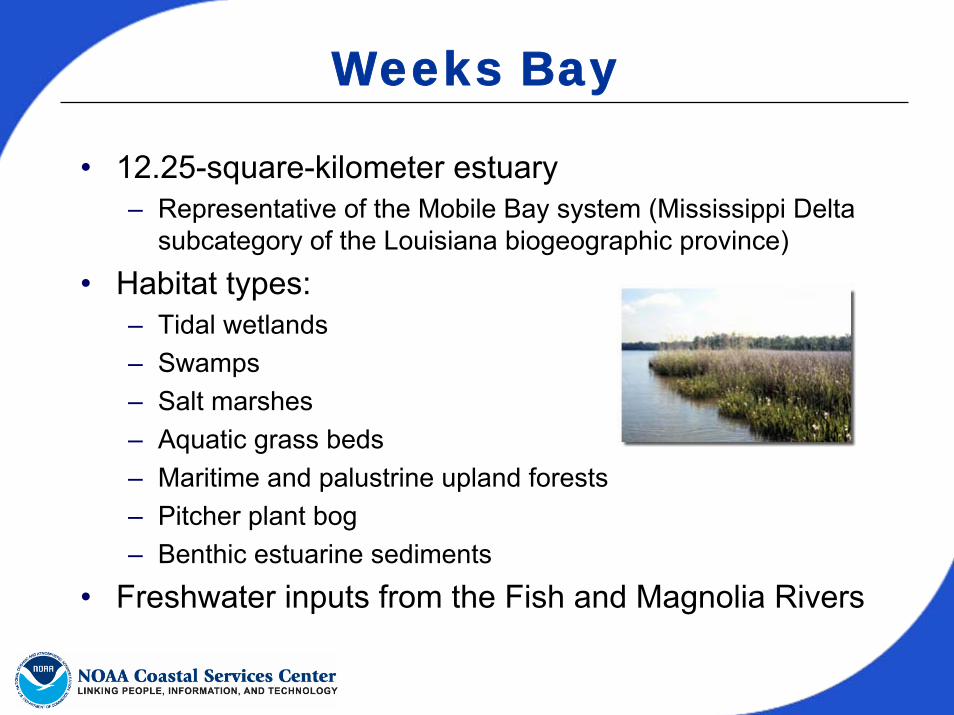
Weeks Bay
• 12.25-square-kilometer estuary– Representative of the Mobile Bay system (Mississippi Delta
subcategory of the Louisiana biogeographic province)
• Habitat types:– Tidal wetlands– Swamps– Salt marshes– Aquatic grass beds– Maritime and palustrine upland forests– Pitcher plant bog– Benthic estuarine sediments
• Freshwater inputs from the Fish and Magnolia Rivers
Protecting Weeks Bay
• Outstanding National Resource Water (1992)– Designated by the Alabama Department of Environmental
Management (ADEM)– Helped secure §319 Nonpoint Source Pollution funds (1994)
• Weeks Bay Watershed Project (1993 – present)– Diverse partnership: Weeks Bay NERR, local agencies,
businesses, watershed residents– Goal: to improve and maintain water quality to meet or
exceed state water-quality standards for Swimming, and Fish and Wildlife water-use classifications
• Watershed Management Plan (1995, updated 2002)
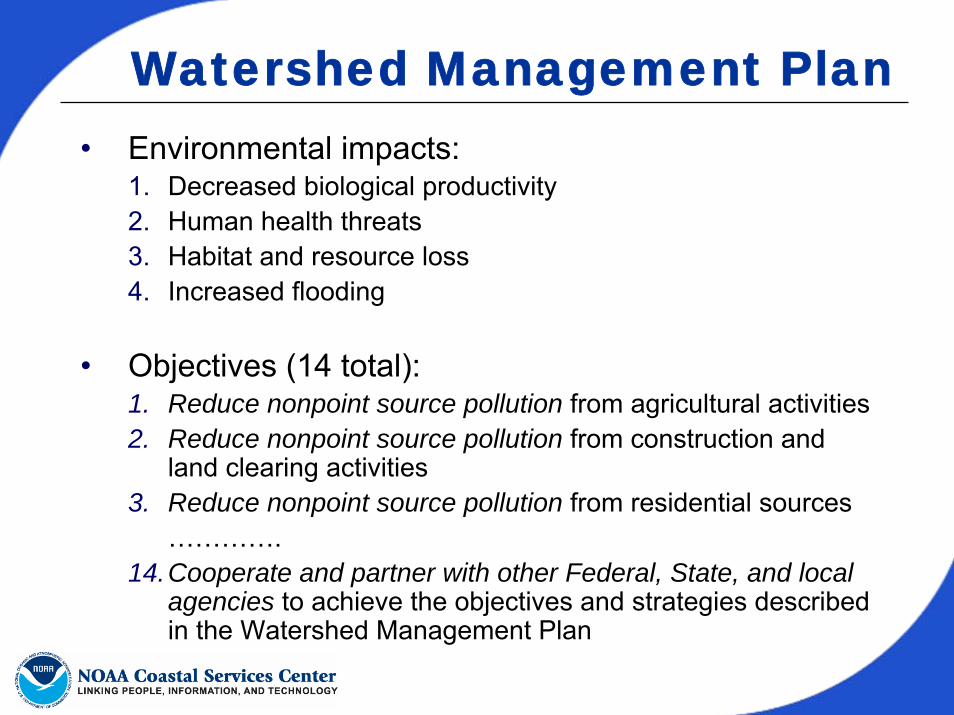
Watershed Management Plan• Environmental impacts:
1. Decreased biological productivity2. Human health threats3. Habitat and resource loss4. Increased flooding
• Objectives (14 total):1. Reduce nonpoint source pollution from agricultural activities2. Reduce nonpoint source pollution from construction and
land clearing activities3. Reduce nonpoint source pollution from residential sources
………….14.Cooperate and partner with other Federal, State, and local
agencies to achieve the objectives and strategies described in the Watershed Management Plan
Mobile Bay
Gulf of MexicoGulf of Mexico
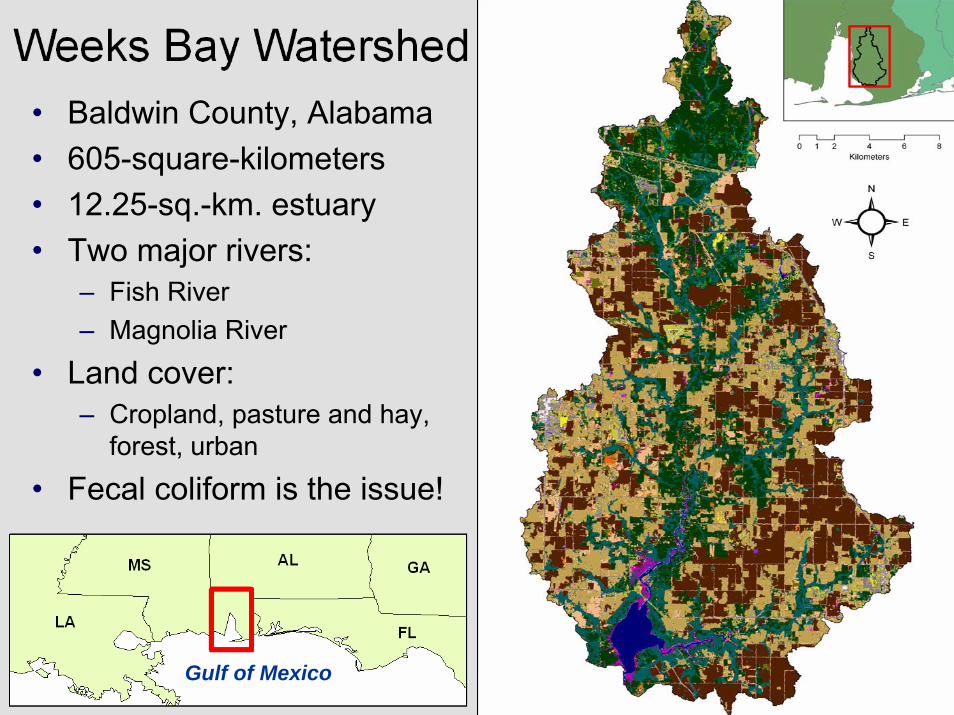
• Baldwin County, Alabama• 605-square-kilometers• 12.25-sq.-km. estuary• Two major rivers:
– Fish River– Magnolia River
• Land cover:– Cropland, pasture and hay,
forest, urban
• Fecal coliform is the issue!

• Oyster beds closed to harvest due to high fecal coliform counts
• Water-quality sampling– Geological Survey of
Alabama– Weeks Bay Water Watch
• Fecal coliform observations– Violation if ≥ 2,000 colonies
per 100 milliliters
• Need to identify sources
Occurrence of violations

Land Cover Change Detection
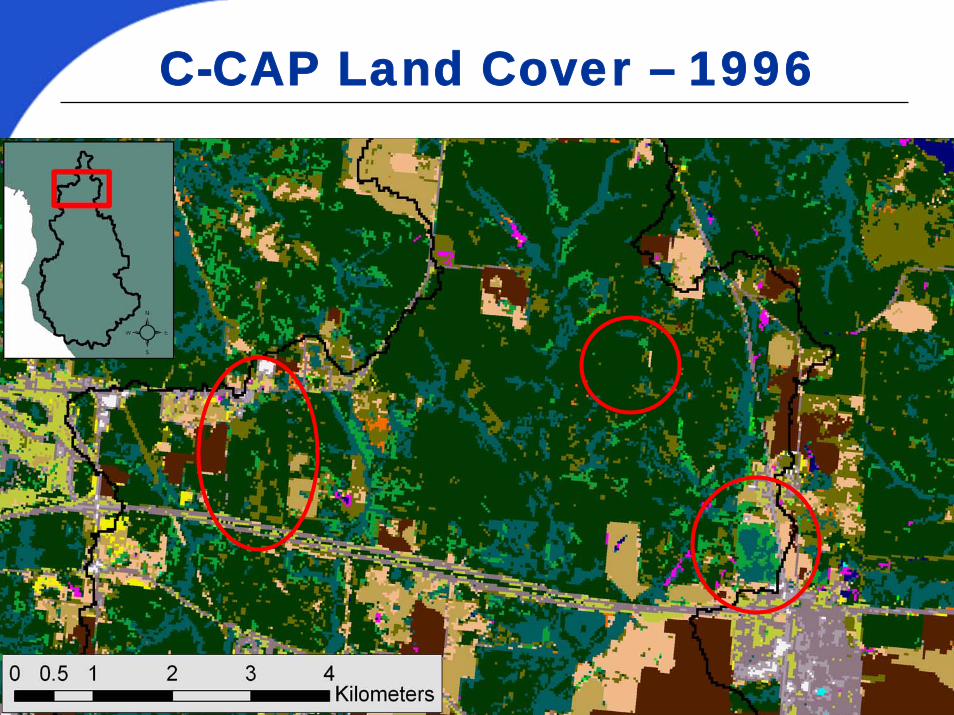
C-CAP Land Cover – 1996
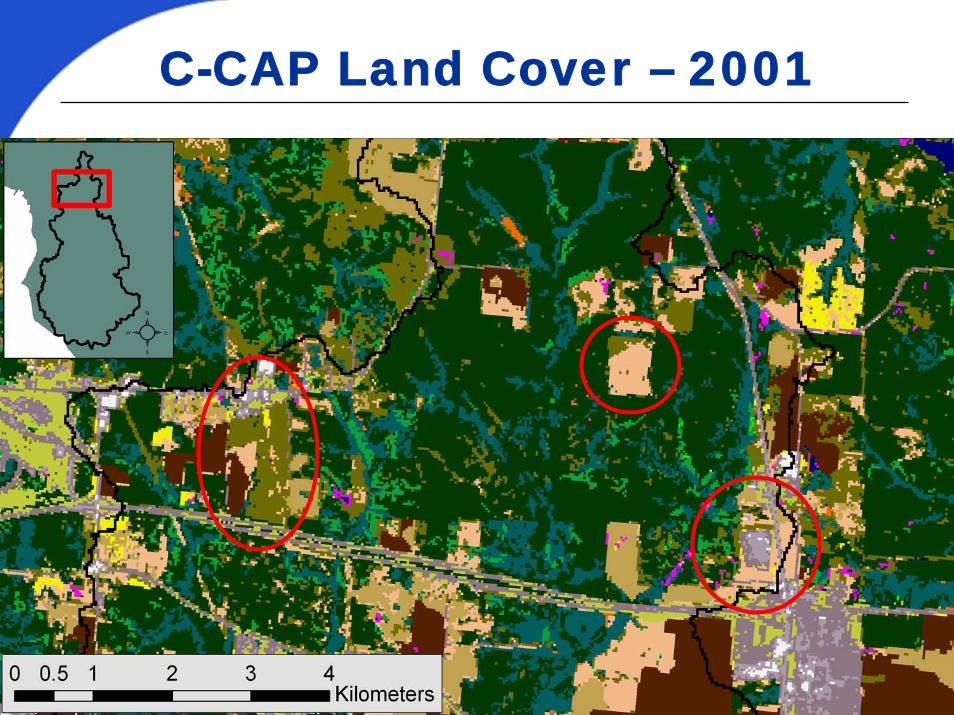
C-CAP Land Cover – 2001
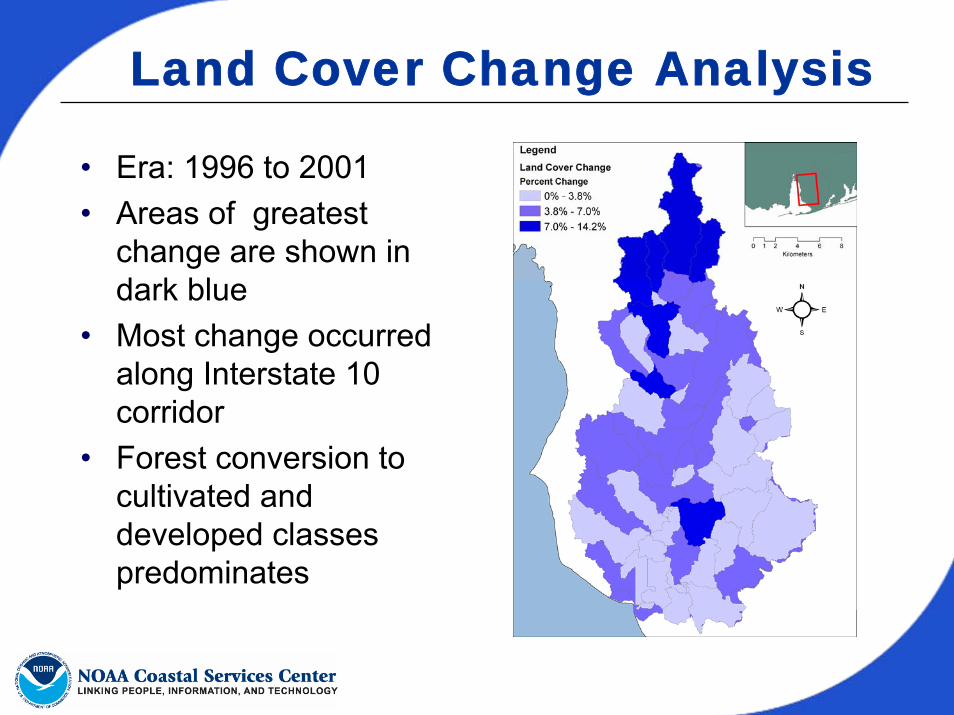
Land Cover Change Analysis
• Era: 1996 to 2001• Areas of greatest
change are shown in dark blue
• Most change occurred along Interstate 10 corridor
• Forest conversion to cultivated and developed classes predominates
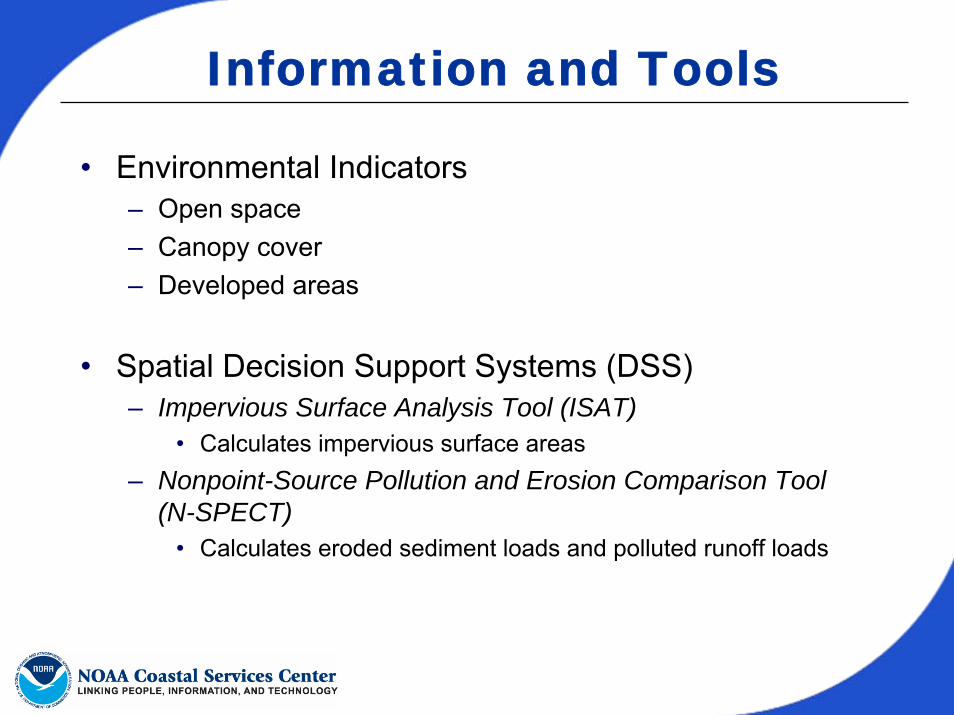
Information and Tools
• Environmental Indicators– Open space– Canopy cover– Developed areas
• Spatial Decision Support Systems (DSS)– Impervious Surface Analysis Tool (ISAT)
• Calculates impervious surface areas– Nonpoint-Source Pollution and Erosion Comparison Tool
(N-SPECT)• Calculates eroded sediment loads and polluted runoff loads

Common Characteristics
• Spatial DSS– Function as geographic
information system (GIS) extensions
– Can perform scenario analyses (e.g. development, rezoning, restoration)
– Results can be used to create map products

Impervious Surfaces – 1996
• Total watershed = 7.5%• Subwatershed totals:
– A = 8.46%– B = 7.99%
A
B
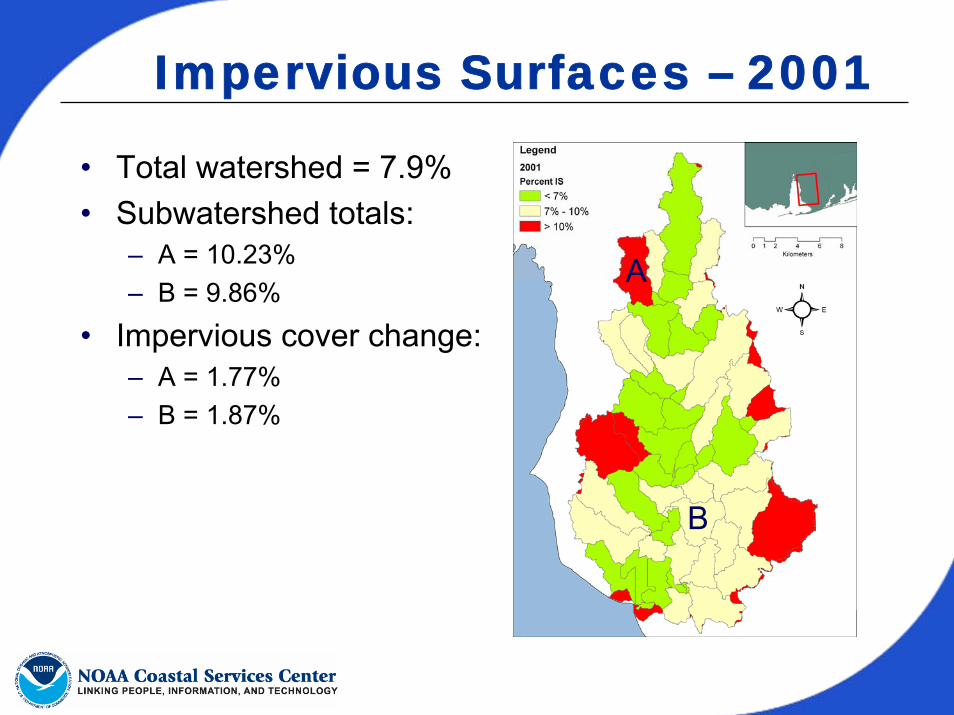
Impervious Surfaces – 2001
• Total watershed = 7.9%• Subwatershed totals:
– A = 10.23%– B = 9.86%
• Impervious cover change:– A = 1.77%– B = 1.87%
A
B
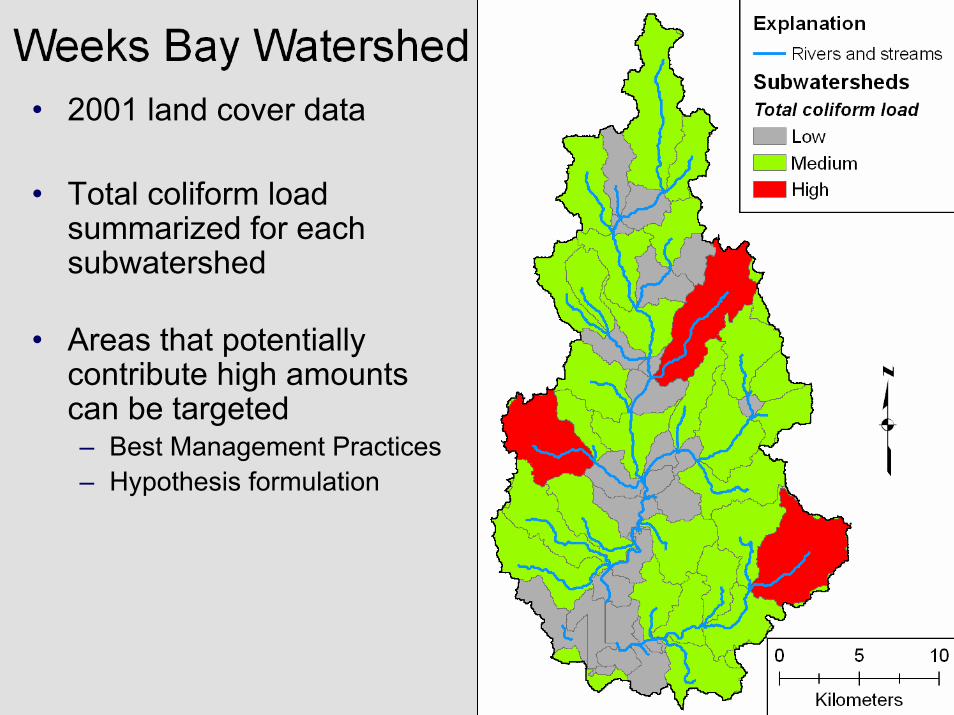
• 2001 land cover data
• Total coliform load summarized for each subwatershed
• Areas that potentially contribute high amounts can be targeted– Best Management Practices– Hypothesis formulation
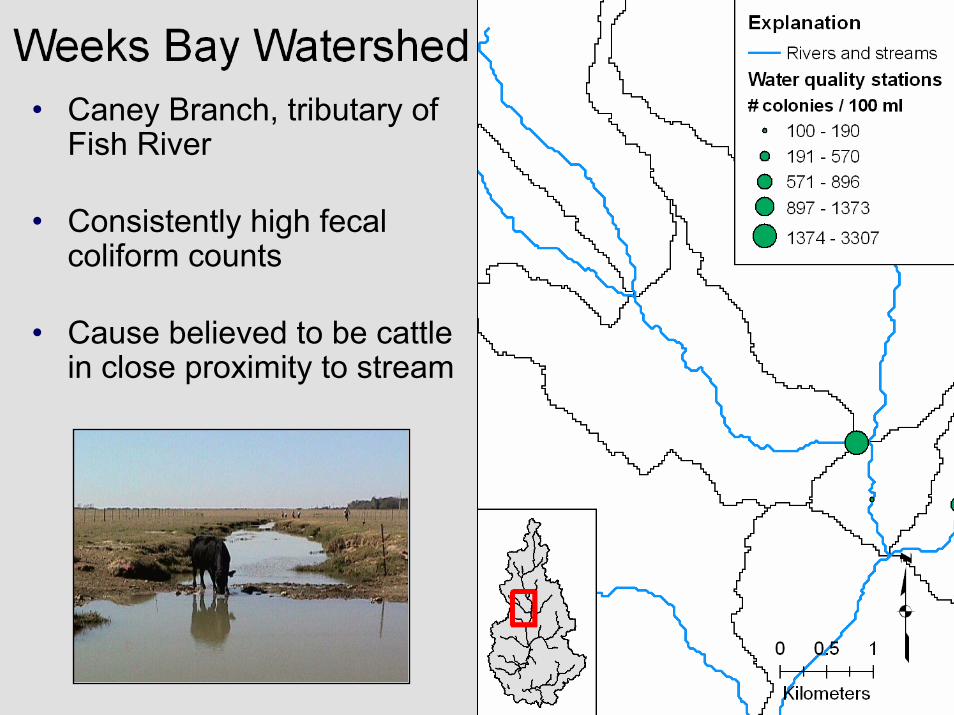
• Caney Branch, tributary of Fish River
• Consistently high fecal coliform counts
• Cause believed to be cattle in close proximity to stream
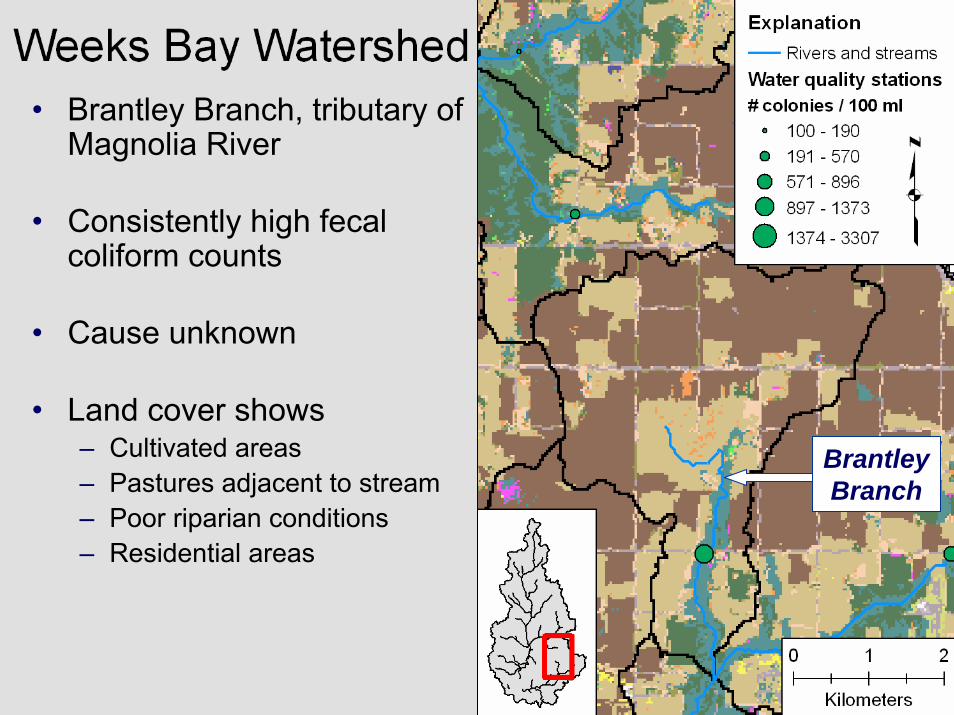
• Brantley Branch, tributary of Magnolia River
• Consistently high fecal coliform counts
• Cause unknown
• Land cover shows– Cultivated areas– Pastures adjacent to stream– Poor riparian conditions– Residential areas
Brantley Branch

• Brantley Branch, tributary of Magnolia River
• N-SPECT output to identify “source” areas– Dark blue = high values– Light blue = low values
• Potential sources?
Brantley Branch
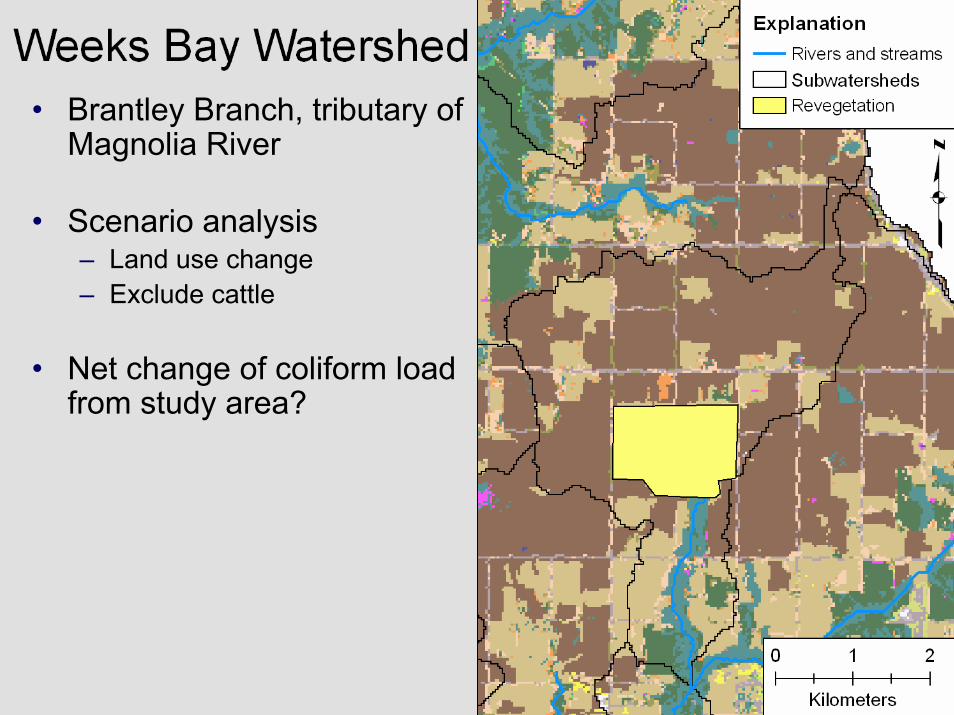
• Brantley Branch, tributary of Magnolia River
• Scenario analysis– Land use change– Exclude cattle
• Net change of coliform load from study area?

• Brantley Branch, tributary of Magnolia River
• Scenario analysis– Land use change– Exclude cattle
• Net change of coliform load from study area– 50% decrease
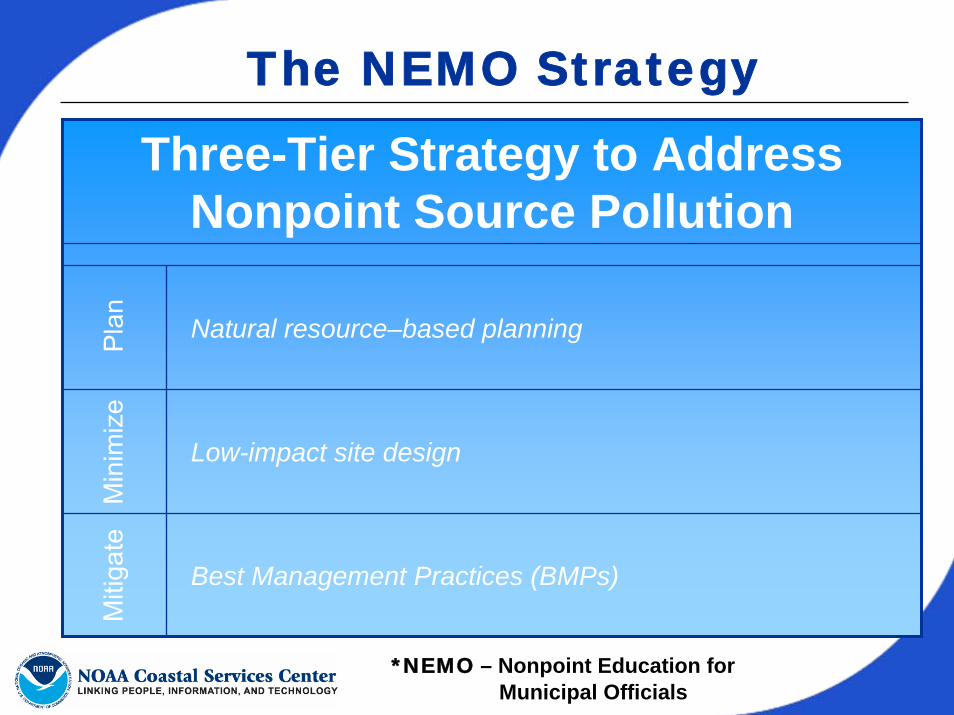
The NEMO Strategy
Three-Tier Strategy to Address Nonpoint Source Pollution
Natural resource–based planning
Low-impact site design
Best Management Practices (BMPs)
Min
imiz
eM
itiga
teP
lan
*NEMO – Nonpoint Education for Municipal Officials
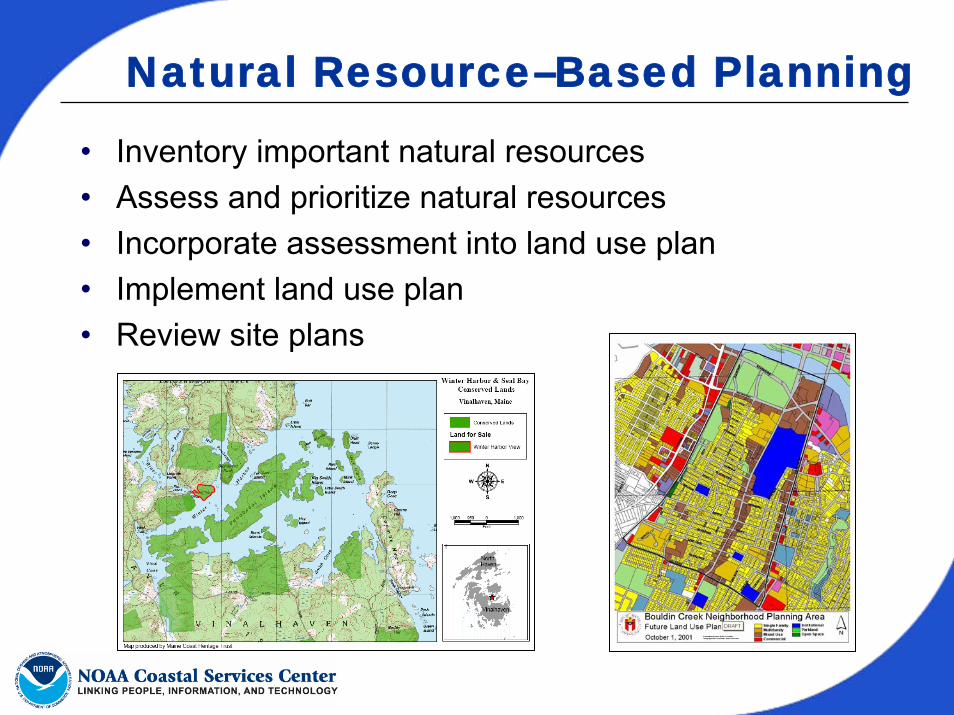
Natural Resource–Based Planning
• Inventory important natural resources• Assess and prioritize natural resources• Incorporate assessment into land use plan• Implement land use plan• Review site plans
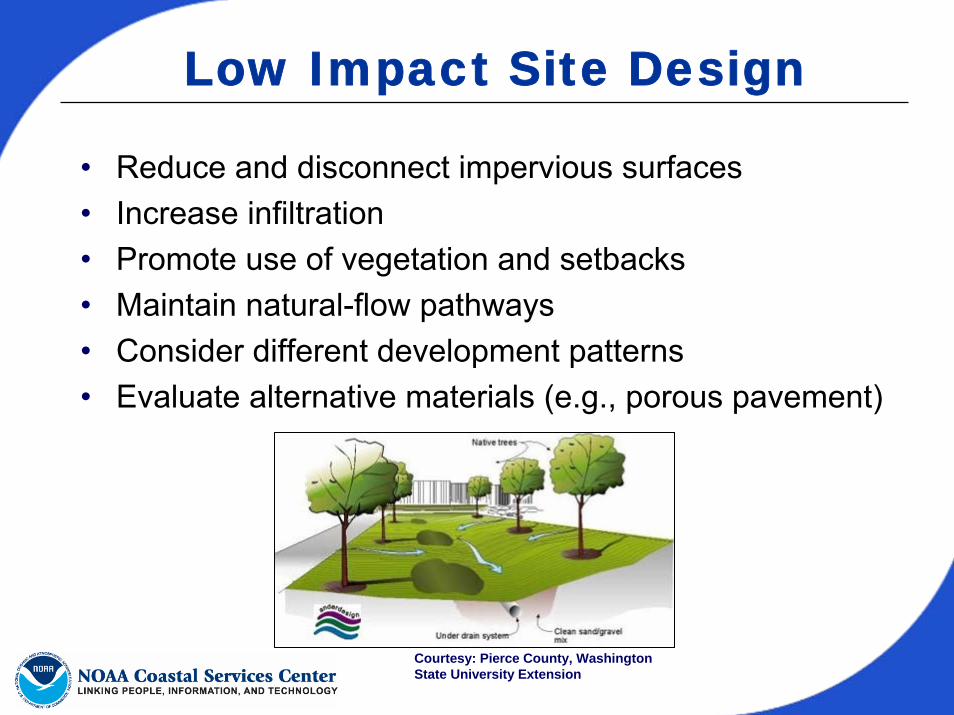
Low Impact Site Design
• Reduce and disconnect impervious surfaces• Increase infiltration• Promote use of vegetation and setbacks• Maintain natural-flow pathways• Consider different development patterns• Evaluate alternative materials (e.g., porous pavement)
Courtesy: Pierce County, Washington State University Extension
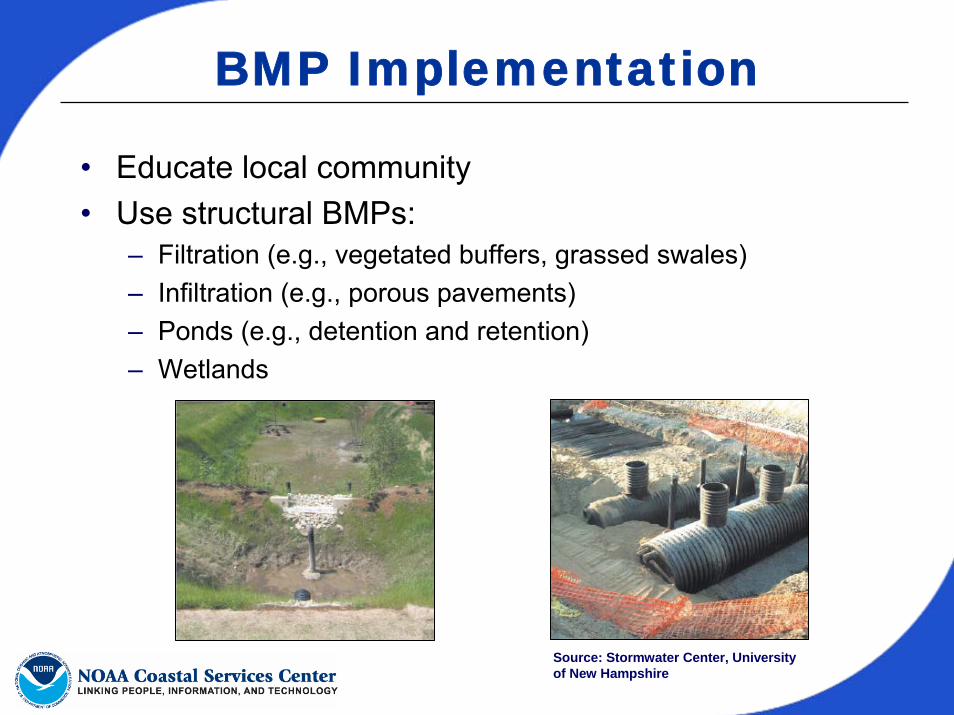
BMP Implementation
• Educate local community• Use structural BMPs:
– Filtration (e.g., vegetated buffers, grassed swales)– Infiltration (e.g., porous pavements)– Ponds (e.g., detention and retention)– Wetlands
Source: Stormwater Center, University of New Hampshire
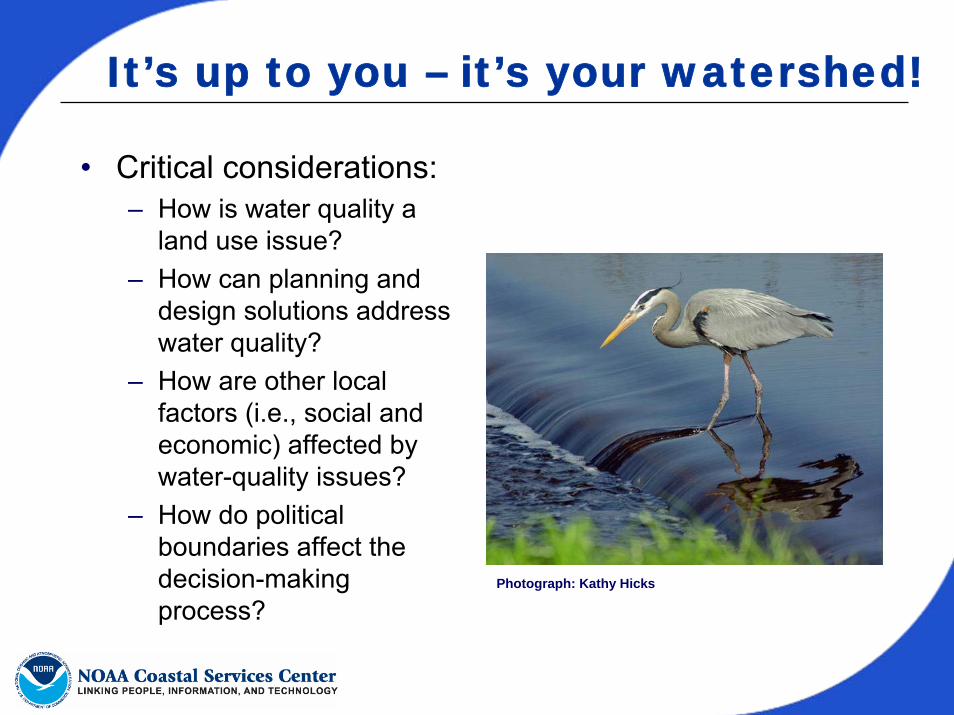
It’s up to you – it’s your watershed!
• Critical considerations:– How is water quality a
land use issue?– How can planning and
design solutions address water quality?
– How are other local factors (i.e., social and economic) affected by water-quality issues?
– How do political boundaries affect the decision-making process?
Photograph: Kathy Hicks
For More Information
• Alabama NEMO– Patti Hurley
(334) [email protected]
– Eve Brantley(334) [email protected]
• Weeks Bay NERR– Michael Shelton
(251) 928-9792 [email protected]
• NOAA Coastal Services Center (N-SPECT)– Jamie Carter
(808) [email protected]
– Dr. Dave Eslinger(843) [email protected]