linking bacterioplankton community structures to
TRANSCRIPT

AQUATIC MICROBIAL ECOLOGYAquat Microb Ecol
Vol. 45: 129–145, 2006 Published November 24
INTRODUCTION
Microorganisms in salt marsh estuarine ecosystemsperform critical functions in the processing of organicmatter and the mineralization of important nutrients. Thediagenesis of macrophyte biomass, the uptake of nutri-ents by bacteria, and the subsequent transfer to highertrophic levels through grazing form the basis of the com-plex heterotrophic food webs that support much of thesecondary production in these estuaries. Primary pro-
duction in estuaries also depends upon microbial pro-cesses because bacteria fix and remineralize the inor-ganic nutrients that limit phytoplankton growth and pro-duction. The importance of these bacterial processes tothe trophic interactions and overall ecology of aquaticsystems has inspired extensive study of bacterial com-munities. Despite this attention, fundamental questionsremain regarding bacterial community distribution andthe factors that contribute to the structuring of bacterialassemblages in estuarine habitats.
© Inter-Research 2006 · www.int-res.com*Email: [email protected]
Linking bacterioplankton community structures toenvironmental state variables and phytoplankton
assemblages in two South Carolina salt marsh estuaries
Wes Johnson1,*, Alan J. Lewitus2, 3, Madilyn Fletcher1, 2
1Marine Science Progam, EWS Rm 603, University of South Carolina, Columbia, 29208 South Carolina, USA2Belle W. Baruch Institute for Marine and Coastal Sciences, EWS Rm 604, University of South Carolina, Columbia,
29208 South Carolina, USA
3Present address: NOAA Center for Sponsored Coastal Ocean Research, 1501 East West Highway, Silver Spring, 20910 Maryland, USA
ABSTRACT: Microorganisms are among the most important organisms to the ecology of salt marshestuaries; however, fundamental questions regarding their distribution, environmental controls, andinteractions with phytoplankton remain unanswered. We used denaturing gradient gel electrophore-sis (DGGE) of bacterial rRNA genes and high performance liquid chromatography (HPLC) of phyto-plankton photopigments to characterize planktonic communities from the Ashepoo, Combahee, andEdisto (ACE) Basin and North Inlet (NI) estuaries on the South Carolina coast, USA. Multivariatecomparisons of the planktonic community profiles revealed that the 2 estuaries supported distinctbacterial communities. Furthermore, bacterial communities in both systems were partitioned intoseparate particle-associated (PA) and free-living (FL) components. Differences in bacterial popula-tions were also observed along the salinity gradient within each system. Comparisons of waterphysicochemistry with bacterial profiles indicated significant correlation of PA bacterial communitystructures with temperature, salinity, organic carbon, total phosphorus, and ammonium, whereas FLcommunities were affected by nitrate, ammonium, total phosphorus and orthophosphate. PA bacteri-oplankton community structures were also associated with diatoms, dinoflagellates, haptophytes andcryptophytes, while FL assemblages corresponded to prasinophytes, chlorophytes, and cyanobacte-ria. Comparisons between estuaries further demonstrated that ACE Basin communities were mostlyassociated with the same pigments as PA samples, and that NI assemblages correlated with FL-associated phytoplankton, suggesting different trophodynamics of particles in the 2 systems.
KEY WORDS: Bacteria · Phytoplankton · Community structure · HPLC · DGGE · Salt marsh estuary
Resale or republication not permitted without written consent of the publisher

Aquat Microb Ecol 45: 129–145, 2006
In some aquatic ecosystems abiotic factors such asriverine input, salinity, temperature, or availability ofnutrients have been shown to control the compositionof the plankton communities present (Lind & Barcena2003, Smith & Kemp 2003, Kirchman et al. 2004). Inestuarine systems in particular, phytoplankton andbacterioplankton productivity and taxonomic composi-tion have been shown to be sensitive to changes innutrient concentrations (Noble et al. 1997, Seitzinger &Sanders 1999, Kirchman et al. 2004, Lagus et al. 2004).However, other research has demonstrated that thestructure of complex, natural communities as well asrelatively simple bacterial assemblages may remainunchanged when exposed to significant shifts in nutri-ent chemistry (Fernandez et al. 1999, Piceno & Lovell2000, Lovell et al. 2001, LaPara et al. 2002). The impor-tance of such bottom-up controls on community com-position is often assumed for ecosystems; however,owing to the inherent complexity of bacterial commu-nities and the practical difficulty of making compar-isons of small-scale phenomena across large spatialscales, such controls are difficult to determine. Addi-tionally, the abiotic factors that influence communitydynamics appear to vary among different ecosystems,and among different zones within an ecosystem (Nobleet al. 2003, Pinhassi et al. 2003, Bordalo & Vieira 2005).
The composition of bacterioplankton populations isalso influenced by the composition of phytoplanktoncommunities. In lakes, estuaries, and the marine envi-ronment, bacterial production, function, and commu-nity composition change as phytoplankton bloomsform, develop, and then collapse (Kirchman et al. 1991,Fandino et al. 2001, Riemann & Winding 2001). Fur-thermore, these changes appear to vary with respect tothe species that dominates the bloom (Pinhassi et al.2004), suggesting specific interactions between phyto-plankton and bacteria, which may remain even in theabsence of a bloom event.
Until recently, the ability to measure and interpretsuch community dynamics in situ has been limited bythe complexity of bacterial communities and thedifficulties and biases associated with culturing andidentifying organisms. However, molecular methodsdeveloped in the past 2 decades have allowed for cul-ture-independent comparisons between communities.In particular, denaturing gradient gel electrophoresis(DGGE) of 16S rRNA gene fragments has come to theforefront of bacterial community structure analysis(Boon et al. 2002). This technique allows for the simul-taneous comparison of multiple samples by creating‘fingerprints’ of the bacterial community, which can becompared visually. The differences in these bandingpatterns indicate differences in the composition of thecommunities from which they are generated. Thistechnique has been used successfully to characterize
bacterial community diversity and composition in anumber of aquatic ecosystems, including estuaries(Trimmer et al. 1997, Hollibaugh et al. 2000, Sekiguchiet al. 2002, Wetz et al. 2002, Selje & Simon 2003,Lassen et al. 2004). Additionally, bands in these pat-terns can be excised and sequenced to identify thetaxa that are observed in the gel images.
The composition and successional dynamics ofphytoplankton communities have been similarly diffi-cult to assess as a result of the high species diversity,multiple life stages, interspecific morphologies, andcomplex interactions between community membersand their environment. High performance liquid chro-matography (HPLC) of photopigments has beenrecently used in numerous studies to generate a com-posite profile of the phytoplankton community (Hig-gins & Mackey 2000, Pinckney et al. 2001, Rodriguezet al. 2002). Group-specific pigments in particular offerinformation on the relative abundance of phytoplank-ton taxa within the community, while the relativeamounts of all pigments measured give a broad pictureof the whole community.
In the present study, we used both HPLC of photo-pigments collected in the summer of 2000 by Noble et al.(2003) and DGGE of bacterial 16S rRNA genes to com-pare communities within and between 2 estuaries on theSouth Carolina coast, USA. The primary objectives ofthis study were to (1) assess in situ patterns of bacterialcommunity distribution within and between 2 pristinesalt marsh estuaries, (2) determine the ecological factorsthat control phytoplankton and bacterial communitystructures, and (3) identify potential associations be-tween phytoplankton and bacterial community struc-tures in these ecosystems. As the interface between ter-restrial and marine ecosystems, estuaries exhibit distinctspatial gradients of chemical and physical characteristicson a landscape scale. We hypothesized that bacterialcommunity composition will differ and vary according todifferences in environmental state variables along thechemical gradients. Furthermore, we expected thatdifferences in phytoplankton community compositionswill correspond to distinct and predictable shifts in thecomposition of bacterial assemblages.
MATERIALS AND METHODS
Site description. The Ashepoo, Combahee, andEdisto (ACE) Basin and the North Inlet (NI) systemsare located ca. 100 km apart on the coast of South Car-olina. The 2 estuaries are similar in temperature, salin-ity, tidal range and tidal frequency, and, as reservesites of the National Estuarine Research Reserve Sys-tem, both drainages are almost entirely undeveloped.The ACE Basin has a relatively large watershed of
130

Johnson et al.: Linking bacterioplankton and phytoplankton communities
approximately 8000 km2 that drains into 3 major rivers,the Ashepoo, the Combahee, and the Edisto. Thefreshwater input of these rivers to the system is roughly41% of the total volume of the estuary (Dame et al.2000). In contrast, NI is tidally dominated and featuresvery little freshwater input. Morris (2000) estimatedthe freshwater input to be 3% of the total tidal volume.These inter-estuary differences in freshwater cyclingresult in variations in nutrient dynamics. The terrestrialinput in the ACE Basin system leads to higher concen-trations of dissolved nutrients than in NI, where avail-able nutrients are predominantly derived from sedi-ment processes and the influx of seawater.
Four sampling stations were selected within eachestuary to reflect the salinity gradient in each system(Fig. 1). ACE Stn 1 was located at the outflow of a smalltributary into the Edisto River. Stn 2 was located in St.Pierre Creek, and Stn 3 was located at the confluenceof St. Pierre Creek and the Edisto River. The most sea-ward station (Stn 4) was located on the eastern marginof St. Helena Sound. NI Stn 1 was a tributary of Crab-haul Creek, Stn 2 was at Oyster Landing, Stn 3 waslocated in the main body of Clambank Creek, and Stn4 was in Town Creek.
Sample collection. Samples were collected fromeach station monthly from April to October 2000 begin-ning at solar noon during the spring tide. Temperature,
salinity, and pH were measured in situ using a Hydro-lab datasonde (Hydrolab-Hach Company), and watersamples for chemical analyses, bacterial counts, andphotopigment determination were collected in tripli-cate from ~30 cm depth at each site in sterile 1 l screwtop jars. Water for bacterial community analysis wascollected in duplicate 8 l containers with sealing lids.All water samples were stored in the dark on ice untilprocessed (3 h maximum).
Bacterial communities were separated into particle-associated (PA) and free-living (FL) fractions bysequentially filtering through a 3 µm pore-size poly-carbonate filter (47 mm; Millipore), and then by pass-ing the filtrate through a 0.22 µm pore-size Sterivexfilter (Millipore), following the protocol of Bidle &Fletcher (1995). These filters were placed immediatelyon dry ice and stored at –80°C until processed.
Bacterial abundance. Direct bacterial cell counts wereperformed by fixing 50 ml of each water sample in glu-taraldehyde (5% final concentration w/v). A subsample(2 ml) of each fixed sample was filtered through a sterile3 µm pore-size polycarbonate filter, and 1 ml of thefiltrate was stained with 50 µl of 10 µM Sytox Greennucleic acid stain (Molecular Probes) for 30 min. Due tohigh background fluorescence and the opacity of theparticles themselves, accurate direct counts of PA organ-isms were not possible, and are absent from this study.
Stained samples were diluted in5 ml phosphate-buffered saline (0.1 MNaCl, 3 mM K2HPO4, pH 7.2) andfiltered at 250 mm Hg vacuumonto black polycarbonate filters with0.22 µm pore-size (25 mm; Millipore).Filters were mounted onto glass micro-scope slides with 10 µl DABCO-glycerol (1,4-diazobicyclo[2.2.2]octane)to stabilize fluorescence (Lovell etal. 1999). Filters were viewed at600 × magnification using an OlympusBX40 microscope equipped with a BX-FLA (Olympus) reflected light flu-orescence attachment and an acridineorange filter cube set (488 nm excita-tion, 630 nm emission). Images of thefilters were captured using a digitalcamera driven by the V5 acquire mod-ule of IPLab Spectrum 3.1 imageanalysis software (Scanalytics). Cellswere enumerated by segmenting andcounting using the IPLab Spectrumsoftware as recommended by the soft-ware manufacturer.
Water chemistry. Concentrations ofnitrate + nitrite (NN), ammonium(NH4), total nitrogen (TN), total dis-
131
Fig. 1. Sampling stations in the Ashepoo,Comabahee, Edisto (ACE) Basin andNorth Inlet (NI) estuaries. Stns 1 to 4follow typical salinity gradients withineach system from low (Stn 1) to high(Stn 4). NC, North Carolina; SC, South
Carolina; GA, Georgia

Aquat Microb Ecol 45: 129–145, 2006
solved nitrogen (TDN), orthophosphate (PO4), totalphosphorus (TP), total dissolved phosphorus (TDP),and silicate (Si) were measured with a TechniconAutoanalyzer (Pulse Instrumentation) according to themanufacturer’s instructions. Dissolved organic carbon(DOC) was measured using a Shimadzu TOC-500 car-bon analyzer following filtration through 0.22 µmpolypropylene filters (Millipore). Statistical analyses ofchemical data were conducted by ANOVA and multi-ple regression analysis using the Statistical AnalysisSoftware package (SAS).
HPLC. HPLC was used to detect 18 pigments thatcan be used as indicators of specific phytoplanktontaxa (Table 1). Pigments were extracted in 100% ace-tone using a tissue grinder. The resulting slurry wasthen filtered through a Teflon HPLC syringe filter(0.45 µm). HPLC was performed according to a proto-col modified from Van Heukelem & Thomas (2001).Briefly, pigments were separated using a BeckmanSystem Gold HPLC with an external column heater,125 solvent module dual pump, and photodiode arraydetector with deuterium lamp (monitoring 450 nm),using temperature-control and a polymeric column.Pigment standards were obtained from L. Van Heu-kelem (Horn Point Laboratory, University of Mary-land). For composition analysis, all pigment concentra-
tions were normalized to the chl a concentration fromeach sample. Phytoplankton community profiles werecompared by cluster analysis as described by Noble etal. (2003). Additional analysis of community structuresand their relationships to environmental state vari-ables were performed using canonical correspondenceanalysis (CCA) in the Multi-Variate Statistical Package(MVSP; Kovach Computing Services).
DNA extraction. Community DNA was extractedfrom PA and FL samples using a modified nucleic acidextraction protocol described by Bidle & Fletcher(1995). FL cells were lysed directly in the Sterivex filtercartridges using 1% sodium dodecyl sulfate (SDS)solution in TE (10 mM TRIS, 1 mM EDTA, pH 7.9), andheated to 65°C for 30 min. The solution was drawn outand extracted once with an equal volume of saturatedphenol (pH 7.9), and once with an equal volume ofchloroform. PA cells were lysed by cutting the 3 µm fil-ters into small pieces using a sterile scalpel and heat-ing them to 65°C in 3 ml of 1% SDS in TE for 30 min.The solution was then drawn off using a pipette andphenol/chloroform extracted as above. DNA solutionswere precipitated in an equal volume of ethanol andcentrifuged for 30 min at 10 000 × g. The pellets wereair-dried and resuspended in 100 µl TE; 1:10 dilutionsof the samples were used as working stocks for poly-merase chain reaction (PCR)/DGGE and the remainingsamples were preserved in 50% ethanol/TE at –20°C.
PCR/DGGE. A ~195 bp fragment of the hyper-vari-able V3 region of the 16S rRNA gene was amplifiedusing the 341f, 5’-CGCCCGCCGCGCCCCGCGCCCGGCCCGCCGCCCCCGCCCCCCTACGGGAGGCAGCAG-3’ and 534r, 5’-ATTACCGCGGCTGCTGG-3’oligonucleotide primers as described by Muyzer et al.(1993). The underlined portion of the forward primer isa 40 bp G/C clamp, described by Ferris et al. (1996).Each sample was amplified in 4 separate 25 µl reac-tions, which were pooled before running on DGGE.Each 25 µl reaction contained 1 µl of the template DNAdescribed above or 25 ng of purified genomic DNA (formarkers), 0.2 U Taq DNA polymerase (Promega), 2.5 µlof 10 × reaction buffer supplied with the polymerase bythe manufacturer, 200 µM final concentration each ofdeoxyribonucleoside triphosphate (dNTP), 0.5 pmolµl–1 of each primer, 0.4 µg µl–1 BSA, and 1.5 mMMgCl2. Reactions were run in a MJ Research PTC-200thermal cycler equipped with a heated lid using atouchdown protocol with an initial denaturing step at94°C for 3 min followed by 20 cycles of 94°C for 60 s,62°C for 30 s (decreasing by 0.5°C cycle–1), and 72°Cfor 30 s. An additional 15 cycles of 94°C for 30 s, 52°Cfor 30 s, and 72°C for 30 s were performed followed bya final extension of 72°C for 4 min. All reactions wererun on 2% agarose to confirm adequate amplification,and samples were ethanol precipitated and centri-
132
Table 1. Photopigments used for phytoplankton communityanalysis and their corresponding taxa as indicated by Nobleet al. (2003) and Paerl et al. (2003). 19’-but: 19’-butanoyloxy-
fucoxanthin; 19’-hex: 19’-hexanoyloxyfucoxanthin
Photopigment Associated taxa
Chl a All photosynthetic algaeChl b Chlorophytes, prasinophytesChl c1 Diatoms, dinoflagellates,
prymnesiophytes, cryptophytesChl c2 Diatoms, dinoflagellates,
prymnesiophytes, cryptophytesFucoxanthin Bacillariophytes, prymnesiophytes,
cryptophyesPrasnioxanthin Some prasinophytesViolaxanthin Chlorophytes, prasinophytes,
eustigmatophytesZeaxanthin Cyanobacteria, prochlorophytes,
rhodophytes, chlorophytesNeoxanthin ChlorophytesDiatoxanthin Diatoms, prymnesiophytesDiadinoxanthin Diatoms, prymnesiophytes, chrysophytes,
euglenophytesAlloxanthin CryptophytesPeridinin Dinoflagellates19’-but Some prymnesiophytes, some
dinoflagellates19’-hex Prymnesiophytes, chrysophytesLutein ChlorophytesCanthaxanthin Benthic cyanobacteriaCarotenes Most photosynthetic algae

Johnson et al.: Linking bacterioplankton and phytoplankton communities
fuged and the pellets air-dried. Amplimers were re-suspended in 10 µl TE and 5 µl loading dye (0.25%bromophenol blue, 0.25% xylene cyanol FF, 40%sucrose) for loading into DGGE.
DGGE was performed on polyacrylamide gels con-taining a double gradient: 8 to 10% acrylamide/bis-acrylamide (37.5:1) and 54 to 70% denaturants with astacking gel of 8% acrylamide/bis-acrylamide con-taining no denaturants. Samples were loaded ontopreheated (60°C) gels in 7 l of TAE buffer (0.04 MTris, 0.02 M acetic acid, 1 mM EDTA) in a BioRadDCode apparatus. Gels were run at 60°C at 100 V for21 h, stained in 1× ethidium bromide in TAE for 30min, destained twice in deionized water for 10 min,and imaged on a BioRad GelDoc 2000 transillumina-tor. Images were captured by a digital camera usingthe VG5 acquire module of the IPLab Spectrum imageanalysis software package. Statistical analyses ofDGGE results were performed by first scoring thebanding patterns using the GelCompar 4.0 softwarepackage (Applied Maths). Band positions were nor-malized to a Bacillus licheniformis 16S rRNA genemarker (3 lanes per gel), and the intensity of eachband was measured. Intensity values for every bandwere normalized to the maximum intensity in therespective lane. For simultaneous comparisons acrossall samples, 45 potential band positions were used togenerate an operational community unit (OCU) foreach sample. Because DGGE analysis is subject toPCR bias (Hansen et al. 1998, Stephen et al. 1998,Kanagawa 2003, Lueders & Friedrich 2003), eachOCU was constructed by converting the intensitymeasurements of the brightest 14 bands (the mini-mum number of bands observed in any single sample)to a binary score indicating absence (0) or presence(1) of a band at each position in a gel lane. The result-ing data were analyzed using the unweighted pair-wise group method analysis (UPGMA) protocol in theMVSP. Similarity matrices were calculated using Jac-card’s coefficient. The resulting similarity matriceswere analyzed for differences using a Monte-Carlopermutation significance test described by Kropf et al.(2004). Briefly, comparisons were made of within- andbetween-group correlations using the test statistic d =rwithin – rbetween, where rwithin and rbetween are the arith-metic mean over all Jaccard coefficients within andbetween groups, respectively. In the permutation test,values in the similarity matrices were moved ran-domly within the matrix and the effect on d was mea-sured. If the random movement of elements amonggroups did not systematically decrease the value of d,then the null hypothesis of d = 0 is rejected. For moredetailed description of this statistical method, refer toKropf et al. (2004). In addition, CCA was performedusing the PA/FL fractions as nominal environmental
variables, as described by Rooney-Varga et al. (2005).Here we assigned PA samples a value of 0 and FLsamples a value of 1. CCA was also applied to pig-ment profiles, DGGE banding patterns, and environ-mental data simultaneously to examine direct rela-tionships between state variables and communityprofiles.
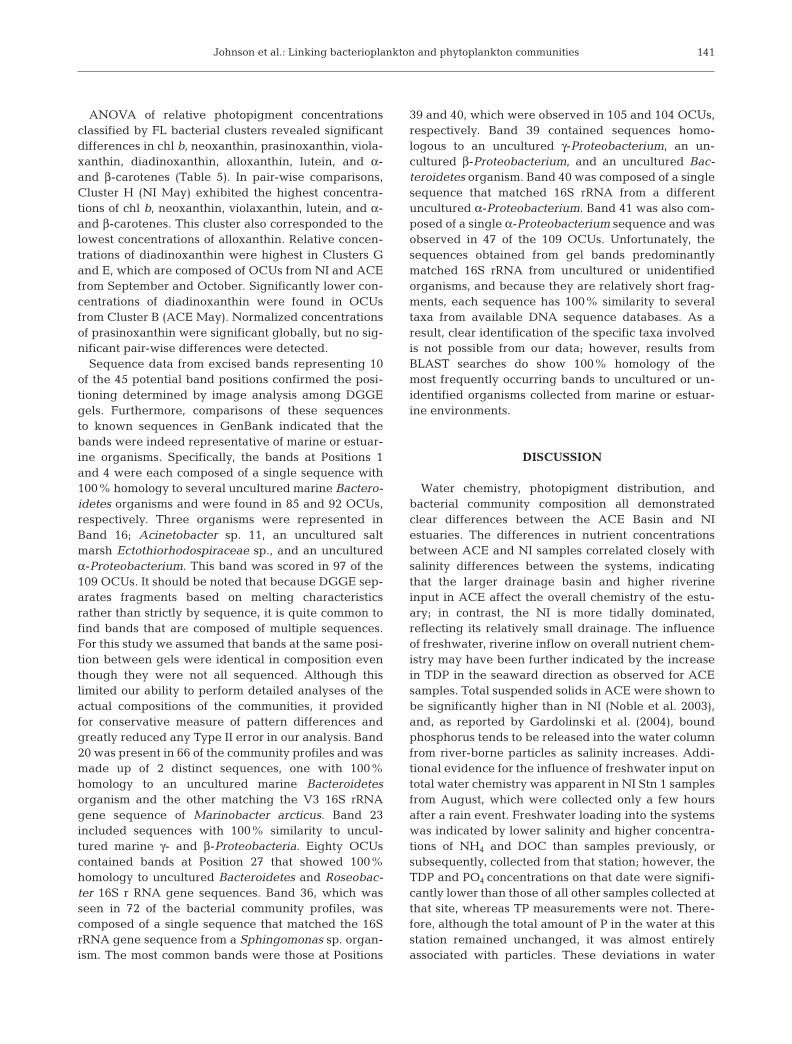
Band sequencing. Prominent bands that appear toalign across multiple gels were sequenced from eachgel to assess the number of sequences present in thebands and to confirm the correct alignment of the bandpositions for all gels used in this study. The positions ofthe excised bands are shown in Fig. 2. Bands from eachsample lane in which a particular band appeared wereexcised directly from denaturing gradient gels using awide-orifice pipette tip and stored in 50 µl TE at 4°C.The band products were reamplified and separated byDGGE to confirm their positions on the gels and to dis-qualify heteroduplexes for cloning. Selected bandproducts were then PCR-amplified using the samereaction conditions as the community DNA amplifica-tions, except that the forward primer did not includethe 40 bp G/C clamp. The resulting amplimers werecloned into JM109 competent cells using the pGEM-Tvector kit (Promega) following the protocol of the man-ufacturer. Ten colonies from each band amplificationwere selected and transferred to LB/Ampicillin platesand grown at 37°C overnight before plasmid isolation.pGEM plasmids were recovered from 5 coloniesfrom each of the original band amplimers by heatingcells at 100°C for 10 min followed by centrifugation at10 000 × g for 30 s. Samples were immediately put onice, and 15 µl of the supernatant was used as templatefor PCR amplification of the insert with T7 and Sp6primers. Inserts were amplified in 25 µl reactions con-taining 2.5 µl 10× reaction buffer, 100 µM final concen-tration of each dNTP, 1.5 mM final concentrationMgCl, 12.5 pmol each primer, and 0.1 U Taq poly-merase (Promega). Reactions were run in a MJResearch thermal cycler by the following protocol: ini-tial denaturing at 94°C for 2 min followed by 30 cyclesof 94°C, 47°C, then 72°C for 30 s each, and a finalextension at 72°C for 2 min. The resulting amplimerswere digested with Hae III and Msp I and separatedon agarose to determine the number of differentsequences comprising each band. Each unique restric-tion digest pattern from every band was used in cyclesequence reactions using the BigDye v3.1 system(Applied Biosystems) following the manufacturer’s in-structions. Sequences were obtained using an ABIautosequencer, and aligned using BioEdit software(Ibis Therapeutics). Sequences were compared toexisting sequences in the GenBank database to con-firm that bands represented organisms likely to befound in salt marsh estuaries.
133

Aquat Microb Ecol 45: 129–145, 2006
RESULTS
Water chemistry
The water chemistry results from both estuaries aresummarized in Table 2. Grand means indicatedgreater concentrations of NN, TP, TDP, and PO4 inACE than in NI (α = 0.05). In contrast, NH4 concentra-tion and salinity were both significantly greater in NIsamples than in ACE samples. Within the ACE estuary,salinity followed the expected gradient, with the low-est salinities recorded at Stn 1 and increasing in theseaward direction to Stn 4 for all months sampled(Table 2). In contrast, the patterns of salinity in NI wereonly consistent with predicted gradient in samplescollected in April, August, and September (Table 2).For all other months, salinity remained essentially un-changed from station to station.
Within each estuary, the nutrient patterns typicallyfollowed the salinity gradient, with lower nutrient con-centrations generally found in the seaward direction,presumably as a result of dilution in seawater(Table 2). These trends were more apparent in theACE Basin, where concentrations of DOC, TN, NN,NH4, and TP were all negatively correlated with salin-ity (α = 0.05), exhibiting a significant decrease in theseaward direction. TDP concentration and pH wereboth positively correlated with salinity in ACE sam-ples. NI samples revealed similar patterns in nutrientdistributions, with DOC, NN, and NH4 negatively cor-related with salinity and PO4 directly correlated withsalinity. These patterns of nutrient distribution areindicative of riverine influence in each estuary.
NI samples from August were collected a fewhours following a rain event, which is reflected in theanomalous water chemistry data from Stn 1. Salinityat Stn 1 averaged 33.3 psu throughout the samplingperiod, but fell to 2 psu in samples from that timepoint. PO4 concentrations were also significantlylower in this sample than at any point in the sam-pling season. In contrast, concentrations of NH4 andDOC at NI Stn 1 were significantly higher in Augustthan in any other month.
Bacterial abundance
Distributions of FL bacterial abundance of ACE andNI samples are represented in Fig. 3. Direct counts ofFL cells from ACE samples were significantly higherthan those from NI samples in April, May and October(p < 0.0001). This pattern was reversed in July, whenNI cell counts were significantly higher than thosefrom ACE (p = 0.0120). Within both estuaries bacterialabundance generally decreased with increasingsalinity; however, this trend is significant only for ACEsamples (α = 0.05).
Photopigments
The photopigment data presented here are a subsetof those presented by Noble et al. (2003). Specifically,the present study compared pigment data collected inthe 2000 sampling season and did not include samplescollected in 1999 and 2001. Chl a concentrations were
134
Fig. 2. DGGE image of North Inlet (NI) and Ashepoo, Combahee, and Edisto (ACE) Basin samples collected in April. Lanes are la-beled according to station number; FL: free-living fraction; PA: particle-associated fraction; M: positive control markers. Relative
positions of bands that were excised and sequenced are indicated by arrows

Johnson et al.: Linking bacterioplankton and phytoplankton communities
significantly higher in ACE than in NI (α = 0.05) andexhibited significant differences along the salinitygradients in both estuaries, with concentrationsgreater at stations with lower salinity (Table 2). NIsamples collected in August from Stn 1 were notableexceptions to this trend, showing both the lowest chl aconcentration and lowest salinity of allsamples collected (data not shown).ANOVA of pigment data from both estuar-ies showed that most pigment concentra-tions were significantly higher at the land-ward stations than at the seaward stationsfor all months. However, peridinin and chlc1 followed the opposite trend in NI sam-ples, with higher concentrations at Stn 4that decreased in the landward direction.Similarly, 19’-hexanoyloxyfucoxanthin (19’-hex) showed a significant increase fromStn 1 to Stn 4 in both estuaries. Linearregressions of absolute pigment concentra-tions against salinity showed significantnegative correlations for all pigments mea-sured except peridinin, neoxanthin, 19’-hex, zeaxanthin, and chl b.
Cluster analysis of HPLC profiles usingPearson’s correlation coefficient revealed 4major clusters (Fig. 4). Clusters A, B, and Dwere composed of several sub-clusters,whereas Cluster C was made up of a singleOCU collected in September from ACE Stn1. Cluster A1 was represented by samplesfrom NI Stns 1, 2, and 3, with the excep-tional addition of 1 sample from ACE Stn 2.Cluster A2 was mainly composed of sam-ples from ACE Stns 1 and 2, with 2 samplesfrom NI Stns 2 and 3. All but one of thesamples in Cluster A2 was collected inApril. Cluster B was divided into 3 sub-
clusters at the 0.998 level: B1 represented samplesfrom both estuaries throughout the sampling season,B2 was mostly made up of ACE samples, and B3 sam-ples were all collected in September or October fromboth estuaries. Cluster D comprised exclusively sam-ples from NI Stns 1 and 2, and could be further divided
135
Table 2. Salinity, chl a, dissolved organic carbon (DOC), nitrate + nitrite (NN), ammonium (NH4), total N (TN), total dissolved N (TDN),orthophosphate (PO4), total phosphorus (TP), and total dissolved P (TDP) from Ashepoo, Combahee, and Edisto (ACE) Basin and North Inlet
(NI) samples pooled over all months samples. Values are mean ± SD
Stn Salinity Chl a DOC NN NH4 TN TDN PO4 TP TDP(psu) (mg l–1) (mg l–1) (µM) (µM) (µM) (µM) (µM) (µM) (µM)
ACE 1 27.57 ± 3.7 12.86 ± 5.20 5.82 ± 1.1 2.01 ± 2.5 1.43 ± 1.4 56.11 ± 13.6 39.22 ± 12.8 0.79 ± 0.1 2.48 ± 0.5 0.66 ± 0.6ACE 2 31.85 ± 2.5 8.68 ± 2.1 4.86 ± 1.0 0.87 ± 1.0 1.13 ± 0.5 51.94 ± 10.4 38.52 ± 15.9 0.71 ± 0.2 2.40 ± 0.5 0.67 ± 0.6ACE 3 33.42 ± 1.6 8.15 ± 2.9 3.78 ± 1.6 0.50 ± 0.7 0.94 ± 0.8 45.66 ± 14.4 37.39 ± 11.1 0.55 ± 0.2 1.95 ± 0.6 0.58 ± 0.5ACE 4 34.85 ± 0.6 5.87 ± 2.3 3.53 ± 0.5 0.20 ± 0.2 0.80 ± 0.9 44.92 ± 14.3 32.52 ± 9.60 0.38 ± 0.2 1.48 ± 0.6 0.33 ± 0.5Pooled 31 ± 3.6 8.89 ± 4.1 4.50 ± 1.4 0.90 ± 1.5 1.08 ± 1.0 49.66 ± 13.7 36.91 ± 12.6 0.61 ± 0.2 2.08 ± 0.7 0.56 ± 0.5
NI 1 28.28 ± 11.8 6.16 ± 4.2 17.83 ± 22.0 0.39 ± 0.2 3.32 ± 2.7 59.04 ± 13.9 46.03 ± 22.0 0.27 ± 0.1 1.33 ± 0.8 0.46 ± 0.5NI 2 34.85 ± 2.2 8.18 ± 3.0 4.18 ± 1.2 0.17 ±0.1 1.26 ± 1.2 46.50 ± 26.1 36.24 ± 10.0 0.22 ± 0.1 1.28 ± 1.1 0.30 ± 0.4NI 3 35.57 ± 0.7 5.64 ± 1.8 3.61 ± 1.1 0.17 ± 0.1 1.42 ± 0.5 46.08 ± 18.3 39.83 ± 15.9 0.24 ± 0.1 1.15 ± 0.7 0.26 ± 0.4NI 4 35.85 ± 0.6 5.78 ± 1.3 3.42 ± 0.8 0.13 ± 0.1 0.85 ± 0.8 34.39 ± 21.3 28.78 ± 10.5 0.16 ± 0.1 0.78 ± 0.7 0.13 ± 0.3Pooled 33.78 ± 6.5 6.44 ± 2.9 7.26 ± 12.4 0.21 ± 0.2 1.71 ± 1.8 45.88 ± 22.1 37.41 ± 16.0 0.22 ± 0.1 1.14 ± 0.8 0.29 ± 0.4
0.00
0.50
1.00
1.50
2.00
2.50
AprM
ay Jun Ju
lAug Sep Oct
Bac
teria
l ab
und
ance
(x10
6 ce
lls m
l–1 )
B
0.00
0.50
1.00
1.50
2.00
2.50 AStn 1
Stn 2
Stn 3
Stn 4
Fig. 3. Bacterial abundance from water samples collected from (A) ACE and (B) NI. Error bars = SD from triplicate samples

Aquat Microb Ecol 45: 129–145, 2006
into 3 sub-clusters: D1 was composed of samples fromMay and June, D2 from October and May, and D3from April.
ANOVA of normalized pigment concentrations ofOCUs within clusters showed that all pigments exceptdiadinoxanthin and alloxanthin varied significantlyamong clusters (α = 0.05). Cluster B showed signifi-cantly higher concentrations of fucoxanthin, chl c, and19’-hex than the other clusters. The sample that repre-sented Cluster C had significantly higher levels of peri-dinin than all other samples (α = 0.05). Cluster D OCUswere characterized by higher concentrations of 19’-butanoyloxyfucoxanthin (19’-but), neoxanthin, prasino-xanthin, violaxanthin, lutein, chl b, and total carotenesthan those of other clusters.
Comparisons of nutrient data across clusters showedno significant correlations between cluster groups andwater chemistry except for Clusters A1 and C. ClusterA1 showed elevated DOC concentrations, and theOCU that makes up Cluster C was related to higherconcentrations of NN and PO4. Both sub-clusters inCluster A corresponded to significantly higher bacter-ial cell counts (α = 0.05). Permutation tests on the simi-larity matrix generated in the cluster analysis showedACE samples to be significantly different from NI sam-ples. Furthermore, the composite photopigment pat-terns differed significantly from month to month in thesampling season, and exhibited significant groupingby station.
CCA comparing phytoplankton community profileswith environmental state variables gave similar pat-terns to those generated by permutation testing ofcluster analysis, with ACE and NI samples forming
distinct groups (Fig. 5). Additionally, ACE OCUscorresponded to higher concentrations of PO4 and NN,whereas NI samples corresponded to both higher con-centrations of NH4 and warmer temperatures.
DGGE
DGGE-generated community banding patternsranged from 14 to 28 distinct bands (of 45 possibleband positions) in each sample, and the most promi-nent 14 from each were used in the analysis. An exam-ple of the gels used in this study is shown in Fig. 2.
136
0.988
0.990
0.992
0.994
0.996
0.998
1.000
A1 A2 B1 B2 B3 C D1 D2 D3
Pea
rson
’s C
oeffi
cien
t
Fig. 4. HPLC profiles determined by Pearson’s coefficient. Clusters at 0.996 similarity are indicated by letters, sub-clusters(similarity > 0.998) by letter-number combinations
–3
–1
1
3
–3 –1 1 3 5
Sal
PO4
NNNH4
TemppH TDP
Fig. 5. Phytoplankton operational community units (OCUs)from HPLC of photopigments relative to environmental vari-
ables showing ACE (s) and NI (m) OCUs

Johnson et al.: Linking bacterioplankton and phytoplankton communities
UPGMA and permutation testing of the clustering pat-terns pooled across all samples demonstrated OCUs togroup significantly into distinct PA and FL clusters aswell as significant ACE and NI clusters (Table 3). Addi-tionally, CCA of bacterial community profiles usingPA/FL fractions as a dummy environmental variableindicated that ACE OCUs tended to associate with PAcharacteristics, whereas NI OCUs tended to grouptoward the FL portion of the gradient (Fig. 6). Separatecluster analyses of PA and FL fractions furtherrevealed OCUs to group significantly by samplingmonth for both fractions (Fig. 7). Station-to-stationcomparisons of bacterial profiles did not show anysignificant patterns in their distribution.
At a Jaccard’s coefficient level of 0.50, PA OCUsgrouped into 10 clusters (Fig. 7A). ANOVA performedon the physical and chemical parameters of sampleswithin clusters revealed significant differences in tem-perature, salinity, pH, DOC, TP and NH4 among clus-ters (Table 4). In pair-wise comparisons, Clusters A andF had TP concentrations that were significantly higherthan those of other cluster groups. These clusters werepopulated almost exclusively by ACE samples col-lected from April to July, with a single OCU from NI inSeptember. Cluster G OCUs exhibited concentrationsof both DOC and NH4 that were significantly higherthan in all other clusters. Inversely, this cluster exhib-ited pH and salinity levels that were significantly lowerthan in all the other clusters except Cluster J. Cluster Gwas made up of a single OCU from NI Stn 1 water sam-ples from August, which were collected following arain event, and Cluster J was composed of a singleOCU representing the May sample from NI Stn 4. Pair-wise comparisons further revealed that the lowest con-centrations of DOC were from Cluster E, which wascomposed of 2 OCUs collected from ACE Stns 3 and 4in September. Although the global p-value for ANOVAof temperature effects showed the differences to besignificant, the only significant pair-wise contrast wasthat between Cluster C (May and June samples) andCluster I (April samples) OCUs, with Cluster C exhibit-ing higher temperatures.
FL samples grouped into 11 clusters at Jaccard’s co-efficient level of 0.50 (Fig. 7B). ANOVA of the physico-chemical factors of these OCUs showed temperature,salinity, NH4, NN, TP, and PO4 to differ significantlyamong clusters (Table 5). Pair-wise comparisonsshowed that Clusters D and H exhibited higher sal-inities than other clusters. Clusters D and H were bothcomposed primarily of NI samples, with Cluster Dlargely comprising samples collected from June andJuly, and Cluster H entirely comprising samples col-lected in May. Cluster D also exhibited higher temper-atures than all other clusters except Cluster I, whichwas composed of OCUs from ACE samples collected inJune. NH4 concentrations were highest in Cluster E(NI, samples collected from September and October)and significantly lower in Clusters H, I, and J. Cluster JOCUs exclusively comprised ACE samples collected inJune, August, and September. Pair-wise comparisonsalso showed Cluster J to have the highest NN concen-trations of all the clusters. Concentrations of TP andPO4 were highest in Clusters B and J, respectively.Both of these clusters were populated entirely by ACEOCUs: Cluster B was composed of samples collected inMay, and Cluster J OCUs of samples collected fromJune to September.
ANOVA of photopigment concentrations (normal-ized to chl a) from the bacterial community clusters
137
Table 3. Summary of permutation tests of UPGMA clusterpatterns. rwithin and rbetween: arithmetic mean over all Jaccardcoefficients within and between groups, respectively;
d: difference between the 2 r-values
rwithin rbetween d p
ACE vs. NI 0.4736 0.4178 0.0557 <0.0001PA vs. FL 0.4528 0.4383 0.0144 <0.0003
–3
–2
–1
0
1
2
3
4
–8 –6 –4 –2 0 2 4 6
ACE-FL
ACE-PA
NI-FL
NI-PA
FL
Fig. 6. Bacterial OCUs from DGGE banding patterns withparticle-associated (PA)/free-living (FA) fraction as an envi-ronmental dummy variable. Gradient vector indicates the
direction of increasing FL characteristics

Aquat Microb Ecol 45: 129–145, 2006
identified by UPGMA revealed significant differ-ences in photopigments for both PA and FL com-munity profiles. ANOVA of photopigments from PAcommunity clusters showed significant differences inchl b, chl c1, fucoxanthin, alloxanthin, diadinoxan-thin, and diatoxanthin at the 0.05 α-level (Table 4).Pair-wise comparisons of relative chl b concentra-tions indicated that only Clusters B (ACE May andNI April) and I (ACE and NI April) differed signifi-cantly from one another after Tukey corrections for
multiple comparisons. Comparisons of chl c1 valuesshowed that the 2 OCUs from Cluster E (ACE Sep-tember samples) had the highest relative concentra-tions of this pigment. Although globally significant(α = 0.05), the differences in both fucoxanthin andalloxanthin concentrations among clusters were notsignificant in any pair-wise comparisons. Both dia-dinoxanthin and diatoxanthin were highest in thesingle NI October OCU in Cluster H, and lowest inOCUs from Clusters B and I.
138
NI-4
May
NI-4
Ap
rN
I-3 A
pr
NI-1
Ap
r
AC
E-3
Ap
r
NI-1
Oct
NI-1
Aug
NI-2
Ap
rA
CE
-3 M
ayA
CE
-2 M
ayA
CE
-1 M
ayN
I-1 S
epA
CE
-2 A
pr
AC
E-1
Ap
r
AC
E-4
May
AC
E-1
Jul
AC
E-1
Jun
NI-3
May
NI-2
May
NI-1
May
NI-3
Jun
AC
E-4
Jul
NI-4
Jul
NI-3
Jul
NI-1
Jun
NI-2
Jul
NI-2
Jun
AC
E-2
Jun
AC
E-4
Sep
AC
E-3
Sep
NI-2
Sep
NI-4
Aug
NI-3
Aug
NI-2
Aug
NI-4
Sep
NI-3
Sep
NI-4
Oct
NI-3
Oct
NI-2
Oct
AC
E-2
Jul
AC
E-1
Sep
AC
E-4
Ap
rA
CE
-4 A
ug
AC
E-2
Aug
AC
E-1
Aug
AC
E-3
Aug
AC
E-3
Jul
AC
E-3
Oct
AC
E-4
Oct
AC
E-2
Oct
AC
E-1
Oct
AC
E-4
Jun
AC
E-3
Jun
A
Jacc
ard
’s c
oef
ficie
nt
(A)
B C FE HG I JD
0.28
0.40
0.52
0.64
0.76
0.88
1.00 AC
E-2
Sep
AC
E-4
Jul
AC
E-2
Sep
AC
E-1
Aug
AC
E-1
Sep
AC
E-3
Jun
AC
E-4
Ap
r
AC
E-4
Jun
AC
E-2
Jun
AC
E-1
Jun
NI-4
May
NI-2
May
NI-1
May
NI-4
Aug
NI-3
Aug
NI-2
Aug
NI-1
Aug
NI-2
Ap
rN
I-1 A
pr
NI-3
Oct
NI-2
Oct
NI-4
Oct
NI-1
Oct
NI-1
Sep
NI-4
Jun
NI-3
Jun
NI-1
Jun
NI-3
May
NI-2
Jul
NI-3
Jul
NI-1
Jul
NI-4
Sep
NI-3
Sep
NI-2
Sep
NI-4
Jul
NI-2
Jun
AC
E-3
Aug
AC
E-2
Jul
AC
E-4
Aug
AC
E-3
Jul
AC
E-4
Oct
AC
E-3
Oct
AC
E-1
Oct
AC
E-4
Sep
NI-4
Ap
rN
I-3 A
pr
AC
E-1
Jul
AC
E-4
May
AC
E-2
May
AC
E-1
May
AC
E-3
Sep
AC
E-3
Ap
rA
CE
-2 A
pr
AC
E-3
May
AC
E-1
Ap
r
AC
E-2
Aug
A
(B)
Jacc
ard
’s c
oef
ficie
nt
B C FE HG I JD K
0.28
0.40
0.52
0.64
0.76
0.88
1.00
Fig. 7. Clustering of (A) PA and (B) FL samples from both estuaries for all months. OCUs are labeled according to estuary (ACE or NI), station number, and month. Clusters at 0.50 similarity are indicated by letters

Johnson et al.: Linking bacterioplankton and phytoplankton communities 139
Tab
le 4
. Att
rib
ute
s sh
ared
by
OC
Us
in P
A c
lust
ers
at 0
.5 s
imil
arit
y, d
eter
min
ed b
y U
PG
MA
. Val
ues
are
mea
n ±
SD
, exc
ept
wh
ere
n =
1. L
ette
rs in
dic
ate
Tu
key
gro
up
ing
in m
ult
iple
p
air-
wis
e co
mp
aris
ons.
Val
ues
wit
h t
he
sam
e le
tter
s w
ith
in e
ach
row
are
not
sig
nif
ican
tly
dif
fere
nt
A(3
)B
(4)
C(1
1)D
(24)
E(2
)F
(3)
G(1
)H
(1)
I(4)
J(1)
p
No
. of
OC
Us
fro
m:
AC
E
23
215
23
00
10
NI
11
99
00
11
21
Ap
r, S
epA
pr,
May
May
–Ju
lA
ug
–O
ctS
epM
ay–
Jul
Au
gO
ctA
pr
May
Bac
t. a
bu
nd
ance
1.18
×10
61.
26 ×
106
6.98
×10
55.
10 ×
105
–8.
68 ×
105
6.00
×10
51.
17 ×
105
6.33
×10
55.
47 ×
105
0.00
53(c
ells
ml–
1 )±
1.5
×10
5AB
±6.
9 ×
105A
±3.
5 ×
105A
B2.
8 ×
105A
B–
±4.
1 ×
105A
BA
BB
±4.
1 ×
105A
BA
B
Sta
te v
aria
ble
DO
C (
mg
l–
1 )9.
72 ±
4.9B
4.97
±0.
5BC
4.79
±1.
5BC
4.10
±1.
0BC
1.90
±2.
2C4.
18 ±
0.8B
C64
.9A
4.36
BC
5.33
±2.
4BC
3.33
C<
0.00
01 0
TN
(µ
M)
53.4
8 ±
3.90
47.0
8 ±
31.5
52.9
7 ±
12.7
46.2
0 ±
11.6
–53
.33
±6.
00–
–34
.18
±25
.044
.68
0.59
28T
DN
(µ
M)
36.4
6 ±
22.2
38.9
9 ±
5.60
42.7
2 ±
13.6
36.7
4 ±
8.70
29.3
4 ±
3.30
42.4
0 ±
9.90
–34
.13
26.9
2 ±
6.60
35.8
60.
3937
NH
4(µ
M)
4.43
±3.
2AB
1.81
±0.
5BC
1.01
±0.
8C1.
21 ±
0.8B
C0.
25 ±
0.1C
0.47
±0.
2C6.
55A
2.55
BC
1.31
±0.
6BC
0.33
C<
0.00
01 0
NN
(µ
M)
1.09
±0.
960.
94 ±
0.64
0.12
±0.
140.
73 ±
1.63
1.24
±1.
190.
14 ±
0.25
0.54
0.53
0.25
±0.
360.
330.
8979
TP
(µ
M)
2.23
±0.
0A2.
15 ±
1.4A
B1.
45 ±
0.4A
B1.
84 ±
0.6A
B–
2.30
±0.
0A0.
97A
B–
0.53
±0.
4B0.
89A
B0.
0165
TD
P (
µM
)0.
193
±0.
330.
481
±0.
320.
712
±0.
250.
510
±0.
460.
554
±0.
260.
768
±0.
640.
47–
0.00
0 ±
0.00
0.13
40.
1369
PO
4(µ
M)
0.31
9 ±
0.09
0.63
5 ±
0.36
0.40
1 ±
0.16
0.45
2 ±
0.34
0.51
9 ±
0.24
0.71
6 ±
0.28
0.00
80.
165
0.13
7 ±
0.05
0.27
30.
1854
Si
(mg
l–
1 )34
.14
±18
.024
.43
±5.
5041
.50
±26
.316
.18
±12
.615
.30
±8.
709.
93 ±
3.8
17.7
418
.90
±17
.96.
61–
0.08
71S
alin
ity
(psu
)25
.33
±3.
7B
30.7
5 ±
2.9A
B35
.81
±0.
8A
33.6
2 ±
2.9A
B33
.00
±1.
4AB
32.6
6 ±
2.0A
B2C
36A
32.5
0 ±
3.6A
B36
A<
0.00
01 0
Tem
per
atu
re (
°C)
21.6
7 ±
4.0
A24
.56
±2.
6A
27.7
6 ±
3.4
A25
.72
±3.
6A
26.0
9 ±
0.0A
27.7
2 ±
3.5A
26.2
8A21
.3A
19.6
3 ±
0.6A
22.6
7A0.
0129
pH
7.2
±0.
6AB
7.5
±0.
1AB
7.3
±0.
4AB
7.7
±0.
2A7.
7 ±
0.1A
7.6
±0.
1A6.
6B7.
6AB
7.5
±0.
2A7.
90.
0104
Pig
men
t
Ch
l b
0.03
66 ±
0.04
5A0.
0812
±0.
032A
0.05
50 ±
0.03
2A0.
0424
±0.
013A
0.03
21 ±
0.01
1A0.
0291
±0.
005A
0.02
53A
0.05
25A
0.02
56 ±
0.01
7A0.
0484
A0.
0467
Ch
l c 1
0.06
16 ±
0.00
6B0.
0543
±0.
005B
0.05
89 ±
0.01
4B0.
0632
±0.
005B
0.09
31 ±
0.00
2A0.
0628
±0.
005B
0.07
44A
B0.
0552
B0.
0641
±0.
004B
0.06
68B
0.00
03C
hl
c 20.
0609
±0.
010
0.06
68 ±
0.01
10.
0705
±0.
026
0.08
49 ±
0.02
60.
0897
±0.
004
0.09
28 ±
0.00
20.
0745
0.05
060.
0664
±0.
011
0.08
350.
3435
Per
idin
in0.
0071
±0.
001
0.00
51 ±
0.00
40.
0082
±0.
010
0.01
58 ±
0.01
30.
0069
±0.
001
0.02
39 ±
0.01
50.
0139
0.00
080.
0070
±0.
001
0.00
430.
2157
19’-
bu
t0.
0066
±0.
002
0.00
58 ±
0.00
20.
0059
±0.
005
0.00
38 ±
0.00
20.
0041
0.00
55 ±
0.00
40.
0030
0.00
160.
0084
±0.
005
0.00
380.
1952
Fu
coxa
nth
in0.
3053
±0.
007A
0.32
47 ±
0.04
1A0.
3496
±0.
082A
0.39
08 ±
0.03
8A0.
4563
±0.
015A
0.38
02 ±
0.03
3A0.
4382
A0.
3301
A0.
3496
±0.
065A
0.41
50A
0.02
33N
eoxa
nth
in0.
0058
±0.
009
0.00
59 ±
0.00
70.
0078
±0.
006
0.00
72 ±
0.00
40.
0059
±0.
003
0.00
54 ±
0.00
10.
0059
0.00
970.
0031
±0.
003
0.00
220.
8374
Pra
sin
oxan
thin
0.01
61 ±
0.02
20.
0234
±0.
010
0.01
58 ±
0.00
80.
0110
±0.
006
0.00
850.
0106
±0.
006
0.00
400.
0077
0.00
79 ±
0.00
60.
0154
0.19
1819
’-h
ex0.
0026
±0.
004
0.00
44 ±
0.00
40.
0017
±0.
003
0.00
46 ±
0.00
50.
0041
0.00
34 ±
0.00
30.
0000
0.00
030.
0026
±0.
003
0.00
600.
1768
Vio
laxa
nth
in0.
0167
±0.
022
0.02
31 ±
0.01
00.
0156
±0.
010
0.01
29 ±
0.00
40.
0091
±0.
002
0.00
89 ±
0.00
30.
0092
0.01
960.
0067
±0.
003
0.01
220.
7283
Dia
din
oxan
thin
0.06
06 ±
0.01
0AB
0.03
96 ±
0.00
2B0.
0533
±0.
007A
B0.
0601
±0.
009A
B0.
0765
±0.
001A
0.05
51 ±
0.01
2AB
0.07
48A
0.07
83A
0.04
73 ±
0.00
6B0.
0535
AB<
0.00
0100
All
oxan
thin
0.01
51 ±
0.00
4A0.
0230
±0.
008A
0.01
41 ±
0.00
6A0.
0158
±0.
005A
0.01
19 ±
0.00
1A0.
0244
±0.
003A
0.01
29A
0.02
21A
0.02
11 ±
0.00
9A0.
0156
A0.
0482
Dia
toxa
nth
in0.
0073
±0.
005A
B0.
0066
±0.
001A
B0.
0088
±0.
003A
B0.
0093
±0.
003A
B0.
0133
±0.
002A
B0.
0088
±0.
002A
B0.
0141
AB
0.01
54A
0.00
58 ±
0.00
3B0.
0081
AB
0.02
34Z
eaxa
nth
in0.
0166
±0.
021
0.03
45 ±
0.02
10.
0240
±0.
014
0.03
46 ±
0.01
90.
0337
±0.
001
0.03
35 ±
0.02
50.
0206
0.03
150.
0101
±0.
008
0.04
950.
2840
Lu
tein
0.00
42 ±
0.00
20.
0103
±0.
006
0.00
86 ±
0.00
90.
0083
±0.
004
0.00
49 ±
0.00
20.
0064
±0.
006
0.00
730.
0157
0.00
34 ±
0.00
20.
0051
0.49
88α-
an
d β
-car
oten
e0.
0327
±0.
017
0.05
97 ±
0.00
90.
0474
±0.
020
0.04
98 ±
0.01
00.
0476
0.04
37 ±
0.00
60.
0418
0.06
400.
0382
±0.
016
0.05
480.
2647

Aquat Microb Ecol 45: 129–145, 2006140
Tab
le 5
. A
ttri
bu
tes
shar
ed b
y O
CU
s in
FL
clu
ster
s at
0.5
sim
ilar
ity,
det
erm
ined
by
UP
GM
A.
Val
ues
are
mea
n ±
SD
, ex
cep
t w
her
e n
= 1
. L
ette
rs i
nd
icat
e T
uk
ey g
rou
pin
g i
n m
ult
iple
p
airw
ise
com
par
ison
s. V
alu
es w
ith
th
e sa
me
lett
ers
wit
hin
eac
h r
ow a
re n
ot s
ign
ific
antl
y d
iffe
ren
t
A(5
)B
(3)
C(4
)D
(20)
E(5
)F
(4)
G(2
)H
(3)
I(3)
J(4)
K(2
)p
No
. of
OC
Us
fro
m:
AC
E5
30
60
22
03
42
NI
00
414
52
03
00
0
Ap
r, M
ay, S
epM
ayA
pr,
Au
gM
ay–O
ctS
ep–O
ctA
pr,
Ju
l, S
epO
ctM
ayJu
nJu
n, A
ug
, Sep
Ap
r, J
ul
Bac
t. a
bu
nd
ance
1.38
×10
61.
21 ×
106
8.33
×10
56.
33 ×
105
3.60
×10
54.
58 ×
105
6.29
×10
55.
90 ×
105
5.51
×10
57.
07 ×
105
3.37
×10
50.
0068
(cel
ls m
l–1)
±4.
1 ×
105A
±2.
8 ×
105A
B±
5.0
×10
5AB
±3.
8 ×
105A
B±
3.7
×10
5B±
3.1
×10
5AB
±2.
1 ×
105A
B±
1.3
×10
5AB
±3.
1 ×
105A
B±
1.0
×10
5AB
±5.
5 ×
104B
Sta
te v
aria
ble
DO
C (
mg
l–1)
4.70
±2.
74.
80 ±
1.0
20.8
6 ±
29.4
4.16
±1.
15.
81 ±
5.3
3.72
±0.
25.
45 ±
1.1
4.30
±1.
34.
05 ±
1.0
4.35
±1.
33.
660.
2714
TN
(µ
M)
55.5
3 ±
6.0
60.8
9 ±
4.4
40.4
2 ±
35.5
50.2
3 ±
12.5
–28
.81
±27
.7–
46.0
3 ±
1.90
41.2
9 ±
5.40
53.9
1 ±
11.4
38.5
8 ±
13.1
0.26
38T
DN
(µ
M)
29.6
5 ±
7.7
40.2
6 ±
2.7
35.4
5 ±
5.4
39.3
0 ±
13.2
39.5
3 ±
13.6
31.8
1 ±
15.3
38.2
3 ±
0.50
37.8
8 ±
2.70
33.8
1 ±
7.10
40.9
9 ±
8.90
30.7
3 ±
4.10
0.82
26N
H4
(µM
)1.
78 ±
1.3A
B1.
35 ±
0.8A
B2.
86 ±
2.4A
B1.
14 ±
0.8A
B3.
32 ±
2.6A
0.79
±0.
5AB
2.06
±0.
9AB
0.34
±0.
2B0.
30 ±
0.1B
0.46
±0.
5B0.
88 ±
0.1A
B0.
0141
NN
(µ
M)
1.16
±0.
9AB
1.05
±0.
6AB
0.41
±0.
3B0.
12 ±
0.1B
0.44
±0.
0B0.
14 ±
0.1B
0.94
±0.
6AB
0.33
±0.
0B0.
00 ±
0.0B
2.98
±3.
4A0.
00 ±
0.0B
0.00
17T
P (
µM
)2.
09 ±
0.6A
B2.
74 ±
0.5A
1.02
±1.
0AB
1.63
±0.
5AB
–0.
90 ±
1.2B
–1.
02 ±
0.2A
B1.
78 ±
0.3A
B2.
10 ±
0.0A
B1.
00 ±
0.6A
B0.
0179
TD
P (
µM
)0.
26 ±
0.3
0.48
±0.
30.
08 ±
0.1
0.60
±0.
40.
23 ±
0.2
0.44
±0.
60.
47 ±
0.4
0.42
±0.
20.
73 ±
0.0
0.81
±0.
30.
50 ±
0.7
0.27
61P
O4
(µM
)0.
43 ±
0.2A
B0.
71 ±
0.2A
B0.
14 ±
0.1B
0.39
±0.
2AB
0.10
±0.
1B0.
39 ±
0.4A
B0.
43 ±
0.3A
B0.
35 ±
0.0A
B0.
63 ±
0.1A
B0.
81 ±
0.1A
0.33
±0.
2B0.
0049
Si (
mg
l–1)
20.4
6 ±
5.3
19.9
6 ±
12.5
34.9
6 ±
15.0
27.7
7 ±
27.1
18.3
5 ±
20.9
8.94
±2.
123
.04
±17
.725
.62
±18
.015
.25
±10
.331
.27
±14
.46.
490.
8555
Sal
init
y (p
su)
28.6
0 ±
4.7A
B30
.66
±4.
0AB
23.5
0 ±
14.5
B35
.45
±0.
8A34
.40
±3.
5AB
34.2
5 ±
1.7A
B32
.50
±3.
5AB
36.3
3 ±
0.5A
33.3
3 ±
2.0A
B29
.25
±4.
2AB
34.5
0 ±
0.7A
B0.
0022
Tem
per
atu
re (
°C)
21.9
1 ±
3.5A
B25
.37
±1.
1AB
24.0
5 ±
4.1A
B27
.76
±3.
1A22
.70
±2.
0AB
23.9
5 ±
5.7A
B20
.60
±0.
2B22
.78
±0.
4AB
27.9
2 ±
0.3A
27.4
9 ±
1.8A
B24
.53
±7.
6AB
0.00
52p
H7.
66 ±
0.0
7.60
±0.
27.
12 ±
0.3
7.49
±0.
47.
60 ±
0.6
7.68
±0.
17.
85 ±
0.2
7.69
±0.
27.
73 ±
0.1
7.61
±0.
17.
74 ±
0.0
0.40
66
Pig
men
t
Ch
l b0.
024
±0.
02C
0.07
9 ±
0.04
AB
0.03
3 ±
0.01
BC
0.04
1 ±
0.01
AB
C0.
053
±0.
02A
BC
0.03
3 ±
0.01
BC
0.04
6 ±
0.00
9AB
C0.
090
±0.
03A
0.03
4 ±
0.01
BC
0.04
3 ±
0.02
AB
C0.
029
±0.
01B
C0.
0036
Ch
l c1
0.06
9 ±
0.01
0.05
4 ±
0.00
0.06
3 ±
0.00
0.06
3 ±
0.01
0.06
1 ±
0.00
0.07
0 ±
0.01
0.06
0 ±
0.00
0.05
2 ±
0.01
0.06
6 ±
0.00
0.06
2 ±
0.00
0.06
4 ±
0.00
0.44
23C
hl c
20.
068
±0.
010.
071
±0.
020.
071
±0.
010.
087
±0.
020.
068
±0.
010.
083
±0.
010.
057
±0.
000.
054
±0.
020.
099
±0.
010.
070
±0.
020.
091
±0.
010.
1506
Per
idin
in0.
007
±0.
000.
004
±0.
000.
016
±0.
010.
014
±0.
010.
005
±0.
000.
015
±0.
010.
001
±0.
000.
001
±0.
000.
035
±0.
010.
019
±0.
010.
012
±0.
000.
1167
19’-
bu
t0.
006
±0.
000.
005
±0.
000.
004
±0.
000.
005
±0.
000.
003
±0.
000.
007
±0.
000.
002
±0.
000.
003
±0.
000.
005
±0.
000.
004
±0.
000.
003
±0.
000.
7493
Fu
coxa
nth
in0.
345
±0.
060.
328
±0.
060.
360
±0.
060.
383
±0.
060.
358
±0.
040.
404
±0.
050.
362
±0.
040.
327
±0.
070.
407
±0.
020.
375
±0.
040.
372
±0.
060.
6576
Neo
xan
thin
0.00
2 ±
0.00
B0.
007
±0.
00A
B0.
004
±0.
00A
B0.
006
±0.
00A
B0.
008
±0.
00A
B0.
005
±0.
00A
B0.
008
±0.
00A
B0.
013
±0.
01A
0.00
6 ±
0.00
AB
0.00
8 ±
0.00
AB
0.00
2 ±
0.00
B0.
0504
Pra
sin
oxan
thin
0.00
7 ±
0.00
A0.
025
±0.
01A
0.00
6 ±
0.00
A0.
013
±0.
00A
0.01
3 ±
0.01
A0.
009
±0.
00A
0.00
8 ±
0.00
A0.
021
±0.
01A
0.01
6 ±
0.00
A0.
011
±0.
00A
0.00
6 ±
0.00
A0.
0480
19’-
hex
0.00
7 ±
0.00
0.02
4 ±
0.01
0.00
9 ±
0.00
0.01
2 ±
0.00
0.01
9 ±
0.01
0.00
8 ±
0.00
0.01
6 ±
0.00
0.02
7 ±
0.01
0.00
8 ±
0.00
0.01
1 ±
0.00
0.00
9 ±
0.00
0.87
75V
iola
xan
thin
0.00
3 ±
0.00
B0.
003
±0.
00A
B0.
001
±0.
00B
0.00
3 ±
0.00
AB
0.00
3 ±
0.00
AB
0.00
3 ±
0.00
B0.
000
±0.
00A
B0.
002
±0.
00A
0.00
7 ±
0.00
B0.
002
±0.
00A
B0.
004
±0.
00B
0.00
18D
iad
inox
anth
in0.
056
±0.
01A
B0.
041
±0.
00B
0.05
5 ±
0.01
AB
0.05
5 ±
0.00
AB
0.07
0 ±
0.00
A0.
057
±0.
01A
B0.
072
±0.
00A
0.06
0 ±
0.00
AB
0.05
6 ±
0.00
AB
0.05
6 ±
0.00
AB
0.05
9 ±
0.00
AB
0.04
06A
lloxa
nth
in0.
014
±0.
00A
B0.
018
±0.
00A
B0.
019
±0.
01A
B0.
015
±0.
00A
B0.
015
±0.
00A
B0.
022
±0.
00A
B0.
015
±0.
00A
B0.
009
±0.
00B
0.02
5 ±
0.00
A0.
016
±0.
00A
B0.
013
±0.
00A
B0.
0352
Dia
toxa
nth
in0.
007
±0.
000.
006
±0.
000.
007
±0.
000.
008
±0.
000.
012
±0.
000.
009
±0.
000.
012
±0.
000.
010
±0.
000.
009
±0.
000.
008
±0.
000.
008
±0.
000.
2326
Zea
xan
thin
0.02
1 ±
0.02
0.04
4 ±
0.01
0.01
3 ±
0.00
0.03
1 ±
0.02
0.02
6 ±
0.01
0.02
2 ±
0.00
0.03
4 ±
0.00
0.04
1 ±
0.01
0.03
6 ±
0.02
0.02
1 ±
0.01
0.02
7 ±
0.03
0.53
88L
ute
in0.
003
±0.
00B
0.01
0 ±
0.00
AB
0.00
4 ±
0.00
AB
0.00
6 ±
0.00
AB
0.01
1 ±
0.00
AB
0.00
6 ±
0.00
AB
0.01
2 ±
0.00
AB
0.01
7 ±
0.01
A0.
004
±0.
00A
B0.
008
±0.
00A
B0.
005
±0.
00A
B0.
0232
α- a
nd
β-c
arot
ene
0.03
4 ±
0.01
B0.
058
±0.
01A
B0.
041
±0.
01B
0.04
4 ±
0.00
AB
0.05
2 ±
0.00
AB
0.04
7 ±
0.00
AB
0.05
5 ±
0.01
AB
0.07
4 ±
0.02
A0.
047
±0.
01A
B0.
052
±0.
01A
B0.
034
±0.
01B
0.00
45
Johnson et al.: Linking bacterioplankton and phytoplankton communities
ANOVA of relative photopigment concentrationsclassified by FL bacterial clusters revealed significantdifferences in chl b, neoxanthin, prasinoxanthin, viola-xanthin, diadinoxanthin, alloxanthin, lutein, and α-and β-carotenes (Table 5). In pair-wise comparisons,Cluster H (NI May) exhibited the highest concentra-tions of chl b, neoxanthin, violaxanthin, lutein, and α-and β-carotenes. This cluster also corresponded to thelowest concentrations of alloxanthin. Relative concen-trations of diadinoxanthin were highest in Clusters Gand E, which are composed of OCUs from NI and ACEfrom September and October. Significantly lower con-centrations of diadinoxanthin were found in OCUsfrom Cluster B (ACE May). Normalized concentrationsof prasinoxanthin were significant globally, but no sig-nificant pair-wise differences were detected.
Sequence data from excised bands representing 10of the 45 potential band positions confirmed the posi-tioning determined by image analysis among DGGEgels. Furthermore, comparisons of these sequencesto known sequences in GenBank indicated that thebands were indeed representative of marine or estuar-ine organisms. Specifically, the bands at Positions 1and 4 were each composed of a single sequence with100% homology to several uncultured marine Bactero-idetes organisms and were found in 85 and 92 OCUs,respectively. Three organisms were represented inBand 16; Acinetobacter sp. 11, an uncultured saltmarsh Ectothiorhodospiraceae sp., and an unculturedα-Proteobacterium. This band was scored in 97 of the109 OCUs. It should be noted that because DGGE sep-arates fragments based on melting characteristicsrather than strictly by sequence, it is quite common tofind bands that are composed of multiple sequences.For this study we assumed that bands at the same posi-tion between gels were identical in composition eventhough they were not all sequenced. Although thislimited our ability to perform detailed analyses of theactual compositions of the communities, it providedfor conservative measure of pattern differences andgreatly reduced any Type II error in our analysis. Band20 was present in 66 of the community profiles and wasmade up of 2 distinct sequences, one with 100%homology to an uncultured marine Bacteroidetesorganism and the other matching the V3 16S rRNAgene sequence of Marinobacter arcticus. Band 23included sequences with 100% similarity to uncul-tured marine γ- and β-Proteobacteria. Eighty OCUscontained bands at Position 27 that showed 100%homology to uncultured Bacteroidetes and Roseobac-ter 16S r RNA gene sequences. Band 36, which wasseen in 72 of the bacterial community profiles, wascomposed of a single sequence that matched the 16SrRNA gene sequence from a Sphingomonas sp. organ-ism. The most common bands were those at Positions
39 and 40, which were observed in 105 and 104 OCUs,respectively. Band 39 contained sequences homo-logous to an uncultured γ-Proteobacterium, an un-cultured β-Proteobacterium, and an uncultured Bac-teroidetes organism. Band 40 was composed of a singlesequence that matched 16S rRNA from a differentuncultured α-Proteobacterium. Band 41 was also com-posed of a single α-Proteobacterium sequence and wasobserved in 47 of the 109 OCUs. Unfortunately, thesequences obtained from gel bands predominantlymatched 16S rRNA from uncultured or unidentifiedorganisms, and because they are relatively short frag-ments, each sequence has 100% similarity to severaltaxa from available DNA sequence databases. As aresult, clear identification of the specific taxa involvedis not possible from our data; however, results fromBLAST searches do show 100% homology of themost frequently occurring bands to uncultured or un-identified organisms collected from marine or estuar-ine environments.
DISCUSSION
Water chemistry, photopigment distribution, andbacterial community composition all demonstratedclear differences between the ACE Basin and NIestuaries. The differences in nutrient concentrationsbetween ACE and NI samples correlated closely withsalinity differences between the systems, indicatingthat the larger drainage basin and higher riverineinput in ACE affect the overall chemistry of the estu-ary; in contrast, the NI is more tidally dominated,reflecting its relatively small drainage. The influenceof freshwater, riverine inflow on overall nutrient chem-istry may have been further indicated by the increasein TDP in the seaward direction as observed for ACEsamples. Total suspended solids in ACE were shown tobe significantly higher than in NI (Noble et al. 2003),and, as reported by Gardolinski et al. (2004), boundphosphorus tends to be released into the water columnfrom river-borne particles as salinity increases. Addi-tional evidence for the influence of freshwater input ontotal water chemistry was apparent in NI Stn 1 samplesfrom August, which were collected only a few hoursafter a rain event. Freshwater loading into the systemswas indicated by lower salinity and higher concentra-tions of NH4 and DOC than samples previously, orsubsequently, collected from that station; however, theTDP and PO4 concentrations on that date were signifi-cantly lower than those of all other samples collected atthat site, whereas TP measurements were not. There-fore, although the total amount of P in the water at thisstation remained unchanged, it was almost entirelyassociated with particles. These deviations in water
141

Aquat Microb Ecol 45: 129–145, 2006
chemistry were likely due to inflow of freshwater thathad been enriched with DOC, NH4, and P-rich particu-late material from the terrestrial component of theestuary.
Within each estuary the nutrient patterns typicallyfollowed the salinity gradient, with lower nutrient con-centrations generally found in the seaward direction,presumably due to dilution in seawater. These trendswere more apparent in ACE than in NI, and are similarto trends in nutrient chemistry found in other estuarieson the eastern seaboard of North America that arecharacterized by large river inputs and relatively littleoceanic influence (Christian et al. 1991, Bouvier & delGiorgio 2002). In contrast, NI nutrient patterns showeddecreasing concentrations of NN and PO4, similar toresults obtained by Verity (2002) in a study of hydrol-ogy and nutrient dynamics within a tidally dominatedsalt marsh estuary on the Georgia coast.
Results of phytoplankton community analysis largelyagree with those of Noble et al. (2003), with greaterphototrophic biomass in the ACE Basin, consistentwith the influence of riverine input on increasing nutri-ent availability and consequent stimulation of phyto-plankton production. The findings of Noble et al.(2003) further indicated spatial and temporal changes,with higher concentrations of pigments indicative ofdiatoms, dinoflagellates, haptophytes, and crypto-phytes in ACE samples and higher levels of pigmentsassociated with chlorophytes, prasinophytes and/orcyanobacteria in NI samples.
For most of the pigments measured, absolute con-centrations were negatively correlated with salinitybut relative concentrations were not, indicating thatalthough the salinity gradient and correspondingnutrient gradients had an effect on the overall size ofthe population, under most conditions they had littledirect effect on the structure of the community. How-ever, comparisons of water chemistry with photopig-ments do suggest that the composition of the phyto-plankton community may have changed in response tosufficiently large shifts in nutrient concentration.Specifically, samples from ACE Stn 1 in Septembershowed a 2-fold increase in NN concentration relativeto other samples from that estuary. This correspondedto a greater than 2-fold increase in both the absoluteand relative concentrations of peridinin, a dinoflagel-late pigment, indicating an increase in dinoflagellatebiomass and an increase in their relative abundancewithin the phytoplankton community, and may beindicative of a small-scale bloom event.
As with the pigment profiles, DGGE banding pat-terns showed some overlap among samples, yet stillshowed significant differences based on cluster analy-sis. Cluster analysis of all samples as a single data setrevealed significant grouping of community profiles
into ACE and NI clusters, demonstrating that eachestuary supported a measurably different bacterialcommunity. Additionally, both estuaries exhibited sig-nificant differences in FL and PA bacterial communi-ties. The absence of systematic variation in station-to-station comparisons within the estuaries suggests that,although there may be differences in bacterial commu-nity composition along the chemical gradients, thesedifferences are much smaller than the variationbetween estuaries and the differences between FL andPA fractions of the bacterioplankton.
Comparisons made among ecological properties ofthe clusters defined in UPGMA demonstrated compo-sitional differences in bacterial communities that cor-responded to differences in several state variables.Although differences in community patterns did notstrictly follow the salinity gradients observed withinthe 2 estuaries, there was a clear effect of salinity onthe composition in general, mostly due to salinity dif-ferences between ACE and NI. Other research hasshown measurable changes along salinity gradients inother estuaries as well as differences between estuar-ies (Schultz & Ducklow 2000, Bouvier & del Giorgio2002, del Giorgio & Bouvier 2002). Our work is not nec-essarily in disagreement with such findings. Rather, wesuggest that the narrow range of bacterial groupsobserved in our gels did not allow for the scale neces-sary to reveal broad differences in community struc-tures. For example, although a clear shift in communitycomposition from β-Proteobacteria in the freshwaterregions of the Choptank River (a sub-estuary of Chesa-peake Bay) to α-Proteobacteria further down the estu-ary was shown using fluorescent in situ hybridizationwith group-specific probes (Bouvier & del Giorgio2002, del Giorgio & Bouvier 2002), the gradient weselected predominantly resolved unidentified mem-bers of the α-subclass of Protebacteria and uniden-tified members of the class Bacteroidetes, and onlydetected a single unidentified β-proteobacterial se-quence.
Significant differences in the composition of both PAand FL assemblages were associated with differencesin phosphorus and nitrogen concentrations; however,the 2 fractions were affected by different species ofthose elements. FL community clusters showed signifi-cant differences in NH4 and NN concentrations,whereas PA clusters exhibited differences only in lev-els of NH4. Clusters from both fractions also showedsignificant differences in the amount of TP present inthe water column; however, only the FL fraction exhib-ited significant differences in the concentration of PO4
among clusters. This is consistent with the concept thatPA organisms use particles as refugia and as sourcesfor nutrition and are thereby subject to microzonenutrient chemistry, whereas FL organisms are more
142

Johnson et al.: Linking bacterioplankton and phytoplankton communities
directly influenced by bulk water chemistry (Cho &Azam 1988). Additionally, NN and PO4 tend to be morebioreactive than NH4 and particulate or organic phos-phorus, and are likely to be rapidly scavenged directlyfrom the water column, thus affecting FL cells morerapidly than PA cells. PA clusters also exhibited signif-icant differences in DOC concentrations among clustergroups; however, the cluster that exhibited the highestconcentration was composed of OCUs from samplescollected following a rain event. This cluster had DOCconcentrations more than 6 times greater than those ofother clusters and salinity that was uncharacteristic forthis site, indicating that this sample representedallochthonous input of water, nutrients, and likely, par-ticulates, thus physically introducing a new PA com-munity rather than causing a compositional shift in thepreexisting PA assemblage.
Comparisons of photopigment concentrations amongbacterial profile clusters demonstrated clear composi-tional associations between PA and FL communities.Clusters identified in PA OCUs demonstrated signifi-cant differences in concentrations of pigments attribut-able to diatoms, some dinoflagellates, haptophytes andcryptophytes, with the lowest concentrations of thesepigments occurring in association with clusters com-posed of OCUs from April and May. Relatively higherlevels of these pigments are associated with OCUsfrom September and October, suggesting a seasonalcomponent that is consistent within both phytoplank-ton and PA bacterial communities.
A recent study by Rooney-Varga et al. (2005) showeda similar association of the PA bacterial assemblage tophytoplankton community composition in the Bay ofFundy, particularly with respect to diatom abundancewithin the community. Interestingly, these researchersclassified phytoplankton by morphology and 18S rRNAgenes (Savin et al. 2004), characterized bacterial com-munities using a ~520 bp 16S rRNA gene fragment,and employed a direct gradient multivariate statisticaltest, and still detected strikingly similar patterns ofassociation between the phytoplankton and bacterialcommunities. Similarly, Pinhassi et al. (2003) foundclear differences in the relative concentrations ofprymnesiophyte and diatom marker pigments that cor-responded to measured differences in bacterial com-munity compositions in the frontal zone between theNorth and Baltic Seas; however, their study did notseparate the FL and PA communities. From these fewstudies, it seems that these associations are robustacross large geographic scales and, because ecologicalstates vary widely among the study sites, are likelyindicative of specific interactions between organismsrather than simultaneous response to state variables.
In contrast, FL bacterial community clusters showedsignificant differences in pigments that correspond
almost entirely to chlorophytes, prasinophytes, andcyanobacteria. These organisms tend to dominate inoligotrophic coastal systems that rely on remineraliza-tion through microbial processes for much of thecommunity nutrient demand.
The present study’s findings extend those of Noble etal. (2003) in comparisons of 2 southeastern salt marshestuaries minimally affected by anthropogenic activi-ties, but differing in watershed area and therefore inallochthonous nutrient and sediment loading. The factthat the estuary with the higher watershed area (ACEBasin) was characterized by relatively high contribu-tions of PA bacteria and diatoms is understandablebecause of their common associations with suspendedsediments (Millie et al. 2002). A greater dependency ofACE microbial communities with new (allochthonous)nitrogen sources is suggested by the predominantcontribution of diatom and dinoflagellate pigmentswhen normalized to chl a. An example of the positiveassociation of diatoms with nitrate is documented inthe spring bloom formation in temperate estuaries,while a close relationship between peridinin andnitrate was demonstrated in this study. One implica-tion from these findings is that the relative contributionof diatoms (and possibly some types of dinoflagellates)to phytoplankton biomass, and of PA bacterial biomassto total bacterial biomass, may correlate positively withwatershed area.
NI, the estuary with the smaller watershed and lowernutrient and sediment loading, was characterizedby greater relative contributions of FL bacteria andpigments indicative of chlorophytes, prasinophytes,and/or cyanobacteria to microbial community composi-tion. Noble et al. (2003) discussed inter-estuary differ-ences in the seasonal timing of the phytoplanktonbloom, and suggested that these differences reflected aprototypical spring phytoplankton bloom driven by al-lochthonous nutrient loading in the ACE Basin versus asummer bloom in NI. This was characterized by micro-bial loop dynamics that included an important influ-ence of microzooplankton grazing and regenerated nu-trients, and a close coupling between phytoflagellatesand bacteria (Lewitus et al. 1998). Of the potentialphytoplankton groups implicated by the pigment pat-terns, prasinophytes and cyanobacteria are most con-sistent with results from previous studies in NI (Lewituset al. 1998, 2005, Kulkarni et al. 2005), and typify phyto-plankton associated with microbial loop communities.The inference that such microbial loop communitieswould involve nutrient and energy cycling withinmicroaggregates (Caron et al. 1988) is rational for apredominant involvement of FL bacteria rather thanmacroaggregate-associated PA bacteria.
In summary, pronounced differences in bacteria andphytoplankton community structure were found in 2
143

Aquat Microb Ecol 45: 129–145, 2006
southeastern estuaries that could ultimately be attrib-uted to differences in the size of their watershed and,consequently, the relative influences of allochthonousand autochthonous regulation. Both estuaries are mini-mally affected by anthropogenic activities, and theACE Basin may therefore be considered to represent anatural salt marsh in a more advanced state of eutroph-ication than NI. In this sense, one can speculatethat the affects of urbanized development (increasedimpervious surfaces, stream channelization, non-pointsource nutrient loading etc.) on the NI ecosystem maypromote shifts in microbial community structure andfunction toward those found in the ACE Basin. Theseinclude higher primary and secondary productivity,a change from a nanoflagellate-dominated phyto-plankton assemblage to one dominated by diatoms,and a trend toward an increased importance of macro-aggregate- over microaggregate-associated trophicdynamics.
Acknowledgements. We acknowledge the financial supportof EPA through the CISNET Landscape-scale EcologicalMonitoring program. We thank P. A. Noble, R. Tymowski, andJ. Gettys for their valuable contributions to sample collectionand analysis.
LITERATURE CITED
Bidle KD, Fletcher M (1995) Comparison of free-living andparticle-associated bacterial commmunities in the Chesa-peake Bay by stable low-molecular-weight RNA analysis.Appl Environ Microbiol 61:944–952
Boon N, De Windt W, Verstraete W, Top EM (2002) Evaluationof nested PCR-DGGE (denaturing gradient gel electro-phoresis) with group-specific 16S rRNA primers for theanalysis of bacterial communities from different waste-water treatment plants. FEMS Microbiol Ecol 39:101–112
Bordalo AA, Vieira MEC (2005) Spatial variability of phyto-plankton, bacteria and viruses in the mesotidal salt wedgeDouro Estuary (Portugal). Estuar Coast Shelf Sci 63:143–154
Bouvier TC, del Giorgio PA (2002) Compositional changes infree-living bacterial communities along a salinity gradientin two temperate estuaries. Limnol Oceanogr 47:453–470
Caron DA, Goldman JC, Dennett MR (1988) Experimentaldemonstration of the roles of bacteria and bacterivorousprotozoa in plankton nutrient cycles. Hydrobiologia 159:27–40
Cho BC, Azam F (1988) Major role of bacteria in biogeochem-ical fluxes in the oceans interior. Nature 332:441–443
Christian RR, Boyer JN, Stanley DW (1991) Multiyear distrib-ution patterns of nutrients within the Neuse River Estuary,North Carolina. Mar Ecol Prog Ser 71:259–274
Dame R, Alber M, Allen D, Mallin M and 8 others (2000) Estu-aries of the south Atlantic coast of North America: theirgeographical signatures. Estuaries 23:793–819
del Giorgio PA, Bouvier TC (2002) Linking the physiologicand phylogenetic successions in free-living bacterialcommunities along an estuarine salinity gradient. LimnolOceanogr 47:471–486
Fandino LB, Riemann L, Steward GF, Long RA, Azam F (2001)Variations in bacterial community structure during adinoflagellate bloom analyzed by DGGE and 16S rDNAsequencing. Aquat Microb Ecol 23:119–130
Fernandez A, Huang SY, Seston S, Xing J, Hickey R, CriddleC, Tiedje J (1999) How stable is stable? Functionversus community composition. Appl Environ Microbiol65:3697–3704
Ferris MJ, Muyzer G, Ward DM (1996) Denaturing gradientgel electrophoresis profiles of 16S rRNA-defined popula-tions inhabiting a hot spring microbial mat community.Appl Environ Microbiol 62:340–346
Gardolinski P, Worsfold PJ, McKelvie ID (2004) Seawater in-duced release and transformation of orgganic and inorganicphosphorus from river sediments. Water Res 38:688–692
Hansen MC, Tolker-Nielsen T, Givskov M, Molin S (1998)Biased 16S rDNA PCR amplification caused by interfer-ence from DNA flanking the template region. FEMSMicrobiol Ecol 26:141–149
Higgins HW, Mackey DJ (2000) Algal class abundances, esti-mated from chlorophyll and carotenoid pigments, in thewestern Equatorial Pacific under El Niño and non-El Niñoconditions. Deep-Sea Res I 47:1461–1483
Hollibaugh JT, Wong PS, Murrell MC (2000) Similarity of par-ticle-associated and free-living bacterial communities innorthern San Francisco Bay, California. Aquat MicrobEcol 21:103–114
Kanagawa T (2003) Bias and artifacts in multitemplate poly-merase chain reactions (PCR). J Biosci Bioeng 96:317–323
Kirchman DL, Suzuki Y, Garside C, Ducklow HW (1991) Highturnover rates of dissolved organic-carbon during a springphytoplankton bloom. Nature 352:612–614
Kirchman DL, Dittel AI, Findlay SEG, Fischer D (2004)Changes in bacterial activity and community structure inresponse to dissolved organic matter in the Hudson River,New York. Aquat Microb Ecol 35:243–257
Kropf S, Heuer H, Gruning M, Smalla K (2004) Significancetest for comparing complex microbial community finger-prints using pairwise similarity measures. J MicrobiolMethods 57:1187–195
Kulkarni NR, White DL, Lewitus AJ, Tymowski RG, Yoch DC(2005) Dimethylsulfoniopropionate in a salt marsh estuary:correlation to tidal cycle and phytoplankton assemblagecomposition. Mar Ecol Prog Ser 289:13–25
Lagus A, Suomela J, Weithoff G, Heikkila K, Helminen H,Sipura J (2004) Species-specific differences in phyto-plankton responses to N and P enrichments and the N: Pratio in the Archipelago Sea, northern Baltic Sea. J Plank-ton Res 26:779–798
LaPara TM, Nakatsu CH, Pantea LM, Alleman JE (2002) Sta-bility of the bacterial communities supported by a seven-stage biological process treating pharmaceutical waste-water as revealed by PCR-DGGE. Water Res 36:638–646
Lassen MF, Bramm ME, Richardson K, Yusoff F, Shariff M(2004) Phytoplankton community composition and sizedistribution in the Langat River Estuary, Malaysia. Estuar-ies 27:716–727
Lewitus AJ, Koepfler ET, Morris JT (1998) Seasonal variationin the regulation of phytoplankton by nitrogen and graz-ing in a salt-marsh estuary. Limnol Oceanogr 43:636–646
Lewitus AJ, White DL, Tymowski RG, Geesey ME, Hymel SN,Noble PA (2005) Adapting the CHEMTAX method forassessing phytoplankton taxonomic composition in south-eastern US estuaries. Estuaries 28:160–172
Lind OT, Barcena E (2003) Response of riverine and transitionzone bacterioplankton communities to a pulsed riverinflow. Hydrobiologia 504:79–85
144

Johnson et al.: Linking bacterioplankton and phytoplankton communities
Lovell CR, Steward CC, Phillips T (1999) Activity of marinesediment bacterial communities exposed to 4-bromophe-nol, a polychaete secondary metabolite. Mar Ecol Prog Ser179:241–246
Lovell CR, Bagwell CE, Czako M, Marton L, Piceno YM,Ringelberg DB (2001) Stability of a rhizosphere microbialcommunity exposed to natural and manipulated environ-mental variability. FEMS Microbiol Ecol 38:69–76
Lueders T, Friedrich MW (2003) Evaluation of PCR amplifica-tion bias by terminal restriction fragment length polymor-phism analysis of small-subunit rRNA and mcrA genes byusing defined template mixtures of methanogenic purecultures and soil DNA extracts. Appl Environ Microbiol69:320–326
Millie DF, Fahnenstiel GL, Carrick HJ, Lohrenz SE, SchofieldOME (2002) Phytoplankton pigments in coastal LakeMichigan: distributions during the spring isothermalperiod and relation with episodic sediment resuspension.J Phycol 38:639–648
Morris J (2000) Effects of sea-level anomalies on estuarineprocess. In: Hobbie JE (ed) Estuarine science: a syntheticapproach to research and practice. Island Press, Washing-ton, DC, p 107–127
Muyzer G, Dewaal EC, Uitterlinden AG (1993) Profiling ofcomplex microbial populations by denaturing gradientgel-electrophoresis analysis of polymerase chain reaction-amplified genes-coding for 16s ribosomal-RNA. ApplEnviron Microbiol 59:695–700
Noble PA, Bidle KD, Fletcher M (1997) Natural microbialcommunity compositions compared by a back-propagat-ing neural network and cluster analysis of 5S rRNA. ApplEnviron Microbiol 63:1762–1770
Noble PA, Tymowski RG, Fletcher M, Morris JT, Lewitus AJ(2003) Contrasting patterns of phytoplankton communitypigment composition in two salt marsh estuaries insoutheastern United States. Appl Environ Microbiol 69:4129–4143
Paerl HW, Valdes LM, Pinckney JL, Piehler MF, Dyble J,Moisander PH (2003) Phytoplankton photopigments asindicators of estuarine and coastal eutrophication. Bio-science 53:953–964
Piceno YM, Lovell CR (2000) Stability in natural bacterialcommunities: I. Nutrient addition effects on rhizospherediazotroph assemblage composition. Microb Ecol 39:32–40
Pinckney JL, Richardson TL, Millie DF, Paerl HW (2001)Application of photopigment biomarkers for quantifyingmicroalgal community composition and in situ growthrates. Org Geochem 32:585–595
Pinhassi J, Winding A, Binnerup SJ, Zweifel UL, Riemann B,Hagström Å (2003) Spatial variability in bacterioplanktoncommunity composition at the Skagerrak-Kattegat Front.Mar Ecol Prog Ser 255:1–13
Pinhassi J, Sala MM, Havskum H, Peters F, Guadayol O, Mal-its A, Marrase CL (2004) Changes in bacterioplanktoncomposition under different phytoplankton regimens.Appl Environ Microbiol 70:6753–6766
Riemann L, Winding A (2001) Community dynamics of free-living and particle-associated bacterial assemblages dur-ing a freshwater phytoplankton bloom. Microb Ecol 42:274–285
Rodriguez F, Varela M, Zapata M (2002) Phytoplanktonassemblages in the Gerlache and Bransfield Straits(Antarctic Peninsula) determined by light microscopy andCHEMTAX analysis of HPLC pigment data. Deep-Sea ResII 49:723–747
Rooney-Varga JN, Giewat MW, Savin MC, Sood S, LeGresleyM, Martin JL (2005) Links between phytoplankton andbacterial community dynamics in a coastal marine envi-ronment. Microb Ecol 49:163–175
Savin MC, Martin JL, LeGresley M, Giewat M, Rooney-VargaJ (2004) Plankton diversity in the Bay of Fundy as mea-sured by morphological and molecular methods. MicrobEcol 48:51–65
Schultz GE, Ducklow H (2000) Changes in bacterioplanktonmetabolic capabilities along a salinity gradient in theYork River estuary, Virginia, USA. Aquat Microb Ecol22:163–174
Seitzinger SP, Sanders RW (1999) Atmospheric inputs of dis-solved organic nitrogen stimulate estuarine bacteria andphytoplankton. Limnol Oceanogr 44:721–730
Sekiguchi H, Koshikawa H, Hiroki M, Murakami S and 5others (2002) Bacterial distribution and phylogeneticdiversity in the Changjiang estuary before the construc-tion of the Three Gorges Dam. Microb Ecol 43:82–91
Selje N, Simon M (2003) Composition and dynamics of parti-cle-associated and free-living bacterial communities in theWeser Estuary, Germany. Aquat Microb Ecol 30:221–237
Smith EM, Kemp WM (2003) Planktonic and bacterial respira-tion along an estuarine gradient: responses to carbon andnutrient enrichment. Aquat Microb Ecol 30:251–261
Stephen JR, Kowalchuk GA, Bruns MAV, McCaig AE, PhillipsCJ, Embley TM, Prosser JI (1998) Analysis of beta-subgroup proteobacterial ammonia oxidizer populationsin soil by denaturing gradient gel electrophoresis analysisand hierarchical phylogenetic probing. Appl EnvironMicrobiol 64:2958–2965
Trimmer M, Purdy KJ, Nedwell DB (1997) Process measure-ment and phylogenetic analysis of the sulfate reducingbacterial communities of two contrasting benthic sites inthe upper estuary of the Great Ouse, Norfolk, UK. FEMSMicrobiol Ecol 24:333–342
Van Heukelem L, Thomas CS (20011) Computer-assistedhigh-performance liquid chromatography method devel-opment with applications to the isolation and analysis ofphytoplankton pigments. J Chromatogr A 910:31–49
Verity PG (2002) A decade of change in the Skidaway Riverestuary. I. Hydrography and nutrients. Estuaries 25:944–960
Wetz MS, Lewitus AJ, Koepfler ET, Hayes KC (2002) Impactof the eastern oyster Crassostrea virginica on microbialcommunity structure in a salt marsh estuary. AquatMicrob Ecol 28:87–97
145
Editorial responsibility: William Li,Dartmouth, Nova Scotia, Canada
Submitted: February 9, 2006; Accepted: September 5, 2006Proofs received from author(s): November 15, 2006