linkages between fisheries, poverty and growth: india case study
Upload: water-food-and-livelihoods-in-river-basins-basin-focal-projects
Post on 27-Jan-2017
7.641 views
TRANSCRIPT

APPENDIX G
India Case Study

Linkages between Fisheries, Povertyand Growth
Case study of India
A report prepared for the
Department for International Development (DFID)Project: ‘The Role of Fisheries in Poverty Alleviationand Growth: Past, Present and Future’
DFID/PASS Contract: AG0213

G-1
STUDY TEAM
Venkatesh SalagramaICM (Integrated Coastal Management)64-16-3A, Pratap Nagar, Kakinada 533 004TELE: +91 884 236 4851FAX: +91 884 235 4932EMAIL: [email protected]; [email protected]

G-2
TABLE OF CONTENTS
Executive Summary........................................................................................................................ 41. BACKGROUND ................................................................................................................ 7
Population characteristics ....................................................................................................... 7Economic structure ................................................................................................................. 8Quality of life indicators ......................................................................................................... 9Balance of payments ............................................................................................................. 10
2. POVERTY........................................................................................................................ 10Poverty Assessment Methodology in India .......................................................................... 10Estimates of Poverty in the country...................................................................................... 11Poverty as an outcome of poor entitlements ......................................................................... 12Economic sectors/regions most affected by poverty ............................................................ 12Studies on poverty................................................................................................................. 14
3. ECONOMIC GROWTH................................................................................................... 16GDP Per Capita..................................................................................................................... 16Economic growth and poverty.............................................................................................. 17Main contributors to economic growth................................................................................. 17Contribution of fisheries to national economy...................................................................... 17Conclusion ............................................................................................................................ 22
4. FISHERIES DEVELOPMENT AND MANAGEMENT................................................. 23Fish production ..................................................................................................................... 23Fisheries exploitation or activity-related benefits................................................................. 25Employment in different production-related activities ......................................................... 26Average earnings in fisheries sector ..................................................................................... 26Other activities undertaken in relation to fishing.................................................................. 29Contribution of fish to food-and livelihood-security ............................................................ 29Fisheries Management in India............................................................................................. 30Costs and Revenues of Fisheries Management..................................................................... 34Conclusion ............................................................................................................................ 34
5. POLICY MAKING........................................................................................................... 35Perceptions of poverty at the macroeconomic level ............................................................. 35Organisations involved in poverty reduction in the country................................................. 36Main instruments used in Poverty Alleviation Programmes (PAPs).................................... 38Evaluations of Policies and Instruments ............................................................................... 38Factors contributing to poor performance of poverty alleviation programmes .................... 39Fisheries policymaking in India............................................................................................ 41Linkages between fish resources, economic growth and poverty reduction ........................ 42Role played by NGOs, fishers’ organisations and civil society in general........................... 44Institutional factors affecting the participation of the poor ................................................. 45Important areas for policy development in the future (Opportunities) ................................. 46Factors likely to impact on the nature and rate of policy development (Threats) ................ 48
6. References......................................................................................................................... 497. Annexures ......................................................................................................................... 56

G-3
ABBREVIATIONS
AAI Aquaculture Authority of IndiaAP Andhra PradeshBOBP Bay of Bengal ProgrammeCDS Centre for Development Studies (Trivandrum)CESS Centre for Economic and Social StudiesCMFRI Central Marine Fisheries Research InstituteDAHD Department of Animal Husbandry and Dairying (GOI)DFID Department for International Development (Government of United
Kingdom)DOF Department of FisheriesDRDA District Rural Development AgencyDWFN Distant Water Fishing NationEEZ Exclusive Economic ZoneFAO Food and Agriculture Organization of the United NationsGDP Gross Domestic ProductGOI Government of IndiaHCR Headcount RatioHDI Human Development IndexICM Integrated Coastal ManagementICSF International Collective in Support of FishworkersIRDP Integrated Rural Development ProgrammeMFRA Marine Fishing Regulation ActMPEDA Marine Products Export Development AuthorityNABARD National Bank for Agriculture and Rural DevelopmentNGO Non-governmental organisationNIRD National Institute of Rural DevelopmentNSS National Sample SurveyNSSO National Sample Survey OrganisationPAP Poverty Alleviation ProgrammePCO Programme for Community Organisation (NGO based in Kerala)PDS Public Distribution SchemeSIFAR Support Unit for Fisheries and Aquatic ResearchSIFFS South Indian Federation of Fishermen SocietiesSPS Sanitary and Phyto-sanitaryTCM Technical Cooperation MissionUNDP United Nations Development Programme

G-4
Executive Summary
This case study for India is prepared as part of the DFID/PASS Project ‘The Role ofFisheries in Poverty Alleviation and Growth: Past, Present and Future’. The objectiveof the study is to conceptualise the interface between poverty reduction and fisheriesdevelopment in India. The study was conducted during February-March 2005 and afirst draft of the report prepared in March has been revised in the light of suggestionsmade by the project leaders in April 2005.
Since 1950s, the emphasis of fisheries development in India has focused onincreasing production through more efficient harvesting technologies and onincreasing foreign exchange earnings for the country and the support for livelihoodswas directed at addressing these two objectives. This growth centred developmenthas brought about radical changes in the way fish are harvested and traded, whichhad implications (both positive and negative) for all stakeholders in the sector. Anevaluation of these changes indicates that economic growth has not beenaccompanied by progressive distributional changes for equitable distribution of thebenefits or addressed the poverty and livelihood concerns adequately. Sometraditional occupations have been marginalized; although new livelihoodopportunities emerged, it is doubtful that those who lost in the first case areadequately compensated by the second. The need for investing large sums in newharvesting technologies forced the poorer stakeholders out of the mainstream, whilefor those who could make the change, increased cost of operations meantintensification of fishing effort, overcapacity, indebtedness and overall uncertainty.The result has been that economic growth in fisheries is accompanied by growingunemployment and by the livelihoods of the poor perpetually facing threats fromnew players and factors beyond their control.
On the other hand, much evidence exists to show that, given a responsiblemanagement regime and a more equal distribution of benefits, fisheries sector cancontribute significantly to the wellbeing of a large proportion of the poor in thecoastal areas. In spite of everything, a comparison of wages earned in differentsectors indicates that fishing is still among the better livelihood options, although itslong-term sustainability (as a means of livelihood for a generally poor population) isuncertain because real incomes have been coming down consistently over the lastdecade. The fact that the sector has a large number of stakeholder groups other thanfishers themselves is largely ignored in the debate on fisheries and livelihoods, withthe result that a major proportion of the benefits from the sector remain un-quantifiedand hence, unsupported. The few studies that deal with fisheries are concerned onlywith small-scale or ‘artisanal’ sector, and there exists a big gap in terms ofunderstanding poverty and livelihoods in the non-artisanal categories likemechanised fishing and aquaculture, not to speak of ‘ancillary’ activities.
In the 1980s, the evidence of depletion of fish catches in the near-shore waters(which are now widely agreed to be under severe stress) surfaced in a telling manner.The government’s emphasis on increasing production and productivity from thewater-bodies (which were recognised as ‘open access’ in spite of the existence ofstrong community-based ‘common property’ arrangements in many areas) did nottake adequate account of the implications of unhindered exploitation of the resourceson their continued wellbeing or to extract the surplus for streamlining the systems to

G-5
effectively address the needs related to trade, sustainability or livelihoods of thepoorer stakeholders (as done in many traditional management systems). This meantthat resource management became more a response to a storm already brewing in thesector rather than a precautionary measure, giving the policy-makers very limitedlatitude for manoeuvre and forcing them to resort to knee-jerk responses. The fishers,who enjoyed an unlimited access to the resources, not only resent complying withany new regulations, but also are averse to paying the costs of management (if asked,which has yet to happen).
The government did put some management measures in place to control theexploitation of the resources, covering a range of instruments, but they have not beenvery successful. That fisheries is a state subject and, even at the federal level, islooked after by many ministries and departments (with poor inter-institutionallinkages and information flows) has meant that resource management continues toremain nobody’s baby. That most policy-making organisations are torn between thethree objectives of livelihood support, macro-economic growth and resourceconservation gives rise to policies that are often contradictory or ad hoc. Thus, inspite of widespread realisation that the resources are being overfished, there are norestrictions on entry into fisheries and new policies actually encourage increasingfishing effort in offshore waters in the name of ‘fisheries management’! The role ofNGOs, fishworker organisations and other civil society organisations in policy-making remains low, despite the (largely symbolic) efforts to increase theirinvolvement.
Consequently, the few acts and policies that speak of the need for management do soonly as lip service and remain largely ineffectual. These have also tended to befocused on technical/resource-oriented measures rather than on people or economicrationale. The sector-specific nature of these policies, insufficient or inappropriateinstruments for implementing them, top-down approaches, lack of participation byall stakeholders either in policy making or in implementation and, most significantly,lack of political will to effect a really meaningful change come in the way ofimplementing them effectively.
There is an urgent need for improving the current knowledge about the fishers andtheir livelihoods and placing them more centrally in the overall context. There is alsoa need to develop appropriate analytical frameworks to understand the links betweennatural resource management, economic growth and livelihood support. Anoverarching institutional framework for bridging the gaps between these three broadareas at the macro- and micro-levels will also need to be developed.
In the context of the multi-species nature of fisheries in India, the best option formanagement lies in effort-reducing measures, such as phasing out the excessivefishing fleet, reducing subsidies for enhancing fishing intensity or efficiency andsupporting the fishers to move into alternative income-generating activities. There isa need to explore and develop a range of instruments for effective fisheriesmanagement because management needs to be location-specific and involve localcommunities in the planning and implementation. Lack of political will,marginalisation of fisheries in the national priorities, the advanced nature of some ofthe problems ailing the sector and the context of legal pluralism that prevails in thecoastal areas are some of the issues that need consideration while formulating a new
G-6
– and radically different – agenda for effective fisheries management as well as forsustainable livelihood support.

G-7
INVESTIGATING THE LINKAGES BETWEEN FISHERIES, POVERTYAND GROWTH: A Case Study for India
1. BACKGROUND
With a land area of 3.3 million km², India is the seventh largest country in the worldand is referred to as a sub-continent in its own right. The Indian Union is federal instructure and consists of 28 states and seven union territories. The constitutiondistributes legislative power between Parliament at the national level and statelegislatures at the state level and vests the residual powers in Parliament. Sectors likeagriculture and fisheries are State Subjects, and the Union Government’s role inthese areas, though significant, is not often direct.
World Bank (2004a: 1) notes that, since the 1970s, India’s economic growth rate hasrisen (averaging 6 percent in the last decade), poverty has nearly halved (from 55percent in 1973-74 to 26 percent in 1999-2000), and social indicators have shownsigns of improvements (the Human Development Index – HDI – went up from 0.411in 1975 to 0.595 in 2002; Annexure 1). The country has achieved self-sufficiency inagricultural production and also stands tenth among the industrialised countries in theworld (GOI, 2005:1).
While these improvements illustrate achievements in a challenging environment, it isacknowledged that India's social indicators remain weak by most measures of humandevelopment, ranking it 127 in the world, in HDI terms (UNDP, 2004). The NationalHuman Development Report gives evidence of the government’s resolve to tacklepoverty in a holistic and integrated manner. The Millennium Development Goals forIndia (Annexure 2) include: halving the proportion of people who suffer fromhunger; two-thirds reduction in infant mortality rates; universal primary schoolingand complete elimination of gender disparities in schooling opportunities by 2015.The broad priorities for national policy as laid down in the Tenth 5-Year Plan (2002-7) focus on poverty reduction and employment generation, universal access to basicservices (literacy, water and health), population control, and addressing gender andenvironmental imbalances (GOI, 2002a: 6). Fisheries is considered one of theimportant sectors contributing to economic growth, livelihood support and povertyalleviation in the country.
Population characteristics
India has the (rather dubious) distinction of being the second most populous countryin the world after China with a total population of 1,028 million (16.7 percent of theworld population) according to the 2001 Census with a population density of 324 persq km (GOI, 2005: 6-7). The population has grown consistently since 1901, thedecadal growth rate climbing from 5.75 percent in the census of 1901 to nearly 25percent in the census of 1971, 1981 and 1991, slowing down to 21.54 percent in20011 (GOI, 2005:8). The sex ratio (number of females per one thousand males)showed a consistently declining trend from 972 in 1901 to 927 in 1991, and
1 It is still impressive because, in real terms, it actually added the highest number ever of people to thecountry’s population (180 million - only slightly less than the total population of Australia!).

G-8
marginally improved to 933 in 2001 (GOI 2005: 11). In the Census of 2001, the mennumbered 532.1 million while the women totalled 496.4 million.
As infant mortalities declined and health infrastructure improved, India now has thesecond largest number of elderly persons after China. In 1981, there were about 43million elderly people in the country (comprising 6.5 per cent of the population),growing to 57 million (or 6.7 per cent) by 1991. The number of widows among theelderly is about three and a half times more than the number of widowers (GOI,2002b: 92). The growth in population was accompanied by disintegration of socialnetworks such as joint family system and the 1990s saw a spurt in the problems facedby the elderly people (ICM 2003).
Urban population
Some 742 million people or 72.25 percent of the population reside in rural areas(NIRD 2003: 4). However, rapid urbanisation has been a characterising feature ofdevelopment in the country since 1950s and, between 1971 and 2001, urbanpopulation grew over 2 ½ times from 110 million to 286 million, rising from 20percent to 28 percent of the total population (GOI, 2005: 15-16). Mumbai, Kolkata,New Delhi, Chennai, Bangalore and Hyderabad are the major cities in the country,but there are at least 20 more cities with a population of over 1 million.
Coastal population
Nine states and 4 union territories in the country have coastal boundaries and some360 million people (about a third of the population) live in coastal areas (Mathew,2003). There is little evidence of an increased movement of people from inland to thecoast, except where urban centres are located in the coastal areas. Fishing hastraditionally been a caste-bound operation and carried the stigma of being a risky andlowly (and low-paying) activity, discouraging entry of outsiders except into certainsub-sectors like mechanised fishing and aquaculture (mainly as asset owners). Theperiod between 1985-95 saw some new opportunities emerging in the sector,facilitating the entry of people of non-fishing orientation into it (mainly intoancillary, shore-based, activities), but the opportunities quickly fizzled out. In fact,since 1980s, in some coastal states like Andhra Pradesh and Orissa, there has been agrowing trend of inland migration by the coastal fishers in search of work in fishingand other wage-paying employment on seasonal as well as long-term (or permanent)basis (Salagrama, 2004c). Long distance migrations from the east coast to the westcoast have also become widely prevalent.
Economic structure
Indian economy followed a mixed economy model, which emphasised the idea,propounded in the Second Five Year Plan, that “the basic criterion for determininglines of advance must not be private profit, but social gain” (GOI, 1956). Apart froma few cosmetic gestures, which created an illusion of advancing towards socialism,the emphasis on socialism did not improve the socio-economic relations enough towarrant a celebration of the development path pursued over the past fifty years(Misra and Puri, 1999:73). Thus, India remains an underdeveloped (or ‘developing’)

G-9
economy, characterised by low per capita income ($ 230 in 2003), which is one ofthe lowest in the world (Datt and Sundharam, 2005:5). Like other under-developedeconomies, India’s national economy also is based on primary production.Agriculture accounts for a quarter of India’s GDP and 70 percent of the population isdependent on it for a livelihood (GOI, 2005: 60). The service sector grew rapidly inthe last two decades and now accounts for more than half of India’s economy.Industrial sector accounts for the remaining quarter of the GDP, and has remainedstable since 1982 (Hosch and Flewweling, 2003). The economy is characterised bychronic unemployment and underemployment and low rate of capital formation.
There are sharp inequalities in the distribution of wealth and assets, with the top 10percent owning nearly half the assets in rural areas while the top 14 percent own 66percent of the assets in the urban areas (Datt and Sundharam, 2005:7). In rural areas,51 percent of the households at the bottom owned just 10 percent of the total assets,while in urban areas, over half the population owned barely 5.3 percent of the totalassets! There are indications that the inequalities of income, wealth and assetsbetween the wealthy and the poor are increasing (PBH, 2003).
Quality of life indicators
Public health expenditure as a percentage of GDP is 0.9 percent in 2001, but theprivate health expenditure is more than four times as much at 4.2 percent (UNDP,2004). Life expectancy at birth has gone up to 63.7 years from 50 years in 1970-75.Infant mortality rate halved between 1970 and 2002 from 127 to 67. Publicexpenditure on education as percentage of GDP is 4.1 in 1999-2000, slightly higherthan it was in 1990 (3.9 percent). The literacy rate in the country has shownremarkable improvement over the years and, according to the Census of 2001, stoodat 65 percent, up from 44 in 1981 and a mere 18 percent in 1951. Female literacy,which stood at an abysmal 9 percent in 1951, increased to 54 percent by 2001 (GOI,2005:14).Population with sustainable access to improved sanitation rose from 16 percent in1990 to 28 percent in 2000 and that for sustainable access to improved water sourcewent from 68 to 84 percent during the same period. Wide variations exist in terms ofaccess to the basic services between different states as well as between urban andrural areas.
Unemployment
As GOI (2002b: 36-37) notes, nearly 90 per cent of the employment in the country isin the unorganised or informal sector and the data on the magnitude and compositionof employment are not entirely adequate or even reliable. Data gathered throughperiodical surveys indicate that, during the period 1983 to 1999-2000, the percentageof persons in the labour force declined from 66.5 per cent in 1983 to 61.8 percent in1999-2000. The decline in the employment growth for females has been significantlyhigher than that for males. As a result, the incidence of unemployment has increasedat the national level from 2 per cent in 1983 to 2.3 per cent in 1999-2000 (GOI,2002b: 36-37). Planning Commission (GOI 2002a: 3) notes that the compositeincidence of unemployment and underemployment stands at 9 percent of the labourforce and at almost 13 percent for the youth. It suggests the steadily worsening land-man ratio and the continued dependence of a high proportion of population on

G-10
agriculture as the principal causes of growing unemployment and underemploymentproblems in the rural areas and predicts that the problem is likely to worsen over theyears unless measures are taken to either increase the intensity of land use throughincreased irrigation and watershed development or to shift a significant proportion ofthe labour force out of agriculture to non-agricultural activities, or both.
Balance of payments
Following the liberalisation of the economy, the balance of payments situationimproved by 2002 and the current account deficit narrowed down to an average of0.8 percent of gross domestic product (GDP) and foreign exchange reservesincreased from less than US$ 6 billion in 1990-91 to US$ 54 billion in 2002 (GOI,2002a: 103), which is considered an indication of the inherent and current strength ofthe economy, although scholars like Jayati Ghosh dispute this contention (PBH,2002: 33-36).
2. POVERTY
Poverty Assessment Methodology in India
As Deaton and Kozel (2005) note, Indian policy making and politics are dominatedby discussions of poverty, and measures of poverty rightly attract a great deal ofattention and debate. The Planning Commission of the Government of India (GOI)has been estimating the Head Count Ratio of the poor separately for rural and urbanareas for over three decades. It currently uses minimum consumption expenditure,anchored in an average (food) energy adequacy norm of 2400 and 2100 kilo caloriesper capita per day to define State specific poverty lines, separately for rural andurban areas. These poverty lines are then applied on the National Sample SurveyOrganisation’s (NSSO) household consumer expenditure distributions to estimate theproportion and number of poor at State level. The NSS is a socio-economic enquirycarried out in the form of successive rounds. The period of enquiry has been varyingacross rounds and has varied from a few weeks to a few months. During theserounds, the NSS collects information on various socio-economic aspects ofhouseholds, household consumption being one of the most important. The data arecollected on the basis of interviews of households, which are selected followingsimple random sampling, which is stratified and has two stages. The first stage unitsare villages in the rural sector and urban blocks in the urban sector. The householdsconstitute the second stage units in both the sectors. The poverty estimates publishedby the Planning Commission count the number of people who are living inhouseholds whose monthly per capita total expenditure is less than a poverty line thatis specific to the state and sector (urban or rural) in which they live (Deaton andKozel, 2005:2).
Conceptually consumer expenditure as a measure of standard of living has theadvantage that it is amenable to welfare interpretations. But when it comes toempirical verifications, it bristles with problems. NIRD (1998) provides acomprehensive critique on the NSS and the other poverty indicator databases appliedto assess poverty in the country. It notes that NSS data do not take into account otherdimensions of welfare like health, life expectancy, literacy, access to safe drinkingwater, public goods or common property resources. This explains why factors other

G-11
than hunger got low priority in policy formulations and plan achievements withrespect to primary education, primary health etc., have remained quite modest.
Recognising it was not sufficient to understand poverty only in terms of lack ofadequate income, but as a state of deprivation spanning the social, economic andpolitical context of the people that prevents their effective participation as equals inthe development process (GOI, 2002b:3), many attempts have been made to developalternative indicators of poverty. In the 1980s, the Working Group set up by theGovernment of India to evolve an acceptable methodology for identifying the poorthrough criteria alternative to per capita income/calorie requirement, concluded thatthere is no feasible alternative to the identification of the poor except by annualincome and expenditure, while accepting that the estimates of per capitaconsumption itself have so many limitations. Similarly, NIRD (1998:110-115)attempted to evolve a set of non-monetary indicators, which are simple and easilyverifiable for identification of the poor, in the final analysis, could not replace theincome criterion successfully, since the percentage of misclassification is as high as40. As Shanthi suggests (in NIRD 1998:83), different definitions identify differentpeople with very different characteristics as being poor.
In preparing the Human Development Report for the country, the PlanningCommission (GOI, 2002b: 34) made an attempt to put together indicators oneconomic attainments that reflect an individual’s personal means as well as outcomemeasures on the availability and access to basic amenities that capture the publicdevelopment effort at improving the economic well-being of people. Thedeprivational aspect of economic attainments was presented through Head-Countestimates of incidence of poverty anchored in a basic food adequacy norm. It is notcertain how the results compared with the traditional HCR-based poverty measures.
Estimates of Poverty in the country
Datt & Sundharam (2005:362-370) provide an overview of poverty estimates in thecountry since 1960s. The Planning Commission (2002a & 2002b), Sundaram andTendulkar (2003), Parikh and Radhakrishnan (2002), NIRD (1999a & b); the WorldBank (2004) and several others have reviewed the recent poverty situation in thecountry and concluded that there has indeed been a steady decline in the proportionof the people below the poverty line. The depth and severity of poverty has reducedfaster than the incidence, and over time there has been a trend towards a greaterdegree of clustering of the poor around the poverty line leading to a situation whereeconomic growth is likely to have a considerably larger impact on poverty reduction.Official estimates (based on Head Count Ratio) show a decline in the poverty ratefrom 55 percent in 1973-74 to 262 in 1999-2000, which, in numbers, still means over260 million people being poor in the country, down by only 60 million from the1973-74 estimate (NIRD 2003: 92) thanks to a parallel – and more rapid – increase inpopulation. The decline has not also been uniform either across States or across ruraland urban areas. The proportion of poor in the rural areas declined from 45.65percent in 1983 to 27.09 percent in 1999-2000, while that in urban areas declined 2 Patnaik (in PBH 2002:3) indicates that this figure was erroneous and was based on ‘contaminated’data and states that the Planning Commission itself accepts it as such. According to more reliablefigures that he cites, the rural poverty is determined to be 36.35 percent for 1999-2000 while the urbanpoverty stood at 28.76 percent.
G-12
from 40.79 percent to 23.62 percent during this period, which – in real terms –actually means an increase in the total number of urban poor by 7 million!
The Human Development Index (HDI) has improved significantly between 1980 and2001. Significantly, inequalities across states on the HDI are less than the incomeinequality as reflected in the per capita State Domestic Product (GOI, 2002b: 3-4).
Poverty as an outcome of poor entitlements
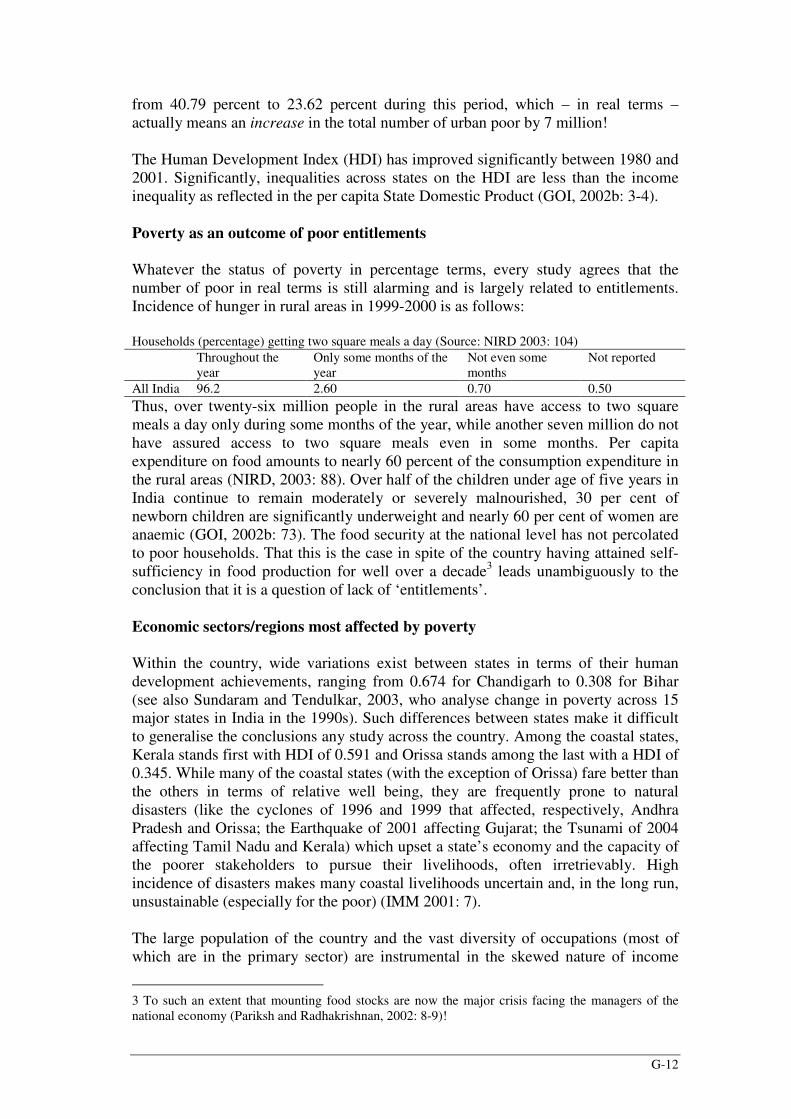
Whatever the status of poverty in percentage terms, every study agrees that thenumber of poor in real terms is still alarming and is largely related to entitlements.Incidence of hunger in rural areas in 1999-2000 is as follows:
Households (percentage) getting two square meals a day (Source: NIRD 2003: 104)Throughout theyear
Only some months of theyear
Not even somemonths
Not reported
All India 96.2 2.60 0.70 0.50Thus, over twenty-six million people in the rural areas have access to two squaremeals a day only during some months of the year, while another seven million do nothave assured access to two square meals even in some months. Per capitaexpenditure on food amounts to nearly 60 percent of the consumption expenditure inthe rural areas (NIRD, 2003: 88). Over half of the children under age of five years inIndia continue to remain moderately or severely malnourished, 30 per cent ofnewborn children are significantly underweight and nearly 60 per cent of women areanaemic (GOI, 2002b: 73). The food security at the national level has not percolatedto poor households. That this is the case in spite of the country having attained self-sufficiency in food production for well over a decade3 leads unambiguously to theconclusion that it is a question of lack of ‘entitlements’.
Economic sectors/regions most affected by poverty
Within the country, wide variations exist between states in terms of their humandevelopment achievements, ranging from 0.674 for Chandigarh to 0.308 for Bihar(see also Sundaram and Tendulkar, 2003, who analyse change in poverty across 15major states in India in the 1990s). Such differences between states make it difficultto generalise the conclusions any study across the country. Among the coastal states,Kerala stands first with HDI of 0.591 and Orissa stands among the last with a HDI of0.345. While many of the coastal states (with the exception of Orissa) fare better thanthe others in terms of relative well being, they are frequently prone to naturaldisasters (like the cyclones of 1996 and 1999 that affected, respectively, AndhraPradesh and Orissa; the Earthquake of 2001 affecting Gujarat; the Tsunami of 2004affecting Tamil Nadu and Kerala) which upset a state’s economy and the capacity ofthe poorer stakeholders to pursue their livelihoods, often irretrievably. Highincidence of disasters makes many coastal livelihoods uncertain and, in the long run,unsustainable (especially for the poor) (IMM 2001: 7).
The large population of the country and the vast diversity of occupations (most ofwhich are in the primary sector) are instrumental in the skewed nature of income
3 To such an extent that mounting food stocks are now the major crisis facing the managers of thenational economy (Pariksh and Radhakrishnan, 2002: 8-9)!
G-13
distribution and high incidence of poverty. Deprivation also stems from, and/or isexacerbated by, social inequality arising from systemic processes like caste, age,religion, gender and geographic origin, which determine the access to, andavailability of, resources to a household and vary from place to place and from timeto time (Salagrama, 2003a).
The livelihoods of the poor are characterised by their dependence upon commonproperty or open access resources. While this is obviously true in case of fishingcommunities, there is much evidence to show that other categories of people likeagricultural labourers too depend on CPRs, but the dependence is often maskedbecause of its frequently non-monetised nature. Any changes in terms of access tothese resources – either curtailing the poor’s entry or enabling that of the moreaffluent sections – can have serious consequences for the livelihoods of the poor asthe development of fisheries sector in India demonstrates (Salagrama, 2003a).
The planners assumed that economic growth, supplemented by policies ofprogressive taxation and public expenditure would lead to a rise in the level of livingof the poor. Production-oriented approach without altering the mode of productioncould not but result in the appropriation of the gains of development by the owners ofinstruments of production. Using the NSS data, Minhas, Bardhan, Dandekar andRath and a few others have attempted to identify particular groups of poor across thecountry (Misra & Puri, 1999: 237) and decided that, in all cases, it was the ownershipof land (in the case of agricultural sector) that determined the wealth status of ahousehold. In the fishing sector, which depends on open access (or commonproperty) arrangements to the natural resources, it is not so much the availability ofthe resource in the open, as the means of access to the resource and the ability toextract it efficiently that is important, which are both increasingly dependent uponthe fishers’ capacity to invest in efficient fishing systems. Thus, poverty in fishingcommunities is determined by the ownership of production tools (boat, nets etc.)(ICM 2003a). Obviously, those who cannot afford to invest in productive assets andhence work on others’ boats find themselves having little say in fishing operations orsharing patterns. Datt and Sundharam (2005) conclude that the philosophy ofautomatic transmission of the benefits arising from an increase in production to thebulk of the small farmers, landless labourers or factory workers without transferringproperty or tenurial rights either to the State or the peasantry was destined to failure.
However, developments in the 1990s indicate that owning land or production tools isnot a sufficient condition for a sustainable livelihood. It becomes one only when theavailability of, and the demand for, the resource – fish, in the case of fishingcommunities – remain stable and consistent. In other words, the health of the naturalresources and the vibrancy of markets became the prerequisites for sustainablelivelihoods. The 1990s saw agriculture, the prime motor of the national economy andthe most important source of livelihoods in the country, slow down. A recent studyby NIRD (2004) notes that, from the middle of 1990s, there has been an all roundcrises in agriculture owing to increasing cost of production, falling output prices,inadequate markets and, on top of all these, the liberal policies of importingagricultural products in India. Agricultural income grew at a slower pace in the1990s than that in the 1980s and output decelerated even more (Parikh andRadhakrishnan, 2003:8). Fisheries too had a similar experience through the 1990s, asproduction reached a plateau and fish trade fluctuated wildly. These trends have put

G-14
the producers under severe stress and have a negative impact on employmentpotential and wages in the primary sector, both of which are stagnating.
Consequently, large-scale influx of rural migrants – including agricultural labourersas well as small landholders – into cities in search of work gathered momentum inthe 1990s (see Deshingkar & Start, 2003). A more serious consequence of the failureof agriculture as a sustainable means of livelihood for the people has been the drasticincrease in the number of suicides in the farming community (NIRD, 2004). But,while suicides have managed to attract some attention, the issues of generaldeprivation and poverty as well as increasing vulnerability and marginalisation of thepoor in agriculture and allied sectors like fisheries (Salagrama, 2004c) havegenerated less interest and the policy responses to the crises have remained patchy atbest.
As both production and trade fluctuated in agriculture and fisheries in the 1990s, theownership of land or production tools no longer allows the producers to take theirlivelihood for granted and even becomes a constraint in the way of diversifying ormigrating out of the sector. As many participatory wealth-ranking exercises in theeastern coastal states of India show, the owners of small landholdings and boats areroutinely ranked as being more vulnerable than the asset-less wage labourers and lesscapable of making the shift to another activity, and the asset-less workers are thusconsidered better off than the owners!
Studies on poverty
There are too many studies on poverty in India (see Deaton and Kozel, 2005 for adetailed review). A search on the WWW yields a mass of information from a widerange of sources (government, private sector and NGOs, international aid agencies),presenting different perspectives (national, regional and sub-regional andcommunity-level; general and specific project oriented etc.) and, not infrequently,different agendas. It is impossible to give even a flavour of the information availableon the subject, which is not surprising considering the size of the Indian sub-continent and the severity of the problem (not to speak of the fact that the compilerof this study is not trained in economics). Sources of information provided at the endof this report give some useful links on Indian poverty.
Apart from government sources like the Planning Commission and the NationalInstitute of Rural Development, several NGOs, like the Centre for Economic andSocial Studies (CESS), carry out studies to assess the performance of povertyalleviation programmes. The World Bank, UNDP and DFID and the manyprogrammes and projects that they support, bring out many publications – policybriefs, working papers, and reports – detailing changes in poverty generally as wellas from the perspective of specific projects undertaken with their assistance.
In terms of studies on poverty, the fisheries sector has attracted relatively lessattention than its counterparts like agriculture and forestry. It is generally assumedthat the fishing communities are poor as a rule and few attempts have been made todistinguish the poor from (and within) the artisanal fishers. Most ‘socio-economic’studies are largely confined to assessing the viability of specific technologies orprojects from a technical, economic and (less frequently) social perspective, than to

G-15
understand or explore poverty in the fishing communities. Many NGOs may have abetter understanding on the subject, but this is confined to a few villages and isseldom compiled or analysed for various reasons. There are also the practicaldifficulties of gathering and disseminating information widely in a country the sizeof India and the condition persists even after the arrival of the Worldwide Web onthe scene.
There are some exceptions to the general trend. The FAO’s Bay of BengalProgramme (BOBP) documented a wealth of information on the small-scale fishersin 1980s and 1990s. International Collective in Support of Fishworkers (ICSF)regularly brings out a number of publications focusing on small-scale fishworkers, animportant strand of its work being to explore the gender dimension in fisheries. Onthe west coast, the Programme for Community Organisation (PCO), the South IndianFederation of Fishermen Societies (SIFFS) and the Centre for Development Studies(CDS) documented the life and livelihoods of the small-scale fishing communities inKerala. Many research projects commissioned by the DFID from mid-1990s focusedon poverty in the fishing communities and filled some important gaps, althoughmuch work still needs to be done. FAO-SIFAR supported a study on poverty, foodinsecurity and vulnerability in the coastal fishing communities of Orissa state in 2003(ICM, 2003a), but it has remained unpublished.
A point to note is that most of these studies deal only with the small-scale or‘artisanal’ sector, and there exists a big gap in terms of understanding poverty andlivelihoods in the non-artisanal categories like mechanised fishing and aquaculture,not to speak of ‘ancillary’ activities. As a result, as one study (Vivekanandan et al,1996) noted in the context of Andhra Pradesh, policy making in India probably haslittle basis in a real understanding of the actual issues of concern to the fishersthemselves.
While there is no denying the clear need to include all livelihood groups in fisheries(artisanal and non-artisanal; capture and culture; marine and inland; men andwomen) in the poverty and development debate in India, recent experiences forceone to conclude that the probability of this need taking a concrete form remainsbleak. As evidence, one can show the massive post-tsunami rehabilitationprogrammes undertaken by government and NGOs in Tamil Nadu, where a vastmajority of the ‘livelihood programmes’ are more or less confined to providing boatsand nets alone, ignoring concerns and warnings about the possible impacts of suchindiscriminate proliferation of fishing capacity on the resources on the one hand andon the social equity and equilibrium aspects on the other. The widely accepted factthat several fishing related livelihoods had been facing serious sustainabilityproblems prior to the tsunami have been conveniently overlooked in theprogrammes4. This line of thinking takes ‘fisheries livelihoods’ as being synonymouswith fishing operations5 to the exclusion of other activities and players, and this
4 Another casualty in the rehabilitation programme appears to be the Coastal Regulation Zone Act, acontentious piece of legislation at the best of times, but now a veritable headache for manyrehabilitation efforts.5 The emphasis is mainly on providing boats to the ‘artisanal’ sector in the (mistaken) belief that theboats in the artisanal sector cannot contribute to resource over-exploitation and also that providing aboat to every fisherman is akin to providing a piece of land to every agricultural worker, i.e., a meansof improving equity. Such social engineering experiments in a sector that is not at all well understood

G-16
lopsided understanding leads to major imbalances in the rehabilitation process. Apartfrom a token commitment to promoting ‘alternative/supplementary livelihoods’,most agencies have avoided exploring options for alternate livelihoods in ameaningful manner. More alarmingly, almost everyone – government, NGOs,church-based groups, national and international aid agencies – is unanimous insupporting production-enhancing technologies as the means of livelihood support,either through ignorance or because of a hurry to spend aid (and to be seen to havedone so) and there is really no effort to seek or suggest alternative paradigms ofdevelopment (which one would have expected to come from the NGOs). One canagree with the oft-quoted statement that one hears in Chennai these days: that the realdisaster began after the tsunami of December 2004.
The conclusion one can draw from this is perhaps that the links between poverty,environment and trade as well as the impact of the major trends in the fisheries sector– declining access to, or availability of fish; technologisation, over-capacitisation andthe consequent indebtedness/credit-market linkages; and changing trade context – onthe life and livelihoods of many categories of fishers (not to speak of the variousnon-fishing stakeholders) continue to be overlooked at all decision-making levels. Tothe question whether the benefits from exports (or the other forms of wealth createdin the sector) can be used for improving livelihood sustainability of the poor (if suchquestions ever get asked at the policy-making level), the answer could be ‘yes’ in atheoretical sense (and one could even suggest a number of ways to do it), but, inpractice, it is very doubtful that such options would make it into policy.
3. ECONOMIC GROWTH
Since its Independence in 1947, India experimented with a Mixed Economy model,which was felt to be apt for a poor, developing country of this magnitude, but turnedout to be an opportunity for bureaucracies and controls to proliferate leading to astagnation in economic growth. The weaknesses in the Indian economy came to thefore in 1991, when India faced a serious balance of payment crisis. In order toovercome the crisis, the country embarked upon a massive programme ofliberalisation and the reforms involved opening up the economy, reducing the publicsector’s role, and liberalising and strengthening the financial sector (World Bank,2000:2). Licensing for domestic manufacture was abolished for all but a fewindustries. The private sector was permitted to enter into areas hitherto reserved forthe public sector. Import tariffs were drastically reduced and the rupee was devaluedsignificantly. The government made a clear commitment for further liberalisation andreforms (Parikh & Radhakrishnan, 2002) and with Mr Manmohan Singh, the originalarchitect of the reforms process in the country, at the helm of affairs now, it can beexpected that the reforms will continue with renewed vigour.
GDP Per Capita
Gross Domestic Product (GDP) of the country in 2002 in US$ was 510.2 billions andin terms of Purchasing Power Parity, it was US$ 2,800 (HDR, 2004). The Per CapitaGDP for India has been showing a consistent increase since 1975, as the following and implemented post-haste in many cases could, it is feared (Muralidharan, pers.comm..), potentiallylead to serious imbalances. It is widely believed that the number of boats being provided will easilyexceed those actually lost/damaged in the tsunami.

G-17
table shows. It is interesting to note that the GDP does not show any fluctuations inthe post-Liberalisation period.
Year 1975 1980 1985 1990 1995 2000 2002GDP per capita (PPP-dollar) 430 630 960 1 380 1 830 2 420 2 670Source: Globalis (2004)
Economic growth and poverty
As Deaton and Kozel (2005) note, what happened to poverty in India in the 1990shas been fiercely debated, both politically and statistically. The effects ofliberalisation on poverty remain controversial (see also Datt & Sundharam,2005:375-8), and the official numbers published by the GOI, showing an accelerationin the rate of poverty reduction have been challenged both for showing too little andtoo much poverty reduction. After a thorough review of various estimates, Deatonand Kozel conclude that although there is no consensus on what happened to Indianpoverty in the 1990s, there is good evidence both that poverty is falling and that theofficial estimates of poverty reduction are too optimistic, particularly for rural India.One might say that it might be still too early to establish the relation betweeneconomic growth and poverty in the country.
Similarly, while determining the HDI for different states, the Planning Commission(GOI, 2002b: 4) finds that the relation between the HDI and the level of economicgrowth does not show any correspondence among the middle-income states in thecountry. The Planning Commission concludes that human attainments appear to bebetter and more sustained in those parts of the country where there is socialmobilisation for human development, and where female literacy and empowermentencourages women to have a say in the decision making process at the householdlevel.
Main contributors to economic growth
Over the last twenty years, agriculture has become less important to the nationaleconomy. Agricultural output growth declined by about 1 percentage point to 2.7 perannum during 1992-99 as against a growth rate of 3.6 percent in the 1980s (Parikhand Radhakrishnan, 2002: 33) and its contribution to GDP fell from 44 percent in1973-74 (GOI, 2002a: 28) to only one quarter in 2002. As if to underline thedeclining importance of agriculture, investment in agriculture as a percentage ofGDP has come down from 1.6 percent in 1993-94 to 1.3 percent in 2001-2 (The NewIndian Express, 15 November 2004: 10). The service sector grew from 37.2 percentin 1982, to 49.2 percent in 2002 – representing now virtually half of India’seconomy. The contribution of the industrial sector has remained stable at 26 percentthroughout this period.
Contribution of fisheries to national economy
G-18
i. Brief overview of the growth of fishing economy in the country6
It is important to note that while the rest of the economy was opened to the marketsonly in the 1990s, fisheries development in the country since 1950s has always beenbased upon the open economy model. As Johnson (2001) puts it, “The developmentpath advocated by modernisation relies on a variable mix of market incentives andstate intervention, the latter specifically to stimulate growth in capacity throughinvestment until such a time as the country or region builds sufficient momentum tomaintain growth on its own”, in other words, by liberalising fish trade. Agriculturewas not given an export orientation because it was felt that it should primarily meetthe domestic demand and fisheries was primed for exports (Anjani Kumar et al,2003:9).
At the policy level, fisheries development became synonymous with addressing theforeign exchange needs of the country from the Second Five Year Plan onwards, andshrimp emerged from relative obscurity to become the Prima Donna of Indianfisheries by late 1960s. The emphasis on increasing exports led to an active focus ondeveloping new harvesting technologies like mechanised trawling through influentialinitiatives like the Indo-Norwegian Project (INP) in Kerala and FAO-supportedprogrammes elsewhere in the country (Kurien, 1985; Vivekanandan, 2002;Srivastava et al, 1990:33; DOF-Karnataka 1978: 8; DOF-Andhra Pradesh, 1978 4).Exploration by INP and CMFRI on the west coast (Kurien, 1985) and by the GOIsurvey vessels on the northeast coast of India (Somvanshi, 2001:2) in late 1960s andmid-1970s opened up the Indian seas for shrimp fishing. The GOI set up a chain ofice-cum-cold storage plants (procured under TCM fisheries programme) at importantcoastal centres (GOI, 1961), which were instrumental in encouraging some privateentrepreneurs to export shrimp to the US in late-1950s, with spectacular results(Kurien 1985). The growing demand from the US and Japan for Indian shrimpreceived a boost with the devaluation of Indian rupee in 1966 and the markets forIndian seafood shifted from traditional buyers like Sri Lanka to more affluenteconomies like the USA, Europe, Australia and Japan (MPEDA, 2001).Significantly, in all this, the coastal waters were treated as an open access regime(GOI, 2001a; Hosche & Flewweling, 2003), which encouraged people to move intothe sector and exploit a common resource freely.
From the 1970s, the government recognised brackishwater aquaculture as one of thepotential sectors for growth and took measures to support it. The Ministry ofCommerce took the initiative to promote shrimp farming ‘in line with the objectiveof maximization of foreign exchange earnings’ (Srivastava et al, 1990: 70) and,under its Marine Products Export Development Authority (MPEDA), evolved anumber of schemes to support aquaculture. In coastal states like Andhra Pradesh, amajor chunk of mangroves in the estuarine systems were de-reserved for shrimp
6 For many reasons (conceptual/methodological; practical/logistical), this study focuses mainly on themarine/brackishwater sector and less on the inland sector but this should not be construed to mean thatthe latter are any less important in terms of providing livelihoods, particularly in central and north-eastern parts of India where riverine capture and freshwater culture provide sizeable livelihoodopportunities for the poor (who, unlike in marine sector, belong to a wide range of castes, whichmakes inland fisheries more ‘inclusive’ than the others). One can assume, however, that the broadcontours of development of the inland sector are not much different from those of the marine andbrackishwater areas.

G-19
farming (AAI, 2001: 57). Individual entrepreneurs were encouraged to take upshrimp farming with financial and technical support (AAI, 2001: 17) with generousassistance from banks and other financial institutions. Until the hatcheries began tosupply seed for culture, fishermen and women were trained in wild-seed collectionand were also provided assistance for acquiring the tools for seed collection (BOBP,1986: 11) (MPEDA, 1984:50). After the liberalisation of Indian economy in 1991,aquaculture really grew big as it became possible to import efficient farmingtechnologies, feed and other essential ingredients7. The 1990s also saw many farmsmoving from extensive farming to semi-intensive and intensive farming systems(ADB/NACA, 1998:100).
Motorisation of artisanal craft, which began in the 1980s, was an important event inthe small-scale fisheries on the east coast of India. Together with revolutionary newgears like the trammel net and the long-lines, motorisation paved the way for theartisanal fishers to enter shrimp export market chains and to supply distant domesticmarket trade. The numbers of motorised boats grew from scratch to nearly 45 000 by1999 (Sathiadhas, 1998:466; GOI, 2000: 128).
ii. Contribution of fisheries to national economy
By 2000, the gross investment on fishing component is estimated as Rs 8 000 crores(Vivekanandan, 2002), much of it being in the private sector. Fisheries contribute Rs.19 555 crore to the Gross Domestic Product (GDP), which works out to 1.3 percentof the total GDP or 4.6 percent of the GDP from agriculture sector, and the figuresare impressive when compared to those in 1970-71, when fisheries contribution tothe GDP stood at 0.62 percent of the total GDP and 1.46 percent of the GDP fromAgriculture (GOI, 2000: 130).
iii. Contribution of fishing sector to exports
Indian seafood exports have grown by over twenty times in the four decades from1961-62 to 1999-2000. The export of seafood from the country increased from 15732 metric tonnes (MT) in 1961-62 to 343 041 MT in 1999-2000. In terms of value,the exports have gone up from a mere Rs. 4 crore to Rs. 5 117 crore or US $ 1 189million during the period, and the unit value realisation increased from Rs. 2/kg toRs. 149/kg (MPEDA 2001). In terms of overall exports from the country, seafoodstands at tenth place, accounting for 2.7 percent of total export earnings in 2001.Among seafood exporting countries, Indian exports stood 17th in terms of quantityand 12th in terms of value (Mathew, 2003). The contribution of exports to the GDPfrom fisheries in 1998-99 is about 24 percent, and to the national GDP is 0.3 percent(calculated from GOI, 2000: 1 & MPEDA 2001:27). In terms of volume, exportsconstituted 5.75 percent of the total production and 11.2 percent of the marineproduction in 1998-99.
One must keep in mind that the earnings from the exports are gross earnings, andwhen the cost of production (including the cost of subsidies and the success-to-failure ratio in aquaculture) is deducted from these, the net earnings may come down 7 In 1990-91, brackishwater cultivation in India covered 65 100 ha, and the total production was 35500 MT, with an average productivity of 550 kg per ha (GFC, 1994:59), but by 1999-2000, the extentof area under brackishwater culture grew to over 150 000 ha (MPEDA 2001).

G-20
significantly. The opportunity costs of diversifying fishing effort to cater to domesticmarkets and the cost-benefit of focusing the development outlays on otherprogrammes might provide a more realistic picture of the earnings from the shrimpexports.
As for the distribution of income generated from the exports, as ever, there are nostudies to provide a good understanding. It must be borne in mind that the fisheriesexport earnings at the national level might look impressive, but they constitute only2.5 percent of the total export earnings and a quarter of the earnings from thefisheries sector. And when spread over a vast area and among a wide range ofstakeholders, the earnings would become pretty thin (and get even thinner when theseasonality issues are brought into the picture).
A large share of the processing and export markets is held by a relatively fewcompanies in Andhra Pradesh and Kerala. SIFFS 2002 notes that 87 percent of theseafood processed in Kochi belt in Kerala during 1999-2000 was done by eightprocessors out of a total 69 processing plants in the area. Nearly 70-80 percent of theseafood in Andhra Pradesh is reportedly processed by four or five large companies.Some of the large processors also own factory vessels to have a better control overthe quality of the catches and the operations. One can speculate and say that a smallminority of people – mainly in the processor-exporter category (rather than in theproducer category; the current rates of return in many fishing systems appear to betoo poor or uncertain or, if they are better than is generally assumed, no reliableinformation is available on this issue) – might be garnering a sizeable proportion ofthe export earnings in the sector, but this will need to be validated through furtherresearch.
Salagrama (2004a) provides a broad characterisation of the different stakeholdersinvolved in the export sector in Indian fisheries. The fishworkers in the export sector(mainly the producers and processors – peelers, sorters, packers, transporters) are notorganised (nor are encouraged to organise) and, as such, have no scope to negotiatewages (or the conditions of their work) based upon a realistic estimate of the returns.This might work against the owners when the markets fluctuate, but the availabilityof large unemployed workforce in the unorganised sector still gives them freedom toget away with it.
Joint-venture operations are prevailing in brackishwater aquaculture sector (mainlyon the east coast of India), which involve setting up buy-back arrangements withfarmers in return for meeting their credit and other needs. It is not known what theshare of the joint venture and multinational corporations is in the overall exportearnings.
iv. Contribution of fisheries sector in terms of poverty alleviation, livelihood supportand environmental sustainability
The economic benefits from shrimp trade to the fishing communities have beenconsiderable. The growth of the sector opened new employment opportunities andbeing largely informal, helped many poor people to find work. As fish productionincreased, there has been a corresponding prosperity in the fishing communities(although its benefits were uneven and skewed within and between villages). Many
G-21
fishers used the surplus to invest in fishing (more boats), ancillary activities (iceplants, transport systems, boat building yards) and non-fishing activities(agriculture). Quality of housing, access to villages and fishing infrastructureimproved. The improved access to fishing villages and the frequent trips by thetraders allowed the normally isolated and inaccessible fishing villages to makecontact with the larger world and to improve their access to basic services. Theinteractions of the fishing communities with the external world improved and thishas certainly raised their social consciousness.
Impacts on poverty: On the other hand, the economic growth of fisheries has notbeen translated into an effective antidote to poverty. Although modernisationgenerated new opportunities, it is doubtful that these were equal to those lost, or thatthe people who lost out were also the gainers from the new opportunities. As Mathew(2003:2) notes, while there is apparent prosperity in several fishing communitiesbecause of increasing fish production and market value, there is, on the other hand,poverty among fishers who have smaller or no capital base. Entry into the newmarket chains involved high capital investment and recurring expenses, andautomatically excluded many poor people from owning new technologies ormanaging them successfully. To quote Mathew again, “A fraction of the fishingcommunities now owns and operates sophisticated fishing units, while the majoritytoil away, either earning their livelihood as workers, or leading a hand-to-mouthexistence operating rudimentary fishing units, with very small marketable surplus”.
A review by the Government of Kerala in late-1970s concludes that, “The benefitsaccruing to the traditional fishermen [i.e., the poorest sections in the sector] onaccount of the government’s mechanisation programmes were negligible” (GOK,1978: 7-8). In fact, the arrival of more efficient systems into the near-shore watersoften gave rise to conflicts with traditional users of the resources. Such conflicts havebeen reported from Goa (Nalini Nayak 2002), Tamil Nadu (Bavinck, 2001), AndhraPradesh (Vivekanandan et al 1997), Orissa (Salagrama, 2002), and Kerala (Kurienand Achari, 1994).
This also led to the growth of ‘subsidy culture’, i.e., the expectation that the State hasthe responsibility to contribute to the wellbeing of the sector (see Tharakan, 1998),which meant spending valuable resources on shoring up the sector at the expense ofthe poor depending on it. This high degree of externalisation of costs also hadimplications on livelihoods, environment and trade.
An important change brought about by the modernisation process is themarginalisation of women from the productive sphere. Similarly, although domesticfood security was one of the important objectives of the modernisation programme, itcould not be reconciled with the capital-intensive, export-market oriented strategiesadopted. While the export of shrimp might not have directly affected food security, itcertainly did so when the fishing boats began targeting shrimp to the exclusion of theother species. The result has been that there is less fish available for domesticconsumption by the fishworkers themselves (Salagrama, 2003a).
Impacts upon livelihoods: The classic ‘Tragedy of Commons’ scenario in marinecapture fisheries unfolded in Kerala as early as 1970s (Kurien, 1985), and in otherstates by 1980s. By 2000, there has been a drastic decline in the catches and catch

G-22
per effort in the mechanised sector on the east and west coasts (FFPI, 2001; Bhatta,2001). Fishing Chimes (March 2004) reported that many mechanised boat owners inVizag were resorting to distress sale of their boats because of falling shrimp catches,un-remunerative prices and rising operational costs. Many others were reportedlyanxious to sell their boats but were unable to find buyers.
Beginning in 1995, shrimp culture has been consistently affected by seriousoutbreaks of viral diseases, which practically wiped out hundreds of farms andfarmers. Price fluctuations in the international markets, local resistance andantagonism in the early stages, adverse judicial decisions (the Supreme Courtjudgement of 1996 banning non-traditional shrimp farming in the coastal zone), andraising costs of production have made the activity risky. Poor recoveries and highrisk forced banks and insurance companies to withdraw from the sector.
With the motorisation of small-scale sector, the concept of risk entered intooperations, as the investment costs in fishing went up by 60 percent (Vivekanandan,et al 1997: 19). In Kerala, motorisation was found to increase the level of investmentfive to ten-fold (SIFFS, 2001:46). In the normally cash-starved artisanal fishingeconomies, increased investments could only come from outside, which involvedgetting into complicated trade arrangements. Because subsidies were not available,or accessible, to all, a widening gap developed between the motorised and non-motorised boat owners and this led to productivity disparities and unequal access tothe common resources of the coastal waters (SIFFS, 1991).
Environmental impacts: More seriously, the growth in fisheries may have beenachieved at the cost of the sustainability of the natural resources, which is anoutcome of promoting the coastal waters as an open access resource and, later, thefailure to control rapid expansion of fishing fleets and to put a viable fisheriesmanagement structure in place. Both trawling and aquaculture have been reported tocontribute to the degradation of natural resources and environment (Vivekanandan,2002; Sujatha 1996; Puthra Pravin et. al 1998; Prathibha Rohit et.al 1993;Vivekanandan et al 1997 etc.).
The focus on promoting a particular technology or a species (shrimp) has clearenvironmental implications. The technologies were introduced without assessingtheir relevance and likely impacts upon the complex interrelationships between manand environment, and in many cases, the ecological consequences have been severe.In order to maximise earnings, the mesh size of the nets is decreasing and moredestructive gears like ring-seines are making entry in many fishing villages, with theresult that the size of many commercial species being landed are of a smaller size andthe catches frequently consist of juveniles (see Sujatha 1996; Luther & Sastry, 1993).The State’s inability to control expansion of the technologies it had itself promoted,or to implement effective management measures, came in the way of reducing effort.
Conclusion
This chapter attempted to examine the nature and patterns of economic growth inIndia, with emphasis on the contribution of the fisheries sector, which indicates thateconomic growth has not been accompanied by (i) establishment of a rational andsustainable natural resource management system and (ii) progressive distributional

G-23
changes for equitable distribution of the benefits in order to address the poverty andlivelihood concerns. The government’s emphasis on increasing foreign exchangeearnings is not accompanied by putting checks on over-exploitation of the resources,or to extract the surplus for streamlining the systems to effectively address the needsrelated to trade, sustainability or livelihoods of the poorer stakeholders. The failure toaddress the growth, environmental and social concerns in a meaningful manner willultimately affect the sustainability of the sector as a whole as well as the stakeholderswho depend on it. The fact that different aspects of fisheries are covered by differentministries or departments has meant that each agency has its own priorities andviewed the sector from its own perspectives along the lines of the story about theelephant and the five blind men. As has been long argued, there is a need to bringfisheries under a single ministry at the central level and its activities are synergisedwith those of the various state governments.
4. FISHERIES DEVELOPMENT AND MANAGEMENT
Fish production
India has a coastline of 8 041 kilometres with an exclusive economic zone (EEZ)stretching over 2.02 million km2, and the continental shelf covers 0.5 million km2.Annexure 3 provides basic information on distribution of marine resources in India.The potential resources available from the Indian waters are 3.9 million tonnes, (2.2million t in the inshore and the rest in the offshore waters) (GOI, 1996). India alsohas inland water sources covering over 190 000 km and open water bodies with awater-spread area of over 66 lakh hectares (GOI 2000: 122). Brackish water areaavailable for aquaculture is 1.2 million ha, of which 165 000 ha has been developed(MPEDA, 2001).
Between 1951 and 2001, India’s fish production increased eight-fold from 0.75million MT to 5.6 million MT8 (Annexure 4). India is currently the fourth largest fishproducer in the world after China, Peru and Japan (Mathew, 2003). India’scontribution to world fish production increased marginally from 3.7 percent in 1950to 4.18 in 1997, but the share of marine sector declined from 2.97 to 2.86 percentduring the period.
The west coast contributes 70 percent to the total marine landings, while the eastcoast accounts for more than half the freshwater fish production and nearly 95percent of the cultivated shrimp production (MPEDA, 2002). In 2000-1, the marinefish production came from about 44 species groups, of which 10 accounted for halfthe production (Mathew, 2003). FAO’s country profile for India (FAO 2000a) notes
8 A note of caution about the statistics used in this report: there is much debate about the validity ofIndian fisheries statistics available with different departments of fisheries. See Vivekanandan et al1997 for a critical review; Salagrama 2003a shows how different sources have different – and totallyunrelated – fish landing statistics for the same area, i.e., Orissa. In Tamil Nadu, it is not uncommon inthe post-tsunami period to find the same official agency providing more than two sets of data for thesame parameter (Ahana Lakshmi, pers.com.). All one can say is that one needs to be cautious whilemaking judgements based on the statistics on production. The statistics on exports (quantity-wise orearning-wise) are far more reliable because they are monitored carefully. In all other instances,lacking alternatives, the general practice is to use catch statistics as indicative of broad trends (whichare obtained through more rigorous micro-level studies etc.) rather than the other way round.

G-24
that Indian oil sardine (Sardinella longiceps), Indian mackerel (Rastrelligerkanagurta) and Sciaenidae dominate the catches, while Bombay duck, anchovies,cephalopods, perches and Carangidae are also important. The three largest fisherieson the west coast of India are Indian Oil sardine, Bombay duck and shrimp fisheries.The main stocks exploited on the east coast include: lesser sardines, silverbellies,penaeid shrimps, sciaenids, Hilsa spp., catfishes and perches (Hosch & Flewweling,2003).
The principal inland fish resources are: major carps (catla, rohu, mrigal and calbasu),minor carps, exotic carps (common, silver and grass carps), murrels and catfishes(wallgo, pangasius etc) (GOI, 2000: 48-49), and over 70 percent of the freshwaterproduction of 2.84 million tonnes in 2000-1 came from carp species.
In 1999-2000, there were a total of 181 284 artisanal (i.e., non-motorised) (65percent of the total), 44 578 motorised (16 percent) and 53 684 mechanised fishingcrafts (19 percent) in the marine sector (GOI, 2000: 128). Most of the fishing vesselsare below 20 m length overall (OAL) and consequently qualify as ‘small-scale’irrespective of the methods of fishing used or harvesting power, which has a bearingon current management efforts.
Shrimp in Indian fishing economy
Shrimp undoubtedly is the most important species in the fisheries economy and is thebackbone on which most activities (mechanised fishing, aquaculture and manyartisanal operations too) survive. In 1995 (for which figures are available), penaeidshrimp accounted for nearly 38 percent of the total value of landed catches althoughconstituting only 8 percent of the total landings (Sathiadhas, 1998:409). Significantincrease in shrimp production from aquaculture has been an important developmentsince 1990s. Marine capture fisheries accounted for the entire quantity of shrimpexported until 1987-88. However, between 1987-88 and 1999-2000, the contributionof capture shrimp has come down to 22 percent of the quantity and 24 percent of thevalue of the total shrimp exports from the country, and in terms of quantity, it hasdwindled from a peak production of 55 736 MT to 24 275 MT (MPEDA, 2001: 37).In 1988-89, shrimp from culture sources contributed nearly half the total exports ofshrimp, and further increased to 78 percent by 1999-2000 and now cultured shrimpaccount for a quarter of the total seafood exports from the country. Mathew (2003)notes that in 2001, aquaculture contributed 60 percent of the total export value, thusemerging as the most important seafood export from India.
Trends in fish production
The growth rate in fish production has been on the decline since 1981 and during1991-2000, it was only 1.9 percent (CMFRI, 2003: 3). The contribution of marinefish to overall landings declined from 71 percent to 50 percent, the decline being dueto increased production in inland and culture sectors as well as falling growth rate inproduction. Within the marine sector, the annual average landings by the trawlersincreased from 300 thousand t in 1980-1981 to 1.3 million t in 1999-2000, increasingtheir share in marine production from 30 percent to nearly 50 percent(Vivekanandan, 2002). The annual per capita production of active fishermen in theartisanal sector declined from 2 590 kg in 1980 to 420 kg in 1996-97, while it

G-25
increased from 5 260 to 8 130 kg in the mechanised sector (Sathiadhas, 1998:466).
The production from pelagic resources increased three-fold since 1961, reaching 1.36million tonnes in 2000, but its relative contribution to the total landings declinedfrom 71 percent in 1965 to 50 percent in 2000. From 1989 to 2000, the landings ofsmall pelagics remained static at around 1.2 million tonnes annually. The landings ofdemersal fish have increased from 0.23 million tonnes in 1961 to 1.33 million tonnes(or half the total landings) in 2000. However, the trend in the aggregated landings ofthe demersal fish levelled off since 1994. Overall, the catches from inshore watersare reported to have reached their full potential and may have begun to beoverexploited (GOI, 2001b;Vivekanandan, 2002).
Similarly, the increase in the percentage contribution of brackishwater production toexports is related more to the poor performance of the capture sector and raising unitvalue (from Rs. 244 to Rs. 330) than to increased production. After reaching a peak82 850 MT in 1994-95, the aquaculture production dipped and it was only in 1999-2000 that it went up beyond its previous peak to reach 86 000 MT. But then, between1994-95 and 1999-2000, the total brackishwater area under culture grew by 56%,while the shrimp production grew only 4 percent, that too only in the final year(MPEDA, 2001:39)!
Landed values of fish
The nature of fisheries (multi-species, dominated by 44 species), sale of fish in openauctions (largely based on visual observation) at many landing centres, long marketchains involving many intermediaries, and seasonal and regional variations in termsof production and disposal of different species make it extremely difficult todetermine the landed values of different fish across the country. It is possible toobtain a better idea about the values of export species like shrimp because thetransactions in this category are more formal and necessitate that the quantities andvalues of exports be recorded, but for a major proportion of fish catches, which areconsumed in the country, no such information exists other than when collected forspecific purposes (as, for e.g., Sathiadhas, 1998), which tend to be mainly one-offexercises and frequently resort to fixing a uniform unit price for a species across thecountry, making the figures indicative at best. The gross income generated at landingcentre level from the marine fish catch of 2.7 million tonnes in 1999-2000 is aboutRs. 10 486 crore (CMFRI, 2003:247).
Fisheries exploitation or activity-related benefits
There are 3651 fishing villages in the country and some 6.7 million people depend onfisheries for a livelihood (GOI 2001). This includes about 1.5 million people engagedin fishing operations (with full-time and part-time fishers accounting in equalmeasure to the number) and over one million people engaged in pre- and post-harvestoperations. Nearly half the full-time fishermen are on the east coast of India and thewest coast accounts for 35 percent while the remaining are spread over other statesand union territories (Mathew, 2003).

G-26
Demographic and socio-economic data on several key stakeholder groups in thesector are not available. As CMFRI (2003:248) notes, “Lack of socio-economicinformation has been one of the most serious impediments to effective policymakingand planning, especially in the case of small-scale fisheries.” The published data onfisheries, such as the annual handbooks on fisheries statistics, give information onfish catches and numbers of harvesting tools (boats and nets, areas of fish ponds), butmake only cursory mention of the people involved in the sector and that too, in a waythat raises more questions than answers any. Consequently, as Mathew (2003) notes,“Since there are no studies on income distribution in Indian fisheries andaquaculture, it is difficult to discuss how much of the benefits of increasing fishproduction and value of fish output actually translate into human development offishing communities.” Obviously, this is one important area that needs furtherresearch in the near future.
The information in the following sections is drawn from secondary data whereavailable, but also from interviews conducted with stakeholder groups in the sector inthe east coast states of Andhra Pradesh and Orissa. These figures will vary from areato area (fishers in Kerala have a much higher per capita earnings while those in someparts of Orissa might have much less) and from season to season, but will serve toindicate broad trends.
Employment in different production-related activities
Sathiadhas (1998: 467) provides a thumb rule that, on average, every 5 kg of marinefish produced provides employment to 2 persons, one in harvest and another in post-harvest sectors. The current estimates of employment in different categories are notavailable, but Sathiadhas (1998: 466) provides some estimates using 1997 figures:
Non-mechanised Motorised MechanisedFishing fleet 160 000 32 000 47 000Active fishermen 650 000 170 000 200 000Ownership by active fishermen 25 19 24
Of the 200 000 employed in mechanised sector, some 10 000 reportedly worked forthe deepsea vessels (Sathiadhas, 1998: 467). The fishers operating the non-motorisedvessels are regarded as the poorest among the Indian fishing communities, theiroperations being subsistence-oriented9.
Shrimp aquaculture provides livelihood to one million people, about a third of thememployed directly in culture operations and the rest in ancillary activities (Mathew2003).
Average earnings in fisheries sector
The producers can be broadly classed into boat owners and crewmembers. Sharingsystems are widely prevalent in many fisheries, and the general norm is that theowner takes fifty percent of the gross income while the crew (including the owner
9 ‘Subsistence’ here is used in the sense of generating just enough income to help the household meetits subsistence needs (leaving little surplus).
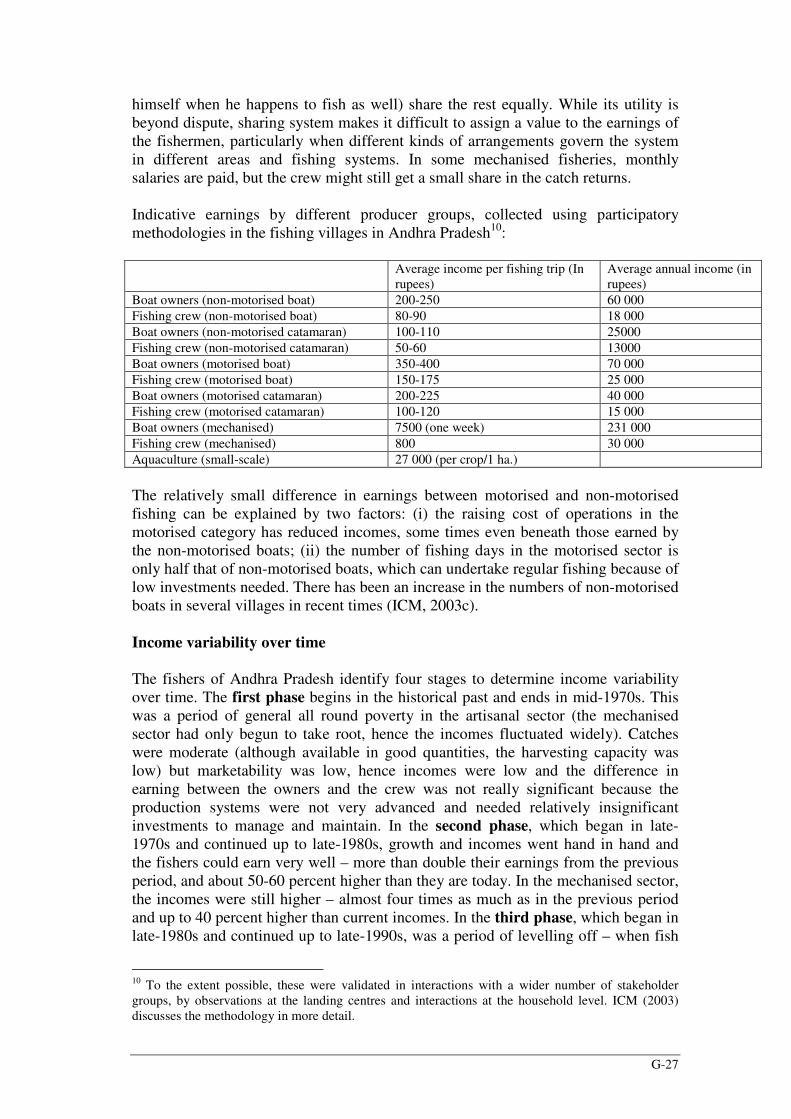
G-27
himself when he happens to fish as well) share the rest equally. While its utility isbeyond dispute, sharing system makes it difficult to assign a value to the earnings ofthe fishermen, particularly when different kinds of arrangements govern the systemin different areas and fishing systems. In some mechanised fisheries, monthlysalaries are paid, but the crew might still get a small share in the catch returns.
Indicative earnings by different producer groups, collected using participatorymethodologies in the fishing villages in Andhra Pradesh10:
Average income per fishing trip (Inrupees)
Average annual income (inrupees)
Boat owners (non-motorised boat) 200-250 60 000Fishing crew (non-motorised boat) 80-90 18 000Boat owners (non-motorised catamaran) 100-110 25000Fishing crew (non-motorised catamaran) 50-60 13000Boat owners (motorised boat) 350-400 70 000Fishing crew (motorised boat) 150-175 25 000Boat owners (motorised catamaran) 200-225 40 000Fishing crew (motorised catamaran) 100-120 15 000Boat owners (mechanised) 7500 (one week) 231 000Fishing crew (mechanised) 800 30 000Aquaculture (small-scale) 27 000 (per crop/1 ha.)
The relatively small difference in earnings between motorised and non-motorisedfishing can be explained by two factors: (i) the raising cost of operations in themotorised category has reduced incomes, some times even beneath those earned bythe non-motorised boats; (ii) the number of fishing days in the motorised sector isonly half that of non-motorised boats, which can undertake regular fishing because oflow investments needed. There has been an increase in the numbers of non-motorisedboats in several villages in recent times (ICM, 2003c).
Income variability over time
The fishers of Andhra Pradesh identify four stages to determine income variabilityover time. The first phase begins in the historical past and ends in mid-1970s. Thiswas a period of general all round poverty in the artisanal sector (the mechanisedsector had only begun to take root, hence the incomes fluctuated widely). Catcheswere moderate (although available in good quantities, the harvesting capacity waslow) but marketability was low, hence incomes were low and the difference inearning between the owners and the crew was not really significant because theproduction systems were not very advanced and needed relatively insignificantinvestments to manage and maintain. In the second phase, which began in late-1970s and continued up to late-1980s, growth and incomes went hand in hand andthe fishers could earn very well – more than double their earnings from the previousperiod, and about 50-60 percent higher than they are today. In the mechanised sector,the incomes were still higher – almost four times as much as in the previous periodand up to 40 percent higher than current incomes. In the third phase, which began inlate-1980s and continued up to late-1990s, was a period of levelling off – when fish
10 To the extent possible, these were validated in interactions with a wider number of stakeholdergroups, by observations at the landing centres and interactions at the household level. ICM (2003)discusses the methodology in more detail.
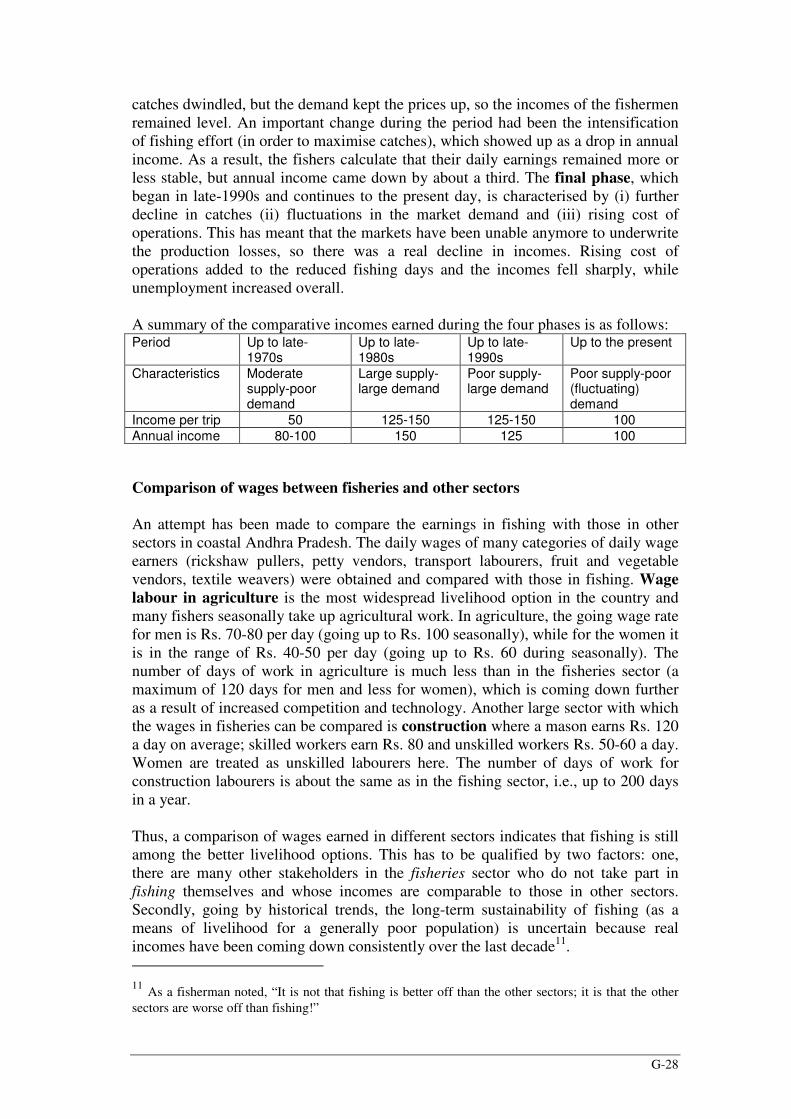
G-28
catches dwindled, but the demand kept the prices up, so the incomes of the fishermenremained level. An important change during the period had been the intensificationof fishing effort (in order to maximise catches), which showed up as a drop in annualincome. As a result, the fishers calculate that their daily earnings remained more orless stable, but annual income came down by about a third. The final phase, whichbegan in late-1990s and continues to the present day, is characterised by (i) furtherdecline in catches (ii) fluctuations in the market demand and (iii) rising cost ofoperations. This has meant that the markets have been unable anymore to underwritethe production losses, so there was a real decline in incomes. Rising cost ofoperations added to the reduced fishing days and the incomes fell sharply, whileunemployment increased overall.
A summary of the comparative incomes earned during the four phases is as follows:Period Up to late-
1970sUp to late-1980s
Up to late-1990s
Up to the present
Characteristics Moderatesupply-poordemand
Large supply-large demand
Poor supply-large demand
Poor supply-poor(fluctuating)demand
Income per trip 50 125-150 125-150 100Annual income 80-100 150 125 100
Comparison of wages between fisheries and other sectors
An attempt has been made to compare the earnings in fishing with those in othersectors in coastal Andhra Pradesh. The daily wages of many categories of daily wageearners (rickshaw pullers, petty vendors, transport labourers, fruit and vegetablevendors, textile weavers) were obtained and compared with those in fishing. Wagelabour in agriculture is the most widespread livelihood option in the country andmany fishers seasonally take up agricultural work. In agriculture, the going wage ratefor men is Rs. 70-80 per day (going up to Rs. 100 seasonally), while for the women itis in the range of Rs. 40-50 per day (going up to Rs. 60 during seasonally). Thenumber of days of work in agriculture is much less than in the fisheries sector (amaximum of 120 days for men and less for women), which is coming down furtheras a result of increased competition and technology. Another large sector with whichthe wages in fisheries can be compared is construction where a mason earns Rs. 120a day on average; skilled workers earn Rs. 80 and unskilled workers Rs. 50-60 a day.Women are treated as unskilled labourers here. The number of days of work forconstruction labourers is about the same as in the fishing sector, i.e., up to 200 daysin a year.
Thus, a comparison of wages earned in different sectors indicates that fishing is stillamong the better livelihood options. This has to be qualified by two factors: one,there are many other stakeholders in the fisheries sector who do not take part infishing themselves and whose incomes are comparable to those in other sectors.Secondly, going by historical trends, the long-term sustainability of fishing (as ameans of livelihood for a generally poor population) is uncertain because realincomes have been coming down consistently over the last decade11. 11 As a fisherman noted, “It is not that fishing is better off than the other sectors; it is that the othersectors are worse off than fishing!”

G-29
Other activities undertaken in relation to fishing
Tietze (1985:80) distinguishes five functions in the traditional fishing economy: (i)production; (ii) processing of fish; (iii) marketing of fish; (iv) finance and credit; and(v) ancillary activities, e.g., boat building, engine repairs, net making etc. Obviously,in some cases, the functions are interwoven and performed by the same category ofpeople; and in others, they are separate and performed by different groups,depending on the stage of development of the communities. ICM (2003a) provides adescription of the stakeholders in fisheries sector in Orissa.
In the post-harvest sector, domestic marketing accounts for a million people whileexport marketing employs another 0.2 million. These include auctioneers at landingand wholesale centres, those involved in transportation, loading, unloading, packing,distribution of ice, commission agents, wholesalers, retailers etc.
An important feature of the fisheries is the gender-based division of labour and theactive role played by the women in the sector. Sharma (2002) discusses thecontribution of women to the fisheries sector and raises a number of pertinent issuesconcerning the current understanding of their role. Some half-a-million womenreportedly work in the pre-and post-harvest operations (CMFRI, 2003:247),constituting some 25 percent of the labour force in the pre-harvest activities, 60percent of that in export processing and 40 percent of the labour force in internalmarketing (Sathiadhas, 1998: 467). Since the women have a specific role in the post-harvest systems, their incomes are not specifically determined by their gender. But,in organised sectors like shrimp processing activities, there is evidence that womenare paid less than men.
Contribution of fish to food-and livelihood-security
Over 70 percent of total fish production of India is sold fresh in domestic markets,about 11 percent is dried or salted, and about 6 percent is converted to fishmeal(GOI, 2000). FAO gives a per capita supply of 4.8 kg of fish in the country.
Production Imports Exports Total foodsupply
Per caputsupply
’000 t live weight kg/yearFish for direct human consumption 5 378 NIL 385 4 670 4.8Non-food uses 780 – – –
Source: FAO (2000a)
Although consumption of fish is not uniform across the country, fish is an importantsource of animal protein, especially among the poor income groups (Salagrama,2004a). Kumar et al (2003) indicate that fish consumption in the country hasincreased since 1980s (by about 75 percent). A study conducted by IIM, Ahmedabad(cited by FAO, 2000) found that 56 percent of the population are fish eaters and theper capita consumption is estimated to be 9.5 kg/year. Not surprisingly, fishconsumption among the fishing communities has traditionally been high, but thereare indications (ICM, 2003a) that this is declining as a result of cost of fish growingfaster than the other commodities, forcing the fishers to sell all of their catch and

G-30
consume non-fish alternatives. Wholesale price indices for different commoditiessupport this:
Year Fish Meat Food Articles All commoditiesBase 1970-71 = 1001971 103.1 106.6 101.0 105.01981 246.6 330.4 230.3 378.4Base 1981-82 = 1001982 118.7 112.8 110.0 104.31990 193.5 188.9 191.6 177.21998 582.4 567.6 431.8 348.2Source: GOI (2000:131)
Availability of fish to the traditional consumers (who are mainly poor) decreaseswhen fish increasingly reach the export and distant urban markets and also becausethe fishing operations are adapted to cater to the demands of the more lucrativemarkets by targeting a few high-value species and ignoring the cheaper varieties onwhich the poor depend. This is another area where statistics are difficult to come by,but there are many indications to show (i) that demand for fish is growing in thecountry (FAO, 2000; Kumar et al 2003) and (ii) that there is a decrease in availabilityof fish to the poorer consumers (coastal fishing and non-fishing people as well asinland tribal populations and agricultural workers).
Fisheries Management in India12
Status of fisheries in the ConstitutionArticle 246, Fisheries, of the Constitution of India makes it a subject for State List.This means that all laws and regulations related to fishing, fish marketing, fishers’welfare etc have to be framed by the state legislatures. As FAO (2000) notes, theinvolvement of the Union Government on issues related to fisheries management ishigh. Also, fish production from the Exclusive Economic Zone (EEZ), major fishingharbours, fishing vessel industry, seafood export trade, and marine and inlandresearch and training are on the Union List, of the Seventh Schedule of theConstitution (Mathew, 2003). Other areas related to fisheries, i.e., the protection ofwild animals and forests, including endangered species of wild fauna and flora,protection of coastal zone and marine biodiversity and prevention of land-basedsources of pollution are on the Concurrent List, which is the responsibility of boththe Union and the state governments.
Agencies dealing with fisheries sector
Mathew (2003) provides a description of the various government departments andMinistries dealing with various aspects of fisheries.
Ministry/Department Responsibilities
12 As many of the questions asked in the template are not really applicable to the Indian context, thisstudy makes a departure from the format, but makes sure to include any information that addresses theissues in the original format.

G-31
At the Union Level:Ministry of Agriculture Fisheries in the EEZ, survey and assessment of fisheries resources,
research, training and extension;Ministry of Shipping Fishing vessel industry and fishing harbours (Union List); minor
fishing ports (Concurrent List).Coast Guard (under the Ministry of Defence) Regulation of fishing by foreign vessels, prevention of marine
pollution from ships and protection of endangered marine speciesMinistry of Food Processing Fish processingMarine Products Export DevelopmentAuthority, MPEDA (Ministry of Commerceand Industry)
Seafood exports
Ministry of Environment and Forests Protection of wild animals and forests and marine biodiversity(Concurrent List); Coastal habitat protection issues
Ministry of External Affairs Law of the Sea mattersDepartment of Ocean Development, Ministryof Ocean Development
Implementation of 1982 UN Convention on the Law of the Sea
Ministry of Water Resources Erosion-related issuesMinistry of Tourism Tourism (activities that have an impact on fisheries)
At the State-Level:Department of Fisheries All fisheries and mariculture activities in the stateDepartment of Forests Protection of wild animals and forests and marine biodiversity
(Concurrent List)Department of Ports Minor fishing harbours (Concurrent List)Source: Mathew (2003)
At the state level, there are many other agencies, like the Department of RuralDevelopment, which undertake several programmes affecting the fisheries sector inmany ways. Also, as a recent review (Hosch and Flewweling, 2003) notes, India isone of the world leaders in terms of establishing associations and societies formed byfishing communities, workers, and other interests related to the sector. Theseorganizations develop and defend positions, publish findings, and influenceauthorities on policy formulation and management options.
The fact that the responsibility for fisheries and marine habitat is spread over severalagencies and Ministries at the state and union government levels, and is furtherinfluenced by a number of organisations, is a cause of confusion – and concern – indeveloping and implementing a rational management regime. As Hosch andFlewweling (2003) conclude, “No single Ministry is solely responsible for managingthe fisheries sector. The lack of an overarching and coherent policy addressingcoastal and deep-sea capture fisheries contributes to the lack of a coherentorganisation of the sector as a whole.”
Fisheries Legislation in India
In general, as Anjani Kumar et al (2003:15) have noted, the national policies in Indiahave been export oriented, supporting relatively large-scale fisheries for shrimp,while for many states the primary concern was the welfare of local small-scalefishermen. Fisheries management has taken the backseat in achieving theseobjectives. Consequently, as Bavinck (2002) has noted, fisheries management in thecountry has been one of reacting and responding to crises as they erupted rather thanbased upon clear-cut strategies based upon scientific/economic rationale.Mathew (2003) summarises the various Acts and legislations that consideredfisheries management and conservation and how they fared. According to him, the

G-32
only Indian legislation that talks about “undertaking measures for the conservationand management of offshore and deep-sea fisheries”, is the Marine Products ExportDevelopment Authority Act, 1972, which has a provision to meet the costs ofconservation and management of waters beyond the territorial sea from the MarineProducts Export Development Fund. The Act gave rise to the MPEDA (under theMinistry of Commerce) and MPEDA has never invoked this legal provision.
Mathew also mentions other acts like the Territorial Waters, Continental Shelf, EEZand other Maritime Zones Act, 1976, which recognises the sovereign rights toconservation and management of living resources in the Indian EEZ and gives powerto the Union Government to make rules, inter alia, for conservation and managementof the living resources of the EEZ and the protection of the marine environment. Thebasic fisheries legislations that followed this Act do not make any mention ofconservation and management!
Fisheries Management Measures in India
Coastal fishing policy is defined by open access regime, which has given rise to asector with many entrants exploiting coastal marine resources to their full potential.The current legal framework (Marine Fishing Regulation Acts) provides for conflictminimisation between traditional and industrial sub-sectors, with little emphasis onsustainable management of the resources (Hosch & Flewweling, 2003). The fisheriesconservation and management measures, when undertaken, are mainly confined totechnical measures like minimum mesh size, closed area/seasons, and prohibitions oncatching certain species and listing species that cannot be exported below a minimumsize and most of these measures are not effectively implemented (Mathew, 2003).More seriously, Mathew (2003) notes that, in spite of resources being overfished,there is no entry restriction into marine fisheries, nor are there any programmes toretire fishing fleet, or to take effective and deterrent legal action against fishingvessels that violate fishing regulations. There are also no legal mechanisms toaddress inter-state movement of fishing vessels or problems arising from suchmovement.
Marine Fishing Regulation Acts
The fisheries within the territorial limits are managed under the Marine FishingRegulation Act (MFRA) of the maritime states of India, based on a model piece oflegislation prepared by the Ministry of Agriculture, GOI, in 1979. These actsdemarcate fishing zones in the territorial waters for fishing by non-mechanisedvessels and mechanised fishing vessels and were mainly used for the purpose ofmaintaining law and order at sea. In addition to the regulation of fishing areas, thereare regulations on the cod end mesh size of trawls. However, in the absence ofeffective surveillance system, these regulations could not be implemented strictly(Vivekanandan, 2002). Encroachment by the mechanised vessels in the areasdemarcated for the artisanal craft and usage of very small mesh size in the cod end(<15 mm) continue even after the promulgation of the acts. The state governmentsalso implement seasonal closure of fishing operations every year and also implementother activities such as ban on destructive nets in the backwaters. As every such newactivity gets added to the MFRA, the Act itself becomes unwieldy and, ultimately,unworkable, a fact accepted by the government (GOI, 2001). There are also

G-33
questions regarding the effectiveness of implementing a fishing ban uniformly acrossall coastal states to enable fish to breed, when the multi-species fisheries of India donot permit any single period in a year to be demarcated as the ‘breeding period’ forall – or even some – of the commercially important species, a problem that iscompounded by lack of studies of a practical nature dealing with the biology of manyspecies.
Working Group on Fisheries for the Tenth Five Year Plan
The influential 2001 Report of the Working Group on Fisheries for the Tenth FiveYear Plan of India’s Planning Commission recognises the problems of overfishing inIndian waters in the territorial sea and emphasises the need to introduce “principlesof scientific fisheries management”. It attributes “depletion, economic waste andconflicts among user groups” in coastal waters to the open access nature of Indianfisheries and over-capacity and advocates an immediate adoption of a community-based and participatory approach to complement scientific fisheries management.And, after all this, it makes no proposal for financial provision for fisheriesmanagement under the Tenth Plan! The Working Group also suggests somemeasures to address the problem, including the introduction of ‘new generationresource-specific vessels’ to tap sources in the offshore waters, ‘development,demonstration and popularisation’ of fuel saving designs of fishing craft and gear,pelagic and mid-water trawling and testing new hull materials (GOI 2001b: 75-78),which fall into what has been called ‘effort-enhancing’ interventions and couldpotentially turn out to be a cure worse than the disease!
Marine Fishing Policy, 2004
The ‘Comprehensive Marine Fishing Policy’ (GOI, 2004), which is the first of itskind in the sector, gives considerable attention to ‘Resource Management’ andadvocates a stringent fishery management system to be put in place. It suggests:
• A review of the MFRA and prescribing a fresh model bill on costal fisheriesdevelopment and management with a re-orientation on limited access incoastal marine sector “through policy initiative, sound legislation andawareness creation”;
• Putting a check to the proliferation of new boats;• Implementing a uniform closed season;• Imposing a strict ban on all types of destructive methods of fishing,
regulating mesh sizes and prohibits catching juveniles, non-target species ordiscarding bycatch after it has been caught;
• Posting observers on commercial fishing vessels for enforcing monitoringcontrol and surveillance system (MCS);
• Establishing a resource enhancement programme through sea ranching,establishing marine sanctuaries, regulating capture of brood stocks, andpromoting fish aggregating devices as a community based activity
Most of these are technical/resource-oriented measures, with people or economicrationale hardly entering the picture. This means that fisheries management willcontinue to remain the government’s own problem while the other stakeholdersremain ‘recipients’ or mere spectators. It also remains to be seen how the Policy willbe implemented in practice, particularly some of the thorny issues like gear bans etc.

G-34
Traditional (Community-Based) Management Systems
The identification of the government as the sole custodian of management of naturalresources was actively fostered by the government itself for at least a century (Gadgil& Guha, 1997) and now becomes a big stumbling block in making any managementsystem work efficiently. The tragedy is that this happens in spite of the existence ofvibrant and more sustainable modes of resource management and use patterns inmany fishing communities in India. Many authors – Thomson (1989), Bavinck(2001), Mathew (1991), Schombucher (1986), Johnson (2002), Kurien (2003) etc –have shown the existence of strong and viable traditional systems of management invarious parts of the country.
A study conducted by Salagrama (2003b) for IDDRA/SIFAR on successes fisheriesmanagement on the customary systems of fisheries management concludes that thesuccess of these systems to be a result of: (i) their ability to understand and buildupon the specific conditions of natural and social environment in an area; (ii) theneed for ensuring secure, sustainable and equitable access to resources; (iii) theintegrated and holistic nature of the systems of governance concerning resourceallocation; and (iv) their participatory nature, where people had the right and theopportunity to discuss and debate all measures of management.
Costs and Revenues of Fisheries Management
License fees are levied in the mechanised sector, but fees are low as are the penaltiesapplied for violating regulations. These sources of revenue do not represent a seriouscontribution to the overall cost of management of the resource. Also, manycategories of fishers hardly pay any income tax due to exemptions provided by thegovernment as well as to weak institutional mechanisms to make them pay. Althoughsome categories like seafood exporters are now included in the tax bracket, there isstill a long way to go before this can be applied right across the sector. Exports arecharged a cess of 0.3 percent of the FOB value of seafood exports, and the collectedtax is used for financing the Marine Products Export Development Authority andcurrently stands at about $ 4 million per annum (Hosch and Flewweling, 2003).
In summary, the cost of management continues to be borne by the government fromother sources, and considering the financial crunch as well as the politicalimplications the government chooses to keep off the issue as much as it can get awaywith! Hosch and Flewweling (2003) note that the overall national budget for fisheriesmanagement has decreased over the last ten years although costs related to MCS andconflict management are said to have increased. Lacking sound research studies, it isalmost impossible to say where the fishery wealth is going, but wherever it is going,it certainly is not going towards putting more responsible fisheries managementregimes in place, or even to support the integrated development of the sector.
Conclusion
One tends to agree with the Hosch & Flewweling’s conclusion that “Fisheriespolicies in India have been developed with few linkages between sectors, based ondated legislation, and focused on increased production with little emphasis onconservation, sustainability or responsible fisheries management.” Whatever

G-35
conservation and management has been done is more as a reaction to a crisis that hasalready erupted, rather than as a precautionary measure. These have also tended tobe focused on technical/resource-oriented measures rather than on people oreconomic rationale. Low awareness among the stakeholders, poor funding andmanpower, and political implications have reduced whatever effectiveness theseprogramme might have had.
5. POLICY MAKING
Perceptions of poverty at the macroeconomic level
Reduction in poverty and inequality, through overall economic and socialdevelopment by ensuring equitable access in resources and skills, as well as bywidening the opportunities for gainful employment to the deprived sections of thesociety have been among the central objectives of Indian planning during the pasthalf century (CESS, 2002:3). Successive Five Year Plans consistently espoused thecause of the poor and emphasised the need for poverty alleviation in the country,although – as Datt and Sundharam (2005:372) note – the number of the poorcontinued to swell in the country notwithstanding the pious sentiments for theweaker sections in the Plans.
In the immediate post-Independence period, characterised by stagnant economy, lowper capita incomes and unequal distribution of wealth, the prime need was to buildthe necessary infrastructure to generate sufficient income. The first two Five YearPlans (1951-56, 1956-61) concentrated mainly on this theme, but they were alsoaware that economic growth alone was not sufficient to reduce poverty and there wasa need for direct state intervention for poverty eradication. Thus, the Plans attachedimportance to labour-intensive techniques of production and production of wagegoods so that the benefits of growth could reach a larger section of population (Dattaand Sharma, 2002). In subsequent plans, poverty has been seen increasingly as thecentral problem calling for special action in relation to people who have remainedweak and deprived (GOI, 1982: 11).
NIRD (1999a:3) notes three distinct phases in policies aimed at supportingagriculture for rural development. In the first phase, summed up by the slogan, ‘Landto the Tiller’, agricultural lands (which were hitherto concentrated in the hands offeudal and other vested interests) were sought to be redistributed among the landlessfarmers. However, for various reasons, the land redistribution acts achieved littleeither in terms of growth or social justice and the land-ownership pattern hascontinued to be skewed; in 1991, nine percent of the households owned half thefarmland in the country (worked from NIRD, 1999a: 35).
In the second phase, driven by the ‘technology school’, envisaged increasing foodproduction through introduction of high yielding variety seeds and chemicalfertilizers – what has been termed as ‘Green Revolution’. This approach, adopted inmid-sixties, did not have much to say on equity, in the hope that the benefits ofincreased production would trickle down to the poor in due course. The assumptionsin the green revolution were the class neutrality of the markets in the access tomodern inputs and distribution of gains on the one hand, and space/regionalneutrality in the diffusion process on the other. In an economy where agrarian

G-36
reforms were far from complete, these were to act as major impediments to thesuccess of the green revolution. Other shortcomings of the approach too becameapparent by mid-1970s.
The third phase of rural development, ushered in the mid-seventies, involved settingup a number of ‘area’ and ‘target group’ specific programmes, aimed at providingincome-earning assets to households living below the poverty line. The PublicDistribution System (PDS), aimed at providing subsidised food to the poor wasintroduced during this period and a range of public works programmes for creatingwage employment opportunities for the poor have been introduced from time to time.Still, as the Planning Commission recognises, poverty is remains a major problemand the numbers have actually been raising over the years.
For the weaker sections of the society, positive discrimination policies have beenenacted and reservations made at various levels. Some packages of insurance – forold people, widows and for seasonal workers to overcome lean seasons – have beenput in place. National drinking water missions, public healthcare, rural sanitation,universal literacy campaigns, housing and public distribution system are some of thepublic services relevant to the fishing communities of India (NIRD, 1999a; ICM2003a). Although much criticism is (often rightly) levelled against the focus, content,scope and implementation of these programmes, they do address some basic needs ofthe poor and removing them is likely to increase their vulnerability significantly inmany parts of the country.
Since the 1990s, poverty alleviation has assumed more significance due to theapprehension that the short-run impact of the ongoing reforms process may not befavourable for the eradication of poverty and the Tenth Five-Year Plan as well as theNational Human Development Report give strong testimony of the fact. The GOIstands in the forefront of developing countries arguing for a more equitable andlenient trade regime under the WTO, because of the high percentage of poorpopulation in the country who depend on agriculture for a living and whose ability topurchase agricultural products at the international market price would be extremelylow. India also argues that it would need enough flexibility under the Agreement onAgriculture to take care of its food security, rural employment and livelihoodconcerns (GOI, 2002a: 123). It also fears that, when international markets gettransmitted into the domestic economy, they could seriously affect the prices of foodgrains and food entitlements of the poor.
Organisations involved in poverty reduction in the country
Government organisations
At the Central Government level, it is the Planning Commission, which sets the goalsfor poverty alleviation and assigns budgetary provisions for the various programmesunder different Ministries (Finance, Rural Development, Agriculture, Commerce,Industries). The programmes implemented fall into two broad categories: (i) thoseaimed at poverty alleviation in a wider sense; (ii) those aimed at the development ofparticular sectors as well as the people working in them (for e.g., fishing) including(sector-specific) welfare measures. An example of the second category is the UnionMinistry of Agriculture, which – through the state Departments of Fisheries –

G-37
provides assistance for basic infrastructure, supplying engines, housing, fuelsubsidies, life insurance, lean season assistance and a host of other services (GOI,1996:191-217). Here, poverty alleviation is an important – but more implicit thanexplicit – objective, particularly in the sector-level programmes (for e.g., subsidiesfor processing industries to upgrade their systems).
Seeing that a welter of agencies working in the rural development sector was a causeof confusion, it was proposed in the Sixth Five Year Plan (1980-85) that, ‘suchmultiplicity of programmes for the rural poor operated through a multiplicity ofagencies should be ended and replaced by one single integrated programme operativethroughout the country’. The result has been the introduction of the largest anti-poverty programme ever implemented in the country, the Integrated RuralDevelopment Programme (IRDP) first introduced in 1976. It covered the wholecountry by 1980 with the objective of transferring productive assets to broaden theresource base of the poorest rural families (GOI, 1982:13). The IRDP wasimplemented through a central coordinating agency in each district, called DistrictRural Development Agency (DRDA), with its staff drawn from different departmentslike Agriculture, Animal Husbandry, Irrigation, Forestry, Fisheries, Industry etc,which gives it an opportunity to aim for holistic attempt at poverty alleviation andalso to streamline the different sectoral programmes to aim at a particular objective.Under the IRDP, assistance was provided to the poor families for the purchase andownership of productive assets in the form of subsidy and assistance in obtainingloan from institutional credit agencies. In 1999, the IRDP was restructured as theSwarnajayanti Gram Swarozgar Yojna (SGSY), which aimed (along with othercentrally funded- and executed programmes like Jawahar Rozgar Yojana – JRY) atself-employment of the rural poor.
Banks and other financial institutions
Since independence, a multi-agency approach consisting of cooperatives,commercial banks and regional rural banks has been adopted to provide cheaper andadequate credit to farmers. The National Bank of Agriculture and RuralDevelopment (NABARD) was set up in 1982 by an Act of Parliament to refinancefor all kinds of production and investment credit to agriculture, small-scaleindustries, handicrafts etc. with a view to promote integrated rural development(Datta & Sundharam, 2005:602-3). Its Rural Infrastructure Development Fund(RIDF) was created to extend loans to State Governments to enable them to take upinfrastructure projects in different rural sectors. Progressive institutionalisation ofagricultural credit under the Five Year Plans has made it possible that 60 percent ofthe required short-term and medium-term production credit is now provided bycooperatives, commercial banks and RRBs in many states.
Non-governmental and civil society organisations (adapted from David Brown et al,Undated)
In the post-Independence period, the government recognised the role that voluntaryorganisations could play in providing services to disadvantaged populations and setup the Central Social Welfare Board to provide support to NGOs. The 1980s saw asudden spurt in the government support to NGOs, and an increase in theirparticipation in the development programmes. In the Seventh Five Year Plan, the

G-38
resources earmarked for NGOs increased dramatically and brought into existence anew agency called the Council for Advancement of People's Action and RuralTechnology (CAPART) to strengthen the capacities of NGOs. Over the decades,NGOs have been important actors in a variety of development activities, such asproviding relief in disaster areas, services such as education and health in remote andimpoverished areas, community organizing for local problem-solving and self-reliance, coalition-building and advocacy to press grassroots claims on governmentservices, or support activities such as research, training, and technical assistance tograssroots populations. Alongside the conventional development activities, IndianNGOs have also demonstrated alternative models of education, health care,community development, housing and several other areas of grassroots development.During the past decade the work of NGOs has been central to raising and bringinginto the mainstream of Indian development planning and programming such issues aswomen, environment, and wasteland development.
Main instruments used in Poverty Alleviation Programmes (PAPs)
In the Government sector, most poverty alleviation programmes are designed by thecentre and implemented by the State on fund sharing basis for financing theprogrammes. The annual outlay for centrally sponsored anti-poverty programmesconstitutes between 5 and 8 percent of the total Government of India (GOI)expenditure, and about 1 percent of the GDP (NIRD, 1999a: 102). CESS (2002:3)groups the Poverty Alleviation Programmes (PAPs) into five categories, which are asfollows:
Income enhancement programmes:• Self Employment Programmes which include IRDP, DWCRA and TRYSEM and• Wage employment programmes which include JRY and EAS;• Programmes which focus on providing food and nutritional security viz., PDS and ICDS;• Programmes which provide basic minimum services – housing, sanitation, health, education;• Income maintenance programmes viz., pension schemes, maternity benefit scheme and
survival benefit scheme; and• Natural resource management and livelihoods.
The instruments used by the NGOs vary greatly across programmes, based on theirfocus and approach, area of expertise/operation, funding sources and conditions.
Evaluations of Policies and Instruments
As DFID’s India Country Strategy Paper (1999: 1) notes: “Policies and programmesdesigned to help the poor have suffered from ineffective implementation and there iswidespread public concern about the impact of corruption on governance. The largesums invested in public anti-poverty programmes tend to focus on poorly targetedsubsidies and safety nets rather than longer term investments in education andhealth.” Various evaluations about the IRDP reveal that the actual percolation effectof the programme has been much less in terms of poverty alleviation as comparedwith the impressive figures doled out by Government reports in terms of subsidies,bank credit and poverty line crossers (Datta and Sundharam, 2005:410).In terms of institutional credit, as Datta and Sundharam (2005: 584) note, the newinstitutions created by the government and the vastly extended facilities of ruralfinance provided by these institutions have been appropriated by the top 30 percent

G-39
of the middle and affluent farmers in the country, with the result that 30 years in thefield of rural credit appears to have failed to make a dent on poverty and provideadequate credit to improve the economic condition for the bottom 70 percent of therural population. The weakest of the rural population consisting of bonded labourers,landless agricultural labourers, tribals, Scheduled Castes and Scheduled Tribes, whoform 25-30 percent of the total rural population, fail to receive assistance from theinstitutional credit programmes. A study conducted in mid-1990s by DFID’s Post-Harvest Fisheries Project (PHFP, undated) showed that, in 1994-95, fisheriesreceived only 2.5 percent of the total funds earmarked for the priority sector (whichincludes agriculture, irrigation, land development and non-farm sector) and that theformal credit sources, including banks, development institutions and cooperativescontributed less than 10 per cent of credit usage of the fishers.
In respect to the development programmes taken up by agencies like the Departmentof Fisheries on their own, lack of vertical and horizontal linkages with otherdevelopment initiatives have meant duplication of effort on the one hand andpromotion of conflicting objectives on the other (Vivekanandan et al, 1996). There isgenerally no congruence or synergy between sectoral programmes implemented bydifferent Ministries/Departments and there are also problems related to their reach,implementation and effectiveness in tackling poverty effectively. The shortcomingsin NGOs’ focus, approaches and activities are evaluated by Kamat (2002), AditiTandon (The Tribune, July 26, 2003) and several others.
Factors contributing to poor performance of poverty alleviation programmes
Datt & Sundharam (2005:379) point to a fundamental problem in the PAPs, which isthat a strong political will is lacking to bring about institutional changes leading toredistribution of income-yielding assets either through land reform. As a result, mostPAPs remain ornamental in terms of impact. NIRD (1999a: 102) notes that whilespending on PAPs figures significantly in GOI’s total spending, the sums are notlarge when compared to the magnitude of poverty in India. Even if all of thespending under the PAPs reaches the poor (which the Planning Commission itselfrecognises as highly problematic), the total transfer to the poor is on an average only5-7 percent of the expenditure required to cross the poverty line. The NIRD reportgoes on to assess a number of other PAPs and concludes that, scarcity of resources,the elaborate top-down patronage system in all the rural development schemes, lackof local infrastructure and acute shortage of basic human skills have prevented thepoor from improving their socio-economic status (NIRD, 1999a: 117).
Datt and Sundharam (2005:380) also note that most schemes get distorted duringimplementation, a conclusion accepted by the Planning Commission, which notesthat, rather than the availability of resources, it is the institutional capacity toformulate viable need-based projects with efficient delivery systems to utiliseoptimally the available resources that determined the success of PAPs. Citing thecase of ongoing rural development programmes, it notes that (2002a: 179), excessivecompartmentalisation of the executive into Ministries/Departments has encouraged anarrow sectoral approach to conceiving, formulating and implementing schemes, andprevented mutual synergies to benefit the plan initiatives, while duplication of effortscurtailed the flow of assistance to the beneficiaries. In the absence of acceptablelevels of governance, the Plan advises, it would be preferable to eschew targeted

G-40
PAPs in favour of more generally applicable schemes. The Commission also noteslack of continuity and harmony between policy-making bodies and executivedivisions, corruption, excessive bureaucratisation, and dilemmas facing the State inthe context of liberalisation as having a bearing on the governance in the country.
The Tenth Five-Year Plan and Objectives for Poverty Alleviation
The Tenth Five Year Plan (2002:6) (which may be considered as the Indianequivalent of a PRSP, although far wider in scope) recognises that economic growthcannot be the only objective of national planning and defines development objectivesnot just in terms of increases in GDP or per capita income, but more broadly in termsof enhancement of human well being. It identifies the following monitorable targetsfor a few key indicators of human development:
Monitorable targets for the Tenth Five Year Plan and Beyond (GOI, 2002a: 6):• Reduction in poverty ratio by 5 percentage points by 2007 and by 15 percentage points by
2012• Providing (opportunities for) gainful and high-quality employment• All children in school by 2003; increase in literacy rates to 75 percent by 2007• Reduction in gender gaps in literacy and wage rates by at least 50 percent by 2007• Reduction in the decadal rate of population growth between 2001-2011 to 16.2 percent• Reduction in infant mortality rate to 45 per 1000 by 2007 and to 28 by 2012• Reduction in maternal mortality rate to 2 per 1000 by 2007 and to 1 by 2012• Increase in forest and tree cover to 25 percent by 2007 and 33 percent by 2012• Sustained access to potable drinking water to all villages by 2007• Cleaning all major polluted rivers by 2007 and other polluted stretches by 2012.
Noting that good governance is perhaps the single most important factor in ensuringthe objectives of the Tenth Plan are met, the Planning Commission suggests someaspects of governance that need to be taken up on a priority (GOI, 2002b: 182-88),which include:
• People’s participation at all stages of planning, implementation and monitoring• Decentralisation and creation of institutional structures for realising goals of self-governance• Right to information• Reforms of the Revenue System, which is perceived to be “one of the most oppressive and
corrupt systems of government”;• Mobilisation of other resources for development and other purposes, which are presently
unfounded and represent a claim on the general revenues.• Increasing the role of civil society in the development activities• Reforms to civil services, procedures, programme/project formulation, delivery systems,
monitoring, budgeting and judiciary etc.• Encouraging information technology to develop electronic governance (e-governance)
It is not possible to assess how many of these targets are being met during the currentPlan period. Datt & Sundharam (2005:322-4) remark about some of its objectives asbeing ‘ambitious’ and ‘unrealistic’ and raise doubts about its ability to achieve someof the targets.
To summarise, the foregoing discussion suggests that poverty alleviation continues totake a central role in the Indian planning process at the macro-economic levelalthough the efforts over the successive 5-Year Plans have remained only partiallysuccessful in weeding out poverty.
G-41
Fisheries policymaking in India
At the policymaking level, fisheries is considered as an important growth sector,generating income and employment for a large section of economically backwardpopulation of the country, contributing to food security to the population and earningforeign exchange through exports. Consequently, at least four differing views can beperceived in the approach to fisheries at the level of Union Ministries. According tothe Ministry of Agriculture (Department of Animal Husbandry and Dairying),which oversees fisheries, the sector
occupies a very important place in the socio-economic development of thecountry. It has been recognized as a powerful income and employmentgenerator as it stimulates growth of a number of subsidiary industries and is asource of cheap and nutritious food besides being a foreign exchange earner.Most importantly, it is the source of livelihood for a large section ofeconomically backward population of the country (http://dahd.nic.in/fish.htm;emphasis added).
Within this broad viewpoint, policymaking takes conflicting directions (such aspromoting more harvesting technologies on the one hand and undertaking resourceconservation on the other).
On the other hand, the Ministry of Environment and Forests, which is the nodalagency for the planning, promotion, co-ordination and overseeing theimplementation of environmental and forestry conservation and managementprogrammes (http://envfor.nic.in/), considers fisheries and the fishers as acontributing factor for degradation of natural resources and environment andintroduces in situ wildlife protection and fisheries management measures that haveimplications for the life and livelihood of fishworkers. In 2001, some species ofshark and ray, molluscs, sea horses, giant grouper, coral and sea cucumbers andsponges have been brought under the ambit of the Indian Wildlife Protection Act of1972 and it took considerable effort on the part of not only the fishworkerorganisations, but also the Ministry of Agriculure and the Ministry of Commerce toget the MOEF to relax some of the provisions in order to avoid a slump in economicgrowth and export earnings from the sector. Similarly, in the state of Orissa, two-thirds of the 450-km coastline has come under a ban to protect the Olive Ridleyturtles, causing considerable hardship to the thousands of marine and estuarinefishers in the state (OTFWU, 2004) and the Department of Fisheries is facing aserious problem of finding alternative sources of livelihoods for the fishers affectedby the ban (Satyabrata Sahu, pers.comm.). Another example of a similar naturecomes from Tamil Nadu, where the proposal to set up a marine bio-reserve in theGulf of Mannar region has led to protests from the fishers’ organisations and theCommissioner of Fisheries of the state (MP Nirmala, pers.comm.).
The Ministry of Commerce provides a third strand in the differing perceptions. Ifthe Ministry of Agriculture focuses on production and the Ministry of Environmentand Forests on conservation, the Ministry of Commerce’s emphasis is on foreignexchange earnings and it pursues this objective with a single-minded zeal and, often,at the expense of the resource and livelihood concerns. The Marine Products Export
G-42
Development Authority (MPEDA) was constituted in 1972 under the MarineProducts Export Development Authority Act 1972 (No.13 of 1972) and functionsunder the Ministry of Commerce. The role envisaged for the MPEDA under thestatute is comprehensive - covering fisheries of all kinds, increasing exports,specifying standards, processing, marketing, extension and training in variousaspects of the industry (http://www.mpeda.com/). As already noted, its all-encompassing role also includes conservation and management, although it has neverimplemented any programmes in this respect. The programmes of MPEDA aim atexport production in capture and culture fisheries, induction of new technology andmodernisation of processing facilities and market promotion.
A fourth perception of the fisheries sector comes from the Ministry of Defence,whose Coast Guard considers fishing in the coastal and offshore waters as a nuisancein performing their border control functions and in responding to smuggling andpoaching by foreign vessels. In addition, they also contribute to marine pollutioncontrol� �http://www.globalsecurity.org/ military/world/india/cg.htm). In borderstates like Gujarat which have a sizeable fishing fleet, the Coast Guard insists on thefishers carrying their identification papers with them at all times and harassingpeople when they are caught without them at high seas. The largely illiterate andmigrant work force onboard these boats finds it frequently difficult to obtain or carrythe papers with them and suffer badly as a result. An even more serious consequencebefalls the fishermen of the neighbouring Pakistan who stray into the Indian watersfor fishing purposes and caught and jailed for indefinite periods of time without aproper trial (Gupta and Sharma, 2004; Salagrama, 2004c). The same fate awaitsIndian fishermen who stray into the Pakistani waters.
Linkages between fish resources, economic growth and poverty reduction, asarticulated in the policies
The importance of the fisheries sector to the national economy is underlined by theconstitution of a separate Working Group on Fisheries for the Tenth Five Year Plan(2002b). The Plan proposes a fish production target of 8.19 MT envisaging a growthrate of 5.44 percent per annum (marine 2.5 percent and inland 8.0 percent),emphasizing the need for increasing public/private investment for strengtheninginfrastructure for diversifying fisheries and aquaculture activities in order to enhance‘fish production and productivity’. The major thrust during the Plan is proposed to beon integrated development of inland fisheries, management of coastal fisheries,developing deep-sea fisheries with equity participation, vertical and horizontaldevelopment of aquaculture productivity, infrastructure development, improved post-harvest management, and policy interventions including monitoring, control andsurveillance.
An important conclusion that can be drawn from the Tenth Plan document (as well asfrom the Working Group report that contributes to the Plan) is that ‘growth’ (in termsof increasing production) continues to be the driving force of fisheries policy-makingin the country. Poverty alleviation and livelihood issues or environmental andresource conservation do not figure prominently on the agenda and when they do, itis apparent that their real purpose is ornamental. As noted, for all the pioussentiments about the need to better manage the fisheries resources in the WorkingGroup report, no provision was made for the purpose. Similarly, while suggesting the
G-43
programmes for increasing ‘production and productivity’ (a phrase that crops uprepeatedly in the Plan document), it seems to ignore the ground reality vis-à-vischanging production (depletion of natural resources) and market (international trade)conditions. Consequently, the emphasis on introduction of new extractiontechnologies (which are necessarily beyond the capacity of the poorer fishers toinvest in, so the poverty angle remains more or less closed) might lead to an all-too-predictable result. An example of this ‘producing more at any cost’ paradigm is thenew Deep Sea Fishing Policy.
The Deep Sea Fishing Policy, 2002
In November 2002, the Government issued a Deep Sea Fishing Policy aimed atincreasing fishing effort to exploit India’s untapped marine fisheries resources. Thegovernment’s contention is that, considering the inability of the existing fleet to fishin the offshore waters, a vast resource remains untapped, which is an economicwaste. Moreover, the argument goes, if India fails to make use of its EEZproductively, this may spur landlocked countries like Nepal and Bhutan in the regionto lay claim to those waters and lease them to distant foreign nations anyway (GOI,2001b: 578).
After a thorough review of the new guidelines, Mathew (2003) concludes that thepotential benefits to the Indian fishing economy from the new Policy appear to beless than even the most exploitative fisheries agreement between coastal states anddistant water fishing nations! Under the new regime, there are no vessel quotas orlicense fees commensurate with the value of the catch, and no requirement to employIndian workers or to land in Indian ports, the whole system is loaded in favour offoreign deep-sea fishing vessel operators registered as Indian companies. Mathewalso cautions that the new policy would act as an invitation to DWFNs to dump theirexcessive harvesting capacity in the Indian waters, which is certainly not a steptowards enhancing the health of the marine environment. Thus, the new Deep SeaFishing Policy might help in increasing production by the utilisation of some under-exploited resources, but the potential impacts upon the natural resources themselvesand on the poverty and livelihoods of the poor remain a matter of concern.
Similarly, the changing international trade context and the emergence of non-tariffbarriers like Sanitary and Phyto-Sanitary (SPS) measures (Salagrama, 2004b) do notreceive attention at the macro-policy level and the measures suggested in terms ofIndia’s possible stand at the negotiations or to improve the existing conditions up tothe required standards are non-existent or barely adequate, particularly in the contextof widespread poverty in the sector.
Socio-economic studies undertaken in the fisheries sector and implementation ofresults in policy terms
As indicated in the chapter on Poverty, a few socio-economic studies exist on thefisheries sector, but their impact on policy-making has been minimal. A review of theprogrammes undertaken over successive 5 Year Plans since 1950s shows aremarkable consistency in policymaking, indicating that the focus has remained fixedon certain (resource- and technology-centred and production-oriented) objectiveswhich may have evolved over the years but remain the same at the core. That the

G-44
lack of even basic data on different actors in the sector has not been felt to affectpolicy-making is an indication of how remarkably independent of socio-economicconsiderations the policy-process has so far been. True, a number of public sectorfisheries research institutes exist in the country, but a review of their work makes oneto conclude that: (i) fisheries research has mainly focused on the fish (biology,harvest and post-harvest technologies) and to a much less extent on the people ortheir socio-economic conditions and (ii) the contribution of research to policymakinghas been extremely poor. The institutional and policy frameworks to ensure the flowof research results into policy-making processes are weak to the point of being non-existent and the result has been negative on both.
Role played by NGOs, fishers’ organisations and civil society in general
The growth of NGOs and grassroots organisations in the fisheries sector was rathersluggish until 1970s, but when they did in states like Kerala as a result of continuousefforts by committed bands of intellectuals from within and outside the fishingcommunities, they quickly became an integral part of the system. It was due to yearsof hard work put in by fishworkers’ organisations with support from some NGOs inKerala that led to a seasonal ban on mechanised fishing and its subsequent extensionacross all the coastal states (Kurien, 1988). NGOs like the Programme forCommunity Organisation (PCO), the South Indian Federation of Fishermen Societies(SIFFS) and the National Fishworkers’ Forum have organised the fishworkers alongindependent lines, vocalised their needs in a meaningful manner and attempted toaddress these needs through innovative community-based strategies that would pavethe way for the government to implement some of them in its own programmes(Vivekanandan, 2003). In other west coast states like Maharashtra and Gujarat, thecooperative movement has been very strong in the fishing sector. These cooperatives– mainly economically oriented – quickly took on a wider range of responsibilitiesand developed into viable systems of governance and support.
Barring a few areas in southern Tamil Nadu, the NGO and fishworkers’ movementon the east coast has been rather weak. The NGO interventions here have beenlargely general in nature and involved applying a general package of assistance –consisting of health and literacy programmes and setting up self-help groups –overlooking the specificities of poverty in fishing communities. Disasterpreparedness can be said to have been one area where many NGOs tackled the needsof the fishers more than adequately, but in most other areas, their interventions havenot made much of a mark. On a positive note, a vibrant, grassroots-based fishworkersmovement is taking root in Orissa (Salagrama, 2002), which has the potential tospread across to other states in due course.
The relations between the government and the NGOs remain rather ambiguous andare, often, characterised by mutual suspicion. Over time, there has been moreopenness and moves towards involvement of people from Private and NGO sectorsin the planning and implementation of the government programmes, but these‘outsiders’ are frequently involved only to satisfy the diktats of ‘participation’ thatmost aid-agencies insist upon. Similarly, the government having become the mostimportant aid-giver to the NGOs, the latter too frequently run the risk of being nomore than an extension of the government system.

G-45
Institutional factors affecting the participation of the poor in economicactivities, policymaking and implementation13
The foregoing sections have shown that economic growth in India in general and infisheries in particular has been significant over the last half century and yet, thebenefits of economic growth have not reached the poor as a result of (i) the pattern ofgrowth being biased towards certain programmes and groups and (ii) poor targetingand implementation of pro-poor policies. More seriously, there is also the fact thatthe concept of wealth has not yet entered the consciousness of the policymakers, whoconsequently consider the benefits in terms of increasing production from the naturalresources. This approach not only does not help the poor (or anyone else), but alsomakes them poorer as has been happening in many states already (Salagrama, 2003a,2004b).
This state of affairs also stems from or leads to:
a. Lack of policy coherence. The relationship between three main strands offisheries development debate, i.e., economic growth, natural resourcemanagement and poverty alleviation remains obscure in fisheries policymaking.This leads to conflicting objectives in the policies and, together with the legalpluralism that pertains in the sector, ends up being a bundle of contradictions.
b. Top-down approaches to policymaking and implementation, focusing onincreasing production, enhancing technological efficiency and improving foreignexchange earnings, ignoring the potential costs for the poor and the naturalresources
c. Poor implementation. Lack of vertical (central to state to grassroots level; withinparticular departments like DOF etc.) and horizontal (between different sectoraldepartments; between government, NGOs and private sector).
d. Absence of monitoring, impact assessment and evaluations. Studies about thesocio-economic impacts of the various policies concerning the fisheries sector (orthe projects they have spawned) are either not conducted or are not availablegenerally. The systems for generating such information using a set of indicatorsvalid across a large country like India are non-existent.
e. Changes – mainly in terms of being more inclusive – do happen in someprogrammes (e.g., FAO-supported GOI Disaster Preparedness and MitigationProgramme for Andhra Pradesh – see FAO, 2000), but these are confined to one-off exercises and seldom lead to a permanent change in the institutionalframeworks for policymaking or implementation.
All this translates to the poor in the fisheries sector facing serious problems inpursuing their economic activities and also in taking part in the policymaking andimplementation aspects.Data/research gaps relevant to improved policy-making that need addressing
Need for better information and ‘locating’ fisheries in the national context: There isa need to shift the focus of development and management from commodities topeople and the objectives from introducing new technologies to addressing their real 13 The information contained in this and the following sections is mainly derived from interactionswith institutional stakeholders in fisheries – fisheries officers, scientists, NGOs, industry groups andcommunity organisations, using some of the themes discussed in the Concept Paper.

G-46
needs. Collection and compilation of basic data on the different stakeholders in thesector, their number and socio-economic conditions is an important first step becausethe lack of such data leads to unfocused – or mis-focused – development objectives.Efforts to integrate fisheries in the broader context of the national economy, byundertaking comparative studies with other economic sectors, by focusing on themulti-sectoral orientation of the fishers’ livelihoods (which never entirely depend onfisheries alone) and by understanding the inter-sectoral movements will also benecessary to determine the need for, and the direction of, policy support that isrequired. Developing indicators of poverty specific to the sector – as well as thosethat are relevant across a wider spectrum – is an important area that needs to morework urgently. Approaches to better channel the benefits of economic growth toalleviate poverty (legal and institutional frameworks) and the avenues for the poorfishers to move into in order to reduce pressure on the natural resources and to find asustainable livelihood for themselves are yet to be explored in any detail and needurgent consideration in order to arrive at a ‘win-win’ solution for efficient fisheriesmanagement.
Analytical frameworks to enhance the links between natural resources, economicgrowth and poverty alleviation: Predictive models to assess the impact of changes indifferent parameters in the natural resources as well as the macro-economic scenario(for instance, changes in the international trade regimes) and the possible options(spanning multiple sectors and disciplines and not just confined to biological ortechnical solutions) to overcome the adverse impacts and maximise the good onesare necessary in order to avoid knee-jerk responses to ‘sudden’ crises. An audit of thenatural resources (i.e., fish) in a way that the policymakers can make use of it is anecessity both to ascertain their survival and sustainability and to ensure theircontinued availability to the people through rational fisheries management strategies.Institutional frameworks: The institutional frameworks for planning andimplementing efficient development and management systems, which are holisticallylinked to the socio-economic context in which the fishers live and provide for theparticipation of the poorer stakeholders, need to be explored in conjunction with theprimary stakeholders and developed into a cohesive system of organisation.Improved fisheries development and management regimes, which take cognisance ofthe traditional (community-based) systems and their holistic approach tomanagement, will not only enhance the health of the resources by making the peopleto have a stake in the health of the resources, but also provide use rights to the poorthat they can use in a number of different ways. However, as Kurien (2003:39) notes,restoring community rights does not necessarily lead to proper management forseveral reasons and the role of NGOs as well as the state must play a significant roleto make this happen.
Important areas for policy development in the future with reference to thelinkage between fisheries, economic growth and poverty reduction(Opportunities)
In the context of the multi-species nature of fisheries in India, it is doubtful if quotasystems would be effective as a management measure. Obviously, the best optionlies in effort-reducing measures, such as phasing out the excessive fishing fleet,reducing subsidies for enhancing fishing intensity or efficiency and supporting thefishers to move into alternative income-generating activities. By developing a good

G-47
understanding of the sustainable levels of exploitation for different species and thenworking out the maximum number of vessels in different categories that can beallowed to operate, it is possible to put a cap on the expansion of fishing fleet – whilethe political and economic repercussions of reducing the current size of the fleetmight be too high, it is however possible to stop further increases or replacement ofexisting boats until the size of the fleet comes down to acceptable levels. Once thatstage has been reached, the emphasis can then be on allowing only replacement ofold or damaged boats, so that the exploitation levels remain within limits. A start canbe made by developing reliable databases on the numbers of fishing boats in differentcategories and their economics of operation. Reducing subsidies for adding newboats to the fleet or upgrading existing capacity for harvest is an immediatenecessity. Where applicable and necessary, bans on active fishing gears can beexplored, with the emphasis being on how to implement them effectively and in sucha way that the poor are not ultimately the losers.
An important lesson that one can draw from the experience so far is that fisheriesmanagement cannot be boiled down to one – or even a few – specific instruments orthat the measures cannot be uniform along the entire coast of India. It is not clearhow measures like uniform fishing ban across the coastal states would help the fishduring the breeding period. There is a need to explore and develop a range ofinstruments and implementing such of them as are applicable to a particular areabased upon the local context – in other words, management measures need to belocation-specific and can even vary from place to place, provided they areimplemented effectively, which is possible only by involving the local communitiesin the planning and implementation.
Helping the fishers to move out or to diversify is another area that requires attention.While coastal aquaculture remains an area of uncertainty, there are severalindications that diversification of culture operations to growing alternative speciessuch as sea bass show promise as a viable alternative for the fishers, both in terms ofreducing production hazards and costs as well as in providing them with a readymademarket both domestic and international.
A few other areas for policy-making will involve:a. Raising the profile of natural resource management and poverty alleviation in the
fisheries policymaking, making them as important as (if not more important than)economic growth;
b. Developing strategies for more efficient benefit flows to the poor from theimproved utilisation of the natural resources;
c. Decentralisation of the policymaking process, to better reflect the needs of thepeople (particularly poor) in the development programmes and to improve theperformance of the management regimes;
d. Establishing and nurturing co-management programmes, ensuring the poor andthe vulnerable sections (for e.g., women) a better say in the matters;
e. Addressing the issue of legal pluralism in a practical manner and, to the extentpossible, making the functions of different agencies clear and straightforward;
f. Enforcing fiscal reforms in the sector, but in a way that the poorer producers donot get marginalized as a result;
g. Weeding out ‘effort-enhancing’ and environmentally harmful harvestingtechniques through removal of subsidies, banning destructive fishing gears and

G-48
practices; phasing out and promotion of ‘ecologically sophisticated’ technologies(Kurien, 2003:40).
h. Ensuring access to alternatives to people wherever their current livelihoods arethreatened or marginalized as a result of management measures;
i. Improving infrastructure and transport systems to reduce losses and enhanceaccess to markets
j. Improving social security networks and insurance for the weaker and vulnerablesections
k. Factors likely to impact on the nature and rate of policy development (Threats)Naturally, the lack of political will is an important constraint to improve fisheriesdevelopment/management policies in the sector. The influence of, and lobbying by,vested interests at various levels (including influential groups seeking benefits tothemselves or to avoid the fallout of any potentially adverse legislations), which havebeen entrenched to take advantage of a particular system of development andmanagement can be a serious constraint in attempting a serious/radical restructuringof the policy-objectives.
As the sector suffers from both supply and demand related constraints, its importanceto the national economy might decline, or its demands on the national economymight mount (for instance, to cope with the international pressure on quality control),forcing it into the sidelines of the national agenda and even making it ‘expendable’ inpursuit of more rewarding activities like tourism. When this gets reflected in reducedoutlays, the influence of the government to determine major shifts in the way thingswork can be seriously jeopardized.
Thirdly, the fact that the declines in fisheries sector as well as the processescontributing to them have advanced so far that there is a fear that it might beextremely difficult to set the clock back will mean that a responsible managementsystem will take considerable time to take root. The way the government has allowedpeople to view it – as the sole owner of the resources, as being responsible for alldevelopment in the sector etc. – means that they will continue to look to it both forsupport (in the form of subsidies etc.) as well as to take care of management on itsown (disclaiming their own responsibility). A progressive change in attitudes broughtabout by a range of methods – legislations, awareness raising, incentives – willnecessarily take time.
The legal pluralist context in which the fishers operate – i.e., their life andlivelihoods are influenced by various agencies (government, NGOs, private sector,community-based etc.) – means that a change in one Ministry or Department isunlikely to yield any benefits, and might even be the cause of concern for the otherinterest groups. Bringing them all to share a common vision is not exactly an easytask.

G-49
6. REFERENCES AND ADDITIONAL READING
Published documents:
AAI 2001. Shrimp Aquaculture and the Environment: An Environment Impact AssessmentReport submitted to the Supreme Court of India, Aquaculture Authority of India: Chennai.
ADB/NACA, 1998. Aquaculture sustainability and the environment. Report on a RegionalStudy and Workshop. Bangkok, Thailand: Asian Development Bank and Network ofAquaculture Centres in Asia-Pacific.
Anjani Kumar, P K Joshi & P S Birthal, 2003. Fisheries Sector in India: An Overview ofPerformance, Policies and Programmes, in A Profile of People, Technologies and Policies inFisheries Sector in India (Ed. Anjani Kumar, P K Katiha and PK Joshi), National Centre forAgricultural Economics and Policy Research: New Delhi.
Bavinck, M, 2001. Marine Resource Management: Conflict and Resolution in the Fisheriesof the Coromandel Coast. Sage Publications, New Delhi.
Bhatta 2001. Changing Fish Utilisation and its Impact on the Poor in Karnataka, a scopingstudy prepared under Project R7799: Changing Fish Utilisation and its Impact on Poverty inIndia, funded under DFID’s Post-Harvest Fisheries Research Programme and managed byIMM Ltd., UK
BOBP 1986. Experimental Shrimp Farming in Ponds in Polekurru, Andhra Pradesh, India,BOBP Working Paper 46, Bay of Bengal Programme: Madras
CMFRI, 2003. Status of Exploited Marine Fishery Resources of India, Central MarineFisheries Research Institute.
Datt, R & KPM Sundharam, 2005. Indian Economy (Fifty-First Edition), S Chand &Company Ltd, New Delhi.
Datta KL & Savita Sharma, 2002: Facets of Indian Poverty, Concept Publishing Company:New Delhi.
DOF AP, 1978. Two Decades of Fisheries Development in Andhra Pradesh, Department ofFisheries Andhra Pradesh
DOF Karnataka 1978. Two Decades of Fisheries Development in Karnataka, 1957-77.Department of Fisheries, Karnataka.
FAO 2000. Report of the Government of India/Government of Andhra Pradesh/FAOWorkshop on Measures to Reduce Loss of Life During Cyclones, Visakhapatnam, AndhraPradesh, India, 4-6 March 1999. FAO Fisheries Report No 622, Rome, FAO. 2000.
FFPI 2001. Conservation and Management of Shrimp Resources of the East Coast of India.Forum of Fisheries Professionals of India & Fishery Survey of India, Visakhapatnam
GOI 2000. Handbook on Fisheries Statistics 2000 New Delhi: Government of India Ministryof Agriculture Department of Animal Husbandry and Dairying.
GOI 2001a. Report of the Working Group on Fisheries for the Tenth Five Year Plan,Government of India, Planning Commission: New Delhi

G-50
GOI, 2005: India: A Reference Annual, Publications Division, Government of IndiaGOK 1978. Strategy and Action Programme for a Massive Thrust to Fisheries Developmentand Fishermen’s Welfare in Kerala State (1978-83), prepared by S Krishna Kumar, SpecialSecretary to Government (Fisheries, Ports and Social Welfare), Government of Kerala:Trivandrum
Hosch G & P Flewweling, 2003: East India Country Review (Draft) prepared as part of theState of World Marine Capture Fisheries Management – 2003, Food and AgricultureOrganization of the United Nations
IMM, 2001: Learning Lessons from the Cyclone – DFID’s Support for Post-CycloneLivelihoods Rehabilitation in Orissa, India, Integrated Marine Management Ltd. Exeter, UK.Johnson D, 2001. Wealth and Waste: Contrasting legacies of fisheries development inGujarat since 1950s, Economic and Political Weekly, March 31, 2001.
Johnson, D 2002. Emptying the Sea of Wealth: Globalisation and the Gujarat Fishery, 1950-1999, thesis presented to the Faculty of Graduate Studies of the University of Guelph.
Kamat, 2002. Development Hegemony, Oxford University Press: New Delhi.
Kurien J & A Paul 2000. Nets for Social Safety: An analysis of the growth and changingcomposition of social security programmes in the fisheries sector of Kerala state, India,Samudra Monograph, International Collective in Support of Fishworkers: Chennai.
Kurien J 1980. Social Factors and Economic Organisation of the Traditional Small-scaleFishermen of India, in Social Action Vol. 30 April-June 1980.
Kurien J and Thankappan Achari TR, 1994. Overfishing the Coastal Commons: Causes andConsequences, in Ramachandra Guha (Ed.) Social Ecology, Oxford University Press: Delhi.
Kurien J, 1988. The role of fishermen’s organisations in fisheries management of developingcountries (with particular reference to the Indo-Pacific region), in Studies on the role offishermen’s organisations in fisheries management, FAO Fisheries Technical Paper 300:Rome.
Kurien, J 1985. Technical Assistance Projects and Socio-Economic Change: NorwegianIntervention in Kerala’s Fisheries Development, in Economic and Political Weekly Vol XX,Nos 25 and 26, Review of Agriculture, June 22-29, 1985.
Luther, G & Appanna Sastry, Y.(1993) Occurrence of spawners, juveniles and young fish inrelation to the fishery seasons of some major fishery resources of India - A preliminarystudy, Mar.Fish.Infor.Serv., T&E Ser., No.122: Aug-Sept-1993.
Mathew, S 1991. Study of territorial use rights in Small-scale Fisheries: Traditional Systemsof Fisheries Management in Pulicat Lake, Tamil Nadu, India. FAO Fisheries Circular 839,FAO, 1991.
Mathew, S 2003: Trade in Fisheries and Human Development: Country Case Study – India,for Asia Pacific Regional Initiative on Trade, Economic Governance and HumanDevelopment.
Mathew, S 2004. Socio-economic aspects of management measures aimed at controlling seaturtle mortality: A case study of Orissa, India, for FAO Expert Consultation on “Interactionsbetween sea turtles and fisheries within an ecosystem context”, Rome, 9-12 March 2004.
G-51
Misra, SK & VK Puri, 1999. Indian Economy, Himalaya Publishing House, Mumbai.MPEDA 1984. Report on Fisheries Development in West Bengal. The Marine ProductsExport Development Authority, Cochin.
MPEDA, 2000. Statistics of Marine Products Exports, 2000, The Marine Products ExportDevelopment AuthorityMPEDA, 2001. MPEDA: An Overview, The Marine Products Export DevelopmentAuthority
Nalini Nayak 2002. An Essay on the Fishworkers’ Movement in India, in Aliou Sall,Michael Belliveau and Nalini Nayak: Conversations, ICSF: Chennai.
NIRD, 1998: Database on Rural Poverty Indicators, National Institute of RuralDevelopment, Hyderabad
NIRD, 1999a. India Rural Development Report, 1999: Regional Disparities in Developmentand Poverty, National Institute of Rural Development
NIRD, 1999b. Poverty Decline and Human Development Factors in Some States, NationalInstitute of Rural Development.
NIRD, 2003: Rural Development Statistics, 2002-03, National Institute of RuralDevelopment
NIRD, 2004: Farmer’s Suicides in Andhra Pradesh and Karnataka, National Institute ofRural Development
OTFWU, 2004. Prayer of the Traditional Fishermen for Hearing on Turtle Issues, letterdated 19 February addressed to the Chairman, Central Empowered Committee, Delhi. OrissaTraditional Fishworkers’ Union: Arjipalli.
Parikh, K & R. Radhakrishna, 2002. India Development Report, 2002, Oxford UniversityPress
PBH, 2002: The Indian Economy 2001-2: An Alternative Survey by Delhi Science Forum,Prajasakti Book House
PHFP, Undated. Credit Availability for Marine Artisanal Fisherfolk: Andhra Pradesh andOrissa. Madras: DFID Post-Harvest Fisheries Project.
Prathibha Rohit, Alli C. Gupta & Uma S Bhat (1993) Increased exploitation of juvenile fishpopulation by bull trawlers during the early post-monsoon fishing season of 1992 along theDakshina Kannada coast, Karnataka, Mar.Fish.Infor.Serv., T&E Ser., No.122: Aug-Sept-1993, p 9-12.
Puthra Pravin & Manohardoss, R.C.(1996) Constituents of low value trawl bycatch caughtoff Veraval. Fishery Technology, 1996, Vol. 33(2) pp: 121-123
Sathiadhas, R. 1998 Exploitation, employment, earnings and marketing aspects of marinefisheries in Indian economy, in Advances and Priorities in Fisheries Technology (ed.Balachandran et al) p. 463-472 Society of Fisheries Technologists (India), CochinSchömbucher, Elisabeth (1986). Die Vadabalija in Andhra Pradesh und in Orissa: Aspekteder Wirtschaftlichen und Sozialen Organisation Einer Maritimen Gesellschaft. SteinerVerlag Wiesbaden Gmbh: Stuttgart.

G-52
SIFFS 1991. Motorisation of Fishing Units: Benefits and Burdens. Programme forCommunity Organisation and South Indian Federation of Fishermen Societies: TrivandrumSIFFS 2002. Research Project on Globalisation and Seafood Trade Legislation: The effect onPoverty in India; Final Report for Kerala – a study prepared under Project R7970:Globalisation and Seafood Trade Legislation: The Effect on Poverty in India, funded underDFID’s Post-Harvest Fisheries Research Programme and managed by Natural ResourcesInstitute, United Kingdom
Somvanshi, 2001. An Approach to Adaptive Conservation and Management Measures forShrimp Resources along the East Coast of India, in “Conservation and Management ofShrimp Resources of the East Coast of India” Forum of Fisheries Professionals of India &Fishery Survey of India, Visakhapatnam
Srivastava, UK, BH Dholakia, S. Vathsala and K Chidambaram 1990. Fishery Sector ofIndia, Oxford & IBH Publishing Co Pvt Ltd.
Sujatha, K.1995. Finfish constituents of trawl bycatch off Visakhapatnam, FisheryTechnology, Vol.32(1), pp:56-60
Sujatha, K. 1996. Trash fish catch of the trawl fishery off Visakhapatnam, J.Aqua.Biol.Vol.11 (1&2), 1996: 17-23
Sundaram K and Suresh D Tendulkar. 2003: Poverty in India in the 1990s: An Analysis ofChanges in 15 Major States, in Economic and Political Weekly Vol XXXVIII No 14, April5-11, 2003: 1385-1393
Tharakan, AJ 1998 Seafood industry – reasons for impasse and solutions, in Seafood ExportJournal Vol XXIX, No 1, April 1998
Thomson KT 1989. Political Economy of Fishing: A study of an Indigenous Social Systemin Tamil Nadu, thesis submitted for the award of the degree of Doctor of Philosophy,University of Madras.
Tietze, U. (Ed.) 1985. Artisanal Marine Fisherfolk of Orissa: Study of their technology,economic status, social organisation and cognitive patterns. Vidyapuri, Cuttack
Vivekanandan V 2003: Restructuring Matsyafed: An opinion. Unpublished.
Vivekanandan, V., C.M. Muralidharan, and M. Subbarao. 1998. A Study of Marine Fisheriesof Andhra Pradesh. Draft.
World Bank, 2000. India: Reducing Poverty, Accelerating Development, Oxford UniversityPress
Online resources:CESS, 2002. Poverty Alleviation Programmes in Andhra Pradesh, by S Mahendra Dev and PPadmanabha Rao, sponsored by Planning Commission, Government of India.http://planningcommission.nic.in/
David Brown, L, R Tandon, A Chaudhury and S Synghal, Undated. Public-NGO FinancingInstitutions in India: An Exploratory Study, http://www.jsi.com/idr/web%20reports/html/13-4.html

G-53
Deaton, A & V Kozel, 2005. Data and dogma: the great Indian poverty debate,http://www.wws.princeton.edu/~rpds/downloads/deaton_kozel_datadogma.pdfDeshingkar, P & D Start, 2003. Seasonal Migration for Livelihoods in India: Coping,Accumulation and Exclusion, Working Paper 220, Overseas Development Institute,http://www.odi.org.uk/publications/working_papers/wp220.pdf
DFID, 1999. India: Country Strategy Paper 1999. http://www.dfid.gov.uk/
FAO, 2000a: Fishery Country Profile: The Republic of India,http://www.fao.org/fi/fcp/en/IND/profile.htm
FAO, 2000b: Information on Fisheries Management in the Republic of India,http://www.fao.org/fi/fcp/en/IND/body.htm
Globalis, 2004: India, http://globalis.gvu.unu.edu/country.cfm?country=IN&indicatorid=0
GOI 1996. Handbook on Fisheries Statistics 1996. New Delhi: Government of IndiaMinistry of Agriculture Department of Animal Husbandry and Dairying.GOI, 1956: Second Five-Year Plan, 1956-61, Government of India,http://planningcommission.nic.in/plans/planrel/fiveyr/welcome.html
GOI, 1982: Report of the Expert Group on Programmes for Alleviation of Poverty, PlanningCommission, Government of India,http://planningcommission.nic.in/reports/publications/pub82_povty.pdf
GOI, 1993. Report of the Expert Group on Estimation of Proportion and Number of Poor,Planning Commission, Government of India,http://planningcommission.nic.in/reports/publications/ pub93_nopoors.pdf
GOI, 2001. Report of the Working Group on Fisheries For the Tenth Five Year Plan,Government of India, Planning Commission.http://planningcommission.nic.in/reports/publications/pubbody.htm
GOI, 2002a: Tenth Five Year Plan, 2002-2007,http://planningcommission.nic.in/plans/planrel/fiveyr/welcome.html
GOI, 2002b: National Human Development Report 2001, Planning Commission,Government of India,http://planningcommission.nic.in/reports/genrep/nhdrep/nhdreportf.htm
GOI, 2004: Comprehensive Marine Fishing Policy, November 2004. Government of IndiaMinistry of Agriculture Department of Animal Husbandry and Dairying,http://dahd.nic.in/fishpolicy.htm
Gupta C & M Sharma, 2004. Blurred Borders: Coastal Conflicts Between India andPakistan, in Economic and Political Weekly, July 03, 2004,http://www.epw.org.in/showArticles.php?root=2004&leaf=07&filename=7383&filetype=html
Kumar, P, Mruthyunjaya, Pratap S Birthal, 2003. Changing Consumption Pattern in SouthAsia (PowerPoint presentation), http://www.ficci.com/ficci/media-room/speeches-presentations/2003/nov/nov-agri-kumar-consumption.ppt
Kurien J & A Paul 2000. Nets for Social Safety: An analysis of the growth and changingcomposition of social security programmes in the fisheries sector of Kerala state, India,
G-54
Samudra Monograph, International Collective in Support of Fishworkers: Chennai(http://www.icsf.net/)
Kurien, 2003. The Blessings of the Commons: Small-scale Fisheries, Community PropertyRights, and Coastal Natural Assets, CDS Working Paper no. 349, Centre for DevelopmentStudies, Trivandrum (http://www.cds.edu).
Mathur, AS & AS Sachdeva, 2003. Towards an economic approach to sustainable forestdevelopment, Perspective Planning Division, Planning Commission,http://planningcommission.nic.in/reports/wrkpapers/wrkp_forest.pdf
Sharma, C. 2002. The Impact of Fisheries Development and Globalisation Processes onWomen of Fishing Communities in the Asian Region, in Asia-Pacific Research Network,Journal 8, http://www.aprnet.org/journals/8/v8-2.htm
Tietze, U. (Ed.) 1985. Artisanal Marine Fisherfolk of Orissa: Study of their technology,economic status, social organisation and cognitive patterns. Vidyapuri, Cuttack(http://www.bobpigo.org/index1.htm)UNDP, 2004: Human Development Report, 2004, Country Fact Sheets: India,http://hdr.undp.org/statistics/data/country_fact_sheets/cty_fs_IND.html &http://hdr.undp.org/statistics/data/cty/cty_f_IND.html
Vivekanandan, E 2002. Marine Fisheries and Fish Biodiversity in India, fromhttp://sdnp.delhi.nic.in/nbsap/themes/naturalaqua/biodiversityhtms.html
World Bank (2004a): The World Bank in India: Country Brief, September 2004.http://siteresources.worldbank.org/INTINDIA/Resources/IN05.pdf
World Bank (2004b): India Data Profile,Http://devdata.worldbank.org/external/CPProfile.asp?SelectedCountry=IND&CCODE=IND&CNAME=India&PTYPE=CP
Journals and periodicals• Economic and Political Weekly• Journal of Rural Development• Kurukshetra• Yojana
ICM Reports:Salagrama, V. 1999 Bycatch Utilisation in Indian Fisheries: An Overview. In Clucas, I. &Teutscher, F. (Ed.) Report and Proceedings of FAO/DFID Expert Consultation on BycatchUtilisation in Tropical Fisheries, Beijing, China, 21-23 September 1998.
Salagrama V 2002. UAA-ActionAid Integrated Development Project for Coastal FishingCommunities of Orissa, 1993-2003: Report of the review of project activities, IntegratedCoastal Management: Kakinada
Salagrama V 2003a. Poverty, Food Insecurity and Vulnerability in Coastal FishingCommunities of Orissa, developed as part of the FNPP-SIFAR (FAO) Project on ‘Assessingthe Vulnerability of Poor Coastal Communities to Food Insecurity and Poverty’, Draft(November 2003); Integrated Coastal Management: Kakinada

G-55
Salagrama V 2003b. Traditional Community-Based Management Systems in Two FishingVillages in East Godavari District of Andhra Pradesh. Case study for SIFAR/World Bankfunded project, “Study of Good Management Practice for Sustainable Fisheries”, IntegratedCoastal Management: Kakinada
Salagrama V 2003c. A study of AFCOF Schemes in Three Fishing Villages inVisakhapatnam District, Andhra Pradesh, undertaken for the Andhra Pradesh StateFishermen’s Cooperative Societies Federation Ltd (AFCOF), Integrated CoastalManagement: Kakinada
Salagrama V 2004a: A study of market supply chains in fisheries in the southern districts ofOrissa, study done for Oxfam (GB), Bhubaneswar. Integrated Coastal Management:Kakinada
Salagrama V 2004b: Policy Research: Implications of Liberalisation of Fish Trade forDeveloping Countries – A case study for India, Project PR 26109, Food and AgricultureOrganization of the United Nations, 2004.
Salagrama V 2004c: Migration of Fishermen from Srikakulam District in Andhra Pradesh,study conducted by ICM/SIFFS, First Draft August 2004. ICM/SIFFS, Kakinada.

G-56
7. ANNEXURES
Annexure 1: Selected Human Development Indicators for IndiaSource: http://hdr.undp.org/statistics/data/cty/cty_f_IND.html
HDI Rank: 127Human development indexLife expectancy at birth (years) (HDI), 2002 63.7Adult literacy rate (% ages 15 and above) (HDI), 2002 61.3Combined gross enrolment ratio for primary, secondary and tertiary schools (%), 2001/02 55GDP per capita (PPP US$) (HDI), 2002 2,670Life expectancy index 0.64Education index 0.59GDP index 0.55Human development index (HDI) value, 2002 0.595GDP per capita (PPP US$) rank minus HDI rank - 10Human development index trendsHuman development index, 1975 0.411Human development index, 1980 0.437Human development index, 1985 0.476Human development index, 1990 0.514Human development index, 1995 0.548Human development index, 2000 0.579Human development index, 2002 0.595Human and income poverty: Developing countriesHuman poverty index (HPI-1) Rank 48Human Poverty Index (HPI-1) Value (%) 31.4Probability at birth of not surviving to age 40 (% of cohort), 2000-05 15.3Adult illiteracy rate (% ages 15 and above), 2002 38.7Population without sustainable access to an improved water source (%), 2000 16Children underweight for age (% under age 5) (HPI-1), 1995-2002 47Population living below $1 a day (%), 1990-2002 34.7Population living below $2 a day (%), 1990-2002 79.9Population living below the national poverty line (%), 1990-2001 28.6HPI-1 rank minus income poverty rank - 12
Demographic trendsTotal population (millions), 1975 620.7Total population (millions), 2002 1,049.5Total population (millions), 2015 1,246.4Annual population growth rate (%), 1975-2002 1.9Annual population growth rate (%), 2002-2015 1.3Urban population (% of total), 1975 21.3Urban population (% of total), 2002 28.1Urban population (% of total), 2015 32.2Population under age 15 (% of total), 2002 33.3Population under age 15 (% of total), 2015 27.7Population age 65 and above (% of total), 2002 5.1Population age 65 and above (% of total), 2015 6.3Total fertility rate (births per woman), 1970-75 5.4Total fertility rate (births per woman), 2000-05 3.0Commitment to health: resources, access and servicesPublic health expenditure (% of GDP), 2001 0.9Private health expenditure (% of GDP), 2001 4.2Health expenditure per capita (PPP US$), 2001 80One-year-olds fully immunized against tuberculosis (%), 2002 81One-year-olds fully immunized against measles (%), 2002 67Oral rehydration therapy use rate (%), 1994-2002 ..Contraceptive prevalence rate (%), 1995-2002 48 5Births attended by skilled health personnel (%), 1995-2002 43Physicians (per 100,000 people), 1990-2003 51Population with sustainable access to affordable essential drugs (%), 1999 0-49Water, sanitation and nutritional statusPopulation with sustainable access to improved sanitation (%), 1990 16Population with sustainable access to improved sanitation (%), 2000 28Population with sustainable access to an improved water source (%), 1990 68Population with sustainable access to an improved water source (%), 2000 84

G-57
Undernourished people (% of total population), 1990/92 25Undernourished people (% of total population), 1999/2001 21Children underweight for age (% under age 5), 1995-2002 47Children under height for age (% under age 5), 1995-2002 46Infants with low birthweight (%), 1998-2002 30Leading global health crises and risksHIV prevalence (% ages 15-49), 2003 [0.4 - 1.3]Malaria cases (per 100,000 people), 2000 7Tuberculosis cases (per 100,000 people), 2002 344Prevalence of smoking (% of adults), women, 2000 3Prevalence of smoking (% of adults), men, 2000 29Survival: progress and setbacksLife expectancy at birth (years), 1970-75 50.3Life expectancy at birth (years), 2000-05 63.9Infant mortality rate (per 1,000 live births), 1970 127Infant mortality rate (per 1,000 live births), 2002 67Under-five mortality rate (per 1,000 live births), 1970 202Under-five mortality rate (per 1,000 live births), 2002 93Probability at birth of surviving to age 65, female (% of cohort), 2000-05 67.5Probability at birth of surviving to age 65, male (% of cohort), 2000-05 61.9Maternal mortality ratio reported (per 100,000 live births), 1985-2002 540Maternal mortality ratio adjusted (per 100,000 live births), 2000 540Commitment to education: public spendingPublic expenditure on education (as % of GDP), 1990 3.9Public expenditure on education (as % of GDP), 1999-2001 4.1Public expenditure on education (as % of total government expenditure), 1990 12.2Public expenditure on education (as % of total government expenditure), 1999-2001 12.7Public expenditure on education, pre-primary and primary (as % of all levels), 1990 38.9Public expenditure on education, pre-primary and primary (as % of all levels), 1999-2001 38.4Public expenditure on education, secondary (% of all levels), 1990 27.0Public expenditure on education, secondary (% of all levels), 1999-2001 40.1Public expenditure on education, tertiary (% of all levels), 1990 14.9Public expenditure on education, tertiary (% of all levels), 1999-2001 20.3Literacy and enrolmentAdult literacy rate (% ages 15 and above), 1990 49.3Adult literacy rate (% ages 15 and above), 2002 61.3Youth literacy rate (% ages 15-24), 1990 64.3Net primary enrolment ratio (%), 2001/02 83Children reaching grade 5 (%), 2000/01 59Tertiary students in science, math and engineering (% of all tertiary students), 1994-97 25Economic performanceGDP (US$ billions), 2002 510.2GDP (PPP US$ billions), 2002 2,799.6GDP per capita (US$), 2002 487GDP per capita (PPP US$), 2002 2,670GDP per capita annual growth rate (%), 1975-2002 3.3GDP per capita annual growth rate (%), 1990-2002 4.0GDP per capita, highest value (PPP US$), 1975-2002 2,670GDP per capita, year of highest value 2002Average annual change in consumer price index (%), 1990-2002 8.3Average annual change in consumer price index (%), 2001-02 4.4Inequality in income or consumptionSurvey Year 1999/2000Share of income or consumption (%) - Poorest 10% 3.9Share of income or consumption (%) - Poorest 20% 8.9Share of income or consumption (%) - Richest 20% 41.6Share of income or consumption (%) - Richest 10% 27.4Inequality measures - Ratio of richest 10% to poorest 10% 7.0Inequality measures - Ratio of richest 20% to poorest 20% 4.7Inequality measures - Gini index 32.5Priorities in public spendingPublic expenditure on education (% of GDP), 1990 3.9Public expenditure on education (% of GDP), 1999-2001 4.1Public expenditure on health (% of GDP), 1990 0.9Public expenditure on health (% of GDP), 2001 0.9Military expenditure (% of GDP), 1990 2.7Military expenditure (% of GDP), 2002 2.3

G-58
Total debt service (% of GDP), 1990 2.6Total debt service (% of GDP), 2002 2.6Energy and the environmentTraditional fuel consumption (% of total energy requirements), 2001 24.3Electricity consumption per capita (kilowatt-hours), 1980 173Electricity consumption per capita (kilowatt-hours), 2001 561GDP per unit of energy use (1995 PPP US$ per kg of oil equivalent), 1980 3.1GDP per unit of energy use (1995 PPP US$ per kg of oil equivalent), 2001 4.4Carbon dioxide emissions - Per capita (metric tons), 1980 0.5Carbon dioxide emissions - Per capita (metric tons), 2000 1.1Carbon dioxide emissions - Share of world total (%), 2000 4.4Gender-related development indexGender-related development index (GDI) rank, 2002 103Gender-related development index (GDI) value, 2002 0.572Life expectancy at birth, female (years), 2002 64.4Life expectancy at birth, male (years), 2002 63.1Adult literacy rate, female (% ages 15 and above), 2002 46.4Adult literacy rate, male (% ages 15 and above), 2002 69.0Combined gross enrolment ratio for primary, secondary and tertiary level schools, female (%) ,2001/02 48Combined gross enrolment ratio for primary, secondary and tertiary level schools, male (%) ,2001/02 62Estimated earned income, female (PPP US$), 2002 1,442Estimated earned income, male (PPP US$), 2002 3,820HDI rank minus GDI rank, 2002 - 1Gender inequality in educationFemale primary net enrolment ratio (%), 2000/01 76Primary net enrolment ratio (female as % of male), 2000/01 0.83Female tertiary gross enrolment ratio (%), 2000/01 9Tertiary gross enrolment ratio (female rate as % of male rate), 2000/01 0.68Gender inequality in economic activityFemale economic activity rate (% ages 15 and above), 2002 42.4Female economic activity rate (index, 1990=100, ages 15 and above), 2002 105Female economic activity rate (% of male rate, ages 15 and above), 2002 50

G-59
Annexure 2: Millennium Development Goals for IndiaSource:http://devdata.worldbank.org/idg/IDGProfile.asp?CCODE=IND&CNAME=India&SelectedCountry=IND
����������������
������ ���� ���������� ����������2015 target = halve 1990 $1 a day poverty and malnutrition rates
Population below $1 a day (%)��
��
����
��
Poverty gap at $1 a day (%)����
���
��
Percentage share of income or consumption held by poorest 20%��
��
��
��
Prevalence of child malnutrition (% of children under 5)��
����
���
��
Population below minimum level of dietary energy consumption (%)����
� ��
� ��
��
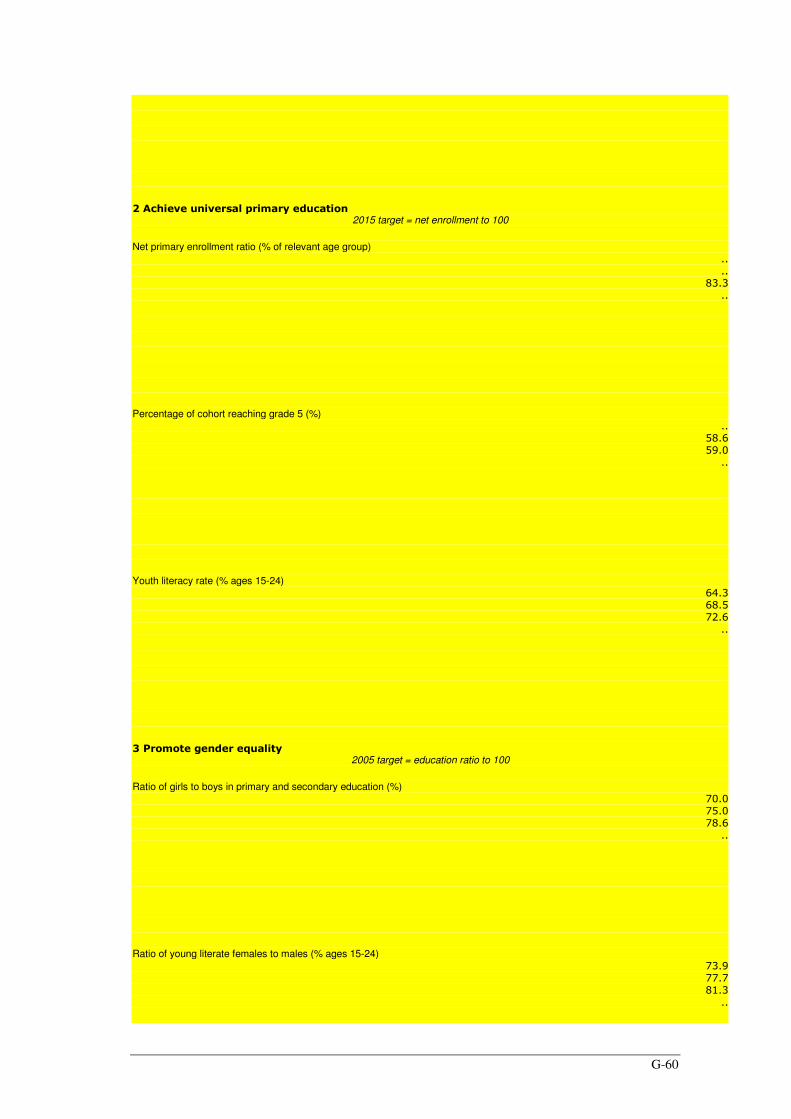
G-60
����������������������������� ���2015 target = net enrollment to 100
Net primary enrollment ratio (% of relevant age group)��
��
����
��
Percentage of cohort reaching grade 5 (%)��
���
���
��
Youth literacy rate (% ages 15-24)���
���
���
��
������� ������������� �2005 target = education ratio to 100
Ratio of girls to boys in primary and secondary education (%)����
����
���
��
Ratio of young literate females to males (% ages 15-24)���
����
� ��
��

G-61
Share of women employed in the nonagricultural sector (%) ���
���
��
��
Proportion of seats held by women in national parliament (%)��
���
��
��
�� ������������� �� �2015 target = reduce 1990 under 5 mortality by two-thirds
Under 5 mortality rate (per 1,000) ����
����
���
���
Infant mortality rate (per 1,000 live births)����
����
���
���
Immunization, measles (% of children under 12 months)���
����
���
���

G-62
��!�������� �������� �2015 target = reduce 1990 maternal mortality by three-fourths
Maternal mortality ratio (modeled estimate, per 100,000 live births)��
��
�����
��
Births attended by skilled health staff (% of total)��
����
����
��
"�#��$ �%!&'�!()*��������� ����������2015 target = halt, and begin to reverse, AIDS, etc.
Prevalence of HIV, female (% ages 15-24)��
�����
��
Contraceptive prevalence rate (% of women ages 15-49)���
����
� ��
��
Number of children orphaned by HIV/AIDS����
��
��

G-63
Incidence of tuberculosis (per 100,000 people)��
��
����
���
Tuberculosis cases detected under DOTS (%)��
��
����
� �
+������������������ ����� ��$��� �2015 target = various (see notes)
Forest area (% of total land area)� ��
��
� �
��
Nationally protected areas (% of total land area)��
������
���
GDP per unit of energy use (PPP $ per kg oil equivalent)���
��
���
��
CO2 emissions (metric tons per capita)���

G-64
��
�
��
Access to an improved water source (% of population)���
��
����
��
Access to improved sanitation (% of population) ��
��
����
��
Access to secure tenure (% of population)��
��
��
��
,�(��������-��$���� ��������.���(��������� 2015 target = various (see notes)
Youth unemployment rate (% of total labor force ages 15-24)��
����
��
Fixed line and mobile telephones (per 1,000 people)��
���
����
� �
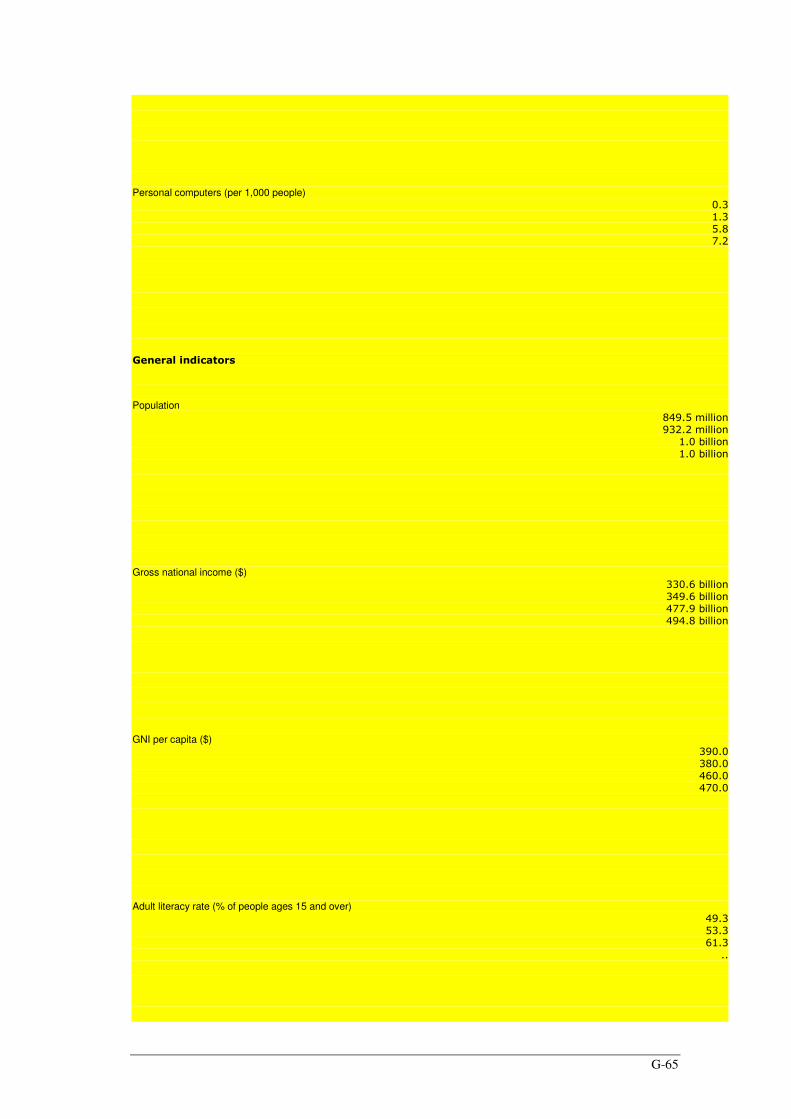
G-65
Personal computers (per 1,000 people)���
��
���
���
-���������� ���
Population������������
������������
����������
����������
Gross national income ($)������������
�����������
������������
������������
GNI per capita ($)����
�����
����
�����
Adult literacy rate (% of people ages 15 and over)���
����
��
��

G-66
Total fertility rate (births per woman)���
���
��
��
Life expectancy at birth (years)��
��
��
���
Aid (% of GNI)���
���
���
���
External debt (% of GNI)���
��
����
���
Investment (% of GDP)���
���
����
����
Trade (% of GDP) ���
����

G-67
���
����
)�����/��������������� ������� ������ ����������������
0� �/�In some cases the data are for earlier or later years than those stated.
-����� ��� �/ Halve, between 1990 and 2015, the proportion of people whose income is less than one dollar a day. Halve,between 1990 and 2015, the proportion of people who suffer from hunger.
-����� ��� / Ensure that, by 2015, children everywhere, boys and girls alike, will be able to complete a full course ofprimary schooling.
-����� ��� / Eliminate gender disparity in primary and secondary education preferably by 2005 and to all levels ofeducation no later than 2015.
-����� ��� / Reduce by two-thirds, between 1990 and 2015, the under-five mortality rate.
-����� ��� / Reduce by three-quarters, between 1990 and 2015, the maternal mortality ratio.
-���"� ��� �/ Have halted by 2015, and begun to reverse, the spread of HIV/AIDS. Have halted by 2015, and begun toreverse, the incidence of malaria and other major diseases.
-���+� ��� �/ Integrate the principles of sustainable development into country policies and programs and reverse theloss of environmental resources. Halve, by 2015, the proportion of people without sustainable access to safe drinking water.By 2020, to have achieved a significant improvement in the lives of at least 100 million slum dwellers.
-���,� ��� �/ Develop further an open, rule-based, predictable, non-discriminatory trading and financial system. Addressthe Special Needs of the Least Developed Countries. Address the Special Needs of landlocked countries and small islanddeveloping states. Deal comprehensively with the debt problems of developing countries through national and internationalmeasures in order to make debt sustainable in the long term. In cooperation with developing countries, develop andimplement strategies for decent and productive work for youth. In cooperation with pharmaceutical companies, provideaccess to affordable, essential drugs in developing countries. In cooperation with the private sector, make available thebenefits of new technologies, especially information and communications.

G-68
Annexure 3: Distribution of marine fishery resources in India
State/UnionTerritory
Approx lengthof coastline
(km)
Continentalshelf (‘000 km)
No oflandingcentres
No of fishingvillages
Andhra Pradesh 974 33 508 508
Goa 104 10 88 72
Gujarat 1600 184 286 851
Karnataka 300 27 29 221
Kerala (P) 590 40 226 222
Maharashtra 720 112 184 395
Orissa 480 26 63 329
Tamil Nadu 1076 41 362 556
West Bengal 158 17 47 652
A & N Islands 1912 35 57 45
Daman and Diu(P)
27 - 7 31
Lakshadweep (P) 132 4 11 10
Pondicherry 45 1 28 45
Total 8118 530 1896 3937
P – Provisional Source: GOI (2000: 121).
Annexure 4: Fish production in India 1950-51 to 1999-2000 (from GOI 2000)
Fish production in India 1950-51 to 1999-2000 (in '000 MT) (GOI, 2000:5)
0
5
10
15
20
25
30
35
1950
-51
1960
-61
1970
-71
1978
-79
1980
-81
1982
-83
1984
-85
1986
-87
1988
-89
1990
-91
1992
-93
1994
-95
1996
-97
1998
-99
Hun
dred
s
Marine
Inland