investigating the linkages between fisheries, poverty and growth: thailand case study
Upload: water-food-and-livelihoods-in-river-basins-basin-focal-projects
Post on 18-May-2015
1.166 views
DESCRIPTION
A report prepared for the Department for international development (DFID) Project: “the role of fisheries in poverty alleviation and growth: past, present and future” 2005TRANSCRIPT

APPENDIX L
Thailand Case Study

INVESTIGATING THE LINKAGESBETWEEN FISHERIES, POVERTYAND GROWTH:
THAILAND CASE STUDY REPORT
A report prepared for the
Department for international development (DFID)Project: “the role of fisheries in poverty alleviation andgrowth: past, present and future”
23 May 2005

L-2
STUDY TEAM
Ruangrai TokrisnaRef: AGO213C/AoC/TOKRISNA
L-3
SUMMARY
Thai government had included poverty eradication as one of the main nine nationalpolicies. 13.47% of the 63.7 people lived in the Southern Region where there werelong coastlines where mainly dwelled by Thai fishermen. Recent population growthwas 0.66% a year. 1.75% of the total GDP (US$151.3 billion) came from fishingsector, with a decreasing trend through the years.
“Poor people” were those below poverty line of US$31.4/month. There were 0.7million poor people in the South, with a headcount ration of 8.3. Factors affectingpoverty were divided into two groups, per individual and per structure. Per individualincluded lack of agricultural land and capital asset, indebtedness, low education, lackof occupational skill, lack of information on occupation, materialism preference,large family relatively to income earning capacity, and health problem. Pre structureincluded lack of effective natural resource management, inequitable development infavor for manufacturing sector, negative impact from open economy, legislativesystem, lack of effective collaboration among government agencies and in spatialdevelopment, and lack of effective budget allocation for poverty eradication.Government strategies on poverty eradication were potential development for urbanand rural poor, social protection and safety net, macroeconomic policies, naturalresource management and legislative reform, and streamlining public administrationfor poverty eradication. Government objectives were to increase the opportunity,generate income, and reduce non-productive consumption expenditure among thepoor.
Fishery abundance in Thai waters had been degraded. Marine capture growth wasslower down. Important increase in fishing sector came mainly from development inshrimp culture, a main source of foreign exchange earning. Trawlers were the mainfishing gears while main catches from trawls were trash fish for fish meal. Smallscale fishermen accounted for about 80% of total fishing population while their catchcontributed around 20%. Main fishing gear for small scale fishermen were drift gillnets. Net return for an average small scale fishing family of five persons wasUS$1,827/hh/yr.
There were over fishing in Thai waters. Nevertheless limited effort had been oncontrolling fishing effort. Ineffective control was due to limited capacity on effectivemonitoring and enforcement. This over fishing was burden on small scale coastalfishermen. Attempts had been on development of community-based fisheriesmanagement and co-management. There were needs for legislation in support andcapable community organization for this management regime.
For poverty eradication, too little attention had been on the coastal poor. Futurepoverty eradication policy in fishing sector could be capacity strengthening infisheries management, post harvest handling, value added processing, and marketingon the basis of pro-poor development strategies. Constraints on lack of coordinationamong relevant agencies, budget, human resource capacity, and marketing skillshould be alleviated.
L-4
ACRONYMS and ABBREVIATIONS
OTOP One Tambon (village) One ProductSML Small Medium LargeSPV Special Purpose VehiclesGDP Gross Domestic ProductNESDB National Social and Economic Development BoardGNP Gross National Productkg kilogramhh householdR&D Research and DevelopmentCBFM Community-based Fishery ManagementNGO Non Government OrganizationCOD Community Organization DevelopmentDANCED Danish Consortium on Environment and Development
L-5
CONTENTS
PAGE1. BACKGROUND 6 1.1 HISTORY, STRUCTURE AND NATURE OF
GOVERNMENT AND NATIONAL POLITICS6
1.2 POPULATION 7 1.3 ECONOMIC STRUCTURE 8 1.4 INDICATORS OF NATIONAL CHARACTEISTICS 92. POVERTY 9 2.1 DEFINITION OF POVERTY IN THAILAND 9 2.2 FACTORS AFFECTING POVERTY 10 2.3 POVERTY REDUCTION STRATEGIES 113. ECONOMIC GROWTH 14 3.1 GROSS DOMESTIC PRODUCT 14 3.2 FISHING SECTOR 214. FISHERIES DEVELOPMENT AND MANAGEMENT 23 4.1 FISHERIES EXPLOITATION 23 4.2 WEALTH-RELATED BENEFITS 295. POLICY MAKING 30 5.1 POVERTY ISSUES 30 5.2 POVERTY AND THE FISHING SECTOR 33REFERENCES 36TABLES 38-73

L-6
LIST OF TABLESPAGE
Gross Domestic Product at Current Market Prices by Economic Activities,1995 - 2002
14
Share of Economic Sector in GDP at current market prices, 1995 - 2002 15Annual GDP Growth rate, 1996 - 2002 (%) 15GDP at Current Market Price by Economic Activities 1995 - 2002 16Table 1 Thai Population, 1980 - 2003 38Table 2 Population Migration in Thailand, 2003 40Table 3 Thailand’s Key Economic Indicators 41Table 4 Gross Domestic product by Sector, Thailand 2000 - 2003 42Table 5 Growth Rate of GDP by Sector, Thailand 2000 - 2003 43Table 6 Thailand Political Development Indicators 44Table 7 Thailand Social Development Indicators 46Table 8 Thailand Economic Development Indicators 48Table 9 Thailand Human Development Indicators 49Table 10 Poverty line, Thailand by Region and Area 1996 - 2004 58Table 11 People in Poverty, Thailand by Region and Area 1996 - 2004 58Table 12 Head-count Ratio, Thailand by Region and Area 1996 - 2004 59Table 13 Thai Export Volume and Value, 2001 - 2004 60Table 14 Share and Growth Rate of Thai Export, 2001 - 2004 61Table 15 Quantity and value of Production from Fishing Sector by Type ofProduction, 1981 - 2000
62
Table 16 Share of Fisheries Production, 1981 - 2000 63Table 17 Marine Capture by Type of Operation, 1981 - 2000 64Table 18 Marine Catches by Species and Fishing Ground, 2000 65Table 19 Marine Catches by Type of Fishing Gear and Fishing Ground,2000
66
Table 20 Number of Registered Fishing Vessels by Size and Type of Gear 67Table 21 Share of Registered Fishing Vessels by Size and Type of Gear 68Table 22 Marine Fishery Households by Type of Operation, 1995 and 2000 69Table 23 Marine Fishery Households by Type of Operation, 1995 and 2000 69Table 24 Number of Fishermen in Peal Season by Area aand Origin ofFishermen, 2000
70
Table 25 Wage rate in Fishing Sector, 1996 - 2003 71Table 26 Fish Processing Plants by type of Processing and Region 71Table 27 Utilization of Marine Catches by Type of Processing 72Table 28 Cost and Returns from Small Scale fisheries 72Table 29 Source of Income of Small Scale Fisheries 73

L-7

L-8
1. BACKGROUND
1.1. History, structure and nature of government and national politics
Figure 1 Map of Thailand
Source: http://www.fao.org/fi/fcp/en/THA/profile.htm
Thai Kingdom was established in the mid-14th century, governed by absolutemonarchy until 1932 when turned into constitutional monarchy. His Majesty KingBhumibhol is the Head of the State. The official state administration rests on thegovernment headed by the Prime Minister. There is the Parliament and bureaucraticsystem from the capital city down to the village level. Legislative power is vestedwith the Parliament, through the elected House of Representatives and the electedSenate. The parliament approves all legislative matters, to be signed by the Kingbefore becoming the Thai Law.
Thai Rak Thai Party, led by Thanksin Shinawatra, won the election in February2005. Thanksin Shinawatra became the Prime Minister for the second time. Indelivering the national policy to the Parliament in March, he stated that “…The nextfour years will be four years that transform Thailand into a secure and sustainablenation in every respect. The Government will provide the opportunities for the futureand lay solid foundations for the economy, society and politics by focusing onstrengthening the local people, replenishing the fertility of soil and water resourcesand restoring the power of decision to the community. The Government will alsoemphasize the restructuring of the economy and society to become more balanced,immunizing the economic system and reforming the education system with the aim ofdeveloping Thailand as a society with knowledge-based economy according to His
Thailand is located in the central onSoutheast Asia, bordered by Laos tothe northeast, Cambodia to thesoutheast, Malaysia to the south, andMyanmar to the northwest.
There were long coastlines along thelower eastern region and thesoutheast, surrounded by the Gulf ofThailand. On the southwest, there isAndaman Sea. Totally, coastlineswere 2,624 km. long. in total. Coastalfishing villages are located alongthese coastlines.
Recently the coastal development inthe East (Laem Chabang, Si Rachaand Sattahip) and the South (Phuket,Surat Thani, Songkhla, Pattani) hasturned parts of these coastal areas toindustrial areas (Figure 1).

L-9
Majesty the King’s concept of a Sufficiency Economy. These efforts will leadThailand to become a country with balanced, prosperous, secure and sustainablestructures. ..”.
To achieve such statement goal, there are nine main policies covering 1) povertyeradication, 2) human development and quality of life, 3) economic restructuring tocreate equilibrium and competitiveness, 4) natural resources and environment, 5)foreign policy and international economics, 6) development of the legal system andgood governance, 7) democracy and civil society process promotion, 8) nationalsecurity, and 9) directive principles of fundamental state policies.
For poverty eradication, at the grass root level asset capitalization is the mean forcapital access. Cooperative systems are to be promoted. The government will providemobile units “Poverty Eradication Caravan” giving advices and services forprofessional development and training. At the community level local community willbe strengthened. Agricultural infrastructure will be developed. Marketing system forthe “One Tambon (village) One Product (OTOP)” will be improved. Budget will beallocated under “Small Medium Large (SML) Scheme to enable the community inalleviating their poverty problems. At the national level the government willfacilitate sufficient land ownership and increase efficiency in water resourcemanagement. “Special Purpose Vehicles (SPV)” will be established for production,processing, marketing, and access to capital funds in order to reduce farmers’ risk.The emphasis is on farming sector.
1.2. Population
Thai population was 63.7 million in 2003, 49.08% male and 50.92% female. Averageannual growth rate during 1980 – 2003 was 1.28%. The growth rate was higher in theearlier years and decreased to be more stable recently. In 1980s the growth rate was1.97% and decreased to 1.03% in 1990s. Recently during 2000 - 2003 populationgrowth rate was 0.66% a year (Table 1). Average population density was 123persons/sq km.
Of this total population, 9.27% lived in Bangkok. 34.34% lived in the NortheasternRegion, 23.76% in the Central, 19.16% in the Northern, while only 13.47% lived inthe South. Coastal provinces are mostly located in the South along the Gulf ofThailand on the east and the Andaman Sea on the west. Among the four Regions,area of the Southern is the smallest (70,715 sq km). In term of population density,population was crowded in, the capital city, Bangkok (3,734 persons/sq km)followed by the Central Region (146 persons/sq km) and the Northeastern (128persons/sq km). Population density in the Southern Region came in the third, 120persons/sq km. The lowest density was the mountainous Northern Region (71persons/sq km).
Immigration in to the coastal Southern Region was 0.68% of total population, lowerthan the immigration in the Northeastern (2.70%), Central (1.43%), and the Northern(1.18%). The immigration was least in Bangkok (0.46%). Immigration in theSouthern Region was mostly among southern provinces (0.53%), the rest were fromBangkok, Central Region, Northeastern, Northern, and foreign countries accordingly.Out migration from the south was 0.81%, thus there were more people moving out of
L-10
the Southern provinces. Reasons for immigration into the coastal Southern Regionwere following the family to settle down there (0.25%), moving back to hometown(0.10%), settling down (0.07%), looking for new occupation (0.06%), studying(0.05%), being assigned to work there (0.05%), changing occupation (0.02%),getting higher income (0.02%), working for family business (0.02%), taking care ofor being taken care of (0.02%), getting medical care (0.01%), and other reasons(0.02%) . (Table 2)
Coastal area in Thailand was divided into five zones. Zone I is located along thecoastlines in the East (Trat, Chantaburi and Rayong), Zone 2 covers the coastlinesalong the inner Gulf of Thailand (Chonburi, Chacheongsao, Samutprakarn,Samutsakorn, Samutsongkhram, and Petchburi), Zone 3 covers the Gulf coastlines inthe upper South (Prachuapkhirikhan, Chumporn and Suratthani), Zone 4 covers theGulf coastlines in the lower South (Nakhonsithammarat, Songkhla, Pattani andNaratiwat), and Zone 5 covers coastlines along Andaman Sea (Ranong, Phangnga,Phuket, Krabi, Trang and Satun). Large coastal cites with population of over amillion are Nakhonsithammarat, Songkhla, Chonburi and Samutprakarn.
1.3. Economic Structure
GDP in 2003 was 5,930.4 billion baht (= US$ 151.3 billion) of which 10.03% wasfrom agriculture, other 89.97% was from non-agricultural sector, mainlymanufacturing (34.74%) and wholesale and retail trade including repair of vehiclesand household goods (15.42%). Fishing sector shared only 1.75% of the GDP, with adecreasing share through the years while other agriculture share still increased being8.28% of the GDP in 2003 (Tables 3 and 4)
GDP growth rate was as high as 6.16% in 2000, decreased to 4.28% in 2001 andincreased again to be 6.09% in 2002 and to 8.89% in 2003. GDP growth rate inagricultural sector increased rapidly from 2.00% in 2000 to be 15.96% in 2003.Nevertheless these increases were from the non-fishing sector. For fishery, the GDPgrowth rate which was 13.82% in 2000 decreased to be -5.86% in 2001, -4.42% in2002, and -1.89% in 2003. Non-agriculture GDP growth was lower than agricultureGDP growth rate since 2001 being 4.16%, 5.75%, and 8.16% accordingly.(Table 5)
Unemployment rate in 1999 was 5.2% in February, 5.3% in May, 3.0% in August,and 3.3% in November and tended to decrease in 2000 to be 4.3%, 4.1%, 2.4% and3.7% accordingly.1
Balance of payments was surplus being US$5.7 billions in 2003, It was preliminaryestimated to be the so in 20042. Trade balance had a surplus of US$1.7 billions beinglower than in 2000 – 2003. (Details are in Table 3.)
1.4. Indicators of National Characteristics
1 Labor Force Survey 1999 – 2000 Labor Force Survey 1999 – 2000, National Statistical Office.2 Bank of Thailand

L-11
Indicators of national characteristics and development status are given in Table 6 – 9(political, social, economic, and human development indicators).
2. POVERTY
2.1. Definition of Poverty in Thailand
“Poor people” are those below the poverty line. The poverty line was constructed onthe basis of food and minimum basic consumption requirements of each familymember. Such requirements are varied by age, sex, and spatial price difference. Thusthe “poor” means one with insufficient income to pay for these minimumrequirements.
On the average the poverty line as estimated by the National Social and EconomicDevelopment Board (NESDB) was 1,230 baht/person/month (approximatelyUS$31.4 at the exchange rate 39.2 baht/US$) in 2004, an increasing trend from 953baht/person/month in 1996. There were 7.5 million poor people whose incomes werebelow this poverty line, a decreasing from 9.8 million in 1996. The head-count ratiodecreased from 17.0 in 1996 to 12.0 in 2004. (Table 10 – 12)
The poverty line was higher in urban area. Urban poverty line in 2004 was 1,466baht/person/month (US$37.4) while it was 1,119 baht/person/month (US$28.5) inrural area. In urban area there were 1.0 million poor people while the other 6.5million lived in rural area. Head-count ratios were 4.8 in urban area and 13.4 in ruralarea.
By region, there was only in the Central Region, not including Bangkok the capitalcity, which the poverty line was above the country average (1,305 baht/person/monthcompared to 1,230). Number of poor people was highest in the Northeast (3.8million, 45.33% of the total poor). Most of these were those in the rural Northeast(3.4 million). Low income from agricultural sector was the reason for being poor.The Northeast region has been considered a least fertile region with lowestagricultural yield due to relatively low soil fertility, drought, and lack of effectiveirrigation system. Nevertheless the head-count ratio in the Northeast (17.9) wassecond to the North (18.5). 3
The poverty line in the South, the coastal areas where most of the fishing villageswere located, was 1,190 baht/person/month, higher than in the Northeast (1,071baht/person/month) Thailand and slightly higher than the North (1,148baht/person/month) but lower than the Central and the country average.
There were 0.7 million poor people (9.33% of the total poor) in the South of which0.1 million lived in urban area and the other 0.6 million in rural area. Compared tothe other region, not including Bangkok, number of the poor was least in the South. 3 NESDB reported that the differences were greater at the provincial level. In the South where byregion, the poverty seemed relatively less serious, there were still two provinces on the Malaysiaborder, Yala and Narathiwas that the poverty was considered severe.

L-12
Headcount ratio in the South was 8.3 on the average, being 5.5 in urban area and 9.2in rural area.
Due to economic crisis in 19974, the poverty in Thailand tended to increase;nevertheless the reduction was slower in the rural areas indicating that economicdevelopment had not reached the entire sector equitably. Farmers in the Northeastleft their farms seeking for employment in Bangkok and peripheries. Before the crisissuch migration was a factor of decrease in poverty in the Northeast. Nevertheless theeconomic crisis led to increase in poverty. Head –count ration increased from 17.0 in1996 to 18.8 in 1998 and even higher to 21.3 in 2001. Nevertheless after therecovery, the ration decreased to 15.0 in 2003 and recently to 12.0 in 2004.
2.2. Factors Affecting Poverty
NESDB divided main factors of poverty into two groups: per individual and perstructure. The factors were as follows.
Per individual� Lack of capital asset� Lack of agricultural land� Indebtedness� Low education� Lack of occupational skill� Lack of information on occupation� Materialism preference� Large family relatively to income earning capacity� Health problem
Poor people in Thailand were mostly in agricultural sector. Coastal artisanalfishermen were also considered “poor”. Lack of agricultural land and capital assetconstrained investment capacity for production efficiency and better income.Farmers had to borrow for farm investment as well as to make their livings, thus achronic indebtedness, mainly with their traders. Low education, lack of occupationalskill and lack of information on occupation limited their job opportunities.Development led to their materialism preference. Examples were the preferences ontelevision, motorcycle, and mobile phone. In rural sector, working age people usuallyleft home to find jobs in the cities. Children might be sent back to hometown duringtheir school age since cost of living in the cities was expensive. Thus in rural sector,there were families with the old and the young, few working age thus low capacity inearning income for the non-working members. Health was also considered a problemamong these poor.
Per structure
4 In 1980s and early 1990s, economic growth in Thailand was two digits. The high income wasconsidered “bubble economy”. Real estate prices were unusually high resulting from the speculation.High interest rate induced foreign capital inflow. Investors in Thailand sought low interest loans fromabroad. Financial liberalization eased the capital inflow and investment in Thai stack market. Thaibaht value was too high, leading to increasing imports and speculation on real estates. There wasinflux of foreign loans and investment. The too strong baht value led to speculation in foreigncurrency. When foreign capital was withdrawn, baht was devalued. This devaluation led to inability inpayment on foreign loan. Businesses had to be sold to foreign investors. Many were out of businessleading to decrease in income during the late 1990s. Employees were laid off.
L-13
� Lack of effective management on natural resources includingforest, land, water, coastal, and fishery resources andenvironment which led to overexploitation by commercialsector, thus fewer resources for the poor.
� Inequitable development in favor of manufacturing sector.� Open economy leading negative impact and higher risk for the
poor who were mainly in agricultural sector.� Legislation system which led to greater social inequity.� Lack of effective collaboration among government agencies
concerning poverty eradication.� Lack of collaboration in spatial development.� Lack of effective government budget allocation on poverty
eradication.
Thailand has been one of the natural resource abundant countries. Nevertheless thelack of effective resource management and rapid economic development had led toresource degradation. Less benefit from resource exploitation had been share by thepoor. Open economy also led to resource overexploitation, mainly in manufacturingsector. Without effective natural resource management, rapid development led toresource degradation. Open economy without protection on small scale farmersincrease the poverty in this sector. Still the current legislations were in favor for thedevelopment and higher income group, thus led to greater social inequality. Whilethere were government concerns in poverty eradication, there were lack of effectivecoordination among relevant government agencies and lack of spatial developmentcollaboration in achieving this goal. Finally government budget allocation wasconsidered not adequately allocated for this goal.
2.3 Poverty Reduction Strategies
Government strategies in poverty eradication, according to NESDB, can be groupedin to three missions as follows.
1. Develop the potential of urban and rural poor:
� Urban poor, support on job security viao Establishing occupation group and community
business.o Provision of low interest credit.o Turning slum into community production area, as well
as uplifting living condition and environment.o Provision of necessary social services.
� Rural poor, support on occupation potential viao Support on sustainable agriculture and self- sufficient
domestic consumption.o Promotion on strengthening community economy.o Promotion on occupation group.o Raising community saving.o Connection between community economy and private
company.o Better education for better alternatives and improved
life quality.
L-14
� Strengthening community capability viao Promotion on community organization and
networking.o Development on community organization, to be core
unit in local development and collaboration with otherrelevant agencies.
o Promotion on community participation in public sectordecision making process.
Examples of action plan being undertaken include debt moratorium forsmall farmers, village fund, One-Tambon5-One –Product (OTOP), longterm credit facilities, refinance informal loans, turning asset of the poor tocapital investment.
2. Develop social protection and safety net:� Develop health service system and training for the poor
o Fair health serviceo Accelerate health insurance program at the nationwideo Provide education and training for the disable oneso Skill development for the poor for capital credit access
� Provide social welfareo Develop information system data baseo Improve existing revolving fundo Promotion on community welfare fundo Accelerate the establishment of unemployment
insurance fund
Examples of action plans are cash transfer to indigent elderly and disablepersons, universal health insurance program, provision on housing andshelter, and drinking water, local authorities in education and life longlearning opportunity for the poor, and school bicycle.
3. Structural poverty eradication:� Promotion on macroeconomic policy in favor of poverty
eradicationo Increasing public conscious on self-sufficiencyo Develop capacity in economic, politic, social and
cultural self-relianceo Promotion on equitable economic developmento Low inflation targetingo Least tax burden on the pooro Least adverse impact from free trade regimeo Increasing equity in access to information system
technology for alleviating problem and increasingopportunity for better life quality among the poor.
4. Natural resource management administration and legislative reform forpoverty eradication:
5 Tambon is a Thai word for sub-district.

L-15
� Efficient resource utilization viao Promotion on community role in natural resource and
environmental managemento Acceleration on provision of agricultural land for poor
farmerso Promotion on natural resource utilization zoningo Promotion on urban planningo Acceleration on water source and irrigation
developmento Support on establishing natural resource and
environment conservation and monitoring fundo Increasing public sector natural resources and
environment concern on natural resource andenvironmental impact
o Improve legislations concerning natural resources andenvironment
The emphases are on natural resource management, land settlement, andland reform.
5. Streamlining public administration for poverty eradication� Division of the government agencies involving poverty
eradication by their mission:o Planningo Overall actiono Area actiono Supporting agencies
� Decentralization on budget allocation� Public hearing
The focuses are on devolution of public resource management andresponsibility and community action plan for poverty reduction.
3. ECONOMIC GROWTH
3.1 Gross Domestic Product
In 2003, Bank of Thailand reported that the preliminary GDP at current marketprices was 5, 930 billion baht (= US$143 billion at 41.5 baht/US$). GDP in 2002 was5,452 billion baht (=US$127 billion at 43.0 baht/US$). Average growth rate during1995 -2002 was 2.98%. Fishing sector growth rate was 3.86%, higher than those innon-agriculture (3.06%) and other agriculture sector (1.82%). Growth rate inagricultural sector (2.29%) was low than the total average.

L-16
Gross Domestic Product at Current Market Prices by Economic Activities, 1995 - 2002 (bill. baht)
1995 1996 1997 1998 1999 2000 2001 2002 Growthrate
Agriculture 398 438 447 499 436 444 468 511 2.29Agriculture, Hunting andForestry 314 350 352 391 332 326 357 407 1.82
Fishing 84 88 95 108 103 118 111 104 3.86Non-Agriculture 3,788 4,173 4,285 4,128 4,202 4,479 4,665 4,941 3.06Gross Domestic Product 4,186 4,611 4,733 4,626 4,637 4,923 5,134 5,452 2.98Source: Calculated from Data of National Social and Economic Development Boardhttp://www.nesdb.go.th/econSocial/macro/nad.htm
On the average, non-agricultural sector had the main share in GDP, 90.48%, whileagricultural share was only 9.52%. During the economic crisis in 1998 share ofagricultural sector slightly increased due to the decrease in contribution from non-agricultural sector. Fishing sector shared only 2.12%, with a tendency to decreaserecently.
Share of Economic Sector in GDP at current market prices, 1995 - 2002 (%)Item 1995 1996 1997 1998 1999 2000 2001 2002 AverageAgriculture 9.51 9.50 9.45 10.78 9.39 9.02 9.12 9.37 9.52Agriculture, Hunting andForestry 7.49 7.59 7.44 8.44 7.16 6.63 6.96 7.46 7.40Fishing 2.01 1.91 2.01 2.33 2.23 2.39 2.16 1.91 2.12Non-Agriculture 90.49 90.50 90.55 89.22 90.61 90.98 90.88 90.63 90.48Gross Domestic Product 100.00 100.00 100.00 100.00 100.00 100.00 100.00 100.00 100.00Source: Calculated from Data of National Social and Economic Development Boardhttp://www.nesdb.go.th/econSocial/macro/nad.htm
Until 2000, annual growth in fishing sector was the higher. The exception was thenegative growth in 1999, which could be the impact of economic crisis. Neverthelessgrowth rate in fishing sector increased again in 2000, and became negative afterward.
Annual GDP growth rate �����- ����
-��.��
-��.��
�.��
��.��
��.��
���� ���� ���� ���� ���� ���� ����
��� �� � ��� �� ���� ���������������
������ ������� �� �
������� ������!�� ��
Source: Calculated from Data of National Social and Economic Development Boardhttp://www.nesdb.go.th/econSocial/macro/nad.htm

L-17
Annual GDP Growth rate, 1996 - 2002 (%)Item 1996 1997 1998 1999 2000 2001 2002 1995-2002Agriculture 10.10 2.07 11.50 -12.65 1.98 5.47 9.06 2.29Agriculture, Hunting and Forestry 11.61 0.51 10.98 -14.99 -1.72 9.50 13.87 1.82Fishing 4.47 8.25 13.43 -4.19 13.85 -5.69 -6.44 3.86Non-Agriculture 10.15 2.70 -3.68 1.79 6.61 4.16 5.91 3.06Gross Domestic Product 10.15 2.64 -2.24 0.23 6.17 4.28 6.19 2.98Source: Calculated from Data of National Social and Economic Development Boardhttp://www.nesdb.go.th/econSocial/macro/nad.htm
By economic activities, most contribution was from manufacturing sector (31.78%),followed by wholesale, retail trade and repairing services (16.84%), and transport,storage and communication (7.87%). Following these three was agriculture, huntingand forestry (7.40%) and hotel and restaurants (5.41%). Contributions from otheractivities were less than five percent.
GDP at Current Market Price by Economic Activities 1995 - 2002 (bill. baht) 1995 1996 1997 1998 1999 2000 2001 2002
Agriculture, Hunting and Forestry 314 350 352 391 332 326 357 407
Fishing 84 88 95 108 103 118 111 104
Mining and Quarrying 50 63 82 84 87 117 126 136
Manufacturing 1,252 1,370 1,428 1,428 1,514 1,653 1,715 1,848
Electricity, Gas and Water Supply 101 107 119 142 130 146 167 176
Construction 303 342 272 179 166 150 154 166
Wholesale and Retail Trade; Repairing Service 709 763 812 786 801 848 857 867
Hotels and Restaurants 220 249 246 231 256 275 289 310
Transport, Storage and Communications 303 341 370 361 376 397 429 444
Financial Intermediation 297 328 309 235 156 146 151 166
Real Estate, Renting and Business Activities 143 155 157 153 157 161 164 172
Public Administration 158 171 181 195 204 211 222 245
Education 137 149 163 182 187 197 202 212
Health and Social Work 61 69 76 83 91 97 104 107
Other Service Activities 49 59 63 61 68 74 77 84
Private Households with Employed Persons 6 6 7 7 7 7 7 7Source: Calculated from Data of National Social and Economic Development Boardhttp://www.nesdb.go.th/econSocial/macro/nad.htm
L-18
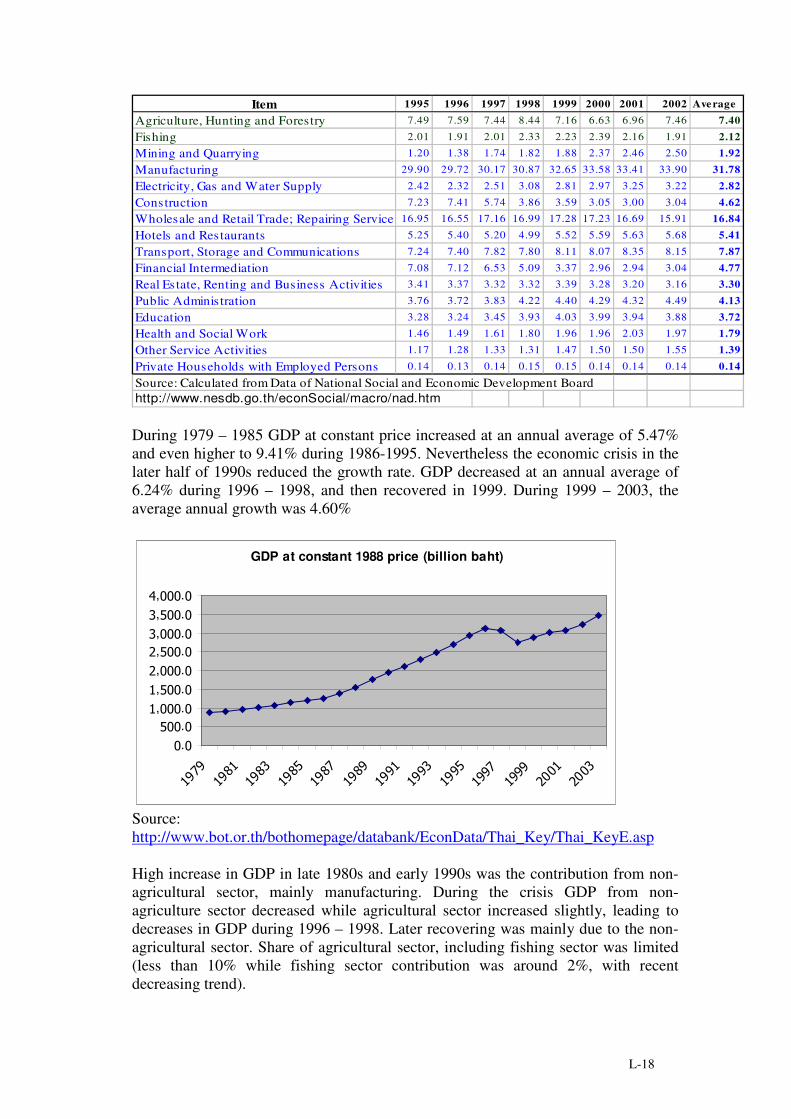
Item 1995 1996 1997 1998 1999 2000 2001 2002 AverageAgriculture, Hunting and Forestry 7.49 7.59 7.44 8.44 7.16 6.63 6.96 7.46 7.40Fishing 2.01 1.91 2.01 2.33 2.23 2.39 2.16 1.91 2.12Mining and Quarrying 1.20 1.38 1.74 1.82 1.88 2.37 2.46 2.50 1.92Manufacturing 29.90 29.72 30.17 30.87 32.65 33.58 33.41 33.90 31.78Electricity, Gas and Water Supply 2.42 2.32 2.51 3.08 2.81 2.97 3.25 3.22 2.82Construction 7.23 7.41 5.74 3.86 3.59 3.05 3.00 3.04 4.62Wholesale and Retail Trade; Repairing Service 16.95 16.55 17.16 16.99 17.28 17.23 16.69 15.91 16.84Hotels and Restaurants 5.25 5.40 5.20 4.99 5.52 5.59 5.63 5.68 5.41Transport, Storage and Communications 7.24 7.40 7.82 7.80 8.11 8.07 8.35 8.15 7.87Financial Intermediation 7.08 7.12 6.53 5.09 3.37 2.96 2.94 3.04 4.77Real Estate, Renting and Business Activities 3.41 3.37 3.32 3.32 3.39 3.28 3.20 3.16 3.30Public Administration 3.76 3.72 3.83 4.22 4.40 4.29 4.32 4.49 4.13Education 3.28 3.24 3.45 3.93 4.03 3.99 3.94 3.88 3.72Health and Social Work 1.46 1.49 1.61 1.80 1.96 1.96 2.03 1.97 1.79Other Service Activities 1.17 1.28 1.33 1.31 1.47 1.50 1.50 1.55 1.39Private Households with Employed Persons 0.14 0.13 0.14 0.15 0.15 0.14 0.14 0.14 0.14Source: Calculated from Data of National Social and Economic Development Board http://www.nesdb.go.th/econSocial/macro/nad.htm
During 1979 – 1985 GDP at constant price increased at an annual average of 5.47%and even higher to 9.41% during 1986-1995. Nevertheless the economic crisis in thelater half of 1990s reduced the growth rate. GDP decreased at an annual average of6.24% during 1996 – 1998, and then recovered in 1999. During 1999 – 2003, theaverage annual growth was 4.60%
GDP at constant 1988 price (billion baht)
�.�"��.��,���.��,"��.��,���.��,"��.�#,���.�#,"��.�$,���.�
�����������#���"���������������#���"
�����
������������#
Source:http://www.bot.or.th/bothomepage/databank/EconData/Thai_Key/Thai_KeyE.asp
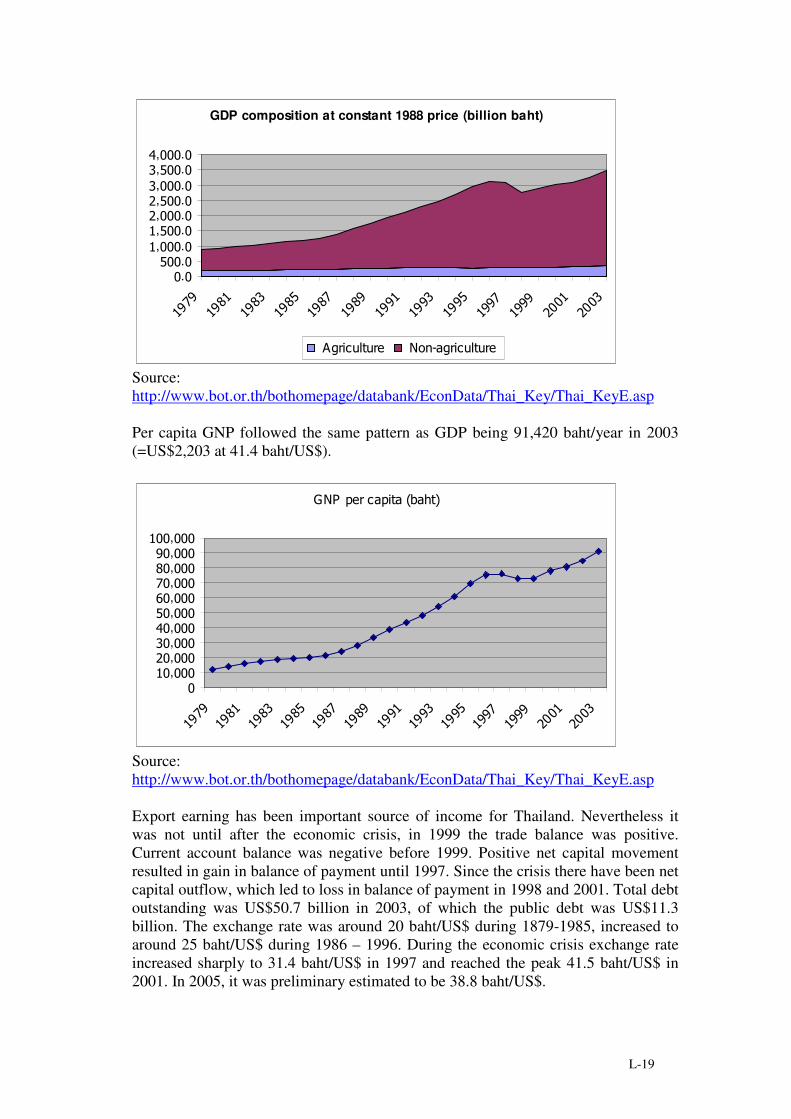
High increase in GDP in late 1980s and early 1990s was the contribution from non-agricultural sector, mainly manufacturing. During the crisis GDP from non-agriculture sector decreased while agricultural sector increased slightly, leading todecreases in GDP during 1996 – 1998. Later recovering was mainly due to the non-agricultural sector. Share of agricultural sector, including fishing sector was limited(less than 10% while fishing sector contribution was around 2%, with recentdecreasing trend).
L-19
GDP composition at constant 1988 price (billion baht)
�.�"��.��,���.��,"��.��,���.��,"��.�#,���.�#,"��.�$,���.�
�����������#���"���������������#���"
�����
������������#
���� �� �� �������� �� ��
Source:http://www.bot.or.th/bothomepage/databank/EconData/Thai_Key/Thai_KeyE.asp
Per capita GNP followed the same pattern as GDP being 91,420 baht/year in 2003(=US$2,203 at 41.4 baht/US$).
��!�%����%����&'���(
���,�����,���#�,���$�,���"�,�����,�����,�����,�����,������,���
�����������#���"���������������#���"
�����
������������#
Source:http://www.bot.or.th/bothomepage/databank/EconData/Thai_Key/Thai_KeyE.asp
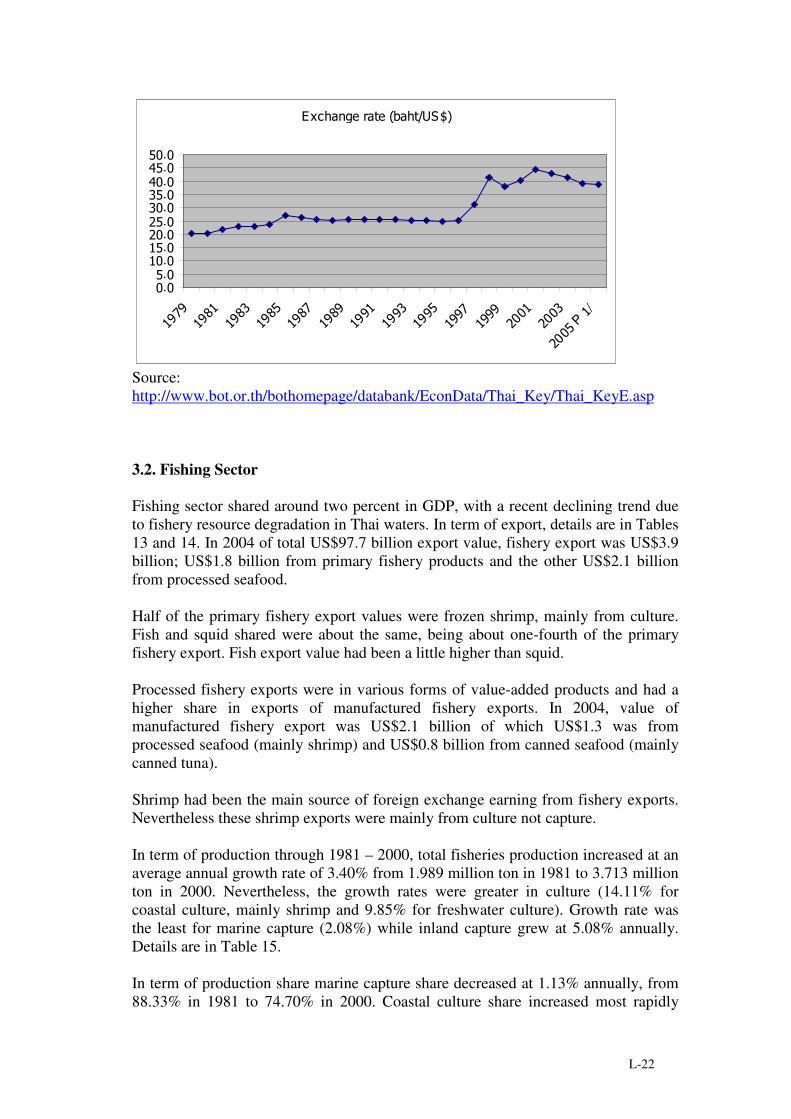
Export earning has been important source of income for Thailand. Nevertheless itwas not until after the economic crisis, in 1999 the trade balance was positive.Current account balance was negative before 1999. Positive net capital movementresulted in gain in balance of payment until 1997. Since the crisis there have been netcapital outflow, which led to loss in balance of payment in 1998 and 2001. Total debtoutstanding was US$50.7 billion in 2003, of which the public debt was US$11.3billion. The exchange rate was around 20 baht/US$ during 1879-1985, increased toaround 25 baht/US$ during 1986 – 1996. During the economic crisis exchange rateincreased sharply to 31.4 baht/US$ in 1997 and reached the peak 41.5 baht/US$ in2001. In 2005, it was preliminary estimated to be 38.8 baht/US$.

L-20
Export and Import (billions of US$)
�.���.�
$�.���.���.�
���.����.�
�����������#���"���������������#���"
�����
������������#
)*%�� + %��
Source:http://www.bot.or.th/bothomepage/databank/EconData/Thai_Key/Thai_KeyE.asp
Current account balance and net capital movement (billions of US$)
-��.�
-��.�
�.�
��.�
��.�
#�.�
�����������#���"���������������#���"
�����
������������#
, �������� ���'������ ������%����� �-� ���
Source:http://www.bot.or.th/bothomepage/databank/EconData/Thai_Key/Thai_KeyE.asp

L-21
Balance of payments (billions of US$)
-��.�-��.�-�.�-�.�-$.�-�.��.��.�$.��.��.���.�
�����������#���"���������������#���"
�����
������������#
Source:http://www.bot.or.th/bothomepage/databank/EconData/Thai_Key/Thai_KeyE.asp
Composition of net capital movement (billions of US$)
-��.�
-��.�
�.�
��.�
��.�
#�.�
�����������#���"���������������#���"
�����
������������#
!�-��� �! '��� �./0
Total debt outstanding and public debt (billions of US$)
�.���.�
$�.���.���.�
���.����.�
�����������#���"���������������#���"
�����
������������#
0�������'��� ���������� ! '������'�
L-22
)*����������&'���1234(�����������
�.�".���.��".���.��".�#�.�#".�$�.�$".�"�.�
�����������#���"���������������#���"
�����
������������#
���"�P
�/
Source:http://www.bot.or.th/bothomepage/databank/EconData/Thai_Key/Thai_KeyE.asp
3.2. Fishing Sector
Fishing sector shared around two percent in GDP, with a recent declining trend dueto fishery resource degradation in Thai waters. In term of export, details are in Tables13 and 14. In 2004 of total US$97.7 billion export value, fishery export was US$3.9billion; US$1.8 billion from primary fishery products and the other US$2.1 billionfrom processed seafood.
Half of the primary fishery export values were frozen shrimp, mainly from culture.Fish and squid shared were about the same, being about one-fourth of the primaryfishery export. Fish export value had been a little higher than squid.
Processed fishery exports were in various forms of value-added products and had ahigher share in exports of manufactured fishery exports. In 2004, value ofmanufactured fishery export was US$2.1 billion of which US$1.3 was fromprocessed seafood (mainly shrimp) and US$0.8 billion from canned seafood (mainlycanned tuna).
Shrimp had been the main source of foreign exchange earning from fishery exports.Nevertheless these shrimp exports were mainly from culture not capture.
In term of production through 1981 – 2000, total fisheries production increased at anaverage annual growth rate of 3.40% from 1.989 million ton in 1981 to 3.713 millionton in 2000. Nevertheless, the growth rates were greater in culture (14.11% forcoastal culture, mainly shrimp and 9.85% for freshwater culture). Growth rate wasthe least for marine capture (2.08%) while inland capture grew at 5.08% annually.Details are in Table 15.
In term of production share marine capture share decreased at 1.13% annually, from88.33% in 1981 to 74.70% in 2000. Coastal culture share increased most rapidly

L-23
being 10.50% annually, from a share of 3.93% in 1981 to 12.58% in 2000. Freshwater culture share increased at 6.44% annually while inland capture share increasedonly 1.68%. (Table 16)
Fishery abundance in Thai waters had been degraded. Marine capture growth wasslowed down. Important increase in fishing sector came mainly from development inshrimp culture.
In term of value the increase in total production was 12.97% annually, much higherthan the volume growth rate. From 17.13 billion baht, the value increased to 157.46billion baht in 2000. The highest growth rate was from coastal culture (27.12%),greater than twice the second highest – freshwater culture (12.12%). The rapidincrease in share of coastal culture reduced the share from the other fishing sector. Interm of value, share of other sector decreased while the share of coastal cultureincreased from 5.12% in 1981 to 58.81% in 2000, higher than the share of marinecapture (31.37%). (Table 15)
�������� ������������������������������������
�5���
�5"��
�5���
�5"���5���
�5"��
#5���
#5"��
$5���
����
���#
���"
����
����
����
���#
���"
����
����
6�������%� � +��������%� � ,�������� �� � ����7����� �� �
Source: Fisheries Statistics of Thailandhttp://www.fisheries.go.th/it/stat/t71.htm
Value of Fish Production 1981 - 2000 (billion baht)
0.0020.0040.0060.0080.00
100.00120.00140.00160.00180.00
1981
1983
1985
1987
1989
1991
1993
1995
1997
1999
Marine capture Inland capture Coastal culture Freshwater culture
Source: Fisheries Statistics of Thailandhttp://www.fisheries.go.th/it/stat/t72.htm

L-24
Main contribution to Thai fishing sector was shrimp culture, with a rapid growthsince late 1980s. The development was induced good price in the internationalmarket and coastal abundance in Thailand. For marine capture, most of the catcheswere from trawlers. Main catches from trawlers were trash fish for feed mill. Rapidincrease in number of trawlers had rapidly depleted fishery resource abundance inthe Gulf of Thailand. Coastal fishermen, with limited alternatives on job opportunitydue to lack of skill and investment funds had been mostly affected from this resourcedegradation.
The rapid increase in trawlers was resulted by the development of otterboard trawlersfrom Germany. Before trawlers main fishing gears were purse seines aimed forpelagic fish. Due to fishery resource abundance, when otterboard trawl wasintroduced, catches were high targeting on demersal resources. High earnings fromthis fishing gear led to rapid increase in number of trawlers. Commercial fishermengained from this resource exploitation. Later there was overcapacity, thus overfishing and fishery resource degradation. Such resource degradation had a negativeimpact on coastal small scale fishermen who mainly relied on coastal fisheryresources. There had not been government subsidy on this fishing gear. Neverthelesslack of effective control on number of trawlers was one of the cause of fisheryresource degradation in the Gulf of Thailand.
4. FISHERIES DEVELOPMENT AND MANAGEMENT
4.1. Fisheries Exploitation
After development in trawl fishery, main catches were demersal fish, of which alarge portion was caught as trash fish for fish meal industry. These trash fish werelow quality fish, caught mainly by trawlers, and were used for animal feed. Trawlhad been considered a destructive fishing gear. Young juvenile economic fish werealso caught as trash fish, by trawls. Fishery resource abundance in Thai waters wasrapidly depleted by trawling. There is a regulation on banning trawl within 3kilometers from shoreline. Nevertheless due to long coastlines and limited budgetand personnel on monitoring and enforcement, this regulation had not beeneffectively pursued its objective. Catch per unit effort reduced by ten times after theboom in trawlers.
Recently due to resource degradation in Thai waters, large trawlers had to fishoutside Thai waters. There were a number of Thai trawlers fishing in neighboringcountry waters, including Indonesia, Myanmar, Malaysia, Cambodia and Vietnam.Large Thai trawls had already been fishing in Indian Ocean, as well as in Africancountry waters.
Fishery resource degradation in Thai waters, especially in the Gulf of Thailand wasburdened mostly on small scale fishermen, with small fishing vessels thus could notfish far from home. These small scale artisanal fishermen relied on their dailycatches for home consumption as well as source of income.
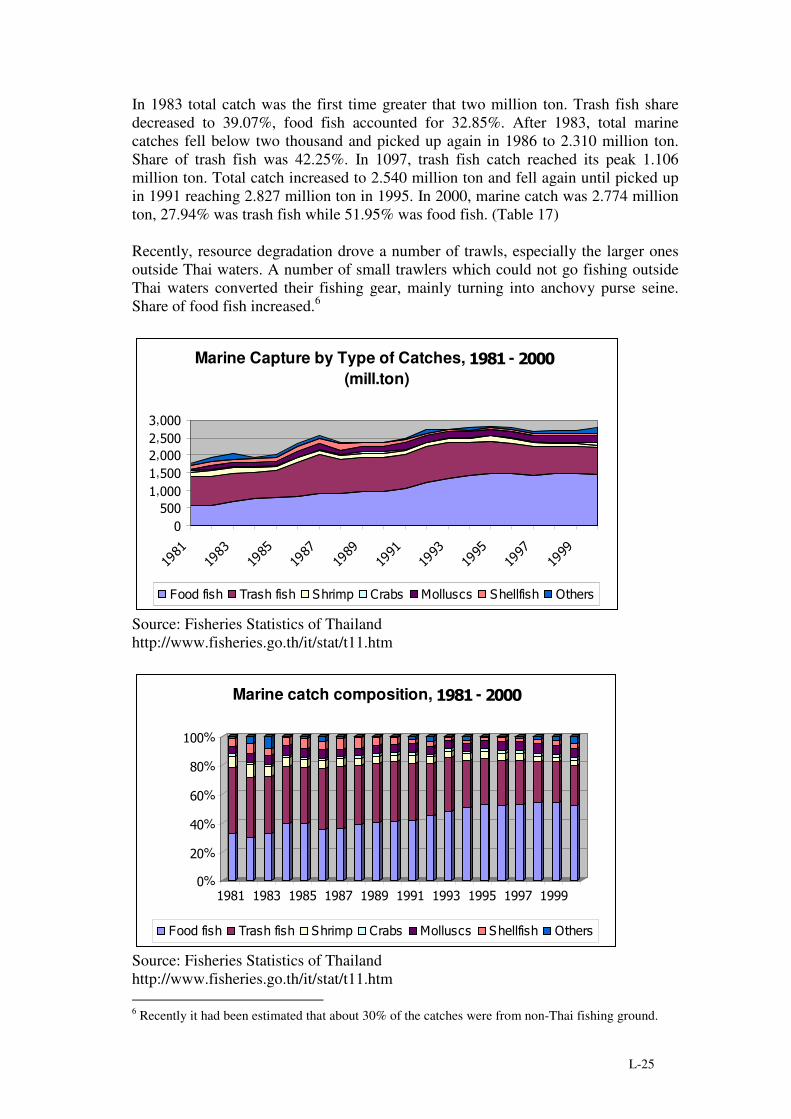
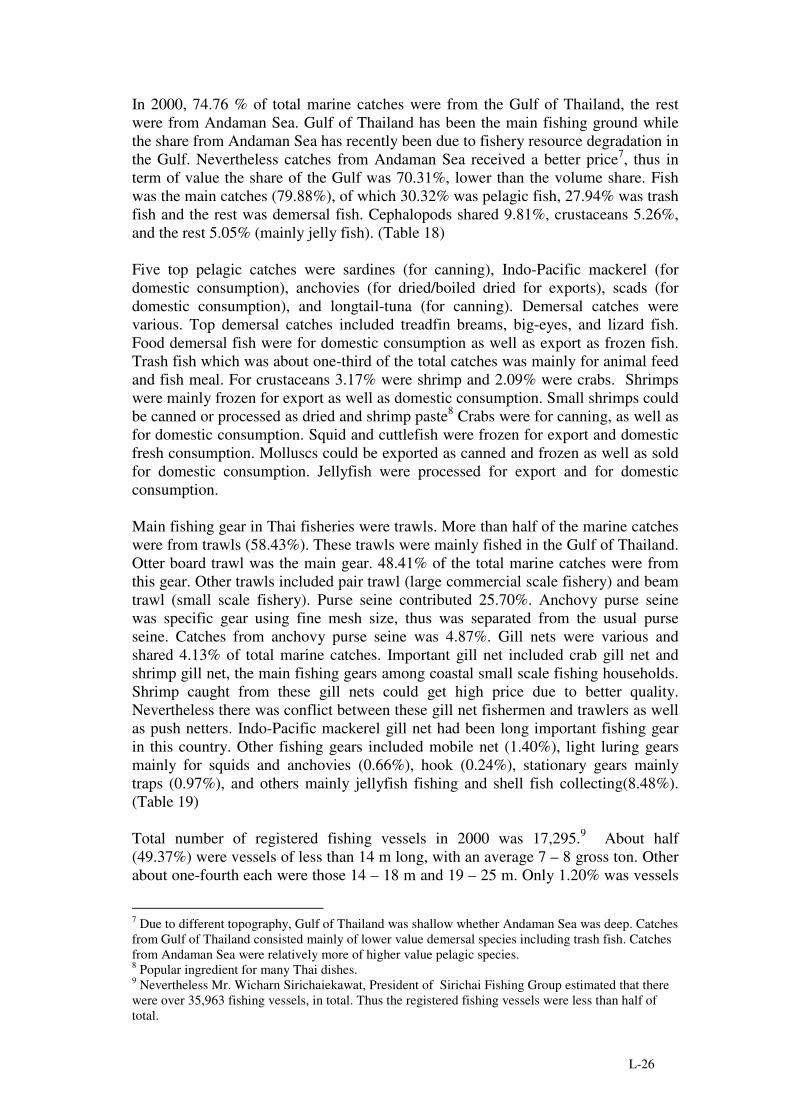
In 1981 total marine capture was 1.757 million ton of which almost half (45.36%)was trash fish. Food fish accounted for 32.84%, shrimp 7.91%, and shellfish 5.75%.
L-25
In 1983 total catch was the first time greater that two million ton. Trash fish sharedecreased to 39.07%, food fish accounted for 32.85%. After 1983, total marinecatches fell below two thousand and picked up again in 1986 to 2.310 million ton.Share of trash fish was 42.25%. In 1097, trash fish catch reached its peak 1.106million ton. Total catch increased to 2.540 million ton and fell again until picked upin 1991 reaching 2.827 million ton in 1995. In 2000, marine catch was 2.774 millionton, 27.94% was trash fish while 51.95% was food fish. (Table 17)
Recently, resource degradation drove a number of trawls, especially the larger onesoutside Thai waters. A number of small trawlers which could not go fishing outsideThai waters converted their fishing gear, mainly turning into anchovy purse seine.Share of food fish increased.6
Marine Capture by Type of Catches, �����- �����(mill.ton)
�
"��
�,����,"���,����,"��#,���
����
���#
���"
����
����
����
���#
���"
����
����
�����8��� 0����8��� 3�� % ,�'� 6��� ��� 3����8��� /����
Source: Fisheries Statistics of Thailandhttp://www.fisheries.go.th/it/stat/t11.htm
�%
��%
$�%
��%
��%
���%
���� ���# ���" ������������ ���# ���" ��������
Marine catch composition, �����- ����
�����8��� 0����8��� 3�� % ,�'� 6��� ��� 3����8��� /����
Source: Fisheries Statistics of Thailandhttp://www.fisheries.go.th/it/stat/t11.htm 6 Recently it had been estimated that about 30% of the catches were from non-Thai fishing ground.
L-26
In 2000, 74.76 % of total marine catches were from the Gulf of Thailand, the restwere from Andaman Sea. Gulf of Thailand has been the main fishing ground whilethe share from Andaman Sea has recently been due to fishery resource degradation inthe Gulf. Nevertheless catches from Andaman Sea received a better price7, thus interm of value the share of the Gulf was 70.31%, lower than the volume share. Fishwas the main catches (79.88%), of which 30.32% was pelagic fish, 27.94% was trashfish and the rest was demersal fish. Cephalopods shared 9.81%, crustaceans 5.26%,and the rest 5.05% (mainly jelly fish). (Table 18)
Five top pelagic catches were sardines (for canning), Indo-Pacific mackerel (fordomestic consumption), anchovies (for dried/boiled dried for exports), scads (fordomestic consumption), and longtail-tuna (for canning). Demersal catches werevarious. Top demersal catches included treadfin breams, big-eyes, and lizard fish.Food demersal fish were for domestic consumption as well as export as frozen fish.Trash fish which was about one-third of the total catches was mainly for animal feedand fish meal. For crustaceans 3.17% were shrimp and 2.09% were crabs. Shrimpswere mainly frozen for export as well as domestic consumption. Small shrimps couldbe canned or processed as dried and shrimp paste8 Crabs were for canning, as well asfor domestic consumption. Squid and cuttlefish were frozen for export and domesticfresh consumption. Molluscs could be exported as canned and frozen as well as soldfor domestic consumption. Jellyfish were processed for export and for domesticconsumption.
Main fishing gear in Thai fisheries were trawls. More than half of the marine catcheswere from trawls (58.43%). These trawls were mainly fished in the Gulf of Thailand.Otter board trawl was the main gear. 48.41% of the total marine catches were fromthis gear. Other trawls included pair trawl (large commercial scale fishery) and beamtrawl (small scale fishery). Purse seine contributed 25.70%. Anchovy purse seinewas specific gear using fine mesh size, thus was separated from the usual purseseine. Catches from anchovy purse seine was 4.87%. Gill nets were various andshared 4.13% of total marine catches. Important gill net included crab gill net andshrimp gill net, the main fishing gears among coastal small scale fishing households.Shrimp caught from these gill nets could get high price due to better quality.Nevertheless there was conflict between these gill net fishermen and trawlers as wellas push netters. Indo-Pacific mackerel gill net had been long important fishing gearin this country. Other fishing gears included mobile net (1.40%), light luring gearsmainly for squids and anchovies (0.66%), hook (0.24%), stationary gears mainlytraps (0.97%), and others mainly jellyfish fishing and shell fish collecting(8.48%).(Table 19)
Total number of registered fishing vessels in 2000 was 17,295.9 About half(49.37%) were vessels of less than 14 m long, with an average 7 – 8 gross ton. Otherabout one-fourth each were those 14 – 18 m and 19 – 25 m. Only 1.20% was vessels
7 Due to different topography, Gulf of Thailand was shallow whether Andaman Sea was deep. Catchesfrom Gulf of Thailand consisted mainly of lower value demersal species including trash fish. Catchesfrom Andaman Sea were relatively more of higher value pelagic species.8 Popular ingredient for many Thai dishes.9 Nevertheless Mr. Wicharn Sirichaiekawat, President of Sirichai Fishing Group estimated that therewere over 35,963 fishing vessels, in total. Thus the registered fishing vessels were less than half oftotal.

L-27
of longer than 25 m long. 19 -25 m vessels share was largest in term of gross ton(56.75%). Tables 20 – 21)
More than one-third of registered fishing vessels (35.58%) were otter board trawls.There were 11.44% less than 14 m long, 11.84% 14 – 18 m and 11.48% 19 – 25 m.Those longer than 25 m long shared 0.83%. Other important gear among theregistered vessels were squid falling net (12.12%), various gill nets (8.01%), pairtrawl (9.73%) shrimp trammel net (6.16%), surrounding net (5.72%), crab gill net(4.98%), anchovy falling net (4.76%), push net (3.69%), anchovy surrounding net(2.97%) and lift nets (2.00%).
Fishing gears were various, Thai fisheries were multi-gear and multi-species. Themain fishing gear, otter board trawl was non-selective gear. Catches were multi-species. Other demersal fishing gears, including push net, were also non-selective.Some coastal fishing vessels used different fishing gears in different seasondepending on available resources. The underreported number of fishing vessels andfishing gears led to problems in effective fishery management.
In 1995 there were 53,112 marine fishing households. 89.7% were small scale andother 10.3% were commercial scale. Most of the fishermen were small scale whilemost of the catches were from commercial scale. Number of fishing householdincreased 8.8% in 2000. Nevertheless while there were more small scale fishinghouseholds (increased by 12%), number of commercial scales households decreasedby 18.8%.Share of small scale increased to 92.7% in 2000, while total fishinghouseholds was 57,801. Most of the fishing households were in Coastal Zone 4 and 5in Southern Region. (Table 22)
Of 57,801 marine fishing households 1,820 also practiced coastal culture (mainlyshrimp). Investment in shrimp farming was relatively high10 and was difficult to beaffordable by small scale fishermen11. Usually fishermen who also kept aquaculturewere successful fishermen with access to capital investment. Including coastalculture household, number of fishery households was 93,512 in Year 2000, anincrease of 15.9% compared to Year 1995. Increase in marine fishing household was11.6%, lower than the increase in coastal aquaculture (29.4%). There was a decreasein households which kept both practices, This could be explained by the moredifficult capture fisheries and higher risk in coastal culture due to degraded coastalenvironment. (Table 23)
10 Require not less than US$25,000 to start a small shrimp farm.11 Small scale fishermen were those artisanal coastal fishermen with fishing vessels of 5 ton gross orlower. Most of them used outboard engine fishing vessels. Some used non-engined vessels or withoutany vessel. These fishermen could not go fishing far away from the coastlines. Usually their fishinggrounds were about 5 kilometres from shoreline. Their fishing trips were daily. Their main fishinggears were drift gill net, traps, hook and lines. Commercial fishermen used larger engined vessels.Main gear was trawl. Their fishing trips were not daily but longer depending on size of the vessel.Trawls and engined push net, of those commercial fishermen were banned within three kilometresfrom shoreline. Nevertheless the enforcement was not effective. There had been conflicts between thecommercial and small scale fishermen in coastal areas. For aquaculture operators, sizes were varied bytype of operation. For example for shrimp farms, those with less than 5 hectares could be consideredsmall scale.
L-28
Beside the above, there were fishery employee households, 29,122 in Year 2000 adecrease of -0.6% from 1995 due to decrease in coastal aquaculture employeehouseholds. There had been a downfall in coastal aquaculture since early 2000s.
In Year 2000, number of fishermen in peak season was 168,140. Almost half(48.09%) were family member, the rest were employees (51.91%). Most of theemployees were local residents (19.11%). Nevertheless 17.38% were foreign labor,mainly from Myanmar. There were also some Cambodians. 11.06% were employeesfrom the Northeastern Region, with a decreasing trend since they could get non-fishing jobs due to the coastal zone development. Employees from the other areaswere only 4.20%. More than half of these employees worked in the Southern Regionin Coastal 5 (28.27%), Coastal Zone 4(26.90%), and Coastal Zone 2 (23.66%).(Table 24)
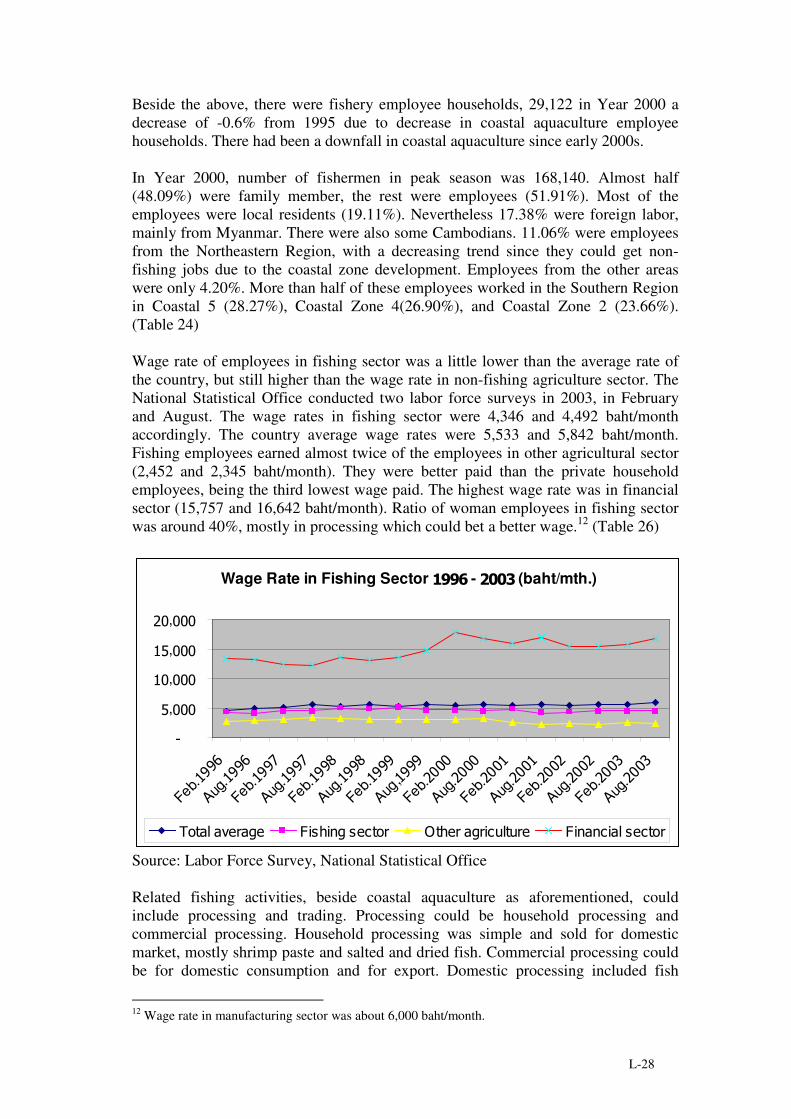
Wage rate of employees in fishing sector was a little lower than the average rate ofthe country, but still higher than the wage rate in non-fishing agriculture sector. TheNational Statistical Office conducted two labor force surveys in 2003, in Februaryand August. The wage rates in fishing sector were 4,346 and 4,492 baht/monthaccordingly. The country average wage rates were 5,533 and 5,842 baht/month.Fishing employees earned almost twice of the employees in other agricultural sector(2,452 and 2,345 baht/month). They were better paid than the private householdemployees, being the third lowest wage paid. The highest wage rate was in financialsector (15,757 and 16,642 baht/month). Ratio of woman employees in fishing sectorwas around 40%, mostly in processing which could bet a better wage.12 (Table 26)
Wage Rate in Fishing Sector �����- �����(baht/mth.)
�
",���
��,���
�",���
��,���
Feb.����
Aug.����
Feb.����
Aug.����
Feb.����
Aug.����
Feb.����
Aug,����
Feb.����
Aug.����
Feb.����
Aug.����
Feb.����
Aug.����
Feb.���#
Aug.���#
0������-��� ������������ /������� �� � ���������������
Source: Labor Force Survey, National Statistical Office
Related fishing activities, beside coastal aquaculture as aforementioned, couldinclude processing and trading. Processing could be household processing andcommercial processing. Household processing was simple and sold for domesticmarket, mostly shrimp paste and salted and dried fish. Commercial processing couldbe for domestic consumption and for export. Domestic processing included fish
12 Wage rate in manufacturing sector was about 6,000 baht/month.
L-29
sauce (partly exported), steaming, smoking, dried and salted, fish ball, shrimpcracker, and fish meal. Export processing included freezing (mainly shrimp) andcanning (mainly tuna, fish shrimp, and crab).
In 2000, there were 142 freezing/cold storage plants. Most of them were located inCoastal Zone 2 along the coast of the inner Gulf of Thailand and scatter along thecoast of the Southern Region. There were 40 canneries, mostly in Coastal Zone 2 and3 (the lower south along the coastlines of the Gulf of Thailand). Fish sauce plantswere 86, could be found most in Coastal Zone 2 as well as 1 (coastlines in theEastern Region). Budu fish sauce plants were 123 and were located only in coastalZone 3. The budu is special fish sauce for southern dishes. There were 80 steamingplants (mainly for Indo-Pacific mackerel and similar fish) and 17 smoking plants.Number of dried/salted plants were numerous (665 fish, 124 shrimp, 381 squid, and160 mollusc) since most were small scale processing. There were 82 fish ballprocessing plants. Fish ball was important ingredient for noodle dish. Shrimp crackerprocessing plants were 148, mainly in Coastal Zone 3. Fish meal plants, utilizingtrash fish, were 94. (Table 26)
In term of utilization, food fish was mainly frozen (30.8%), canned (30.0%) andconsumed fresh (22.8%). All trash fish was for fish meal processing. Shrimp wasmostly frozen (49.7%), mainly for export. It was also canned (29.0%) for export.Fresh shrimp for domestic consumption was 17.1%. 4.2% was dried, also fordomestic consumption. Sergistid shrimp was totally for shrimp paste processing.Crab was mostly consumed fresh (52.4%). 35.8% was canned and 11.8% was frozenfor export. Shellfish was also mainly for domestic consumption, 60.9% fresh. 23.3%was canned and 3.1% was frozen, for export. Squid was mostly frozen (64.9%) forexport. 18.3% was consumed fresh, domestically. 10.0% was dried. High qualitydried squid was exported (mainly to Japan). 6.8% was canned, for export. Jellyfishwas mostly dried (99.8%, both for domestic consumption and export. (Table 27)
It was estimated that fish processing employees were around two hundred thousand,mainly women.
Average fish consumption was 22 kg/person/year, 28% of animal proteinconsumption. In the former days fish was the main dish in every meal. There was asaying “there was rice in paddy fields and fish in water sources” reflecting foodabundance in Thailand. Nevertheless the fish in this saying rather meant forfreshwater fish in traditional consumption. For marine fish, Indo-Pacific mackerelhad been popular, not only for the southern residents but overall country as well.Recently marine fish at the size of serving plate has been more acceptable among theurban households. Convenient cooking service provided by supermarket helpedincrease this consumption.
Costs and returns of small scale fisheries are given in Table 28. In Year 2000, overallthe value of sold catches was 125.083 baht/hh/yr. Part of the catches was for homeconsumption. Cost of fishing was 52,012 baht, leaving a net return of 73,072 baht.13
Main cost of fishing was fuel cost which was 40.7%. The costs as recorded did nottake into account family labor cost. Usually for small scale fisheries 1-2 family
13 Average family size was 5 persons per household.

L-30
members engaged in fishing. By type of gears, push netter earned highest net return.Net returns form shrimp gill net, crab gill net, mullet gill net were similar. Theconflicts in fishery resource utilization between push netters and gill netters wereobserved. Push net was considered a destructive fishing gear, while push nettercomplaint that gill net obstruct their sailing.
Small scale fishermen could earn income from other sources besides fishing. Fishingincome, on the average, was 81.5% of total income. They could also earn 2.3% fromrelated activities including coastal culture and processing. They could earn 16.2%from on-fishing sector. Total income was 89.684 baht/household/yr, lower in CoastalZone 5 and 4 due to smaller size of operation while the dependency on non-fishingsector was a little higher (16.9% and 18.6% accordingly). (Table 29)
4.2 Wealth-Related Benefits
Before the bureaucratic reform in October 2002, Department of Fisheries was thesole Fishery Management Unit. Relevant agencies in marine fishery managementwere Division of Marine Fishery and the Local Fisheries Office in each province, incollaboration with Legislation Unit in Office of Department Secretariat. There hadbeen problems on inadequate personnel and budget for effective fisheriesmanagement. Fishery law and regulation were not up to date, based on the 1947Royal Decree on Fisheries which was basically designed for freshwater fisheries.
After the reform the responsibility on marine resources has been divided betweenDepartment of Fisheries under the Ministry of Agriculture and Cooperatives andOffice of Marine and Coastal Resources under the Ministry of Natural Resources andEnvironment. In Department of Fisheries, relevant agencies include Office ofFisheries Management Administration and Office of Marine Fisheries Research andDevelopment. Their responsibilities are on legislative matters, monitoring, controland enforcement as well as R&D on marine fisheries resources. Provincial FisheriesOffice acting as the coordinating unit between the Central Department of Fisheriesand the Provincial Office. In the existing bureaucratic system the governor acts aschief executive officers. Local government agencies have to collaborate in makingplans, determine the missions and implement. Department of Fisheries is the mainfishery management unit, in collaboration with the relevant agencies. Office ofMarine and Coastal Resources was responsible for resource rehabilitation andconservation.
So far, Department of Fisheries has set the target in marine fishery management,focusing on the production target. It was stated that the production in Thai watersshould not less be than 1.7 million ton per year and uneconomic exploitation (mainlytrash fish) should be reduced not less than 100,000 ton per year. Unlike the usualfisheries management plan, the fishery policy has been targeted at the production, notmanagement for optimum sustainable yield.
Panayoutou and Jetanavanich (1987) referred to South China Sea (1976 and 1987),Menasveta et al.(1973 and Bahtia et al. (1983) estimated that the maximumsustainable yield for demersal fish resources in the Gulf of Thailand was 0.768million ton and 0.200 million ton in Andaman Sea, for pelagic fish resources theywere 0.365 and 0.071 million ton accordingly.; a total of 1.404 million ton. lower
L-31
than the maximum target production as set by Department of Fisheries. Compare tothe reported catches, the fishery resources has already been overexploited.
Panayoutou and Jetanavanich (1987) applied bio-economic fixed price model forfisheries in the Gulf of Thailand. Their findings indicated that at maximumsustainable economic yield, the effort should be 61.46 % of the actual effort in 1982.At this optimum control there would be an economic rent of 14.173 billion baht. Thecatch from the Gulf of Thailand would be 0.9 million ton, slightly less than themaximum sustainable yield. Nevertheless action had not been taken to effectivelyreduce the fishing effort.
Fishing vessels were required to register the vessel with Department of Harbor,Ministry of Communication; and register the fishing gear with Department ofFisheries which they would be charged for fishing licenses. Charge rate was verylow, reflecting only the registration fee, not for the economic rent in fishing.Nevertheless less than 70% of the total vessels in Thai waters registered withDepartment of Harbor. Less than 30% registered their fishing gears. There were 30%of the vessels which did not registered at any department.14 Thus there was a problemin effective control on fishing effort in Thai waters. Without proper licensing system,it was difficult to effectively control fishing effort. The excessive fishing effortwhich led to overfishing and fishery resource degradation could not be effectivelyreduced. The buy back scheme was proposed but had never been undertaken due tobudget constraint as well as difficulty in effective control on number of fishingvessels.
There were more than three hundred landing points for marine captures along thelong coastlines, thus difficult to be controlled. Limited fishing access via quotaregime was considered difficult and would not be efficient for multi-gear/multi-species fisheries in Thailand, especially for scattered small scale fisheries.15
Thus fisheries management schemes were more oriented on resource renewal likeclosed-area and closed-season. Once resources were renewed it would attract morefishing effort and finally resource degradation.
The lack of effort control and over fishing was burden on small scale fisheries.Resource rent, before being dissipated, was enjoyed by capable fishermen, mainlycommercial fishermen. Those fishermen with access to the rent, afforded investmentin more profitable non-fishing sector as well as building up their capacity to fishoutside Thai waters. It had been small scale fishermen, without alternative non-fishing earning, who suffered from fisheries resource degradation in Thai waters.
Attempts had been on development of community-based fisheries management(CBFM) and co-management. Still, there were need for legislation in support for thisregime and need for capable community organization for fisheries management.Recently, various NGOs had been working in support for strengthening communityorganization for coastal fisheries management. Federation of Southern Fishermen
14 Based on the estimation by Mr.Wicharn Siorichaiekawat, President of Sirichai Fisheries Group.15 Large commercial fisheries could run their own landing places. Department of Fisheries might notbe capable in effective quota control.
L-32
was established and had been working effectively in participation on policy andplanning, for coastal poor.
5. POLICY MAKING
5.1. Poverty Issue
Poverty reduction/eradication has been one of the important national agenda.
Number of the poor had been decreasing through the years. Before economic crisis,Thai economic growth rate had been recorded high probably the highest among thehighest among Southeast Asian countries. Nevertheless, income disparity was stillthe problem. Income gap was considered higher than neighboring countries. Therewere regional and sectoral inequalities, in favor for the metropolitan areas andmanufacturing sector. Poverty has been concentrated in Northeast, North and Southregions. The poor mainly lived in the villages and engaged in farming, with limitedland holding.
Inadequate education and skill limited job opportunity among the poor. Governmenthad put effort in poverty reduction through various community development schemesincluding strengthening their capacity and providing sources of investment fund.Priority has been given on human resource development to reduce income disparitiessince the 8th National Economic and Social Development Plan (1997 – 2001), withemphases on decentralization, enhancing community roles, and rehabilitating naturalresource and environment.
Rapid economic development, especially before the economic crisis, had put thepriority on industrial development which relied on imported raw material andtechnology while being less aware of the loss of the society and natural resourceendowments. Export oriented production had adversely affected the poor.Infrastructure development concentrated in large cities leaving behind the ruralsector, leading to greater disparity. Limited access to capital investment fund amongthe poor even greater limited their opportunity to share the economic growth.
Government of Thailand pro-poor macroeconomic policies put the emphases on thefollowings.16
- Rational exploitation on natural resources and environment- Growth in the sector which the poor relied on, to provide job and
income for poverty reduction- Mild inflation to lessen price instability- Rational exchange to reduce price instability and increase
competitiveness- Maintaining interest rate to induce investment in technology and
equipment for effective input utilization- Low interest rate credit on capital investment for the poor- Increase government budget for poverty eradication
16 Details are available from NESDB (2003), NESDB (2004), NESDB (2005) andhttp://www.worldbank.org/eapsocial/countries/thai/pov.htm.

L-33
- Promotion on value added and upgrading labor skill andtechnology activities
- Pro-poor safety net against trade liberalizationPolicies for poverty eradication included 1) Macroeconomic policy in support forsafety net for the poor e.g. investment in agriculture and agro-industry, value addedfor agricultural products, targeting inflation management to lessen negative impacton the poor, improve tax collection in favor for the poor, provision on access toinformation system and technology, and provision to protect adverse impact fromtrade liberalization regime; 2) Promotion on basic social services and infrastructuree.g. provision on social welfare, health insurance, and social security; 3) Promotionon collaboration among relevant agencies and policies in poverty eradication; 4)Efficient management administration system covering self-sufficiency policy,development on poverty indicators, improved legislation in favor of betteropportunity for the poor, and improved laws and regulations on natural resources andenvironment to increase local participation in resource management.
Government objectives were 1) increasing opportunity 2) income generation and 3)reducing non-productive consumption expenditure. Investment funds were providedto increase opportunity for the poor through village fund, people bank, and small-medium enterprise bank. Programs for these strategies included small-scale lowinterest loans for poor households, cash transfer for elderly and the poor, and in kindtransfer (medical services and school lunch program). Attempts were on ruraldevelopment through the support on local productive capacity, infrastructuredevelopment, job creation, and provision on basic social services. After the economiccrisis, through the international support, investment funds were made available forthe poor.17 Better education was provided through access to education, curriculumreform, and skill improvement. Compulsory education was extended from 9 to 12years.
Action plan in poverty eradiation were dived into 1) macroeconomic policy with theemphases on turning assets in to capital investment fund and tax policy in favor forthe poor; 2) Increasing capacity of the poor with the emphases on communityplanning, village fund, debt moratorium, and people’s bank; 3) Natural resourcemanagement with the emphases on land use planning, agricultural economic zoning,and water resource and forestry management; 4) social safety net with the emphaseson health insurance and social services to the poor; and 5) public managementadministration system with the emphases on budget revision18 and role of theCommittee on Regional and Local Growth Distribution Policy.
According to the National Social and Economic Development Board (NESDB), threemain objective for poverty eradication included 1) Reducing poverty and incomedisparities via indigenous knowledge and community organization; 2) Increasingcompetitiveness via increasing domestic productivity and export; and 3) Sustainabledevelopment via human resource development, management administration, peopleparticipation and natural resource conservation and development.
17 Examples were Social Investment Project (SIP) supported by the World Bank, Asian developmentBank, and Japan; Social Sector Program Loan (SSPL) supported by Asian Development Bank, andEconomic Recovery Social Sector Program Loan (ERSSPL) supported by Japan.18 About 13% of the government budget has been allocated for poverty eradication, with anincreasing share through the years.

L-34
Overall NESDB evaluations on poverty eradication were as follows:- Headcount ratio decreased from 14.2% to 10.3% in 2002- Income gap between the richest and poorest reduced from 14.8% in 2000
to 13.7% in 2002- Agricultural household income increased 14.3% in 2002- Unemployment decreased from 3.59% in 2000 to 2.24% in 2002.
The core government agency in responsible for the design of poverty eradicationpolicies was the National Social and Economic Development Board (NESDB).Implementing agencies would collaborate in undertaking the action plan. Under theumbrella of NESDB there was an NGO “Thai Bhattana Foundation” working closelywith NESDB on self sufficiency economic regime and civil society. RecentlyNESDB put the priority on strengthening community organization for povertyeradication. During the 8Th Plan Committee on Regional and Local GrowthDistribution Policy was established. Subcommittee on Action Plan for PovertyEradication Strategies was set up to coordinate the action plan among Committee onRegional and Local Growth Distribution Policy, National Committee on UrbanDevelopment, and National Committee on Social Policy. Experts and representativesfrom civil society were included in this subcommittee. The tasks in action planswould be assigned to relevant agencies, in collaboration with communityorganizations and NGOs, under supervision of the Committee on Regional and LocalGrowth Distribution Policy.
Poverty eradication plan, holistic government budget plan, community planningproject, and community networking were undertaken. Still there were problems onineffective management administration (lack of integration, limited participation ofrelevant agencies, focus on public role, limited participation from the poor,coordination between public sector and the community); limited pro-poor structuraladjustment for natural resource management and legislation ; and lack of supportiveplans (reducing rural poor expenditure, market promotion, agricultural land for poorfarmers).
5.2 Poverty and The Fishing Sector
The poorest in Thailand were rural dwellers that relied mainly on agriculture, in theNortheaster Region. 19.6% of the poor lived in the rural Northeastern Region whilethere was only 9.2% in rural Southern Region, mostly coastal areas. On the averagefishermen were not considered poor. NESDB (2001) reported that the “poor” villagesin the Southern Region accounted for 1.72% of the total country poor villages. Themain reason for being poor was lack of agricultural land, thus could not grow paddyfor domestic rice19 consumption. Poverty eradication was focused on non-fishingagricultural sector.
Nevertheless, duality existed in Thai fishing sector. There were large commercialsector that had been benefited from the resource rent when fishery resources werestill abundance, and small scale artisanal sector who suffered from resourcedegradation. Small scale fishing household, on the average, could earned net income
19 Rice is the staple food for the Thais.

L-35
from their fishing. They were considered better off compared to landless farmers inthe Northeastern Region.
Nevertheless negative impact from fishery resource degradation had been aware. Inpoverty eradication scheme, fishing sector was mentioned in the part of improvementon natural resources and environmental management. Fishery resource abundance,especially in the Gulf of Thailand, had evidently been degraded. The need for Thaiwater rehabilitation was realized both in public and private sector.
Attempts on natural resource, including fishery resource, management in povertyreduction scheme were to revise the rules and regulation and increase the role oflocal community in natural resource management. While water resources andforestry resources20 had the priority in poverty reduction scheme, community-based/co-management had been developed in coastal fisheries. Collaborations werefound among relevant government agencies (both central and local), NGOs, and thecoastal communities. Department of Fisheries put effort on uplifting living conditionfor coastal poor through extension on non-destructive fishing gear and fishprocessing and provision on revolving fund.
Fishing sector has been one important source of foreign exchange earning forThailand. Thus the poor fishing sector might have not been a clear picture. Duringthe years of abundant resources, government policies for the fishing sector wereincreasing productivity oriented, from capture as well as culture. The priority had notbeen given on rational resource exploitation, thus Thai fisheries were soon degraded.
First to suffer from the degradation were coastal small scale fishermen. Incollaboration with NGOs, the fishermen established the Federation of ArtisanalFishermen. The NGOs in the Southern Thailand were actively involved in theactivities in lack of government support, playing significant development role in poorfishing villages. Success of the Federation was due to strong communityorganization, partially supported by the NGOs. Partnership among the fishermen andvarious NGOS were developed. Among Thai Muslim fishing village, ruralmicrofinance was developed, leading to investment fund and employment generationfor the coastal poor.
One of the keys of success in involving local community in fishery resourcesmanagement is the capability of local community organization. There had been anumber of successful community-based fishery management in Southern Thailand,with support from NGOs.
Strong leadership, good governance and transparency could be the basis fordeveloping capable community organization for fishery resource management.Besides human factor, geographical boundary was another key. A “close” (or semi-close) boundary of the fishing ground could ease the monitoring, thus moreeffectively regulated. Legislation on community-based/co-management was anotherrequirement. Department of Fisheries had put effort in drafting legislation for this 20 Efficient water resource management was essential in increasing farming productivity. Forestryresource management was essential for reducing soil erosion, increasing soil fertility, lesseningdrought and flood; thus better faming productivity. Poor villagers living along the buffer zonedepended on forest products for their living as well as income generation.
L-36
regime. There was still some disagreement from stakeholders who had a potentialloss from this management regime.21 Local coastal community, at present couldmonitor but once there was any intrusion or illegal fishing in their waters22, they didnot have the right to enforce. Effective collaboration from the public sector wasrequired for the enforcement.
Socio-economic studies in small scale fishing sector were undertaken in late 1970sunder the Small Scale Fisheries Development supported by InternationalDevelopment Research Centre. The project covered a number of Asian countries,including Thailand. Nevertheless the results were not implemented in policy term, inThailand. In mid 1980s, Panayotou conducted several studies on small scale Thaifisheries. Panayotou and Jetanavanich (1985) gave empirical evidence that the Gulfof Thailand had been over fishing. They recommended an immediate halt inconstruction of new trawlers, licensing to control existing vessels, artificial reef toenhance resource abundance for coastal fisheries, and community fishing right. Thefirst two had never been effectively undertaken. Through the FAO advice,Department of Fisheries agreed on artificial reef. In late 1980s more intention was ondevelopment community-based fishery management.23
Loss of juvenile economic species caught as trash fish was one of the problems indevelopment of Thai fisheries. Suteemechaikul (1992) estimated an economic loss ofjuvenile catches as trash fish by push net and small trawl in Ban Don Bay (in theupper south, Gulf of Thailand) to be 82 – 302 million baht, varied by type of gearand size of vessel. The Bay had been over fished. Economic rent varied by type ofgear and size of fishing being 27 million baht/year for 14-18 m pair trawl to 890million baht/year for push net. Dejboon (1998) applied the same estimationprocedure for large push net in lower Gulf of Thailand. Loss of juvenile economicspecies was 0.46 million baht/yr/vessel while the net return, on the average, was lessthan ten thousand baht not accounting for the juvenile loss. These two studiesprovided empirical evidence on the loss from trawls and push net.
Nevertheless the aforementioned studies were based on single species fixed pricebio-economic model which might not be suitable for multi-species trawl and push netfisheries in Thailand.
Once the fishery resources were degraded, large trawl left the Gulf of Thailand fornew fishing grounds. Small trawls were adjusted for anchovy fishing, using finemesh size. Anchovy light luring fisheries were considered destructive and hadadverse impact on coastal fisheries. In 1999 Federation of Artisanal Fishermenrequested the government to control such fishing gears. Research team fromacademic institutes was assigned to conduct studies for policy making. Study resultsindicated that coastal fisheries were adversely impact and there should be control onanchovy light luring fishing effort.24
21 Trawler that fished in coastal waters could disagree since they might not be able to continue theirfishing. Nevertheless through the negotiation, plausibility could be granting tradable fishing right tothe coastal community. Similar regime had been conducted in coastal Japanese Fisheries.22 Examples were trawl and motorized push net within three kilometers from the shoreline.23 Thailand National Policies can be found at http://www.fisheries.go.th/english/index.html24 Details in Tokrisna (2000).
L-37
There were a number of socio-economic studies on small scale fisheries undertakenby NGOS. For examples the study on adverse impact of push net by SouthernCoastal Resource Management Project and Federation of Southern ArtisanalFishermen (2000), trawl and Thai sea crisis by Southern Coastal ResourceManagement Project (2001), Songkhla Lake fisheries by Southern Coastal ResourceManagement Project (2002 and 2003), and community based natural resourcemanagement by Project of Coastal Zone management through CommunityOrganization and Networks in Southern Thailand: Thai NGO-COD and DANCEDpartnership (2002). These studies focused on the problems of artisanal fisheries insouthern Thailand.
Participation of poor people in economic growth activities, policymaking andimplement had been encouraged through NGO support on strengthening capacity andnetworking fishing community organization. Academicians could provide thesupport on technical studies, being information for policy makers. There had beeneffort on social and economic studies.
Nevertheless efficient coastal fishery management, beside indigenous knowledge,required technical information on management scheme. Limited effort had been onbiological and bio-economic studies.
For poverty eradication, too little attention had been on the coastal poor. Thereshould be studies on poverty status, cause and reduction in uplifting living conditionsfor coastal poor.
Important areas for future policy development, a linkage between fisheries, economicgrowth and poverty reduction could be capacity strengthening in fishery resourcemanagement, post harvesting handling, value added processing, marketing of fisheryproducts on the basis of pro-poor development strategies.
Constraints on artisanal pro-poor fisheries development could be the lack of co-ordination of among relevant agencies, the budget, capacity of human resources, andmarketing skill.
REFERENCES AND ADDITIONAL READING
Dejboon, W. (1998). Economics of Large Scale Push Net fisheries Management inLower South, the Gulf of Thailand; A Case Study of Changwat Pattani, GraduateSchool, Kasetsart University, Bangkok. (In Thai).
Fisheries Statistical Research and Statistical Group. (2000). Fisheries Statistics ofThailand 2000, Department of Fisheries, Ministry of Agriculture and Cooperatives,Bangkok
National Social Economic Development Board. (2003). Factor Analysis of RuralPoverty and Development Problems, Mimeo., In Thai.

L-38
National Social Economic Development Board. (2004). Report on IntegratedCommunity Strength and Poverty Eradication, First Phase (May 2003 – May 2004),Mimeo., In Thai.
National Social Economic Development Board. (2005). Thailand Poverty Profile andPoverty Reduction Strategies, Mimeo.
National Statistical Office. (2004) Social Indicators 2004, Ministry of Informationand Communication Technology, Bangkok
National Statistical Office (2002, 2000). Marine Fishery Census, Office of the PrimeMinister, Bangkok
Panayotou, T. and S. Jetanavanich. (1987). The Economics and Management of ThaiMarine Fisheries, ICLARM Studies and Reviews 14, Philippines
Project of Coastal ZoneManagement through Community Organization and Networkin Soputhern Thailand: Thai NGO – COD and DANCED Partnership, CommunityBased Natural Resource Management: Case Studies from Southern TraditionalFisher Folk Communities, Ferng-fah Printing Co.Ltd., Bangkok
Southern Coastal Resource Management Project. (2000). Aun Roon…KatagornHaeng Tong Talay Thai, Haad Yai Print, Sopngkhla (In Thai)
Southern Coastal Resource Management Project. (2001). Aun Lak Parb satorn wigritTalay Thai, Ferng-fah Printing Co.Ltd., Bangkok. (In Thai)
Southern Coastal Resource Management Project. (2002). Kon Furn Talay Sarb,Ferng-fah Printing Co.Ltd., Bangkok. (In Thai)
Southern Coastal Resource Management Project. (2002). Kon Loom Nam TalaySarb Songkhla, Ferng-fah Printing Co.Ltd., Bangkok. (In Thai)
Suteemechaikul, S. (1992). An Evaluation on Economic Losses from Utilization ofAquatic Livings by Push Net and Trawlers in Ban Don Bay, Graduate School,Kasetsart University, Bangkok. (In Thai)
Tokrisna, R.(2000). Conflict in Fishery resource Utilization; A Case Study of LightLuring Anchovy Fishjery in Thailand, IIFET Proceeding 2000, Oregon.
http://www.fao.org/fi/fcp/en/THA/profile.htmhttp://www.fao.org/fi/fcp/en/THA/profile.htmhttp://www.nesdb.go.th/econSocial/macro/nad.htmhttp://www.bot.or.th/bothomepage/databank/EconData/Thai_Key/Thai_KeyE.asphttp://www.fisheries.go.th/it/stathttp://www.nso.go.th/eng/stat/subject/subject.htm#cata1http://www.globalbarometer.org/governanceindicators/Thailand.htmhttp://www.globalbarometer.org/governanceindicators/Thailand.htmhttp://unstats.un.org/unsd/demographic/products/socind/socind2.htm

L-39
http://www.imf.org/external/pubs/ft/weo/2004/02/data/dbcoutm.cfm?SD=1998&ED=2005&R1=1&R2=1&CS=3&SS=2&OS=C&DD=0&OUT=1&C=578&S=NGDP_RPCH-NGDP_R-NGDP-NGDPD-NGDP_D-NGDPRPC-NGDPPC-NGDPDPC-PPPWGT-PPPSH-PPPEX-PPPPC-PCPIPCH-PCPI-BCA_NGDPD-BCA&CMP=0&x=39&y=8http://hdr.undp.org/statistics/data/cty/cty_f_THA.htmlhttp://poverty.nesdb.go.th/poverty_new/showreport.aspx?file=report/pov_profile_year.rpt&query=&formula=http://www.ops2.moc.go.th/meeting/trade2.xls
�

L-40
Table 1 Thai Population, 1980 - 2003
Year Total Male Female Density (persons/sq km)
� � � � � � �� � � � � �� � �� � � �� � � � � �
� � � � � � �� � �� � � �� � � � � � �� � � �� � � � �
� � � � � �� � � �� � � � � � �� � � � � � �� � � � �
� � � � � � � �� � � � �� � � �� � � � �� � � � � � � � �
� � � � � � � �� � �� � � �� � � �� � �� � � � � � �
� � � � �� � �� � � �� � �� � � �� �� � � � � �� �
� � � � �� � � � � � � �� � �� � � � � � � � � � �
� � � � �� � �� � � �� � � �� � �� � �� � � � � � �� �
� � � � � �� � � �� � � � � � � � � � � � � �� � � � � � �� �
� � � � �� � � � � � �� � � � � � �� � � �� � � � � ��
� � � � � � � � � � �� � � � � � �� �� � � � � � ��
� � � � � �� � � �� � � �� � �� � � �� � � �� � � � � �� �
� � � � �� � � �� � � �� � � �� � � �� � � �� � � � ��
� � � � � � �� � � � � �� � � � �� � �� � � � � �� �
� � � � � �� � �� � � � � �� � � � � � �� � � � � �� �
� � � � �� � � � � � �� � � �� � � � �� � � �� � � � �� �
� � � � � � �� � � �� � � �� � �� � � �� � �� � � � �� �
� � � � � � �� � � � � � � � �� � � � � � �� � � � � �
� � � � � � �� � � �� � � � � � � �� � � �� � � � � � � � � �� �
� � � � � � �� � � �� � � � �� � �� � � �� � � � � � � �� �
� � � � � �� � � �� � � � �� �� � � � �� �� � � � � �
� � � � � � � �� � � � �� � �� � � � � �� � � � ��
� � � �� � � �� � � �� � �� � � � �� � � � � � �
���� � � � �� � � �� � � � � � � �� � �� � � �� � � � �� � ��� � ��� � � ��� �� ��� ��� � �� ���� � ��� �� �� ��� �� �� �� ��� �� �� � �� ��� �! ��" �##$ $ $ �� � � �% � ��! #� � % #� �� �#� � & '� � �#� � & '� � ��! �( ) � � �� � �

L-41
Figure 1 Thai Population 1980 – 2003
���������
��,���,�����������
��,���,�����������
#�,���,�����������
$�,���,�����������
"�,���,�����������
��,���,�����������
��,���,�����������
����
����
���$
����
����
����
����
���$
����
����
����
����
�� ���
6���
Source: Table 1.
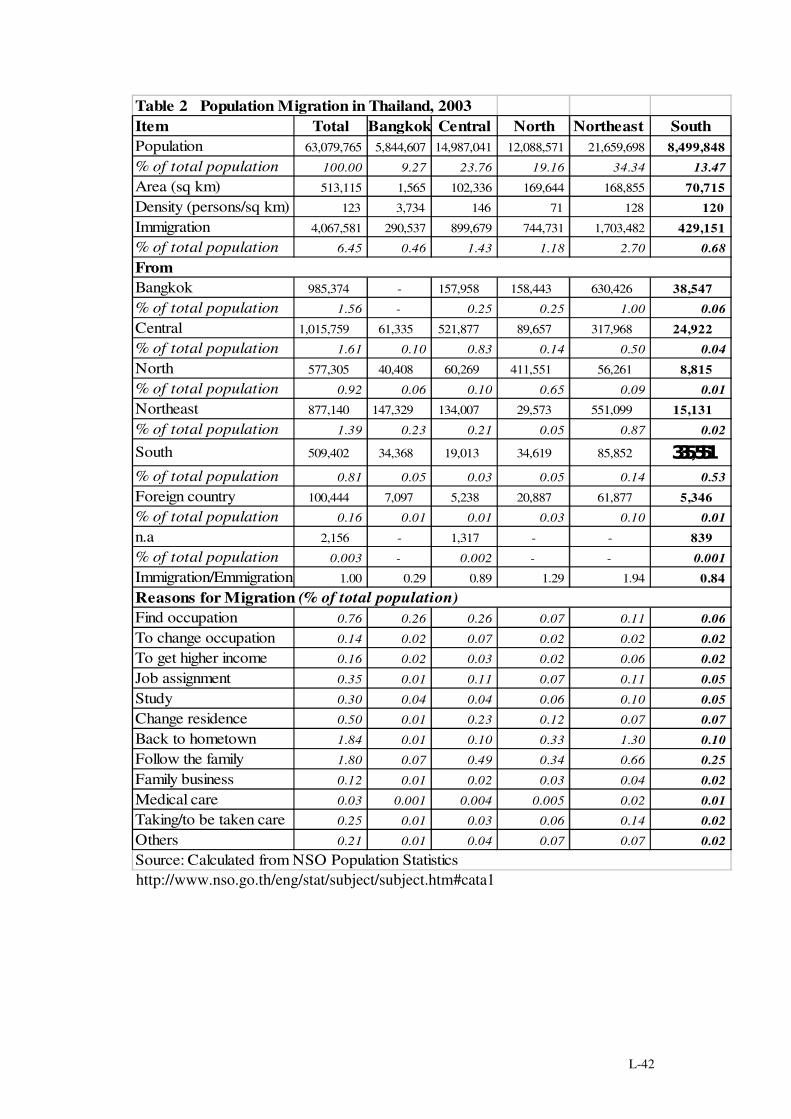
L-42
Table 2 Population Migration in Thailand, 2003Item Total Bangkok Central North Northeast SouthPopulation 63,079,765 5,844,607 14,987,041 12,088,571 21,659,698 8,499,848 % of total population 100.00 9.27 23.76 19.16 34.34 13.47Area (sq km) 513,115 1,565 102,336 169,644 168,855 70,715 Density (persons/sq km) 123 3,734 146 71 128 120 Immigration 4,067,581 290,537 899,679 744,731 1,703,482 429,151 % of total population 6.45 0.46 1.43 1.18 2.70 0.68
Bangkok 985,374 - 157,958 158,443 630,426 38,547 % of total population 1.56 - 0.25 0.25 1.00 0.06Central 1,015,759 61,335 521,877 89,657 317,968 24,922 % of total population 1.61 0.10 0.83 0.14 0.50 0.04North 577,305 40,408 60,269 411,551 56,261 8,815 % of total population 0.92 0.06 0.10 0.65 0.09 0.01Northeast 877,140 147,329 134,007 29,573 551,099 15,131 % of total population 1.39 0.23 0.21 0.05 0.87 0.02
South 509,402 34,368 19,013 34,619 85,852 ���,��������% of total population 0.81 0.05 0.03 0.05 0.14 0.53Foreign country 100,444 7,097 5,238 20,887 61,877 5,346 % of total population 0.16 0.01 0.01 0.03 0.10 0.01n.a 2,156 - 1,317 - - 839 % of total population 0.003 - 0.002 - - 0.001Immigration/Emmigration 1.00 0.29 0.89 1.29 1.94 0.84
Find occupation 0.76 0.26 0.26 0.07 0.11 0.06To change occupation 0.14 0.02 0.07 0.02 0.02 0.02To get higher income 0.16 0.02 0.03 0.02 0.06 0.02Job assignment 0.35 0.01 0.11 0.07 0.11 0.05Study 0.30 0.04 0.04 0.06 0.10 0.05Change residence 0.50 0.01 0.23 0.12 0.07 0.07Back to hometown 1.84 0.01 0.10 0.33 1.30 0.10Follow the family 1.80 0.07 0.49 0.34 0.66 0.25Family business 0.12 0.01 0.02 0.03 0.04 0.02Medical care 0.03 0.001 0.004 0.005 0.02 0.01Taking/to be taken care 0.25 0.01 0.03 0.06 0.14 0.02Others 0.21 0.01 0.04 0.07 0.07 0.02
Reasons for Migration (% of total population)
From
Source: Calculated from NSO Population Statistics http://www.nso.go.th/eng/stat/subject/subject.htm#cata1

L-43
Item 2000 2001 2002 2003 2004(p)
1. Population (millions) 61.88 62.31 62.80 63.08 63.35
(% change) 0.13 0.70 0.79 0.45 0.43
2. GDP at constant 1988 price (billion baht) 3,073.6 3,237.6 3,460.0 .... ....
(% change) 2.2 5.3 6.9 .... ....
2.1 Agriculture (billion baht) 320.0 323.4 351.5 .... ....
(% change) 3.2 1.0 8.7 .... ....
2.2 Non-agriculture (billion baht) 2,753.6 2,914.2 3,108.5 .... ....
(% change) 2.0 5.8 6.7 .... ....
3. GDP at current price (billion baht) 5,133.5 5,446.0 5,930.4 .... ....
(% change) 4.3 6.1 8.9 .... ....
4. GNP per capita (baht) 80,558 84,846 91,420 .... ....
5. Consumer Price Index (2002=100) 99.4 100.0 101.8 104.6 104.6
(% change) 1.6 0.7 1.8 2.7 2.7
6. Export (billions of US$) 63.1 66.1 78.1 96.1 96.1
(% change) -7.1 4.8 18.2 23.0 23.0
7. Import (billions of US$) 60.6 63.4 74.3 94.4 94.4
(% change) -3.0 4.6 17.4 27.0 27.0
8. Trade balance (billions of US$) 2.5 2.7 3.8 1.7 1.7
9. Current account balance (billions of US$) 6.2 7.0 8.0 7.3 7.3
(% of GDP) 5.4 5.5 5.6 .... ....
10. Net capital movement (billions of US$) -4.6 -4.2 -8.0 0.1 0.1
- Private 3/ -3.9 -5.7 -8.8 -0.8 -0.8
- Public -0.3 -2.5 -1.9 -2.2 -2.2
- Bank of Thailand -0.4 4.0 2.7 3.1 3.1
11. Balance of payments (billions of US$) 1.3 4.2 0.1 5.7 5.7
12. Exchange rate(baht : US$) 44.5 43.0 41.5 39.2 39.2
Source: Bank of Thailand
Table 3 Thailand's Key Economic Indicators
http://www.bot.or.th/bothomepage/databank/EconData/Thai_Key/Thai_KeyE.asp

L-44
Item 2000 2001 2002 20031 Agriculture 444.2 468.9 513.1 595.0
(% of GDP) 9.02 9.13 9.42 10.032 Agriculture, hunting and forestry 326.4 358.0 407.0 491.0
(% of GDP) 6.63 6.97 7.47 8.283 Fishing 117.8 110.9 106.0 104.0
(% of GDP) 2.39 2.16 1.95 1.754 Non-agriculture 4,478.5 4,664.6 4,932.9 5,335.4
(% of GDP) 90.98 90.87 90.58 89.975 Mining and quarrying 116.7 126.2 135.9 154.6
(% of GDP) 2.37 2.46 2.50 2.616 Manufacturing 1,653.7 1,715.9 1,831.9 2,060.4
(% of GDP) 33.59 33.43 33.64 34.747 Electricity, gas and water supply 146.1 166.7 175.6 190.9
(% of GDP) 2.97 3.25 3.22 3.228 Construction 150.6 154.5 165.7 175.6
(% of GDP) 3.06 3.01 3.04 2.969 Wholesale and retail trade, repair of vehicles and h/h goods 847.6 856.1 866.0 914.3
(% of GDP) 17.22 16.68 15.90 15.4210 Hotels and restaurants 275.2 289.2 309.6 300.4
(% of GDP) 5.59 5.63 5.68 5.0711 Transport, storage and communications 395.9 427.0 449.6 465.2
(% of GDP) 8.04 8.32 8.26 7.8412 Financial intermediation 145.8 151.4 171.0 202.2
(% of GDP) 2.96 2.95 3.14 3.4113 Real estate, renting and business activities 161.8 163.9 171.7 177.9
(% of GDP) 3.29 3.19 3.15 3.0014 Public administration and defence, compulsory social security 211.0 222.2 244.7 262.1
(% of GDP) 4.29 4.33 4.49 4.4215 Education 196.5 202.3 211.3 220.9
(% of GDP) 3.99 3.94 3.88 3.7216 Health and social work 96.7 104.8 107.6 106.8
(% of GDP) 1.96 2.04 1.98 1.8017 Other community, social and personal service activities 73.8 77.1 85.0 96.2
(% of GDP) 1.50 1.50 1.56 1.6218 Private households with employed persons 7.0 7.3 7.5 7.8
(% of GDP) 0.14 0.14 0.14 0.1319 Gross domestic product 4,922.7 5,133.5 5,446.0 5930.4
(% of GDP) 100.00 100.00 100.00 100.00
Table 4 Gross Domestic Product by Sector, Thailand 2000 - 2003 (millions of baht)
Source : Calculated from Statistics of National Economic and Social Development Board ( NESDB)http://www.nesdb.go.th/econSocial/macro/nad.htm
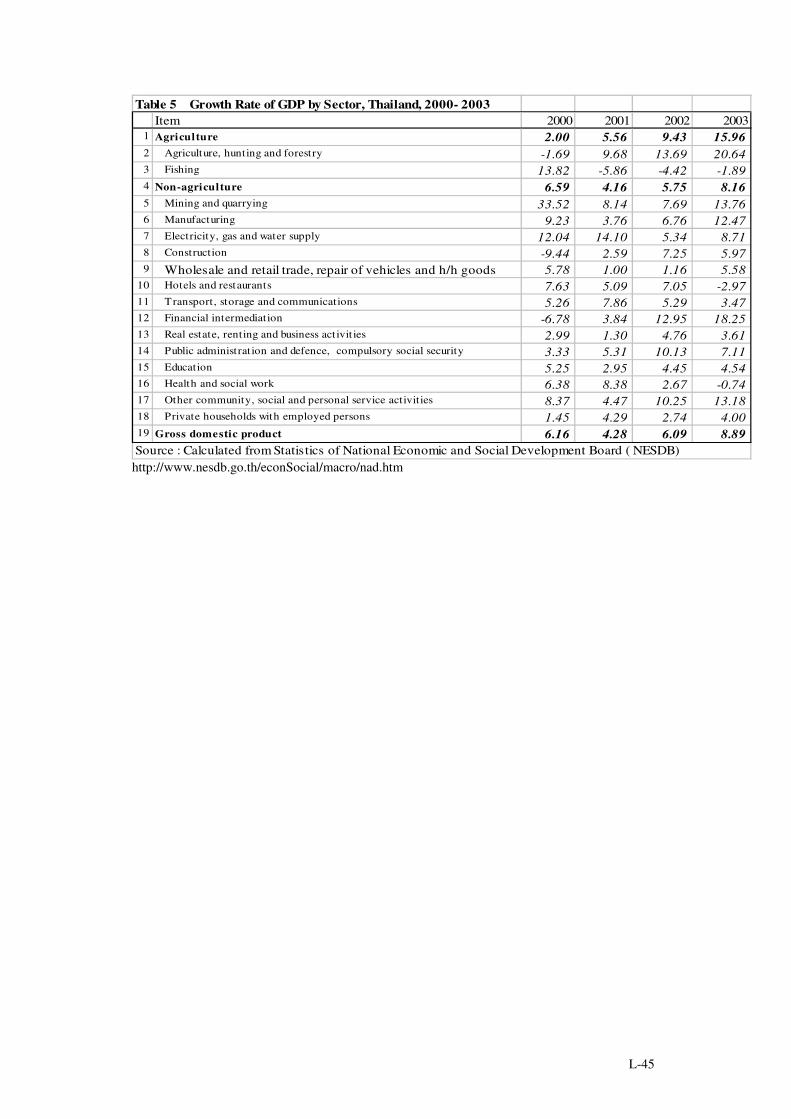
L-45
Table 5 Growth Rate of GDP by Sector, Thailand, 2000- 2003Item 2000 2001 2002 2003
1 Agriculture 2.00 5.56 9.43 15.962 Agriculture, hunting and forestry -1.69 9.68 13.69 20.643 Fishing 13.82 -5.86 -4.42 -1.894 Non-agriculture 6.59 4.16 5.75 8.165 Mining and quarrying 33.52 8.14 7.69 13.766 Manufacturing 9.23 3.76 6.76 12.477 Electricity, gas and water supply 12.04 14.10 5.34 8.718 Construction -9.44 2.59 7.25 5.979 Wholesale and retail trade, repair of vehicles and h/h goods 5.78 1.00 1.16 5.58
10 Hotels and restaurants 7.63 5.09 7.05 -2.9711 Transport, storage and communications 5.26 7.86 5.29 3.4712 Financial intermediation -6.78 3.84 12.95 18.2513 Real estate, renting and business act ivit ies 2.99 1.30 4.76 3.6114 Public administrat ion and defence, compulsory social security 3.33 5.31 10.13 7.1115 Education 5.25 2.95 4.45 4.5416 Health and social work 6.38 8.38 2.67 -0.7417 Other community, social and personal service activities 8.37 4.47 10.25 13.1818 Private households with employed persons 1.45 4.29 2.74 4.0019 Gross domestic product 6.16 4.28 6.09 8.89Source : Calculated from Statistics of National Economic and Social Development Board ( NESDB)http://www.nesdb.go.th/econSocial/macro/nad.htm

L-46
Table 6 Thailand Political Development Indicators
%Positive
Difference fromEast Asian mean
Political Participation and Elections
Interest in politics 73 33
Opinion leader (convince, asked opinion) 31 10
Supports party 41 -6
Trust in Institutions
Parliament/Congress 55 12
Police 56 3
Political parties 47 12
Courts 58 2
Army, military 76 11
Television 76 9
Newspapers 51 -4
Rule of Law, Crime & Corruption
Freedom from corruption 65 21
Corruption lessened under new regime 70 38
No experience of corruption 67 -11
Identities
Identifies with nation 38 -26
Religion
Nominally Buddhist 94 61
Evaluating Economic Conditions
Rating current economy positively 39 18
Economy improved over past 5 years 38 7
Positive about future economy 54 12
Satisfied with current household economy 25 2
Household economy better than in the past 37 4
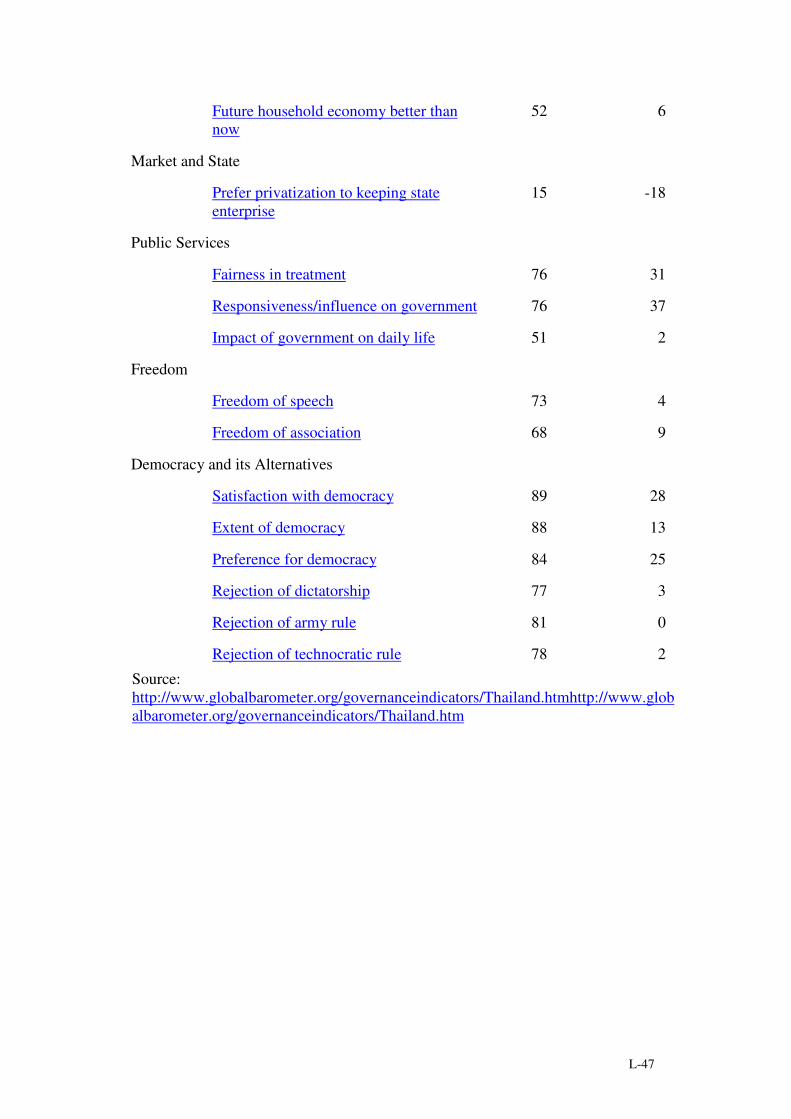
L-47
Future household economy better thannow
52 6
Market and State
Prefer privatization to keeping stateenterprise
15 -18
Public Services
Fairness in treatment 76 31
Responsiveness/influence on government 76 37
Impact of government on daily life 51 2
Freedom
Freedom of speech 73 4
Freedom of association 68 9
Democracy and its Alternatives
Satisfaction with democracy 89 28
Extent of democracy 88 13
Preference for democracy 84 25
Rejection of dictatorship 77 3
Rejection of army rule 81 0
Rejection of technocratic rule 78 2
Source:http://www.globalbarometer.org/governanceindicators/Thailand.htmhttp://www.globalbarometer.org/governanceindicators/Thailand.htm
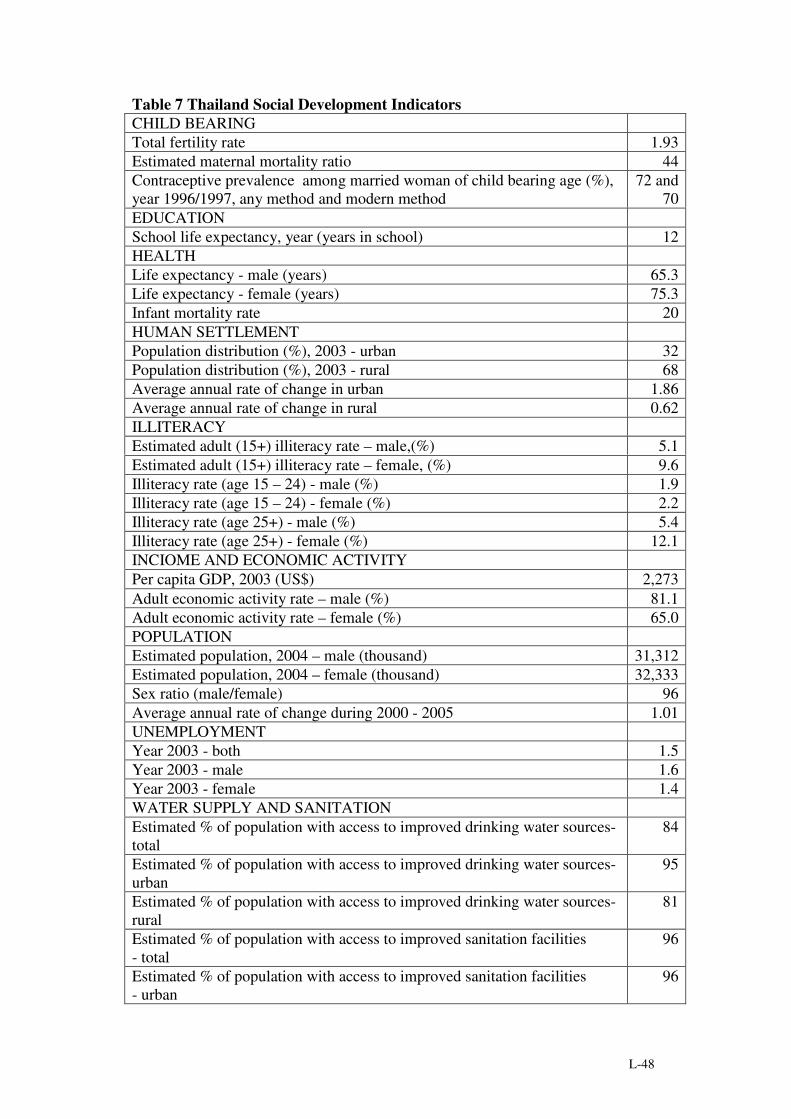
L-48
Table 7 Thailand Social Development IndicatorsCHILD BEARINGTotal fertility rate 1.93Estimated maternal mortality ratio 44Contraceptive prevalence among married woman of child bearing age (%),year 1996/1997, any method and modern method
72 and70
EDUCATIONSchool life expectancy, year (years in school) 12HEALTHLife expectancy - male (years) 65.3Life expectancy - female (years) 75.3Infant mortality rate 20HUMAN SETTLEMENTPopulation distribution (%), 2003 - urban 32Population distribution (%), 2003 - rural 68Average annual rate of change in urban 1.86Average annual rate of change in rural 0.62ILLITERACYEstimated adult (15+) illiteracy rate – male,(%) 5.1Estimated adult (15+) illiteracy rate – female, (%) 9.6Illiteracy rate (age 15 – 24) - male (%) 1.9Illiteracy rate (age 15 – 24) - female (%) 2.2Illiteracy rate (age 25+) - male (%) 5.4Illiteracy rate (age 25+) - female (%) 12.1INCIOME AND ECONOMIC ACTIVITYPer capita GDP, 2003 (US$) 2,273Adult economic activity rate – male (%) 81.1Adult economic activity rate – female (%) 65.0POPULATIONEstimated population, 2004 – male (thousand) 31,312Estimated population, 2004 – female (thousand) 32,333Sex ratio (male/female) 96Average annual rate of change during 2000 - 2005 1.01UNEMPLOYMENTYear 2003 - both 1.5Year 2003 - male 1.6Year 2003 - female 1.4WATER SUPPLY AND SANITATIONEstimated % of population with access to improved drinking water sources-total
84
Estimated % of population with access to improved drinking water sources-urban
95
Estimated % of population with access to improved drinking water sources-rural
81
Estimated % of population with access to improved sanitation facilities- total
96
Estimated % of population with access to improved sanitation facilities- urban
96

L-49
Estimated % of population with access to improved sanitation facilities- rural
96
YOUTH AND ELDERLY POPULATIONS% of population under age 15 in Year 2004 25% of male population age 60+ in Year 2004 8% of female population age 60+ in Year 2004 10Sex ratio (male/100 female) in population aged 60+ 83Source: http://unstats.un.org/unsd/demographic/products/socind/socind2.htm
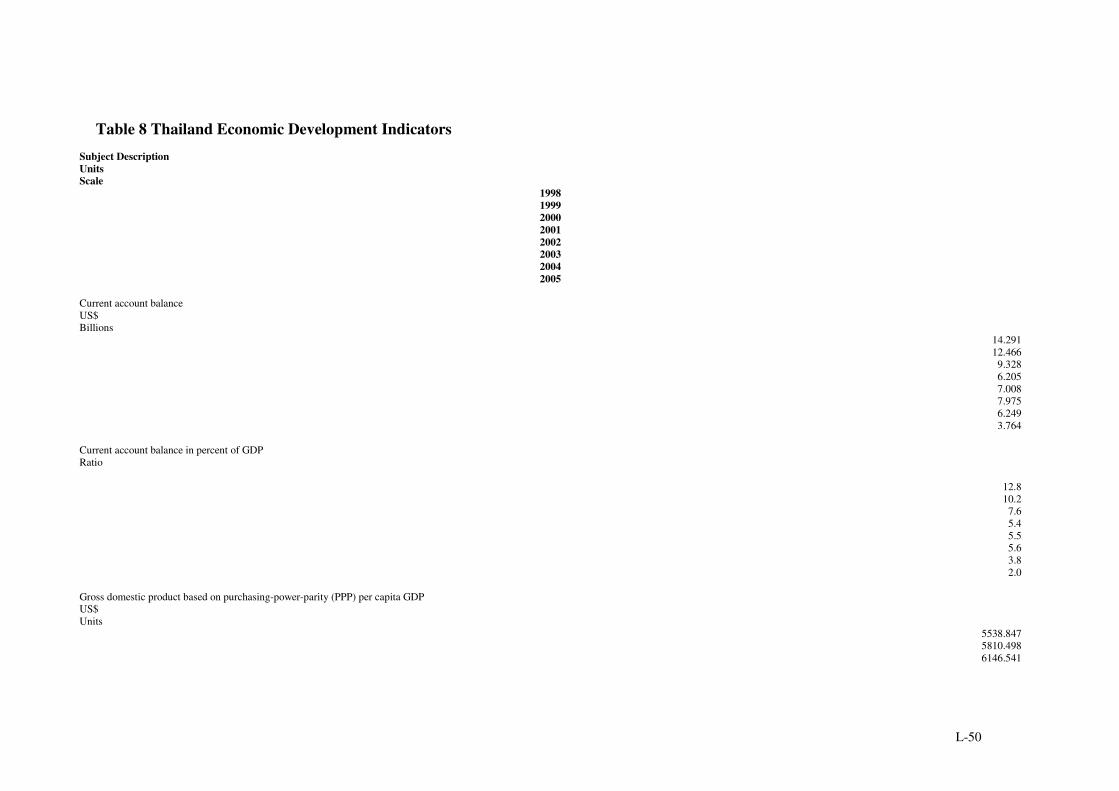
L-50
Table 8 Thailand Economic Development IndicatorsSubject DescriptionUnitsScale
19981999200020012002200320042005
Current account balanceUS$Billions
14.29112.4669.3286.2057.0087.9756.2493.764
Current account balance in percent of GDPRatio
12.810.2
7.65.45.55.63.82.0
Gross domestic product based on purchasing-power-parity (PPP) per capita GDPUS$Units
5538.8475810.4986146.541

L-51
6358.8396702.0257070.0497444.1657851.459
Gross domestic product based on purchasing-power-parity (PPP) share of world totalPercent
0.8590.8660.8660.8630.8830.8990.9080.912
Gross domestic product based on purchasing-power-parity (PPP) valuation of country GDPUS$Billions
338.811358.973383.544400.225426.044453.933482.733514.236
Gross domestic product per capita, constant pricesTH BahtUnits
44951.51246487.21348215.73748823.08550952.66053853.88956613.34759640.900
Gross domestic product per capita, current pricesUS$Units

L-52
1828.6691984.9421966.9631835.7791996.3242229.7082555.5612807.329
Gross domestic product per capita, current pricesTH BahtUnits
75632.61475057.93178898.44681567.14385762.23892498.564
102835.973111837.458
Gross domestic product, constant pricesTH BahtBillions
2749.6842871.9803008.6623072.9253239.0303457.6943671.2143906.218
Gross domestic product, constant prices, annual percent changePercent
-10.54.44.82.15.46.86.26.4

L-53
Gross domestic product, current pricesUS$Billions
111.860122.630122.739115.544126.905143.159165.721183.868
Gross domestic product, current pricesTH BahtBillions
4626.4474637.0794923.2635133.8365451.8545938.8796668.6197324.863
Gross domestic product, deflatorIndex
168.254161.459163.636167.067168.317171.758181.646187.518
InflationIndex, 1995=100
120.814121.186123.069125.113125.868128.154

L-54
131.673134.014
Inflation, annual percent changePercent
8.10.31.61.70.61.82.71.8
PPP US dollar exchange rateUS$
13.65512.91812.81912.80112.75312.86812.86012.950
Source: http://www.imf.org/external/pubs/ft/weo/2004/02/data/dbcoutm.cfm?SD=1998&ED=2005&R1=1&R2=1&CS=3&SS=2&OS=C&DD=0&OUT=1&C=578&S=NGDP_RPCH-NGDP_R-NGDP-NGDPD-NGDP_D-NGDPRPC-NGDPPC-NGDPDPC-PPPWGT-PPPSH-PPPEX-PPPPC-PCPIPCH-PCPI-BCA_NGDPD-BCA&CMP=0&x=39&y=8

L-55
Table 9 Thailand Human Development Indicators
1. Human development index
Life expectancy at birth (years) (HDI), 200269.1
Adult literacy rate (% ages 15 and above) (HDI), 200292.6 1
Combined gross enrolment ratio for primary, secondary and tertiary schools (%), 2001/0273 2
GDP per capita (PPP US$) (HDI), 20027,010
Life expectancy index0.74
Education index0.86
GDP index0.71
Human development index (HDI) value, 20020.768
GDP per capita (PPP US$) rank minus HDI rank- 9
2. Human development index trends
Human development index, 19750.613
Human development index, 19800.651
Human development index, 19850.676
Human development index, 19900.707
Human development index, 19950.742
Human development index, 2000..
Human development index, 20020.768

L-56
3. Human and income poverty: Developing countries
Human poverty index (HPI-1) Rank22
Human Poverty Index (HPI-1) Value (%)13.1
Probability at birth of not surviving to age 40 (% of cohort), 2000-0510.2
Adult illiteracy rate (% ages 15 and above), 20027.4 3
Population without sustainable access to an improved water source (%), 200016
Children underweight for age (% under age 5) (HPI-1), 1995-200219 4
Population living below $1 a day (%), 1990-2002<2
Population living below $2 a day (%), 1990-200232.5
Population living below the national poverty line (%), 1990-200113.1
HPI-1 rank minus income poverty rank15
4. Human and income poverty: OECD, Central & Eastern Europe & CIS
Human poverty index (HPI-2) Rank..
Human poverty index (HPI-2) Value (%)..
Probability at birth of not surviving to age 60 (% of cohort), 2000-05..
People lacking functional literacy skills (% ages 16-65), 1994-98..
Long-term unemployment (% of labour force), 2002..
Population living below 50% of median income (%), 1990-2000..

L-57
Population living below $11 a day (1994 PPP US$), 1994-95..
Population living below $4 a day (1990 PPP US$), 1996-99..
HPI-2 rank minus income poverty rank..
5. Demographic trends
Total population (millions), 197541.3
Total population (millions), 200262.2
Total population (millions), 201569.6
Annual population growth rate (%), 1975-20021.5
Annual population growth rate (%), 2002-20150.9
Urban population (% of total), 197523.8
Urban population (% of total), 200231.6
Urban population (% of total), 201536.7
Population under age 15 (% of total), 200225.6
Population under age 15 (% of total), 201522.0
Population age 65 and above (% of total), 20025.8
Population age 65 and above (% of total), 20158.1
Total fertility rate (births per woman), 1970-755.0
Total fertility rate (births per woman), 2000-051.9

L-58
6. Commitment to health: resources, access and services
Public health expenditure (% of GDP), 20012.1
Private health expenditure (% of GDP), 20011.6
Health expenditure per capita (PPP US$), 2001254
One-year-olds fully immunized against tuberculosis (%), 200299
One-year-olds fully immunized against measles (%), 200294
Oral rehydration therapy use rate (%), 1994-2002..
Contraceptive prevalence rate (%), 1995-200272
Births attended by skilled health personnel (%), 1995-200299
Physicians (per 100,000 people), 1990-200330
Population with sustainable access to affordable essential drugs (%), 199995-100
7. Water, sanitation and nutritional status
Population with sustainable access to improved sanitation (%), 199079
Population with sustainable access to improved sanitation (%), 200096
Population with sustainable access to an improved water source (%), 199080
Population with sustainable access to an improved water source (%), 200084
Undernourished people (% of total population), 1990/9228
Undernourished people (% of total population), 1999/200119
Children underweight for age (% under age 5), 1995-2002

L-59
19 5
Children under height for age (% under age 5), 1995-200216 5
Infants with low birthweight (%), 1998-20029
8. Leading global health crises and risks
HIV prevalence (% ages 15-49), 20031.5 [0.8 - 2.8]
Condom use at last high-risk sex (% ages 15-24), women, 1996-2002..
Condom use at last high-risk sex (% ages 15-24), men, 1996-2002..
Malaria cases (per 100,000 people), 2000130
Children under age 5 with insecticide-treated bed nets (%), 1999-2001..
Children under age 5 with fever treated with anti-malarial drugs (%), 1999-2001..
Tuberculosis cases (per 100,000 people), 2002179
Tuberculosis cases detected under DOTS (%), 200273
Tuberculosis cases cured under DOTS (%), 200175
Prevalence of smoking (% of adults), women, 20003
Prevalence of smoking (% of adults), men, 200044
9. Survival: progress and setbacks
Life expectancy at birth (years), 1970-7561.0
Life expectancy at birth (years), 2000-0569.3
Infant mortality rate (per 1,000 live births), 1970

L-60
74
Infant mortality rate (per 1,000 live births), 200224
Under-five mortality rate (per 1,000 live births), 1970102
Under-five mortality rate (per 1,000 live births), 200228
Probability at birth of surviving to age 65, female (% of cohort), 2000-0579.9
Probability at birth of surviving to age 65, male (% of cohort), 2000-0562.4
Maternal mortality ratio reported (per 100,000 live births), 1985-200236
Maternal mortality ratio adjusted (per 100,000 live births), 200044
10. Commitment to education: public spending
Public expenditure on education (as % of GDP), 19903.5
Public expenditure on education (as % of GDP), 1999-20015.0
Public expenditure on education (as % of total government expenditure), 199020.0
Public expenditure on education (as % of total government expenditure), 1999-200131.0
Public expenditure on education, pre-primary and primary (as % of all levels), 199056.2
Public expenditure on education, pre-primary and primary (as % of all levels), 1999-200142.3
Public expenditure on education, secondary (% of all levels), 199021.6
Public expenditure on education, secondary (% of all levels), 1999-200120.5
Public expenditure on education, tertiary (% of all levels), 199014.6
Public expenditure on education, tertiary (% of all levels), 1999-200121.7

L-61
11. Literacy and enrolment
Adult literacy rate (% ages 15 and above), 199092.4
Adult literacy rate (% ages 15 and above), 200292.6 6
Youth literacy rate (% ages 15-24), 199098.1
Youth literacy rate (% ages 15-24), 200298.0 6
Net primary enrolment ratio (%), 1990/9176
Net primary enrolment ratio (%), 2001/0286
Net secondary enrolment ratio (%), 1990/91..
Net secondary enrolment ratio (%), 2001/02..
Children reaching grade 5 (%), 1990/91..
Children reaching grade 5 (%), 2000/0194 7
Tertiary students in science, math and engineering (% of all tertiary students), 1994-9721
12. Technology: diffusion and creation
Telephone mainlines (per 1,000 people), 199024
Telephone mainlines (per 1,000 people), 2002105
Cellular subscribers (per 1,000 people), 19901
Cellular subscribers (per 1,000 people), 2002260
Internet users (per 1,000 people), 19900

L-62
Internet users (per 1,000 people), 200277.6
Patents granted to residents (per million people), 20003
Receipts of royalties and license fees (US$ per person), 20020.1
Research and development (R&D) expenditures (as % of GDP), 1996-20020.1
Researchers in R&D (per million people), 1990-200174
13. Economic performance
GDP (US$ billions), 2002126.9
GDP (PPP US$ billions), 2002431.9
GDP per capita (US$), 20022,060
GDP per capita (PPP US$), 20027,010
GDP per capita annual growth rate (%), 1975-20025.2
GDP per capita annual growth rate (%), 1990-20022.9
GDP per capita, highest value (PPP US$), 1975-20027,080
GDP per capita, year of highest value1996
Average annual change in consumer price index (%), 1990-20024.3
Average annual change in consumer price index (%), 2001-020.6
14. Inequality in income or consumption
Survey Year2000 8
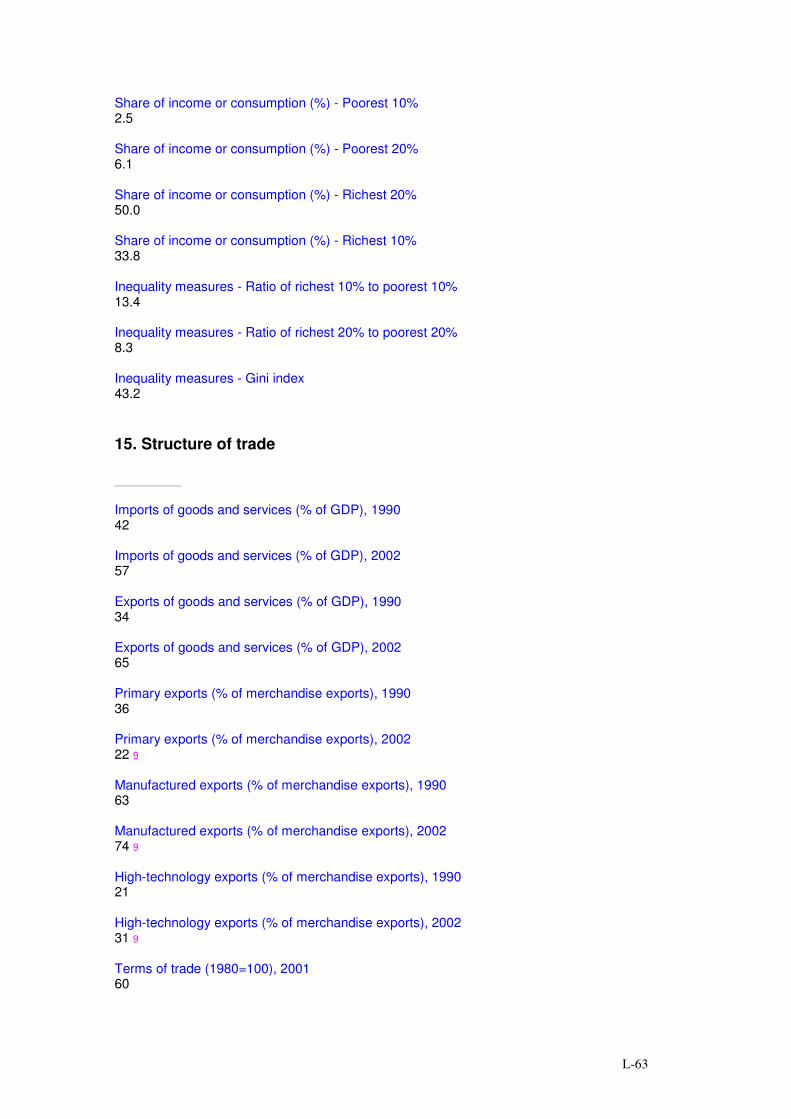
L-63
Share of income or consumption (%) - Poorest 10%2.5
Share of income or consumption (%) - Poorest 20%6.1
Share of income or consumption (%) - Richest 20%50.0
Share of income or consumption (%) - Richest 10%33.8
Inequality measures - Ratio of richest 10% to poorest 10%13.4
Inequality measures - Ratio of richest 20% to poorest 20%8.3
Inequality measures - Gini index43.2
15. Structure of trade
Imports of goods and services (% of GDP), 199042
Imports of goods and services (% of GDP), 200257
Exports of goods and services (% of GDP), 199034
Exports of goods and services (% of GDP), 200265
Primary exports (% of merchandise exports), 199036
Primary exports (% of merchandise exports), 200222 9
Manufactured exports (% of merchandise exports), 199063
Manufactured exports (% of merchandise exports), 200274 9
High-technology exports (% of merchandise exports), 199021
High-technology exports (% of merchandise exports), 200231 9
Terms of trade (1980=100), 200160

L-64
16. Rich country responsibilities: aid
Net official development assistance (ODA) disbursed, Total (US$ millions), 2002..
Net official development assistance (ODA) disbursed, As % of GNI, 1990..
Net official development assistance (ODA) disbursed, As % of GNI, 2002..
ODA per capita of donor country (2001 US$), 1990..
ODA per capita of donor country (2001 US$), 2002..
ODA to least developed countries (% of total), 1990..
ODA to least developed countries (% of total), 2002..
ODA to basic social services (% of total), 1995/96..
ODA to basic social services (% of total), 2001/02..
Untied bilateral ODA (% of total), 1990..
Untied bilateral ODA (% of total), 2002..
17. Rich country responsibilities: debt relief and trade
Bilateral pledges to the HIPC trust fund (US$ millions), 2003..
Gross bilateral debt forgiveness (US$ millions), 1990-2002..
Average tariff barriers and non-tariff equivalents, 2000..
Goods imports from developing countries (Total US$ millions), 2002..
Goods imports from developing countries (Share of total imports), 2002..
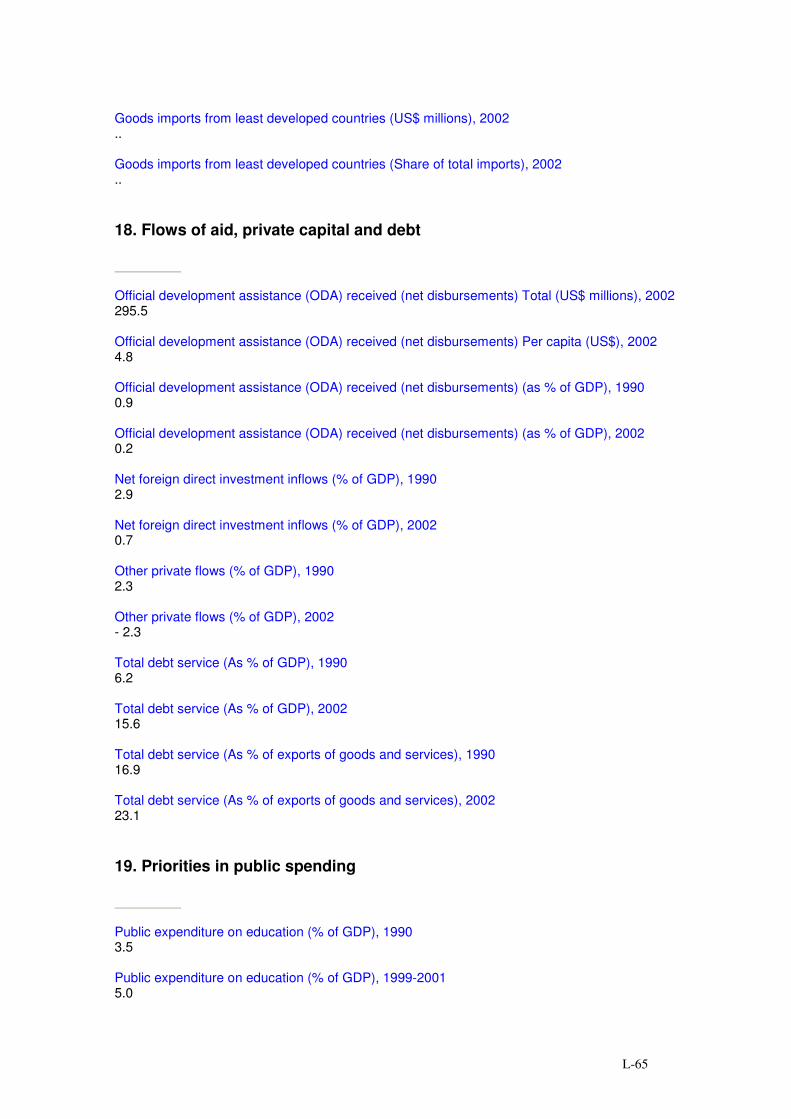
L-65
Goods imports from least developed countries (US$ millions), 2002..
Goods imports from least developed countries (Share of total imports), 2002..
18. Flows of aid, private capital and debt
Official development assistance (ODA) received (net disbursements) Total (US$ millions), 2002295.5
Official development assistance (ODA) received (net disbursements) Per capita (US$), 20024.8
Official development assistance (ODA) received (net disbursements) (as % of GDP), 19900.9
Official development assistance (ODA) received (net disbursements) (as % of GDP), 20020.2
Net foreign direct investment inflows (% of GDP), 19902.9
Net foreign direct investment inflows (% of GDP), 20020.7
Other private flows (% of GDP), 19902.3
Other private flows (% of GDP), 2002- 2.3
Total debt service (As % of GDP), 19906.2
Total debt service (As % of GDP), 200215.6
Total debt service (As % of exports of goods and services), 199016.9
Total debt service (As % of exports of goods and services), 200223.1
19. Priorities in public spending
Public expenditure on education (% of GDP), 19903.5
Public expenditure on education (% of GDP), 1999-20015.0

L-66
Public expenditure on health (% of GDP), 19900.9
Public expenditure on health (% of GDP), 20012.1
Military expenditure (% of GDP), 19902.3
Military expenditure (% of GDP), 20021.4
Total debt service (% of GDP), 19906.2
Total debt service (% of GDP), 200215.6
20. Unemployment in OECD countries
Unemployed people (thousands), 2002..
Unemployment rate Total (% of labour force), 2002..
Unemployment rate Average annual (% of labour force), 1992-2002..
Unemployment rate Female (% of male rate), 2002..
Youth unemployment rate Total (% of labour force ages 15-24), 2002..
Youth unemployment rate Female (% of male rate), 2002..
Long-term unemployment (% of total unemployment): Women, 2002..
Long-term unemployment (% of total unemployment): Men, 2002..
21. Energy and the environment
Traditional fuel consumption (% of total energy requirements), 200115.9
Electricity consumption per capita (kilowatt-hours), 1980340

L-67
Electricity consumption per capita (kilowatt-hours), 20011,804
GDP per unit of energy use (1995 PPP US$ per kg of oil equivalent), 19804.8
GDP per unit of energy use (1995 PPP US$ per kg of oil equivalent), 20014.8
Carbon dioxide emissions - Per capita (metric tons), 19800.9
Carbon dioxide emissions - Per capita (metric tons), 20003.3
Carbon dioxide emissions - Share of world total (%), 20000.8
Ratification of environmental treaties - Cartagena Protocol on Biosafety..
Ratification of environmental treaties - Framework Convention on Climate Change
Ratification of environmental treaties - Kyoto Protocol to the Framework Convention on ClimateChange
Ratification of environmental treaties - Convention on Biological Diversity
22. Refugees and armaments
Internally displaced people (thousands), 20030
Refugees by country of asylum (thousands), 2003119
Refugees by country of origin (thousands), 2003(.)
Conventional arms transfers (1990 prices) - Imports (US$ millions), 1994661
Conventional arms transfers (1990 prices) - Imports (US$ millions), 2003163
Conventional arms transfers (1990 prices) - Exports (US$ millions), 20035
Conventional arms transfers (1990 prices) - Exports (share %), 1999-2003(.)

L-68
Total armed forces Thousands, 2002306
Total armed forces Index (1985=100), 2002130
24. Gender-related development index
Gender-related development index (GDI) rank, 200261
Gender-related development index (GDI) value, 20020.766
Life expectancy at birth, female (years), 200273.4
Life expectancy at birth, male (years), 200265.2
Adult literacy rate, female (% ages 15 and above), 200290.5 10
Adult literacy rate, male (% ages 15 and above), 200294.9 10
Combined gross enrolment ratio for primary, secondary and tertiary level schools, female (%) ,2001/0272 11
Combined gross enrolment ratio for primary, secondary and tertiary level schools, male (%) ,2001/0274 11
Estimated earned income, female (PPP US$), 20025,284
Estimated earned income, male (PPP US$), 20028,664
HDI rank minus GDI rank, 20021
25. Gender empowerment measure
Gender empowerment measure (GEM) rank57
Gender empowerment measure (GEM) value0.461
Seats in parliament held by women (% of total)

L-69
9.6
Female legislators, senior officials and managers (% of total)27
Female professional and technical workers (% of total)55
Ratio of estimated female to male earned income0.61
26. Gender inequality in education
Adult literacy rate (female rate % ages 15 and above), 200290.5 12
Adult literacy rate (female rate as % of male rate), 200295 12
Youth literacy rate (female rate % ages 15-24), 200297.8 12
Youth literacy rate (female rate as % of male rate), 2002100
Female primary net enrolment ratio (%), 2000/0185 13
Primary net enrolment ratio (female as % of male), 2000/010.97 13
Female secondary net enrolment ratio (%), 2000/01..
Secondary net enrolment ratio (female rate as % of male rate), 2000/01..
Female tertiary gross enrolment ratio (%), 2000/0138
Tertiary gross enrolment ratio (female rate as % of male rate), 2000/011.09
27. Gender inequality in economic activity
Female economic activity rate (% ages 15 and above), 200273.0
Female economic activity rate (index, 1990=100, ages 15 and above), 200297
Female economic activity rate (% of male rate, ages 15 and above), 2002
L-70
85
Female employment in agriculture (as % of female labour force), 1995-200248
Female employment in agriculture (as % of male) , 1995-200295
Female employment in industry (as % of female labour force), 1995-200217
Female employment in industry (as % of male) , 1995-200285
Female employment in services (as % of female labour force), 1995-200235
Female employment in services (as % of male) , 1995-2002119
Women contributing family workers (% of total), 1995-200266
Men contributing family workers (% of total), 1995-200234
29. Women's political participation
Year women received right to vote1932
Year women received right to stand for election1932
Year first woman elected (E) or appointed (A) to parliament1948 A
Women in government at ministerial level (as % of total), 20015.7
Seats in lower house or single house held by women (as % of total), 19903.0
Seats in lower house or single house held by women (as % of total), 20049.2
Seats in upper house or senate held by women (as % of total), 200410.5
30. Status of major international human rights instruments
International Convention on the Prevention and Punishment of the Crime of Genocide, 1948
L-71
..
International Convention on the Elimination of All Forms of Racial Discrimination, 1965
International Covenant on Civil and Political Rights, 1966
International Covenant on Economic, Social and Cultural Rights, 1966
Convention on the Elimination of All Forms of Discrimination Against Women, 1979
Convention Against Torture and Other Cruel, Inhuman or Degrading Treatment or Punishment,1984..
Convention on the Rights of the Child, 1989
31. Status of fundamental labour rights conventions
Freedom of association and collective bargaining - Convention 87..
Freedom of association and collective bargaining - Convention 98..
Elimination of forced and compulsory labour - Convention 29
Elimination of forced and compulsory labour - Convention 105
Elimination of discrimination in respect of employment and occupation - Convention 100
Elimination of discrimination in respect of employment and occupation - Convention 111..
Abolition of child labour - Convention 138..
Abolition of child labour - Convention 182
Notes :1 - Census data.2 - Data refer to a year other than that specified.3 - Census data.4 - Data refer to a year or period other than that specified, differ from the standard definition or refer to only part of a country.5 - Data refer to a year or period other than that specified, differ from the standard definition or refer to only part of the country.6 - Census data.

L-72
7 - Data refer to the 1998/99 school year.8 - Survey based on consumption.9 - Data refer to 2001.10 - Census data.11 - Data refer to the 2000/01 school year.12 - Census data.13 - Preliminary UNESCO Institute for Statistics estimates, subject to further revision.
Source: http://hdr.undp.org/statistics/data/cty/cty_f_THA.html

L-73
Table 10 Poverty line, Thailand by Region and Area 1996 - 2004 (Baht/person/monthRegion and Area 1996 1998 2000 2002 2004BANGKOK 1,502 1,696 1,736 1,801 1,773 CENTRAL 1,013 1,212 1,227 1,277 1,305 Central-Urban 1,173 1,368 1,389 1,457 1,407 Central-Rural 934 1,137 1,142 1,184 1,252 NORTH 874 1,023 1,019 1,078 1,148 North-Urban 1,023 1,178 1,199 1,252 1,297 North-Rutal 836 984 974 1,032 1,109 NORTHEAST 811 998 993 1,040 1,071 Northeast-Urban 952 1,128 1,131 1,181 1,203 Northeast-Rural 784 973 966 1,099 1,040 SOUTH 897 1,033 1,034 1,096 1,190 South-Urban 1,029 1,197 1,201 1,205 1,332 South-Rural 860 986 985 1,041 1,114 THAILAND 953 1,130 1,135 1,190 1,230 Thailand-Urban 1,216 1,397 1,147 1,471 1,466 Thailand-Rural 839 1,012 1,009 1,058 1,119 Source: National Social and Economic Development Boardhttp://poverty.nesdb.go.th/poverty_new/showreport.aspx?file=report/pov_profile_year.rpt&query=&formula=Table 11 People in Poverty, Thailand by Region and Area 1996 - 2004 (million)Region and Area 1996 1998 2000 2002 2004BANGKOK 0.1 0.1 0.1 0.1 0.1 CENTRAL 1.5 1.6 1.6 1.1 0.8 Central-Urban 0.3 0.3 0.3 0.2 0.2 Central-Rural 1.2 1.3 1.3 0.9 0.6 NORTH 1.8 1.9 1.9 2.1 2.2 North-Urban 0.3 0.2 0.2 0.3 0.2 North-Rutal 1.5 1.7 1.7 1.8 2.0 NORTHEAST 5.1 5.9 5.9 5.0 3.8 Northeast-Urban 0.5 0.5 0.5 0.5 0.4 Northeast-Rural 4.6 5.4 5.4 4.5 3.4 SOUTH 1.3 1.6 1.6 1.1 0.7 South-Urban 0.1 0.2 0.2 0.1 0.1 South-Rural 1.2 1.4 1.4 1.0 0.6 THAILAND 9.8 11.0 11.0 9.5 7.5 Thailand-Urban 1.3 1.3 1.3 1.3 1.0 Thailand-Rural 8.5 9.7 9.7 8.2 6.5 Source: National Social and Economic Development Boardhttp://poverty.nesdb.go.th/poverty_new/showreport.aspx?file=report/pov_profile_year.rpt&query=&formula=
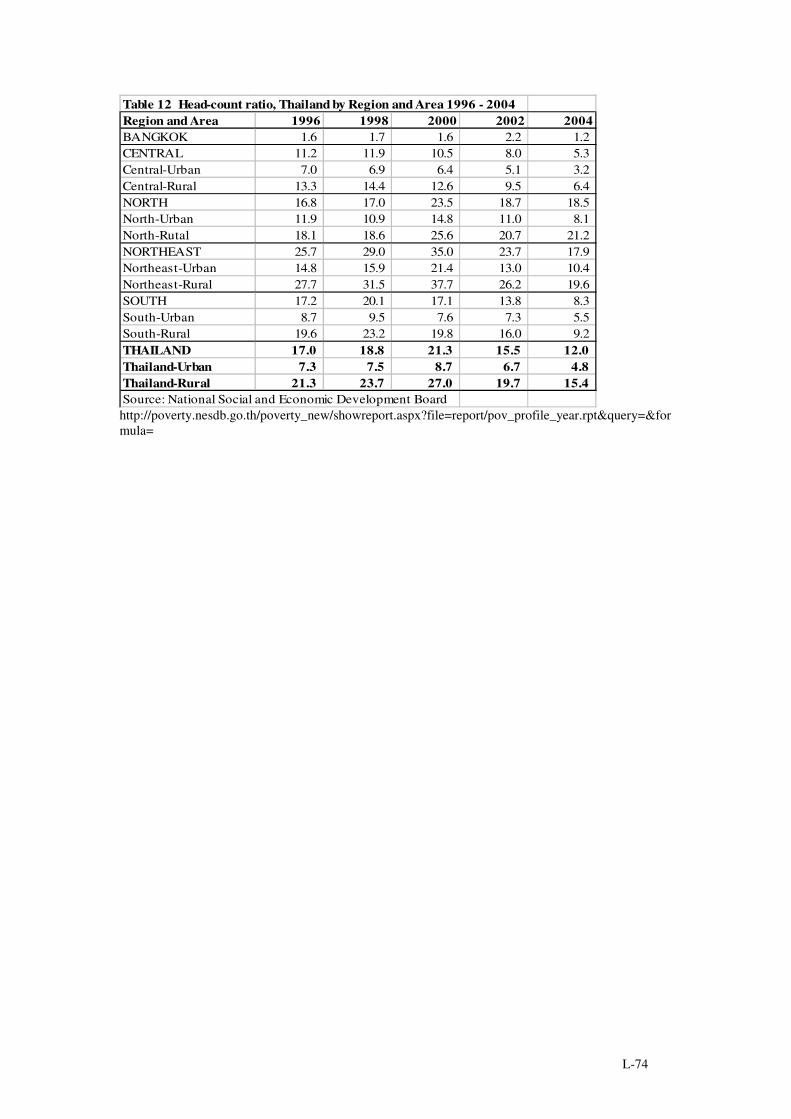
L-74
Table 12 Head-count ratio, Thailand by Region and Area 1996 - 2004 Region and Area 1996 1998 2000 2002 2004BANGKOK 1.6 1.7 1.6 2.2 1.2 CENTRAL 11.2 11.9 10.5 8.0 5.3 Central-Urban 7.0 6.9 6.4 5.1 3.2 Central-Rural 13.3 14.4 12.6 9.5 6.4 NORTH 16.8 17.0 23.5 18.7 18.5 North-Urban 11.9 10.9 14.8 11.0 8.1 North-Rutal 18.1 18.6 25.6 20.7 21.2 NORTHEAST 25.7 29.0 35.0 23.7 17.9 Northeast-Urban 14.8 15.9 21.4 13.0 10.4 Northeast-Rural 27.7 31.5 37.7 26.2 19.6 SOUTH 17.2 20.1 17.1 13.8 8.3 South-Urban 8.7 9.5 7.6 7.3 5.5 South-Rural 19.6 23.2 19.8 16.0 9.2 THAILAND 17.0 18.8 21.3 15.5 12.0 Thailand-Urban 7.3 7.5 8.7 6.7 4.8 Thailand-Rural 21.3 23.7 27.0 19.7 15.4 Source: National Social and Economic Development Boardhttp://poverty.nesdb.go.th/poverty_new/showreport.aspx?file=report/pov_profile_year.rpt&query=&formula=

L-75
Table 13 Thai Export Volume and Value 2001 - 2004 (Vulume:thou. ton. Value: US$billion)
Volume Value Volume Value Volume Value Volume ValueTO TAL - 65.2 - 68.2 - 80.0 - 97.7
AGRICULTURAL PRIMARY PRO DUCT - 7.1 - 7.1 - 8.8 - 10.3 AGRO -INDUSTRIAL PRO DUCT - 4.7 - 5.1 - 5.1 - 6.0 INDUSTRIAL PRO DUCT - 49.1 - 51.9 - 61.2 - 75.8 MINERAL AND FUEL 15,173.6 2.0 15,024.0 2.0 16,676.5 2.3 17,644.1 3.7 1. FISHERY PRIMARY PRO DUCT 645.4 2.1 618.3 1.7 709.0 1.8 741.5 1.8
1.1Shrimp 145.6 1.2 99.6 0.8 119.4 0.9 123.1 0.8
1.1.1 Frozen shrimp 144.6 1.2 99.2 0.8 118.9 0.9 122.5 0.8
1.1.1.1 Black t iger shrimp na na 82.6 0.7 77.8 0.6 53.0 0.4
1.1.1.2 Freshwater shrimp na na 2.1 0.01 2.6 0.01 3.9 0.02
1.1.1.3 Other frozen shriimps na na 14.6 0.1 38.5 0.3 65.5 0.4
1.1.2 Dried shrimp 0.9 0.01 0.3 0.002 0.4 0.002 0.5 0.003
1.1.3 Boiled shrimp 0.1 0.001 0.1 0.0002 0.1 0.001 0.2 0.001
1.2 Squid 82.5 0.3 93.8 0.3 99.7 0.3 97.5 0.4
1.2.1 Frozen squid 82.0 0.3 92.8 0.3 97.8 0.3 96.5 0.4
1.2.2 Dried squid 0.5 0.005 1.0 0.01 1.9 0.01 1.0 0.01
1.3 Fish 379.4 0.4 386.6 0.4 432.3 0.5 447.0 0.5
1.3.1 Frozen fish fillet 141.9 0.3 156.1 0.3 153.8 0.3 131.0 0.3
1.3.2 Frozen fish 199.0 0.1 194.1 0.1 223.9 0.1 259.3 0.1
1.3.3 Dried fish 29.4 0.04 29.0 0.04 48.8 0.05 50.9 0.05
1.4 Lived fish 9.1 0.02 7.3 0.02 5.8 0.02 5.8 0.02
1.5 Crustacean 25.2 0.1 24.9 0.1 23.7 0.1 28.9 0.1
1.6 Crab, frozen or boiled 4.1 0.04 2.9 0.02 4.2 0.02 6.5 0.03
1.7 Mollusk 7.6 0.01 7.7 0.01 6.3 0.01 8.3 0.01
1.8 other crustacean 13.4 0.04 14.3 0.05 13.2 0.05 14.0 0.05
1.7 Dried jelly fish 3.6 0.005 5.5 0.01 6.0 0.01 6.6 0.01
1.8 Turtle 3.5 0.01 4.5 0.01 17.7 0.004 25.6 0.003
1.9 Frog 3.3 0.005 0.02 ###### 5.7 0.001 9.4 0.002
1.10 O tner fishery product 2.3 0.02 3.3 0.02 4.6 0.01 3.4 0.02
2. FISHERY MANUFACTURING PRO DUCTS 526.9 2.1 603.4 2.0 705.4 2.1 705.4 2.1 2.1 Canned seafood 314.4 0.8 324.8 0.7 390.6 0.8 390.6 0.8 2.1.1 Canned tuna 243.7 0.5 268.2 0.6 326.7 0.7 326.7 0.7
2.1.2 Canned sardine 35.9 0.04 36.1 0.04 43.8 0.05 43.8 0.05
2.1.3 Canned crab 8.2 0.1 7.5 0.1 7.9 0.1 7.9 0.1
2.1.4 Canned shrimp 20.7 0.2 7.5 0.1 6.4 0.0 6.4 0.04
2.1.5 Canned short-necked clam 5.0 0.01 4.7 0.01 4.7 0.01 4.7 0.01
2.1.6 Canned squid 0.9 0.003 0.9 0.003 1.1 0.004 1.1 0.004
2.2 Processed seafood 212.5 1.3 278.6 1.3 314.9 1.3 314.9 1.3 2.2.1 Processed shrimp 82.4 1.0 104.7 0.9 108.3 0.8 108.3 0.8
2.2.2 Processed squid 8.5 0.04 10.5 0.05 10.1 0.04 10.1 0.04
2.2.3 Processed crab 0.7 0.01 1.4 0.02 1.1 0.01 1.1 0.01
2.2.4 Processed fish 109.8 0.2 153.3 0.3 185.7 0.4 185.7 0.4
2.2.4.1 Tuna 22.0 0.05 52.0 0.1 69.0 0.2 69.0 0.2
2.2.4.2 Other fish 87.8 0.2 101.3 0.2 116.7 0.2 116.7 0.2
2.2.5 Other processed crustacean 3.0 0.01 2.5 0.01 2.8 0.01 2.8 0.01
2.2.6 Processed short-necked clam 3.2 0.01 1.0 0.002 0.9 0.002 0.9 0.002
2.2.7 Other processed seafood 4.9 0.02 5.2 0.02 6.0 0.02 6.0 0.02
Source: Ministry of Commerce
2002 20032001 2004
Compiled from http://www.ops2.moc.go.th/meeting/trade2.xls

L-76
Table 14 Share and Growth rate of Thai Export 2001 - 2004 (%)
2001 2002 2003 2004 Average 2002 2003 2004 AverageTO TAL 100.0 100.0 100.0 100.0 100.0 4.6 17.4 22.1 14.7AGRICULTURAL PRIMARY PRO DUCT10.8 10.4 11.0 10.6 10.7 0.9 24.0 17.1 14.0AGRO -INDUSTRIAL PRO DUCT 7.2 7.5 6.4 6.1 6.8 8.1 0.0 16.7 8.3INDUSTRIAL PRODUCT 75.3 76.2 76.5 77.5 76.4 5.7 18.0 23.7 15.8MINERAL AND FUEL 3.1 2.9 2.9 3.8 3.2 -2.2 15.0 59.9 24.21. FISHERY PRIMARY PRO DUCT 3.2 2.4 2.2 1.8 2.4 -19.7 6.8 1.3 -3.81.1Shrimp 1.9 1.2 1.1 0.8 1.3 -35.4 7.9 -6.3 -11.31.1.1 Frozen shrimp 1.9 1.2 1.1 0.8 1.2 -35.1 7.8 -6.4 -11.2
1.1.1.1 Black tiger shrimp na 1.0 0.7 0.4 0.7 na -12.0 -35.6 -23.8
1.1.1.2 Freshwater shrimp na 0.02 0.02 0.02 0.02 na 27.1 36.5 31.8
1.1.1.3 Other frozen shriimps na 0.2 0.3 0.4 0.3 na 105.9 53.9 79.9
1.1.2 Dried shrimp 0.01 0.003 0.003 0.003 0.01 -72.5 14.8 28.1 -9.9
1.1.3 Boiled shrimp 0.001 0.0004 0.001 0.001 0.001 -70.6 175.6 10.0 38.3
1.2 Squid 0.4 0.4 0.4 0.4 0.4 10.2 10.2 15.6 12.01.2.1 Frozen squid 0.4 0.4 0.4 0.4 0.4 9.6 10.0 16.4 12.0
1.2.2 Dried squid 0.01 0.01 0.01 0.01 0.01 45.0 17.2 -18.2 14.7
1.3 Fish 0.6 0.6 0.6 0.5 0.6 4.7 5.5 2.0 4.11.3.1 Frozen fish fillet 0.4 0.4 0.4 0.3 0.4 11.9 2.9 -5.6 3.1
1.3.2 Frozen fish 0.2 0.1 0.1 0.1 0.1 -10.9 10.0 20.7 6.6
1.3.3 Dried fish 0.1 0.06 0.1 0.1 0.1 8.0 19.0 8.1 11.7
1.4 Lived fish 0.03 0.03 0.02 0.02 0.03 -17.3 -2.0 15.1 -1.41.5 Crustacean 0.1 0.1 0.1 0.1 0.1 -10.6 3.6 12.5 1.81.6 Crab, frozen or boiled 0.1 0.03 0.03 0.03 0.04 -34.0 0.8 29.4 -1.21.7 Mollusk 0.01 0.01 0.01 0.01 0.01 -19.4 20.9 29.3 10.31.8 other crustacean 0.1 0.1 0.1 0.05 0.1 10.9 2.5 1.4 4.91.7 Dried je lly fish 0.01 0.01 0.01 0.01 0.01 44.5 0.6 21.0 22.01.8 Turtle 0.02 0.01 0.005 0.003 0.01 -17.5 -58.6 -36.5 -37.51.9 Frog 0.01 0.0001 0.001 0.002 0.003 -99.0 2,297.32 48.4 748.91.10 O tner fishery product 0.03 0.03 0.02 0.02 0.02 -1.0 -18.6 44.7 8.42. FISHERY MANUFACTURING PRO DUCTS3.2 3.0 2.7 2.2 2.7 -2.4 5.9 0.0 1.22.1 Canned seafood 1.2 1.1 1.0 0.9 1.0 -4.5 12.8 0.0 2.82.1.1 Canned tuna 0.7 0.8 0.8 0.7 0.8 19.3 18.1 0.0 12.5
2.1.2 Canned sardine 0.1 0.06 0.06 0.05 0.1 -4.7 25.8 0.0 7.0
2.1.3 Canned crab 0.1 0.1 0.1 0.1 0.1 14.8 -5.6 0.0 3.1
2.1.4 Canned shrimp 0.3 0.1 0.0 0.04 0.1 -72.3 -25.7 0.0 -32.7
2.1.5 Canned short-necked clam 0.02 0.01 0.01 0.01 0.01 -14.6 -4.3 0.0 -6.3
2.1.6 Canned squid 0.005 0.004 0.005 0.004 0.004 1.1 33.3 0.0 11.5
2.2 Processed seafood 2.0 1.9 1.6 1.3 1.7 -1.2 1.9 0.0 0.22.2.1 Processed shrimp 1.5 1.3 1.0 0.8 1.2 -12.2 -5.2 0.0 -5.8
2.2.2 Processed squid 0.1 0.1 0.1 0.05 0.1 10.0 -3.9 0.0 2.0
2.2.3 Processed crab 0.01 0.02 0.02 0.01 0.02 81.1 -12.7 0.0 22.8
2.2.4 Processed fish 0.3 0.5 0.5 0.4 0.4 49.3 22.4 0.0 23.9
2.2.4.1 Tuna 0.1 0.2 0.2 0.2 0.2 167.1 28.3 0.0 65.1
2.2.4.2 Other fish 0.3 0.3 0.3 0.2 0.3 15.4 18.5 0.0 11.3
2.2.5 Other processed crustacean 0.02 0.01 0.01 0.01 0.01 -32.5 8.2 0.0 -8.1
2.2.6 Processed short-necked clam 0.01 0.003 0.003 0.002 0.005 -66.5 -10.0 0.0 -25.5
2.2.7 Other processed seafood 0.03 0.02 0.02 0.02 0.02 -12.3 15.7 0.0 1.1
Source: Calculated from Ministry of Commerce data.
ItemShare of export value Growth rate
http://www.ops2.moc.go.th/meeting/trade2.xls
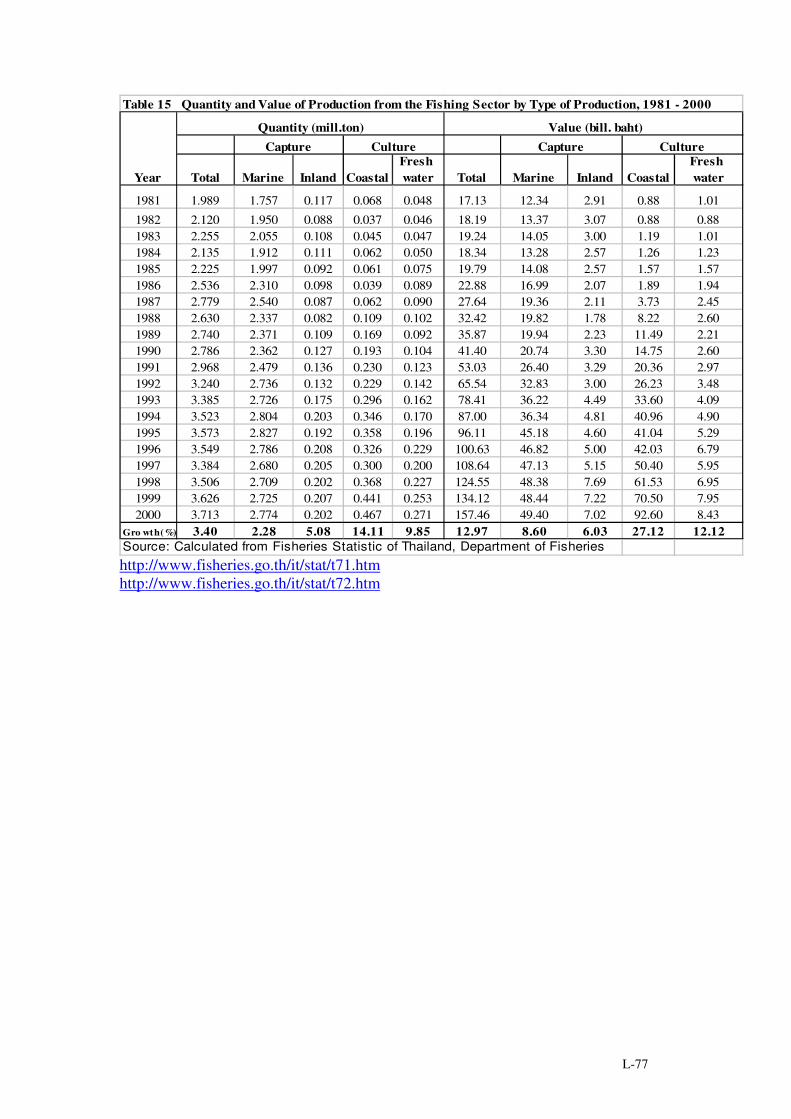
L-77
Table 15 Quantity and Value of Production from the Fishing Sector by Type of Production, 1981 - 2000
1981 1.989 1.757 0.117 0.068 0.048 17.13 12.34 2.91 0.88 1.01
1982 2.120 1.950 0.088 0.037 0.046 18.19 13.37 3.07 0.88 0.881983 2.255 2.055 0.108 0.045 0.047 19.24 14.05 3.00 1.19 1.011984 2.135 1.912 0.111 0.062 0.050 18.34 13.28 2.57 1.26 1.231985 2.225 1.997 0.092 0.061 0.075 19.79 14.08 2.57 1.57 1.571986 2.536 2.310 0.098 0.039 0.089 22.88 16.99 2.07 1.89 1.941987 2.779 2.540 0.087 0.062 0.090 27.64 19.36 2.11 3.73 2.451988 2.630 2.337 0.082 0.109 0.102 32.42 19.82 1.78 8.22 2.601989 2.740 2.371 0.109 0.169 0.092 35.87 19.94 2.23 11.49 2.211990 2.786 2.362 0.127 0.193 0.104 41.40 20.74 3.30 14.75 2.601991 2.968 2.479 0.136 0.230 0.123 53.03 26.40 3.29 20.36 2.971992 3.240 2.736 0.132 0.229 0.142 65.54 32.83 3.00 26.23 3.481993 3.385 2.726 0.175 0.296 0.162 78.41 36.22 4.49 33.60 4.091994 3.523 2.804 0.203 0.346 0.170 87.00 36.34 4.81 40.96 4.901995 3.573 2.827 0.192 0.358 0.196 96.11 45.18 4.60 41.04 5.291996 3.549 2.786 0.208 0.326 0.229 100.63 46.82 5.00 42.03 6.791997 3.384 2.680 0.205 0.300 0.200 108.64 47.13 5.15 50.40 5.951998 3.506 2.709 0.202 0.368 0.227 124.55 48.38 7.69 61.53 6.951999 3.626 2.725 0.207 0.441 0.253 134.12 48.44 7.22 70.50 7.952000 3.713 2.774 0.202 0.467 0.271 157.46 49.40 7.02 92.60 8.43
Gro wth(%) 3.40 2.28 5.08 14.11 9.85 12.97 8.60 6.03 27.12 12.12Source: Calculated from Fisheries Statistic of Thailand, Department of Fisheries
Total Year Fresh water CoastalInlandMarine
Value (bill. baht)Quantity (mill.ton)Capture CultureCapture Culture
Marine Inland CoastalFresh waterTotal
http://www.fisheries.go.th/it/stat/t71.htmhttp://www.fisheries.go.th/it/stat/t72.htm
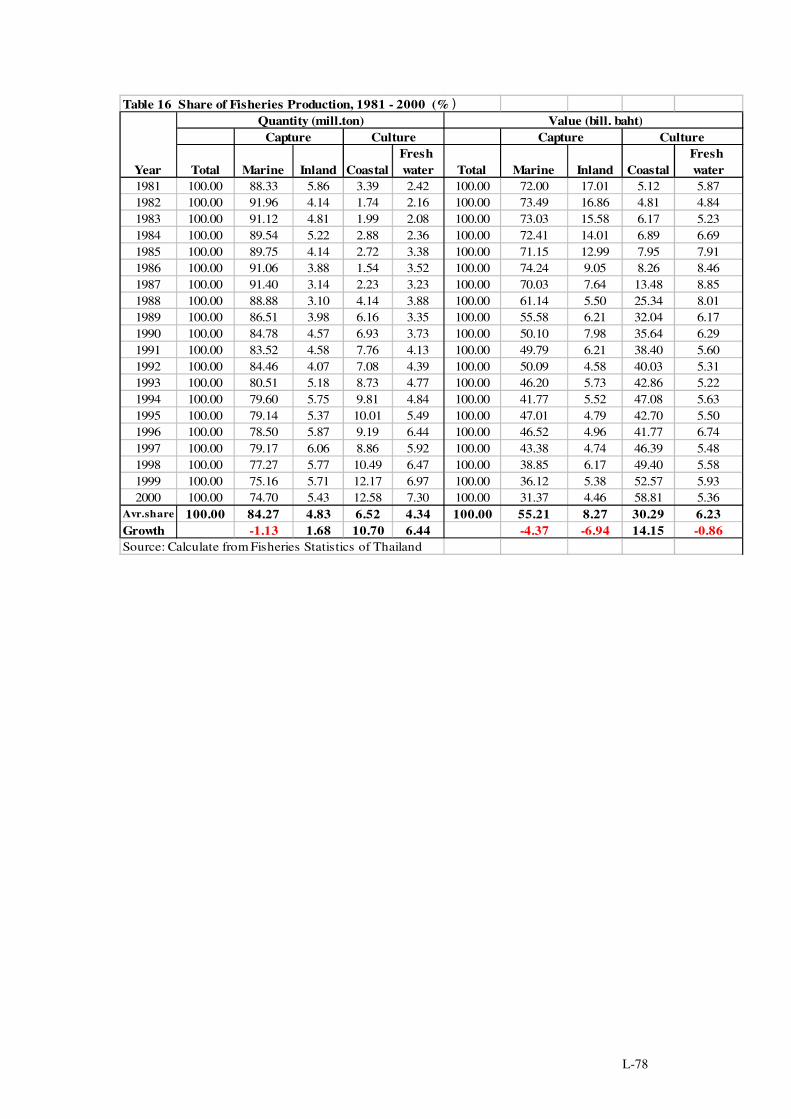
L-78
Table 16 Share of Fisheries Production, 1981 - 2000 (% )
1981 100.00 88.33 5.86 3.39 2.42 100.00 72.00 17.01 5.12 5.871982 100.00 91.96 4.14 1.74 2.16 100.00 73.49 16.86 4.81 4.841983 100.00 91.12 4.81 1.99 2.08 100.00 73.03 15.58 6.17 5.231984 100.00 89.54 5.22 2.88 2.36 100.00 72.41 14.01 6.89 6.691985 100.00 89.75 4.14 2.72 3.38 100.00 71.15 12.99 7.95 7.911986 100.00 91.06 3.88 1.54 3.52 100.00 74.24 9.05 8.26 8.461987 100.00 91.40 3.14 2.23 3.23 100.00 70.03 7.64 13.48 8.851988 100.00 88.88 3.10 4.14 3.88 100.00 61.14 5.50 25.34 8.011989 100.00 86.51 3.98 6.16 3.35 100.00 55.58 6.21 32.04 6.171990 100.00 84.78 4.57 6.93 3.73 100.00 50.10 7.98 35.64 6.291991 100.00 83.52 4.58 7.76 4.13 100.00 49.79 6.21 38.40 5.601992 100.00 84.46 4.07 7.08 4.39 100.00 50.09 4.58 40.03 5.311993 100.00 80.51 5.18 8.73 4.77 100.00 46.20 5.73 42.86 5.221994 100.00 79.60 5.75 9.81 4.84 100.00 41.77 5.52 47.08 5.631995 100.00 79.14 5.37 10.01 5.49 100.00 47.01 4.79 42.70 5.501996 100.00 78.50 5.87 9.19 6.44 100.00 46.52 4.96 41.77 6.741997 100.00 79.17 6.06 8.86 5.92 100.00 43.38 4.74 46.39 5.481998 100.00 77.27 5.77 10.49 6.47 100.00 38.85 6.17 49.40 5.581999 100.00 75.16 5.71 12.17 6.97 100.00 36.12 5.38 52.57 5.932000 100.00 74.70 5.43 12.58 7.30 100.00 31.37 4.46 58.81 5.36
Avr.share 100.00 84.27 4.83 6.52 4.34 100.00 55.21 8.27 30.29 6.23Growth -1.13 1.68 10.70 6.44 -4.37 -6.94 14.15 -0.86Source: Calculate from Fisheries Statistics of Thailand
Total Inland CoastalFresh water
Quantity (mill.ton) Value (bill. baht)Capture Culture Capture Culture
Year Fresh water Total Marine Inland CoastalMarine
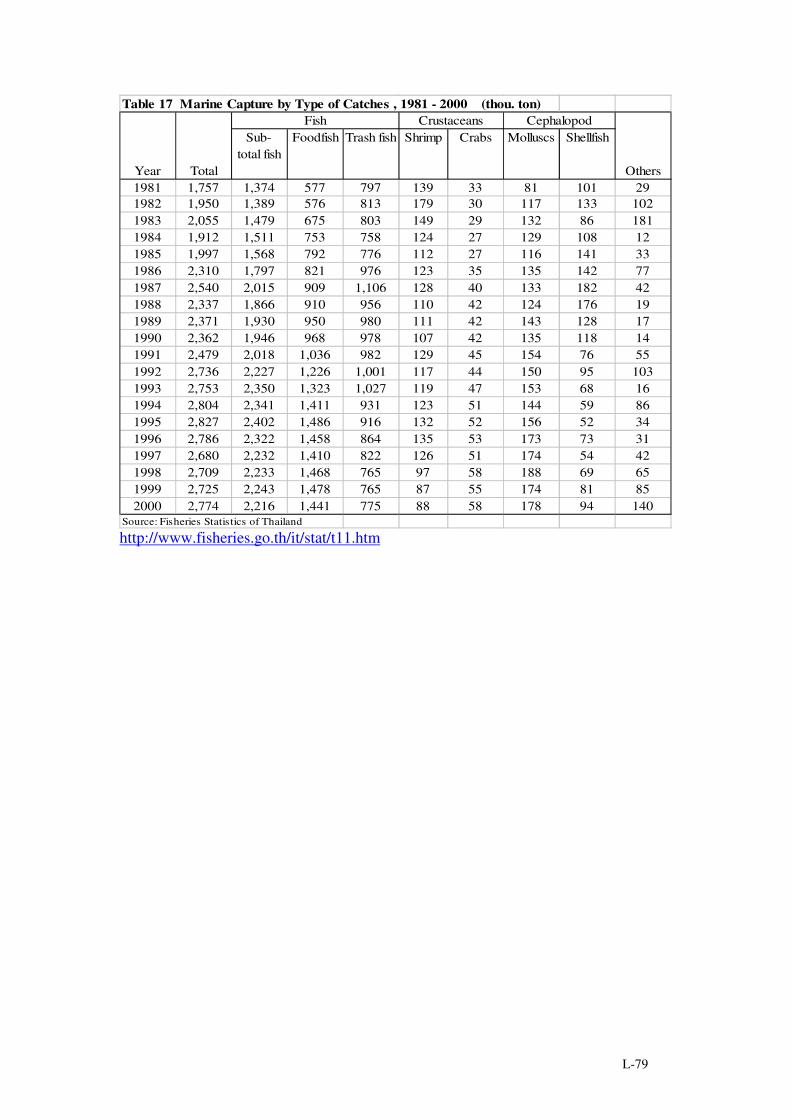
L-79
Table 17 Marine Capture by Type of Catches , 1981 - 2000 (thou. ton)
1981 1,757 1,374 577 797 139 33 81 101 291982 1,950 1,389 576 813 179 30 117 133 1021983 2,055 1,479 675 803 149 29 132 86 1811984 1,912 1,511 753 758 124 27 129 108 121985 1,997 1,568 792 776 112 27 116 141 331986 2,310 1,797 821 976 123 35 135 142 771987 2,540 2,015 909 1,106 128 40 133 182 421988 2,337 1,866 910 956 110 42 124 176 191989 2,371 1,930 950 980 111 42 143 128 171990 2,362 1,946 968 978 107 42 135 118 141991 2,479 2,018 1,036 982 129 45 154 76 551992 2,736 2,227 1,226 1,001 117 44 150 95 1031993 2,753 2,350 1,323 1,027 119 47 153 68 161994 2,804 2,341 1,411 931 123 51 144 59 861995 2,827 2,402 1,486 916 132 52 156 52 341996 2,786 2,322 1,458 864 135 53 173 73 311997 2,680 2,232 1,410 822 126 51 174 54 421998 2,709 2,233 1,468 765 97 58 188 69 651999 2,725 2,243 1,478 765 87 55 174 81 852000 2,774 2,216 1,441 775 88 58 178 94 140
Source: Fisheries Statistics of Thailand
Year Total
Fish CrustaceansSub-
total fishFoodfish Trash fish Shrimp Crabs
Others
Cephalopod Molluscs Shellfish
http://www.fisheries.go.th/it/stat/t11.htm
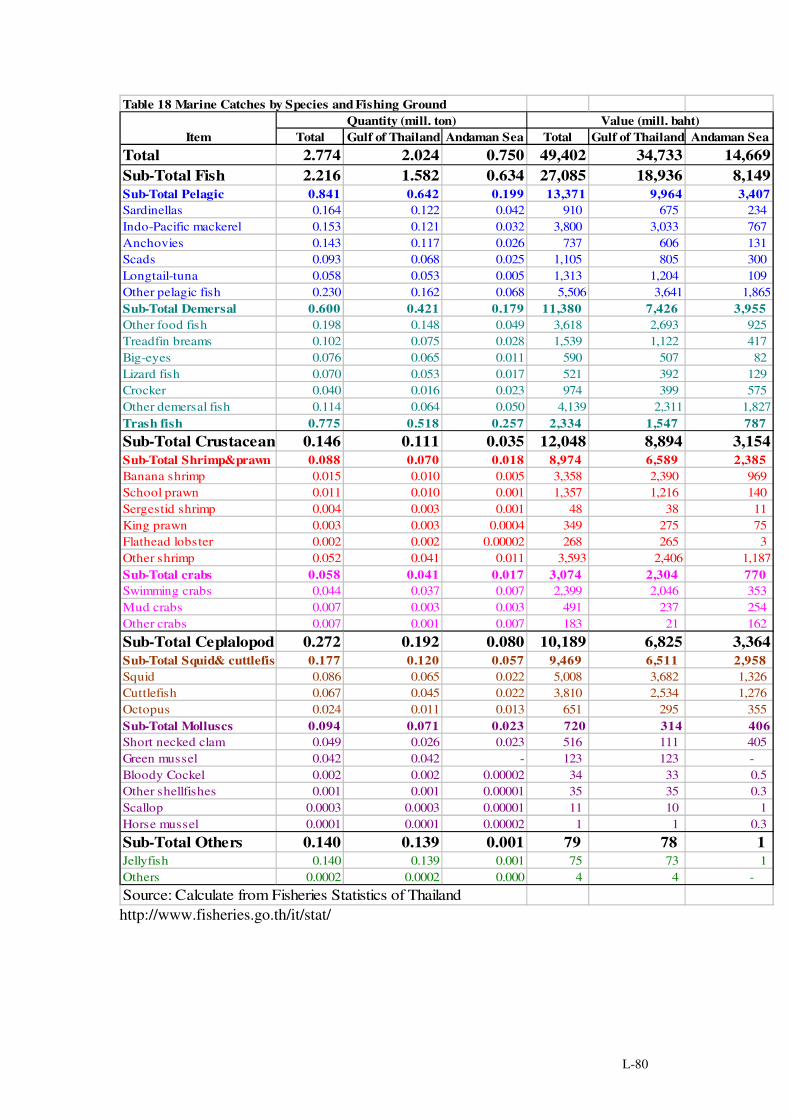
L-80
Table 18 Marine Catches by Species and Fishing Ground
Total Gulf of Thailand Andaman Sea Total Gulf of Thailand Andaman SeaTotal 2.774 2.024 0.750 49,402 34,733 14,669Sub-Total Fish 2.216 1.582 0.634 27,085 18,936 8,149Sub-Total Pelagic 0.841 0.642 0.199 13,371 9,964 3,407Sardinellas 0.164 0.122 0.042 910 675 234 Indo-Pacific mackerel 0.153 0.121 0.032 3,800 3,033 767 Anchovies 0.143 0.117 0.026 737 606 131 Scads 0.093 0.068 0.025 1,105 805 300 Longtail-tuna 0.058 0.053 0.005 1,313 1,204 109 Other pelagic fish 0.230 0.162 0.068 5,506 3,641 1,865Sub-Total Demersal 0.600 0.421 0.179 11,380 7,426 3,955 Other food fish 0.198 0.148 0.049 3,618 2,693 925 Treadfin breams 0.102 0.075 0.028 1,539 1,122 417 Big-eyes 0.076 0.065 0.011 590 507 82 Lizard fish 0.070 0.053 0.017 521 392 129 Crocker 0.040 0.016 0.023 974 399 575 Other demersal fish 0.114 0.064 0.050 4,139 2,311 1,827Trash fish 0.775 0.518 0.257 2,334 1,547 787 Sub-Total Crustacean 0.146 0.111 0.035 12,048 8,894 3,154Sub-Total Shrimp&prawn 0.088 0.070 0.018 8,974 6,589 2,385 Banana shrimp 0.015 0.010 0.005 3,358 2,390 969 School prawn 0.011 0.010 0.001 1,357 1,216 140 Sergestid shrimp 0.004 0.003 0.001 48 38 11 King prawn 0.003 0.003 0.0004 349 275 75 Flathead lobster 0.002 0.002 0.00002 268 265 3 Other shrimp 0.052 0.041 0.011 3,593 2,406 1,187Sub-Total crabs 0.058 0.041 0.017 3,074 2,304 770 Swimming crabs 0.044 0.037 0.007 2,399 2,046 353 Mud crabs 0.007 0.003 0.003 491 237 254 Other crabs 0.007 0.001 0.007 183 21 162
Sub-Total Ceplalopod 0.272 0.192 0.080 10,189 6,825 3,364Sub-Total Squid& cuttlefish 0.177 0.120 0.057 9,469 6,511 2,958 Squid 0.086 0.065 0.022 5,008 3,682 1,326 Cuttlefish 0.067 0.045 0.022 3,810 2,534 1,276 Octopus 0.024 0.011 0.013 651 295 355 Sub-Total Molluscs 0.094 0.071 0.023 720 314 406Short necked clam 0.049 0.026 0.023 516 111 405 Green mussel 0.042 0.042 - 123 123 - Bloody Cockel 0.002 0.002 0.00002 34 33 0.5 Other shellfishes 0.001 0.001 0.00001 35 35 0.3 Scallop 0.0003 0.0003 0.00001 11 10 1 Horse mussel 0.0001 0.0001 0.00002 1 1 0.3
Sub-Total Others 0.140 0.139 0.001 79 78 1 Jellyfish 0.140 0.139 0.001 75 73 1 Others 0.0002 0.0002 0.000 4 4 - Source: Calculate from Fisheries Statistics of Thailand
ItemQuantity (mill. ton) Value (mill. baht)
http://www.fisheries.go.th/it/stat/

L-81
Table 19 Marine Catches by Type of Fishing Gear and Fishing Ground, 2000
Total Gulf of Thailand Andaman Sea Total Gulf of Thailand Andaman SeaTotal 2,773,665 2,023,172 750,493 100.00 72.94 27.06Sub-Total trawl 1,620,642 1,130,162 490,480 58.43 40.75 17.68Otter board trawl 1,342,616 909,270 433,346 48.41 32.78 15.62Pair trawl 275,510 218,376 57,134 9.93 7.87 2.06Beam trawl 2,516 2,516 - 0.09 0.09 - Sub-Total purse seine 712,927 528,798 184,129 25.70 19.06 6.64Purse seine 577,976 419,888 158,088 20.84 15.14 5.70Anchovy purse seine 134,951 108,910 26,041 4.87 3.93 0.94Sub-Total gill net 114,450 84,257 30,193 4.13 3.04 1.09King mackerel drift gill net 9,596 7,961 1,635 0.35 0.29 0.06Indo-pacific mackerel encircling gill net9,240 9,121 119 0.33 0.33 0.00Crab gill net 35,313 30,268 5,045 1.27 1.09 0.18Shrimp gill net 14,074 8,536 5,538 0.51 0.31 0.20Squid trammel nets 1,135 1,135 - 0.04 0.04 - Indo-pacific mackerel gill net 21,220 17,194 4,026 0.77 0.62 0.15Mullet gill net 15,512 9,212 6,300 0.56 0.33 0.23Other gill nets 14,660 7,130 7,530 0.53 0.26 0.27Sub-Total mobilnet 38,882 29,501 9,381 1.40 1.06 0.34Other cast net 398 310 88 0.01 0.01 0.00Acetes scoop net 1,073 455 618 0.04 0.02 0.02Lift nets 2,560 746 1,814 0.09 0.03 0.07Other net 962 962 - 0.03 0.03 0.00Push net 33,889 27,028 6,861 1.22 0.97 0.25Sub-Total light luring 18,269 18,074 195 0.66 0.65 0.01Squid falling nets 16,827 16,632 195 0.61 0.60 0.01Anchovy falling nets 1,442 1,442 - 0.05 0.05 0.00Sub-Total hook 6,549 5,458 1,091 0.24 0.20 0.04Long line 1,125 738 387 0.04 0.03 0.01Handline and pole & lines 5,424 4,720 704 0.20 0.17 0.03Sub-Total stationary gear 26,766 16,038 10,728 0.97 0.58 0.39Set bag net 10,847 5,049 5,798 0.39 0.18 0.21Fish trap 989 577 412 0.04 0.02 0.01Crab trap 4,851 2,447 2,404 0.17 0.09 0.09Squid trap 5,378 3,532 1,846 0.19 0.13 0.07Shrimp trap 2,530 2,530 - 0.09 0.09 0.00Stationary trap 20 21 - 0.00 0.00 0.00Bamboo stake trap 2,150 1,882 268 0.08 0.07 0.01Miscellaneous Gears 235,180 210,884 24,296 8.48 7.60 0.88Jellyfishes 139,622 138,636 986 5.03 5.00 0.04Shellfish collecting 93,844 70,668 23,176 3.38 2.55 0.84Others 1,714 1,580 134 0.06 0.06 0.00Source: Calculate from Fisheries Statistics of Thailand
Quantity (ton) Share of total catch (% )Gear
http://www.fisheries.go.th/it/stat/
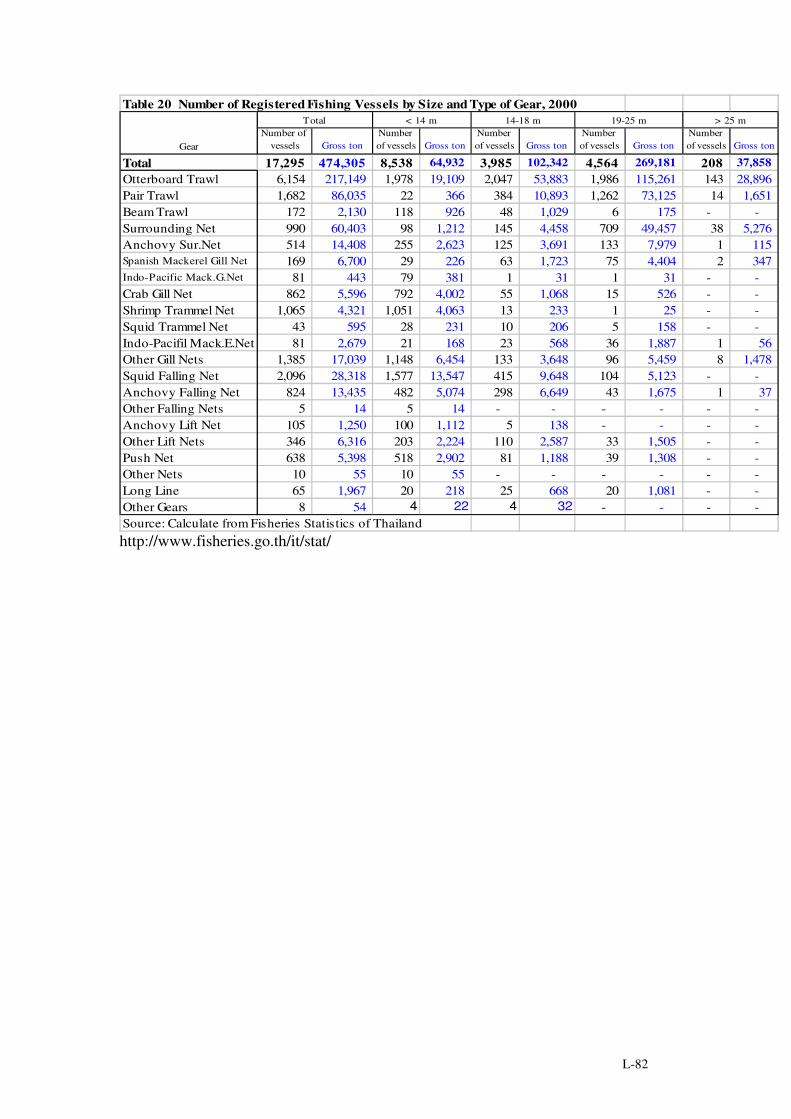
L-82
Table 20 Number of Registered Fishing Vessels by Size and Type of Gear, 2000
Number of vessels Gross ton
Number of vessels Gross ton
Number of vessels Gross ton
Number of vessels Gross ton
Number of vessels Gross ton
Total 17,295 474,305 8,538 64,932 3,985 102,342 4,564 269,181 208 37,858 Otterboard Trawl 6,154 217,149 1,978 19,109 2,047 53,883 1,986 115,261 143 28,896 Pair Trawl 1,682 86,035 22 366 384 10,893 1,262 73,125 14 1,651 Beam Trawl 172 2,130 118 926 48 1,029 6 175 - - Surrounding Net 990 60,403 98 1,212 145 4,458 709 49,457 38 5,276 Anchovy Sur.Net 514 14,408 255 2,623 125 3,691 133 7,979 1 115 Spanish Mackerel Gill Net 169 6,700 29 226 63 1,723 75 4,404 2 347 Indo-Pacific Mack.G.Net 81 443 79 381 1 31 1 31 - - Crab Gill Net 862 5,596 792 4,002 55 1,068 15 526 - - Shrimp Trammel Net 1,065 4,321 1,051 4,063 13 233 1 25 - - Squid Trammel Net 43 595 28 231 10 206 5 158 - - Indo-Pacifil Mack.E.Net 81 2,679 21 168 23 568 36 1,887 1 56 Other Gill Nets 1,385 17,039 1,148 6,454 133 3,648 96 5,459 8 1,478 Squid Falling Net 2,096 28,318 1,577 13,547 415 9,648 104 5,123 - - Anchovy Falling Net 824 13,435 482 5,074 298 6,649 43 1,675 1 37 Other Falling Nets 5 14 5 14 - - - - - - Anchovy Lift Net 105 1,250 100 1,112 5 138 - - - - Other Lift Nets 346 6,316 203 2,224 110 2,587 33 1,505 - - Push Net 638 5,398 518 2,902 81 1,188 39 1,308 - - Other Nets 10 55 10 55 - - - - - - Long Line 65 1,967 20 218 25 668 20 1,081 - - Other Gears 8 54 4 22 4 32 - - - - Source: Calculate from Fisheries Statistics of Thailand
Gear
Total < 14 m 14-18 m 19-25 m > 25 m
http://www.fisheries.go.th/it/stat/
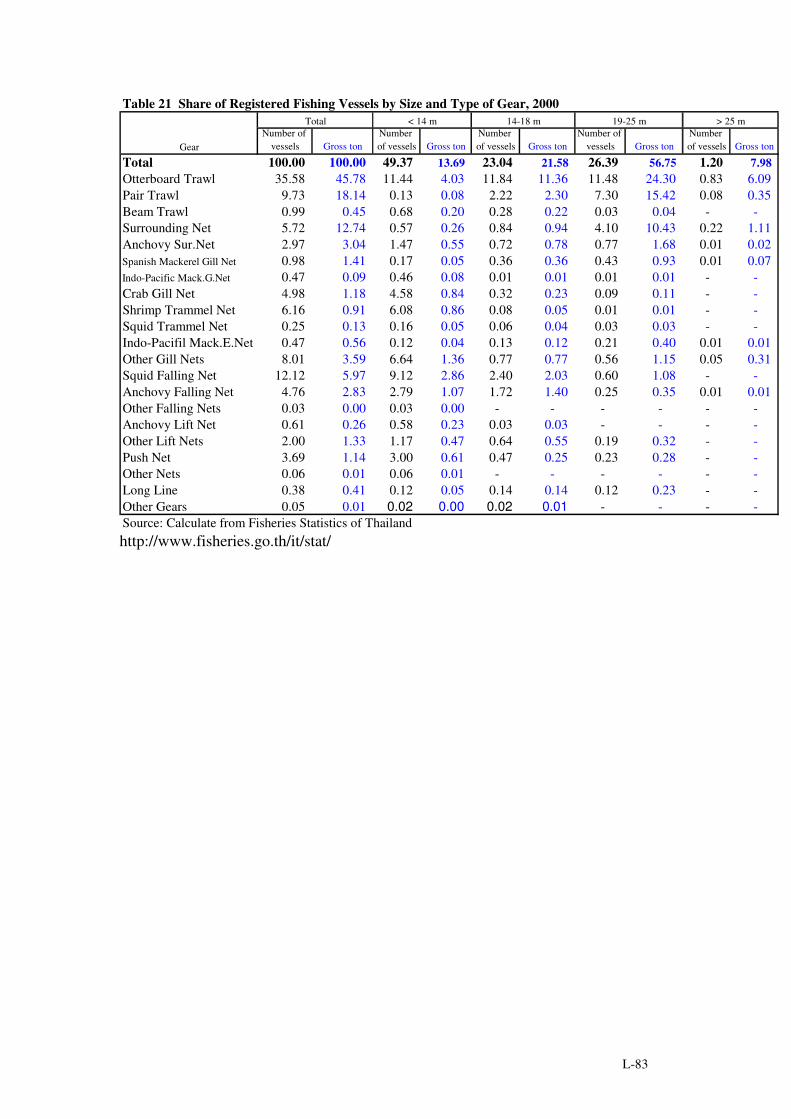
L-83
Table 21 Share of Registered Fishing Vessels by Size and Type of Gear, 2000
Number of vessels Gross ton
Number of vessels Gross ton
Number of vessels Gross ton
Number of vessels Gross ton
Number of vessels Gross ton
Total 100.00 100.00 49.37 13.69 23.04 21.58 26.39 56.75 1.20 7.98 Otterboard Trawl 35.58 45.78 11.44 4.03 11.84 11.36 11.48 24.30 0.83 6.09 Pair Trawl 9.73 18.14 0.13 0.08 2.22 2.30 7.30 15.42 0.08 0.35 Beam Trawl 0.99 0.45 0.68 0.20 0.28 0.22 0.03 0.04 - - Surrounding Net 5.72 12.74 0.57 0.26 0.84 0.94 4.10 10.43 0.22 1.11 Anchovy Sur.Net 2.97 3.04 1.47 0.55 0.72 0.78 0.77 1.68 0.01 0.02 Spanish Mackerel Gill Net 0.98 1.41 0.17 0.05 0.36 0.36 0.43 0.93 0.01 0.07 Indo-Pacific Mack.G.Net 0.47 0.09 0.46 0.08 0.01 0.01 0.01 0.01 - - Crab Gill Net 4.98 1.18 4.58 0.84 0.32 0.23 0.09 0.11 - - Shrimp Trammel Net 6.16 0.91 6.08 0.86 0.08 0.05 0.01 0.01 - - Squid Trammel Net 0.25 0.13 0.16 0.05 0.06 0.04 0.03 0.03 - - Indo-Pacifil Mack.E.Net 0.47 0.56 0.12 0.04 0.13 0.12 0.21 0.40 0.01 0.01 Other Gill Nets 8.01 3.59 6.64 1.36 0.77 0.77 0.56 1.15 0.05 0.31 Squid Falling Net 12.12 5.97 9.12 2.86 2.40 2.03 0.60 1.08 - - Anchovy Falling Net 4.76 2.83 2.79 1.07 1.72 1.40 0.25 0.35 0.01 0.01 Other Falling Nets 0.03 0.00 0.03 0.00 - - - - - - Anchovy Lift Net 0.61 0.26 0.58 0.23 0.03 0.03 - - - - Other Lift Nets 2.00 1.33 1.17 0.47 0.64 0.55 0.19 0.32 - - Push Net 3.69 1.14 3.00 0.61 0.47 0.25 0.23 0.28 - - Other Nets 0.06 0.01 0.06 0.01 - - - - - - Long Line 0.38 0.41 0.12 0.05 0.14 0.14 0.12 0.23 - - Other Gears 0.05 0.01 0.02 0.00 0.02 0.01 - - - - Source: Calculate from Fisheries Statistics of Thailand
Gear
Total < 14 m 14-18 m 19-25 m > 25 m
http://www.fisheries.go.th/it/stat/

L-84
Table 22 Marine Fishery Households by Size of Operation, 1995 and 2000
Total Small scale Commercial Total Small scale Commercial Total Small scale Commercial
Total 53,112 47,620 5,492 57,801 53,343 4,458 8.8 12.0 -18.8
(100.0) (89.7) (10.3) (100.0) (92.3) (7.7)
Coastal Zone 1 6,287 5,642 645 6,351 5,906 445 1.0 4.7 -31.0
(100.0) (89.7) (10.3) (100.0) (93.0) (7.0)
Coastal Zone 2 5,866 4,330 1,536 5,194 3,960 1,234 -11.5 -8.5 -19.7
(100.0) (73.8) (26.2) (100.0) (76.2) (23.8)
Coastal Zone 3 7,311 6,107 1,204 7,580 6,901 679 3.7 13.0 -43.6
(100.0) (83.5) (16.5) (100.0) (91.0) (9.0)
Coastal Zone 4 16,802 15,502 1,300 17,973 16,429 1,544 7.0 6.0 18.8
(100.0) (92.3) (7.7) (100.0) (91.4) (8.6)
Coastal Zone 5 16,846 16,039 807 20,703 20,147 556 22.9 25.6 -31.1
(100.0) (95.2) (4.8) (100.0) (97.3) (2.7)
Source: Marine Fishery Census 1995 and Additional Survey in 2000, National Statistical Office
Note: Coastal Zone 1 is in the Eastern Region, Coastal Zone 2 is the coastline along the inner Gulf of Thailand Coastal Zone 3 is the upper south coastline of the Gulf of Thailand, Coastal Zone 4 is the coastline of the lower south
and Coastal Zone 5 is the coastline along the Andaman Sea.
Area1995 2000 % Change
Table 23 Marine Fishery Households by Type of Operation 1995 and 2000
1995 2000 Type of Operation
No. of H/H % No. of H/H % % Change
Fishing Households 80,704 100 93,512 100 15.9
Marine fishing only 50,176 62.2 55,981 59.9 11.6
Coastal culture only 27,592 34.2 35,711 38.2 29.4
Both 2,936 3.6 1,820 1.9 -38.0
Fishery Employee Households 29,302 100 29,122 100 -0.6
Marine fishing only 22,894 78.1 23,703 81.4 3.5
Coastal culture only 6,223 21.3 5162 17.7 -17.0
Both 185 0.6 257 0.9 38.9
Source: Marine Fisheries Census 1995 and Additional Survey in 2000, National Statistical Office

L-85
Table 24 Number of Fishermen in Peak Season by Area and Origin of the Fishermen 2000
Total Local Northeast Other non-local Foreigner
Total 168,140 80,857 87,283 32,136 18,594 7,337 29,216
Coastal Zone 1 14,267 8,402 5,865 1,940 1,334 416 2,175
Coastal Zone 2 39,778 6,880 32,898 6,631 10,412 2,093 13,762
Coastal Zone 3 21,331 11,270 10,061 6,218 1,061 699 2,083
Coastal Zone 4 45,227 24,485 20,742 10,564 3,890 2,104 4,184
Coastal Zone 5 47,537 29,820 17,717 6,783 1,897 2,025 7,012
Total 100.00 48.09 51.91 19.11 11.06 4.36 17.38
Coastal Zone 1 8.49 5.00 3.49 1.15 0.79 0.25 1.29
Coastal Zone 2 23.66 4.09 19.57 3.94 6.19 1.24 8.18
Coastal Zone 3 12.69 6.70 5.98 3.70 0.63 0.42 1.24
Coastal Zone 4 26.90 14.56 12.34 6.28 2.31 1.25 2.49
Coastal Zone 5 28.27 17.74 10.54 4.03 1.13 1.20 4.17
Source: Addidition Marine Fisheries Survey 2000, National Statistical Office
AreaEmployees
Share of total fishermen
Total Family member

L-86
Table 25 Wage Rate in Fishing Sector 1996 - 2003 (baht/month)Total average Fishing sector Other agriculture Financial sector
Feb.1996 4,439 4,221 2,567 13,249 Aug.1996 4,839 3,879 2,750 13,145 Feb.1997 5,044 4,389 2,986 12,250 Aug.1997 5,532 4,489 3,212 12,070 Feb.1998 5,243 4,881 3,161 13,634 Aug.1998 5,571 4,785 2,879 12,876 Feb.1999 5,233 5,156 2,933 13,514 Aug,1999 5,602 4,584 2,890 14,747 Feb.2000 5,337 4,550 2,897 17,695 Aug.2000 5,534 4,446 3,075 16,640 Feb.2001 5,331 4,822 2,393 15,850 Aug.2001 5,567 4,154 2,092 16,930 Feb.2002 5,350 4,222 2,322 15,408 Aug.2002 5,568 4,371 2,208 15,474 Feb.2003 5,533 4,346 2,453 15,757 Aug.2003 5,842 4,492 2,345 16,642 Source: National Statistical OfficeSocial Indicator Indices
Table 26 Fish Processing Plants by Type of Processing and Area, 2000
Type Total CZ 1 CZ 2 CZ 3 CZ 4 CZ 5Freezing 142 8 76 15 27 16
Canning 40 2 22 3 11 2
Fish sauce
fish 86 30 46 8 1 1
budu 1/ 123 0 0 0 123 0
Steaming 80 0 59 3 14 4
Smoking 17 0 5 0 5 7
Dried/salted
fish 665 35 310 27 247 46
shrimp 124 8 26 20 21 49
squid 381 61 130 88 53 49
mollusc 160 0 159 0 0 1
Fish ball 82 13 45 2 13 9
Shrimp cracker 148 0 6 0 142 0
Fish meal 94 8 21 9 30 26Source: Fishery Statistics of Thailand, 2000Note: 1/ Special fish sauce for southern dishes.

L-87
Table 27 Utilization of Marine Catches by Type of Processing (% of each type of aquatic catches)
Type TotalFoodfish
Trashfish Shrimp Sergistid Crab Shellfish Squid Jellyfish
Fresh 20.5 22.8 0 17.1 0 52.4 60.9 18.3 0Frozen 23.8 30.8 0 49.7 0 11.8 3.1 64.9 0Canned 19.7 30.0 0 29.0 0 35.8 23.3 6.8 0Steamed/smoked 0.4 0.8 0 0 0 0 0 0 0Fermented 3.3 7.1 0 0 0 0 0 0 0Dried/salted/paste 5.9 3.1 0 4.2 100.0 0 12.7 10 99.8Other food processing 0.5 1.1 0 0 0 0 0 0 0.2Fish meal 25.9 4.3 100.0 0 0 0 0 0 0Source: Fishery Statistics of Thailandhttp://www.fisheries.go.th/it/stat/
Table 28 Cost and Return from Small Scale Fisheries, 2000 (baht/household/year)
Total Shrimp gill net Crab gill net Mullet gill net Push net
cost,return
% ofcost
cost,return
% ofcost
cost,return
% ofcost
cost,return
% ofcost
cost,return
% ofcost
Value ofcatches, sold 125,083 119,699 124,711 114,632 173,356
Costs offishing 52,012 100.0 48,284 100.0 53,539 100.0 42,834 100.0 77,682 100.0
Hired labor 8,167 15.7 7,609 15.8 8,356 15.6 5,142 12.0 14,171 18.2
Fuel 21,166 40.7 17,888 37.0 20,834 38.9 16,884 39.4 34,746 44.7
Lubrication 1,423 2.7 1,444 3.0 1,544 2.9 1,232 2.9 1,940 2.5
Gearmaintenance 4,798 9.2 5,941 12.3 7,116 13.3 4,680 10.9 5,364 6.9
Bait 993 1.9 215 0.4 538 1.0 152 0.4 309 0.4
Ice 1,166 2.2 949 2.0 352 0.7 1,177 2.8 1,655 2.1
Battery 577 1.1 468 1.0 599 1.1 521 1.2 974 1.3
Hullmaintenance 3,718 7.2 3,646 7.5 4,025 7.5 4,299 10.0 5,073 6.5
Enginemaintenance 2,640 5.1 2,764 5.7 2,968 5.5 3,361 7.9 3,607 4.7
Interest onloan 252 0.5 184 0.4 118 0.2 274 0.6 608 0.8
Others 772 1.5 580 1.2 688 1.3 446 1.0 950 1.2
Depreciation 6,339 12.2 6,595 13.7 6,401 12.0 4,666 10.9 8,285 10.7
Net returnfrom fishing 73,072 71,415 71,172 71,798 95,675
Source: Additional Survey for Marine Fisheries Census 2000, National Statistical Office

L-88
Table 29 Source of Income for Small Scale Fisheries, 2000
Total Coastal Zone 1 Coastal Zone 2 Coastal Zone 3 Coastal Zone 4 Coastal Zone 5Item
baht/hh/yr. % of Total baht/hh/yr. % ofTotal baht/hh/yr. % of
Total baht/hh/yr. % ofTotal baht/hh/yr. % of
Total baht/hh/yr. % ofTotal
Total Income 89,684 100.0 101,985 100.0 121,349 100.0 114,943 100.0 82,465 100.0 77,171 100.0
Marine Fisheries 75,187 83.8 87,070 85.4 105,139 86.6 99,478 86.5 67,140 81.4 64,126 83.1
Fishing 73,072 81.5 84,565 82.9 99,798 82.2 96,228 83.7 65,520 79.4 62,744 81.3
Related activities 2,115 2.3 2,505 2.5 5,341 4.4 3,250 2.8 1,620 2.0 1,382 1.8
� Coastalaquaculture 817 0.9 1,885 1.9 1,723 1.4 418 0.3 806 1.0 482 0.6
� Processing 1,298 1.4 620 0.6 3,618 3.0 2,832 2.5 814 1.0 900 1.2
Non-fishing Sector 14,498 16.2 14,916 14.6 16,210 13.4 15,465 13.5 15,325 18.6 13,045 16.9
Wage and salary 7,365 8.2 8,967 8.8 10,830 8.9 9,859 8.6 6,853 8.3 5,790 7.5
Other agriculture 3,289 3.7 3,136 3.1 1,328 1.1 1,590 1.4 4,134 5.0 3,617 4.7
Trade and service 3,685 4.1 2,791 2.7 3,898 3.2 3,830 3.3 4,108 5.0 3,506 4.5
Others 159 0.2 22 - 154 0.2 186 0.2 230 0.3 132 0.2
Source: Additional Survey for Marine Fisheries Census 2000, National Statistical Office