limnological sampling during an annual cycle at three
TRANSCRIPT

RESEARCH FOR THE MANAGEMENTOF THE FISHERIES GCP/RAF/271/FIN-TD/46(En)ON LAKE TANGANYIKA
GCP/RAF/271/FIN-TD/46(En) February 1996
LIMNOLOGICAL SAMPLING DURING AN ANNUAL CYCLEAT THREE STATIONS ON LAKE TANGANYIKA (1993-1994)
byP.-D. Plisnier , V. Langenberg, L. Mwape,
D. Chitamwembwa, K. Tshibangu and E. Coenen
FINNISH INTERNATIONAL DEVELOPMENT AGENCY
FOOD AND AGRICULTURE ORGANIZATIONOF THE UNITED NATIONS
Bujumbura, February 1996

The conclusions and recommendations given in this and otherreports in the Research for the Management of the Fisherieson Lake Tanganyika Project series are those consideredappropriate at the time of preparation. They may bemodified in the light of further knowledge gained atsubsequent stages of the Project. The designations employedand the presentation of material in this publication do notimply the expression of any opinion on the part of FAO orFINNIDA concerning the legal status of any country,territory, city or area, or concerning the determination ofits frontiers or boundaries

GCP/RAF/271/FIN-TD/46 (En) iii
PREFACE
The Research for the Management of the Fisheries on LakeTanganyika Project (Lake Tanganyika Research) became fullyoperational in January 1992. It is executed by the Food andAgriculture organization of the United Nations (FAO) and fundedby the Finnish International Developmental Agency (FINNIDA) andthe Arab Gulf Programme for United Nations DevelopmentOrganizations (AGFUND).
This project aims at the determination of the biologicalbasis for fish production on Lake Tanganyika, in order to permitthe formulation of a coherent lake—wide fisheries managementpolicy for the four riparian States (Burundi, Tanzania, Zaïreand Zambia).
Particular attention will be also given to the reinforcementof the skills and physical facilities of the fisheries researchunits in all four beneficiary countries as well as to the build-up of effective coordination mechanisms to ensure fullcollaboration between the Governments concerned.
Prof. O.V. Lindqvist Dr. George HanekLTR Scientific Coordinator LTR Coordinator
LAKE TANGANYIKA RESEARCHFAO
B.P. 1250BUJUMBURABURUNDI
Telex: FOODAGRI BDI 5092 Tel.: (257) 22 9760
Fax.: (257) 22 9761

GCP/RAF/271/FIN-TD/46 (En) iv
GCP/RAF/271/FIN PUBLICATIONS
Publications of LTR are issued in two series:
* A series of technical documents (GCP/RAF/271/FIN-TD)related to meetings, missions and research organized by theproject; and
* A series of manuals and field guides (GCP/RAF/271/FIN-FM)related to training and field work activities conducted in theframework of the project.
For both series, reference is further made to the documentnumber (01), and the language in which the document is issued:English (En) and/or French (Fr).
For bibliographic purposes this document should be cited as follows :
Plisnier, P.-D., V. Langenberg, L. Mwape, D. Chitamwebwa,1996 K. Tshibangu, and E. Coenen, Limnological sampling during
an annual cycle at three stations on Lake Tanganyika (1993-1994) FAO/FINNIDA Research for the Management of the Fisheries on Lake Tanganyika.GCP/RAF/271/FIN—TD/46 (En): 124p.

GCP/RAF/271/FIN-TD/46 (En) v
Table of Contents
SUMMARY 1
1. INTRODUCTION 2
2. OBJECTIVES OF THE LIMNOLOGICAL COMPONENT 2
3. MATERIAL AND METHODS 2
3.1 General remarks 2 3.2 Sampling design and procedure 2 3.3 Instrumentation and analytical methods 3
4. RESULTS 6
4.1 The yearly limnological cycle 6 4.2 Limnological parameters 8
4.2.1 Temperature and stratification 8 4.2.2 Transparency 8 4.2.3 Turbidity 9 4.2.4 Dissolved oxygen 9 4.2.5 Conductivity 9 4.2.6 pH 9 4.2.7 Phosphorus 10 4.2.8 Nitrogen 10
5. DISCUSSION 10
6. CONCLUSIONS 13
ACKNOWLEDGEMENTS 14
REFERENCES 16
FIGURES 1 - 6 19
APPENDIX A 24
APPENDIX B 103
APPENDIX C 115

GCP/RAF/271/FIN-TD/46 (En) 1
SUMMARY
This report presents the results of the first year oflimnological sampling by LTR. Layers identified in the watercolumn of Lake Tanganyika, parameter profiles and rhythmicpatterns regulating the distribution of the nutrients aredescribed. Upwelling was observed in the south of the lake during thedry, windy season. Stratification was variable in strength butalways present in the north. The lake showed a marked tilting ofthe epilimnion during the dry season from June to September. This period was followed by oscillations of water masses towardsan equilibrium when the strong winds from the south east stopped. Conductivity and pH fluctuations indicated dampenedoscillations, particularly at both ends of the lake. Movementsof the epilimnion toward an equilibrium position generated and/orre-inforced internal waves. These waves were inferred fromfluctuations of chemical or physical characteristics of the lake. Ten parameters were measured frequently near Bujumbura,Kigoma and Mpulungu over one year. Variation in theconcentration of several parameters was commonly by a factor of 3or more. The time of long-period internal waves was estimated tobe approximately 28 to 33 days. Pulse production caused byinternal waves is suggested. It could be linked to "non-randompatchiness" in nutrients and organisms. Turbulence may have explained the presence of dissolvedoxygen in deep water, sometimes detectable at 300 m, or ammoniain the epilimnion. Turbulence resulting from highly dynamicphysical events might induce "random-patchiness" in watercomposition. The results of the first year of sampling showed that theproductivity of Lake Tanganyika, like that of the oceans, seemedto depend largely on regeneration processes.

GCP/RAF/271/FIN-TD/46 (En) 2
1. INTRODUCTION The Lake Tanganyika Research Project (LTR) completed one yearof regular limnological sampling on Lake Tanganyika in July 1994. This is the first known simultaneous sampling and measuring ofvarious limnological parameters, using the same techniques atdifferent locations on the lake, over this time period. Resultsof this study are presented in this report as well as someinitial conclusions. A second year of sampling was carried outto July 1995 and will be reported elsewhere. The interpretationof the present results should be considered as preliminary untilthe second year of data have been analysed. 2. OBJECTIVES OF THE LIMNOLOGICAL COMPONENT The objectives of the limnological component were to obtaininformation on changes in time and space of some of the mainphysical and chemical parameters of the lake that would help toimprove understanding of the abundance of organisms especiallyzooplankton and fish. The physical and chemical environmentstudied in the limnogical component is the basis of biologicalproduction on which fish production ultimately depends. Thestudy of fluctuations in this environment at each station shouldenhance the understanding of food webs from nutrients to fish. The variations of limnological parameters in the water column onseveral time scales provide information which can be correlatedwith the hydrodynamics of the lake. 3. MATERIAL AND METHODS 3.1. General remarks
The following parameters have been measured during regularsampling (type A) and intensive sampling (type B), transparency(Secchi), temperature, dissolved oxygen, pH, conductivity, totalphosphorus (TP), phosphate (total reactive phosphorus, TRP, asPO4
3-), ammonia (NH4-N), nitrite (NO2-N), nitrate (NO3-N) and
turbidity (NTU). The parameters were generally measured by theHACH DREL 2OOO methods. Most of these methods proved to besufficiently accurate for the study. They were suitable for usein remote stations and onboard medium sized boats where therewere no laboratory facilities. Regular accuracy checks werecarried out and confidence was gained by comparing ranges ofconcentrations with other studies (Van Meel ,1987; Degens et al.,1971; Hecky et al., 1978; Beauchamp, 1939). 3.2. Sampling design and procedure During the first year LTR only investigated the pelagic zone. Three different types of sampling were established: (1) regularsampling (type A) (2 to 4 per month), (2) intensive sampling(type B) (24 h cycle, every 6 weeks) and (3) seasonal sampling(type C) (every 3 months). Results of type A are reported here.

GCP/RAF/271/FIN-TD/46 (En) 3
Results of type B and C sampling are presented in two separatedocuments (Plisnier, in prep.). The position of each samplingsite (Table 1, Fig. 1) was recorded with a GPS (globalpositioning system), Raystar 390 of Raytheon, with an estimatedaccuracy of 15 to 100 m depending of the position of thesatellite. The GPS was used during each experiment to positionthe boat. Full details of the sampling procedure are given inPlisnier (1993) and only a brief description is presented here. Regular sampling at site A was performed normally everyTuesday morning at 0900 h (GMT + 2 h) except during the intensivesampling period (type B). Site A of each station was located >4km from the shore where the depth of the lake was >120 m (Fig.1). The exact coordinates recorded by GPS are given in Table 1. As the boat drifted, the position at the end of sampling mayhave been slightly different from that at the start. Sampleswere taken every 10 m from the surface to 100 m. The followingparameters were measured (a) directly from the boat:transparency, water temperature, dissolved oxygen, pH andconductivity, and (b) from water samples taken to the laboratory:P (total), PO4
3-, NH3-N, NO2--N, NO3-N and turbidity. Temperature,pH, conductivity and turbidity were measured every 10 m and theother parameters every 20 m ,from the surface to 100 m. Dissolved oxygen measurements were first made in November 1993 atBujumbura and in April 1994 at Kigoma and Mpulungu. Regularsampling was carried on 28 occasions at Bujumbura/Uvira (referredto in tables and figures as Buj.-Uvi.), 29 occasions at Kigomaand 33 occasions at Mpulungu (Table C.1). 3.3 Instrumentation and analytical methods
Transparency measurements, taken at the start of the samplingperiod, were made with a 20 cm diameter Secchi disk. The meanvalue of measurements made by three separate observers wasrecorded. Water samples were collected using Van Dorn bottles(made by Limnos) of 7.4 and 2.0 l capacity. The weight of thebottles was increased when necessary. Bottles were lowered andraised with a hand winch. Water temperature, with an accuracy of + 0.1°C, was first measured with a thermometer placed inside thewater bottle. The thermometer was read as soon as the bottlereached the deck. This method was replaced with in situmeasurements taken down to 80 m with a digital thermometer,coupled to an oxygen meter (made by Yellow Springs InstrumentCo.), with the same accuracy as before. For lower depths theprobe was placed in the sampling bottle and read when the bottlereached the surface. Other water temperature measurements werecollected with a CTD-12 (with a precision of + 0.01(C and withautomatic Anderaa thermistor strings (with a similar precision but with an accuracy of + 0.1°C (Huttula, pers. comm.)). Dissolved oxygen (DO) was measured with a dissolved oxygen meter,model 50B of Yellow Springs Instrument Co., equipped with a YSI5739 probe and a YSI 5795A submersible stirrer. The cableallowed in situ measurements down to 80 m. At lower depths theprobe was carefully introduced into a 7.4 sampling bottle aftereach vertical haul. Calibrations were made in the air andcorrected for altitude before each sampling period. Precision

GCP/RAF/271/FIN-TD/46 (En) 4
was + 0.01 mg/l DO. pH readings were taken with a portable HachpH meter, model 43800-00. Precision was + 0.01. For conductivity(µS/cm), a Hach conductivity meter, model 44600 was used. Theinstrument automatically compensates for temperature deviationfrom 25 °C. Turbidity measurements (NTU) were made with a Hachturbidimeter model 2100A. Precision was + 0.01 NTU. All theabove instruments were regularly calibrated at each station. The following parameters were measured by spectrophotometryusing a Hach DR/2000 machine: ammonia, nitrates, nitrites, totalphosphorus and phosphates. The methods are summarised in Table2. Total phosphorus readings were not always reliable as valueswere sometimes less than phosphates. Obvious, inconsistentresults were discarded. Analysis was later improved by using aCOD reactor (made by Hach Co.). However results for phosphoruswere considered preliminary, needing confirmation with improvedmethods. Orthophosphates (PO4
3-) were measured during the firstyear on non-filtered water due to the lack of filteringequipment. They corresponded to total reactive phosphorus (TRP). Soluble reactive phosphorus (SRP) and total dissolved phosphorus(TDP) were measured during the second year and are presentedelsewhere.

GCP/RAF/271/FIN-TD/46 (En) 5
Location Samplingsites
Latitude Longitude
Bujumbura/Uvira
AB/C
3°28.00’S3°45.00’S
29017.00’E29°15.00’E
Kigoma AB/C
4°51.26’S4°50.69’S
29°35.54’E29°34.65’E
Mpulungu AB/C
8°43.98’S8°34.45’S
31°02.43’E30°50.10’E
Table 1 Coordinates of sampling sites recorded by GPS.
Parameters Methods Precision and unitsAmmonia Nessler (*) ± 0.01 mg/l (NH3-N)Nitrates Cadmium reduction ± 0.01 mg/l (N03-N)Nitrites Diazotization (*) ± 0.001 mg/l (N02-N)Total phosphorus Acid persuiphate (*) ± 0.01 mg/l (P04---)Orthophosphates Ascorbic Acid (*) ± 0.01 mg/l (P04---)
Table 2 Parameters measured by spectrophotometry methods(Hach Drei 2000) with corresponding precision and units.(*) USEPA approved (United States Environmental ProtectionAgency).

GCP/RAF/271/FIN-TD/46 (En) 6
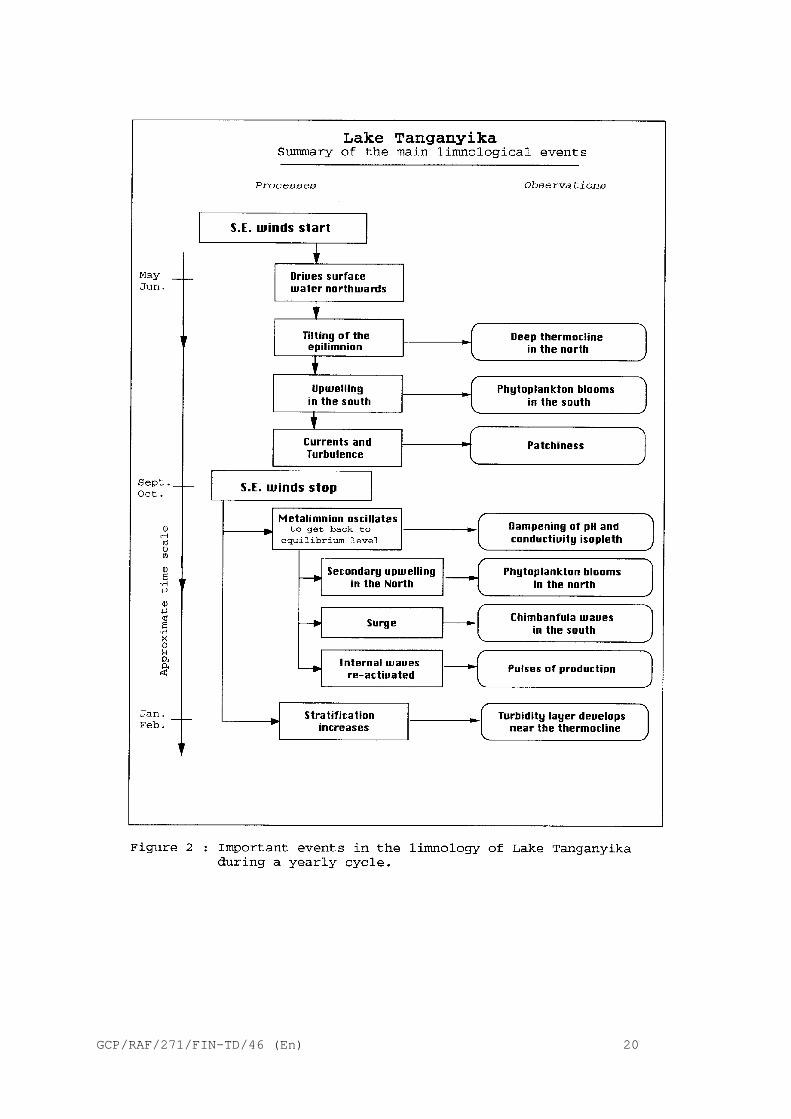
4. RESULTS 4.1 The yearly limnological cycle
The best place to start to describe the limnological cycle ofLake Tanganyika is with the wind. The wind regulates the energyinput into the lake through physical processes and causes mixing. The steps, which are developed below are summarised in Figure 2. In May-June, south east winds drive warm epilimnion watertowards the north of the lake. This results in a tilting of theepilimnion (Fig. 3.). The volume of warm water accumulated inthe north depends on the strength of the wind. Thermocline depthis a good indicator of the volume of warm water amassed at thenorth of the lake. Thermocline depth at Bujumbura was 70 to 75 min July 1993. In the south, near Mpulungu, the epilimnion wasvirtually absent at this time. The warm water accumulation in the north is mainly a surfaceprocess. Water flows south as deep currents and causes upwellingalong the southern coast. Upwelling was inferred from themeasurement of colder and nutrient rich water that averaged 24.4(C at the surface during the dry season (compared to 27.2 (Cduring the wet season) at Mpulungu. Surface water was also cooledby wind and lower air temperature in the dry season (Fig.A.1.1).Both processes (cooling from the deep, return currents and fromlake-atmosphere interactions) resulted in very weakstratification. The stratification index (as defined in appendixA.5.) highlighted the differences between north and south in thedry season (Fig. 4). During upwelling, mixing of water nearMpulungu increased and higher concentrations of N and P (normallyabundant below the thermocline) were measured in the epilimnion(Appendices A.14. and A.15.). Average water transparencydecreased to between 8 and 10 m (compared to 12 to 18 m duringthe wet season). Higher phytoplankton biomass resulting fromupwelling in the south was observed by Beauchamp (1939) andCoulter (1968). In 1993-94, mixing during upwelling was observedto be particularly conspicuous when deep internal waves (seebelow) showed an 'apex'. Figure 5 shows that two deep internalwaves (detected at 250-300 m) are in phase with the lifting ofthe 23.75 to 24.00 (C isopleth that reached an 'apex' on 30/07/93and 26/08/93. On a daily cycle, mixing increased particularly inthe early morning when high winds and low air temperaturecoincided (Appendix A.6). During the dry season, turbulence was extensive and vorticesand exchange of water from both sides of the thermocline weredetected to at least 200 m (Plisnier, in prep.). Coulter (1968)suggested that the amplitude of internal waves in the upper 150 mimplied that turbulent mixing, due to internal waves, extendedwell below 150 m.
The south-east winds ceased at the end of the dry season, andthe metalimnion "fell back" towards a horizontal plane but

GCP/RAF/271/FIN-TD/46 (En) 7
continued to oscillate over several months. This period wascharacterised by agitated water movements. The oscillations ofthe metalimnion and thermocline depth are illustrated in figureA.7.3. The changes in pH and conductivity provided an excellentway to examine the movements of the metalimnion (Fig. 6). Yearlyvariations in the pH at 40 m ranged between 8.47 and 9.40 atBujumbura/Uvira and 8.66 to 9.12 at Mpulungu. Deep watercharacterised by lower pH (relative to the surface) affected thepH in surface waters at the end of the dry season. The nutrientrich deep water probably strongly influenced primary productionwhen it was brought near the surface. Consumption of HCO3- duringphotosynthesis results in higher pH values. This could explainthe fluctuations of pH measured in the lake. During the wetseason, pH changes were reduced to reach more stable values inFebruary at each station (Appendix A.12). Ammonia and nitritealso fluctuated less at Bujumbura/Uvira. Secondary upwelling at the north of the lake was noted inOctober 1993 and was also probably linked with oscillations ofthe metalimnion. For example, deep conductivity isopleths rosetowards the surface (Figure A.11.1.). Transparency nearBujumbura/Uvira was particularly low in October (8.4 m) andNovember 1993 (7.1 m). It is suggested that this event may beproportional to the intensity of the main upwelling in the southsince both phenomena are related to wind intensity. However thesecondary upwelling was weaker when compared to the southernupwelling as thermal stratification remained in the north. Phytoplankton blooms had previously been detected at this time ofthe year in the north (Symoens, 1955a,1955b; Dubois, 1958) whichsuggests the yearly occurrence of the secondary upwelling. Strong waves were observed near the shores of Mpulungu andcould have corresponded to a surge at the beginning of themetalimnion oscillations in September-October. These waves areobserved every year at the end of the dry season. They arelocally called "Chimbanfula". This means "digging for the rains"locally because they occur at the beginning of the wet season.Some fishermen report that "Chimbanfula" waves can be associatedwith fish kills and plankton blooms. In September 1993, a fishkill of Boulengerochromis microlepis was observed. Corpses wereseen floating in many areas near Mpulungu. "Chimbanfula" wavesmay be related to travelling waves and oscillations of themetalimnion. This supports Coulter's (1991) suggestion thatoscillations are accompanied by water movements that take theform of a large amplitude, progressive wave which graduallytransforms into a standing wave. He suggested that such a surgecould cause a "local severe mixing". Internal waves during the whole year, at all the stations ofLTR, were inferred from fluctuations of temperature (Fig. 5), pH,conductivity, turbidity, total phosphorus, phosphates, ammonia,nitrates and nitrites. Previously, internal waves had been notedfrom temperature and oxygen isopleths (Dubois, 1958; Coulter,1968). In the present study, an average of 11 waves for all theparameters at each station were identified. They corresponded toa period of 33 days. Some parameters such as nitrates in thenorth and phosphates in the south had up to 13 peaks during theyear (average period was 28 days). It is possible that some peaks

GCP/RAF/271/FIN-TD/46 (En) 8
were missed because of the relatively low frequency of sampling(2 to 3 samples of type A per month). There seemed to be noperiod when waves were absent for any of the parameters at anystation. Even during the upwelling in the south, internal waveswere detected in deep water (cf. temperature at 200 and 300 m)which supports the theories of Coulter (1991). Pulses generated by internal waves were reflected in nutrientwaves in the water column. The long period waves showed avertical displacement of nutrient concentrations of c. 20 m inthe water column. Regular pulses of phytoplankton productionprobably followed the rhythmic movements of internal wavesbecause deep eutrophic water was able to reach the biotic andphotic zones which usually showed oligotrophic characteristics.The "nutrient waves" should also have influenced organisms thatwere adapted to take advantage of favourable but episodicconditions. As the lake became more stable, particularly, from Februaryto May, turbidity increased near the thermocline atBujumbura/Uvira. A deep-living community of organisms linked tonutrients and reduced matter brought up by the internal waves mayhave developed particularly when the lake was calm near thethermocline. In Lake Kivu, the stable chemocline at 60 m alloweda layer of chemosynthetic bacteria to form there (Haberyan andHecky, 1988). This bacterial 'plate' was nourished by theabundant methane and other organic compounds moving up from deepwaters. A bacterial 'plate' may also exist in Lake Tanganyika,particularly when the lake is calm.
4.2 Limnological parameters
4.2.1 Temperature and stratification
Thermal stratification was observed at each station duringthe whole year except in the south in the dry season (upwelling).The epilimnion generally extended from the surface to depthsbetween 20 and 105 m. The upper metalimnion including thethermocline extended generally from 50 to 120 m. The thermoclinewas occasionally detected in the upper 20 m. The lowermetalimnion reached at least a depth of 300 m. Hypolimnion water(<23.5(C) was measured at c. 300 m except during upwelling in thesouth. Internal waves, indicated by temperature fluctuations werenoted at all depths including below the thermocline down to 300 mall the year. They were not clear from 0 to 30 m due to mixing ofthe epilimnion. 4.2.2 Transparency
Transparency fluctuated between 5.0 and 23.5 m at site A. The northern station at Bujumbura/Uvira had the lowesttransparency (mean = 9.1 m). Higher mean values were recorded at

GCP/RAF/271/FIN-TD/46 (En) 9
Kigoma (13.8 m) and Mpulungu (12.4 m.) (Table A.2.1). Transparency varied considerably on a daily basis. Variations intransparency (up to 5 m) were noted in a few hours in the southon 17/9/94, 18/11/94 and 16/12/94. Turbulent mixing may have beenresponsible for a high level of heterogeneity in nutrients,plankton and transparency. Water temperature and transparencyshowed a positive correlation particularly in Kigoma (r2 = 0.56)and Mpulungu (r2 = 0.53). 4.2.3 Turbidity
Average turbidity at Bujumbura/Uvira was highest (0.40 NTU)compared to Mpulungu (0.35 NTU) and Kigoma (0.25 NTU). Turbiditydecreased with depth at each station. The lake was usually moretransparent in deep waters than on the surface. This was probablydue to a higher abundance of living organisms in the epilimnion.However, in some months turbidity increased in deeper watersuggesting deeper pulses of production (Plisnier et al., inprep.). During the dry season, turbidity was significantly higher atthe north and the south ends of the lake compared to Kigoma.During the wet season, a turbidity layer developed near thethermocline at Bujumbura/Uvira and was probably caused bycommunities of deep-living organisms (Figure A.9.3). 4.2.4 Dissolved oxygen
Surface waters were often saturated or supersaturated indissolved oxygen. Dissolved oxygen was present down to c. 80 m atBujumbura/Uvira and c. 200 m at Mpulungu. Results were limitedfor the first year (Appendix A.10). Some measurements ofdissolved oxygen concentrations down to 300 m were made at eachstation and appeared to be related to turbulent processes. 4.2.5 Conductivity
Conductivity was generally between 660 (S/cm near the surfaceand 700 (S/cm at 300 m (Figure A.3.1. and appendix A.11.). Conductivity at Kigoma was often slightly lower than at both endsof the lake. Greatest variability of conductivity was measured atBujumbura/Uvira in the upper layer (values between 520 and 728(S/cm have been recorded). The changes of conductivity wererelevant as they could be used as indicators of metalimnionmovements (cf. 4.1.). 4.2.6 pH
pH often ranged between 9.0 at the surface and 8.7 at 300 m(Figure A.3.1. and appendix A.12.). Variations of pH during the

GCP/RAF/271/FIN-TD/46 (En) 10
year were highest at Bujumbura/Uvira. At both ends of the lake,pH oscillations lessened over the year. Both pH andconductivity seemed to be excellent "tracers" of vertical watermovements. pH did not change as rapidly as other parametersprobably due to the high buffering capacity of Lake Tanganyika. 4.2.7 Phosphorus
Concentrations of phosphorus in surface waters were c. 0.05mg/ l (TRP in mg/l PO43-). A clear increase with depth wasobserved with concentrations of x5 to x10 at 100 m depth (TableA.14.1) compared to the surface. During the upwelling period inthe south, the concentrations of total phosphorus doubled in theepilimnion (mean of 0.32 mg/l as PO43- in the upper 0-100 watercolumn compared to 0.12 mg/l during the wet season). Pulses ofhigh phosphate concentrations caused by internal waves raisingthe rich deeper layers, were observed especially atBujumbura/Uvira and Kigoma. 4.2.8 Nitrogen
Nitrates had a maximum in concentration of c. 0.10 mg/l NO3-Nat 60-80 m in the north and 100-140 m in the south (AppendixA.15). The nitrate rich layer was related to the thermocline andoxycline depths at each station. The layer was particularly welldefined when the lake became calm after January-February 1994. Below the nitrate layer a nitrite layer was sometimes detectedsuch as at 80 m at Bujumbura/Uvira (0.005 mg/l NO2-N). At this station, higher values of nitrites were also observed in theupper 100 m during the mixing period in October and November. This was probably linked with the well defined thermocline nearBujumbura/Uvira and a strong vertical gradient of dissolvedoxygen affecting nitrification and denitrification processes. Below the oxycline, high concentrations of ammonia were measured.At Bujumbura/Uvira mean concentrations of ammonia were 0.05 mg/lNH4-N at the surface water and >0.40 mg/l NH4-N at 300 m. Mixingmay have brought significant concentrations to the surface (>0.20mg/l NH4-N). High ammonia concentrations were recorded more oftenat Bujumbura/Uvira, probably because of the shallow thermoclinedepth there. Ammonia was often low or not detected in Mpulunguprobably because of deeper oxygenation processes in the south. 5. DISCUSSION Mixing of nutrients Lake Tanganyika is not oligotrophic as deep waters containextremely large quantities of nutrients (P, N, Si). However, itmay not be called eutrophic either as surface water are oftenpoor in nutrients. Van Meel (1987) suggested that the lake waspseudoeutrophic as it possessed both oligotrophic and eutrophic

GCP/RAF/271/FIN-TD/46 (En) 11
characteristics. The uneven distribution of nutrients is largelythe consequence of the existence of thermal stratification in thelake. The thermocline is the main barrier between very differentwater layers. Fluctuations in the extent stratification determinethe degree of nutrient influx into the photic zone. Two mainfeatures of stratification are the depth of the thermocline andits strength. The former is highly dependent on the heat budgetand on the winds: (1) An increased input of heat results in a deepening of thethermocline and keeps the nutrient rich layers in deeper waters. (2) The wind from the south-east causes the accumulation ofwarmer epilimnion water and thereby deepens the thermocline inthe north, while in the south deep, rich waters upwell. When theforce of the wind weakens or ceases after the dry season,oscillations of the metalimnion form internal waves. The waves,mainly detected below the thermocline, may themselves influencethermocline depth. The rhythmic movements of internal waves induce a regular pulse of production when deep eutrophic water isable to reach the biotic and photic zones where photosynthesiscan increase. The "nutrient waves" should influence organismsadapted to capitalize on these favourable but episodic events. Thermocline strength (= stratification level) relies on waterdensity changes which are mainly dependant on temperature and thesalinity gradients in the water column. The level ofstratification determines the extent of turbulent mixing, forexample a weakly stratified thermocline would allow more"permeability" between different layers. It would appear that the productivity of the lake is highlydependant on the hydrodynamic state of the lake and on climaticconditions, particularly the wind and the heat budget. Computation of the dynamics of the thermal regime of such a largelake depends on accurate estimations of wind induced shearstresses over the lake and on correct identification of verticalturbulent diffusion which control the processes of verticalmixing (Huttula and Podsetchine, 1994).
Upwelling and secondary upwelling
When the winds are strong, the tilting of the epilimnion andthe upwelling in the south will be important. After the cessationof the wind, upward movement in the north should be similar andas important to the upwelling in the south during the dry season.Indeed, significant fluctuations of some parameters (e.g.conductivity) suggest the existence of a secondary upwelling inOctober-November in the north of the lake. Historical data haveshown that phytoplankton blooms occurred in the north at thistime of year (Symoens, 1955a,1955b; Dubois, 1958; Hecky andKling, 1981). This northern bloom often coincided with the onsetof the rain that was held mainly responsible for a highernutrient input. However, while the rains probably play some rolein phytoplankton blooms, it has been suggested above that the

GCP/RAF/271/FIN-TD/46 (En) 12
secondary upwelling with upward movement of deep waters in thenorth at that time should be held mainly responsible for bringingnutrients towards the surface. This would explain the typicaldelay between high algae production in the south followed a fewmonths later by increased productivity in the north. It issuggested that the upwelling detected in the north of Lake Malawiin October 1993, from satellite images of the lake surfacetemperature (Wooster et al., 1993) may be similar to secondaryupwelling in Lake Tanganyika. Pulses and patchiness in water composition The lake is certainly not homogeneous and stable during anannual cycle. Patchiness has been observed in several studies onautotrophic (algae blooms) as well as heterotrophic organisms(zooplankton) (Vuorinen and Kurki, 1994; Bosma, pers. com.). Thepatchy distribution of Stolothrissa tanganicae has been reportedby Collart (de Bont, 1972). Patchiness could possibly be divided into: (1) "non random patchiness". Changes in limnologicalparameters measured by LTR in 1993-94 showed some rhythmicchanges induced by internal waves with a defined period(apparently 28 to 33 days). A pulse production might result fromthis. Hecky and Fee (1981) found that Lake Tanganyikaphytoplankton had the highest growth rate of those examined intropical lakes. It is possible that fast growing algalpopulations, adapted to fluctuating environmental conditions, areable to capitalize upon these "nutrient waves". (2) "random patchiness" due to turbulence and currents. Anextensive patchiness in the chemical characteristics of LakeTanganyika was observed, particularly during short termexperiments such as 24 h cycles (Plisnier, in prep.). Veryvariable transparency on a short time scale (hours) might resultfrom patchiness in nutrients. It could also be affected by solarradiation and photo-inhibition or movements of water. De Bont (1972) had suggested that patchiness in fish distribution could be the result of patchiness in the environmentof the lake. He suggested that the main factor responsible forfish patchiness was the internal waves (that are here classifiedas "non-random patchiness"). However, "random patchiness" iscertainly also involved in the distribution of fish.Investigations in patchiness in physical limnology (temperature,mixing index, etc.) and in nutrients might quantify links withzooplankton and fish distribution. Important informationincludes the size of patches and temporal changes. Only a multi-disciplinary lake wide investigation using R.V. TanganyikaExplorer could do this. It should be realised that relationshipsbetween different levels of the food web will only be possiblewith simultaneous sampling because of the dynamic nature of LakeTanganyika. It is highly advisable to measure some mainlimnological parameters during fish cruises.

GCP/RAF/271/FIN-TD/46 (En) 13
6. CONCLUSIONS This first year of data shows that productivity of LakeTanganyika like the sea and probably like other large deeptropical lakes, depends to a large extent on the regeneration ofnutrients from the water column . Nutrient rich waters were observed below the thermocline.Their access to the upper photic layers is highly dependant ofhydrodynamic events driven by climatic conditions.` A limnological cycle could be summarised in the followingsequence of events: - SE winds drive surface water northwards - This tilts the metalimnion - Upwelling occurs during the windy dry season in the south - SE winds stop and metalimnion oscillates - Surge flows back and forth along the lake - Secondary upwelling raises deep waters in the north - Internal waves are re-activated by the surge - Metalimnion oscillations dampen Internal waves have been observed for all the parametersstudied at all three stations around the lake throughout the yearfrom August 1993 to July 1994. They are a very important aspectof the lake's limnology and could play a considerable role in the"non-random patchiness" and the production pattern of theecosystem. A regular pulse of production is likely to follow therhythmic movements of internal waves bringing deep eutrophicwater toward the photic zone. These "nutrient waves" could alsohave acted as a major environmental factor in the selection oforganisms (in the pelagic particularly) by favouring theoccurrence of fast growing organisms adapted to highly variablefluctuating conditions. "Non-random patchiness" could be linked on a large scale withinternal waves, upwelling and main currents while on a shortertime and geographical scale, "random patchiness" probablyresulted from turbulence. Vortices have been often observed inthe water column at each station. Elucidation of patchiness in limnological parameters is vitalto the understanding of patchiness in higher trophic levels suchas zooplankton and fish. Simultaneous sampling through multi-disciplinary lake wide cruises is a pre-requisite. Parts of"non-random" patchiness (internal waves) may however be beststudied through very frequent sampling at a few fixed stations.

GCP/RAF/271/FIN-TD/46 (En) 14
ACKNOWLEDGEMENTS
Several people have participated with enthusiasm in theprogramme during sampling and analysis. We sincerely thank themfor their involvement in the researches.
At each station, limnology teams have been involved inregular sampling, sometimes in very rough weather conditionsduring the day and night. They have also performed a great numberof analyses in the laboratories of the project. At Bujumbura we thank particularly P. Kotilainen., J.M.Tumba, E. Gahungu, P. Paffen, E. Nikomeze, B. Ndimunzigo, S.Nyamushahu and S. Kimbadi. The LTR station was supervised by DrG. Hanek. Other persons have also contributed to the sampling programmeat Bujumbura and we thank R. Varyianis, I. Rugoreka and P.Sinanka. At Kigoma, sincere thanks are given to E.W. Lyoba, D. Lyoba,N. Challe, H. Kurki, M. Chatta, S. Muhoza, A. Kalangali, E.Kadula, O. Kashushu, W. Kisisiwe and M. Agustino. The LTR stationwas supervised by P. Mannini. Special thanks in Mpulungu are addressed to E. Bosma, C.Lukwessa, R. Shapola, L. Makasa, I. Zulu, E. Chipulu, S. Sichivu,K. Kaoma, P. Verburg , J. Chimanga, B. Kassikila and C. Sichamba. Data from automatic stations have been made available thanksto T. Huttula and his team, particularly P. Verburg in Mpulunguand P. Kotilainen in Bujumbura. Very valuable help has been provided by the Belgium-CPGLproject of Hydrobiology in Bujumbura. We particularly thank DrsA. Vandelannoote, L. De Vos and L. Risch for their muchappreciated collaboration. Sodium and potassium have been analysed at the "CentreNational de Technologie Alimentaire of Bujumbura" with theassistance of A. Bikorimana. We sincerely thank Dr. J. Kapetsky Scientific Coordinator(FAO), Mrs D. Blessich and Mr. M. Doeff, Project OperationOfficers (FAO) for their most valuable assistance and Dr A.Bakun, Mrs J. Collins, Mr A. Gribling as well as others officerof FAO involved with LTR for their support. Acknowledgement is made to Professor O. Lindqvist, ScientificCoordinator and Professor H. Molsä, Kuopio University, Finland,for their support in scientific matters and bibliographicmaterial.
Professors J.-C. Descy and J.-C Micha of the Facultés Notre-Dame de la Paix in Namur, Belgium have provided valuable help and

GCP/RAF/271/FIN-TD/46 (En) 15
advice which are sincerely acknowledged here. We thank also the Project Coordinator Dr G. Hanek for supportin implementing the limnological component and Dr J.F. Craig,Senior Scientific Field Coordinator for advice and guidance. Wevery much appreciated the help of Drs J.F. Craig and K. Banisterin editing this manuscript. Numerous others have supported this research and helped inmany ways. Although they are not named, they are sincerelythanked here.

GCP/RAF/271/FIN-TD/46 (En) 16
REFERENCES
Beadle L.C., 1974. The inland waters of tropical Africa. An
introduction to tropical limnology. Longman London: 475p.
Beauchamp R.S.A., 1939. Hydrology of Lake Tanganyika.Internationale Revue der gesamten Hydrobiologie undHydrographie 39(3 4): 316 353.
Beauchamp R.S.A., 1964. The Rift Valley Lakes of Africa.Verhandlungen der Internationalen Vereinigung furtheoretische und angewandte Limnologie 15: 91-99.
Capart A., 1952. Le milieu géographique et géophysique. Résultatsscientifiques de l' exploration hydrobiologique du LacTanganika (1946-1947). Institut Royal des SciencesNaturelles de Belgique 1: 3-27.
Coulter G. W., 1968. Hydrological processes and primaryproduction in Lake Tanganyika. Proceedings 11thConference Great Lakes Research InternationalAssociation of Great Lakes Research: 609 626.
Coulter G.W., 1991. Lake Tanganyika and its life. Coulter ed.Oxford University Press. London Oxford & New York: 354p.
Craig H., F. Dixon, V. Craig, J. Edmond and G. Coulter, 1974.Lake Tanganyika geochemical and hydrographic study:1973 expedition. Publication Scripps Institution ofOceanography Series 75(5):1-83.
Dagnelie P. 1975. Théorie et méthodes statistiques. PressesAgronomiques de Gembloux, Vol.2: 463 p
De Bont A. F., 1972. La productivité du Lac Tanganika.Verhandlungen der Internationalen Vereinigung furtheoretische und angewandte Limnologie. Stuttgart 18:656-660.
Degens E. T. Von Herzen R. P. and Wong H-K., 1971. LakeTanganyika. Water chemistry sediments geologicalstructure. Naturwissenschaften New York 58(5): 229-241.
Ferro W. and G.W. Coulter, 1974. Limnological data from the northof Lake Tanganyika. United Nations Food and AgricultureOrganisation Report FI:DP BD1/73/020/10: 1-19.
Ferro W., 1975. Observations limnologiques dans le nord du LacTanganika (1972-1975). United Nations Food andAgriculture Organisation. Report FI:DP/BD1/73/020/: 1-29.

GCP/RAF/271/FIN-TD/46 (En) 17
Haberyan, K. A. and R. E. Hecky, 1987. The late Pleistocene and Holocene stratigraphy and paleolimnology of Lakes Kivuand Tanganyika. Palaeo-3, 61:169-197.
Hecky R.E., E.J. Fee, H.J. Kling and J.W. Rudd, 1978. Studies onthe planktonic ecology of Lake Tanganyika. CanadianDepartment of Fish and Environment. Fisheries andMarine Service Technical Report 816: 1-51.
Hecky, R.E. and E.J. Fee, 1981. Primary production and rates ofalgal growth in Lake Tanganyika. Limnol. Ocean. 26:532-547.
Hecky R.E. and H.J. Kling, 1981. The phytoplankton andprotozooplankton of the euphotic zone of LakeTanganyika: Species composition biomass chlorophyllcontent and spatio-temporal distribution. Limnology andOceanography 26(3): 548-564.
Hecky R.E., E.J. Fee, H.J. Kling and J.W. Rudd, 1981.Relationship between primary production and fishproduction in Lake Tanganyika. Transactions of theAmerican Fisheries Society 110: 336-345.
Hutchinson G.E. 1957. A treatise on limnology. vol 1 : 1015 p.
Huttula T. and P. Kotilainen, 1994. Wind effect over the lakevaries significantly. LTR Newsletter n(11, 12-13
Huttula T. and V. Podsetchine, 1994. Hydrological modeling onlake Tanganyika. FAO/FINNIDA Research for theManagement of the Fisheries on Lake Tanganyika.GCP/RAF/271/FIN-TD/20 (En): 19 p.
Plisnier, P.-D., 1993. Field Manual for Limnological Sampling onLake Tanganyika FAO/FINNIDA Research for theManagement of the Fisheries on Lake Tanganyika.GCP/RAF/271/FIN-FM/07 (En): 28 p
Rast W., M. Holland and S.O. Ryding, 1989. EutrophicationManagement framework for the policy-maker. MAB Digest,UNESCO: 83 p.
Sokal R.R. & F.J. ROHLF, 1995 Biometry W.H. Freeman & Cie: 887 p.
Symoens J. J., 1955a. Observation d'une fleur d'eau àCyanophycees au Lac Tanganika. Folia scientificaAfricae centralis 1 (3): 17.
Symoens J. J., 1955b. Sur le maximum planctonique observé en finde saison sèche dans le bassin nord du Lac Tanganika.Folia scientifica Africae centralis 1(4):12.
Tuckey I.W., 1977. Exploratory data analysis. Addison WesleyPubl. Co., Massachusetts: 688 p.

GCP/RAF/271/FIN-TD/46 (En) 18
Van Meel L.I.J., 1987. Contribution a la limnologie de quatregrands lacs du Zaïre oriental: Tanganyika, Kivu, MobutuSese Seko (ex Albert), Idi Amin Dada (ex Edouard). Lesparamètres chimiques. Fascicule A: Le lac Tanganyika. Institut Royal des Sciences Naturelles de Belgique,Document de travail 41: 118 p
Vuorinen I. and H. Kurki, 1994. Résultats Préliminaires sur l'Echantillonnage du Zooplancton au lac Tanganyika.FAO/FINNIDA Recherches pour l' Aménagement des Pêchesau lac Tanganyika. GCP/RAF/271/FIN-TD/22(Fr): 43 p.
Wooster M.J., C.B. Cear, V.R. Copley and G. Patterson, 1993.Monitoring Lake Malawi Using Real Time Remote Sensing.Final Report of the Remote Sensing Component of theUK/SADC Pelagic Fish Resource Assessment Project.Volume 2: Image Archive. NRI-SADC: 124 p.

GCP/RAF/271/FIN-TD/46 (En) 19
GCP/RAF/271/FIN-TD/46 (En) 20

GCP/RAF/271/FIN-TD/46 (En) 21

GCP/RAF/271/FIN-TD/46 (En) 22

GCP/RAF/271/FIN-TD/46 (En) 23

GCP/RAF/271/FIN-TD/46 (En) 24
APPENDIX A
A.1 Meteorology Weather is a major factor influencing changes in lakeecosystems. Data for precipitation, temperature and wind speedfrom each station are presented here for the period studied. A.1.1 Precipitation Precipitation was extremely low at Bujumbura between August1993 and July 1994 (Fig. A.1.1) compared to previous years. Only427 mm were recorded at the LTR automatic station while theyearly 'mean' total precipitation for 30 years was 855 mm atBujumbura Airport. Uvira, c. 25 km from Bujumbura, recorded 697mm of precipitation in 1993-1994 (CRSN, personal communication) avalue lower but still comparable to the yearly mean recordedthere (810 mm) for a period of 10 years. For the same period,precipitation at Kigoma was below the 10 yr mean, 821 compared to961 mm. At Mpulungu the precipitation, 1176 mm, was also belowthe mean (20 yr data) of 1248 mm. Mean monthly values for precipitation from 17 stations aroundthe lake are presented in Figure A.1.2. Latitude and altitudewere two important factors influencing precipitation. At lowlatitude (towards Mpulungu) there was generally one main wetseason with a high level of precipitation during a few welldefined months, particularly December to March. At latitudescloser to the equator (towards Bujumbura) precipitation was'spread out' during two seasons whose peaks were generally inMarch to April and November to December. This rhythm was linkedwith the passage of the ITCZ (inter tropical convergence zone)and general atmospheric circulation. There was considerable precipitation during a short period atMpulungu. Total precipitation of 300 mm per month was commoncompared to the mean monthly maximum for Bujumbura of 120 mm. The heavy precipitation may have washed nutrients into the lakeat Mpulungu at a greater rate than in the north. Altitude also directly influenced the amount ofprecipitation probably as a result of convection flow andcondensation of clouds near the escarpments. Stations at 'loweraltitudes' experienced less precipitation.

GCP/RAF/271/FIN-TD/46 (En) 25
A.1.2. Air temperature Air temperature data presented in Figure A.1.1 showedvariation but absolute values should not be strictly comparedbetween stations. The main reason is that the data originate fromsites situated at different distances from the lake at eachstation. At Bujumbura, the site was on the shore, at Kigoma thesite was 5 km inshore and at Mpulungu the site was an anchoredbuoy (c. 30 km) with an automatic recording station in thepelagic zone. The location of the recording sites is likely tocause bias when comparing air temperatures. An automatic stationwas installed in June 1995 on the shore at Mpulungu and thusbetter comparisons will soon be possible between the two ends ofthe lake. Two peaks of air temperature were observed during theyear (Fig. A.1.1), one in October and the other in April-May. AtMpulungu the first peak was longer and lasted until November-December. The minimum values were observed in June-July at eachstation. There was also a well defined low value in December atBujumbura and Kigoma while this second low was observed later, inFebruary, at Mpulungu. The variation in air temperature thusshowed a similar pattern at each station, two peaks and twominima with, however, longer lasting or delayed peaks inMpulungu. The daily cycles of air temperature (recorded every hour atthe anchored automatic station 30 km north of Mpulungu) wereaveraged for each month (Fig. A.1.3) It can be observed that airtemperature reached a maximum between 1400 and 1600 h dependingon the month. In September and October 1993, a second peak wasrecorded during the night (2300 to 0100 h) which appeared to belinked with a warm wind. The minimum temperature was reachedbetween 0400 and 0700 h depending on the month. At Mpulungu the highest mean, hourly air temperature, 27.5 (C,was recorded in October 1993 at 1200 h while the lowest hourlymean of air temperature, 22.4 (C, was recorded at 0700 h in June1994. In June 1994 at 0500 h, two hours before the lowtemperature was recorded, the highest hourly mean wind speed (8.5m/s) was recorded. The morning hours of June were thuscharacterised by two favourable conditions for mixing of thewater column by convection, high wind speed and low airtemperature (with probably a low heat budget).

GCP/RAF/271/FIN-TD/46 (En) 26
A.1.3. Wind speed Only three types of wind are considered here, the on- andoff-shore winds, the south-east trade wind during the dry seasonand the stormy winds of the wet season. The on- and off-shorewinds are thermal in origin, caused by the temperaturedifferences between the land and water. Beauchamp (1939) showeda clear relationship between the speed of the off-shore winds andthe maximum and minimum temperatures of the preceding day and night. This type of wind was noted all year round (example forMpulungu is shown in Fig. A.1.3) and was particularly importantduring the dry season. Radiation differences between day andnight were then important and thermal difference between lake andland were much higher. The south east trade wind was observedduring the dry season. Near Mpulungu, during the night, itseffect was cumulative with the off-shore winds. This 'combined'wind is locally named "Kapata". It can start very suddenly inthe evening or during the night but is sometimes interrupted. There can be pulses of several days of wind separated by quieterperiods. It can reach an hourly mean speed of 8 m/s as recordedin July 1994 (Fig. A.1.3). Figure A.1.3 shows that the windspeed reached a maximum in the early morning (0400 to 0800 h) atMpulungu during the dry season. The on-shore wind, mainly fromthe north, was observed during almost the whole year,particularly in September and October, between 1400 and 1600 h. This wind seemed much less important than the Kapata wind as itoccurred when the water showed a daily stratification of theupper layers (Figures B.1 to B.11). The stirring effect of theon-shore wind on the water is probably less important. It wasreported by fishermen to have little influence on fishing. June1994 was the only month with virtually no on-shore wind. Thisfollowed strong night time winds from the south (Kapata). Stormwinds during the dry season were generally from the north. The wind speeds were difficult to compare between stationsbecause recordings were made at different distances from thelake. In Figure A.1.1, the wind speed values are given forBujumbura and at two sites off Mpulungu, an automatic station ona buoy c. 30 km north of Mpulungu and on the shore, in front ofthe Department of Fisheries, Mpulungu. At Mpulungu the wind wasstronger on the lake compared to the shore as the latter wassheltered from the north and south by hills. The winds from bothsites were stronger than at Bujumbura. The correlation betweenthe shore wind station and the pelagic wind station of Mpulunguwas highly significant (P<0.001). The increased wind speedrecorded in the pelagic area was between 0.36 and 1.45 m/s higherthan the wind recorded on shore (data obtained over 10 months). The wind speed on the shore and in the pelagic area of Mpulunguwas respectively 36 % and 70 % higher than the wind speedrecorded at Bujumbura port. The highest wind speeds were notedparticularly during the dry season (April to September) whenthere were 'Kapata' winds. The months with the lowest mean windspeeds were December in Bujumbura and January in Mpulungu. Datafor Kigoma are not presented here but Huttula and Kotilainen(1994) noted that the wind was less variable than at the otherstations, 3.9 m/s in August 1993 and 3.4 m/s in March 1994.

GCP/RAF/271/FIN-TD/46 (En) 27

GCP/RAF/271/FIN-TD/46 (En) 28

GCP/RAF/271/FIN-TD/46 (En) 29

GCP/RAF/271/FIN-TD/46 (En) 30
A.2 Means, medians, maximum and minimum values of parameters. The values of each parameter measured at site A of eachstation are presented in Table A.2.1. In this table means werecalculated for the 0 to 100 m water column. More specific dataare given in the following sections. Yearly median values were as follows. For temperature atBujumbura/Uvira, 25.8 (C, was close to that at Kigoma, 25.7 (C,but higher than at Mpulungu, 24.5 (C. However variation washigher in Mpulungu. Transparency was lower at Bujumbura/Uvira,8.7 m, than at Kigoma or Mpulungu, 12.8 and 11.9 m respectively). pH was generally similar at each station, approximately 8.9. Higher variation was noted at Bujumbura/Uvira than at the otherstations. Conductivity was 659 at Bujumbura/Uvira, 654 at Kigomaand 662 (S/cm at Mpulungu. Conductivity was more variable atBujumbura/Uvira than in the other stations. Turbidity was verysimilar at Bujumbura/Uvira and Mpulungu, 0.32 and 0.33 NTUrespectively, but lower at Kigoma, 0.25 NTU. Total phosphoruswas 0.03 at Buj-Uvi, 0.39 at Kigoma and 0.08 (m/l at Mpulungu. Phosphates values measured from unfiltered water were 0.6 atBujumbura/Uvira, 0.9 at Kigoma and 0.4 (m/l at Mpulungu. Ammoniahad a median value of 0 at each station but could occasionallyreach 26 at Bujumbura/Uvira, 24 at Kigoma and 39 (m/l atMpulungu. Nitrates were 3.6 at Bujumbura/Uvira, 5.4 at Kigomaand 5.0 (m/l at Mpulungu. At Bujumbura/Uvira and Mpulungu,median values of nitrite were 0.1 and at Kigoma 0.2 (m/l. Median values are graphically compared in Figure A.2.1 usingthe "box and whiskers" representation (Tuckey, 1977).

GCP/RAF/271/FIN-TD/46 (En) 31

GCP/RAF/271/FIN-TD/46 (En) 32

GCP/RAF/271/FIN-TD/46 (En) 33
A.3 Vertical profiles and identification of layers
The classical definition of the water layers that applies totemperate lakes does not seem to be appropriate for LakeTanganyika. Besides the epilimnion and hypolimnion, themetalimnion should probably be split into two layers. Craig etal. (1974) identified an "intermediate" layer between themetalimnion and the hypolimnion while other researchers havedescribed an "upper hypolimnion". In the present study, the lakewas divided into four layers based on limnological parameters.Depths of the four layers varied during the year. The epilimniongenerally reached a depth of 20 to 105 m depending on thestation. The mean thermocline depth for the three stations atsite A was 53 m in 1993-1994 and fluctuated between 15 and 90 m.The upper metalimnion, including the thermocline was generallyobserved between 50 and 120 m. Temperature decreased rapidly inthe upper metalimnion. The lower metalimnion generally startedbetween 50 and 120 m and spread to at least 300 m. Temperaturedecreased slowly in this layer. The upper depth of thehypolimnion was variable. It seemed adequate to define it as thedepth where temperature was <23.5 °C since temperature variationbelow this level was slight.
As is seen in Figures A.3.1, A.3.2 and A.3.3, the lake watergenerally showed oligotrophic characteristics near the surfacebut had high concentrations of nutrients in deep water.

GCP/RAF/271/FIN-TD/46 (En) 34
GCP/RAF/271/FIN-TD/46 (En) 35

GCP/RAF/271/FIN-TD/46 (En) 36

GCP/RAF/271/FIN-TD/46 (En) 37

GCP/RAF/271/FIN-TD/46 (En) 38
A.4 Temperature
At Bujumbura/Uvira site A the mean surface temperature was26.13 °C during the dry season and 26.45 °C during the wetseason (Table A.4.1). At Kigoma, similar but slightly highertemperatures were recorded, 26.18 °C during the dry season and26.77 °C during the wet season. At Mpulungu the surfacetemperature at site A was 24.39 °C and 27.17 °C respectively. Thelow dry season temperature in Mpulungu corresponded to theupwelling period. During the wet season, the mean temperaturewas higher than at the northern stations. It can be observed thatthe mean surface temperature differed between season at eachstation (0.39 °C at Bujumbura/Uvira, 0.59 °C at Kigoma and 2.78°C at Mpulungu). ANOVA indicated a highly significant (P <0.001)difference in temperature for station, season and depth as wellas for each interaction (Table A.4.2).
Median temperature values of the water column from 0 to 100 mare compared between each station in Figure A.2.1 and TableA.4.3. There were significant differences in temperature betweenMpulungu (with more extreme values) and the two northernstations. The results of comparisons between temperature meansusing the least significant difference method (LSD) (Sokal andRohlf, 1995) are shown in Table A.4.4. Between Bujumbura/Uviraand Kigoma there were no significant differences in temperatureduring the year but between these two stations and Mpulungu therewas a significant difference (p<0.001) during the dry season dueto upwelling of cold water at the latter.
Seasonal differences were noted with depth between stations.For example the mean temperatures at 60 and 80 m were higher atBujumbura/Uvira during the dry season, 25.8 and 25.2 °Crespectively, compared to the wet season, 24.9 and 24.4 °C (p<0.001). This was probably due to the deeper thermocline or mayalso have resulted from downwelling. At Mpulungu, the oppositeto Bujumbura/Uvira was observed as the temperature was lower from0 to 100 m during the dry season than during the wet season(Table A.4.1). This was statistically significant (p<0.001) from0 to 40 m (Table C.2). The lower temperature probably resultedfrom upwelling and an increase in mixing during the coolest andwindiest period of the year (June to September).
Monthly, median values of temperature, taken at each depthat each station illustrate the development of temperatureisopleths (Fig. A.4.1.). The different profiles, probably causedby regional differences in climate, between Mpulungu and thenorthern stations are evident (Fig. A.4.2) and confirmed by themedian test (Dagnelie, 1975): c2obs = 46.2 (p<0.001) betweenKigoma and Mpulungu and c2obs = 31.4 (p<0.001) betweenBujumbura/Uvira and Mpulungu. The profiles betweenBujumbura/Uvira and Kigoma were not statistically different (c2obs= 0.21).

GCP/RAF/271/FIN-TD/46 (En) 39

GCP/RAF/271/FIN-TD/46 (En) 40

GCP/RAF/271/FIN-TD/46 (En) 41

GCP/RAF/271/FIN-TD/46 (En) 42

GCP/RAF/271/FIN-TD/46 (En) 43

GCP/RAF/271/FIN-TD/46 (En) 44
A.5. Stratification
Lake stratification was quantified by a stratification index(SI):
SI = sDi * 10000
where: sDi is the standard deviation of the matrix of water densityD at each depth i.
For computation, water density at depth i (Di) was derivedfrom the following polynomial regression (r=1), calculated forthe temperature range 20.0 to 30.0 °C, using Hutchinson's (1957)tables:
Di = A + 3.977e-5 * Ti - 7.052e-6 * Ti^2 + 3.008e-8 * Ti^3
where:
Ti is the temperature (°C) at depth i A is a constant equal to 1.000017195
The effect of atmospheric and water column pressure on waterdensity was not accounted for as it was assumed that it would beequal at all stations (Beadle, 1974; Beauchamp, 1964).
When the temperature was quite homogenous in the watercolumn, the stratification index SI was small or = 0. This wasthe condition most favourable for vertical mixing. It wasobserved during upwelling periods. If the stratification waswell established there was a greater difference between thetemperature at the surface and at the bottom of the measureddepth causing density differences and increased SI values.Figure 4 and Table A.5.1 show that during the dry season thestratification was very low at Mpulungu (SI = 0.12 in August1993) while it rapidly increased in October and November 1993 andreached a maximum (3.6) in January 1994.
Bujumbura/Uvira, Kigoma and Mpulungu showed more establishedstratification only during the dry season (e.g. SI ranges between1.3 and 1.6 in August-September 1993). Peak values of SI atthese stations coincided with air temperature peaks in October-November and April-May. Overall, differences in stratificationwere more extreme in the south than in the north of LakeTanganyika.
The mean stratification index for 1993-1994 was 2.27 atBujumbura/Uvira, 2.30 at Kigoma and 2.19 at Mpulungu (TableA.5.2). There was greater variation in the index values atMpulungu as indicated by the standard deviations of 0.55, 0.53and 1.39 respectively. ANOVA indicated that season (p<0.001)and station (p<0.05) were significant as well as the interactionseason-station (Table A.5.3). Yearly means between stationscompared by the LSD method were not significant (Table A.5.3).When SIs were compared between seasons the greatest variation wasfound at Mpulungu where it was 3.08 during the wet season and0.40 during the dry season (Table A.5.2). The difference was

GCP/RAF/271/FIN-TD/46 (En) 45
highly significant (p<0.001) as confirmed by the LSD test (TableA.5.4).

GCP/RAF/271/FIN-TD/46 (En) 46

GCP/RAF/271/FIN-TD/46 (En) 47

GCP/RAF/271/FIN-TD/46 (En) 48
A.6. Upwelling
The southern upwelling was characterised by temperaturehomogeneity in the water column (Fig. 5). The upwellingcorresponded with high wind speeds (3 hourly mean between 4 and 7m/s) and with the minimum air temperature for the year (3 hourlymean was c. 23°C), conditions found during the dry season. Thedata from the thermistor chain showed that suitable conditionsfor upwelling occurred mostly during the night and in the earlymorning (Monthly changes in temperature every 3 hours are givenin Figures B.1-B.11). After the dry season, in September 1993,the 23.75 to 24.00 °C isotherm was not detected again in theupper 90 m (up to May 1994). The upwelling probably endedbetween 10 and 21 September 1993 when the 24.25 to 24.5 °Cisotherm disappeared and a permanent thermocline was formed(Figure B.4).
In summary the upwelling took place during the dry season andusually the pulses were strongest at night when the wind speedwas highest and the air temperature reached a minimum. In theperiod 24 July 1993 to 5 August 1994 upwelling corresponded withthe ascending phase of a deep internal wave at 250 and 300 m (cf.isotherms of 23.25 to 23.50 °C in Appendix B.2).
The persisting waves of the preceding year 1992-1993 weredetected between 200 and 300 m deep (Fig. 5) (isotherm below23.75 °C). The 23.75 to 24.00 °C isotherm showed the mostpronounced displacement towards the surface. This isotherm wasusually between 110 and 150 m but reached the surface in July1994. Internal waves were recorded during the whole wet seasonat each depth sampled from 300 m to the thermocline. Waves werenot detected above the thermocline because of interference fromturbulence. As mentioned above, deep internal waves wereobserved without interruption during the dry season at 250 m and300 m (Fig. 5). Regular measurements of deeper layers arerequired to study the depths affected by internal waves. It ishighly probable that these waves have a lower depth range thanexpected as indicated by parameters measured over 24 h. Coulter(1991) suggested that internal waves could persist much longerthan one season. In the present study of one year nointerruption of the internal waves in the deep layers was found.

GCP/RAF/271/FIN-TD/46 (En) 49
A.7 Thermocline depth
Mean thermocline depth at site A was 49.7, 53.4 and 41.0 m atBujumbura/Uvira, Kigoma and Mpulungu respectively during the wetseason. The thermocline depth during the dry season was lower atBujumbura/Uvira and Kigoma, 65.0 and 75.6 m but not present atMpulungu due to upwelling and mixing by convection (Table A.7.1).The greatest variation in the mean thermocline depth was observedduring the wet season at Mpulungu (Fig. A.7.1). ANOVA (TableA.7.2) indicated station and station-season interactions were themost important factors influencing thermocline depth (p<0.001).When the data were considered for the whole year, there was nostatistical difference between Bujumbura/Uvira and Kigoma (TableA.7.3) confirming the homogeneity between the northern stations.
As well as differences in the depth of the thermoclinebetween seasons, the thermocline deepened during most of the wetseason at the northern stations. This was particularly obviousat Kigoma. A gradual transition from the shallow thermocline ofthe wet season to the deeper thermocline of the dry season wasnoted (Figs 10 and 14). The thermocline deepened from October toJune at Bujumbura/Uvira and from November to June at Kigoma. Thesinking of the thermocline in the north appeared to be causedpartially by the accumulation of warmer water resulting fromsoutherly winds.
These winds seemed to start before the main winds of the dryseason. At Mpulungu, the thermocline was deepest betweenDecember 1993 and March 1994 and then became shallower todisappear finally during the upwelling (June 1994). Thethermocline tilted towards the north particularly during the dryseason. At the end of this season, when the main south eastwinds stopped, the thermocline (and metalimnion) "fell back" intoan equilibrium position taking several oscillations, detected ateach station before this position was reached. The range ofvariation was about 10 to 15 m at Bujumbura/Uvira and Kigoma and20 to 25 m at Mpulungu. These fluctuations were associated withinternal waves (Fig. A.4.3).

GCP/RAF/271/FIN-TD/46 (En) 50

GCP/RAF/271/FIN-TD/46 (En) 51

GCP/RAF/271/FIN-TD/46 (En) 52

GCP/RAF/271/FIN-TD/46 (En) 53
A.8 Transparency
During the first year of sampling the main measurement takento indicate plankton biomass was transparency. Equipment forchlorophyll a measurements is not available. Althoughtransparency is an indirect measurement, it is known fromprevious studies of Lake Tanganyika, that variations intransparency probably reflect changes in phytoplankton biomass(Ferro and Coulter, 1974; Hecky et al., 1981). Futuremeasurement of chlorophyll a and transparency will determine thereliability of this relationship.
Mean transparency was 9.1 m at site A at Bujumbura/Uvira(range 5.0 - 15.4 m), 13.8 m at Kigoma (range 8.1 - 23.5 m) and12.4 m at Mpulungu (range 7.0 - 20.5 m) (Table A.2.1). Therewere short term (hourly) and long term (seasonal) variations intransparency. Water temperature and transparency werepositively related at all three study sites (p<0.05 forBujumbura/Uvira and p<0.001 for Kigoma and Mpulungu).
On 31 May 1994, at each station, transparency was measuredthroughout the day (from 0600 to 1800 h) every hour, by 3different observers. The turbidity of the mixolimnion water wasmeasured at the same time. Transparency was variable (changes of1.5 to 3 m) during the day at each station (Fig. A.8.1) inparticular at Kigoma. In another study, daily variation wasnoted at Mpulungu where monthly observations were made along fivecoastal 'lines' in 1993-1994. A total of 1020 measurements weretaken during this time. Transparency could change by up to 5 min less than 2 h. It is possible that fluctuations intransparency were related to internal waves and turbulence whichmade nutrients available for rapid assimilation by algae. Thelake water generally showed oligotrophic characteristics near thesurface but richer, eutrophic characteristics in deeper water.The phytoplankton growth probably responded rapidly to theinternal waves which brought nutrients to the upper layers eitherin rhythmic (waves) or non rhythmic (turbulence) ways.
General long-term trends in transparency in the north of thelake were linked with thermocline depth (Fig. A.8.3). As thethermocline became deeper towards the end of the wet season andthe epilimnion warmer, transparency increased. The 'nutricline'then reached lower depths than at the beginning of the wet seasonwhich might explain the lower production and higher transparencyat the surface layers. Ferro (1975) observed similar changes intransparency and thermocline depth. At Mpulungu, during theupwelling period (June to September), transparency was low (8 to10 m). The water was clearest in December 1993 (c. 18 m) andagain in March 1994 (c. 13 m). When the south east wind startedthe water generally became less transparent but pulses of clearwater were always present even during the dry season. Theresults of transparency measurements taken at the five sites nearMpulungu (Fig. A.8.3) indicated that the general trends observedat Mpulungu could be extrapolated to the whole south of the lake.

GCP/RAF/271/FIN-TD/46 (En) 54

GCP/RAF/271/FIN-TD/46 (En) 55

GCP/RAF/271/FIN-TD/46 (En) 56
A.9 Turbidity
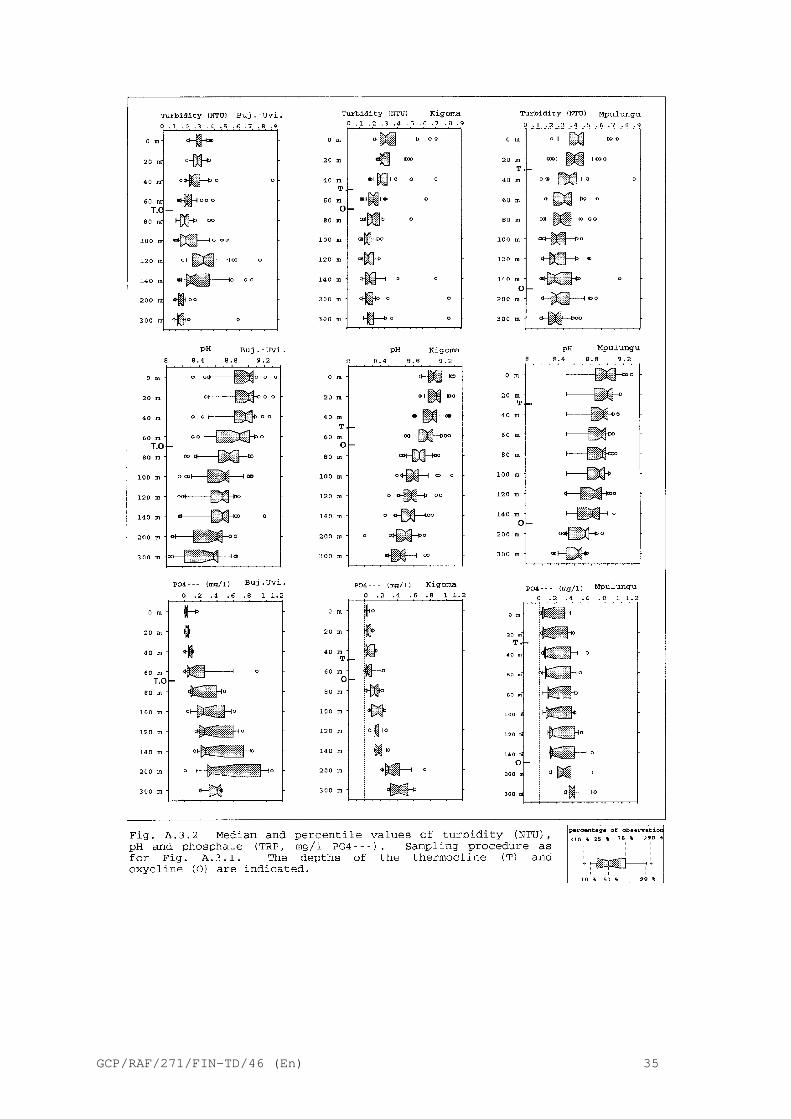
Silt, clay, organic matter, algae and others micro-organismsmay cause turbidity. Plankton and other micro-organisms probablycause the greatest variability in turbidity in the pelagic area.The pelagic area is not significantly influenced by river inflowsin Lake Tanganyika. Generally, these waters are colder and sinkrapidly below the thermocline. When yearly data were comparedbetween stations (Table A.9.3), the highest mean turbidity of thewater column from 0 to 100 m was recorded at Bujumbura/Uvira(0.40 NTU) followed by Mpulungu (0.34 NTU) and Kigoma (0.25 NTU).These differences were highly significant (P < 0.001) (TableA.9.4) and showed similar trends to transparency data (TableA.2.1 and Fig. A.2.1). Maximum values of turbidity were alsorecorded at Bujumbura/Uvira, 2.1 NTU, compared to Kigoma, 0.85NTU, and Mpulungu, 0.70 NTU, while the minimum values were 0.12NTU at Bujumbura/Uvira, 0.09 NTU at Kigoma and 0.14 NTU atMpulungu (Table A.2.1). Turbidity decreased with depth (Fig.A.3.2) although at Bujumbura/Uvira, a marked increase wasobserved near the thermocline from March 1994 to May 1994.
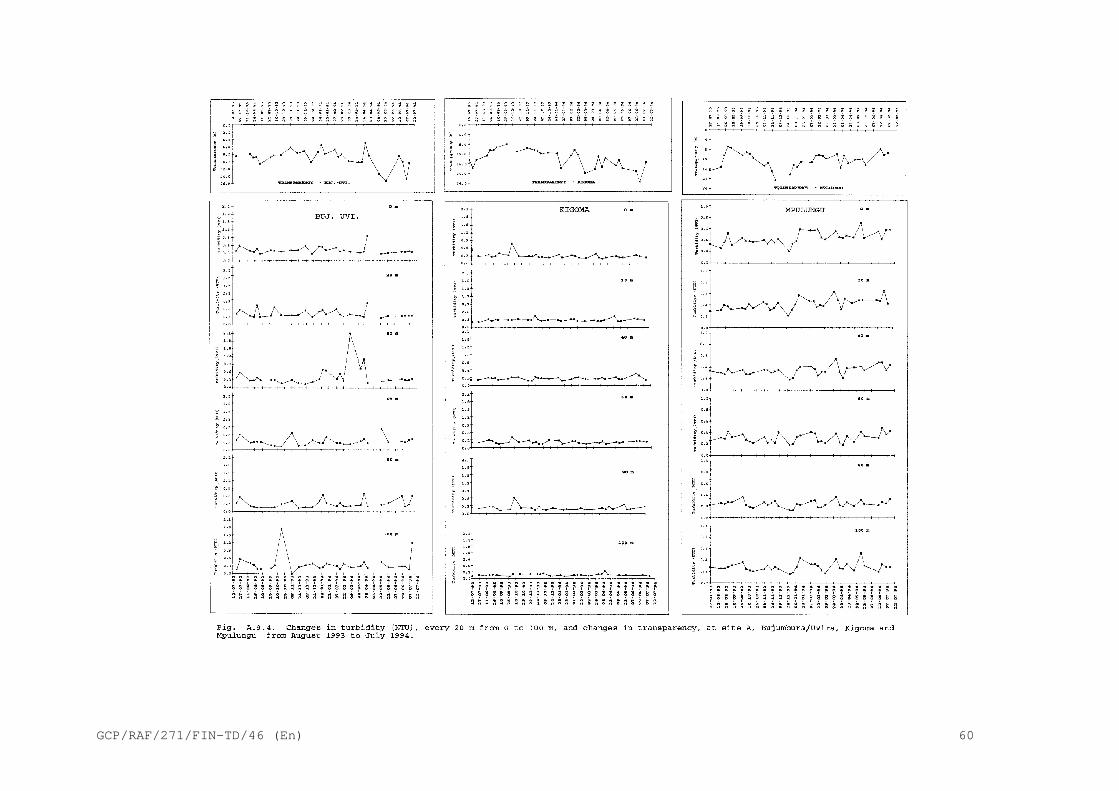
The main factors influencing turbidity were station, depth,and the interaction between station and season (ANOVA, TablesA.9.2 and A.9.3). During the dry season, the turbidity at bothends of the lake (0.30 NTU at Bujumbura/Uvira and 0.35 NTU atMpulungu) was significantly higher (p<0.001) than at Kigoma (0.25NTU). There was a significant interaction between station andseason. At Bujumbura/Uvira turbidity during the wet season, 0.43NTU, was statistically different (p<0.001) from the dry season,0.34 NTU, although no seasonal differences were detected atKigoma and Mpulungu. Seasonal differences at Bujumbura/Uvirawere mainly due to the increase of turbidity at 40 m (Fig. A.9.3and Table C.3) which was most apparent in March and April 1994.
Changes in the shape of the isopleths of turbidity at site Aof Bujumbura/Uvira indicated the increased turbidity during thewet season. At site B c. 30 km south of site A a turbidity layeralso developed during the wet season but between 120 and 140 m.A layer of high turbidity during the wet season was not observedat site A of Kigoma (Fig. A.9.1) but was noted at site B, (>0.20NTU) at 120 m in December 1993 and January 1994 (Fig. A.9.2).At Mpulungu, the turbidity at the surface was lower (0.30 to 0.36NTU) in December (in this month the water was distinctlystratified and was very transparent, Secchi disk c. 18 m) butstarted to increase in January and February in the surface to 40m layer. From April, (when the winds of the dry season started)to July the higher turbidity isopleth (>0.42 NTU) sank from 0-30m to 60 m which indicated the increasing importance of mixing.At Mpulungu surface maximum turbidity was also observed in July(turbidity between 0.54 and 0.60 NTU) (Fig. A.9.2).

GCP/RAF/271/FIN-TD/46 (En) 57

GCP/RAF/271/FIN-TD/46 (En) 58

GCP/RAF/271/FIN-TD/46 (En) 59
GCP/RAF/271/FIN-TD/46 (En) 60

GCP/RAF/271/FIN-TD/46 (En) 61

GCP/RAF/271/FIN-TD/46 (En) 62

GCP/RAF/271/FIN-TD/46 (En) 63
A.10 Dissolved oxygen
The results of dissolved oxygen (DO) measurements werepreliminary as they did not encompass a whole year. An oxygenmeter was not available during the first 3 months atBujumbura/Uvira and during the first 8 months at Kigoma andMpulungu.
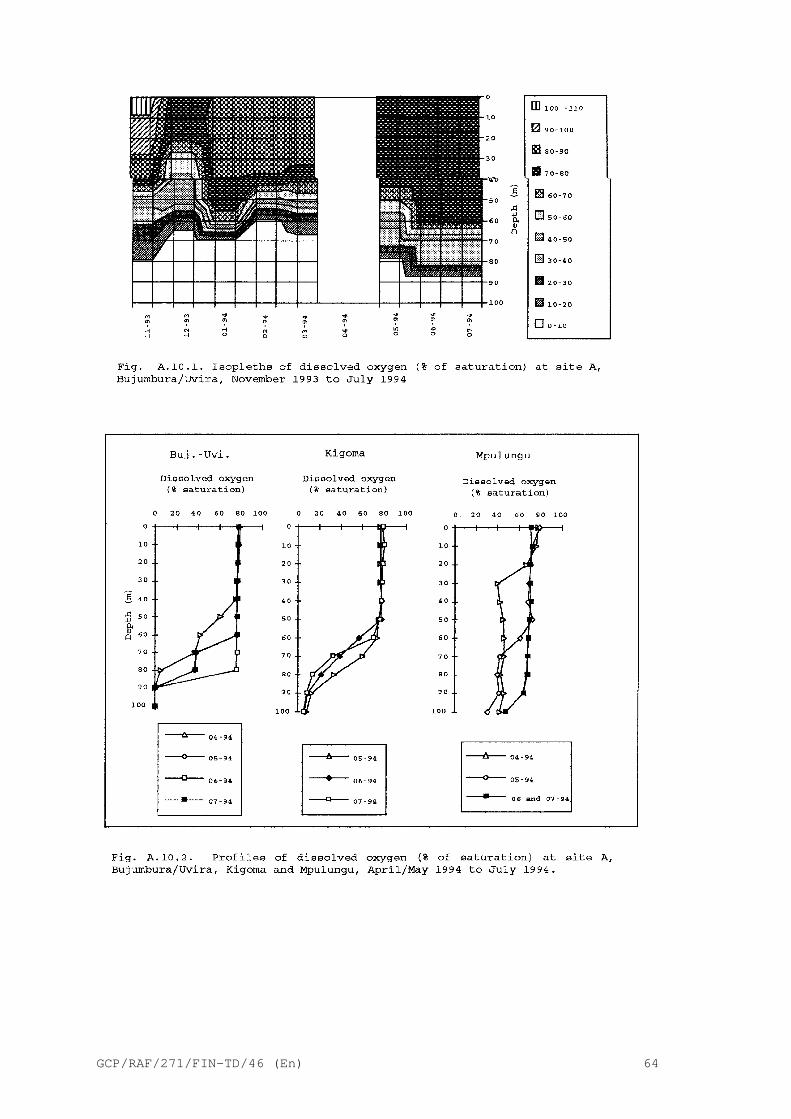
The mean depth where anoxia (DO = 0 mg/l) was first detected(site A) was 84.6 m at Bujumbura/Uvira (November 1993 to July1994) and 85.0 m at Kigoma, (April to July 1994). At Mpulunguthe water was always oxygenated down to 100 m (mean 3.8 mg/ l at100 m). The water temperature at 84.6 m, Bujumbura/Uvira, was24.5 (C. Insufficient data were available for the others stations.
The isopleths of DO measured at Bujumbura/Uvira are presentedin Figure A.10.1. Maximum DO was observed in November 1993 whensupersaturation (121 %) occurred. For the range of temperaturesobserved in Lake Tanganyika, 100 % oxygen saturation was from 7.1to 7.6 mg/l. In December DO was between 90 and 100 % saturationbetween O - 40 m. Lowering of the oxygenated layer was recordedfrom February to July. It corresponded to the descent of thethermocline (Figs A.4.1 and A.7.2).
DO decreased between 20 and 30 m in April at Mpulungu (whenthe thermocline depth was nearer the surface). In May the upperlayers increased in DO (Fig. A.10.2). The shape of the DOprofile in July probably resulted from mixing caused byupwelling.
In the present study DO was recorded occasionally down to 300m at site B of each station. Previous records of DO were down to240 m (Capart, 1952). For example at Mpulungu on 7 June 1994 2.1mg/l were recorded at 1200 h and 1.4 mg/l at 1800 h at 300 m.Some temporary incursions of DO were possible in lower depths dueto turbulence.
GCP/RAF/271/FIN-TD/46 (En) 64

GCP/RAF/271/FIN-TD/46 (En) 65
A.11 Conductivity
The majority of the African lakes show a conductivity between96 (S/cm (Lake Victoria) and 925 (S/cm (Lake Edward). During thepresent sampling period, the mean conductivity, was 659 (S/cm atBujumbura/Uvira, 653 (S/cm at Kigoma and 658 (S/cm at Mpulungu(Table A.11.3). Conductivity at Kigoma was significantly(p<0.001) lower than at Bujumbura/Uvira and Mpulungu but therewas no significant difference between Bujumbura/Uvira andMpulungu (Table A.11.4).
Variation in conductivity was most pronounced atBujumbura/Uvira (Fig. A.2.1). Minimum and maximum values for the0-100 m water column were 520 and 728 (S/cm at Bujumbura/Uvira,553 and 702 (S/cm at Kigoma and 607 and 704 (S/cm at Mpulungu(Table A.2.1). Conductivity increased with depth at allstations (Fig. A.3.1) although variation at each depth was morepronounced at Bujumbura/Uvira and Kigoma than at Mpulungu.
There was variation in the conductivity of the water betweenstations, depths and seasons and the station-season interaction(Table A.11.2 and Figs A.11.1 to A.11.3)). Important differenceswere noted at the end of the dry season and at the beginning ofwet season. At Bujumbura/Uvira, minimum of values ofconductivity were recorded in September at 20 m (Fig. A.11.3).In October, water of conductivity 700 (S/cm, normally detected atc. 300 m (Fig. A.3.1), was measured at all depths >50 m. On 19October 1993, conductivity at the surface reached 686 (S/c, avalue normally found at c. 200 m. At Kigoma a reduction inconductivity at 40 to 60 m was observed in September (Figs A.11.1and A.11.3). At Mpulungu "pulses" of deep, conductive water weremeasured. These corresponded with the changes in thermoclinedepth (cf Fig. A.11.1 with Figs A.4.1 and A.7.2). Variation inconductivity showed an "absorbed oscillation" shape (Fig.A.11.2). This was particularly clear at Bujumbura/Uvira. Theamplitude of the variation was significant on 7 September whenconductivity decreased at several depths (particularly 0 to 30m). It was followed by a rise in conductivity on 19 October andsubsequent oscillations of decreasing amplitude towards the endof the sampling year. Similar but less significant changes wererecorded at Kigoma (Fig. A.11.2). A significant decrease inconductivity was noted on 5 October. Variation tended to be lesspronounced towards the end of the sampling year. At Mpulunguoscillations in conductivity values were noted but the patternwas different. After significant fluctuations during the dryseason and at the beginning of the wet season, there was littlevariation in conductivity from November 1993 to January 1994, aperiod of stable stratification in this area.

GCP/RAF/271/FIN-TD/46 (En) 66

GCP/RAF/271/FIN-TD/46 (En) 67

GCP/RAF/271/FIN-TD/46 (En) 68

GCP/RAF/271/FIN-TD/46 (En) 69

GCP/RAF/271/FIN-TD/46 (En) 70

GCP/RAF/271/FIN-TD/46 (En) 71
A.12 pH
Lake Tanganyika water is alkaline but becomes less so withdepth. During the study year the mean surface water pH was 9.01at Bujumbura/Uvira, 9.06 at Kigoma and 9.02 at Mpulungu and at100 m was 8.90, 8.94 and 8.93 respectively (Table A.12.1). Thedifferences between Bujumbura/Uvira and Kigoma were significant(p<0.001) (Table A.12.4) at all depths sampled (from 0 to 100 m).The pattern of variation in pH was similar to conductivity, inthe 0 to 100 m column it was highest at Bujumbura/Uvira (FigsA.2.1 and A.3.2). The lowest variation was seen at Kigoma. AtMpulungu, besides the general decrease of median values, it wasnoted that the 10 % percentiles were similar between 0 and 100 m.This corresponded to mixing of the water column during upwelling.
A decrease in pH just below the thermocline (c. 80 m) wasrecorded at Bujumbura/Uvira and Kigoma while at Mpulungu adecrease in pH was measured well below the thermocline, justbelow the deep oxycline, between 140 m and 200 m.
ANOVA showed that the interaction between season and stationwas highly significant(p<0.001) at Bujumbura/Uvira and Kigoma andsignificant(p<0.05) at Mpulungu (Table A.12.4). AtBujumbura/Uvira the mean pH decreased during the dry season whileat Kigoma it increased (Table A.12.3). Differences were noted atsimilar depths between stations. For example the surface pH was9.14 at Kigoma compared to 8.85 at Bujumbura/Uvira during the dryseason (Table A.12.1). The above differences were confirmed byLSD tests (Table C.5). At Mpulungu, as at Kigoma, the pHincreased during the dry season. At Bujumbura/Uvira low valuesin August 1993 but high values in October and November 1993 wereobserved. In the latter months there was greater phytoplanktonproduction. During the wet season, there were no significantdifferences between stations (Table A.12.4).
Variation in pH was greatest from September-December (FigsA.12.1 and A.12.2). The isopleths of pH were related to changesin thermocline depth (cf Fig. A.12.2 to Figs A.4.1 and A.7.2).
Upward pulses of deep water were recorded at site B fromisopleths of low pH rising from depths >300 m to 80-100 m atBujumbura/Uvira from September to December, to 60 to 80 m atKigoma in December and to 140-200 m at Mpulungu from September toNovember (Fig. A.12.2). A second pulse of deep water with lowerpH values was recorded in March at Kigoma and in March-April atBujumbura/Uvira. It corresponded to the upward movement of thethermocline at this time (Fig. A.7.2).

GCP/RAF/271/FIN-TD/46 (En) 72

GCP/RAF/271/FIN-TD/46 (En) 73

GCP/RAF/271/FIN-TD/46 (En) 74

GCP/RAF/271/FIN-TD/46 (En) 75

GCP/RAF/271/FIN-TD/46 (En) 76

GCP/RAF/271/FIN-TD/46 (En) 77

GCP/RAF/271/FIN-TD/46 (En) 78
A.13 Total phosphorus
Means of total phosphorus (TP) (as PO4 3-) for the 0-100 mwater column were similar for Bujumbura/Uvira and Mpulungu, 0.13and 0.15 mg/l respectively (Table A.13.2). At Kigoma, highvalues were regularly recorded. The mean was 0.47 mg/l.
Median values of TP at Kigoma were higher than at the otherstations (Fig. A.2.1). Increased values were observed in August,September, October and December. Other parameters such as pH andconductivity also varied significantly in these months.
A comparison between seasons showed that the greatestvariation in TP was at Mpulungu were the concentrations of TPwere 0.32 and 0.12 mg/l during the dry and wet seasonsrespectively. Upwelling occurred during the dry season and atthis time, at Kigoma, TP concentrations increased but decreasedat Bujumbura/Uvira (Table A.13.2).

GCP/RAF/271/FIN-TD/46 (En) 79

GCP/RAF/271/FIN-TD/46 (En) 80
A.14 Phosphates
The average concentration of total reactive phosphorus (TRP)in the 0 to 100 m column was significantly lower in Mpulungu(0.05 mg/l as PO4 3-) compared to Bujumbura/Uvira and Kigoma (0.15mg/l as PO4 3-) (Table A.14.3 and A.14.4). Phosphateconcentrations increased with depth (Figure A.3.2). Differencesbetween the means were significant (P<0.001 or <0,01) for all thecriteria (station, season and depth) and all their interactionsexcept station x season x depth (Table A.14.2).
At Bujumbura/Uvira, the concentration of TRP in the 0 t0 100m water column was significantly (P<0.001) lower during the dryseason (0.09 mg/l as PO4 3-) compared to the wet season (0.19 mg/las PO4 3-). Phosphate rich layers reached the epilimnion at 20-40m in October then sank during the year with some upward pulses inDecember and March (Fig. A.14.1). The deepening of phosphate richlayers corresponded with the deepening of the thermocline (FigureA.7.2) and the pulses were probably linked with internal waves.
At Kigoma, a more patchy distribution was identified withpulses in September, January and particularly May (Fig. A.14.1).These fluctuations need further investigations.
At Mpulungu, phosphate concentrations were linked with thedry season (and its upwelling) and the end of the wet season whenthe thermocline became shallower (compare Figs 36 and 37 withFig. 10). The influence of stratification on the input ofnutrients such as phosphates was particularly well inferred fromthe data. During most of the wet season phosphates might havelimited production near Mpulungu particularly during low phasesof internal waves.
Pulses of TRP were noted during the whole year atBujumbura/Uvira and Kigoma (Fig. A.14.2). At Mpulungu pulses werenot detected during December and January, a time of the year withthe strongest stratification when the thermocline acted as aneffective barrier.

GCP/RAF/271/FIN-TD/46 (En) 81

GCP/RAF/271/FIN-TD/46 (En) 82

GCP/RAF/271/FIN-TD/46 (En) 83

GCP/RAF/271/FIN-TD/46 (En) 84

GCP/RAF/271/FIN-TD/46 (En) 85
A.15 Nitrates
Mean concentrations of nitrates in the 0 to 100 m watercolumn were 0.06 mg/l (NO3-N) at Bujumbura/Uvira and 0.08 mg/l atKigoma and Mpulungu (Table A.15.3). Differences betweenBujumbura/Uvira and the other stations were significant (p<0.001with Kigoma and p<0.01 with Mpulungu (Table A.15.4)).
Medians and percentiles of all observations at site A arepresented in Figure A.2.1 Below the surface nitrates increasedto reach a maximum, 0.10 mg/l at 60 m at Bujumbura/Uvira, 0.12mg/l at 80 m at Kigoma and 0.10 mg/l at 100 m at Mpulungu (TableA.15.1). Maximum values were related to the oxycline (Fig.A.3.3). Below the oxycline average nitrate values decreased to0.04 mg/l at 300 m at Bujumbura/Uvira (N = 3), 0.07 mg/l atKigoma (N = 12) and 0.05 mg/l at Mpulungu (N = 8) at site B. Nodeeper samples were taken during the first year.
At Bujumbura/Uvira, during the dry season and from October toDecember, nitrate concentrations were homogeneous in the watercolumn (Figs A.15.1, A.15.2 and A.15.3). From January to Aprilthere was a well defined peak near the thermocline at 60 m andfrom May to June at 80 m when the thermocline deepened. At siteB maximum concentrations were also observed from 60 to 80 m (Fig.A.15.2). At Kigoma the lowest values of nitrates were recordedduring the dry season (Table A.15.4). Maximum values of nitratewere generally recorded at a lower depth than at Bujumbura/Uvira(c. 80-100 m), particularly from March to June (Fig. A.15.3).Fluctuations in nitrate values at Mpulungu were related tochanges in thermocline depth (cf. Figs A.15.2 and A.15.4 withFig. A.4.1). Pulses of nitrate concentrations were recorded nearthe surface at Kigoma and Mpulungu (Figs A.15.2 and A.15.4).

GCP/RAF/271/FIN-TD/46 (En) 86

GCP/RAF/271/FIN-TD/46 (En) 87

GCP/RAF/271/FIN-TD/46 (En) 88

GCP/RAF/271/FIN-TD/46 (En) 89

GCP/RAF/271/FIN-TD/46 (En) 90

GCP/RAF/271/FIN-TD/46 (En) 91

GCP/RAF/271/FIN-TD/46 (En) 92
A.16 Nitrites
Mean nitrite values for the 0 to 100 m water column was 0.003mg/l (NO2-N) at each station. There were no significantdifferences between stations (Tables A.16.2 and A.16.3). A peakof <0.005 mg/l at 80 m during the wet season at Bujumbura/Uvirawas statistically different from concentrations at other depths(Table C.8). At Mpulungu nitrites were significantly less(p<0.01), 0.002 mg/l, during the wet season than at otherstations, 0.003 mg/l (Table A.16.4).
Between the dry season and the wet season, isopleths ofnitrite concentrations (Fig. A.16.1) indicated higher values atBujumbura/Uvira. This corresponded with a period of mixing andupwelling of deep water (see Fig. A.11.1). Other peaks weremeasured at 80 m, in December, in February and in June (Fig.A.16.1).

GCP/RAF/271/FIN-TD/46 (En) 93

GCP/RAF/271/FIN-TD/46 (En) 94

GCP/RAF/271/FIN-TD/46 (En) 95

GCP/RAF/271/FIN-TD/46 (En) 96

GCP/RAF/271/FIN-TD/46 (En) 97
A.17 Ammonia
Mean concentrations of ammonia (NH4-N) for the 0 to 100 mwater column were 0.04 mg/l at Bujumbura/Uvira and 0.02 mg/l atKigoma and Mpulungu (Table A.17.3). The value for Bujumbura/Uvirawas significantly (p<0.001) higher (Tables A.17.2 and A.17.4).During the wet season means of NH4-N were 0.12 mg/l atBujumbura/Uvira compared to 0.01 in mg/l at Kigoma and Mpulungu.Medians and percentiles of ammonia (Fig. A.2.1) indicated thathigher values of ammonia were recorded more frequently atBujumbura/Uvira. The maximum value there was 0.37 mg/l NH4-N on1 January 1994 at 100 m. Concentrations at 100 m werestatistically (p<0.05 to <0.001 depending of the depthconsidered) different from all other depths at all stations(Table C.9). Ammonia concentrations increased in the anoxiczone.
Fluctuations of ammonia were similar to those of nitrites(Fig. A.16.1). Ammonia concentrations were significantlydifferent (p<0.01) between seasons in the water column from 0 to100 m only at Kigoma where 0.01 mg/l NH4-N was recorded duringthe wet season and 0.04 mg/l NH4-N during the dry season (TableA.17.3 and A.17.4). During the dry season there were significantdifferences (p<0.001) in concentrations between Bujumbura/Uvira,0.05 mg/l NH4-N, and Mpulungu, 0.01 mg/l NH4-N which probablyreflected differences in oxygenation in the upper layers at thesestations. In September and October 1993 isopleths of ammoniaindicated higher values in the epilimnion at Bujumbura/Uvira(Fig. A.17.1). There was no precipitation at the time.Isopleths at Kigoma and Mpulungu at site A (Fig. A.17.1)fluctuated irregularly during the year probably resulting fromlocal mixing or precipitation. Ammonia in the upper layers wasdetected following mixing or precipitation before it was absorbedby organisms or converted to nitrite and nitrate.

GCP/RAF/271/FIN-TD/46 (En) 98

GCP/RAF/271/FIN-TD/46 (En) 99

GCP/RAF/271/FIN-TD/46 (En) 100

GCP/RAF/271/FIN-TD/46 (En) 101

GCP/RAF/271/FIN-TD/46 (En) 102
APPENDIX B

GCP/RAF/271/FIN-TD/46 (En) 103

GCP/RAF/271/FIN-TD/46 (En) 104

GCP/RAF/271/FIN-TD/46 (En) 105

GCP/RAF/271/FIN-TD/46 (En) 106

GCP/RAF/271/FIN-TD/46 (En) 107

GCP/RAF/271/FIN-TD/46 (En) 108

GCP/RAF/271/FIN-TD/46 (En) 109

GCP/RAF/271/FIN-TD/46 (En) 110

GCP/RAF/271/FIN-TD/46 (En) 111

GCP/RAF/271/FIN-TD/46 (En) 112

GCP/RAF/271/FIN-TD/46 (En) 113

GCP/RAF/271/FIN-TD/46 (En) 114
APPENDIX C

GCP/RAF/271/FIN-TD/46 (En) 115

GCP/RAF/271/FIN-TD/46 (En) 116

GCP/RAF/271/FIN-TD/46 (En) 117

GCP/RAF/271/FIN-TD/46 (En) 118

GCP/RAF/271/FIN-TD/46 (En) 119

GCP/RAF/271/FIN-TD/46 (En) 120

GCP/RAF/271/FIN-TD/46 (En) 121

GCP/RAF/271/FIN-TD/46 (En) 122

GCP/RAF/271/FIN-TD/46 (En) 123