liming effects on some chemical and biological parameters of soil (spodosols and histosols) in a...
TRANSCRIPT
V o l u n ~ p a p e r
LIMING EFFECTS ON SOME CHEMICAL AND BIOLOGICAL PARAMETERS OF SOIL
(SPODOSOLS AND HISTOSOLS) IN A HARDWOOD FOREST WATERSHED
Joseph B. Yavitt I and Robert M. Newton 2
iCornell University
Department of Natural Resources and Ecosystems Research Center
Fernow Hall
Ithaca, NY 14583 USA
2Smith College
Department of Geology
Northhampton, MA 01063 USA
Abstract. Acidic lakes and streams can be restored with base application (usually limestone) provided
that the base does not wash out before the benefits of alkalization can be realized; liming soils of
the adjoining watershed may be an alternative approach. This study was conducted to provide a
scientific basis for soil liming. Plots (50 m 2) with different limestone dosages (e.g. 0, 5, 10 or 15
Mg CaCO 3 ha -l) were established on each of two different soils (a Spodosol and a Histosol) in the Woods
Lake watershed of the Adirondack Park Region of New York, USA. Six months after soil liming much of
the added limestone was still present in both the Spodosoi and in the Histosol. Ten months after soil
liming results indicated that: (i) soil pH increased (> 1 unit) but mostly in the top 1 cm; (2) net N
mineralization increased from 9.8 to ca. 15 ~g N g-i d-i and nitrification increased from 2.8 to ca. 8
~g N g-i d-l (3) denitrification was not affected (98 ~g N g-I d-l); (4) CO Z production potential
decreased in the surface soil and as a function of limestone dosage (60 to 8 ~mol g-I d-l); and (5)
soluble SO42- concentrations in the Histosol were not affected (105 ~mol L-l). Liming acidic forest
soils with > 5 Mg CaCO 3 ha -I may increase the soil's acid neutralizing capacity, which could provide
long-term benefits for surface water acidification.
i. Introduction
It is well known that acidic lakes and streams (pH < 5) are characterized
by low diversity and growth rates for primary producers (Stokes, 1986),
for secondary producers (Geelen and Leuven, 1986), and for fish
(Schofield and Driscoll, 1987; Brown, 1988). The application of
limestone reduces acidic conditions and improves surface water quality
(i.e. pH and CA 2+ and A13+ concentrations) and mitigates stresses on
producers and fish populations (Porcella, 1989 and references cited
therein). Lake and stream liming as a means of long-term restoration,
however, depends on the lime remaining in the water (Wright, 1985). This
becomes a problem when the lime washes out of the water before any
benefits can be realized, and thus continuous addition of limestone is
required to overcome continuous water flux. Soil liming may be an
alternative. That is, liming the soils of a watershed with acidic lakes
and streams should neutralize surface waters before they reach adjoining
lakes and streams (Davis, 1988; Warfvinge and Sverdrup, 1989), and
increasing the soilts base saturation and the soilrs buffering capacity
of exchangeable base cations (Reuss and Johnson, 1985, 1986) should
increase acid neutralizing capacity (ANC) of surface waters over longer
periods of time than direct lake or stream liming.
Water, Air, and Soil Pollution 54: 529-544, 1990/91. © 1990/91 KluwerAcademic Publishers. Printed in the Netherlands.

530 J.B. YAVITT AND R. M. NEWTON
Soil liming to mitigate acidification of surface waters in forested watersheds has been practiced infrequently; therefore, many questions regarding its application exist. The Experimental Watershed Liming Study (EWLS) located within the Woods Lake watershed in the Adirondack Park Region of New York, USA was initiated to address questions regarding the appropriate conditions for soil liming. The questions included: (i) What dosage of lime is required to increase ANC of surface water? (2) To what extent are chemical and microbiological properties of
soils affected by liming? (3) What is the response of liming mineral soils (e.g. a Spodosol) vs
wetland soils (e.g. a Histosol)? Here we report results that describe short-term impacts of soil liming on chemical and microbiological properties of forest and wetland soils for small test plots each with a different limestone dosage. The purpose of this study was to help establish the limestone dosage for large-scale liming within the watershed. The results are discussed with regard to the impact of soil liming on surface water quality.
2. Methods
2.1 Study area
Woods Lake (42°52'N, 71°58'W) is a 23 ha clearwater lake located in a 207-ha watershed that is underlain by thin deposits (e.g. < 4 m depth) of granitic glacial till (April and Newton, 1985; Newton et a2., 1987). The characteristics of Woods Lake and its watershed are typical of acidic systems in the west-central region of the Adirondacks (Driseoll and Newton, 1985; Goldstein et a2., 1985). Detailed description of the atmospheric deposition for the study area can be found in Johannes et a2. (1985). Pertinent values for this study (1981 values) are: S042- deposition of 797 eq ha -I yr -I, NO 3- and NH4 + depositions of 434 and 275
2+ 1 1 + eq ha -I yr -I, respectively, Ca deposition of 175 eq ha- yr- , and H deposition of 653 eq ha -I yr -I. The lake is shallow (I0 m maximum depth) with a hydrologic residence time of 210 days (Staubitz and Zarriello, 1989). It is thought that the ii0 to 140 cm of annual atmospheric precipitation is only partially neutralized in the watershed before entering the lake through a network of seven first-order streams.
Approximately 95% of the watershed is northern-hardwood forest, dominated by American beech (Fagus grandifolia Ehrh.), red maple (Acer rubrum L.) and yellow birch (Betula alleghaniensis Britt.) with occasional codominant red spruce (?icea rubens Sarg.) established on Spodosols and Inceptisols. The most common soil within the watershed is an acidic Tunbridge-Lyman soil (coarse-loamy to loamy, mixed frigid Typic to Lythic Haplorthods). The remaining 5% of the watershed is wetland, dominated by mosses (Sphagnum sp.), sedges (Carex sp.) and ericaceous shrubs (Ledum groenlandicum Oeder and Chamaedaphne calyculata [L.] Moench.) established on a Dawson Muck soil (sandy-skeletal, mixed dysic Terrie Borosaprists).
2.2 Test plots
Six plots (50 m 2) were established on each of two soil types (e.g. the Tunbr idge - Lyman soil and the Dawson Muck soil) in October 1988.
LIMING EFFECTS ON CHEMICAL AND BIOLOGICAL PARAMETERS 531
Treatments consisted of three application rates of CaCO 3 (5, I0 and 15 Mg of CaCO 3 ha -1 ) with a mean particle size of 18 #m that was hand broadcast as a dry powder to the surface of the plot. One additional plot received I0 Mg CaCO 3 ha -I of 18 #m CaCO 3 to serve as a replicate for this liming dosage, one plot received i0 Mg CaCO 3 ha -I of 200 #m CaCO 3 to evaluate the effect of particle size on soil chemistry, and one plot served as a control.
2.3 General chemical characteristics of the soils
Soil samples were taken in one volumetric pit (200 cm 2 to bedrock) in each plot prior to liming to determine relevant chemical and physical properties. The rectangular pits were dug carefully with small trowels. In the forest soil plots, layers of soil were separated by genetic horizons, whereas soils in the wetland plots were separated by depth intervals (0 to 5, 5 to i0, and i0 to 20 cm depths). Subsamples of each horizon or depth interval were taken, field-moist weights were recorded, and oven dried at I05°C to convert data to an oven-dry basis. Bulk density (Mg m -3) was calculated for each horizon or depth interval.
Soil pH was determined on field-moist samples with electrodes in 1:5 [w:v] soil:solution ratio suspensions of both deionized water and 1 M KCI. Total exchangeable acidity extracted with BaCI2-TEA was determined by the standard titration procedure (Thomas, 1982). Exchangeable bases (Ca, Mg, K and Na) extracted with IM NH4CI were determined in extracts by atomic adsorption spectrophotometry with LaCI 3 additions to minimize interferences (Thomas, 1982). Ammonium and NO3-extracted with 2 M KCI were determined in extracts by automated speetrophotometric procedures (Keeney and Nelson, 1982).
2.4 Limestone determination
Soil cores (I0 cm dia. by 15 cm depth) were taken 6 mo after the limestone application in the spring of 1989 to determine the amount of limestone that remained in the soil. Each core was mixed thoroughly by hand, and a i0 g subsample (air-dired basis) was used for the limestone determination, using 6 M HCI and detection of CO 2 by gas chromatography.
2.5 Bulk soil collection for the forest soil plots
Within the forest soil plots, the response of B horizon soil to the added limestone was assessed using B horizon soil enclosed in "soil bags" and incubated in each plot. Prior to liming, several kilograms of B horizon soil were collected approximately 500 m east of the test plots. The 0 and E horizons were removed from a 15 by 2 m area, and the B horizon was excavated and sieved through a 6 mm screen in the field. The sieved material was placed on a large polyethylene sheet and mixed thoroughly by hand for > 60 min. Two hundred g of this homogenized soil were enclosed in replicate Nytex-mesh bags (250 #M mesh size) and placed at the interface of the Oa and E horizons in each of the six test plots. Duplicate bags were retrieved from each plot in August 1989 and chemical properties of the soil were analyzed as described above.

532 J.B. YAVITT AND R. M. NEWTON
2.6 Net N mineralization, nitrification and denitrification
Net N mineralization was measured in each forest soil plot by the buried polyethylene bag technique (Westermann and Crothers, 1980). In each plot, five replicate samples of the forest floor were taken from the 0 to i0 em depth, which consisted of Oe and Oa horizon material. One-half of each sample was placed undisturbed in a 0.04 mm thick plastic bag, buried in the same hole and covered with leaf litter; the bag remained in place for a 28 day incubation period. The other half of each sample was returned to the laboratory and extractable NH4 + and NO 3- levels were determined immediately by shaking a fresh subsample with 2 M KCI (1:5 [w:v] sample:solution ratio), equilibrating for 24 hr and pipetting an aliquot of the supernatant; NH4 + and NO 3- levels in the supernatant were determined spectrophotometrically. Upon retrieval, the incubated soils were analyzed for extractable NH4 + and NO 3- levels with 2 M KCI.
Net N mineralization of the wetland soils was determined by a modification of the anaerobic incubation technique (Keeney and Bremner, 1966). Two soil cores (0 to I0 cm depth) were taken from each plot. A 75 cm 3 subsample of soil plus 120 mL of distilled water were placed in a 250 mL flask, which was flushed with N 2 to ensure anaerobic conditions and incubated for 7 d at 25°C. A second 75 cm 3 subsample was analyzed immediately for extractable NH4 + levels with 2 M KCI. Following incubation, the soil was analyzed for extractable NH4 + levels with 2 M KCI, and net N mineralization was calculated as the increase in NH4+-N levels over the 7 d incubation period.
Denitrification potential was determined by the C2H2-block technique (Yoshinara et ai., 1977). Duplicate soil cores were collected in each plot in August 1988. The genetic horizons of the forest soils were separated and the wetland soils were separated by depth intervals. Soil subsamples (20 g or 75 em 3, respectively) plus 120 mL of distilled water were placed in a 250 mL flask, and the flask was stoppered. A piece of glass tubing had been inserted through the center of the stopper and sealed with an aluminum-crimped septum to allow periodic N20 sampling of the headspace using a gas-tight syringe. The flask was flushed with N 2 before 10% of the headspace gas was removed using a gas-tight syringe and an equal volume of C2H 2 was added. A 1.0 mL sample of the headspace gas was removed at 4 to 6 hr intervals and analyzed for N20 concentration on a gas chromatograph with a 63Ni electron capture detector. Nitrogen was the carrier gas (10 mL min-l), and Poropak QS was used in a 1.8-m S.S. column maintained at 35°C. Standards consisted of N20 diluted in N 2 and were obtained from Scott Specialty Gases, Wakefield, MA. Corrections were made for the solubility of N 2 in water. Separate subsamples were incubated without flooding and with 100% 02 in the headspace of the flask to determine N 2 production potential under aerobic conditions.
2.7 CO 2 production potential
Carbon dioxide production potentials of soils were determined by a static incubation technique. Separate soil subsamples were taken from the cores utilized for the denitrification studies and were placed in individual, stoppered 250 mL flasks, which were flushed with room air to ensure aerobic conditions. For the wetland soils, 120 mL of distilled water were also placed into the flasks and the headspace was flushed with N 2 to ensure anaerobic conditions. A 1.0 mL sample of the headspace gas was

LIMING EFFECTS ON CHEMICAL AND BIOLOGICAL PARAMETERS 533
removed at 4 to 6 hr intervals and analyzed for CO 2 concentration on a gas chromatograph with a thermal conductivity detector. Helium was the carrier gas (30 mL min-l), and Poropak R was used in a 1.8 m S.S. column maintained at 35°C. Standards consisted of CO 2 diluted in N 2 and were obtained from Scott Specialty Gases, Wakefield, MA.
2.8 Soluble sulfate
Concentrations of dissolved sulfate in the wetland soil were measured in August 1988. Prior to sampling, a single well was installed in each plot; the collection depth was 25 cm below the surface. Water in the well was bailed initially, then water that refilled the well was collected and a subsample was retained for analysis of the sulfate concentration by ion chromatography (Tabatabai and Dick, 1983).
2.9 Statistical analyses
We did not attempt rigorous statistical analyses of the data because the main effect (limestone dosage) was not fully replicated.
All reported values in this paper are the means of at least two samples, which were collected from different locations within any individual plot. Coefficients of variation for means within plots were always between 45 and 125%.
3. Results and Discussion
3.1 General chemical characteristics of the soils and peats
The forest soil was acidic throughout the profile (Table I), which is typical of well developed Spodosols (Ugolini and Dahlgren, 1987). The pH values of the wetland soils also were acidic (Table I), which is typical of organic soil (i.e. peat) derived mostly from Sphagnum sp. (Moore and Bellamy, 1974). In addition to free acidity, both of the soils had substantial amounts of extractable acidity (u,e, H + and AL 3+) as indicated by the pH values determined on field-moist soil samples in KCI that were at least 0.5 units lower than those in deionized water.
Table I
Soil characteristics
Site Horizon or Depth Bulk Density pH Strata (cm) (gcm -3) Water KCL
Forest Oi 0.09 Forest Oe 0.22 Forest Oa 0.40 Forest E, B 0.62 Wetland 0-5 0.i0 Wetland 5-10 0.13 Wetland 10-15 0.16
4 57 4 21 4 06 3 74 4 73 4 63 4 57
3.15 3.24 3.58 3.03 3.90 3.99 3.96

534 J.B. YAVITT AND R. M. NEWTON
We found a distinct decrease of pH with increasing depth in the forest soil, thereby resulting in the lowest pH in the mineral horizon. In contrast, most Spodosols in coniferous forests show the lowest pH value (e.g. < 4.0) in the Oi horizon (el. Sanborn and Lavkulich, 1989). At Woods Lake, the Oi horizon is composed predominantly of deciduous leaf litter, which alone does not preclude low pH values (el. Johnson and McBride, 1989). In our case, however, the relatively high pH of the Oi horizon may reflect acid neutralizing capacity derived from the release of base cations from the decomposing leaf litter during the August sampling. In fact, we have measured pH values of < 3.5 of the Oi horizon in early spring and summer when organic matter decomposition and nutrient mineralization were slowed presumably by low temperature.
Exchangeable base cation levels in the forest floor of the forest soil (88 meq kg "I) were much larger than that in the mineral horizon, which had essentially negligible levels ~2 meq kg-l)(Table II). Most of this charge consisted of exchangeable Ca z+. Despite the relatively large base cation content of the forest floor, base saturation was low (39%) whereas base saturation of the mineral horizon was even lower (9.5%). These low values contribute to the acidic nature of soil water, especially in soils where the contact time between acid water and exchange sites is short and exchange reactions are not complete (David et al., 1988).
Table II
Comparison of pH and exchangeable cations and acidity by soil type
Soil type pH Ca 2+ Mg 2+ K + Na + Acidity
(meq kg -I Forest soil
O horizons 4.06 69 6 6 6 140 E, B horizons 3.74 0.5 0.2 0.2 0.4 12
Wetland soil 4.60 19 6 15 2 1005
The wetland soils had exchangeable base cation levels (42 meq kg -I) (Table II) that were typical of ombrotrophic bogs (i.e. pH < 4.5; Ca z+ = 130 meq kg-l)(Malmer and Sjors, 1955; Pakarinen and Tolonen, 1977). These systems characteristically have water and nutrients derived entirely from atmospheric deposition, and groundwater input is neglig- ible. In addition, drainage waters from ombrotrophic bogs usually have acidity derived from high concentrations of dissolved organic carbon (Gorham et al, 1985).
3.2 Limestone determinations and bulk soil responses to limestone addition
Measurements of limestone in the forest soils 6 mo after the additions showed that much of the added limestone still remained in the top 15 cm
LIMING EFFECTS ON CHEMICAL AND BIOLOGICAL PARAMETERS 535
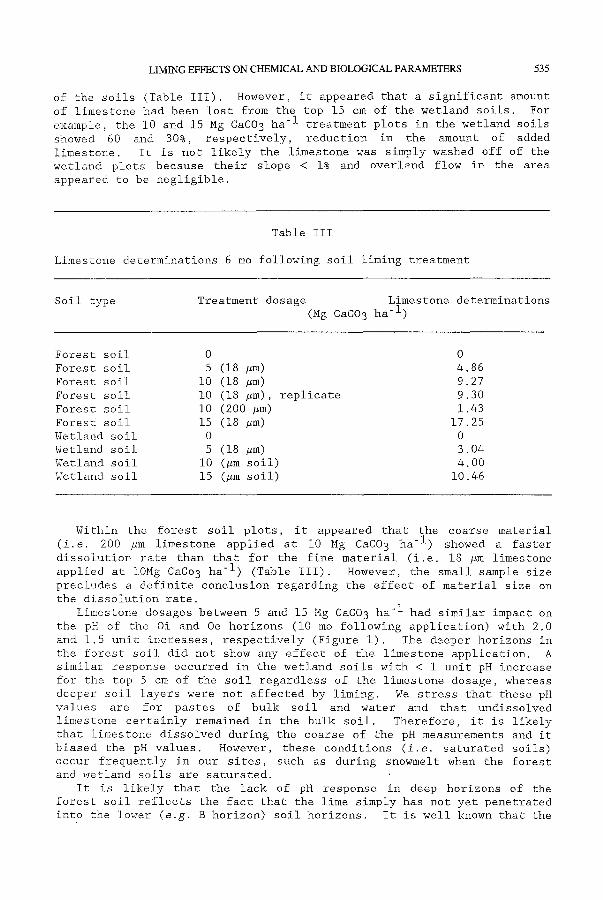
of the soils (Table III). However, it appeared that a significant amount of limestone had been lost from the top 15 cm of the wetland soils. For example, the i0 and 15 Mg CaCO 3 ha -I treatment plots in the wetland soils showed 60 and 30~, respectively, reduction in the amount of added limestone. It is not likely the limestone was simply washed off of the wetland plots because their slope < i~ and overland flow in the area appeared to be negligible.
Table III
Limestone determinations 6 mo following soil liming treatment
Soil type Treatment dosage Limestone determinations (Mg CaCO 3 ha -1 )
Forest soil 0 0 Forest soil 5 (18 #m) 4.86 Forest soil I0 (18 #m) 9.27 Forest soil i0 (18 #m), replicate 9.30 Forest soil i0 (200 #m) 1.43 Forest soil 15 (18 #m) 17.25 Wetland soil 0 0 Wetland soil 5 (18 #m) 3.04 Wetland soil i0 (#m soil) 4.00 Wetland soil 15 (~m soil) 10.46
Within the forest soil plots, it appeared that the coarse material (i.e. 200 #m limestone applied at I0 Mg CaCO 3 ha -1 ) showed a faster dissolution rate than that for the fine material (i.e. 18 #m limestone applied at 10Mg CaCo 3 ha -1 ) (Table III). However, the small sample size precludes a definite conclusion regarding the effect of material size on the dissolution rate.
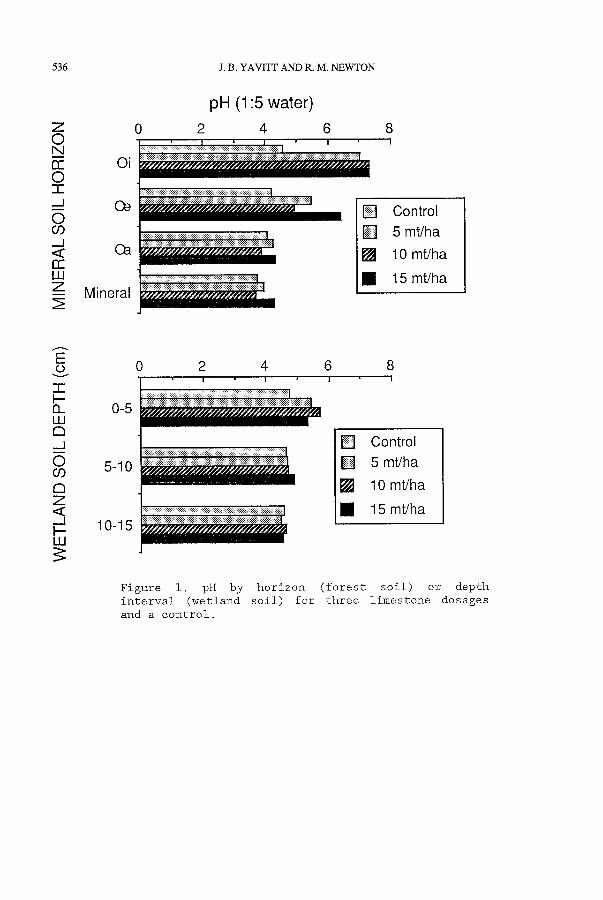
Limestone dosages between 5 and 15 Mg CaCO 3 ha -I had similar impact on the pH of the Oi and Oe horizons (i0 mo following application) with 2.0 and 1.5 unit increases, respectively (Figure i). The deeper horizons in the forest soil did not show any effect of the limestone application. A similar response occurred in the wetland soils with < 1 unit pH increase for the top 5 cm of the soil regardless of the limestone dosage, whereas deeper soil layers were not affected by liming. We stress that these pH values are for pastes of bulk soil and water and that undissolved limestone certainly remained in the bulk soil. Therefore, it is likely that limestone dissolved during the coarse of the pH measurements and it biased the pH values. However, these conditions (i.e. saturated soils) occur frequently in our sites, such as during snowmelt when the forest and wetland soils are saturated.
It is likely that the lack of pH response in deep horizons of the forest soil reflects the fact that the lime simply has not yet penetrated into the lower (e.g. B horizon) soil horizons. It is well known that the
536 J.B. YAVITI' AND R. M. NEWTON
Z 0 2 O N ~_ 0i O -r" J 0e O O3 J < 0a r r ILl
i ii~i~iiiiiii~iii~iii@i!`~i!iFi!i!iii!i!~:!i!i!`:~i~i~i~!~!!~!!i!i~!~!!i~i~i~i~i~i~i!i~i~i~i~iii~i~
j
pFI (1:5 water)
4 8 -1
] Control
5 mt/ha
~J 10 mt/ha
/ 15 mt/ha
E O
v
-i-
n LU n J
O o0 E3 Z < J } - uJ
0-5
5-10
10-15
0 2 4 6 I I I
f~l '
J
[ ] Control
[ ] 5 mt/ha
[ ] 10 mr/ha
[ ] 15 mt/ha
Figure i. pH by horizon (forest soil) or depth interval (wetland soil) for three limestone dosages and a control.

LIMING EFFECTS ON CHEMICAL AND BIOLOGICAL PARAMETERS 537
rate of limestone dissolution in soil is increased by low pH, high moisture content, fine particle size, and high pCO 2 levels (Nye and Ameloko, 1987). In our studies it appears that limestone particles have essentially "cemented together," which has reduced their surface area and resulted in a much more recalcitrant material than the fine particles deposited on the soil surface. If this lime layer continues to dissolve very slowly, then the entire layer may become buried in the soil and penetrate into deeper soil horizons as the soil continues to develop. Based on the early results to date, the rate appears to be ca. I cm yr -I (i.e. the depth to the Oe horizon in one year).
Because of the slow rate of lime penetration, exchangeable soil base cation levels in the soil bags, containing B horizon material, placed at the Oa/mineral-horizon interface did not show any evidence of liming (Table IV). We now expect that it will take several years for the limestone to ~enetrate the soil to the depth of the soil bags, at which time their Ca =+ contents should increase markedly; of course, a marked response in exchangeable Ca 2+ levels might occur earlier if dissolved Ca 2+ is passed to the soil bags in drainage waters.
Table IV
Chemical characteristics of B horizon soil incubated in "soil bags" for I0 mo following soil liming treatment
Limestone dosage Ca 2+ Mg 2+ K + Na + Acidity (Mg CaCO 3 ha -1 ) (meq kg -I)
0 0.5 0.3 0.2 0.4 12 5 0.7 0.2 0.2 0.4 13
i0 0.6 0.3 0.2 0.4 12 15 0.8 0.3 0.2 0.4 12
Lime was not visible on the surface of the wetland plots, suggesting more rapid dissolution of limestone than in the forest soil plots. Furthermore, complete dissolution of a limestone dosage as large as 15 Mg CaCO 3 ha -I would result in a large increase of exchangeable Ca 2+ levels in the soil. Preliminary data suggest that this ma X be true as the limed soils had exchangeable Ca 2+ levels of 600 meq kg -I (C.P. Gubala, pers. comm.), which would account for about 50% of the applied limestone~
3.3 Net N mineralization, nitrification and denitrification
Net N mineralization in the forest soil (Oe + Oa horizons) increased 50 to 75% following liming (Table V), and 2.6- to 3.7-fold increases in nitrification were observed. Net N mineralization in the wetland soil was extremely low and unresponsive to liming. Soils in ombrotrophic sys- tems often have very low N contents (Urban and Eisenreich, 1988), which may be more important than acidity in limiting net N mineralization.

538 J.B. YAVITT AND R. M. NEWTON
Table V
Rates of net N mineralization and net nitrification by soil type i0 mo following soil liming treatment
Soil type Limestone dosase (Mg CaCO 3 ha -~)
Net Nitrification Net N Mineralization (#g N g-i d-l)
Forest soil 0 2.8 9.6 Forest soil 5 10.3 16.3 Forest soil i0 7.4 14.4 Forest soil 15 7.4 14.9 Wetland soil 0 0.03 Wetland soil 5 0.01 Wetland soil i0 0.02 Wetland soil 15 0.01
The increased rates of net N mineralization and especially nitrifica- tion in the forest soil are not trivial because enhanced rates of nitri- fication might lead to increased NO 3- flux through the soil. This result has two important implications regarding surface water quality. First, NO 3- is a "mobile anion" (sensu Reuss and Johnson, 1985). Therefore, the flux of NO 3 - through the soil, if accompanied by limestone-derived Ca 2+, might facilitate the movement of exchangeable Ca 2+ into deep soil horizons. A basic premise of this study is that Ca 2+ input into the mineral horizon of the soil would increase the soil base saturation as well as the soil's buffering capacity of exchangeable base cations which would increase acid neutralizing capacity (ANC) of surface waters. A second important implication of increased nitrification in the soil following liming is the effect of NO 3- on surface water quality, including NO 3- levels in drinking water and eutrophication.
Traditionally, nitrification has been considered to be limited in low pH forest soils because acidity inhibits autotrophic nitrifiers (Keeney, 1980). Therefore, liming of acidic soils should enhance nitrification rates by mitigating the acidity limitations. However, the nitrification rates in our unlimed, acidic soils (Table V) are toward the high end of rates measured in a broad spectrum of temperate and tropical forest soils (cf. Robertson, 1982). In fact, Kreitinger et al. (1985) suggested that the high rates of nitrification in Adirondack Spodosols are not the result of classieal autotrophic nitrifiers, but that a methylotrophic- type organism is responsible.
It appears that enhanced nitrification following liming might have been the result of increase NH4 + levels in the soil rather than amelioration of acidity. Robertson (1984) showed that NH4 + additions stimulated nitrification in a relatively low pH tropical soil, whereas liming did not stimulate nitrification. Furthermore, Nyborg and Hoyt (1978) found that liming doubled rates of net N mineralization of soil regardless whether the soil was acidic or nonacidic, initially, thus reinforcing this notion.

LIMING EFFECTS ON CHEMICAL AND BIOLOGICAL PARAMETERS 539
Whether the increased levels of NO 3- that we observed in the forest soil influence surface water quality depends on denitrification, which would reduce the NO 3- to a nonreactive, gaseous produce (i~e., N 2 and N20 ) . Denitrification activity in the forest soil was located largely in the Oa horizon (Figure 2). Furthermore, N20 production under anoxic conditions in the Oa horizon was more than an order of magnitude greater than that under oxic conditions (data not shown), indicating the importance of denitrification over nitrification as the source of N20. Probably anaerobic sites exist in the Oa horizon which facilitate the growth and activity of denitrifying microorganisms.
It is possible that NO 3- produced under oxie conditions in the 0e horizon can be denitrified completely under anoxic conditions in the 0a horizon, thereby preventing its flux into the B horizon. For example, we calculated nitrification of 0.8 kg N ha "I d -I in the unlimed forest soil and 3.1 kg N ha -I d -I following soil liming. In contrast, the measured rate of denitrification potentially can consume 29 kg N ha -I d -1, which appears to be more than enough to prevent NO 3- leaching from the forest soil, even following soil liming.
Similarly, NO 3- flux in the wetland soils may be influenced by denitrification (Figure 2). However, the relatively large rates of denitrifieation we measured may be anomalous and much larger than those occurring naturally in the field. For example, the low rates of net N mineralization in the soils suggest that NH4 + levels might not be large enough to support nitrification, thus NO 3- availability would limit denitrification. It is possible that the sampled peat was exposed to 02 during preparation in the laboratory, and the 02 stimulated nitrification, followed by denitrification when exposed to anoxic conditions. Nitrification-denitrification are known to occur simultaneously in flooded systems where both aerobic and anaerobic zones exist (Reddy and Patrick, 1984).
3.4 CO 2 production potential
Carbon dioxide production potentials of the forest and wetland soils (unlimed conditions) were greatest at the surface and decreased with increasing depth (Figure 3). This pattern probably was a function of change in the organic substrate with depth. That is, organic matter at the soil surface was the freshest, supported the most active population of respiring microorganisms, and thus had the largest CO 2 production potential.
Within the forest soil plots, CO 2 production potentials decreased sharply with increasing limestone dosage, especially for the Oi horizon (Figure 3). Otherwise, liming had little effect on CO 2 production potentials for the other forest soil horizons. A similar pattern was observed in the wetland soil plots, except that the 15 Mg CaCO 3 ha -I treatment did not appear to substantially limit CO 2 production.
It is certainly true that a portion of the CO 2 produced in the Oi horizons (with undissolved limestone) was consumed by limestone dissolution during the course of the incubation period (cf. Warfvinge and Sverdrup, 1989), thereby preventing CO 2 accumulation in the headspace of the flask and suggesting an apparent reduction in the CO 2 production potential. It is also possible that the limestone addition at least partially inhibited CO 2 production via microbial respiration. For example, soil liming may have increased the soil pH to toxic levels (e.g.

540 J.B. YAVITT AND R. M. NEWTON
DENITRIFICATION POTENTIAL (pmol/g/d) Z 0 5 0
L ~ o~ © "r"
O-- ~////////////,,@,~ O 0 !i ~:!: ~ii:!:!i ~i ~:i:iiiiii!i~i ~:i:iii!~:!:!i ~:~:! i i $!: !ilia:! :ii ~:i:ii~:i:i:iiiili!: !: ~i!iiiii!: :i:ii!:ii~i~i!: I J !~:i:~!i~:~:~:~i~!~!i~i~i~i~i~:~i~i~i~i~!!i~i~i!i!i~:i!~i~i~i~i~i~i~i~i~i~i~i~i~i~i~i~i~:~i~i~ii!~ < Oa
LLI
Z Mineral
10 15 I I
[ ] Control [ ] 5 mt/ha
[ ] 10 mt/ha
[ ] 15 mt/ha
E 0
v
w
d
0
Z < .J
w
0 5 10 I I
o-5
10-15
15 I
[ ] Control [ ] 5 mt/ha
[ ] 10 mt/ha
[ ] 15 mt/ha
Figure 2. Denitrification by horizon (forest soil) or depth interval (wetland soil) for three limestone dosages and a control.

LIMING EFFECTS ON CHEMICAL AND BIOLOGICAL PARAMETERS 541
Z
0 U rr 0 "l- J Oe 0 o9 J ,< Oa rr w Z Mineral
RESPIRATION POTENTIAL (Bmol/g/d)
0 20 40 60 80 I ' ' I ' ' I ' ' I I ::::::::::::::::::::::::::::::::::::::::::::::::::::: ~::! :! ::.! !:! :.! ! i ~ + ~ l
O i ...........................
[ ] 5 mt/ha
[ ] 10 rot/ha
• 15 rot/ha
E O
v
I k- D_ W 0 _J
0 o9 a Z
_J
w
0-5
5-10
10-15
0 20 40 60 80
[ ] Control [ ] 5 mt/ha
[ ] 10 mr/ha
• 15 mr/ha
Figure 3. Carbon dioxide production potential expressed as respiration potential by horizon (forest soil) or depth interval (wetland soil) for three limestone dosages and a control.

542 J.B. YAVITT AND R. M. NEWTON
pH of 7) for the population of microorganisms adapted to acidic conditions. The interface of dissolving limestone and acid soil should maintain a pH of 7, which is that of CaCO 3 in equilibrium with soil at pCO 2 = 0.005 atm and Ca 2+ = I0 -2 M (Nye and Ameloko, 1987). The pH gradient away from the limestone may extend over 0.5 cm before reaching naturally acidic levels (Nye and Ameloko, 1987). It is possible that that inhibition of microbial activity by soil liming might be a short- term response as new populations adapt to the higher pH levels. Changes in CO 2 production potentials have at least two implications to ANC of surface waters. Reduced CO 2 production would lower soil pCO 2 levels, which would (i) result in a slower rate of limestone dissolution, and (ii) less production of alkalinity from mobile HC03-. This problem may persist if large amounts of undissolved lime continue to penetrate into deep soil layers.
3.5 Soluble sulfate
Dissolved S042- levels in the wetland soils were similar among the unlimed wetland plot (105 #mol L -I) and the 3 limestone treated plots (92, 93 and 105 #mol L -I for 5, I0 and 15 Mg CaCO 3 ha -1 , respectively). The similarity of values suggests that dissimilatory sulfate reduction (Howarth and Teal, 1980) was not stimulated by liming, at least, not to the degree that the soluble S042- pool size was depleted. Thus, the production of HS- does not appear to be an important factor leading to an increase in ANC in the wetland soils.
We did not investigate the effect of liming on SO42- in the forest soil plots because of the large research effort required, including measurement of S transformations and transfer between organic and inorganic pools (cf. Schindler et al., 1986). Unfortunately, this effort was beyond the scope of the present study. However, studies in the literature suggest that liming increases levels of mobile S042- in drainage waters, at least, initially following the limestone application (cf. Bolan et al., 1988). The effect may be directly caused by lime desorbing mobile S042- from soil exchange sites or else by increasing the rate of sulfate mineralization. Mobile S042- can acidify surface waters if base cations are not leached concomitantly.
4. Summary and Conclusions
Soil liming is expected to be a viable approach to neutralizing acidic soil water (cf. Tervet and Harriman, 1988), thus providing long-term restoration of lakes and streams in acid-sensitive regions. Because several processes (e.g. rate of limestone dissolution, limestone particle size, time of application, and soil type) probably are important (cf. Warfvinge and Sverdrup, 1989), predicting the response may be difficult.
Our results suggest that, at least for the local conditions, the rate of limestone dissolution is extremely slow especially in mineral soils (e.g., the forest soil plots) but that faster dissolution rates for limestone may occur in saturated wetland soils. For this reason, the benefit of soil liming will be realized immediately only if soil water remains in contact with the undissolved limestone "hung up" in the surface of the forest soil. This depends on the flow path of water through the soil, which may show overland flow (i.e. through the 0

LIMING EFFECTS ON CHEMICAL AND BIOLOGICAL PARAMETERS 543
horizons) especially during the spring snowmelt period (cf. Newton and Driscoll, 1987). Otherwise, the contact time between soil water and the undissolved limestone may be relatively short. The real benefit of soil liming to neutralize surface water acidity may be realized over long periods of time as a result of reestablishing the soil's buffering capacity.
Acknowledgments
We especially thank V. Blette for excellent assistance in the laboratory. This study was funded as part of the Experimental Watershed Liming Study (EWLS) by the Electric Power Research Institute and the Empire State Electric Research Corporation.
References
April R. and Newton, R.M.: 1985, Water, Air, and Soil Pollut. 26, 373. Boland, N.S., Syers, J.K., Tillman, R.W. and Scotter, D.R.: 1988, J. Soil
Sci. 39, 493. Brown, D.J.A.: 1988 Environ., Pollut. 54, 275. David, M.B., Reuss, J.O. and Walthall, P.M.: 1988, Water, Air, and Soil
Pollut. 38, 71. Davis, J.E.: 1988, Water Resour. Res. 24, 525. Driscoll, C.T. and Newton, R.M.: 1985, Environ. Sci. Technol. 29, 1018. Geelen, J.F.M. and Leuven, R.S.E.: 1986, Experientia 42, 486. Goldstein, R.A., Gherini, S.A., Chen, C.W., Mok, L. and Hudson, R.J.M.:
1985, Philos. Trans. R. Soc. Londson, Set. B. 305, 409. Gotham, E., Eisenreich, S.J., Ford, J. and Santelmann, M.V.: 1985, "The
chemistry of bog waters," in Stumm, W. (ed) Chemical Processes in Lakes, John Wiley and Sons, New York.
Howarth, R.W. and Teal, J.M.: 1980, Am. Nat. 116, 862. Johannes, A.H., Altwicker, E.R. and Clesceri, N.L.: 1985, Water, Air, and
Soil Pollut. 26, 339. Johnson, M.G. and McBride, M.B.: 1989, Soil Sci. Soc. Am. J. 53, 482. Keeney, D.R.: 1980, For. Sci. 26, 159. Keeney, D.R. and Bremner, J.M.: 1966, AEron. J. 58, 498. Keeney, D.R. and Nelson, D.W.: 1982, Agronomy 9, 643. Kreitinger, J.P., Klein, T.M., Novick, N.J. and Alexander, M.: 1985, Soil
Sei. Soe. Am. J. 49, 1407. Malmer, N. and Sjors, H.: 1955, Bot. Not. 108, 46. Moore, P.D. and Bellamy, D.J.: 1974, Peatlands, Springer-Verlag, New
York. Newton, R.M. and Driscoll, C.T.: 1987, EOS Tran. Am. Geophys. Union 68,
304. Newton, R.M., Weintraub, J. and April, R.: 1987, BioEeochemistry 3, 21. Nye, P.H. and Amelko, A.Y.: 1987, J. Soil Sci. 38, 641. Nyborg, M. and Hoyt, P.B.: 1978, Can. J. Soli Sci. 58, 331. Pakarinen, P. and Tolonen, K.: 1977, Lindbergia 4, 27. Porcella, D.B.: 1989, Can. J. Flsh. Aquat. Sci. 46, 246. Reddy, K.R. and Patrick, W.H., Jr.: 1984, GRC Grit. Rev. Environ. Control
13, 273. Reuss, J.O. and Johnson, D.W.: 1985, J. Environ. Qual. 14, 26.

544 J.B. YAVITT AND R. M. NEWTON
Reuss, J.O. and Johnson, D.W.: 1986, Acid Deposition and the Acidification of Soils and Waters, Spring-Verlag, New York.
Robertson, G.P.: 1982, Philos. Trans. R. Soc. London, Set. B. 296, 445. Robertson, G.P.: 1984, Oecologia 61, 99. Sanborn, P. and Lavkulioh, L.M.: 1989, Soil Sci. Soc. Am. J. 53, 511. Schindler, S.C., Mitchell, M.J., Scott, T.J., Fuller, R.D. and Driscoll,
C.T.: 1986, Soil Sci. Soc. Am. J. 50, 457. Schofield, C.L. and Driscoll, C.T.: 1987, Biogeoehemistry 3, 63. Stokes, P.M.: 1986, Water, Air, and Soil Pollut. 30, 421. Staubitz, W.W. and Zarriello, P.J.: 1989, Can. J. Fish Aquat. Sci. 46,
268. Tabatabai, M.A. and Dick, W.A.: 1983, J. Environ. Qual. 12, 209. Tervet, D.J. and Harriman, R.: 1988, Aquaeult. Fish. ManaEe. 19, 191. Thomas, G.W.: 1982, Agronomy 9, 159. Ugolini, F.C. and Dahlgren, R.A.: 1987, "The mechanism of podzolization
as revealed by soil solution studies," in Righi, D. and Chauvel (eds), Podsols et Podsolisation, AFES et INRA, Paris.
Urban, N.R. and Eisenreich, S.P.: 1988, Can. J. Bot. 66, 435. Warfvinge, P. and Sverdrup, H.: 1989, Soil Sei. Soc. Am. J. 53.44.
Westermnn DT and Crothers, S.E.; 1980, Agron. J. 72, 1009. Wright, R.F.: 1985, Can. J. Fish. Aquat. Sci. 42, 1103. Yoshinara, T., Hynes, R. and Knowles, R.: 1977, Soil Biol. Bioehem. 9,
177.