soils of peatlands: histosols and gelisols - us forest … · soils of peatlands: histosols and...
TRANSCRIPT

277
10Soils of Peatlands: Histosols and Gelisols
Randy Kolka, Scott D. Bridgham, and Chien-Lu Ping
Introduction
Peatlands are a subset of wetlands that have accumulated significant amounts of soil organic matter. Soils of peatlands are colloquially known as peat, with mucks referring to peats that are decomposed to the point that the original plant remains are altered beyond recognition (Chapter 6, SSSA 2008). Generally, soils with a surface organic layer >40 cm thick have been classified as Histosols in the U.S. soil classification system—Soil Taxonomy (Soil Survey Staff 2014). Permafrost-affected organic soils are classified as the Histels sub-order in the Gelisols order (Soil Survey Staff 2014). Based on current calculations of earth’s land surface of 148,940,000 km2 and our estimate of peatland area (or the combined area of Histosols and Histels) (Table 10.1), peatlands occupy about 2.7% of the earth’s surface.
Peatlands have historically been classified based on a number of criteria, such as topog-raphy, ontogeny (i.e., landscape developmental sequence), hydrology, soil and/or water chemistry, plant community composition, and degree of soil organic matter decompo-sition (Moore and Bellamy 1974; Cowardin et al. 1979; Gore 1983; Bridgham et al. 1996; National Wetlands Working Group 1997; Inisheva 2006; Vitt 2006). Given the confusion in peatland terminology and the emphasis of this chapter on soils, we will discuss here only the dominant ecological paradigm in peatlands—the ombrogenous–minerogenous gradi-ent. Although the fundamental definition of this gradient is based on hydrology, it is often
CONTENTS
Introduction .................................................................................................................................277Geographic Distribution ............................................................................................................ 279
Global Peatlands ..................................................................................................................... 279Global Carbon Storage in Peatlands ....................................................................................280Gelisols ..................................................................................................................................... 282Comparison of Four Classification Schemes ...................................................................... 282
Hydrology ....................................................................................................................................283Hydrology and Peatland Development ..............................................................................283Hydrology and Peat Characteristics ....................................................................................284
Peat Biogeochemistry: A Comparative Approach .................................................................. 287Conterminous U.S. Peats: The Ombrogenous–Minerogenous Gradient ....................... 287Alaskan Peatlands: Histosols and Gelisols ......................................................................... 301
Conclusions ..................................................................................................................................303Acknowledgments ......................................................................................................................304References ....................................................................................................................................304
© 2016 by Taylor & Francis Group, LLC

278 Wetland Soils
thought to be coincident with (and a primary control over) plant community composition and the biogeochemistry of peatland soils (Bridgham et al. 1996).
Minerogenous peatlands have significant inputs of groundwater and/or upland run-off, generally imparting higher basic cation content and pH to their soils (Heinselman 1963; Moore and Bellamy 1974). These peatlands are generally called fens, whereas treed minerogenous peatlands are often termed swamp forests in North America, although this latter term is also used to describe forested wetlands on mineral soils (National Wetlands Working Group 1997). In contrast, ombrogenous peatlands, through deep accumulation of peat, have achieved a landscape topographic position where they are isolated from all but atmospheric inputs of water, alkalinity-generating cations, and nutrients. As a result, they have low ash and basic cation content and low pH in their soils, and are commonly termed bogs. Fens exhibit a wide range of minerotrophy due to complicated interactions between hydrology, topographic landscape position, and chemistry of surrounding and/or underlying mineral soils and groundwater (Bridgham and Richardson 1993; Bridgham et al. 1996; Verry 1997, 2006). For example, a region where mineral soils are dominated by sand with very low exchangeable cations can have fens with significant groundwater input but soil chemistry and plant communities more characteristic of bogs.
Fens with more minerogenous characteristics (i.e., higher soil pH and basic cation con-tent) are generally described as “rich,” whereas those more similar to bogs in soil chemis-try and plant community composition are called “poor.” Bridgham et al. (1996) objected to terms such as rich and poor fens, because they essentially describe a gradient of pH and basic cation concentration, while most studies have pointed to nitrogen and/or phospho-rus as the limiting nutrients for plant growth in peatlands. They suggested that nutrient availability gradients may not be coincident with the ombrogenous–minerogenous gradi-ent; experimental results have demonstrated that nitrogen availability is greater in more minerogenous peatlands, whereas phosphorus availability is higher in more ombrogenous peatlands (Bridgham et al. 1998; Chapin 1998), although recent research using enzymes as indicators of nutrient availability indicated that phosphorus was more limited than nitro-gen across a ombrogenous–minerogenous gradient in northern Minnesota (Hill et al. 2014).
TABLE 10.1
Current and Historical Global Peatland Area (in 103 km2)
Regionsa Current Historical
Alaskab 132 132Canadab 1136 1150Mexicob 10 –USc,b 93 111North Americab 1372 1407Northern 3728d 4045e
Tropical 285f 441g
Global 4013 4486
a Includes both permafrost and non- permafrost peatlands.b Bridgham et al. (2006).c Not including Alaska.d Historical area—loss of 316,000 km2 reported in Joosten (2009).e Includes all non-tropical peatlands in Northern and Southern
Hemispheres (Yu et al. 2010).f Historical area—loss of 156,000 km2 reported in Joosten (2009).g Page et al. (2011).
© 2016 by Taylor & Francis Group, LLC

279Soils of Peatlands
The effect of permafrost on peatlands is dramatic, lending support to defining the soil suborder Histels for permafrost-affected organic soils. The formation and development of several major peatland types are the direct result of permafrost action (Zoltai and Tarnocai 1971; Moore and Bellamy 1974; National Wetlands Working Group 1988; Botch et al. 1995; Ahrens et al. 2004). Additionally, soil carbon pool sizes, distribution, and bioavailability are strongly affected by (1) cryoturbation, which is the soil-mixing action of freeze/thaw processes, and (2) by the presence of permafrost itself, which has strong controls over soil temperature and moisture and runoff (Michaelson et al. 1996). Overall, permafrost-affected soils represent 16% of all soils on the globe, and contain up to 50% of the global belowground soil carbon pool (Tarnocai et al. 2009).
The literature on peatlands is vast, and we focus here only on the soils, particularly within the context of the ombrogenous–minerogenous gradient and the effects of perma-frost. The objectives of this chapter are to: (1) summarize the geographic distribution of the world’s peatlands, (2) describe Gelisols as defined in Soil Taxonomy and compare it to classifications of other countries and organizations, (3) examine the effects of the physi-cal structure and botanical composition of various peats on their hydrologic properties, and (4) compare the physical and chemical characteristics of peats in U.S. wetlands from Florida to Alaska, with an emphasis on the ombrogenous–minerogenous gradient for Histosols and the defining characteristics due to permafrost in Gelisols.
Geographic Distribution
Global Peatlands
Ground-based estimates, remote sensing, and hydrological modeling have all been used to estimate the regional distribution and global area of wetlands (reviewed in Lehner and Döll 2004; Bridgham et al. 2006; Melton et al. 2013), but it is likely that ground-based esti-mates most effectively delineate peatlands from other wetland types (cf. Lehner and Döll 2004). There are two distinct peaks of wetland area in the tropical and boreal zones, with tropical wetlands being primarily mineral-soil based and boreal wetlands being primarily peatlands (Figure 10.1). It is interesting that, while northern climates are clearly conducive to peat formation, large areas of tropical peatlands do exist (Table 10.1)—for example, very deep peat deposits occur in Indonesia and the Amazon (Page et al. 2011). Remote sensing techniques suggest that the area of tropical wetlands may have been formerly underesti-mated (Gumbricht 2012).
Table 10.2 gives the distribution of organic soils within the U.S. There are two related databases maintained by the USDA that provide the best available estimates of organic soil area in the U.S. (Soil Survey Staff 1998). MUIR (Map Unit Interpretation Record) contains digitized soil maps at a scale of 1:12,000–1:31,680, but large areas of certain states have not had soil surveys completed. This includes states such as Michigan and Minnesota that have large expanses of organic soils. In the STATSGO (State Soil Geographic) data base, other sources of information are used to estimate soil information in unmapped areas, but the scale is at 1:250,000, except Alaska, which is at 1:1,000,000. In states that are poorly mapped, STATSGO data are necessary to obtain realistic estimates of peatland area. However, because of the coarse scale, STATSGO fails to recognize many small pockets of organic soils. Consequently, it was deemed most accurate to take the highest estimate of
© 2016 by Taylor & Francis Group, LLC

280 Wetland Soils
STATSGO or MUIR for each state (Soil Survey Staff 1998). Total organic soil area in the U.S. is 234,006 km2 (Table 10.2), with Alaska alone accounting for 56% of all peatlands. Excluding Alaska, the two regions with the most organic soils are the Midwest and South. In particular, large areas of peatlands occur in Michigan, Minnesota, Wisconsin, Florida, Louisiana, and North Carolina.
The distribution of Alaskan peatlands into Histosols and Gelisols demonstrates that 67% of its peatlands are affected by permafrost. Tarnocai (1998) estimated that 36% of Canadian peatlands had permafrost features (Organic Cryosols). In particular, significant areas of peatlands occur in the zone of discontinuous permafrost (Gorham 1991). Mosses and black spruce tend to enhance permafrost formation in this discontinuous zone (Van Cleve et al. 1991; Camill and Clark 1998).
Global Carbon Storage in Peatlands
Although peatlands only occupy approximately 2.7% of the terrestrial land surface, they represent a globally significant carbon pool because of the deep organic soil deposits that have accumulated over thousands of years. Gorham (1991) estimated that boreal and sub-arctic peatlands contain 455 Pg C (1 Pg = 1015 g). This is very similar to the global peatland carbon pool of 462 Pg estimated by Bridgham et al. (2006). In comparison, Yu et al. (2010) estimated that Northern Hemisphere boreal and subarctic peatlands contain 547 Pg C, tropical peatlands contain 50 Pg C, and Patagonia peatlands contain 15 Pg C, for a total of 612 Pg C. Histels alone are estimated to contain 184 Pg C (Tarnocai et al. 2009), and thus contain a substantial fraction of world’s peatland carbon.
Peat deposits of the boreal region tend to be deeper than those of the subarctic, and the boreal region has higher long-term net carbon accumulation rates (Ovenden 1990; Gorham 1991; Botch et al. 1995; Ping et al. 1997a; Bridgham et al. 2006; Kolka et al. 2011). On aver-age, long-term accumulation rates in subarctic and boreal peatlands were estimated to be 7–11 and 23–41 g m−2 yr−1, respectively (Ovenden 1990). Carbon accumulation rates ranged from 12 g m−2 yr−1 in Arctic peatlands to 80 g m−2 yr−1 in more minerotrophic mires in the boreal and temperate zones of the former Soviet Union, with an average of 30 g m−2 yr−1 (Botch et al. 1995). Bridgham et al. (2006) estimated the mean carbon accumulation rate to
700
20
40
60
80
100
120
140
50 30 10 10Latitude
30
BogFenSwampMarshFloodplainLake
Wet
land
are
a (1
04 km
2 )
50 70 90 S90 N
FIGURE 10.1 Global wetland area in 10° latitudinal belts for various wetland types. (Modified from Aselmann, I. and P. J. Crutzen. 1989. J. Atmos. Chem. 8: 307–359. With permission from Kluwer Academic Publishers.)
© 2016 by Taylor & Francis Group, LLC

281Soils of Peatlands
be 7.1 g m−2 yr−1 for the conterminous U.S. while Kolka et al. (2011) synthesized the litera-ture and reported a range from 0.7 to 42 g m−2 yr−1 across all Histosols with rates generally increasing with decreasing latitude.
Although peatlands are generally sinks for atmospheric carbon, they are also impor-tant sources of greenhouse gases. Wetlands are an important land use that is tracked
TABLE 10.2
Area of Organic Soils (km2) in the United States
State Histosol Dataa Histel State Histosol Data Histel
Midwest SouthIllinois 356 M – Alabama 809 S –Indiana 1490 S – Arkansas – M –Iowa 301 M – Florida 15,943 S –Kansas – M – Georgia 1879 S –Michigan 16,511 S – Kentucky – M –Minnesota 24,345 S – Louisiana 9537 M –Missouri 51 M – Mississippi 908 S –Nebraska 44 M – North Carolina 6339 S –North Dakota 26 M – Puerto Rico 28 M –Oklahoma – M – South Carolina 650 S –South Dakota – M – Tennessee – M –Wisconsin 13,476 S – Texas 52 M –Total 56,601 Virginia 549 S –
Total 36,693Northeast WestConnecticut 434 S – Alaska 43,201 S 88,994Delaware 356 S – Arizona – M –Maine 3965 S – California 617 S –Maryland 949 M – Colorado 335 S –Massachusetts 1364 M – Hawaii 1920 M –New Hampshire 899 M – Idaho 236 S –New Jersey 732 M – Montana 260 S –New York 3131 S – Nevada 74 S –Ohio 309 S – New Mexico 1 M –Pennsylvania 163 M – Oregon 329 S –Rhode Island 119 S – Utah 28 S –Vermont 270 M – Washington 790 M –West Virginia – M – Wyoming 30 M –Total 12,692 Total 47,821 88,994
Source: Adapted from Soil Survey Staff. 1998. Query for Histosol Soil Components in the National MUIR and STATSGO Data Sets 8/98. Natural Resource Conservation Service, USDA, Lincoln, NE and Statistical Laboratory, Iowa State University, Ames, IA.
Note:Total Peatlands = 234,006.Total Histosols = 153,807.Total Wetland Histosols = 145,012.Total Folists = 8795 km2.a S = STATSGO, M = MUIR. The highest Histosol area was taken from either STATSGO (State Soil Geographic
database) or MUIR (Map Unit Interpretation Record database). Folist and Histel area were taken from STATSGO.
© 2016 by Taylor & Francis Group, LLC

282 Wetland Soils
by countries for Intergovernmental Panel on Climate Change (IPCC) reporting (IPCC 2006). Recently a Wetlands Supplement was produced by the IPCC to better account for greenhouse gas fluxes and changes in carbon pools for managed peatlands (IPCC 2014). Kolka et al. (2011) completed a synthesis of the literature for carbon dioxide and meth-ane fluxes from peatlands across the globe. For natural or unmanaged peatlands, the mean flux of carbon dioxide was 79.5 mmol m−2 d−1 (range 12–152 mmol m−2 d−1), while for methane it was 5.4 mmol m−2 d−1 (range 0.03–18 mmol m−2 d−1). A number of peatland drainage experiments were also included in the synthesis and drainage tends to increase carbon dioxide fluxes by about a factor of three while decreasing methane fluxes by about a factor of three (Moore and Knowles 1989; Nykanen et al. 1995; Strack et al. 2004; Kolka et al. 2011).
Gelisols
Histosol soil classification was discussed in Chapter 6. In this section we will briefly dis-cuss the classification of organic soils in three widely used soil classification systems. In Soil Taxonomy, the U.S. soil classification, organic soils not affected by permafrost are placed in the Histosol order and those affected by permafrost are keyed out in the Histels suborder under the Gelisol order. Great groups of Histels are defined by fiber contents, period of saturation (differentiation of histic vs. folic) and presence of ground ice. In the Canadian system (Soil Classification Working Group 1998), organic soils are recognized at the Organic order, and the ones affected by permafrost are keyed out in the Organic Cryosol great group of the Cryosolic order. Subgroups then are defined by fiber con-tent of the control section or by the depth of peat over mineral soil or ice. In the World Reference Base system (IUSS Working Group WRB 2006), organic soils are recognized at the Reference Soil Group (RSG) as Histosol and those affected by permafrost are placed at the second level with a qualifier as Cryic Histosol. In all three systems, the requirements for Histosols and permafrost-affected Histosols (Histels) are comparable.
Comparison of Four Classification Schemes
By way of comparison, we examine four alternative methods for classifying organic soils from Florida to Minnesota and two histic epipedons from a beaver meadow (Table 10.4 and see Peat Biogeochemistry—A Comparative Approach below). The first method is the USDA protocol (Soil Survey Staff 2014), as described in Chapter 6. The second is the ASTM protocol (ASTM 2013), with sapric, hemic, and fibric peats having 0%–32%, 33%–67%, and >67% dry-mass unrubbed fiber, respectively. The third method is the Canadian protocol (Soil Classification Working Group 1998), with sapric peat having a rubbed fiber content of <10% by volume and a pyrophosphate index (determined on the Munsell color chart after inserting white chromatographic paper into a paste composed of peat and a sodium-pyrophosphate solution) of ≤3, fibric peat having ≥75% rubbed fiber content by volume or ≥40% rubbed fiber by volume and a pyrophosphate index of ≥5, and hemic peat failing to meet the requirements of fibric or sapric peat. The fourth method is the von Post scale (Mathur and Farnham 1985; Parent and Caron 1993; ASTM 2013), where sapric, hemic, and fibric peats have von Post ratings of 7–10, 4–6, and 1–3, respectively.
None of the samples had ≥75% average rubbed fiber content by volume, but most of the bog and acidic fen soils would be classified as fibric in the USDA and Canadian systems based on their pyrophosphate color. Visually these samples were composed predomi-nantly of moderately to undecomposed Sphagnum fibers. Similar results were obtained
© 2016 by Taylor & Francis Group, LLC

283Soils of Peatlands
with the ASTM classification system. The von Post scale gave a greater variety of classifica-tion values for bogs and acidic fens.
The intermediate fens, tamarack swamps, and cedar swamps had hemic peat according to most of the classification systems, whereas the histic epipedon in the beaver meadows, the ash swamp, and the southern peats had sapric material according to one or more of the classification systems. Correlations between the classification systems ranged from an r2 of 0.54 (between von Post and ASTM) and 0.88 (between Canadian and ASTM). Thus, quite different classifications can be given by the different systems, even though peats are only divided into three decompositional categories. Overall, the Canadian system tended to give highest values (i.e., the fewest Saprists and Hemists), and the USDA and von Post systems the lowest values (Table 10.4).
There are 279 Histosol soil series in the U.S. (excluding Folists) (Kolka et al. 2011). Of those series, 9.3% are Fibrists, 29.4% Hemists, and 61.3% Saprists. In comparison, Canadian Histosols (their Organic order) are 36.8% Fibrists (their Fibrisol), 61.8% Hemists (their Mesisol), and only 1.4% Saprists (their Humisol; Tarnocai 1998). The differences between the two countries probably reflect greater decomposition of peats at lower latitudes (see Peat Biogeochemistry—A Comparative Approach below), and the tendency of the Canadian soil classification system to place similar peats into less decomposed categories than the U.S. system, as discussed above.
Malterer et al. (1992) reviewed methods of assessing fiber content and decomposition in northern peats. They compared the von Post method, the centrifugation method of the former Soviet Union (Parent and Caron 1993), the USDA pyrophosphate color test and fiber-volume methods, and the ASTM fiber-weight method. Their analyses indicate that the centrifugation method of the former Soviet Union and the von Post humification field method separate more classes of peat with greater precision than the USDA and the ASTM methods. Stanek and Silc (1977) similarly found the von Post method differentiated more classes of well-humified peat than the rubbed and unrubbed fiber volume methods and the pyrophosphate color test of the USDA.
The pyrophosphate method is not particularly effective at extracting peat humic sub-stances (Mathur and Farnham 1985). Additionally, the use of pyrophosphate color is lim-ited because it is a qualitative variable, although spectrophotometric alternatives exist (Day et al. 1979). Mathur and Farnham (1985) state, “There is little theoretical basis for assuming that the color intensity of a [pyrophosphate] peat extract should be closely related to the extent of humification or that the extraction would be even semiquantitative in the pres-ence of significant amounts of mineral matter.” However, the pyrophosphate color index is reasonably well correlated with other measures of humification in Table 10.5.
Hydrology
Hydrology and Peatland Development
Hydrology is the central factor, by definition, in the formation of all hydric soils, but peat-lands are unique in the degree of autogenic (i.e., biotically driven) feedbacks between plant production and community composition, microbial decomposition, soil biogeochemis-try, and hydrology (Heinselman 1963, 1970; Moore and Bellamy 1974; Siegel 1992; Belyea and Baird 2006). Under waterlogged conditions, especially in northern latitudes as noted
© 2016 by Taylor & Francis Group, LLC

284 Wetland Soils
above, net primary production generally exceeds decomposition, resulting in peat forma-tion. The peat’s botanical source, state of decomposition, bulk density, and depth interact to determine its hydraulic conductivity (Boelter 1969; Päivänen 1973; Silins and Rothwell 1998; Weiss et al. 1998). At some point, accumulation of deep, highly decomposed peat may impede vertical groundwater exchange with the surface layers. Additionally, the forma-tion of peat itself increases water retention. As water retention increases, the peatland expands above the regional water table, and often above the surrounding landscape. At this point, an ombrogenous system has developed, with its characteristic soil chemistry and plant communities. Thus, we see a succession over time in many peatlands from fens to bogs, with an increasing state of ombrotrophy as a result of increasing biotic control over hydrology.
There are climatic limitations on this process: fens can occur in any climate because of their dependence on outside sources of water, whereas bogs can only occur in regions where precipitation exceeds evapotranspiration. The preponderance of peatlands in north-ern latitudes is at least partially due to lower temperatures limiting evapotranspiration, so that peatland formation is favored in areas of even moderate precipitation. However, sub-strate permeability, artesian pressure heads, landform, and other groundwater factors can override macroclimate in the formation of large peatland complexes (Heinselman 1970; Siegel and Glaser 1987). In permafrost regions, drainage is further slowed by the seasonal freeze–thaw cycle, underlying permafrost, and low evapotranspiration rates, especially on north-facing slopes (Rieger 1983) where “hanging bogs” were described. Permafrost may also act as a confining aquatard, creating artesian conditions for groundwater discharge and spring-fed wetlands (Racine and Walters 1994).
Hydrology and Peat Characteristics
As noted above, an important attribute of peats is their ability to hold and retain water. Undecomposed fibric peats are predominantly composed of air- or water-filled pore spaces of large diameter (>600 µm, Boelter 1964; Päivänen 1973; Silins and Rothwell 1998). This, in combination with low-density organic matter, results in a saturated water content often exceeding 1000% of oven-dry mass and 90% of total peat volume (Boelter 1964, 1969; Päivänen 1973; Damman and French 1987) (see Figure 10.2). More decomposed, higher bulk density peats and herbaceous peats have smaller pore spaces and correspondingly lower water-storage capacity under saturated conditions, although they still maintain >80% saturated water content by volume (Boelter 1964, 1969; Päivänen 1973; Silins and Rothwell 1998) (see Figure 10.2). However, water is held in the large pore spaces of fibric peat primarily by detention storage (i.e., easily drainable porosity), and even moderate soil tensions result in large losses of the stored water (Figure 10.2). Similar to mineral soils, more decomposed, higher bulk density peats, with correspondingly smaller diameter pore spaces, have greater water retention under unsaturated conditions, and this differ-ence increases at higher soil tension (Figure 10.2). The different botanical compositions of peats also have an important effect on water-holding capacity and retention (Boelter 1968; Weiss et al. 1998).
Surface peats have horizontal conductivities that are orders of magnitude greater than downward hydraulic conductivities in deeper peats (Päivänen 1973; Ingram 1982, 1983; Gafni and Brooks 1990). An important cause of this anisotropy is that deeper, more decomposed peat layers tend to have lower saturated hydraulic conductivity (Figure 10.3). In peatland terminology, water flow occurs predominantly in the upper, seasonally aerobic layer of the peat, or acrotelm, with very low flow through the deeper, permanently anaerobic layer,
© 2016 by Taylor & Francis Group, LLC

285Soils of Peatlands
0
25
50
75
100
HEMICSAPRIC
Fiber content (% oven-dry mass)
Wat
er c
onte
nt (%
vol
ume)
0 33 67 100FIBRIC
1.5 MPa
0.01 MPa
0.0005 MPa
Saturated
FIGURE 10.2Relationship between fiber content of peat, water content, and soil water potential. Note that the definition for sapric, hemic, and fibric peats is somewhat different than used today in the U.S. (Modified from Boelter, D. H. 1969. Soil Sci. Soc. Am. Proc. 33: 606–609. With permission.)
0
0
1
2
3
4
5
6
7
8
2 4 6Humification
Hyd
raul
ic c
ondu
ctiv
ity (1
0–3 c
m/s
)
8 10
Sphagnum peat
Moss and sedge peat
Reed and sedge peat
FIGURE 10.3 Effect of the botanical composition of peat and degree of humification on saturated hydraulic conductivity of peats. Humification is given in the qualitative von Post scale, where 1 is undecomposed and 10 is extremely decomposed. (Modified from Baden, W. and R. Eggelsmann. 1963. Zulturtech. Flurber. 4: 226–254.)
© 2016 by Taylor & Francis Group, LLC

286 Wetland Soils
or catotelm (Damman 1986). Interestingly, unsaturated hydraulic conductivity is greater in more decomposed peats with smaller-diameter pore spaces (Silins and Rothwell 1998), similar to mineral soils (Brady and Weil 2008). Additionally, the plant composition from which the peat was derived has a dramatic effect on saturated hydraulic conductivity, with reed–sedge peat having the highest conductivity, and Sphagnum peats the lowest within any particular humification class (Figure 10.3). Undecayed Sphagnum moss has very high saturated conductivities, but conductivity decreases rapidly upon humification. Despite the high surface saturated conductivity of peats, horizontal water movement is very slow due to the low slope gradient (Brooks 1992, Chapter 3). A review of the literature indicates peat soil hydraulic conductivities range from greater than 200 × 10−3 cm s−1 in upper bog layers in Minnesota (Gafni and Brooks 1990) to 0.00011 × 10⁻³ cm s−1 in basal blanket peat in England (Holden and Burt 2003, Kolka et al. 2011). Bulk density varied from 0.8 g cm−3 in older lower layers of a Norwegian bog (Ohlson and Okland 1998) to 0.02 g cm−3 in the surface layer of a raised bog in New Brunswick (Korpijaako and Radforth 1972; Kolka et al. 2011).
These properties of peats have important ecological and economic consequences. The water table is often far below the surface in many peatlands, particularly in bogs, dur-ing the growing season (Boelter and Verry 1977; Bridgham and Richardson 1993; Verry 1997), and desiccation is an important constraint on the growth of Sphagnum mosses (Titus and Wagner 1984; Rydin 1985; Weltzin et al. 2001). Under drought conditions with a water table far below the surface, more decomposed peats would maintain higher plant-available water and faster transport of water to the roots (Päivänen 1973; Silins and Rothwell 1998).
Water retention and hydraulic conductivity are also important considerations in run-off from peatlands, drainage operations, and in commercial forestry in peatlands (Boelter 1964; Boelter and Verry 1977; Silins and Rothwell 1998). Drainage of highly decomposed, subsurface peats is quite difficult. Often effective drainage only occurs within 10 m or less of ditches (Bradof 1992a). As an example, failed attempts at draining the large Red Lake peatland complex in northwestern Minnesota from 1907 through the 1930s resulted in vir-tual bankruptcy of several counties and were only resolved when the state took over large areas of tax-delinquent lands (Bradof 1992b).
We have presented the traditional view of peatland hydrology. However, the work of Siegel and colleagues (Chason and Siegel 1986; Siegel 1988, 1992; Siegel and Glaser 1987; Glaser et al. 2004) has questioned the assumption that vertical flow is negligible in peat-lands, and particularly in bogs because of very low conductivities in deep peat. With both field work and hydrologic modeling studies, they have demonstrated that the hydraulic head in raised bogs is sufficient to drive downward water flowpaths, making bogs recharge zones and adjacent fens discharge zones (see Chapter 3 for a discussion of these concepts). Even more interestingly, they have shown some bogs and fens to vary seasonally between being recharge and discharge zones. Chason and Siegel (1986) found much higher hydrau-lic conductivities in deep, decomposed peats than previous studies, which they attribute to discontinuous zones of buried wood, roots, and other structural features in peat that form “pipes” with extremely high conductivities. Working with the same group of scien-tists, Reeve et al. (2000) modeled vertical flow in peatlands. They found that vertical flow is negligible in raised bogs. Also, they determined that the amount of vertical flow depends on the differences in hydraulic conductivity with depth, especially at the catotelm/mineral soil boundary. Vertical flow can be more important when the mineral layer below the bog is permeable. If underlying sediment is impermeable, horizontal flow dominates. Further modelings work by Reeve et al. (2006) indicate that seasonal changes in water storage can influence the amount of vertical flow with high water tables with more head leading to higher vertical flows such as found during spring following snowmelt.
© 2016 by Taylor & Francis Group, LLC

287Soils of Peatlands
Runoff from peatlands outside permafrost areas is low, although it is higher in fens than bogs because of relatively constant groundwater inputs into fens and the potential for fens to also be present on gentle slopes (Boelter and Verry 1977; Verry 1997). However if permafrost is present, the infiltration and surface storage is low, and runoff occurs (Kane and Hinzman 1988). Free water mainly drains laterally above the permafrost following the slope. According to a study conducted in the interior of northeastern Russia, the ratio of water drained laterally to vertically is 8:1 (Alfimov and Ping 1994).
Peat Biogeochemistry: A Comparative Approach
Conterminous U.S. Peats: The Ombrogenous–Minerogenous Gradient
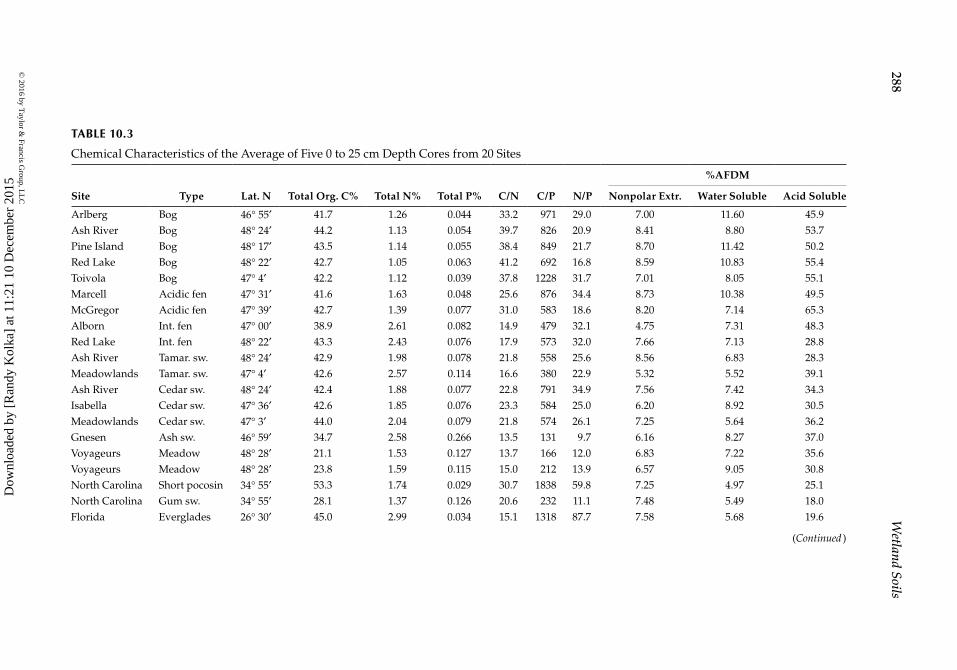
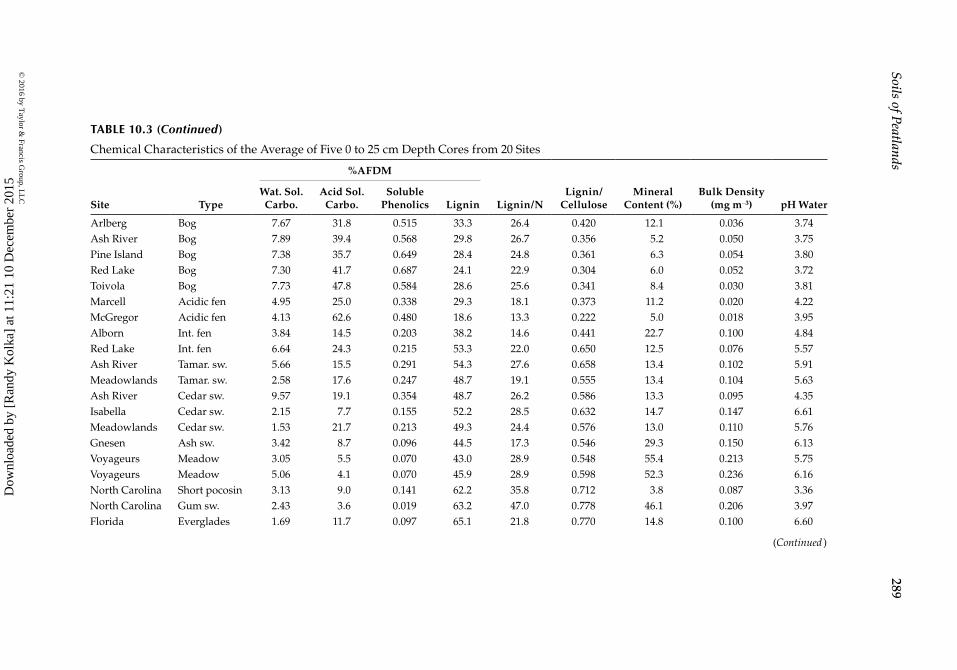
We examined 39 physical and chemical properties of soils from 20 different wetlands (Tables 10.3 and 10.4), 17 in northern Minnesota, 2 in North Carolina, and 1 in Florida. The Minnesota sites were part of a larger study in carbon and nutrient dynamics in wetlands and were placed along an ombrogenous–minerogenous gradient according to dominant vegetation and soil pH (Bridgham et al. 1998). While this gradient is strictly defined based on hydrology, field data generally show a close correspondence between hydrologic status, vegetation, and soil chemistry (Sjörs 1950; Heinselman 1963, 1970; Glaser 1987; Grootjans et al. 1988; Vitt and Chee 1990; Gorham and Janssens 1992; Vitt 2006). All sites were classi-fied as Histosols, except for two of the Minnesota sites, Upper and Lower Shoepack, which were beaver meadows in Voyageurs National Park with a surface histic epipedon of from 8 to 21 cm thickness over a mineral layer.
The short pocosin (an ombrotrophic bog dominated by stunted ericaceous shrubs) and gum swamp (minerogenous forested swamp dominated by Nyssa sylvatica, Liquidambar styraciflua, Acer rubrum, and Taxodium distichum) sites in the Coastal Plain of North Carolina are described in Bridgham and Richardson (1993). The Florida Everglades site is domi-nated by sawgrass, Cladium jamaicensis. It is part of Water Conservation Area 2A and has not been impacted by agricultural runoff (C. Richardson, Duke University, personal com-munication). Five replicate cores from 0 to 25 cm depth were taken from hollows in each site, when significant microtopography was present.
We put the 39 variables from all 20 wetlands in Tables 10.3 and 10.4 into a principal component analysis (PCA; Wilkinson et al. 1992). PCA is a multivariate technique that combines the physical and chemical factors into master variables called components that explain the most variation in the data set. The correlation of all 39 variables with the three most important principal components is presented in Figure 10.4. The first principal com-ponent had high positive weightings from lignin, the lignin:cellulose ratio, bulk density, and the von Post index. In contrast, variables with high negative principal component 1 weightings were pyrophosphate color, rubbed and unrubbed fiber, water and acid soluble components, soluble phenolics, and extractable potassium. These variables suggest that principal component 1 describes a decomposition axis, with peat that has high positive values being highly decomposed.
The second principal component describes an alkalinity/pH axis, with high weightings from extractable Ca and Mg, the Ca:Mg ratio, cation-exchange capacity, total exchangeable bases, %base saturation, and pH (Figure 10.4). Interestingly, %humin, total soil nitrogen, and calcium-chloride extractable N clumped with these alkalinity variables, which suggest
© 2016 by Taylor & Francis Group, LLC
288W
etland Soils
TABLE 10.3
Chemical Characteristics of the Average of Five 0 to 25 cm Depth Cores from 20 Sites
Site Type Lat. N Total Org. C% Total N% Total P% C/N C/P N/P
%AFDM
Nonpolar Extr. Water Soluble Acid Soluble
Arlberg Bog 46° 55′ 41.7 1.26 0.044 33.2 971 29.0 7.00 11.60 45.9Ash River Bog 48° 24′ 44.2 1.13 0.054 39.7 826 20.9 8.41 8.80 53.7Pine Island Bog 48° 17′ 43.5 1.14 0.055 38.4 849 21.7 8.70 11.42 50.2Red Lake Bog 48° 22′ 42.7 1.05 0.063 41.2 692 16.8 8.59 10.83 55.4Toivola Bog 47° 4′ 42.2 1.12 0.039 37.8 1228 31.7 7.01 8.05 55.1Marcell Acidic fen 47° 31′ 41.6 1.63 0.048 25.6 876 34.4 8.73 10.38 49.5McGregor Acidic fen 47° 39′ 42.7 1.39 0.077 31.0 583 18.6 8.20 7.14 65.3Alborn Int. fen 47° 00′ 38.9 2.61 0.082 14.9 479 32.1 4.75 7.31 48.3Red Lake Int. fen 48° 22′ 43.3 2.43 0.076 17.9 573 32.0 7.66 7.13 28.8Ash River Tamar. sw. 48° 24′ 42.9 1.98 0.078 21.8 558 25.6 8.56 6.83 28.3Meadowlands Tamar. sw. 47° 4′ 42.6 2.57 0.114 16.6 380 22.9 5.32 5.52 39.1Ash River Cedar sw. 48° 24′ 42.4 1.88 0.077 22.8 791 34.9 7.56 7.42 34.3Isabella Cedar sw. 47° 36′ 42.6 1.85 0.076 23.3 584 25.0 6.20 8.92 30.5Meadowlands Cedar sw. 47° 3′ 44.0 2.04 0.079 21.8 574 26.1 7.25 5.64 36.2Gnesen Ash sw. 46° 59′ 34.7 2.58 0.266 13.5 131 9.7 6.16 8.27 37.0Voyageurs Meadow 48° 28′ 21.1 1.53 0.127 13.7 166 12.0 6.83 7.22 35.6Voyageurs Meadow 48° 28′ 23.8 1.59 0.115 15.0 212 13.9 6.57 9.05 30.8North Carolina Short pocosin 34° 55′ 53.3 1.74 0.029 30.7 1838 59.8 7.25 4.97 25.1North Carolina Gum sw. 34° 55′ 28.1 1.37 0.126 20.6 232 11.1 7.48 5.49 18.0Florida Everglades 26° 30′ 45.0 2.99 0.034 15.1 1318 87.7 7.58 5.68 19.6
(Continued )
© 2016 by Taylor &
Francis Group, LLC
Dow
nloa
ded
by [
Ran
dy K
olka
] at
11:
21 1
0 D
ecem
ber
2015
289Soils of Peatlands
TABLE 10.3 (Continued)
Chemical Characteristics of the Average of Five 0 to 25 cm Depth Cores from 20 Sites
Site Type
%AFDM
Lignin/NLignin/
CelluloseMineral
Content (%)Bulk Density
(mg m−3) pH WaterWat. Sol.
Carbo.Acid Sol.
Carbo.Soluble
Phenolics Lignin
Arlberg Bog 7.67 31.8 0.515 33.3 26.4 0.420 12.1 0.036 3.74Ash River Bog 7.89 39.4 0.568 29.8 26.7 0.356 5.2 0.050 3.75Pine Island Bog 7.38 35.7 0.649 28.4 24.8 0.361 6.3 0.054 3.80Red Lake Bog 7.30 41.7 0.687 24.1 22.9 0.304 6.0 0.052 3.72Toivola Bog 7.73 47.8 0.584 28.6 25.6 0.341 8.4 0.030 3.81Marcell Acidic fen 4.95 25.0 0.338 29.3 18.1 0.373 11.2 0.020 4.22McGregor Acidic fen 4.13 62.6 0.480 18.6 13.3 0.222 5.0 0.018 3.95Alborn Int. fen 3.84 14.5 0.203 38.2 14.6 0.441 22.7 0.100 4.84Red Lake Int. fen 6.64 24.3 0.215 53.3 22.0 0.650 12.5 0.076 5.57Ash River Tamar. sw. 5.66 15.5 0.291 54.3 27.6 0.658 13.4 0.102 5.91Meadowlands Tamar. sw. 2.58 17.6 0.247 48.7 19.1 0.555 13.4 0.104 5.63Ash River Cedar sw. 9.57 19.1 0.354 48.7 26.2 0.586 13.3 0.095 4.35Isabella Cedar sw. 2.15 7.7 0.155 52.2 28.5 0.632 14.7 0.147 6.61Meadowlands Cedar sw. 1.53 21.7 0.213 49.3 24.4 0.576 13.0 0.110 5.76Gnesen Ash sw. 3.42 8.7 0.096 44.5 17.3 0.546 29.3 0.150 6.13Voyageurs Meadow 3.05 5.5 0.070 43.0 28.9 0.548 55.4 0.213 5.75Voyageurs Meadow 5.06 4.1 0.070 45.9 28.9 0.598 52.3 0.236 6.16North Carolina Short pocosin 3.13 9.0 0.141 62.2 35.8 0.712 3.8 0.087 3.36North Carolina Gum sw. 2.43 3.6 0.019 63.2 47.0 0.778 46.1 0.206 3.97Florida Everglades 1.69 11.7 0.097 65.1 21.8 0.770 14.8 0.100 6.60
(Continued )
© 2016 by Taylor &
Francis Group, LLC
Dow
nloa
ded
by [
Ran
dy K
olka
] at
11:
21 1
0 D
ecem
ber
2015

290W
etland Soils
TABLE 10.3 (Continued)
Chemical Characteristics of the Average of Five 0 to 25 cm Depth Cores from 20 Sites
Site Type
cmolc/kg
Base Sat. (%)Acid-F Extr.
P. (µg g−1)Exch. Acidity Exch. Bases CECpH 7
Extractable Bases
Na K Mg Ca Ca/Mg
Arlberg Bog 19.9 13.2 33.1 0.382 2.87 3.3 6.7 2.01 39.6 3.26Ash River Bog 13.9 11.8 25.7 0.433 1.55 3.5 6.3 1.88 45.1 3.08Pine Island Bog 15.7 19.1 34.7 0.544 3.63 4.2 10.7 2.51 56.1 2.68Red Lake Bog 17.2 16.5 33.7 0.430 2.57 4.7 8.8 1.89 49.8 3.00Toivola Bog 24.0 18.1 42.2 0.465 2.83 3.9 10.9 2.82 43.2 1.12Marcell Acidic fen 31.3 21.1 52.4 0.550 1.65 5.0 13.9 2.79 40.8 1.94McGregor Acidic fen 30.7 22.0 52.6 0.793 4.42 5.7 11.1 1.97 41.8 36.91Alborn Int. fen 11.3 12.3 23.6 0.500 0.90 2.6 8.3 3.29 51.4 1.85Red Lake Int. fen 6.4 34.8 41.2 0.465 1.25 8.0 25.1 3.15 85.2 1.45Ash River Tamar. sw. 15.4 84.3 99.7 0.344 1.05 21.6 61.3 2.86 84.5 1.32Meadowlands Tamar. sw. 14.6 60.2 74.8 0.537 1.01 17.0 41.7 2.45 80.5 13.03Ash River Cedar sw. 19.6 31.9 51.5 0.422 1.55 6.8 23.1 3.45 62.8 4.91Isabella Cedar sw. 7.8 116.9 124.7 0.524 0.78 24.0 91.6 3.84 93.7 1.58Meadowlands Cedar sw. 19.1 67.0 86.1 0.381 0.70 17.4 48.5 2.78 77.8 1.80Gnesen Ash sw. 10.6 51.3 61.8 0.679 0.69 10.6 39.3 3.70 82.8 8.49Voyageurs Meadow 4.4 26.3 30.7 0.263 1.34 7.5 17.3 2.38 85.5 7.23Voyageurs Meadow 3.5 35.2 38.7 0.267 1.13 10.1 23.7 2.45 88.4 3.85North Carolina Short pocosin 28.1 7.1 35.2 0.733 0.68 5.3 0.4 0.07 20.1 0.82North Carolina Gum sw. 19.3 1.4 20.7 0.294 0.40 0.4 0.3 0.73 6.8 6.56Florida Everglades 5.5 139.9 145.4 7.658 1.94 30.3 100.0 3.30 96.2 8.01
(Continued )
© 2016 by Taylor &
Francis Group, LLC
Dow
nloa
ded
by [
Ran
dy K
olka
] at
11:
21 1
0 D
ecem
ber
2015

291Soils of Peatlands
TABLE 10.3 (Continued)
Chemical Characteristics of the Average of Five 0 to 25 cm Depth Cores from 20 Sites
Site Type
CaCl2 Ext. Oxalate Ext. %AFDM
P (µg g−1) N (µg g−1) Fe (mg g−1) Al (mg g−1) Humin Fulvic Acids Humic Acids
Arlberg Bog 5.66 24.9 2.85 1.88 72.4 20.7 12.0Ash River Bog 0.96 0.7 0.90 0.46 72.1 0.6 23.1Pine Island Bog 6.16 14.6 0.93 0.57 72.7 23.8 7.6Red Lake Bog 11.95 9.6 2.61 1.01 72.3 3.5 21.3Toivola Bog 0.43 14.2 3.35 1.08 72.2 6.5 23.4Marcell Acidic fen 7.87 72.1 2.95 1.99 75.7 22.9 10.2McGregor Acidic fen 36.16 31.6 3.29 0.61 73.8 21.2 7.5Alborn Int. fen 0.53 16.1 12.29 3.24 75.9 26.5 23.0Red Lake Int. fen 0.91 26.6 6.48 2.08 79.8 14.7 13.8Ash River Tamar. sw. 2.38 85.1 2.76 1.63 79.2 3.3 11.5Meadowlands Tamar. sw. 1.79 39.0 7.34 1.19 70.6 4.8 11.7Ash River Cedar sw. 6.31 41.0 2.98 2.08 80.0 24.2 13.5Isabella Cedar sw. 1.02 48.6 6.09 1.09 80.2 0.9 13.4Meadowlands Cedar sw. 1.76 54.7 7.88 1.43 79.7 6.3 11.7Gnesen Ash sw. 0.20 42.2 10.48 5.61 77.1 13.5 17.2Voyageurs Meadow 3.09 19.8 5.70 3.03 73.2 57.0 26.4Voyageurs Meadow 0.80 38.9 6.29 2.39 63.5 54.0 23.2North Carolina Short pocosin 16.25 5.3 0.62 0.99 72.0 17.6 26.8North Carolina Gum sw. 0.41 7.0 1.38 7.64 54.4 42.6 37.1Florida Everglades 11.49 35.6 1.71 0.83 77.3 22.5 8.9
Note: All sites are in Minnesota except where noted. Int.: intermediate, Tamar.: tamarack, sw.: swamp, Lat.: latitude, Org.: organic, Extr.: extractable, AFDM: ash-free dry mass, Wat.: water, Sol.: soluble, Carbo.: carbohydrates, Exch.: exchangeable, CEC: cation exchange capacity, Sat.: saturation, Acid-F: acid fluoride.
© 2016 by Taylor &
Francis Group, LLC
Dow
nloa
ded
by [
Ran
dy K
olka
] at
11:
21 1
0 D
ecem
ber
2015

292W
etland Soils
TABLE 10.4
Physical Characteristics and Various Classification Schemes for the Average of Five 0 to 25 cm Depth Cores from 20 Sites
Site Type
Unrubbed Fiber Rubbed Fiber 10YR
von Post
Index
Classificationsa
% Dry-mass
% Volume
% Dry-mass
% Volume
Value Color
Chroma Color
Compositeb Color U.S. Canadian ASTM
von Post
Arlberg Bog 78 73 68 53 7.2 2.2 5 3 2.4 2.6 2.8 2.8Ash River Bog 92 82 80 62 8 1.4 6.6 2.6 3 3 3 3Pine Island Bog 81 75 68 53 7.8 1.8 6 2.4 2.8 2.8 2.8 3Red Lake Bog 86 78 78 60 8 1.6 6.4 3.6 3 3 2.8 2.4Toivola Bog 78 73 74 57 7.8 1.8 6 2.8 2.8 2.8 2.8 3Marcell Acidic fen 76 72 60 48 8 1.4 6.6 4.6 3 3 3 2McGregor Acidic fen 85 78 77 60 8 1 7 2.8 3 3 3 3Alborn Int. fen 33 46 26 26 6.2 3.4 2.8 4.6 1.2 2 1.8 2Red Lake Int. fen 52 56 41 34 8 2 6 4 2 2 2 2Ash River Tamar. sw. 63 63 51 41 7.8 2.2 5.6 4.2 2.4 2.4 2.4 2Meadowlands Tamar. sw. 48 53 30 26 7 3.2 3.8 6.8 1.8 2 2 1.2Ash River Cedar sw. 53 57 44 36 7.6 2.4 5.2 6.2 2.4 2.4 2 1.6Isabella Cedar sw. 47 52 30 26 7 2.8 4.2 8 1.8 2 2 1Meadowlands Cedar sw. 58 60 43 35 6.8 2.8 4 6 2 2.2 2.2 1.6Gnesen Ash sw. 45 51 11 13 5.2 3 2.2 9.4 1 2 2 1Voyageurs Meadow 31 42 20 19 6.8 3.2 3.6 6 1.6 2 1.4 2Voyageurs Meadow 35 45 17 17 5.6 3 2.6 6.4 1 2 1.6 1.4North Carolina Short pocosin 48 53 16 16 5 3 2 10 1 2 2 1North Carolina Gum sw. 28 40 8 10 3 2 1 10 1 1.4 1.2 1Florida Everglades 63 63 20 19 5.8 3 2.8 9 1 2 2.2 1
Note: All sites are in Minnesota except where noted. See text for description of classification schemes. Int.: intermediate, Tamar.: tamarack, sw.: swamp.a Average classification for the five cores. 1 = sapric, 2 = hemic, 3 = fibric.b 10YR Value—10YR Color (Parent and Caron 1993).
© 2016 by Taylor &
Francis Group, LLC
Dow
nloa
ded
by [
Ran
dy K
olka
] at
11:
21 1
0 D
ecem
ber
2015

293Soils of Peatlands
YR10URF
AF-P
NPECaCl2-P
CaCl2-NCa/Mg
HuminBSat
P
C
Ca, Mg, CEC, ExBase
Fe
FA
HA
Al
Lig/N
BDVP
Ash
Na
pHN
C/P
N/P
ExAcidC/NWSCarb
ASCarb
RF, K, WS
0.5
0
–0.5
–1–1 –0.5 0 1
1
0.5Principal component 1 (Decomposition factor)
–1 –0.5 0 10.5
–1 –0.5 0 10.5
Principal component 1 (Decomposition factor)
Prin
cipa
l com
pone
nt 2
(Alk
alin
ity/p
H fa
ctor
)
YR10, RF, K
URF
AF-P
NPECaCl2-P
CaCl2-N
Mg, Ca, ExBase
Ca/Mg
Humin
BSat
P
C
C/N
WS
Fe
FAAl
pHHA
BD
VP
Ash
Na
N
CEC
Lig/N
N/P
C/P
ExAcid,
ASWSCarb
ASCarb, Phen,0.5
0
–0.5
–1
1
Prin
cipa
l com
pone
nt 3
(Car
bon
fact
or)
YR10,
URFNPE
CaCl2-N, N
Ca/Mg,
Humin
BSat
P
C
C/N
HA
pHFA
ASWS AF-P
FeAl BD
LCI, LigVP
Ash
NaK CEC
Lig/N
N/P
C/P
ExAcid
WSCarb
ASCarb, Phen, CaCl2-PRF, 0.5
0
–0.5
–1
1
Principal component 2 (Alkalinity/pH factor)
Prin
cipa
l com
pone
nt 3
(Car
bon
fact
or)
LCI. Lig
AS, Phen
LCI, Lig
Mg, Ca, ExBase
FIGURE 10.4 The loadings of 39 soil variables from 15 peatlands in northern Minnesota, 2 beaver meadows with histic epipe-dons in northern Minnesota, 2 peatlands in North Carolina, and 1 peatland in Florida on the first 3 axes of a principal components analysis. The loading is comparable to the correlation coefficient (r) for each variable against each axis. Abbreviations are as in Table 10.5.
© 2016 by Taylor & Francis Group, LLC

294 Wetland Soils
a positive relationship between alkalinity/pH, humin formation, and nitrogen pools and fluxes. In contrast, humic acid content had a high negative weighting on this axis, which suggests it has a negative relationship with alkalinity/pH.
The third principal component axis was related to soil carbon and mineral content (Figure 10.4). It had positive weighting from total soil carbon, and high negative weight-ings from %mineral content, oxalate-extractable Fe and Al, bulk density, and total soil phosphorus. Phosphorus is strongly sorbed by iron and aluminum hydroxyoxides, so it is not surprising that greater mineral content is related to higher total soil phosphorus levels, although this does not necessarily translate into higher available phosphorus (Bridgham et al. 1998). Additionally, more minerogenous peats may receive greater inputs of apatite–phosphorus from weathering.
There is a large cost in labor, time, and expense in doing many of these chemical analy-ses, and it is promising that a simple set of physical and chemical variables often measured in peats is closely correlated with many of the more difficult chemical analyses. In particu-lar, mineral content, bulk density, pH, fiber content, and the von Post index are correlated with many other chemical variables (Table 10.5). They are also as effective as the chemical variables in predicting nutrient and carbon mineralization in peats (Lévesque and Mathur 1979; Bridgham et al. 1998).
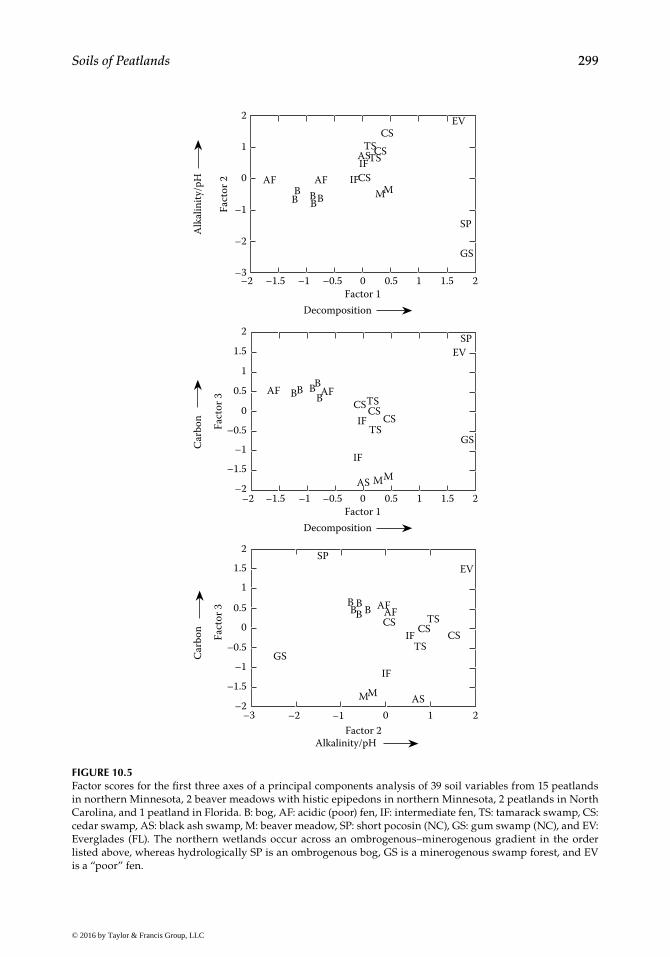
PCA also allows one to determine “factor scores” for each of the 20 wetlands along these three principal component axes. We used our multivariate data set to discriminate natural groupings of peatlands according to their soil characteristics (Figure 10.5). The first, second, and third factors explained 28.8%, 22.5% and 21.1%, respectively, of the vari-ance among sites, or 72.4% of the total variance. The first factor (Decomposition Factor) effectively separated three groups of wetlands: acidic fens and bogs, more minerotrophic northern wetlands, and southern peatlands. The second factor (Alkalinity/pH Factor) sep-arated bogs from acidic fens, beaver meadows from minerotrophic northern peatlands, and the alkaline Everglades site from the acidic North Carolina peatlands. The third fac-tor (Carbon Factor) separated minerotrophic northern cedar and tamarack swamps from intermediate fens, the ash swamp site, and the two beaver meadows. The nutrient-deficient short pocosin and Everglades sites were separated from the relatively nutrient-rich North Carolina gum swamp.
The difficulty of applying the ombrogenous–minerogenous gradient to southern peat-lands is evident from our data. One sees the expected decrease in rubbed fiber content and increase in mineral ash, lignin, pH, %base saturation, and related variables express-ing increasing alkalinity from bogs to ash swamps and beaver meadows in the northern sites, related to increasing minerogenous water inputs and their impact on water chem-istry (Table 10.3, Figure 10.6). However, both short pocosins and the Everglades are pro-foundly phosphorus limited, whereas the gum swamp is relatively fertile (Walbridge 1991; Koch and Reddy 1992; Bridgham and Richardson 1993; Craft and Richardson 1997). Hydrologically, the Everglades site would be considered a “poor” fen, despite its alka-line soil conditions, and the gum swamp is a highly minerogenous “rich” swamp forest, despite its very acidic soil (Table 10.3, Figure 10.6). The sands of the North Carolina Coastal Plain have very low exchangeable basic cation concentrations, so contribute little alkalinity despite being highly minerogenous (Bridgham and Richardson 1993). Additionally, all of the southern peats are highly decomposed hemic or sapric peats with very low fiber and cellulose content, but high lignin content (Tables 10.3 and 10.4; Figures 10.4 through 10.6).
Our data support the traditional concept of an ombrogenous–minerogenous gradient in northern peatlands in terms of alkalinity and degree of decomposition of peats; how-ever, soil nutrient availability is more problematic. We found in these same Minnesota
© 2016 by Taylor & Francis Group, LLC

295Soils of Peatlands
TABLE 10.5
Pearson Correlations (r) when P < 0.05 for Variables in Tables 10.3 and 10.4
C N P C/N C/P N/P NPE WS AS WSCarb
C
N
P −0.57
C/N 0.48 −0.78 −0.55
C/P 0.74 −0.74 0.51
N/P 0.56 0.44 −0.55 0.77
NPE −0.52 0.58
WS −0.54 0.51
AS −0.49 0.63 0.55
WSCarb −0.51 0.59 0.59 0.46
ASCarb −0.51 0.75 0.47 0.85 0.52
Phen 0.44 −0.62 −0.46 0.88 0.50 0.63 0.80 0.73
Lig 0.58 −0.62 −0.69 −0.97 −0.52
Lig/N −0.58
LCI 0.54 −0.64 −0.63 −0.99 −0.49
Ash −0.95 0.57 −0.64 −0.65
BD −0.77 0.58 −0.69 −0.58 −0.44 −0.66 −0.48
pH 0.69 −0.78 −0.45 −0.53 −0.54
ExAcid 0.47 0.55 0.46 0.44
ExBase 0.60 −0.46 −0.47
CEC 0.55 0.48 −0.46
Na 0.50 0.80
K −0.49 0.62 0.45 0.50 0.71 0.47
Mg 0.60 −0.44 −0.48 −0.50
Ca 0.60 −0.44 −0.47 −0.47
Ca/Mg 0.51
BSat 0.57 −0.56
AF-P
CaCl2-P
CaCl2-N
Fe 0.58 0.59 −0.63 −0.58 −0.77
Al −0.62 0.69 −0.49 −0.55
Humin 0.51
FA −0.78
HA −0.47
URF 0.56 −0.48 −0.51 0.82 0.45 0.68 0.52 0.69 0.55
RF −0.60 −0.51 0.83 0.59 0.57 0.81 0.67
YR10 −0.45 −0.45 0.63 0.62 0.52 0.70 0.65
VP 0.49 −0.59 −0.58 −0.78 −0.68
(Continued)
© 2016 by Taylor & Francis Group, LLC

296 Wetland Soils
TABLE 10.5 (Continued)
Pearson Correlations (r) when P < 0.05 for Variables in Tables 10.3 and 10.4
ASCarb Phen Lig Lig/N LCI Ash BD pH ExAcid ExBase
C
N
P
C/N
C/P
N/P
NPE
WS
AS
WSCarb
ASCarb
Phen 0.87
Lig −0.81 −0.80
Lig/N 0.52
LCI −0.84 −0.81 0.99 0.55
Ash −0.64 −0.66
BD −0.81 −0.78 0.58 0.49 0.64 0.90
pH −0.59 −0.65 0.51 0.53 0.57
ExAcid 0.53 −0.53 −0.63 −0.73
ExBase 0.49 0.47 0.81 −0.45
CEC 0.44 0.70 0.98
Na 0.63
K 0.84 0.76 −0.74 −0.73 −0.64 −0.48
Mg 0.52 0.50 0.81 0.98
Ca 0.50 0.48 0.82 −0.47 1.00
Ca/Mg −0.58 0.64 −0.45 0.57
BSat 0.90 −0.74 0.76
AF-P
CaCl2-P 0.53 −0.44 0.54
CaCl2-N 0.56 0.56
Fe −0.48 0.55
Al −0.53 −0.56 0.68 0.60
Humin −0.60 −0.51 0.48
FA −0.46 0.81 0.61
HA 0.66 0.54 0.51 −0.49
URF 0.86 0.88 −0.68 −0.70 −0.75 −0.85 −0.51 0.48
RF 0.91 0.95 −0.80 −0.81 −0.66 −0.81 −0.57 0.47
YR10 0.81 0.81 −0.71 −0.71 −0.61 −0.75
VP −0.79 −0.82 0.80 0.80 0.63
(Continued)
© 2016 by Taylor & Francis Group, LLC

297Soils of Peatlands
TABLE 10.5 (Continued)
Pearson Correlations (r) when P < 0.05 for Variables in Tables 10.3 and 10.4
CEC Na K Mg Ca Ca/Mg BSat AF-P CaCl2-P CaCl2-N
C
N
P
C/N
C/P
N/P
NPE
WS
AS
WSCarb
ASCarb
Phen
Lig
Lig/N
LCI
Ash
BD
pH
ExAcid
ExBase
CEC
Na 0.62
K
Mg 0.96 0.59
Ca 0.97 0.59 0.97
Ca/Mg 0.51 0.48 0.60
BSat 0.64 0.76 0.76 0.74
AF-P 0.49
CaCl2-P 0.63 0.75
CaCl2-N 0.61 0.59 0.57 0.53 0.51
Fe 0.55 0.46
Al −0.49
Humin 0.50 0.45 0.48 0.67 0.53 0.47
FA
HA −0.55 −0.47 −0.47 −0.53 −0.45 −0.58
URF 0.74 −0.49
RF 0.75 −0.49
YR10 0.66
VP −0.68
(Continued)
© 2016 by Taylor & Francis Group, LLC

298 Wetland Soils
TABLE 10.5 (Continued)
Pearson Correlations (r) when P < 0.05 for Variables in Tables 10.3 and 10.4
Fe Al Humin FA HA URF RF YR10
CNPC/NC/PN/PNPEWSASWSCarbASCarbPhenLigLig/NLCIAshBDpHExAcidExBaseCECNaKMgCaCa/MgBSatAF-PCaCl2-PCaCl2-NFeAlHumin −0.49FA 0.47 −0.51HA 0.57 −0.67URF −0.53 −0.64 −0.54 −0.47RF −0.60 −0.47 0.92YR10 −0.63 −0.44 −0.52 0.83 0.92VP 0.52 −0.70 −0.88 −0.85
Note: C: %organic C, N: %total N, P: %total P, NPE: nonpolar extractable organic matter, WS: water soluble organic matter, AS: acid soluble organic matter, WSCarb: water soluble carbohydrates, ASCarb: acid soluble carbohydrates, Phen: soluble phenolics, Lig: lig-nin, LCI: lignin/cellulose, BD: bulk density, ExAcid: exchangeable acidity, ExBase: exchangeable bases, CEC: cation-exchange capacity, BSat: %base saturation, AF-P: acid fluoride extractable P, CaCl2-N and CaCl2-P: calcium chloride extractable N and P, FA: fulvic acid, HA: humic acid, URF: %unrubbed fiber, RF: %rubbed fiber, YR10: compos-ite pyrophosphate color (10YR Value—10YR Color), VP: von Post index.
© 2016 by Taylor & Francis Group, LLC
299Soils of Peatlands
2
2
1
1
–1
0
0
–2
–3–2
–2
–1.5 –1
–1
1 20–0.5
–0.5
0.5
0.5
–0.5
1.5
–1.5
1.5
GS
SP
EVCS
TSTSCS
CSMM
ASIF
AFAFB
B BBB
IF
GS
SPEV
TS
TSCS
CSCS
MMAS
AFAFBB
BBB
IF
IF
GS
SPEV
TS
TSCSCSCS
MM AS
AFAFBBBB B
IF
IF
Fact
or 2
Fact
or 3
2
1
0
–2–3
–1
0.5
–1.5
1.5
Factor 2
Factor 1
–2 –1 1 20
Decomposition
Alk
alin
ity/p
H
Alkalinity/pH
–2 –1.5 –1 1 20–0.5 0.5 1.5Factor 1
Decomposition
Car
bon
Fact
or 3
Car
bon
FIGURE 10.5 Factor scores for the first three axes of a principal components analysis of 39 soil variables from 15 peatlands in northern Minnesota, 2 beaver meadows with histic epipedons in northern Minnesota, 2 peatlands in North Carolina, and 1 peatland in Florida. B: bog, AF: acidic (poor) fen, IF: intermediate fen, TS: tamarack swamp, CS: cedar swamp, AS: black ash swamp, M: beaver meadow, SP: short pocosin (NC), GS: gum swamp (NC), and EV: Everglades (FL). The northern wetlands occur across an ombrogenous–minerogenous gradient in the order listed above, whereas hydrologically SP is an ombrogenous bog, GS is a minerogenous swamp forest, and EV is a “poor” fen.
© 2016 by Taylor & Francis Group, LLC

300 Wetland Soils
wetlands that more minerogenous wetlands have larger total soil nitrogen and phospho-rus pools, but those pools turn over more slowly in minerogenous sites (Bridgham et al. 1998). A phosphorus isotope addition experiment across the ombrogenous–minerogenous gradient resulted in no differences in available phosphorus, microbial phosphorus, and the root phosphorus at 10–20 cm, although total soil phosphorus and aboveground veg-etation phosphorus content increased from bog to rich fen (Kellogg and Bridgham 2003). It appears that although bogs and intermediate fens have a small total phosphorus pool, they have similar phosphorus availability to rich fens because of rapid cycling and effi-cient retention of phosphorus. The large increase in bulk density in more minerogenous sites also has important consequences, because plant roots and microbes exploit a volume
7.06.56.05.55.04.54.03.53.0
B
B
AF IF T+C AS M SP GS EV
% B
ass s
atur
atio
n%
Lig
nin
cont
ent
AF IF T+C AS M SP GS EV
B AF IF T+C AS M SP GS EV
B AF IF T+C AS M SP GS EV
B AF IF T+C AS M SP GS EV
50
40
30
20
10
0
60
*
*
*
*
*
*
*
*
100
80
60
40
20
0
*
**
*
70
60
50
40
20
10
30
0
** *
*
80 70 60 50 40
20 10
30
0
**
*
*
pH
% R
ubbe
d fib
er c
onte
nt%
Min
eral
con
tent
FIGURE 10.6 Relationship between pH, mineral content, base saturation, rubbed fiber content, and lignin to the ombrogenous–minerogenous gradient in the northern wetlands (going from left to right on the x-axis) and the three southern peatlands (SP, GS, and EV). The northern wetlands occur across an ombrogenous–minerogenous gradient in the order listed above, whereas hydrologically SP is an ombrogenous bog, GS is a minerogenous swamp forest, and EV is a “poor” fen. Average ± 1 standard error, except * indicates N = 1 site so standard errors could not be obtained.
© 2016 by Taylor & Francis Group, LLC

301Soils of Peatlands
and not a mass of soil. The net result of all these factors was that nitrogen availability was higher in more minerogenous Minnesota wetlands (Bridgham et al. 1998). Chapin (1998) conducted a detailed fertilization experiment in an intermediate fen and bog in northern Minnesota and found similar results. Interestingly, she found that bog vegetation was not nutrient limited, except for a delayed response in ericaceous shrubs, and Sphagnum mosses were actually inhibited at moderate rates of nitrogen addition. The fen vegetation was phosphorus limited. Similar results have been found for both soil nutrient availability (Waughman 1980; Verhoeven et al. 1990; Koerselman et al. 1993; Updegraff et al. 1995) and plant-nutrient response (Clymo 1987; Lee et al. 1987; Boyer and Wheeler 1989; Bridgham et al. 1996) in other northern peatlands. More recent research using enzymes to determine nutrient limitations found phosphorus to be more limiting than nitrogen across a gradient of ombrogenous to minerogenous peatlands in northern Minnesota (Hill et al. 2014).
We suggest that the ombrogenous–minerogenous paradigm is an important and use-ful concept in northern peatlands, although its relation to a nutrient availability gra-dient appears to be complicated and worthy of further research. We conclude that the ombrogenous–minerogenous gradient does not appear to be directly translatable into an oligotrophic–eutrophic gradient. Furthermore, traditional concepts of how the ombroge-nous-minerogenous gradient affects peat chemistry and physical properties in northern peatlands do not appear to be useful in southern peatlands.
Alaskan Peatlands: Histosols and Gelisols
We also examined a more limited set of soil variables in peats collected in the five pedons from Alaska (Table 10.6). Pedons 1 and 2 are intermediate fens, whereas pedons 3 through 5 are bogs. Pedons 3 and 5 are Histosols, whereas pedons 1, 2, and 4 are Histels within the order Gelisols.
The bulk density and mineral content of the horizons from the five pedons from Alaska are much higher than those from the Minnesota and southern peats (Table 10.3). Eolian and volcanic deposits (loess and tephra) have been active in many parts of Alaska and northwest Canada since the Late Pleistocene (Péwé 1975; Riehle 1985). Because of this fre-quent or intermittent input of mineral deposits, the organic soils in these regions have a higher bulk density compared with those developed in the humid maritime zones of southeastern Alaska and British Columbia. The additions of these materials appear in bands and layers in the peat, and thus they can serve as time-stratigraphic markers. In peat developed in bottom lands, mineral layers exist in lamella or bands due to the erosion or washing from surrounding slopes (Pedon 2).
In northern Alaska, as in the Minnesota sites, vegetation and land cover class show a strong correlation with the base status and pH of the soil (Ping et al. 1998). The pH of Alaskan peatlands decreases from 5.5 to 7.7 in the Arctic coast to 4.0 to 4.5 in the boreal forest in the interior, to 3.0 to 3.5 in south central and southeastern Alaska. Most bogs in south central Alaska are extremely acidic and have low base status. Some of the bogs have hydraulic conductivity less than 10 cm h−1 (Clark and Kautz 1997). Péwé (1975) pointed out that there is continuous deposition of carbonate-rich loess in the Arctic Coastal Plain and in interior Alaska if streams are transporting glacial debris. In these soils, extract-able Ca and Mg dominate the soluble salts and the exchange sites in the soils (Pedons 1 and 2). Pedon 3 is a raised bog with Sphagnum moss as the dominant vegetation making the pH very acidic. Even though the area has relatively low loess deposition, the added carbonates from the loess are reflected in the Ca-dominance of the exchange sites and the slightly higher base saturation in the surface layer. Although Pedon 4 formed in humid
© 2016 by Taylor & Francis Group, LLC

302W
etland Soils
TABLE 10.6
Characteristics of Selected Histosols from Alaska
Pedon #Lat. N Horizon
Depth (cm)
Total Org. C (%) C/N
Mineral Content
(%)
Bulk Density (mg m−3)
pH CaCl2
cmolc/kg
Base Sat. (%)
Fiber Content
Pyrophosphate Color
Exch. Acidity CEC
Extractable Bases
Na K Mg CaUnrub.
(%)Rubbed
(%)
1 Oa1 0–18 23 35 62 0.39 6.9 17 79 1 tr 4 85 100 52 16 10YR 5/370° 17′ Oa2 18–39 15 13 77 0.49 5.9 13 29 1 tr 1 16 61 26 12 10YR 4/3
Oe 39–50 22 14 65 0.38 6.3 18 49 1 tr 4 43 99 58 24 10YR 4/3Oef 50–100 25 19 61 n.d. 7.1 12 63 2 tr 6 115 100 80 26 10YR 4/3Cf 39–80 tr 11 n.d. 1.8 7.7 n.d. 2 0 tr 1 n.d. 100 n.d. n.d. n.d.
2 Oi 0–17 51 25 15 7.7 21 168 tr 3 20 183 100 92 64 10YR 7/367° 26′ Oe1 17–35 49 17 20 0.12 6.7 38 197 tr tr 15 186 100 64 36 10YR 6/3
Oe2 35–48 52 29 n.d. 5.8 49 160 tr tr 11 146 98 n.d. n.d. n.d.C/Oa 48–54 24 n.d. n.d. 5.1 47 89 tr tr 6 81 99 n.d. n.d. n.d.Oef1 54–85 42 21 32 5.4 66 139 tr tr 6 113 86 n.d. n.d. n.d.Oaf 85–95 29 20 54 n.d. 58 109 tr tr 5 90 87 52 16 10YR 3/3Oef2 95–108 n.d. n.d. 87 5.6 18 25 tr tr 1 22 94 20 12 10YR 5/3
3 Oe 0–31 39 19 15 0.13 4.3 136 1 1 15 40 42 70 40 7.5YR7/564° 52′ Oi 31–61 38 31 9 0.1 3.9 116 tr tr 5 12 16 88 75 10YR 8/2
Oif 61–127 38 26 7 n.d. 4.4 81 tr tr 5 12 22 90 80 10YR 8/14 Oi 0–29 53 68 n.d. 4.1 79 129 1 1 13 63 6061° 25′ Oe 29–47 53 32 0.15 4.3 83 106 1 tr 6 49 52
Oa 47–79 49 27 0.4 4.3 82 96 1 tr 4 42 49O’e1 79–97 22 30 0.57 4.5 61 49 1 tr 2 18 40O’e2 97–148 55 28 0.2 4.5 78 106 1 tr 4 48 50O’I 148–165 60 32 n.d. 4.5 85 132 1 tr 6 68 57
5 Oi 0–3 17 3.3 94 99 1 2 7 13 23 76 56 10YR 8/356° 30′ Oe 3–18 7 3 130 132 1 1 10 13 19 62 42 7.5YR 8/2
Oa 18–94 54 3.5 72 76 1 1 2 4 9 48 30 5YR 3/4
© 2016 by Taylor &
Francis Group, LLC
Dow
nloa
ded
by [
Ran
dy K
olka
] at
11:
21 1
0 D
ecem
ber
2015

303Soils of Peatlands
south central Alaska, the base saturation is higher than that of Pedon 3 because it is on a broad flood plain which collects seasonal input of minerals. Pedon 5 is a well-drained Folist in perudic southeastern Alaska. Its soil is strongly acidic (pH at 3.3) and has very low base saturation.
Ping et al. (1997b) found that organic matter in fens of the arctic coast was dominated by cellulose (approximately 50%), whereas the humin fraction was <20%. Humic acids dominated the soluble fractions, and the C/N ratio ranged from 6 to 17. In comparison, the Minnesota peats had generally <40% cellulose (i.e., acid-soluble carbohydrates), >70% humin, a variable humic acid:fulvic acid ratio, and a C/N ratio which ranged from 14 to 41 (Table 10.3). All these data point to a lesser degree of humification of peats as the climate gets colder. This generalization is borne out by a similar comparison of the Minnesota peats to those in North Carolina and Florida in Table 10.3.
Peat formed in the zone of continuous permafrost, such as arctic Alaska and northwest Canada, contains cryogenic features such as ice lenses, ice wedges, and other types of ground ice, generally at a depth of 40–60 cm (Tarnocai et al. 1993; Ping et al. 1997a, b, 1998). The upper permafrost layer of these soils often contains up to 80% ice by volume. Cryoturbation causes mixing of soil horizons and redistribution of carbon, resulting in significant carbon stores in the permafrost (Michaelson et al. 1996; Tarnocai et al. 2009). Thawing as a result of climate change is predicted to have important positive feedbacks to the global carbon cycle thereby increasing warming potential (Schurr et al. 2008; Kovan et al. 2011).
Our emphasis in this comparative biogeochemical approach has been on the peat-lands of the U.S. A multivariate analysis of numerous soil properties of Canadian bogs was performed by Brown et al. (1990), but their emphasis was not on the ombrogenous– minerogenous gradient, and the study was done within a more limited geographical set-ting. Additionally, a wealth of information on Canadian peats is found in National Wetlands Working Group (1988). The review by Clymo (1983) emphasizes European peatlands and has long been a classic in this field. Bohlin et al. (1989) examined a wide range of peat properties in a diverse group of Swedish peats and used principal components analysis to examine their results. They found that the peats were differentiated by botanical composi-tion and degree of decomposition, and particularly emphasized the differences between Sphagnum (bog) and Carex (fen)-derived peats. Carex peats were more humified due to microbial decomposition than Sphagnum peats. A thorough review of humic substances in peats is provided by Mathur and Farnham (1985). Vitt (2006) used a five-factor approach integrating hydrology, climate, chemistry, substrate, and vegetation into a practical model to classify peatlands and natural gradients among peatland types. He developed func-tional levels of organization based on the five factors and used this framework to construct chronological “grades” that begin at wetland initiation followed by peatland development and then ultimately differentiate peatlands between bogs and fens (Vitt 2006).
Conclusions
We have presented here a framework for understanding the physical and biogeochemical properties of peat based upon the ombrogenous–minerogenous gradient, and examined how the properties of this gradient differ among different climatic zones. It is clear from the work presented here and elsewhere that peatlands are a critical ecosystem for many
© 2016 by Taylor & Francis Group, LLC

304 Wetland Soils
reasons. Peatlands harbor key flora and fauna, contribute to clean water, mitigate flooding, and store vast amounts of carbon. As a result of centuries of carbon accumulation, peat-lands have mitigated rising concentrations of carbon dioxide in the atmosphere. Warming of Histosols and Gelisols will lead to positive feedbacks to the atmosphere, possibly accel-erating climate change. Management approaches and research aimed at mitigating or adapting to climate change should be a priority for these globally important ecosystems.
Acknowledgments
We would like to thank Karen Updegraff and J. L. Richardson for their contributions to the first edition of this chapter, Curtis Richardson for obtaining the Everglades peat cores, Anastasia Bamford for technical assistance in the laboratory, John Pastor for comments on an earlier version of this manuscript, Inez Kettles for information on the extent of Canadian peatlands, and Sharon Waltman for access to the STATSGO and MUIR NRCS databases. This research was funded by a grant from NASA’s Terrestrial Biosphere Program, the National Science Foundation (DEB-9496305, DEB-9707426), and a Distinguished Global Change Postdoctoral Fellowship from the Department of Energy to Scott Bridgham. The research in Alaska was supported by the USDA-Hatch program.
References
Ahrens, R. J., J. G. Bockheim, and C.L. Ping. 2004. Chapter 3: The Gelisol order in soil taxonomy. In J. M. Kimble (Ed.) Cryosols Springer, Berlin Heidelberg, pp. 627–635.
Alfimov, A. V. and C. L. Ping. 1994. Water regimes of boggy soils on slopes in the Upper Kolyma Basin, NE Russia. Agronomy Abstr. Agron. Soc. Am. Madison, WI.
Aselmann, I. and P. J. Crutzen. 1989. Global distribution of natural freshwater wetlands and rice paddies, their net primary productivity, seasonality and possible methane emissions. J. Atmos. Chem. 8: 307–359.
ASTM. 2013. Annual Book of ASTM Standards. Vol. 04.08. ASTM, Philadelphia, PA.Baden, W. and R. Eggelsmann. 1963. Zur Durchlässigkeit der Moorboden. Z. Kulturtech. Flurber.
4: 226–254.Belyea, L. R. and A. J. Baird. 2006. Beyond “the limits to peat bog growth”: Cross-scale feedback in
peatland development. Ecol. Monogr. 76: 299–322.Boelter, D. H. 1964. Water storage characteristics of several peats in situ. Soil Sci. Soc. Am. Proc.
28: 433–435.Boelter, D. H. 1968. Important physical properties of peat materials. In Proc. 3rd Int. Peat Congress.
International Peat Society, Secretariat, Kuokkalantie, 4, FIN-40520, Jyväskylä, Finland, pp. 150–156.
Boelter, D. H. 1969. Physical properties of peats as related to degree of decomposition. Soil Sci. Soc. Am. Proc. 33: 606–609.
Boelter, D. H. and E. S. Verry. 1977. Peatland and Water in the Northern Lake States. USDA Forest Service General Technical Report NC31. North Central Forest Experimental Station, Forest Service, USDA, St. Paul, MN.
Bohlin, E., M. Hämäläinen, and T. Sundén. 1989. Botanical and chemical characterization of peat using multivariate methods. Soil Sci. 147: 252–263.
© 2016 by Taylor & Francis Group, LLC

305Soils of Peatlands
Botch, M. S., K. I. Kobak, T. S. Vinson, and T. P. Kolchugina. 1995. Carbon pools and accumulation in peatlands of the former Soviet Union. Glob. Biogeochem. Cycles 9: 37–46.
Boyer, M. L. H. and B. D. Wheeler. 1989. Vegetation patterns in spring-fed calcareous fens: Calcite precipitation and constraints on fertility. J. Ecol. 77: 597–609.
Bradof, K. L. 1992a. Ditching of the Red Lake Peatland during the homestead era. In H. E. Wright Jr., B. A. Coffin, and N. E. Aaseng (Eds.) The Patterned Peatlands of Minnesota. University of Minnesota Press, Minneapolis, MN, pp. 263–284.
Bradof, K. L. 1992b. Impact of ditching and road construction on Red Lake Peatland. In H. E. Wright Jr., B. A. Coffin, and N. E. Aaseng (Eds.) The Patterned Peatlands of Minnesota. University of Minnesota Press, Minneapolis, MN, pp. 173–186.
Brady, N.C. and R.R. Weil. 2008. The Nature and Properties of Soils, 14th ed. Pearson Prentice Hall, Upper Saddle River, NJ.
Bridgham, S. D., J. Pastor, J. Janssens, C. Chapin, and T. Malterer. 1996. Multiple limiting gradients in peatlands: A call for a new paradigm. Wetlands 16: 45–65.
Bridgham, S. D. and C. J. Richardson. 1993. Hydrology and nutrient gradients in North Carolina peatlands. Wetlands 13: 207–218.
Bridgham, S., J. Megonigal, J. Keller, N. Bliss, and C. Trettin. 2006. The carbon balance of North American wetlands. Wetlands 26(4): 889–916.
Bridgham, S. D., K. Updegraff, and J. Pastor. 1998. Carbon, nitrogen, and phosphorus mineralization in northern wetlands. Ecology 79: 1545–1561.
Brooks, K. N. 1992. Surface hydrology. In H. E. Wright Jr., B. A. Coffin, and N. E. Aaseng (Eds.) The Patterned Peatlands of Minnesota. University of Minnesota Press, Minneapolis, MN, pp. 153–162.
Brown, D. A., S. P. Mathur, A. Brown, and K. J. Kushner. 1990. Relationships between some proper-ties of organic soils from the southern Canadian Shield. Can. J. Soil Sci. 90: 363–377.
Camill, P. and J. S. Clark. 1998. Climate change disequilibrium of boreal permafrost peatlands caused by local processes. Am. Naturalist 151: 207–222.
Chapin, C. T. 1998. Plant community response and nutrient dynamics as a result of manipulations of pH and nutrients in a bog and fen in northeastern Minnesota. PhD dissertation, University of Notre Dame, Notre Dame, IN.
Chason, D. B. and D. I. Siegel. 1986. Hydraulic conductivity and related physical properties of peat, Lost River peatland, northern Minnesota. Soil Sci. 142: 91–99.
Clark, M. H. and D. R. Kautz. 1997. Soil Survey of Matanuska–Susita Valley Area, Alaska. USDA Natural Resources Conservation Service. U.S. Govt. Printing Office. Washington, DC.
Clymo, R. S. 1983. Peat. In A. J. Gore (Ed.) Mires: Swamp, Bog, Fen and Moor. Ecosystems of the World, 4A. Elsevier Scientific Publishing, New York, NY, pp. 159–224.
Clymo, R. S. 1987. Interactions of Sphagnum with water and air. In T. C. Hutchinson and K. M. Meema (Eds.) Effects of Atmospheric Pollutants on Forests, Wetlands and Agricultural Ecosystems. Springer-Verlag, Berlin, Germany, pp. 513–529.
Cowardin, L. M., V. Carter, F. C. Golet, and E. T. LaRoe. 1979. Classification of Wetlands and Deepwater Habitats of the United States. FWS/OBS79/31, Fish and Wildlife Service, U.S. Department of the Interior, Washington, DC.
Craft, C. B. and C. J. Richardson. 1997. Relationships between soil nutrients and plant species composition in Everglades peatlands. J. Environ. Qual. 26: 224–232.
Damman, A. W. H. 1986. Hydrology, development, and biogeochemistry of ombrogenous peat bogs with special reference to nutrient relocation in a western Newfoundland bog. Can. J. Bot. 64: 384–394.
Damman, A. W. H. and T. W. French. 1987. The Ecology of Peat Bogs of the Glaciated Northeastern United States: A Community Profile. Fish and Wildlife Service Report 85 (7.16), U.S. Department of Interior, Washington, DC.
Day, J. H., P. J. Rennie, W. Stanek, and G. P. Raymond. 1979. Peat Testing Manual. Technical Memorandum Number 125, Associate Committee on Geotechnical Research. National Research Council of Canada, Ottawa, Canada.
© 2016 by Taylor & Francis Group, LLC

306 Wetland Soils
Gafni, A. and K. N. Brooks. 1990. Hydraulic characteristics of four peatlands in Minnesota. Can. J. Soil Sci. 70: 239–253.
Glaser, P. H. 1987. The Ecology of Patterned Boreal Peatlands of Northern Minnesota: A Community Profile. Fish and Wildlife Service Report 85 (7.14), U.S. Department of Interior, Washington, DC.
Glaser, P. H., B. C. S. Hansen, D. I. Siegel, A. S. Reeve, and P. J. Morin. 2004. Rates, pathways and drivers for peatland development in the Hudson Bay Lowlands, northern Ontario, Canada. J. Ecol. 92: 1036–1053.
Gore, A. J. P. 1983. Introduction. In A. J. P. Gore (Ed.) Mires: Swamp, Bog, Fen and Moor. Ecosystems of the World, 4A. Elsevier, New York, NY, pp. 1–34.
Gorham, E. 1991. Northern peatlands: Role in the carbon cycle and probable responses to climatic warming. Ecol. Appl. 1: 182–195.
Gorham, E. and J. A. Janssens. 1992. Concepts of fen and bog re-examined in relation to bryophyte cover and the acidity of surface waters. Acta Soc. Bot. Pol. 61: 7–20.
Grootjans, A. P., R. van Diggelen, M. J. Wassen, and W. A. Wiersinga. 1988. The effects of drainage on groundwater quality and plant species distribution in stream valley meadows. Vegetatio 75: 37–48.
Gumbricht, T. 2012. Mapping Global Tropical Wetlands from Earth Observing Satellite Imagery. Working Paper No. 103. CIFOR, Bogor, Indonesia.
Heinselman, M. L. 1963. Forest sites, bog processes, and peatland types in the Glacial Lake Agassiz Region, Minnesota. Ecol. Monogr. 33: 327–374.
Heinselman, M. L. 1970. Landscape evolution, peatland types, and the environment in the Lake Agassiz Peatland Natural Area, Minnesota. Ecol. Monogr. 40: 235–261.
Hill, B. H., C. M. Elonen, T. M. Jicha, R. K. Kolka, L. L. P. Lehto, S. D. Sebestyen, and L. R. Seifert-Monson. 2014. Ecoenzymatic stoichiometry and microbial processing of organic matter in northern bogs and fens reveals a common P limitation among peatland types. Biogeochemistry. 120: 203–224.
Holden, J. and T. P. Burt. 2003. Hydraulic conductivity in upland blanket peat: Measurement and variability. Hydrol. Process. 17: 1227–1237.
Ingram, H. A. P. 1982. Size and shape in raised mire ecosystems: A geophysical model. Nature 297: 300–303.
Ingram, H. A. P. 1983. Hydrology. In A. J. P. Gore (Ed.) Mires: Swamp, Bog, Fen and Moor. A. General Studies. Elsevier Scientific Publishing Company, Amsterdam, The Netherlands, pp. 67–158.
Inisheva, L. I. 2006. Peat soils: Genesis and classification. Eur. Soil Sci. 39(7): 699–704.IPCC. 2006. H. S. Eggleston, L. Buendia, K. Miwa, T. Ngara, and K. Tanabe (Eds.) 2006 IPCC Guidelines
for National Greenhouse Gas Inventories, Prepared by the National Greenhouse Gas Inventories Programme. IGES, Japan.
IPCC. 2014. 2013 Supplement to the 2006 IPCC Guidelines for National Greenhouse Gas Inventories: Wetlands. IGES, Japan.
IUSS Working Group WRB. 2006. World Reference Base for Soil Resources. 2nd ed. World Soil Resources Reports No. 103. FAO, Rome.
Joosten, H. 2009. The Global Peatland CO2 Picture: Peatland Status and Drainage Related Emissions in All Countries of the World. Wetlands International, Ede, The Netherlands.
Kane, D. L. and L. D. Hinzman. 1988. Permafrost hydrology of a small arctic watershed. In Proceedings of the 5th International Conference on Permafrost, Tapir Publishers, Trondheim, Norway.
Kellogg, L. E. and S. D. Bridgham. 2003. Phosphorus retention and movement across an ombrotro-phic–minerotrophic peatland gradient. Biogeochemistry 63: 299–315.
Koch, M. S. and K. R. Reddy. 1992. Distribution of soil and plant nutrients along a trophic gradient in the Florida Everglades. Soil Sci. Soc. Am. J. 56: 1492–1499.
Koerselman, W., M. B. Van Kerkhoven, and J. T. A. Verhoeven. 1993. Release of inorganic N, P and K in peat soils; effect of temperature, water chemistry and water level. Biogeochemistry 20: 63–81.
Kolka, R. K., M. C. Rabenhorst, and D. Swanson. 2011. Histosols. Chapter 33.2. In P. M. Huang, Y. Li, and M. E. Sumner (Eds.) Handbook of Soil Sciences Properties and Processes, 2nd ed. CRC Press, Boca Raton, FL. pp. 33.8–33.29.
© 2016 by Taylor & Francis Group, LLC

307Soils of Peatlands
Korpijaako, M. and N. W. Radforth. 1972. Studies of the hydraulic conductivity of peat. In Proc. 4th Int. Peat Congr. V. 3. Otaniemi, Finland, pp. 323–334.
Lee, J. A., M. C. Press, S. Woodin, and P. Ferguson. 1987. Responses to acidic deposition in ombrotrophic mires in the U. K. In T. C. Hutchinson and K. M. Meema (Eds.) Effects of Atmospheric Pollutants on Forests, Wetlands and Agricultural Ecosystems. Springer-Verlag, Berlin, Germany, pp. 549–560.
Lehner, B. and P. Döll. 2004. Development and validation of a global database of lakes, reservoirs and wetlands. J. Hydrol. 296: 1–22.
Lévesque, M. P. and S. P. Mathur. 1979. A comparison of various means of measuring the degree of decomposition of virgin peat materials in the context of their relative biodegradability. Can. J. Soil Sci. 59: 397–400.
Malterer, T. J., E. S. Verry, and J. Erjavec. 1992. Fiber content and degree of decomposition in peats: A review of national methods. Soil Sci. Soc. Am. J. 56: 1200–1211.
Mathur, S. P. and R. S. Farnham. 1985. Geochemistry of humic substances in natural and cultivated peatlands. In G. R. Aiken, D. M. McKnight, R. L. Wershaw, and P. MacCarthy (Eds.) Humic Substances in Soil, Sediment, and Water: Geochemistry, Isolation, and Characterization. John Wiley & Sons, New York, NY, pp. 53–85.
Melton, J. R., R. Wania, E. Hodson, B. Poulter, B. Ringeval, R. Spahni, T. Bohn. et al. 2013. Present state of global wetland extent and wetland methane modelling: Conclusions from a model intercomparison project (WETCHIMP). Biogeosciences 10: 753–788.
Michaelson, G. J., C. L. Ping, and J. M. Kimble. 1996. Carbon storage and distribution in tundra soils of Arctic Alaska U.S.A. Arct. Alp. Res. 28: 414–424.
Moore, P. D. and D. J. Bellamy. 1974. Peatlands. Springer-Verlag, New York, NY.Moore, T. R. and R. Knowles. 1989. The influence of water table levels on methane and carbon diox-
ide emissions from peatland soils. Can. J. Soil Sci. 69: 33–38.National Wetlands Working Group. 1988. Wetlands of Canada. Sustainable Development Branch,
Environment Canada, Ontario, and Polyscience Publications, Montreal, Quebec, Canada.National Wetlands Working Group. 1997. The Canadian Wetland Classification System. Wetlands
Research Centre, University of Waterloo, Waterloo, Ontario, Canada.Nykanen, H., J. Alm, K. Lang, J. Silvola, and P. J. Martikainen. 1995. Emissions of CH4, N2O and CO2
from a virgin fen and a fen drained for grassland in Finland. J. Biogeogr. 22: 351–357.Ohlson, M. and R. H. Okland. 1998. Spatial variation in rates of carbon and nitrogen accumulation
in a boreal bog. Ecology 79: 2745–2758.Ovenden, L. 1990. Peat accumulation in northern wetlands. Quat. Res. 33: 377–386.Page, S. E., J. O. Rieley, and C. J. Banks. 2011. Global and regional importance of the tropical peatland
carbon pool. Glob. Change Biol. 17: 798–818.Päivänen, J. 1973. Hydraulic conductivity and water retention in peat soils. Acta For. Fenn. 129:
1–70.Parent, L. E. and J. Caron. 1993. Physical properties of organic soils. In M. R. Carter (Ed.) Soil Sampling
and Methods of Analysis. CRC Press, Boca Raton, FL, pp. 441–458.Péwé, T. 1975. Quaternary Geology of Alaska. Geological Survey Professional Paper 835, U.S. Geological
Survey. U.S. Govt. Printing Office. Washington, DC.Ping, C. L., J. G. Bockheim, J. M. Kimble, G. J. Michaelson, D. K. Swanson, and D. A. Walker. 1998.
Characteristics of cryogenic soils along a latitudinal transect in arctic Alaska. J. Geophy. Res. 103: 28917–28928.
Ping, C. L., G. J. Michaelson, and J. M. Kimble. 1997a. Carbon storage along a latitudinal transect in Alaska. Nutr. Cycl. Agroecosyst. 49: 235–242.
Ping, C. L., G. J. Michaelson, W. M. Loya, R. J. Candler, and R. L. Malcolm. 1997b. Characteristics of soil organic matter in Arctic ecosystems of Alaska. In R. Lal, J. M. Kimble, and B. A. Stewart (Eds.) Carbon Sequestration—Advances in Soil Science. CRC Press, Boca Raton, FL, pp. 157–167.
Racine, C. H. and J. C. Walters. 1994. Groundwater-discharge fens in the Tanana Lowlands, interior Alaska, U.S.A. Arc. Alp. Res. 26: 418–426.
Reeve, A. S., R. Evensen, P. H. Glaser, D. I. Siegel, and D. Rosenberry. 2006. Flow path oscillations in transient groundwater simulations of large peatland systems. J. Hydrol. 316: 313–324.
© 2016 by Taylor & Francis Group, LLC

308 Wetland Soils
Reeve, A. S., D. I. Siegel, and P. H. Glaser. 2000. Simulating vertical flow in large peatlands. J. Hydrol. 227: 207–217.
Rieger, S. 1983. The Genesis and Classification of Cold Soils. Academic Press, New York, NY.Riehle, J. R. 1985. A reconnaissance of the major Holocene tephra deposits in the upper Cook Inlet
region, Alaska. J. Volcano Geotherm. Res. 26: 37–74.Rydin, H. 1985. Effect of water level on desiccation of Sphagnum in relation to surrounding Sphagna.
Oikos 45: 374–379.Siegel, D. I. 1988. Evaluating cumulative effects of disturbance on the hydrologic function of bogs,
fens, and mires. Environ. Manag. 12: 621–626.Siegel, D. I. 1992. Groundwater hydrology. In H. E. Wright Jr., B. A. Coffin, and N. E. Aaseng (Eds.) The
Patterned Peatlands of Minnesota. University of Minnesota Press, Minneapolis, MN, pp. 163–172.Siegel, D. I. and P. H. Glaser. 1987. Groundwater flow in a bog/fen complex, Lost River Peatland,
northern Minnesota. J. Ecol. 75: 743–754.Silins, U. and R. L. Rothwell. 1998. Forest peatland drainage and subsidence affect soil water reten-
tion and transport properties in an Alberta peatland. Soil Sci. Soc. Am. J. 62: 1048–1056.Sjörs, H. 1950. On the relation between vegetation and electrolytes in north Swedish mire waters.
Oikos 2: 241–257.Soil Classification Working Group. 1998. The Canadian System of Soil Classification. Agriculture and
Agri-Food Canada Publication 1646, NRC Research Press, National Research Council of Canada, Ottawa, Canada.
Soil Survey Staff. 1998. Query for Histosol Soil Components in the National MUIR and STATSGO Data Sets 8/98. Natural Resource Conservation Service, USDA, Lincoln, NE and Statistical Laboratory, Iowa State University, Ames, IA.
Soil Survey Staff. 2014. Keys to Soil Taxonomy. 12th ed. USDA-Natural Resource Conservation Service, Washington, DC.
SSSA. 2008. Glossary of Soil Science Terms. Soil Science Society of America, Madison, WI.Stanek, W. and T. Silc. 1977. Comparisons of four methods for determination of degree of peat humi-
fication (decomposition) with emphasis on the von Post method. Can. J. Soil Sci. 57: 109–117.Strack, M, J. M. Waddington, and E. S. Tuittila. 2004. Effects of water table drawdown on northern
peatland methane dynamics: Implications for climate change. Glob. Biogeochem. Cycles 18: 4003.Tarnocai, C. 1998. The amount of organic carbon in various soil orders and ecological provinces
in Canada. In R. Lal, J. M. Kimble, R. F. Follett, and B. A. Stewart (Eds.) Soil Processes and the Carbon Cycle. CRC Press, Boca Raton, FL, pp. 81–92.
Tarnocai, C., J. G. Canadell, E. A. G. Schuur, P. Kuhry, G. Mazhitova, and S. Zimov. 2009, Soil organic carbon pools in the northern circumpolar permafrost region. Glob. Biogeochem. Cycles 23: GB2023. doi:10.1029/2008GB003327.
Tarnocai, C., C. A. S. Smith, and C. A. Fox. 1993. Guidebook—International Tour of Permafrost-Affected Soils in the Yukon and Northwest Territories of Canada. Centre for Land and Biological Resources, Research Branch, Agriculture Canada, Ottawa, Canada.
Titus, J. E. and D. J. Wagner. 1984. Carbon balance for two Sphagnum mosses: Water balance resolves a physiological paradox. Ecology 65: 1765–1774.
Updegraff, K., J. Pastor, S. D. Bridgham, and C. A. Johnston. 1995. Environmental and substrate controls over carbon and nitrogen mineralization in northern wetlands. Ecol. Appl. 5: 151–163.
Van Cleve, K., F. S. Chapin III, C. T. Dyrness, and L. A. Viereck. 1991. Element cycling in taiga forests: Statefactor control. BioScience 41: 78–88.
Verhoeven, J. T. A., E. Maltby, and M. B. Schmitz. 1990. Nitrogen and phosphorus mineralization in fens and bogs. J. Ecol. 78: 713–726.
Verry, E. S. 1997. Hydrological processes of natural, northern forested wetlands. In C. C. Trettin, M. F. Jurgensen, D. F. Grigal, M. R. Gale, and J. K. Jeglum (Eds.) Northern Forested Wetlands: Ecology and Management. CRC Press, Chelsea, MI, pp. 163–188.
Vitt, D. H. 2006. Functional characteristics and indicators of boreal peatlands. In R. K. Wieder and D. H. Vitt. (Eds.) Boreal Peatland Ecosystems. Springer, New York, NY, pp. 9–24.
© 2016 by Taylor & Francis Group, LLC

309Soils of Peatlands
Vitt, D. H. and W.-L. Chee. 1990. The relationships of vegetation to surface water chemistry and peat chemistry in fens of Alberta, Canada. Vegetatio 89: 87–106.
Walbridge, M. R. 1991. Phosphorus availability in acid organic soils of the Lower North Carolina Coastal Plain. Ecology 72: 2083–2109.
Waughman, G. J. 1980. Chemical aspects of the ecology of some south German peatlands. J. Ecol. 68: 1025–1046.
Weiss, R., J. Alm, R. Laiho, and J. Laine. 1998. Modeling moisture retention in peat soils. Soil Sci. Soc. Am. J. 62: 305–313.
Weltzin, J. F., C. Harth, S. D. Bridgham, J. Pastor, and M. Vonderharr. 2001. Production and microto-pography of bog bryophytes: Response to warming and water-table manipulations. Oecologia 128: 557–565.
Wilkinson, L., M. Hill, and E. Vang. 1992. Systat: Statistics. Systat, Inc., Evanston, IL.Yu, Z., J. Loisel, D. P. Brosseau, D. W. Beilman, and S. J. Hunt. 2010. Global peatland dynamics since
the Last Glacial Maximum. Geophys. Res. Lett. 37: L13402.Zoltai, S. C. and C. Tarnocai. 1971. Properties of a wooded palsa in northern Manitoba. Arc. Alp. Res.
3: 115–129.
© 2016 by Taylor & Francis Group, LLC