life insurance marketing: consumer behavior …life insurance marketing: consumer behavior approach...
TRANSCRIPT
Life Insurance Marketing:
Consumer Behavior
Approach
By Tomoki Inoue
Public Interest Incorporated Foundation
Oriental Life Insurance Cultural Development Center
Tokyo, Japan

i
Preface
In Japan, where the society faces serious depopulation with ongoing aging
and a declining birthrate, life insurance companies are confronted with the
structural changes of a shrinking market and shifting needs for security. The
sales agent channel that had for the longest time claimed a dominant presence
as the sales channel for life insurance is losing contact with consumers, since
fewer people are at home during the daytime in light of the rise in
double-income families and due to more restrictions on solicitation activities in
the workplace against the backdrop of an increased awareness of the dangers of
information leakage. On the other hand, new channels have come onto the
scene, including direct sales channels, mainly online life insurance companies,
and independent insurance shops handling products from different insurance
companies leading to the rapid diversification of sales channels in the life
insurance industry over the past decade or so. Meanwhile, the asymmetric
nature between the seller and the buyer in terms of the predominance of
information is rapidly disappearing with the advances in information
technology and the spread of the Internet among general consumers. The days
when it was said "life insurance is a product that is necessary but faces weak
demand; therefore, consumers cannot recognize the necessity of life insurance
unless the needs are aroused through push-strategy channels” are long gone,
and there seems to be more and more consumers who are aware of their need
for security, examine proactively, and make the decision to purchase insurance.
In order for the life insurance industry to accommodate such changes on the
consumers’ part, it is necessary to first deepen our understanding of the actual
actions of consumers, namely the actions they take when examining the
possibility of taking out life insurance and their thinking behind these actions.
This book is based on an article published in a 33-article series in the insurance
industry newspaper, Insurance Scoop, between March 2009 and October 2013.
In Part 1, the details of consumers’ actions and thoughts are shown in line
with the framework explaining the purchase process of general goods and
services with a focus on the decision-making process and series of actions
consumers take when getting a life insurance product. In the chapters of Part 1,
the specific actions and thoughts of consumers in the various stages of the
purchase process are explained. However, there is no chapter to outline the
overview of the purchase process as a whole. This is out of the concern that
providing an outline might rather end up distorting the recognition that
consumers are diverse. I hope the reader will grasp the big picture of the
purchase process from reading through Part 1.
In Part 2, the characteristics of consumer segments classified into
subdivisions according to various axes are explained with a focus on consumer
ii
heterogeneity. As mentioned above, consumers are diverse. Moreover, we talk
about life insurance as such; however, products to provide compensation for
bereaved families and those for medical security or old-age security have
different elements to be considered when making the decision to purchase,
including marketability or other methods of preparation that may serve as
alternatives. The hope is that revealing the differences and similarities among
consumers or product types will serve to deepen the understanding towards the
consumer life insurance purchase process as set forth in Part 1.
As the environment surrounding consumers and the consumers themselves
have changed since this text first started to be serialized in Insurance Scoop, I
have updated the various statistics and figures to the most recent reports
available and significantly revised some of the expressions. Furthermore,
statistics that had been omitted due to space constraints in the original
publication have all been added. Individual data from the quantitative survey1
conducted in January 2013 by the NLI Research Institute, to which the author
belongs, is used for the analyses in this book unless specifically stated
otherwise.
I would not have had the opportunity to systematically rearrange this
literature had my series of articles that was merely collected into three
brochures gone unnoticed. The English edition based on this rearranged paper
could not have been published without the tremendous support of the Oriental
Life Insurance Cultural Development Center. I note here my deep gratitude.
It will be my great joy if this book would serve to deepen the readers’
understanding of the Japanese life insurance market and consumers, and
furthermore be useful to understand the consumers of your own country by
reflecting on the differences between our market and yours.
September 2014
Tomoki Inoue
1 The outline of the survey is as follows.
Survey subjects: men and women between the ages of 20 and 69 (panel registered with survey company) Survey method: online survey. Number of valid data samples collected: 5,309 respondents (of which 4,021 were policyholders and 1,288 were non-policyholders)
iii
Tomoki Inoue
Analyst
Social Improvement & Life Design Research Department
NLI Research Institute
Specializes in consumer behavior, financial marketing.
2003 Completed the Systems Management Masters’ Program
(MBA) at the Graduate School of Systems Management,
University of Tsukuba
1995 Joined the Japan Institute of Life Insurances
2004 Joined NLI Research Institute, Social Development Research
Department
Since 2006 Transferred to the Social Improvement & Life Design
Research Department within the NLI Research Institute
(concurrent position as part time lecturer at Toyo University
and the University of Yamanashi)
2003–2009 Part-time lecturer at Seijo University, Faculty of Economics
Since 2006 Part-time lecturer at Toyo University, Faculty of Economics,
Since 2010 Part-time lecturer at the University of Yamanashi, Faculty of
Education and Human Sciences
2011–2012 Part-time lecturer at Hosei University, Faculty of Lifelong
Learning and Career Studies
Since 2013 Part-time lecturer at the University of Yamanashi, Faculty of
Life and Environmental Sciences
iv
Contents
Preface .......................................................................................................... i Part 1 The Process of considering taking out a Life Insurance .................. 1 Chapter 1: Introduction ..................................................................................... 1
1. Changes in consumers’ purchasing process ............................................... 1 2. Changes in Consumer Behavior pertaining to Life Insurance ................... 2
Chapter 2: The Process of the Recognition Stage ............................................. 4 1. The established theory of the life insurance industry ................................. 4 2. Consumers that come to buy insurance ................................................... 4 3. Consumer decision process in the consumer behavior theory ................... 6 4. What’s needed is not to arouse needs but to listen attentively ................... 7 5. What makes people think of getting insurance? ......................................... 7 6. Effects on the process of “Search” and those that follow .......................... 9
Chapter 3: Emotion Stage of the Search Process ............................................ 12 1. Timing of External Search ....................................................................... 12 2. Use of Information Source ....................................................................... 14 3. Understanding the Actual Conditions and Background of External Search
Behavior is Required ................................................................................ 16 4. Internet as a Source of Information .......................................................... 17
4-1. Characteristics by attribution ........................................................... 18 4-2. Characteristics by awareness............................................................ 18 4-3. The reason behind people collecting information on the Internet .... 21
5. The required action against consumers trying to arm themselves with
knowledge ................................................................................................ 22 6. The Contents of Information Consumers Search for When Considering
Taking Out Insurance ............................................................................... 23 6-1. The contents of information that consumers search for ................... 23 6-2. Information source and contents of information .............................. 27 6-3. The Level of satisfaction and loyalty, and the contents of information
searched ............................................................................................ 28 Chapter 4: The Process of Comparison and Examination at the Emotion Stage
....................................................................................................... 30 1. The actualities of consumers’ actions of comparison ............................... 30 2. Where the factors that support the act of comparing lay .......................... 33 3. Consumers’ sense of conviction ............................................................... 34
3-1. Knowledge level at the time of considering taking out a policy ...... 35 3-2. The importance of having consumers deepen their knowledge
through comparison and examination .............................................. 37 4. Target and Scope of Comparison and Examination ................................. 39
4-1. The number of competing companies—changes in the consideration
set ..................................................................................................... 39
v
4-2. Scope of competing products and services ...................................... 40 Chapter 5: Purchase Process in the Action Stage ............................................ 44
1. The Importance of Price (Insurance Premium) in Selecting Insurance
Products.................................................................................................... 44 1-1. The Significance of “Price (Insurance Premium)” for the Consumer
......................................................................................................... 44 1-2. The Significance of the Insurance Premium as the Final Determining
Factor ............................................................................................... 46 2. Consumers’ Level of Understanding of the Products and the Satisfaction
with Price Adequacy and Necessity of Assurance ................................... 48 2-1. Consumers’ level of understanding of products at the time of taking
out insurance .................................................................................... 49 2-2. Level of satisfaction with price adequacy and understanding of
necessity at the time of taking out insurance.................................... 51 3. Decision Making in the Action Stage....................................................... 54
3-1. Reason for choosing the company from which to take out insurance
......................................................................................................... 54 3-2. Reason for choosing the channel from which people took out their
insurance .......................................................................................... 55 3-3. The final determining factor in making the decision ....................... 56
4. The Image of the Desired Human Channel .............................................. 57 4-1. Image of human channels................................................................. 58 4-2. The desired human channel .............................................................. 60
Chapter 6: The Sharing Process in the Action Stage ....................................... 62 1. Customer Satisfaction and Loyalty .......................................................... 62
1-1. Loyalty differs depending on the level of satisfaction ..................... 62 1-2. Factors leading to differences in satisfaction levels ......................... 63
2. What Causes Dissatisfaction? .................................................................. 66 2-1. Insurance premium and type of product taken out by the dissatisfied
group ................................................................................................ 67 2-2. The dissatisfied group’s process of considering taking out insurance
......................................................................................................... 68 2-3. The loyalty of the dissatisfied group ................................................ 70
3. Situation of Sharing (Share) Pertaining to Life Insurance ....................... 71 3-1. How WOM related to life insurance is generated ............................ 71 3-2. Characteristics of consumers who rely on WOM ............................ 73 3-3. The status of WOM dissemination and the characteristics of those
who spread the word ........................................................................ 75 4. How important is following up? .............................................................. 77
4-1. Situation with follow-up activities ................................................... 78 4-2. Fruits of following up ...................................................................... 80
Part 2 Consumer Segment and Process of Considering Taking Out
vi
Insurance ....................................................................................... 84 Chapter 1: Status of Having Life Insurance and Consumer Heterogeneity .... 84
1. Changes in the consumers’ process of considering taking out insurance . 84 2. The consumer segment and action of considering taking out insurance .. 85 3. The situation of life insurance ownership ................................................ 87
3-1. The situation of people with coverage considering taking out
insurance .......................................................................................... 88 3-2. The situation with non-policyholders ............................................... 93
Chapter 2: Segmentation Based on Demographic Attribution ........................ 99 1. Life insurance coverage held by the younger generation ......................... 99
1-1. The actual status of coverage among the younger generation ........ 100 1-2. The savings/investment behaviors and awareness of the younger
generation ....................................................................................... 104 2. Need for protection by the core target insurance group ......................... 110
2-1. Family structure ............................................................................. 110 2-2. Life insurance coverage ................................................................. 111 2-3. Background factors for protection needs ....................................... 112 2-4. Intention to get coverage going forward ........................................ 113
3. Household Circumstances and Intention to Get Insurance .................... 116 3-1. Household circumstances ............................................................... 117 3-2. Segmentation by household circumstances and insurance coverage
....................................................................................................... 118 3-3. Segment of household circumstances and level of satisfaction...... 121
Chapter 3: Consumer Insurance Literacy and Actions to Examine the
Possibility of Getting Insurance .................................................. 124 1. Formative Factors of Insurance Literacy ............................................... 124
1-1. Basic knowledge of insurance ........................................................ 124 1-2. Formative factors of insurance literacy .......................................... 127
2. Insurance literacy and actions taken when examining the possibility of
taking out insurance ............................................................................... 132 3. Insurance literacy and the channel of choice/level of satisfaction ......... 135 4. The Brand of the Life Insurance Company and Actions to Take Out
Insurance ................................................................................................ 139 4-1. Brand in marketing ......................................................................... 139 4-2. The brand image of life insurance companies ................................ 140
Chapter 4: Differences in the Actions of Examination by Products and
Channels ...................................................................................... 144 1. Verifying the argument that medical insurance is unnecessary .............. 145
1-1. Knowledge on insurance and insurance needs ............................... 146 1-2. Outstanding financial assets and insurance needs .......................... 147 1-3. Insurance literacy, outstanding financial assets and needs for security
....................................................................................................... 149

vii
2. Actions of Examination Taken by Medical Insurance Policyholders..... 151 2-1. Situation of medical insurance products ........................................ 151 2-2. Reason for getting insurance differing by generation .................... 153 2-3. The examination process and determining factor when taking out
insurance ........................................................................................ 154 3. Actions of Examinations taken by People with Annuities ..................... 158
3-1. Situation of annuity products ......................................................... 158 3-2. Reason for examining the possibility of getting insurance ............ 159 3-3. The examination process and determining factor when taking out
annuities ......................................................................................... 160 3-4. Examination process that differs depending on insurance literacy 162
4. Consumers who Use the Shop Channel (independent insurance shops) 164 4-1. Recognition of independent insurance shops ................................. 165 4-2. Use of independent insurance shops .............................................. 166 4-3. Reason for choosing independent insurance shops ........................ 169 4-4. Outlook going forward ................................................................... 173

viii
1
Part 1 The Process of considering taking out a Life Insurance
Chapter 1: Introduction
1. Changes in consumers’ purchasing process
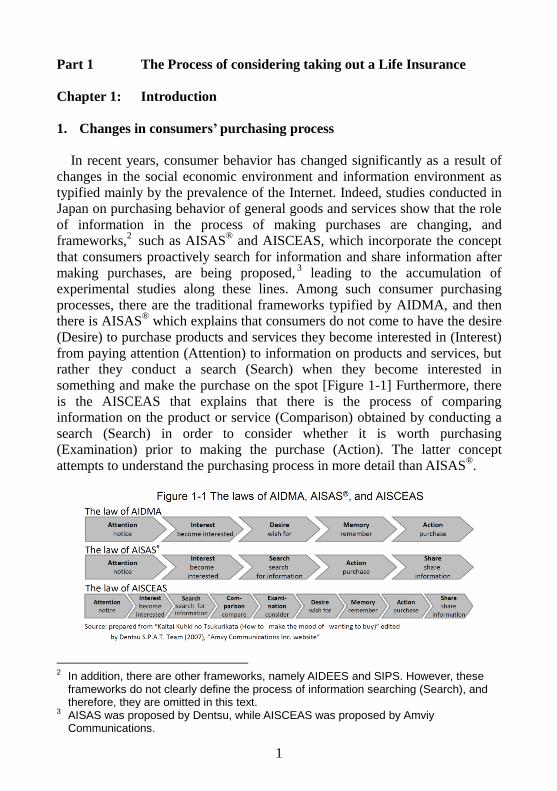
In recent years, consumer behavior has changed significantly as a result of
changes in the social economic environment and information environment as
typified mainly by the prevalence of the Internet. Indeed, studies conducted in
Japan on purchasing behavior of general goods and services show that the role
of information in the process of making purchases are changing, and
frameworks,2 such as AISAS
® and AISCEAS, which incorporate the concept
that consumers proactively search for information and share information after
making purchases, are being proposed,3 leading to the accumulation of
experimental studies along these lines. Among such consumer purchasing
processes, there are the traditional frameworks typified by AIDMA, and then
there is AISAS®
which explains that consumers do not come to have the desire
(Desire) to purchase products and services they become interested in (Interest)
from paying attention (Attention) to information on products and services, but
rather they conduct a search (Search) when they become interested in
something and make the purchase on the spot [Figure 1-1] Furthermore, there
is the AISCEAS that explains that there is the process of comparing
information on the product or service (Comparison) obtained by conducting a
search (Search) in order to consider whether it is worth purchasing
(Examination) prior to making the purchase (Action). The latter concept
attempts to understand the purchasing process in more detail than AISAS®
.
2 In addition, there are other frameworks, namely AIDEES and SIPS. However, these
frameworks do not clearly define the process of information searching (Search), and therefore, they are omitted in this text.
3 AISAS was proposed by Dentsu, while AISCEAS was proposed by Amviy Communications.
2
These are frameworks designed to understand consumers and have been
proposed mainly for the purpose of contributing to advertisement strategies,
namely identifying the necessary medium and messages for companies to
convey information at an appropriate timing to consumers. Indeed, there are
some that maintain the process should be divided into three stages,4
categorizing attention (Attention) as the (1) recognition stage; interest
(Interest), search for information (Search), comparison (Comparison) and
examination (Examination) as the (2) emotion stage; and purchase (Action)
and information sharing (Share) as the (3) action stage; and the medium for
reaching out to the consumers, the contents of the message, and KPI should be
changed depending on the respective stages.
2. Changes in Consumer Behavior pertaining to Life Insurance
As seen above in the purchase behavior of general goods and services,
consumers are now going through the process of searching, comparing, and
examining different information to make purchases, and then they share
information on the purchased goods or services or its providers with people
close to them or over the Internet.
In the social economic and information environment of the recent years,
what kind of process are consumers going through to purchase life insurance?
When taking out life insurance, the preferable amount of coverage differs
depending on the family structure and the income and asset status, and in some
cases, the requirements for benefit payment differ between companies;
therefore, it is highly difficult for a general consumer to fully understand the
products, to make comparisons, and to select which product they should
purchase on their own. Furthermore, upon actually making the purchase, not all
policyholders will receive insurance money or benefits, and even if they do
receive insurance money or benefits, it may take a long time, perhaps decades,
before the money is actually received, or the beneficiary may be different from
the policyholder, such as in the case of insurance against death; therefore, it
seems difficult to share the assessment on whether or not the life insurance
purchased was good or bad.
However, in a focused group interview on life insurance we conducted in the
past, people exhibited behaviors of trying to search and make decisions on their
own or to acquire knowledge as can be seen in comments, such as “I won free
consulting by a financial planner when renewing my policy and was
recommended an assurance offered by a foreign capital insurance company, so
I compared several companies on an insurance comparison website” or “I
searched for life insurance on Yahoo!, added the websites of the companies
4 Some point out that Interest should be included in the (1) recognition stage.
3
from the search result to my favorites, and reviewed them over a couple of
days. I thought I’d check what kind of insurance others were getting to obtain
advance knowledge first on what product of which company was good.” So it
seems that consumers also go through the process of searching for information
and making assessments by comparing companies using comparison sites or
comparing the websites of the individual companies to determine which policy
to buy or which company to go with in the process of a taking out insurance. It
can be considered that the changes in the purchasing behavior for general
goods and services described above are also taking place in the field of life
insurance. According to the laws of AISCEAS; the process of taking out a life
insurance can be outlined as the need is aroused (A, I) by the approach from
the seller, such as sales agents or life events; then information is collected (S)
from the Internet, brochures, or specific proposals, compared and examined (C,
E); and then the contract is concluded (A); and at the same time, the
assessment on the insurance company, its personnel, and the product details is
disseminated (S) by word of mouth to family members, friends, and
acquaintances.
In Part 1, among the various frameworks pertaining to the consumer
purchasing process suggested, we will look at the specific behaviors and
thoughts of consumers in the different stages of taking out an insurance policy
according to the laws of AISCEAS that captures the purchasing process in the
most segmented way.
4
Chapter 2: The Process of the Recognition Stage
1. The established theory of the life insurance industry
"People don't want to think about death, which is a bad omen," "Insurance
(especially life insurance) is a product that is necessary but faces weak demand,
therefore, will not sell if demand is not aroused." It is probably safe to say
these are established industry theories that everyone in the life insurance
industry would know very well. It has been said so for years and I have heard it
myself a number of times. However, recently, we are starting to see people
think of and prepare in advance for their death or after death by arranging for
their graves or writing their wills or having their funeral performed while they
are still alive, for example. Furthermore, as mentioned in the previous chapter,
word of mouth (WOM) has become one of the triggers for consumers to
consider taking out an insurance policy. Thus, the tendency to consider it a
taboo to talk about illness or death, which is deeply related to life insurance
products, seems to be waning greatly. Rather, products and services answering
to the needs of those who want to prepare for their after death seem to have
become less uncommon with Will Kits that assist people to prepare their own
handwritten will and Ending Notes for writing down what people want for their
terminal care or nursing care, their wishes regarding their funeral and grave, as
well as information on their insurance and properties, being sold.
So, is the industry's established theory, "insurance is a product that is
necessary but faces weak demand, therefore, will not sell if demand is not
aroused," still valid today?
2. Consumers that come to buy insurance
In recent years, the sales channel for life insurance has diversified to include
retail stores, bancassurance, and the Internet (direct sales). As for
bancassurance, there are cases where insurance products are sold not only by
tellers but also by liaison officers making rounds, however, retail stores and the
Internet (direct sales) channels both require consumers to go to the store in
person or visit the website themselves, and this is decisively different from the
traditional push-based personal channel such as sales agents and agencies that
life insurance companies had developed. A sense of crisis on the part of life
insurance companies, that the ratio of contact through the traditional channel is falling due to fewer people being home and enhanced security measures in the
workplace, seems to exist behind the diversification of sales channels. Then
again, if the reality were as the above mentioned theory, would it not be that
the consumers would stay away from these retail stores or the websites of life
insurance companies on the Internet, apart from having to have to visit for
5
necessary procedures after taking out the insurance?
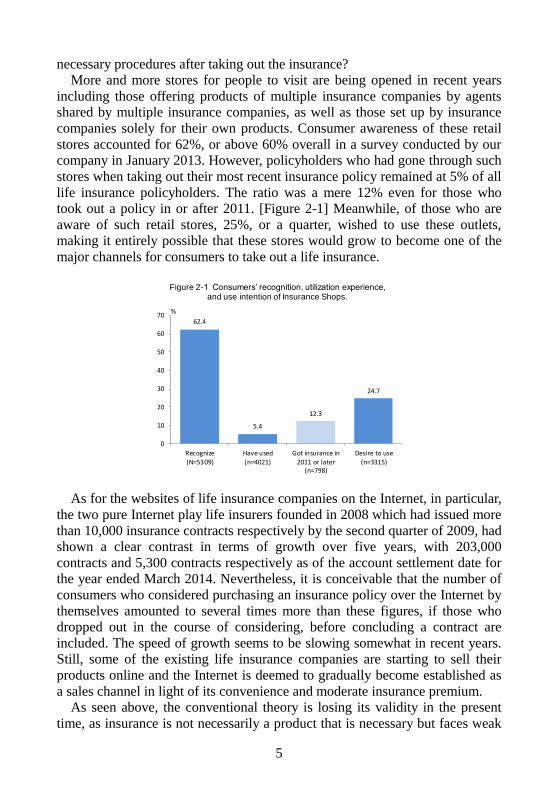
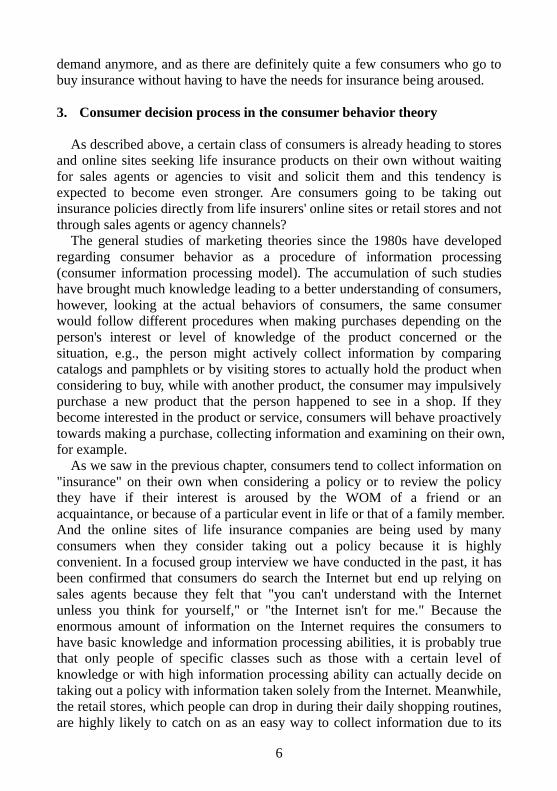
More and more stores for people to visit are being opened in recent years
including those offering products of multiple insurance companies by agents
shared by multiple insurance companies, as well as those set up by insurance
companies solely for their own products. Consumer awareness of these retail
stores accounted for 62%, or above 60% overall in a survey conducted by our
company in January 2013. However, policyholders who had gone through such
stores when taking out their most recent insurance policy remained at 5% of all
life insurance policyholders. The ratio was a mere 12% even for those who
took out a policy in or after 2011. [Figure 2-1] Meanwhile, of those who are
aware of such retail stores, 25%, or a quarter, wished to use these outlets,
making it entirely possible that these stores would grow to become one of the
major channels for consumers to take out a life insurance.
As for the websites of life insurance companies on the Internet, in particular,
the two pure Internet play life insurers founded in 2008 which had issued more
than 10,000 insurance contracts respectively by the second quarter of 2009, had
shown a clear contrast in terms of growth over five years, with 203,000
contracts and 5,300 contracts respectively as of the account settlement date for
the year ended March 2014. Nevertheless, it is conceivable that the number of
consumers who considered purchasing an insurance policy over the Internet by
themselves amounted to several times more than these figures, if those who
dropped out in the course of considering, before concluding a contract are
included. The speed of growth seems to be slowing somewhat in recent years. Still, some of the existing life insurance companies are starting to sell their
products online and the Internet is deemed to gradually become established as
a sales channel in light of its convenience and moderate insurance premium.
As seen above, the conventional theory is losing its validity in the present
time, as insurance is not necessarily a product that is necessary but faces weak
62.4
5.4
12.3
24.7
0
10
20
30
40
50
60
70
Recognize(N=5309)
Have used(n=4021)
Got insurance in2011 or later
(n=798)
Desire to use(n=3315)
%
Figure 2-1 Consumers’ recognition, utilization experience,and use intention of Insurance Shops.
6
demand anymore, and as there are definitely quite a few consumers who go to
buy insurance without having to have the needs for insurance being aroused.
3. Consumer decision process in the consumer behavior theory
As described above, a certain class of consumers is already heading to stores
and online sites seeking life insurance products on their own without waiting
for sales agents or agencies to visit and solicit them and this tendency is
expected to become even stronger. Are consumers going to be taking out
insurance policies directly from life insurers' online sites or retail stores and not
through sales agents or agency channels?
The general studies of marketing theories since the 1980s have developed
regarding consumer behavior as a procedure of information processing
(consumer information processing model). The accumulation of such studies
have brought much knowledge leading to a better understanding of consumers,
however, looking at the actual behaviors of consumers, the same consumer
would follow different procedures when making purchases depending on the
person's interest or level of knowledge of the product concerned or the
situation, e.g., the person might actively collect information by comparing
catalogs and pamphlets or by visiting stores to actually hold the product when
considering to buy, while with another product, the consumer may impulsively
purchase a new product that the person happened to see in a shop. If they
become interested in the product or service, consumers will behave proactively
towards making a purchase, collecting information and examining on their own,
for example.
As we saw in the previous chapter, consumers tend to collect information on
"insurance" on their own when considering a policy or to review the policy
they have if their interest is aroused by the WOM of a friend or an
acquaintance, or because of a particular event in life or that of a family member.
And the online sites of life insurance companies are being used by many
consumers when they consider taking out a policy because it is highly
convenient. In a focused group interview we have conducted in the past, it has
been confirmed that consumers do search the Internet but end up relying on
sales agents because they felt that "you can't understand with the Internet
unless you think for yourself," or "the Internet isn't for me." Because the
enormous amount of information on the Internet requires the consumers to
have basic knowledge and information processing abilities, it is probably true that only people of specific classes such as those with a certain level of
knowledge or with high information processing ability can actually decide on
taking out a policy with information taken solely from the Internet. Meanwhile,
the retail stores, which people can drop in during their daily shopping routines,
are highly likely to catch on as an easy way to collect information due to its
7
convenience, and may well win over consumers who cannot make their
decision based solely on information on the Internet, to the extent these stores
have the presence of humans that can mediate. In determining which channel
the respective consumers would actually use, whether or not they can obtain
information that is easy to understand based on their own level of knowledge,
and whether or not the channel helps remove their concerns, seems to be a big
factor. What is common for all channels, no matter which, is that they help lead
the consumers to a specific product according to their own needs or their
concerns behind the needs.
4. What’s needed is not to arouse needs but to listen attentively
As mentioned in the beginning, the sense of feeling that people don't want to
think about death, which is a bad omen, seems to be waning greatly in recent
years. Consumers take up insurance as a topic of their WOM and do recognize
the necessity of life insurance in everyday life, making comments, such as "I
sort of did feel the necessity" or "I did think it was something to get when you
started working."
Which channel a consumer who starts considering taking out an insurance
policy would go through depends on the amount of knowledge and the ability
to process information of the respective consumers as well as whether he or she
would want someone to mediate, or in other words, whether he or she would
prefer to go through a personal channel or prefer a channel that does not
require meeting a person. In any case, perhaps what is required of the vendors
is not to arouse the needs of the consumers but to listen to the concerns behind
the needs to take out a life insurance policy and to provide measures (solutions)
that would be appropriate to alleviate these concerns.
In the next chapter, we will review consumer behavior with a focus on the
recognition stages of attention and interest in the purchase process described in
the laws of AISCEAS explained in the introduction, and clarify the factors that
affect the process of searching for information (search) and those that follow.
5. What makes people think of getting insurance?
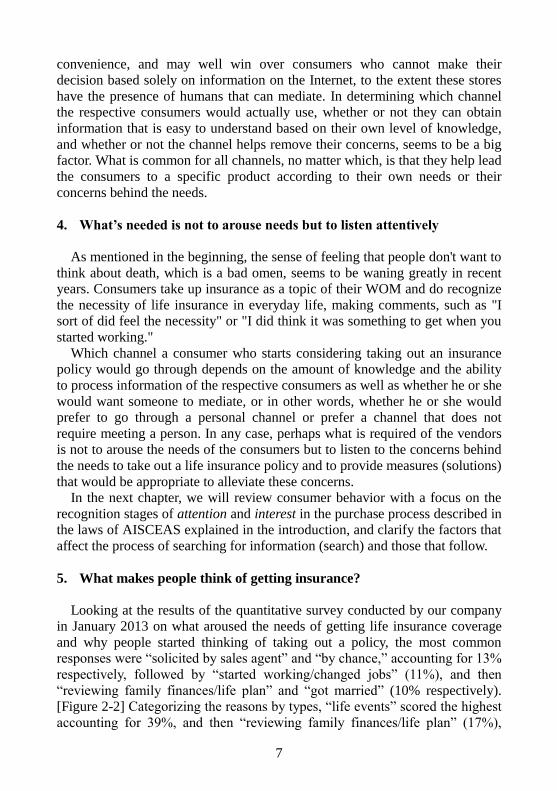
Looking at the results of the quantitative survey conducted by our company
in January 2013 on what aroused the needs of getting life insurance coverage
and why people started thinking of taking out a policy, the most common responses were “solicited by sales agent” and “by chance,” accounting for 13%
respectively, followed by “started working/changed jobs” (11%), and then
“reviewing family finances/life plan” and “got married” (10% respectively).
[Figure 2-2] Categorizing the reasons by types, “life events” scored the highest
accounting for 39%, and then “reviewing family finances/life plan” (17%),
8
“solicited” (16%), “WOM” (14%) and “commercials, direct mail, etc.” (12%)
securing over 10% each, showing that the individual’s life event or life
planning was more likely to be the motivation than approaches made by life
insurance companies or sales agents.
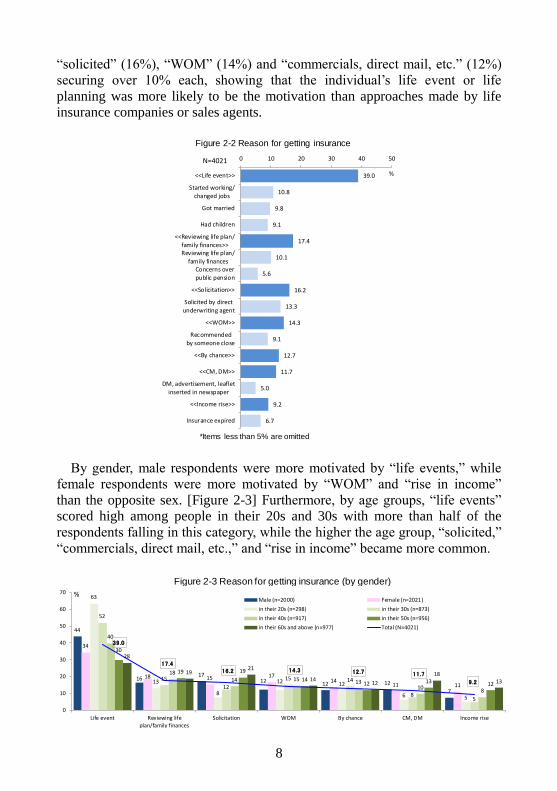
By gender, male respondents were more motivated by “life events,” while
female respondents were more motivated by “WOM” and “rise in income”
than the opposite sex. [Figure 2-3] Furthermore, by age groups, “life events”
scored high among people in their 20s and 30s with more than half of the
respondents falling in this category, while the higher the age group, “solicited,”
“commercials, direct mail, etc.,” and “rise in income” became more common.
39.0
10.8
9.8
9.1
17.4
10.1
5.6
16.2
13.3
14.3
9.1
12.7
11.7
5.0
9.2
6.7
0 10 20 30 40 50
<<Life event>>
Started working/
changed jobs
Got married
Had children
<<Reviewing life plan/
family finances>>Reviewing life plan/
family financesConcerns over
public pension
<<Solicitation>>
Solicited by direct
underwriting agent
<<WOM>>
Recommended
by someone close
<<By chance>>
<<CM, DM>>
DM, advertisement, leaflet
inserted in newspaper
<<Income rise>>
Insurance expired
N=4021
%
*Items less than 5% are omitted
Figure 2-2 Reason for getting insurance
44
1617
12 12 12
7
34
18 15 1714
11 11
63
13
8
12 12
6 5
52
15
12
15 14
85
40
1814 15 13
108
30
19 19
1412 13 12
28
1921
1412
1813
39.0
17.416.2 14.3 12.7 11.7
9.2
0
10
20
30
40
50
60
70
Life event Reviewing lifeplan/family finances
Solicitation WOM By chance CM, DM Income rise
Male (n=2000) Female (n=2021)
in their 20s (n=298) in their 30s (n=873)
in their 40s (n=917) in their 50s (n=956)
in their 60s and above (n=977) Total (N=4021)
%
Figure 2-3 Reason for getting insurance (by gender)
9
6. Effects on the process of “Search” and those that follow
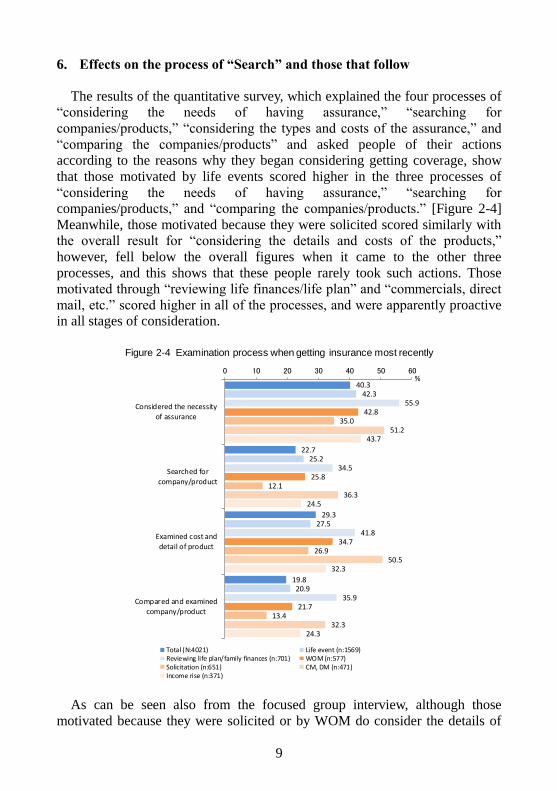
The results of the quantitative survey, which explained the four processes of
“considering the needs of having assurance,” “searching for
companies/products,” “considering the types and costs of the assurance,” and
“comparing the companies/products” and asked people of their actions
according to the reasons why they began considering getting coverage, show
that those motivated by life events scored higher in the three processes of
“considering the needs of having assurance,” “searching for
companies/products,” and “comparing the companies/products.” [Figure 2-4]
Meanwhile, those motivated because they were solicited scored similarly with
the overall result for “considering the details and costs of the products,”
however, fell below the overall figures when it came to the other three
processes, and this shows that these people rarely took such actions. Those
motivated through “reviewing life finances/life plan” and “commercials, direct
mail, etc.” scored higher in all of the processes, and were apparently proactive
in all stages of consideration.
As can be seen also from the focused group interview, although those
motivated because they were solicited or by WOM do consider the details of
40.3
22.7
29.3
19.8
42.3
25.2
27.5
20.9
55.9
34.5
41.8
35.9
42.8
25.8
34.7
21.7
35.0
12.1
26.9
13.4
51.2
36.3
50.5
32.3
43.7
24.5
32.3
24.3
0 10 20 30 40 50 60
Considered the necessityof assurance
Searched for
company/product
Examined cost anddetail of product
Compared and examinedcompany/product
Total (N:4021) Life event (n:1569)Reviewing life plan/family finances (n:701) WOM (n:577)Solicitation (n:651) CM, DM (n:471)Income rise (n:371)
%
Figure 2-4 Examination process when getting insurance most recently
10
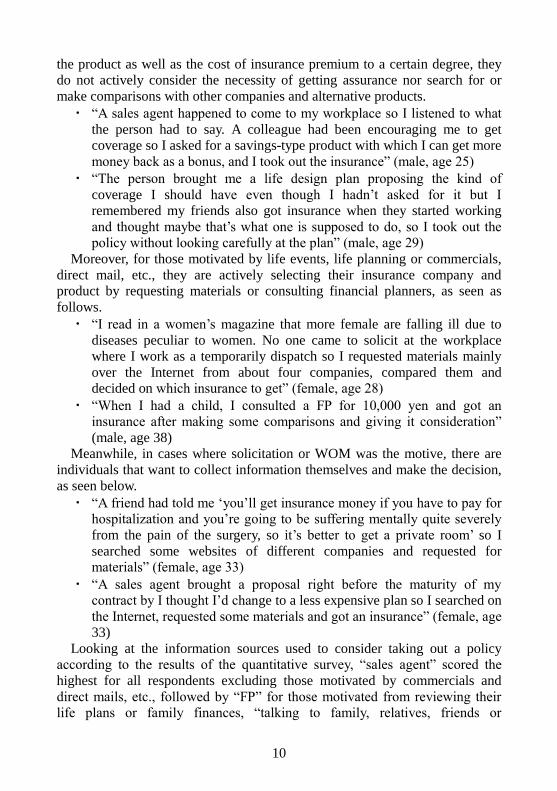
the product as well as the cost of insurance premium to a certain degree, they
do not actively consider the necessity of getting assurance nor search for or
make comparisons with other companies and alternative products.
・ “A sales agent happened to come to my workplace so I listened to what
the person had to say. A colleague had been encouraging me to get
coverage so I asked for a savings-type product with which I can get more
money back as a bonus, and I took out the insurance” (male, age 25)
・ “The person brought me a life design plan proposing the kind of
coverage I should have even though I hadn’t asked for it but I
remembered my friends also got insurance when they started working
and thought maybe that’s what one is supposed to do, so I took out the
policy without looking carefully at the plan” (male, age 29)
Moreover, for those motivated by life events, life planning or commercials,
direct mail, etc., they are actively selecting their insurance company and
product by requesting materials or consulting financial planners, as seen as
follows.
・ “I read in a women’s magazine that more female are falling ill due to
diseases peculiar to women. No one came to solicit at the workplace
where I work as a temporarily dispatch so I requested materials mainly
over the Internet from about four companies, compared them and
decided on which insurance to get” (female, age 28)
・ “When I had a child, I consulted a FP for 10,000 yen and got an
insurance after making some comparisons and giving it consideration”
(male, age 38)
Meanwhile, in cases where solicitation or WOM was the motive, there are
individuals that want to collect information themselves and make the decision,
as seen below.
・ “A friend had told me ‘you’ll get insurance money if you have to pay for
hospitalization and you’re going to be suffering mentally quite severely
from the pain of the surgery, so it’s better to get a private room’ so I
searched some websites of different companies and requested for
materials” (female, age 33)
・ “A sales agent brought a proposal right before the maturity of my
contract by I thought I’d change to a less expensive plan so I searched on
the Internet, requested some materials and got an insurance” (female, age
33)
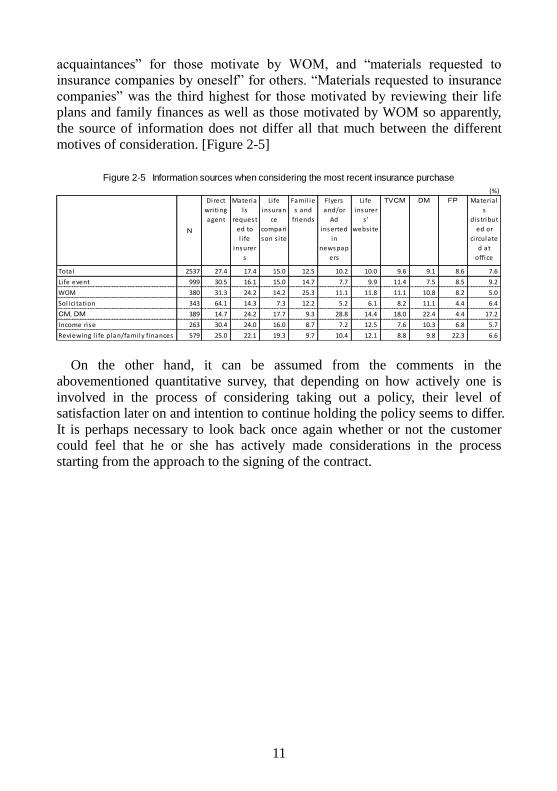
Looking at the information sources used to consider taking out a policy according to the results of the quantitative survey, “sales agent” scored the
highest for all respondents excluding those motivated by commercials and
direct mails, etc., followed by “FP” for those motivated from reviewing their
life plans or family finances, “talking to family, relatives, friends or
11
acquaintances” for those motivate by WOM, and “materials requested to
insurance companies by oneself” for others. “Materials requested to insurance
companies” was the third highest for those motivated by reviewing their life
plans and family finances as well as those motivated by WOM so apparently,
the source of information does not differ all that much between the different
motives of consideration. [Figure 2-5]
On the other hand, it can be assumed from the comments in the
abovementioned quantitative survey, that depending on how actively one is
involved in the process of considering taking out a policy, their level of
satisfaction later on and intention to continue holding the policy seems to differ.
It is perhaps necessary to look back once again whether or not the customer
could feel that he or she has actively made considerations in the process
starting from the approach to the signing of the contract.
(%)
N
Direct
writing
agent
Materia
ls
request
ed to
l i fe
insurer
s
Li fe
insuran
ce
compari
son s i te
Fami l ie
s and
friends
Flyers
and/or
Ad
inserted
in
newspap
ers
Li fe
insurer
s '
webs ite
TVCM DM FP Materia l
s
dis tribut
ed or
ci rculate
d at
office
Total 2537 27.4 17.4 15.0 12.5 10.2 10.0 9.6 9.1 8.6 7.6
Li fe event 999 30.5 16.1 15.0 14.7 7.7 9.9 11.4 7.5 8.5 9.2
WOM 380 31.3 24.2 14.2 25.3 11.1 11.8 11.1 10.8 8.2 5.0
Sol ici tation 343 64.1 14.3 7.3 12.2 5.2 6.1 8.2 11.1 4.4 6.4
CM, DM 389 14.7 24.2 17.7 9.3 28.8 14.4 18.0 22.4 4.4 17.2
Income rise 263 30.4 24.0 16.0 8.7 7.2 12.5 7.6 10.3 6.8 5.7
Reviewing l i fe plan/fami ly finances 579 25.0 22.1 19.3 9.7 10.4 12.1 8.8 9.8 22.3 6.6
Figure 2-5 Information sources when considering the most recent insurance purchase
12
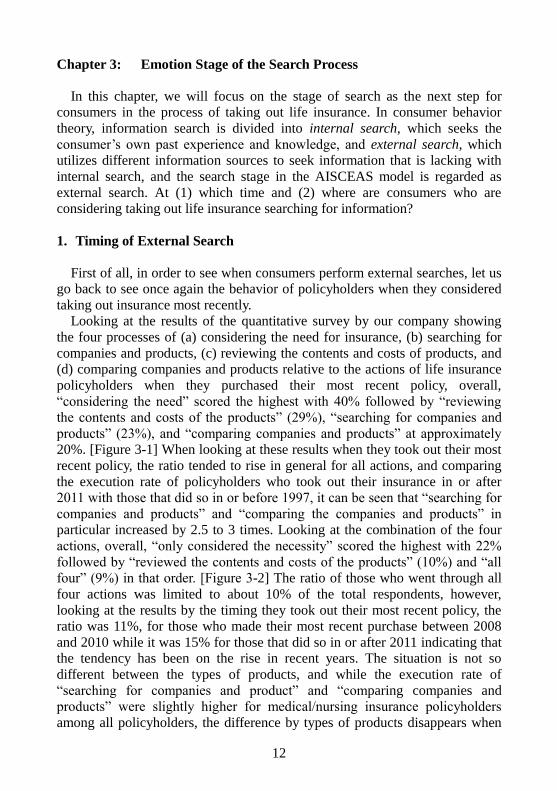
Chapter 3: Emotion Stage of the Search Process
In this chapter, we will focus on the stage of search as the next step for
consumers in the process of taking out life insurance. In consumer behavior
theory, information search is divided into internal search, which seeks the
consumer’s own past experience and knowledge, and external search, which
utilizes different information sources to seek information that is lacking with
internal search, and the search stage in the AISCEAS model is regarded as
external search. At (1) which time and (2) where are consumers who are
considering taking out life insurance searching for information?
1. Timing of External Search
First of all, in order to see when consumers perform external searches, let us
go back to see once again the behavior of policyholders when they considered
taking out insurance most recently.
Looking at the results of the quantitative survey by our company showing
the four processes of (a) considering the need for insurance, (b) searching for
companies and products, (c) reviewing the contents and costs of products, and
(d) comparing companies and products relative to the actions of life insurance
policyholders when they purchased their most recent policy, overall,
“considering the need” scored the highest with 40% followed by “reviewing
the contents and costs of the products” (29%), “searching for companies and
products” (23%), and “comparing companies and products” at approximately
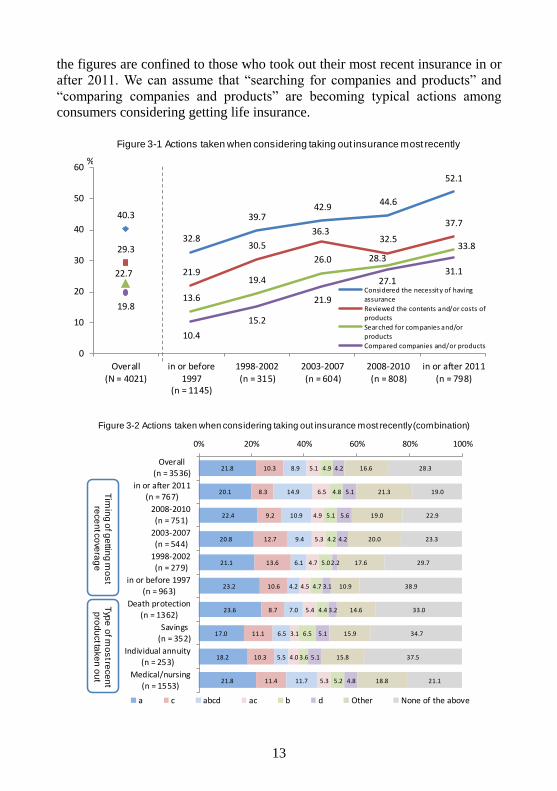
20%. [Figure 3-1] When looking at these results when they took out their most
recent policy, the ratio tended to rise in general for all actions, and comparing
the execution rate of policyholders who took out their insurance in or after
2011 with those that did so in or before 1997, it can be seen that “searching for
companies and products” and “comparing the companies and products” in
particular increased by 2.5 to 3 times. Looking at the combination of the four
actions, overall, “only considered the necessity” scored the highest with 22%
followed by “reviewed the contents and costs of the products” (10%) and “all
four” (9%) in that order. [Figure 3-2] The ratio of those who went through all
four actions was limited to about 10% of the total respondents, however,
looking at the results by the timing they took out their most recent policy, the
ratio was 11%, for those who made their most recent purchase between 2008
and 2010 while it was 15% for those that did so in or after 2011 indicating that the tendency has been on the rise in recent years. The situation is not so
different between the types of products, and while the execution rate of
“searching for companies and product” and “comparing companies and
products” were slightly higher for medical/nursing insurance policyholders
among all policyholders, the difference by types of products disappears when
13
the figures are confined to those who took out their most recent insurance in or
after 2011. We can assume that “searching for companies and products” and
“comparing companies and products” are becoming typical actions among
consumers considering getting life insurance.
40.3
32.8
39.742.9
44.6
52.1
29.3
21.9
30.5
36.332.5
37.7
22.7
13.6
19.4
26.0 28.333.8
19.8
10.4
15.2
21.9
27.131.1
0
10
20
30
40
50
60
Overall(N = 4021)
in or before1997
(n = 1145)
1998-2002(n = 315)
2003-2007(n = 604)
2008-2010(n = 808)
in or after 2011(n = 798)
Considered the necessity of havingassurance
Reviewed the contents and/or costs ofproducts
Searched for companies and/orproducts
Compared companies and/or products
%
Figure 3-1 Actions taken when considering taking out insurance most recently
21.8
20.1
22.4
20.8
21.1
23.2
23.6
17.0
18.2
21.8
10.3
8.3
9.2
12.7
13.6
10.6
8.7
11.1
10.3
11.4
8.9
14.9
10.9
9.4
6.1
4.2
7.0
6.5
5.5
11.7
5.1
6.5
4.9
5.3
4.7
4.5
5.4
3.1
4.0
5.3
4.9
4.8
5.1
4.2
5.0
4.7
4.4
6.5
3.6
5.2
4.2
5.1
5.6
4.2
2.2
3.1
3.2
5.1
5.1
4.8
16.6
21.3
19.0
20.0
17.6
10.9
14.6
15.9
15.8
18.8
28.3
19.0
22.9
23.3
29.7
38.9
33.0
34.7
37.5
21.1
0% 20% 40% 60% 80% 100%
Overall(n = 3536)
in or after 2011(n = 767)
2008-2010
(n = 751)
2003-2007(n = 544)
1998-2002(n = 279)
in or before 1997(n = 963)
Death protection(n = 1362)
Savings(n = 352)
Individual annuity(n = 253)
Medical/nursing
(n = 1553)
a c abcd ac b d Other None of the above
Tim
ing
of g
ettin
g m
os
tre
ce
nt c
ove
rag
eT
ype
of m
os
t rece
nt
pro
du
ct ta
ke
n o
ut
Figure 3-2 Actions taken when considering taking out insurance most recently (combination)
14
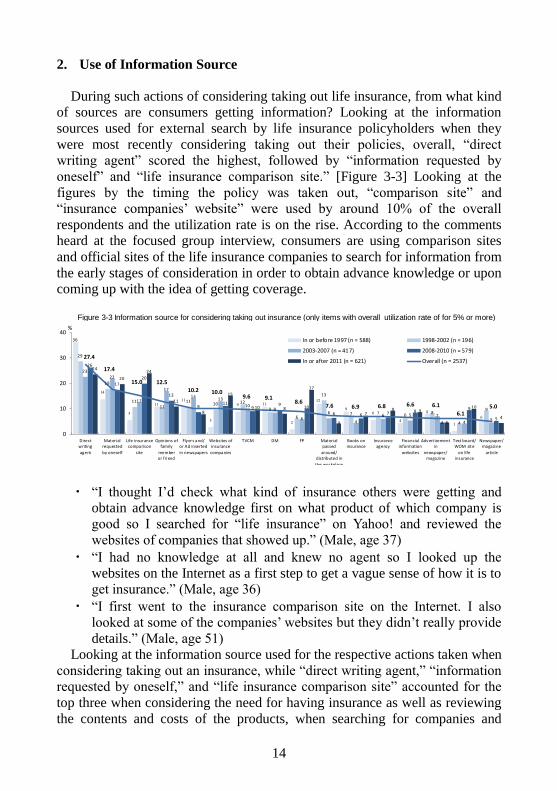
2. Use of Information Source
During such actions of considering taking out life insurance, from what kind
of sources are consumers getting information? Looking at the information
sources used for external search by life insurance policyholders when they
were most recently considering taking out their policies, overall, “direct
writing agent” scored the highest, followed by “information requested by
oneself” and “life insurance comparison site.” [Figure 3-3] Looking at the
figures by the timing the policy was taken out, “comparison site” and
“insurance companies’ website” were used by around 10% of the overall
respondents and the utilization rate is on the rise. According to the comments
heard at the focused group interview, consumers are using comparison sites
and official sites of the life insurance companies to search for information from
the early stages of consideration in order to obtain advance knowledge or upon
coming up with the idea of getting coverage.
・ “I thought I’d check what kind of insurance others were getting and
obtain advance knowledge first on what product of which company is
good so I searched for “life insurance” on Yahoo! and reviewed the
websites of companies that showed up.” (Male, age 37)
・ “I had no knowledge at all and knew no agent so I looked up the
websites on the Internet as a first step to get a vague sense of how it is to
get insurance.” (Male, age 36)
・ “I first went to the insurance comparison site on the Internet. I also
looked at some of the companies’ websites but they didn’t really provide
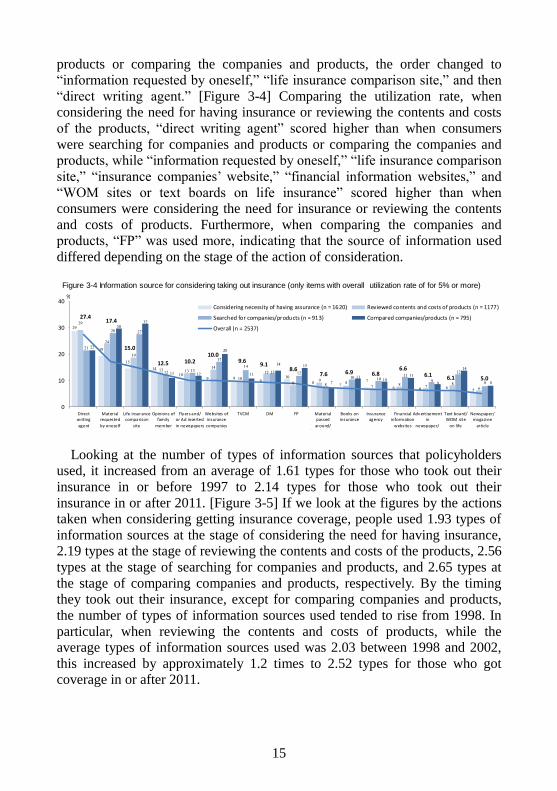
details.” (Male, age 51) Looking at the information source used for the respective actions taken when
considering taking out an insurance, while “direct writing agent,” “information
requested by oneself,” and “life insurance comparison site” accounted for the
top three when considering the need for having insurance as well as reviewing
the contents and costs of the products, when searching for companies and
36
14
5
1111
3
9 11
2
12
96
4
8
16
29
18
1111
1110 12
9
6
13
7 7 68
4
9
23
22
12
17
14 13
108
6
6
4
6 5 7
45
26
17
20
13
911
99
10
6 6 7 8
4
9
5
24
20
24
11
8
15
10 8
17
4
79 9
5
10
4
27.4
17.4
15.0 12.5
10.2 10.09.6 9.1
8.67.6 6.9 6.8 6.6 6.1
6.15.0
0
10
20
30
40
Directwriting
agent
Materialrequested
by oneself
Life insurancecomparison
site
Opinions offamily
memberor friend
Flyers and/or Ad inserted
in newspapers
Websites ofinsurance
companies
TVCM DM FP Materialpassed
around/distributed in
the workplace
Books oninsurance
Insuranceagency
Financialinformation
websites
Advert isementin
newspaper/magazine
Text board/WOM site
on lifeinsurance
Newspaper/magazine
article
In or before 1997 (n = 588) 1998-2002 (n = 196)
2003-2007 (n = 417) 2008-2010 (n = 579)
In or after 2011 (n = 621) Overall (n = 2537)
%
Figure 3-3 Information source for considering taking out insurance (only items with overall utilization rate of for 5% or more)
15
products or comparing the companies and products, the order changed to
“information requested by oneself,” “life insurance comparison site,” and then
“direct writing agent.” [Figure 3-4] Comparing the utilization rate, when
considering the need for having insurance or reviewing the contents and costs
of the products, “direct writing agent” scored higher than when consumers
were searching for companies and products or comparing the companies and
products, while “information requested by oneself,” “life insurance comparison
site,” “insurance companies’ website,” “financial information websites,” and
“WOM sites or text boards on life insurance” scored higher than when
consumers were considering the need for insurance or reviewing the contents
and costs of products. Furthermore, when comparing the companies and
products, “FP” was used more, indicating that the source of information used
differed depending on the stage of the action of consideration.
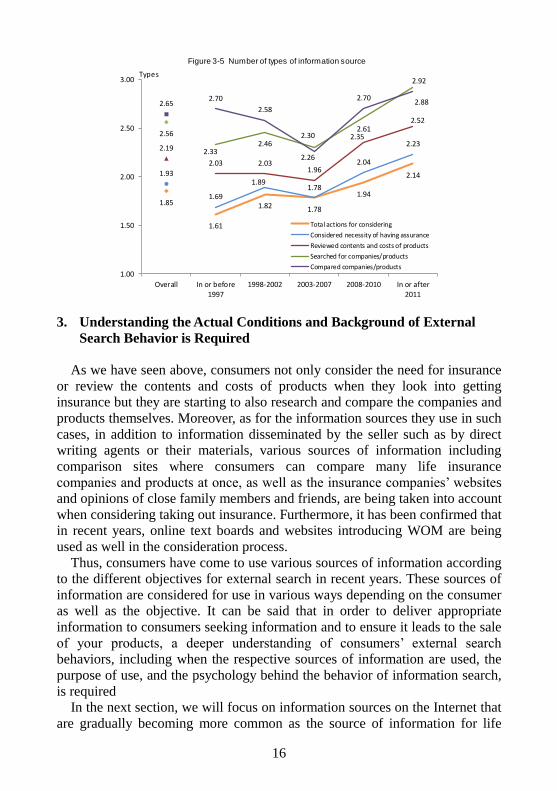
Looking at the number of types of information sources that policyholders
used, it increased from an average of 1.61 types for those who took out their
insurance in or before 1997 to 2.14 types for those who took out their
insurance in or after 2011. [Figure 3-5] If we look at the figures by the actions
taken when considering getting insurance coverage, people used 1.93 types of
information sources at the stage of considering the need for having insurance,
2.19 types at the stage of reviewing the contents and costs of the products, 2.56
types at the stage of searching for companies and products, and 2.65 types at
the stage of comparing companies and products, respectively. By the timing
they took out their insurance, except for comparing companies and products,
the number of types of information sources used tended to rise from 1998. In
particular, when reviewing the contents and costs of products, while the
average types of information sources used was 2.03 between 1998 and 2002,
this increased by approximately 1.2 times to 2.52 types for those who got
coverage in or after 2011.
29
19
1514
109 9 9
108 7
76 6 6 5
29
24
19
13 1314
1012
8 9 87 8 7
86
21
28 27
12 13
1714
13 12
810 10
119
12
8
22
3032
11 12
20
11
14 15
711 10
119
14
8
27.417.4
15.0
12.5 10.210.0
9.69.1
8.67.6 6.9 6.8
6.66.1 6.1 5.0
0
10
20
30
40
Directwriting
agent
Materialrequested
by oneself
Life insurancecomparison
site
Opinions offamily
memberor friend
Flyers and/or Ad inserted
in newspapers
Websites ofinsurance
companies
TVCM DM FP Materialpassed
around/distributed in
Books oninsurance
Insuranceagency
Financialinformation
websites
Advert isementin
newspaper/magazine
Text board/WOM site
on lifeinsurance
Newspaper/magazine
article
Considering necessity of having assurance (n = 1620) Reviewed contents and costs of products (n = 1177)
Searched for companies/products (n = 913) Compared companies/products (n = 795)
Overall (n = 2537)
%
Figure 3-4 Information source for considering taking out insurance (only items with overall utilization rate of for 5% or more)
16
3. Understanding the Actual Conditions and Background of External
Search Behavior is Required
As we have seen above, consumers not only consider the need for insurance
or review the contents and costs of products when they look into getting
insurance but they are starting to also research and compare the companies and
products themselves. Moreover, as for the information sources they use in such
cases, in addition to information disseminated by the seller such as by direct
writing agents or their materials, various sources of information including
comparison sites where consumers can compare many life insurance
companies and products at once, as well as the insurance companies’ websites
and opinions of close family members and friends, are being taken into account
when considering taking out insurance. Furthermore, it has been confirmed that
in recent years, online text boards and websites introducing WOM are being
used as well in the consideration process.
Thus, consumers have come to use various sources of information according
to the different objectives for external search in recent years. These sources of
information are considered for use in various ways depending on the consumer
as well as the objective. It can be said that in order to deliver appropriate
information to consumers seeking information and to ensure it leads to the sale
of your products, a deeper understanding of consumers’ external search behaviors, including when the respective sources of information are used, the
purpose of use, and the psychology behind the behavior of information search,
is required
In the next section, we will focus on information sources on the Internet that
are gradually becoming more common as the source of information for life
1.85
1.61
1.82 1.78
1.94
2.141.93
1.69
1.891.78
2.04
2.232.19
2.03 2.031.96
2.35
2.52
2.56
2.332.46
2.302.61
2.92
2.652.70
2.58
2.26
2.702.88
1.00
1.50
2.00
2.50
3.00
Overall In or before1997
1998-2002 2003-2007 2008-2010 In or after2011
Total actions for considering
Considered necessity of having assurance
Reviewed contents and costs of products
Searched for companies/products
Compared companies/products
Types
Figure 3-5 Number of types of information source
17
insurance and look into the characteristics and background of those who use
the Internet for external searches.
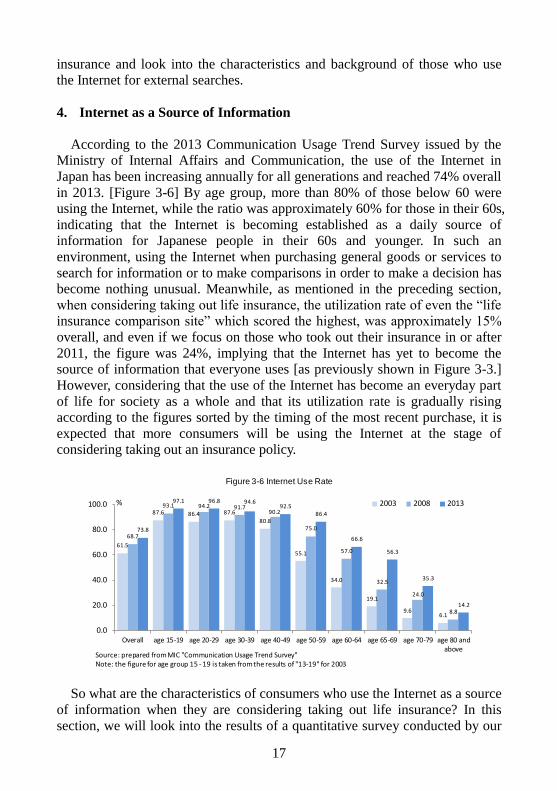
4. Internet as a Source of Information
According to the 2013 Communication Usage Trend Survey issued by the
Ministry of Internal Affairs and Communication, the use of the Internet in
Japan has been increasing annually for all generations and reached 74% overall
in 2013. [Figure 3-6] By age group, more than 80% of those below 60 were
using the Internet, while the ratio was approximately 60% for those in their 60s,
indicating that the Internet is becoming established as a daily source of
information for Japanese people in their 60s and younger. In such an
environment, using the Internet when purchasing general goods or services to
search for information or to make comparisons in order to make a decision has
become nothing unusual. Meanwhile, as mentioned in the preceding section,
when considering taking out life insurance, the utilization rate of even the “life
insurance comparison site” which scored the highest, was approximately 15%
overall, and even if we focus on those who took out their insurance in or after
2011, the figure was 24%, implying that the Internet has yet to become the
source of information that everyone uses [as previously shown in Figure 3-3.]
However, considering that the use of the Internet has become an everyday part
of life for society as a whole and that its utilization rate is gradually rising
according to the figures sorted by the timing of the most recent purchase, it is
expected that more consumers will be using the Internet at the stage of
considering taking out an insurance policy.
So what are the characteristics of consumers who use the Internet as a source
of information when they are considering taking out life insurance? In this
section, we will look into the results of a quantitative survey conducted by our
61.5
87.6 86.4 87.6
80.8
55.1
34.0
19.1
9.66.1
68.7
93.1 94.2 91.790.2
75.0
57.0
32.5
24.0
8.8
73.8
97.1 96.8 94.692.5
86.4
66.6
56.3
35.3
14.2
0.0
20.0
40.0
60.0
80.0
100.0
Overall age 15-19 age 20-29 age 30-39 age 40-49 age 50-59 age 60-64 age 65-69 age 70-79 age 80 andabove
2003 2008 2013%
Source: prepared from MIC "Communication Usage Trend Survey"Note: the figure for age group 15 - 19 is taken from the results of "13-19" for 2003
Figure 3-6 Internet Use Rate
18
company to focus on those who took out some kind of life insurance in or after
2011 and confirm the characteristics of those who used the Internet when
considering taking out insurance.
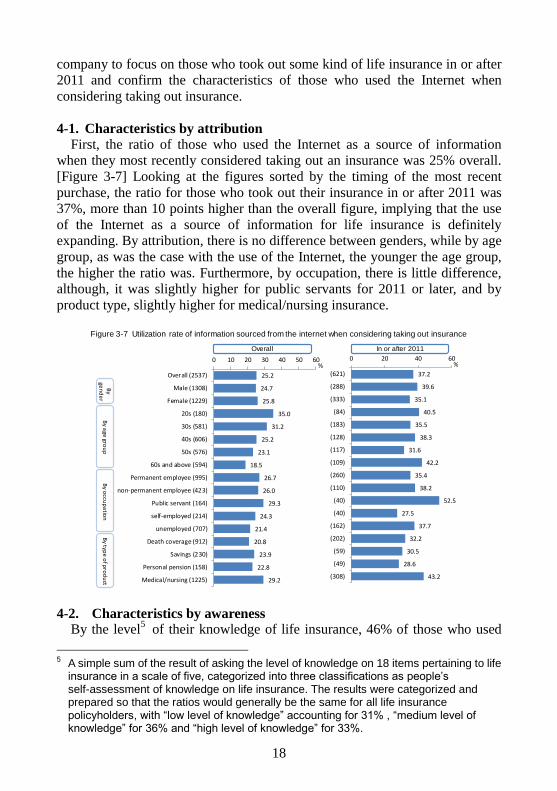
4-1. Characteristics by attribution
First, the ratio of those who used the Internet as a source of information
when they most recently considered taking out an insurance was 25% overall.
[Figure 3-7] Looking at the figures sorted by the timing of the most recent
purchase, the ratio for those who took out their insurance in or after 2011 was
37%, more than 10 points higher than the overall figure, implying that the use
of the Internet as a source of information for life insurance is definitely
expanding. By attribution, there is no difference between genders, while by age
group, as was the case with the use of the Internet, the younger the age group,
the higher the ratio was. Furthermore, by occupation, there is little difference,
although, it was slightly higher for public servants for 2011 or later, and by
product type, slightly higher for medical/nursing insurance.
4-2. Characteristics by awareness By the level
5 of their knowledge of life insurance, 46% of those who used
5 A simple sum of the result of asking the level of knowledge on 18 items pertaining to life
insurance in a scale of five, categorized into three classifications as people’s self-assessment of knowledge on life insurance. The results were categorized and prepared so that the ratios would generally be the same for all life insurance policyholders, with “low level of knowledge” accounting for 31% , “medium level of knowledge” for 36% and “high level of knowledge” for 33%.
37.2
39.6
35.1
40.5
35.5
38.3
31.6
42.2
35.4
38.2
52.5
27.5
37.7
32.2
30.5
28.6
43.2
0 20 40 60
(621)
(288)
(333)
(84)
(183)
(128)
(117)
(109)
(260)
(110)
(40)
(40)
(162)
(202)
(59)
(49)
(308)
%
25.2
24.7
25.8
35.0
31.2
25.2
23.1
18.5
26.7
26.0
29.3
24.3
21.4
20.8
23.9
22.8
29.2
0 10 20 30 40 50 60
Overall (2537)
Male (1308)
Female (1229)
20s (180)
30s (581)
40s (606)
50s (576)
60s and above (594)
Permanent employee (995)
non-permanent employee (423)
Public servant (164)
self-employed (214)
unemployed (707)
Death coverage (912)
Savings (230)
Personal pension (158)
Medical/nursing (1225)
%
By
gen
de
rB
y age
grou
pB
y occu
pa
tion
By typ
e o
f pro
du
ct
Overall In or after 2011
Figure 3-7 Utilization rate of information sourced from the internet when considering taking out insurance
19
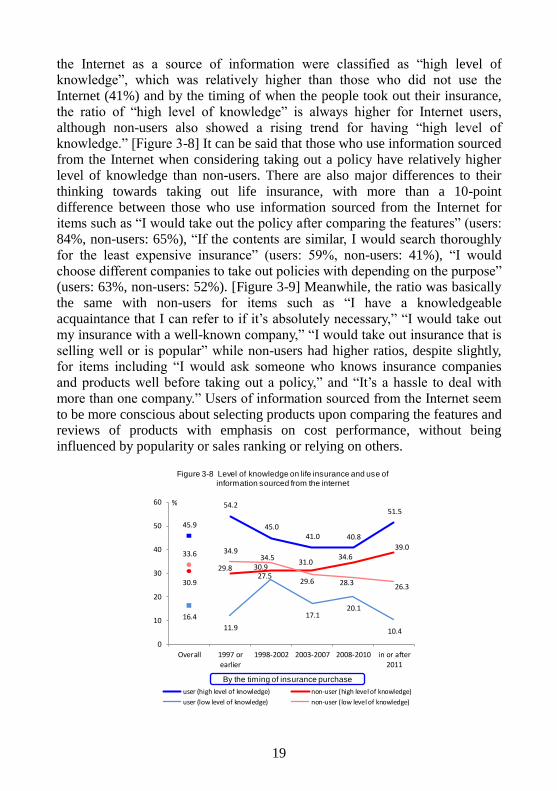
the Internet as a source of information were classified as “high level of knowledge”, which was relatively higher than those who did not use the
Internet (41%) and by the timing of when the people took out their insurance,
the ratio of “high level of knowledge” is always higher for Internet users,
although non-users also showed a rising trend for having “high level of knowledge.” [Figure 3-8] It can be said that those who use information sourced
from the Internet when considering taking out a policy have relatively higher
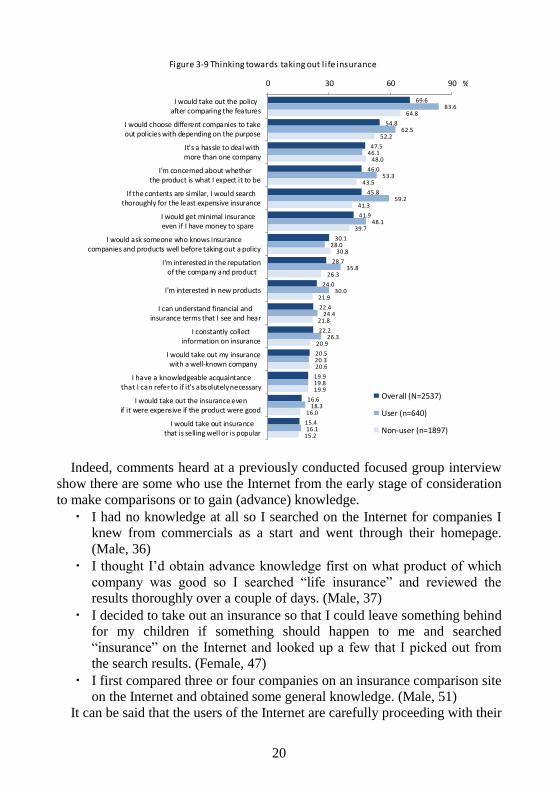
level of knowledge than non-users. There are also major differences to their
thinking towards taking out life insurance, with more than a 10-point
difference between those who use information sourced from the Internet for items such as “I would take out the policy after comparing the features” (users:
84%, non-users: 65%), “If the contents are similar, I would search thoroughly
for the least expensive insurance” (users: 59%, non-users: 41%), “I would
choose different companies to take out policies with depending on the purpose” (users: 63%, non-users: 52%). [Figure 3-9] Meanwhile, the ratio was basically
the same with non-users for items such as “I have a knowledgeable
acquaintance that I can refer to if it’s absolutely necessary,” “I would take out
my insurance with a well-known company,” “I would take out insurance that is
selling well or is popular” while non-users had higher ratios, despite slightly, for items including “I would ask someone who knows insurance companies
and products well before taking out a policy,” and “It’s a hassle to deal with
more than one company.” Users of information sourced from the Internet seem
to be more conscious about selecting products upon comparing the features and reviews of products with emphasis on cost performance, without being
influenced by popularity or sales ranking or relying on others.
45.9
54.2
45.041.0 40.8
51.5
30.9
29.8 30.931.0
34.639.0
16.4
11.9
27.5
17.120.1
10.4
33.6 34.934.5
29.6 28.326.3
0
10
20
30
40
50
60
Overall 1997 orearlier
1998-2002 2003-2007 2008-2010 in or after2011
user (high level of knowledge) non-user (high level of knowledge)
user (low level of knowledge) non-user (low level of knowledge)
%
By the timing of insurance purchase
Figure 3-8 Level of knowledge on life insurance and use of information sourced from the internet
20
Indeed, comments heard at a previously conducted focused group interview
show there are some who use the Internet from the early stage of consideration
to make comparisons or to gain (advance) knowledge.
・ I had no knowledge at all so I searched on the Internet for companies I
knew from commercials as a start and went through their homepage.
(Male, 36)
・ I thought I’d obtain advance knowledge first on what product of which
company was good so I searched “life insurance” and reviewed the
results thoroughly over a couple of days. (Male, 37)
・ I decided to take out an insurance so that I could leave something behind
for my children if something should happen to me and searched
“insurance” on the Internet and looked up a few that I picked out from the search results. (Female, 47)
・ I first compared three or four companies on an insurance comparison site
on the Internet and obtained some general knowledge. (Male, 51)
It can be said that the users of the Internet are carefully proceeding with their
69.6
54.8
47.5
46.0
45.8
41.9
30.1
28.7
24.0
22.4
22.2
20.5
19.9
16.6
15.4
83.6
62.5
46.1
53.3
59.2
48.1
28.0
35.8
30.0
24.4
26.3
20.3
19.8
18.3
16.1
64.8
52.2
48.0
43.5
41.3
39.7
30.8
26.3
21.9
21.8
20.9
20.6
19.9
16.0
15.2
0 30 60 90
I would take out the policyafter comparing the features
I would choose different companies to takeout policies with depending on the purpose
It's a hassle to deal withmore than one company
I'm concerned about whetherthe product is what I expect it to be
If the contents are similar, I would searchthoroughly for the least expensive insurance
I would get minimal insuranceeven if I have money to spare
I would ask someone who knows insurancecompanies and products well before taking out a policy
I'm interested in the reputationof the company and product
I'm interested in new products
I can understand financial andinsurance terms that I see and hear
I constantly collectinformation on insurance
I would take out my insurancewith a well-known company
I have a knowledgeable acquaintance that I can refer to if it’s absolutely necessary
I would take out the insurance evenif it were expensive if the product were good
I would take out insurancethat is selling well or is popular
Overall (N=2537)
User (n=640)
Non-user (n=1897)
%
Figure 3-9 Thinking towards taking out l ife insurance
21
consideration utilizing various sources of information including the Internet
when taking out a policy.
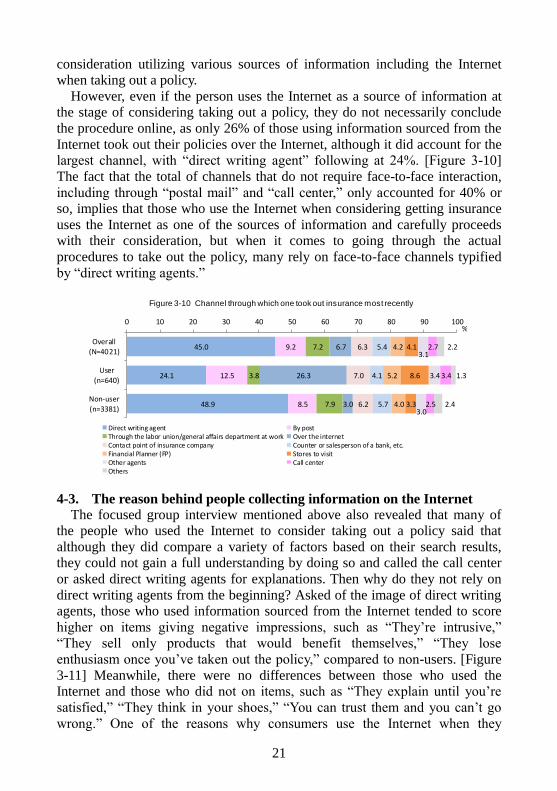
However, even if the person uses the Internet as a source of information at
the stage of considering taking out a policy, they do not necessarily conclude
the procedure online, as only 26% of those using information sourced from the
Internet took out their policies over the Internet, although it did account for the
largest channel, with “direct writing agent” following at 24%. [Figure 3-10]
The fact that the total of channels that do not require face-to-face interaction,
including through “postal mail” and “call center,” only accounted for 40% or
so, implies that those who use the Internet when considering getting insurance
uses the Internet as one of the sources of information and carefully proceeds
with their consideration, but when it comes to going through the actual
procedures to take out the policy, many rely on face-to-face channels typified
by “direct writing agents.”
4-3. The reason behind people collecting information on the Internet
The focused group interview mentioned above also revealed that many of
the people who used the Internet to consider taking out a policy said that
although they did compare a variety of factors based on their search results,
they could not gain a full understanding by doing so and called the call center
or asked direct writing agents for explanations. Then why do they not rely on
direct writing agents from the beginning? Asked of the image of direct writing
agents, those who used information sourced from the Internet tended to score
higher on items giving negative impressions, such as “They’re intrusive,”
“They sell only products that would benefit themselves,” “They lose
enthusiasm once you’ve taken out the policy,” compared to non-users. [Figure
3-11] Meanwhile, there were no differences between those who used the
Internet and those who did not on items, such as “They explain until you’re
satisfied,” “They think in your shoes,” “You can trust them and you can’t go
wrong.” One of the reasons why consumers use the Internet when they
45.0
24.1
48.9
9.2
12.5
8.5
7.2
3.8
7.9
6.7
26.3
3.0
6.3
7.0
6.2
5.4
4.1
5.7
4.2
5.2
4.0
4.1
8.6
3.3
3.1
3.4
3.0
2.7
3.4
2.5
2.2
1.3
2.4
0 10 20 30 40 50 60 70 80 90 100
Overall(N=4021)
User
(n=640)
Non-user(n=3381)
Direct writing agent By postThrough the labor union/general affairs department at work Over the internetContact point of insurance company Counter or salesperson of a bank, etc.Financial Planner (FP) Stores to visitOther agents Call centerOthers
%
Figure 3-10 Channel through which one took out insurance most recently
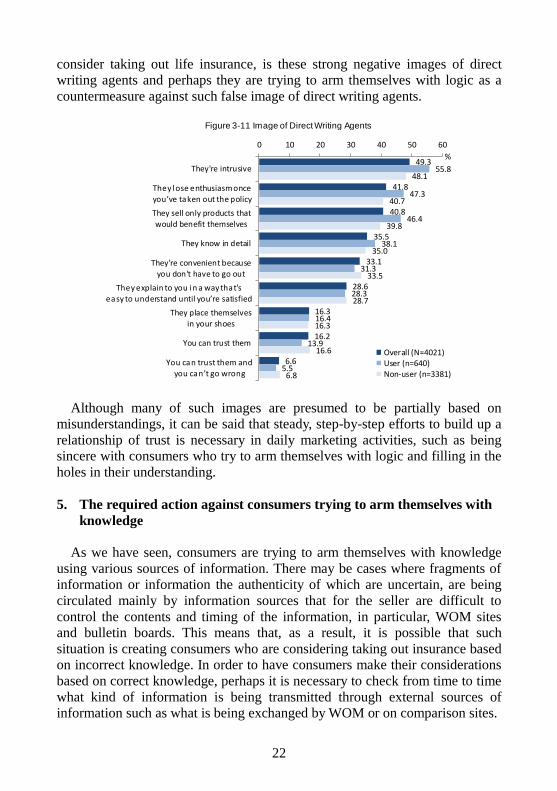
22
consider taking out life insurance, is these strong negative images of direct
writing agents and perhaps they are trying to arm themselves with logic as a
countermeasure against such false image of direct writing agents.
Although many of such images are presumed to be partially based on
misunderstandings, it can be said that steady, step-by-step efforts to build up a
relationship of trust is necessary in daily marketing activities, such as being
sincere with consumers who try to arm themselves with logic and filling in the
holes in their understanding.
5. The required action against consumers trying to arm themselves with
knowledge
As we have seen, consumers are trying to arm themselves with knowledge
using various sources of information. There may be cases where fragments of
information or information the authenticity of which are uncertain, are being
circulated mainly by information sources that for the seller are difficult to
control the contents and timing of the information, in particular, WOM sites
and bulletin boards. This means that, as a result, it is possible that such
situation is creating consumers who are considering taking out insurance based on incorrect knowledge. In order to have consumers make their considerations
based on correct knowledge, perhaps it is necessary to check from time to time
what kind of information is being transmitted through external sources of
information such as what is being exchanged by WOM or on comparison sites.
49.3
41.8
40.8
35.5
33.1
28.6
16.3
16.2
6.6
55.8
47.3
46.4
38.1
31.3
28.3
16.4
13.9
5.5
48.1
40.7
39.8
35.0
33.5
28.7
16.3
16.6
6.8
0 10 20 30 40 50 60
They're intrusive
They lose enthusiasm once you’ve taken out the policy
They sell only products thatwould benefit themselves
They know in detail
They're convenient because
you don't have to go out
They explain to you in a way that's easy to understand until you’re satisfied
They place themselvesin your shoes
You can trust them
You can trust them and you can’t go wrong
Overall (N=4021)User (n=640)Non-user (n=3381)
%
Figure 3-11 Image of Direct Writing Agents
23
Furthermore, it can also be said that such changes in consumer behavior
mainly in light of the changes in the information and communication
environment show that promotion and consumer communication are becoming
more crucial a challenge in terms of management strategy than ever before.
6. The Contents of Information Consumers Search for When
Considering Taking Out Insurance
As has been set forth in the previous sections, many consumers use various
sources of information to collect information when considering taking out
insurance. So what kind of information are consumers collecting from these
respective sources to use as reference? In the following paragraphs, we will
focus on the contents of the information consumers searched for to confirm the
source of information consumers are using, the contents of information they
searched for, and to examine the relationship between the contents of the
information and the level of satisfaction with the purchased product.
6-1. The contents of information that consumers search for
We asked consumers of the contents of information they searched for when
they were most recently considering taking out insurance, giving them the six
options of (1) general information such as the scheme of the insurance or its
necessity (general information), (2) information on the contents and price of
products (product information), (3) information on products selling well or
those that are recommended (best seller information), (4) information on the
status and health of the companies’ management (management information),
(5) information on the companies’ reputation (company reputation) and (6)
reputation of the sales agents’ attitude (channel information). As a result,
“product information” scored the highest overall accounting for 75%, followed
by “general information” (59%), “best seller information” (17%), and
“management information” (16%). [Figure 3-12] By gender, 78% of females
searched for “product information” scoring higher than males (72%), and by
age group, the younger the age group, the higher the score tended to be for
“general information” and “best seller information.” Furthermore, by product
type, “product information” scored high for annuity insurance and “product
information” scored high for medical and nursing insurance, implying that
there are differences in the information consumers search for depending on
their attribution or the assurance they took out. Meanwhile, by the timing of when consumers took out their most recent insurance, the more recently the
purchase was made, the more people tended to search for “best seller
information,” and those who took out their insurance within two years (in or
after 2010) scored higher on “product information” than the overall figures,
while those who made their purchase within three to five years scored higher
24
on “management information,” indicating that the contents of information
consumers search for differ also by the timing of when they took out their
policies (that said, there seem to be information such as “company reputation”
and “channel information” that are not searched for regardless of the timing of
when the policy was taken out). Separately, by the channel through which
people took out their policies, those who used the Internet, which requires
consumers to actively proceed with their examination scored higher for all four
types of information except for “general information” and “channel
information” than the overall figure. [Figure 3-13] As for other channels,
“general information” scored high for those who used insurance agencies,
while “product information” scored high for those who went through financial
planners or direct sales channels such as by Direct Mail or over the Internet,
and “best seller information” was popular among those who went through
Insurance Shops, financial planners or the Internet.
Meanwhile, looking at the contents of information searched by the
consumers’ level of knowledge on life insurance, for the five types of
information excluding “channel information,” the score tended to rise as the
consumers’ level of knowledge became higher and in particular, for “general
information,” “product information” and “management information,” the ratio
was more than 10 points higher than the group with low level of knowledge.
[Figure 3-14] Although consumers probably would not go so far as to worry
about management information if they did not already have a certain level of
knowledge at the time they were considering taking out insurance, the fact that
they are searching for a broad range of information including general
information and product information when they consider getting coverage is
most likely functioning effectively for consumers to deepen their
understanding of the information they searched for and to deepen their
knowledge on insurance.
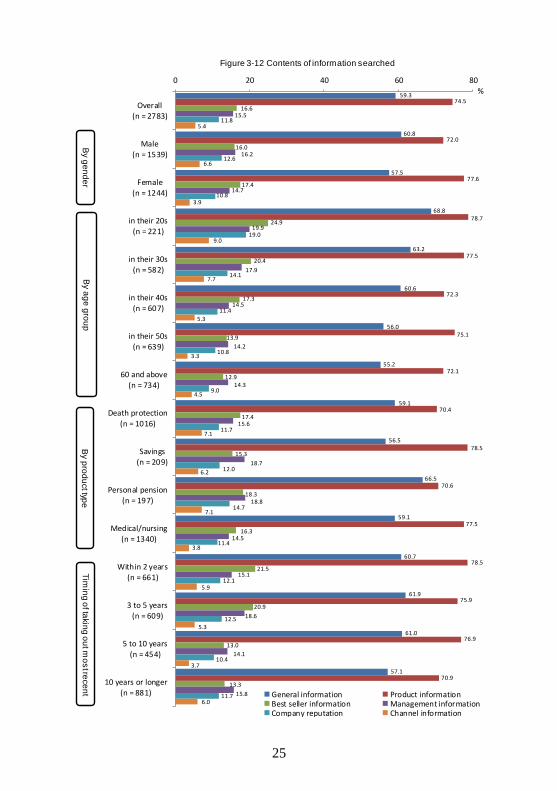
25
59.3
60.8
57.5
68.8
63.2
60.6
56.0
55.2
59.1
56.5
66.5
59.1
60.7
61.9
61.0
57.1
74.5
72.0
77.6
78.7
77.5
72.3
75.1
72.1
70.4
78.5
70.6
77.5
78.5
75.9
76.9
70.9
16.6
16.0
17.4
24.9
20.4
17.3
13.9
12.9
17.4
15.3
18.3
16.3
21.5
20.9
13.0
13.3
15.5
16.2
14.7
19.9
17.9
14.5
14.2
14.3
15.6
18.7
18.8
14.5
15.1
18.6
14.1
15.8
11.8
12.6
10.8
19.0
14.1
11.4
10.8
9.0
11.7
12.0
14.7
11.4
12.1
12.5
10.4
11.7
5.4
6.6
3.9
9.0
7.7
5.3
3.3
4.5
7.1
6.2
7.1
3.8
5.9
5.3
3.7
6.0
0 20 40 60 80
Overall(n = 2783)
Male
(n = 1539)
Female(n = 1244)
in their 20s
(n = 221)
in their 30s(n = 582)
in their 40s(n = 607)
in their 50s
(n = 639)
60 and above(n = 734)
Death protection
(n = 1016)
Savings(n = 209)
Personal pension(n = 197)
Medical/nursing
(n = 1340)
Within 2 years(n = 661)
3 to 5 years
(n = 609)
5 to 10 years(n = 454)
10 years or longer(n = 881) General information Product information
Best seller information Management informationCompany reputation Channel information
%
By g
en
de
rB
y ag
e g
rou
pB
y pro
du
ct typ
eT
imin
g o
f takin
g o
ut m
os
t rece
nt
Figure 3-12 Contents of information searched
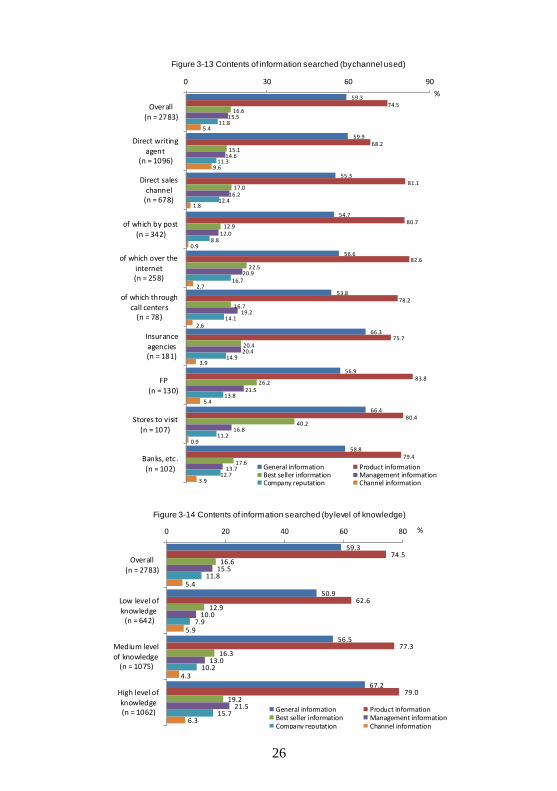
26
59.3
59.9
55.3
54.7
56.6
53.8
66.3
56.9
66.4
58.8
74.5
68.2
81.1
80.7
82.6
78.2
75.7
83.8
80.4
79.4
16.6
15.1
17.0
12.9
22.5
16.7
20.4
26.2
40.2
17.6
15.5
14.6
16.2
12.0
20.9
19.2
20.4
21.5
16.8
13.7
11.8
11.3
12.4
8.8
16.7
14.1
14.9
13.8
11.2
12.7
5.4
9.6
1.8
0.9
2.7
2.6
3.9
5.4
0.9
3.9
0 30 60 90
Overall(n = 2783)
Direct writing
agent(n = 1096)
Direct saleschannel
(n = 678)
of which by post(n = 342)
of which over the
internet(n = 258)
of which throughcall centers
(n = 78)
Insurance
agencies(n = 181)
FP(n = 130)
Stores to visit
(n = 107)
Banks, etc.(n = 102) General information Product information
Best seller information Management informationCompany reputation Channel information
%
Figure 3-13 Contents of information searched (by channel used)
59.3
50.9
56.5
67.2
74.5
62.6
77.3
79.0
16.6
12.9
16.3
19.2
15.5
10.0
13.0
21.5
11.8
7.9
10.2
15.7
5.4
5.9
4.3
6.3
0 20 40 60 80
Overall(n = 2783)
Low level ofknowledge
(n = 642)
Medium levelof knowledge
(n = 1075)
High level ofknowledge(n = 1062) General information Product information
Best seller information Management informationCompany reputation Channel information
%
Figure 3-14 Contents of information searched (by level of knowledge)
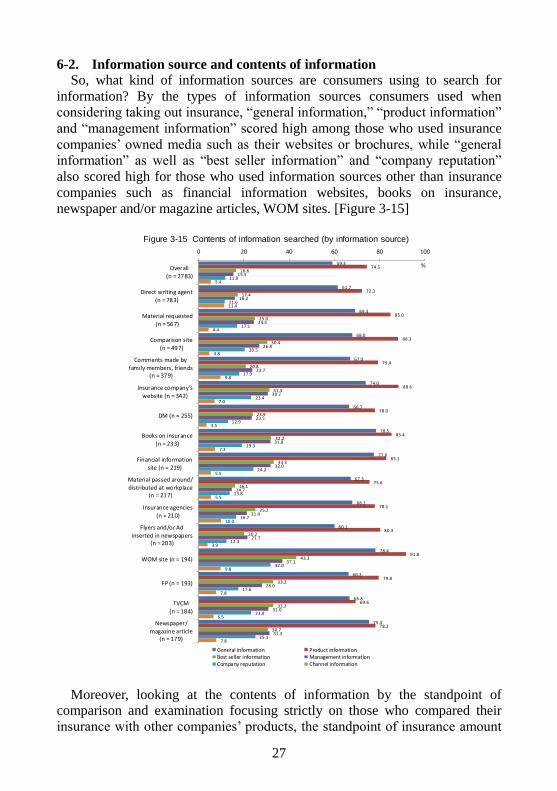
27
6-2. Information source and contents of information So, what kind of information sources are consumers using to search for
information? By the types of information sources consumers used when
considering taking out insurance, “general information,” “product information”
and “management information” scored high among those who used insurance
companies’ owned media such as their websites or brochures, while “general
information” as well as “best seller information” and “company reputation”
also scored high for those who used information sources other than insurance
companies such as financial information websites, books on insurance,
newspaper and/or magazine articles, WOM sites. [Figure 3-15]
Moreover, looking at the contents of information by the standpoint of comparison and examination focusing strictly on those who compared their
insurance with other companies’ products, the standpoint of insurance amount
59.3
61.7
69.3
68.0
67.0
74.0
66.7
78.5
77.6
67.3
68.1
60.1
78.4
66.3
66.8
75.4
74.5
72.3
85.0
88.3
79.4
88.6
78.0
85.4
83.1
75.6
78.1
80.3
91.8
79.8
69.6
78.2
16.6
17.4
25.0
30.4
20.8
31.3
23.9
32.2
33.3
16.1
25.2
20.2
43.3
33.2
33.2
30.7
15.5
16.2
24.5
26.8
23.7
30.7
23.5
31.8
32.0
14.7
21.4
21.7
37.1
28.0
31.0
31.3
11.8
11.6
17.1
20.5
17.9
23.4
12.9
19.3
24.2
13.8
16.7
12.3
32.0
17.6
23.4
25.1
5.4
11.4
4.4
4.8
9.8
7.0
3.5
7.3
5.5
5.5
10.0
3.9
9.8
7.8
6.5
7.8
0 20 40 60 80 100
Overall
(n = 2783)
Direct writing agent(n = 783)
Material requested
(n = 567)
Comparison site
(n = 497)
Comments made byfamily members, friends
(n = 379)
Insurance company's
website (n = 342)
DM (n = 255)
Books on insurance(n = 233)
Financial information
site (n = 219)
Material passed around/
distributed at workplace(n = 217)
Insurance agencies(n = 210)
Flyers and/or Ad
inserted in newspapers(n = 203)
WOM site (n = 194)
FP (n = 193)
TVCM
(n = 184)
Newspaper/
magazine article(n = 179)
General information Product informationBest seller information Management informationCompany reputation Channel information
%
Figure 3-15 Contents of information searched (by information source)
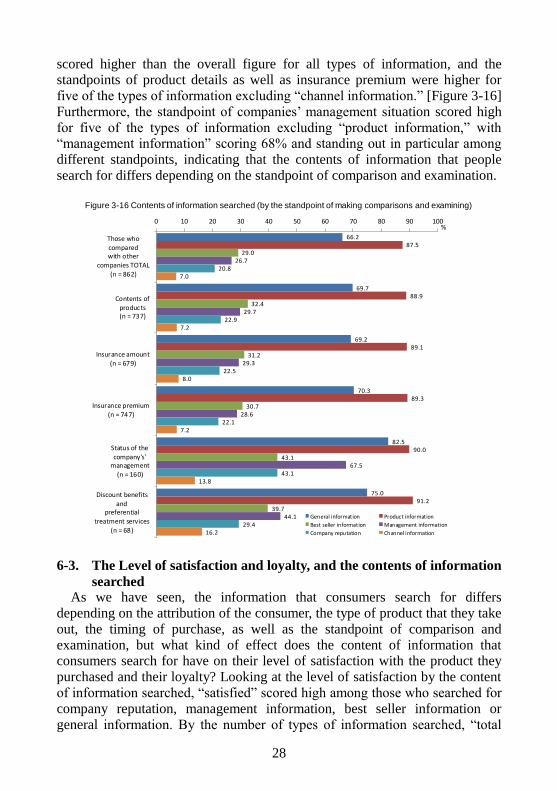
28
scored higher than the overall figure for all types of information, and the standpoints of product details as well as insurance premium were higher for
five of the types of information excluding “channel information.” [Figure 3-16]
Furthermore, the standpoint of companies’ management situation scored high
for five of the types of information excluding “product information,” with “management information” scoring 68% and standing out in particular among
different standpoints, indicating that the contents of information that people
search for differs depending on the standpoint of comparison and examination.
6-3. The Level of satisfaction and loyalty, and the contents of information
searched As we have seen, the information that consumers search for differs
depending on the attribution of the consumer, the type of product that they take
out, the timing of purchase, as well as the standpoint of comparison and
examination, but what kind of effect does the content of information that consumers search for have on their level of satisfaction with the product they
purchased and their loyalty? Looking at the level of satisfaction by the content
of information searched, “satisfied” scored high among those who searched for
company reputation, management information, best seller information or
general information. By the number of types of information searched, “total
66.2
69.7
69.2
70.3
82.5
75.0
87.5
88.9
89.1
89.3
90.0
91.2
29.0
32.4
31.2
30.7
43.1
39.7
26.7
29.7
29.3
28.6
67.5
44.1
20.8
22.9
22.5
22.1
43.1
29.4
7.0
7.2
8.0
7.2
13.8
16.2
0 10 20 30 40 50 60 70 80 90 100
Those who
comparedwith other
companies TOTAL
(n = 862)
Contents ofproducts(n = 737)
Insurance amount(n = 679)
Insurance premium(n = 747)
Status of the
company's'management
(n = 160)
Discount benefits
andpreferential
treatment services
(n = 68)
General information Product information
Best seller information Management information
Company reputation Channel information
%
Figure 3-16 Contents of information searched (by the standpoint of making comparisons and examining)
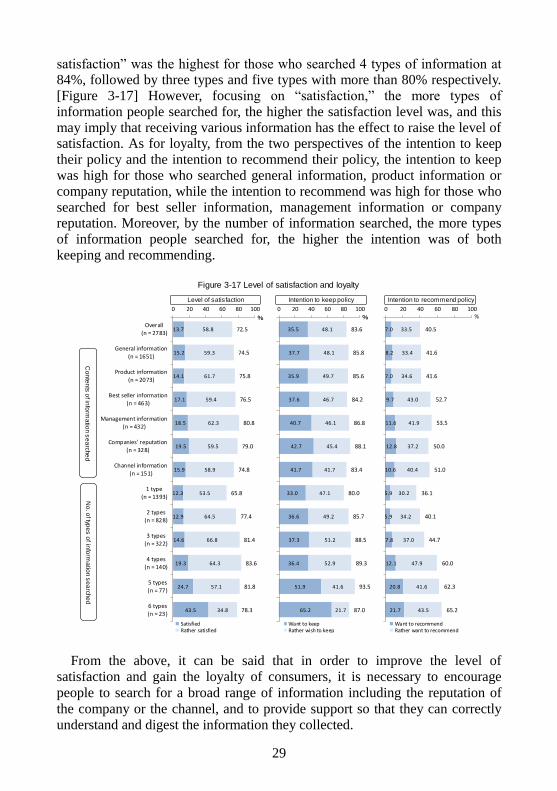
29
satisfaction” was the highest for those who searched 4 types of information at 84%, followed by three types and five types with more than 80% respectively.
[Figure 3-17] However, focusing on “satisfaction,” the more types of
information people searched for, the higher the satisfaction level was, and this
may imply that receiving various information has the effect to raise the level of satisfaction. As for loyalty, from the two perspectives of the intention to keep
their policy and the intention to recommend their policy, the intention to keep
was high for those who searched general information, product information or
company reputation, while the intention to recommend was high for those who
searched for best seller information, management information or company reputation. Moreover, by the number of information searched, the more types
of information people searched for, the higher the intention was of both
keeping and recommending.
From the above, it can be said that in order to improve the level of
satisfaction and gain the loyalty of consumers, it is necessary to encourage
people to search for a broad range of information including the reputation of
the company or the channel, and to provide support so that they can correctly
understand and digest the information they collected.
7.0
8.2
7.0
9.7
11.6
12.8
10.6
5.9
5.9
7.8
12.1
20.8
21.7
33.5
33.4
34.6
43.0
41.9
37.2
40.4
30.2
34.2
37.0
47.9
41.6
43.5
40.5
41.6
41.6
52.7
53.5
50.0
51.0
36.1
40.1
44.7
60.0
62.3
65.2
0 20 40 60 80 100
Want to recommendRather want to recommend
%
35.5
37.7
35.9
37.6
40.7
42.7
41.7
33.0
36.6
37.3
36.4
51.9
65.2
48.1
48.1
49.7
46.7
46.1
45.4
41.7
47.1
49.2
51.2
52.9
41.6
21.7
83.6
85.8
85.6
84.2
86.8
88.1
83.4
80.0
85.7
88.5
89.3
93.5
87.0
0 20 40 60 80 100
Want to keepRather wish to keep
%
13.7
15.2
14.1
17.1
18.5
19.5
15.9
12.3
12.9
14.6
19.3
24.7
43.5
58.8
59.3
61.7
59.4
62.3
59.5
58.9
53.5
64.5
66.8
64.3
57.1
34.8
72.5
74.5
75.8
76.5
80.8
79.0
74.8
65.8
77.4
81.4
83.6
81.8
78.3
0 20 40 60 80 100
Overall(n = 2783)
General information
(n = 1651)
Product information(n = 2073)
Best seller information
(n = 463)
Management information(n = 432)
Companies' reputation
(n = 328)
Channel information
(n = 151)
1 type(n = 1393)
2 types
(n = 828)
3 types(n = 322)
4 types
(n = 140)
5 types(n = 77)
6 types
(n = 23)
SatisfiedRather satisfied
Co
nte
nts
of in
form
atio
n s
ea
rche
dN
o.o
f type
s o
f info
rma
tion
se
arc
he
d%
Level of satisfaction Intention to keep policy Intention to recommend policy
Figure 3-17 Level of satisfaction and loyalty
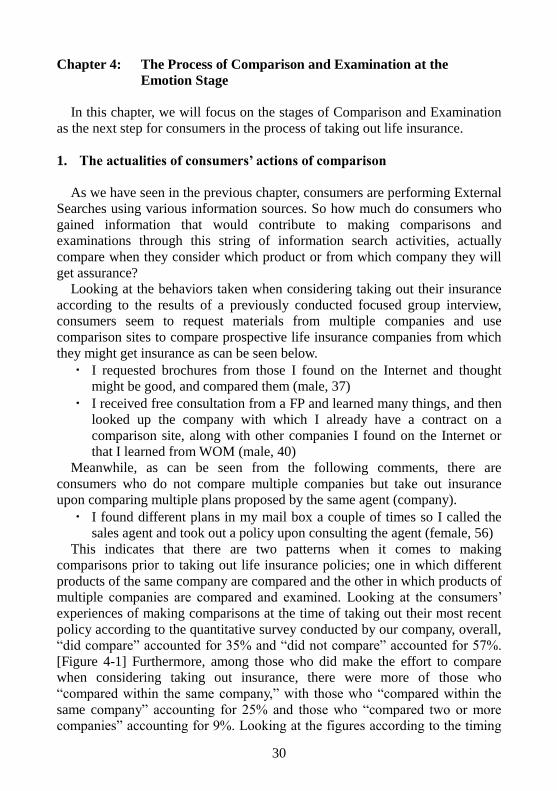
30
Chapter 4: The Process of Comparison and Examination at the
Emotion Stage
In this chapter, we will focus on the stages of Comparison and Examination
as the next step for consumers in the process of taking out life insurance.
1. The actualities of consumers’ actions of comparison
As we have seen in the previous chapter, consumers are performing External
Searches using various information sources. So how much do consumers who
gained information that would contribute to making comparisons and
examinations through this string of information search activities, actually
compare when they consider which product or from which company they will
get assurance?
Looking at the behaviors taken when considering taking out their insurance
according to the results of a previously conducted focused group interview,
consumers seem to request materials from multiple companies and use
comparison sites to compare prospective life insurance companies from which
they might get insurance as can be seen below.
・ I requested brochures from those I found on the Internet and thought
might be good, and compared them (male, 37)
・ I received free consultation from a FP and learned many things, and then
looked up the company with which I already have a contract on a
comparison site, along with other companies I found on the Internet or
that I learned from WOM (male, 40)
Meanwhile, as can be seen from the following comments, there are
consumers who do not compare multiple companies but take out insurance
upon comparing multiple plans proposed by the same agent (company).
・ I found different plans in my mail box a couple of times so I called the
sales agent and took out a policy upon consulting the agent (female, 56)
This indicates that there are two patterns when it comes to making
comparisons prior to taking out life insurance policies; one in which different
products of the same company are compared and the other in which products of
multiple companies are compared and examined. Looking at the consumers’
experiences of making comparisons at the time of taking out their most recent
policy according to the quantitative survey conducted by our company, overall,
“did compare” accounted for 35% and “did not compare” accounted for 57%.
[Figure 4-1] Furthermore, among those who did make the effort to compare
when considering taking out insurance, there were more of those who
“compared within the same company,” with those who “compared within the
same company” accounting for 25% and those who “compared two or more
companies” accounting for 9%. Looking at the figures according to the timing
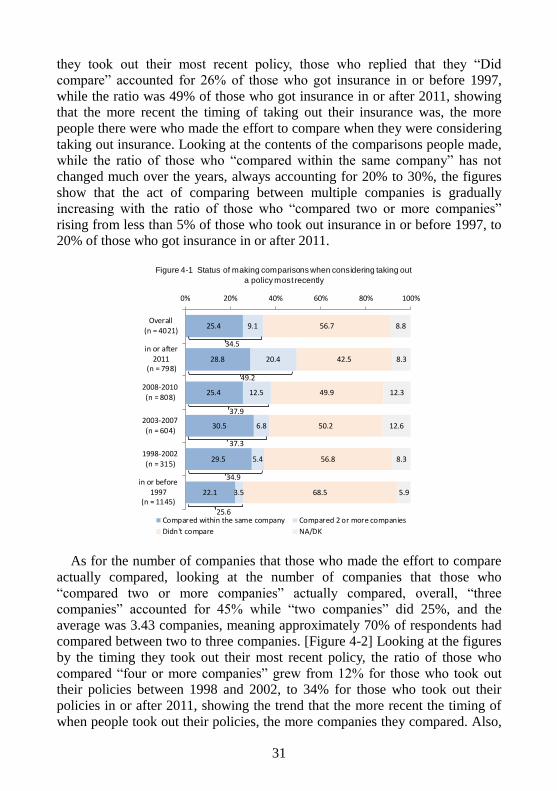
31
they took out their most recent policy, those who replied that they “Did
compare” accounted for 26% of those who got insurance in or before 1997,
while the ratio was 49% of those who got insurance in or after 2011, showing
that the more recent the timing of taking out their insurance was, the more
people there were who made the effort to compare when they were considering
taking out insurance. Looking at the contents of the comparisons people made,
while the ratio of those who “compared within the same company” has not
changed much over the years, always accounting for 20% to 30%, the figures
show that the act of comparing between multiple companies is gradually
increasing with the ratio of those who “compared two or more companies”
rising from less than 5% of those who took out insurance in or before 1997, to
20% of those who got insurance in or after 2011.
As for the number of companies that those who made the effort to compare
actually compared, looking at the number of companies that those who
“compared two or more companies” actually compared, overall, “three
companies” accounted for 45% while “two companies” did 25%, and the
average was 3.43 companies, meaning approximately 70% of respondents had
compared between two to three companies. [Figure 4-2] Looking at the figures
by the timing they took out their most recent policy, the ratio of those who
compared “four or more companies” grew from 12% for those who took out
their policies between 1998 and 2002, to 34% for those who took out their
policies in or after 2011, showing the trend that the more recent the timing of
when people took out their policies, the more companies they compared. Also,
25.4
28.8
25.4
30.5
29.5
22.1
9.1
20.4
12.5
6.8
5.4
3.5
56.7
42.5
49.9
50.2
56.8
68.5
8.8
8.3
12.3
12.6
8.3
5.9
0% 20% 40% 60% 80% 100%
Overall(n = 4021)
in or after2011
(n = 798)
2008-2010(n = 808)
2003-2007
(n = 604)
1998-2002(n = 315)
in or before1997
(n = 1145)
Compared within the same company Compared 2 or more companies
Didn't compare NA/DK
34.5
49.2
37.9
37.3
34.9
25.6
<Figure 4compared 2 or more companies>
Figure 4-1 Status of making comparisons when considering taking out
a policy most recently
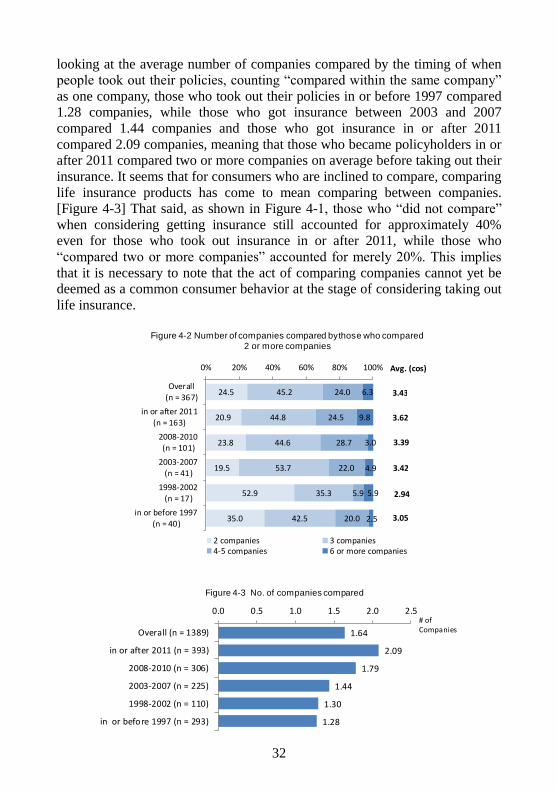
32
looking at the average number of companies compared by the timing of when
people took out their policies, counting “compared within the same company”
as one company, those who took out their policies in or before 1997 compared
1.28 companies, while those who got insurance between 2003 and 2007
compared 1.44 companies and those who got insurance in or after 2011
compared 2.09 companies, meaning that those who became policyholders in or
after 2011 compared two or more companies on average before taking out their
insurance. It seems that for consumers who are inclined to compare, comparing
life insurance products has come to mean comparing between companies.
[Figure 4-3] That said, as shown in Figure 4-1, those who “did not compare”
when considering getting insurance still accounted for approximately 40%
even for those who took out insurance in or after 2011, while those who
“compared two or more companies” accounted for merely 20%. This implies
that it is necessary to note that the act of comparing companies cannot yet be
deemed as a common consumer behavior at the stage of considering taking out
life insurance.
24.5
20.9
23.8
19.5
52.9
35.0
45.2
44.8
44.6
53.7
35.3
42.5
24.0
24.5
28.7
22.0
5.9
20.0
6.3
9.8
3.0
4.9
5.9
2.5
0% 20% 40% 60% 80% 100%
Overall
(n = 367)
in or after 2011
(n = 163)
2008-2010(n = 101)
2003-2007(n = 41)
1998-2002(n = 17)
in or before 1997(n = 40)
2 companies 3 companies4-5 companies 6 or more companies
Avg. (cos)
3.43
3.62
3.39
3.42
2.94
3.05
Figure 4-2 Number of companies compared by those who compared 2 or more companies
1.64
2.09
1.79
1.44
1.30
1.28
0.0 0.5 1.0 1.5 2.0 2.5
Overall (n = 1389)
in or after 2011 (n = 393)
2008-2010 (n = 306)
2003-2007 (n = 225)
1998-2002 (n = 110)
in or before 1997 (n = 293)
# of Companies
Figure 4-3 No. of companies compared
33
2. Where the factors that support the act of comparing lay
As has been seen above, so far, the act of comparing multiple companies at
the time of considering taking out a life insurance and then purchasing one
cannot be regarded as a mainstream action taken by consumers. Mr. Mochino
of Amviy Communications who proposed the AISCEAS model has remarked
on the limits of the theory that “AISCEAS is (merely) a model analyzing only
a small part of purchasing behaviors” and that “the only time the purchasing
behavior of AISCEAS is taken is simply for products or services with high
functional value.” Insurance products differ from fashion items or beverages
which people would purchase if they feel the product might suit them, and it
can be said that it is a product with high functional value that fits the AISCEAS
theory in the respect that gaining the understanding that the product suits
oneself from brochures or explanations of sales agents leads to taking out a
policy. So what is the reason behind the fact that the number of consumers
comparing companies during the process of taking out a life insurance has not
increased dramatically even though the environment for consumers to compare
life insurance products is now more advanced than ever with the spread of the
Internet and the progresses made in the respective companies’ information
disclosure?
In order to narrow down the candidate products to be purchased by
comparing their functions, it can be imagined that knowledge to judge the
superiority or inferiority of products also becomes necessary. Looking at the
policyholders who have made the effort to compare classified by the timing of
when they took out their most recent policy as shown in Figure 4-1 by the level
of their knowledge on life insurance, the higher the level of their knowledge,
the higher the ratio of those who did compare were for all of those who had
compared as well as for those who had compared two or more companies,
regardless of the timing of when they took out their policies. [Figure 4-4]
Furthermore, focusing on the differences by the timing of when they took out
their policies, “did compare” tended to rise in general as the timing of when
they got their insurance became more recent, regardless of the knowledge level.
[Figure 4-5] This trend is even more notable for those who “compared two or
more companies,” as can be seen from the fact that among those who took out
their policies in or after 2011 with high knowledge and who made the effort to
compare, more than half compared between multiple companies when
considering taking out insurance. From the above, it is conceivable that the reason why not many consumers are comparing life insurance products
although they are “products with high functional value,” is that many people
do not have the knowledge necessary to make the comparisons.
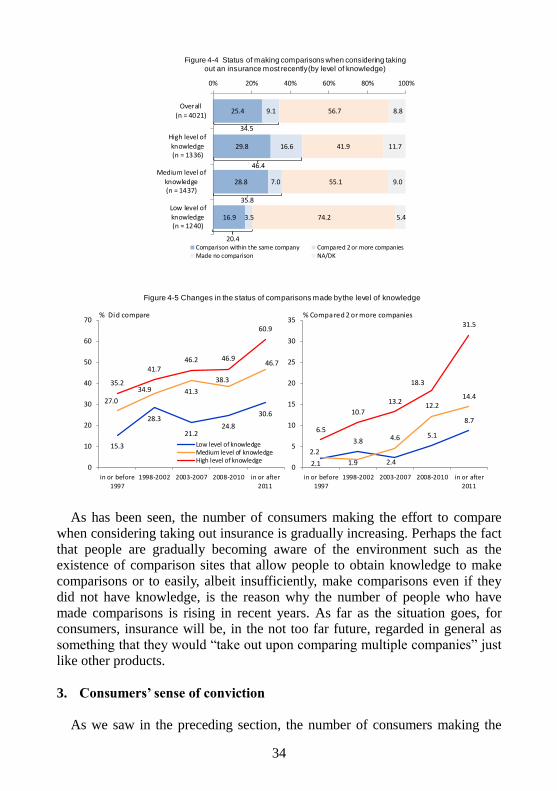
34
As has been seen, the number of consumers making the effort to compare
when considering taking out insurance is gradually increasing. Perhaps the fact
that people are gradually becoming aware of the environment such as the existence of comparison sites that allow people to obtain knowledge to make
comparisons or to easily, albeit insufficiently, make comparisons even if they
did not have knowledge, is the reason why the number of people who have
made comparisons is rising in recent years. As far as the situation goes, for consumers, insurance will be, in the not too far future, regarded in general as
something that they would “take out upon comparing multiple companies” just like other products.
3. Consumers’ sense of conviction
As we saw in the preceding section, the number of consumers making the
25.4
29.8
28.8
16.9
9.1
16.6
7.0
3.5
56.7
41.9
55.1
74.2
8.8
11.7
9.0
5.4
0% 20% 40% 60% 80% 100%
Overall(n = 4021)
High level of
knowledge(n = 1336)
Medium level ofknowledge(n = 1437)
Low level ofknowledge(n = 1240)
Comparison within the same company Compared 2 or more companiesMade no comparison NA/DK
34.5
46.4
35.8
20.4
Figure 4-4 Status of making comparisons when considering taking out an insurance most recently (by level of knowledge)
15.3
28.3
21.224.8
30.6
27.0
34.9 41.3
38.3
46.7
35.2
41.746.2 46.9
60.9
0
10
20
30
40
50
60
70
in or before
1997
1998-2002 2003-2007 2008-2010 in or after
2011
Low level of knowledgeMedium level of knowledgeHigh level of knowledge
% Did compare
2.1
3.8
2.4
5.1
8.7
2.2
1.9
4.6
12.214.4
6.5
10.7
13.2
18.3
31.5
0
5
10
15
20
25
30
35
in or before
1997
1998-2002 2003-2007 2008-2010 in or after
2011
% Compared 2 or more companies
Figure 4-5 Changes in the status of comparisons made by the level of knowledge
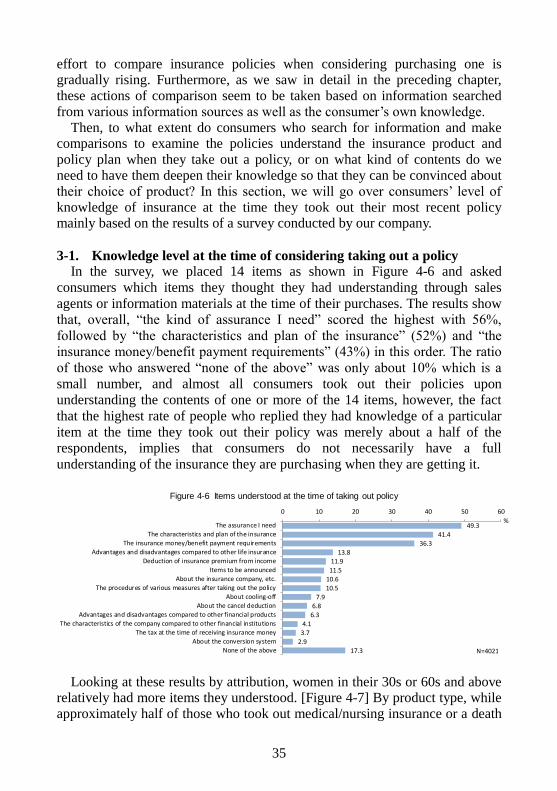
35
effort to compare insurance policies when considering purchasing one is gradually rising. Furthermore, as we saw in detail in the preceding chapter,
these actions of comparison seem to be taken based on information searched
from various information sources as well as the consumer’s own knowledge.
Then, to what extent do consumers who search for information and make comparisons to examine the policies understand the insurance product and
policy plan when they take out a policy, or on what kind of contents do we
need to have them deepen their knowledge so that they can be convinced about
their choice of product? In this section, we will go over consumers’ level of
knowledge of insurance at the time they took out their most recent policy mainly based on the results of a survey conducted by our company.
3-1. Knowledge level at the time of considering taking out a policy In the survey, we placed 14 items as shown in Figure 4-6 and asked
consumers which items they thought they had understanding through sales
agents or information materials at the time of their purchases. The results show
that, overall, “the kind of assurance I need” scored the highest with 56%,
followed by “the characteristics and plan of the insurance” (52%) and “the
insurance money/benefit payment requirements” (43%) in this order. The ratio
of those who answered “none of the above” was only about 10% which is a
small number, and almost all consumers took out their policies upon
understanding the contents of one or more of the 14 items, however, the fact
that the highest rate of people who replied they had knowledge of a particular
item at the time they took out their policy was merely about a half of the
respondents, implies that consumers do not necessarily have a full
understanding of the insurance they are purchasing when they are getting it.
Looking at these results by attribution, women in their 30s or 60s and above relatively had more items they understood. [Figure 4-7] By product type, while
approximately half of those who took out medical/nursing insurance or a death
49.3
41.4
36.3
13.8
11.9
11.5
10.6
10.5
7.9
6.8
6.3
4.1
3.7
2.9
17.3
0 10 20 30 40 50 60
The assurance I need
The characteristics and plan of the insurance
The insurance money/benefit payment requirements
Advantages and disadvantages compared to other life insurance
Deduction of insurance premium from income
Items to be announced
About the insurance company, etc.
The procedures of various measures after taking out the policy
About cooling-off
About the cancel deduction
Advantages and disadvantages compared to other financial products
The characteristics of the company compared to other financial institutions
The tax at the time of receiving insurance money
About the conversion system
None of the above
%
N=4021
Figure 4-6 Items understood at the time of taking out policy
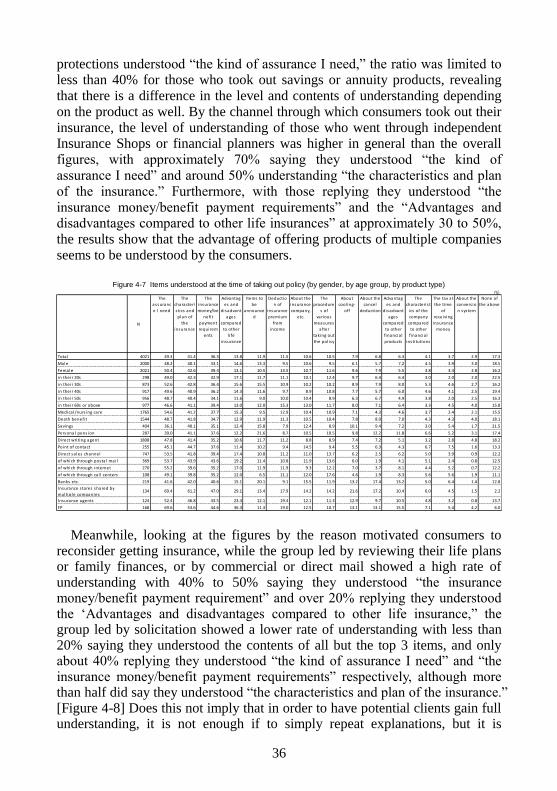
36
protections understood “the kind of assurance I need,” the ratio was limited to less than 40% for those who took out savings or annuity products, revealing
that there is a difference in the level and contents of understanding depending
on the product as well. By the channel through which consumers took out their
insurance, the level of understanding of those who went through independent Insurance Shops or financial planners was higher in general than the overall
figures, with approximately 70% saying they understood “the kind of
assurance I need” and around 50% understanding “the characteristics and plan
of the insurance.” Furthermore, with those replying they understood “the
insurance money/benefit payment requirements” and the “Advantages and disadvantages compared to other life insurances” at approximately 30 to 50%,
the results show that the advantage of offering products of multiple companies
seems to be understood by the consumers.
Meanwhile, looking at the figures by the reason motivated consumers to
reconsider getting insurance, while the group led by reviewing their life plans or family finances, or by commercial or direct mail showed a high rate of understanding with 40% to 50% saying they understood “the insurance money/benefit payment requirement” and over 20% replying they understood the ‘Advantages and disadvantages compared to other life insurance,” the group led by solicitation showed a lower rate of understanding with less than 20% saying they understood the contents of all but the top 3 items, and only about 40% replying they understood “the kind of assurance I need” and “the insurance money/benefit payment requirements” respectively, although more than half did say they understood “the characteristics and plan of the insurance.” [Figure 4-8] Does this not imply that in order to have potential clients gain full understanding, it is not enough if to simply repeat explanations, but it is
(%)
N
The
assuranc
e I need
The
characteri
s tics and
plan of
the
insurance
The
insurance
money/be
nefi t
payment
requirem
ents
Advantag
es and
disadvant
ages
compared
to other
l i fe
insurance
Items to
be
announce
d
Deductio
n of
insurance
premium
from
income
About the
insurance
company,
etc.
The
procedure
s of
various
measures
after
taking out
the pol icy
About
cool ing-
off
About the
cancel
deduction
Advantag
es and
disadvant
ages
compared
to other
financia l
products
The
characteris t
ics of the
company
compared
to other
financia l
insti tutions
The tax at
the time
of
receiving
insurance
money
About the
convers io
n system
None of
the above
Total 4021 49.3 41.4 36.3 13.8 11.9 11.5 10.6 10.5 7.9 6.8 6.3 4.1 3.7 2.9 17.3
Male 2000 48.2 40.1 33.1 14.6 13.3 9.5 10.6 9.5 6.1 5.7 7.2 4.5 3.9 3.0 18.5
Female 2021 50.4 42.6 39.4 13.1 10.5 13.5 10.7 11.6 9.6 7.9 5.5 3.8 3.4 2.8 16.2
in their 20s 298 49.0 42.3 32.9 17.1 11.7 11.1 10.1 12.4 9.7 6.4 6.4 3.0 2.0 2.0 22.5
in their 30s 873 52.6 42.8 36.4 15.6 15.5 10.9 10.2 10.2 8.9 7.9 8.0 5.3 4.6 2.7 16.2
in their 40s 917 49.6 40.9 36.2 14.3 11.6 9.7 8.9 10.8 7.7 5.7 6.0 4.6 4.1 2.5 19.4
in their 50s 956 48.7 40.4 34.1 11.6 9.0 10.0 10.4 8.9 6.3 6.7 4.9 3.8 2.0 2.5 16.3
in their 60s or above 977 46.6 41.1 39.4 13.0 12.0 15.3 13.0 11.7 8.0 7.1 6.4 3.3 4.5 4.0 15.8
Medica l/nurs ing care 1765 54.6 41.2 37.7 15.3 9.5 12.9 10.4 10.9 7.1 4.3 4.6 3.7 2.4 2.1 15.5
Death benefi t 1544 48.7 41.8 34.7 12.9 11.9 11.3 10.5 10.4 7.8 8.0 7.0 4.3 4.3 4.0 18.1
Savings 404 36.1 40.1 35.1 12.4 15.8 7.9 12.4 8.9 10.1 9.4 7.2 3.0 5.4 1.7 21.5
Personal pens ion 287 39.0 41.1 37.6 12.2 21.6 8.7 10.5 10.5 9.8 12.2 11.8 6.6 5.2 3.1 17.4
Direct wri ting agent 1808 47.8 41.4 35.2 10.6 11.7 11.2 8.8 8.9 7.4 7.2 5.1 3.2 2.8 4.8 18.2
Point of contact 255 45.1 44.7 37.6 11.4 10.2 9.4 14.5 9.4 5.5 6.3 4.3 6.7 7.5 1.6 13.3
Direct sa les channel 747 53.5 41.8 39.4 17.4 10.8 11.2 11.0 13.7 6.2 2.5 6.2 5.0 3.9 0.9 12.2
of which through postal mai l 369 53.7 43.9 43.6 19.2 11.4 10.8 11.9 13.6 6.0 1.9 4.1 5.1 2.4 0.8 12.5
of which through internet 270 55.2 39.6 35.2 17.0 11.9 11.9 9.3 12.2 7.0 3.7 8.1 4.4 5.2 0.7 12.2
of which through ca l l centers 108 49.1 39.8 35.2 12.0 6.5 11.1 12.0 17.6 4.6 1.9 8.3 5.6 5.6 1.9 11.1
Banks etc. 219 41.6 42.0 40.6 15.1 20.1 9.1 15.5 11.9 13.2 17.4 13.2 5.0 6.4 1.4 12.8
Insurance s tores shared by
multiple companies134 69.4 61.2 47.0 29.1 13.4 17.9 14.2 14.2 21.6 17.2 10.4 6.0 4.5 1.5 2.2
Insurance agents 124 52.4 46.8 43.5 23.4 12.1 19.4 12.1 11.3 12.9 9.7 10.5 4.8 3.2 0.8 13.7
FP 168 69.6 53.6 44.6 36.3 11.3 19.0 12.5 10.7 13.1 13.1 15.5 7.1 5.4 4.2 6.0
Figure 4-7 Items understood at the time of taking out policy (by gender, by age group, by product type)
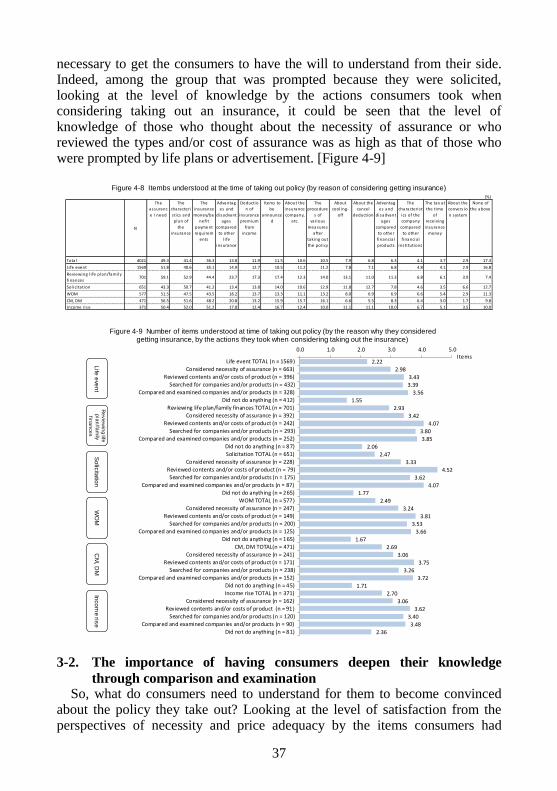
37
necessary to get the consumers to have the will to understand from their side. Indeed, among the group that was prompted because they were solicited, looking at the level of knowledge by the actions consumers took when considering taking out an insurance, it could be seen that the level of knowledge of those who thought about the necessity of assurance or who reviewed the types and/or cost of assurance was as high as that of those who were prompted by life plans or advertisement. [Figure 4-9]
3-2. The importance of having consumers deepen their knowledge
through comparison and examination So, what do consumers need to understand for them to become convinced
about the policy they take out? Looking at the level of satisfaction from the perspectives of necessity and price adequacy by the items consumers had
(%)
N
The
assuranc
e I need
The
characteri
s tics and
plan of
the
insurance
The
insurance
money/be
nefi t
payment
requirem
ents
Advantag
es and
disadvant
ages
compared
to other
l i fe
insurance
Deductio
n of
insurance
premium
from
income
Items to
be
announce
d
About the
insurance
company,
etc.
The
procedure
s of
various
measures
after
taking out
the pol icy
About
cool ing-
off
About the
cancel
deduction
Advantag
es and
disadvant
ages
compared
to other
financia l
products
The
characteris t
ics of the
company
compared
to other
financia l
insti tutions
The tax at
the time
of
receiving
insurance
money
About the
convers io
n system
None of
the above
Total 4021 49.3 41.4 36.3 13.8 11.9 11.5 10.6 10.5 7.9 6.8 6.3 4.1 3.7 2.9 17.3
Li fe event 1569 51.8 40.6 35.1 14.9 12.7 10.5 11.2 11.2 7.8 7.1 6.8 4.8 4.1 2.9 16.8
Reviewing l i fe plan/fami ly
finances701 59.1 52.9 44.4 23.7 17.3 17.4 12.3 14.0 13.1 11.0 11.3 6.8 6.1 3.9 7.4
Sol ici tation 651 43.3 50.7 41.2 13.4 13.8 14.0 10.6 12.9 11.8 12.7 7.8 4.6 3.5 6.6 12.7
WOM 577 51.5 47.5 43.5 18.2 13.7 13.3 11.1 13.2 8.0 6.9 6.9 6.6 5.4 2.9 11.3
CM, DM 471 56.5 51.6 48.2 20.8 13.2 15.9 15.7 16.1 6.6 5.5 8.3 6.4 3.0 1.7 9.8
Income rise 371 50.4 52.0 51.2 17.8 12.4 16.7 12.4 10.0 11.1 11.1 10.0 6.7 5.1 3.5 10.0
Figure 4-8 Itembs understood at the time of taking out policy (by reason of considering getting insurance)
2.22
2.98
3.43
3.39
3.56
1.55
2.93
3.42
4.07
3.80
3.85
2.06
2.47
3.33
4.52
3.62
4.07
1.77
2.49
3.24
3.81
3.53
3.66
1.67
2.69
3.06
3.75
3.26
3.72
1.71
2.70
3.06
3.62
3.40
3.48
2.36
0.0 1.0 2.0 3.0 4.0 5.0
Life event TOTAL (n = 1569)
Considered necessity of assurance (n = 663)
Reviewed contents and/or costs of product (n = 396)
Searched for companies and/or products (n = 432)
Compared and examined companies and/or products (n = 328)
Did not do anything (n = 412)
Reviewing life plan/family finances TOTAL (n = 701)
Considered necessity of assurance (n = 392)
Reviewed contents and/or costs of product (n = 242)
Searched for companies and/or products (n = 293)
Compared and examined companies and/or products (n = 252)
Did not do anything (n = 87)
Solicitation TOTAL (n = 651)
Considered necessity of assurance (n = 228)
Reviewed contents and/or costs of product (n = 79)
Searched for companies and/or products (n = 175)
Compared and examined companies and/or products (n = 87)
Did not do anything (n = 265)
WOM TOTAL (n = 577)
Considered necessity of assurance (n = 247)
Reviewed contents and/or costs of product (n = 149)
Searched for companies and/or products (n = 200)
Compared and examined companies and/or products (n = 125)
Did not do anything (n = 165)
CM, DM TOTAL(n = 471)
Considered necessity of assurance (n = 241)
Reviewed contents and/or costs of product (n = 171)
Searched for companies and/or products (n = 238)
Compared and examined companies and/or products (n = 152)
Did not do anything (n = 45)
Income rise TOTAL (n = 371)
Considered necessity of assurance (n = 162)
Reviewed contents and/or costs of product (n = 91)
Searched for companies and/or products (n = 120)
Compared and examined companies and/or products (n = 90)
Did not do anything (n = 81)
Life
eve
nt
Re
vie
win
g life
pla
n/fa
mily
fina
nce
sS
olic
itatio
nW
OM
CM
, DM
Inco
me
rise
Items
Figure 4-9 Number of items understood at time of taking out policy (by the reason why they considered getting insurance, by the actions they took when considering taking out the insurance)
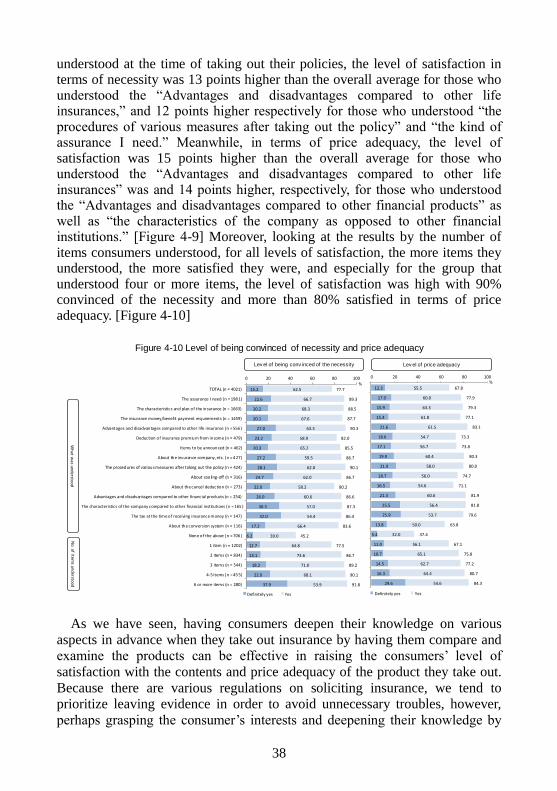
38
understood at the time of taking out their policies, the level of satisfaction in terms of necessity was 13 points higher than the overall average for those who understood the “Advantages and disadvantages compared to other life insurances,” and 12 points higher respectively for those who understood “the procedures of various measures after taking out the policy” and “the kind of assurance I need.” Meanwhile, in terms of price adequacy, the level of satisfaction was 15 points higher than the overall average for those who understood the “Advantages and disadvantages compared to other life insurances” was and 14 points higher, respectively, for those who understood the “Advantages and disadvantages compared to other financial products” as well as “the characteristics of the company as opposed to other financial institutions.” [Figure 4-9] Moreover, looking at the results by the number of items consumers understood, for all levels of satisfaction, the more items they understood, the more satisfied they were, and especially for the group that understood four or more items, the level of satisfaction was high with 90% convinced of the necessity and more than 80% satisfied in terms of price adequacy. [Figure 4-10]
As we have seen, having consumers deepen their knowledge on various
aspects in advance when they take out insurance by having them compare and examine the products can be effective in raising the consumers’ level of
satisfaction with the contents and price adequacy of the product they take out.
Because there are various regulations on soliciting insurance, we tend to
prioritize leaving evidence in order to avoid unnecessary troubles, however,
perhaps grasping the consumer’s interests and deepening their knowledge by
12.3
17.9
15.9
15.4
21.6
18.6
17.1
19.9
21.9
18.7
16.5
21.3
25.5
25.9
13.8
5.4
11.0
10.7
14.5
16.3
29.6
55.5
60.0
63.3
61.8
61.5
54.7
56.7
60.4
58.0
56.0
54.6
60.6
56.4
53.7
50.0
32.0
56.1
65.1
62.7
64.4
54.6
67.8
77.9
79.3
77.1
83.1
73.3
73.8
80.3
80.0
74.7
71.1
81.9
81.8
79.6
63.8
37.4
67.1
75.8
77.2
80.7
84.3
0 20 40 60 80 100
Definitely yes Yes
%
15.2
22.6
20.2
20.1
27.0
23.2
20.3
27.2
28.1
24.7
22.0
26.0
30.3
32.0
17.2
6.2
12.7
13.1
18.2
22.0
37.9
62.5
66.7
68.3
67.6
63.3
58.9
65.2
59.5
62.0
62.0
58.2
60.6
57.0
54.4
66.4
39.0
64.8
73.6
71.0
68.1
53.9
77.7
89.3
88.5
87.7
90.3
82.0
85.5
86.7
90.1
86.7
80.2
86.6
87.3
86.4
83.6
45.2
77.5
86.7
89.2
90.1
91.8
0 20 40 60 80 100
TOTAL (n = 4021)
The assurance I need (n = 198 1)
The characteristics and plan of the insurance (n = 1663)
The insurance money/benefit payment requirements (n = 1459)
Advantages and disadvantages compared to other life insurance (n = 556 )
Deduction of insurance premium from income (n = 479)
Items to be announced (n = 462)
About the insurance company, etc. (n = 4 27)
The procedures of various measures after taking out the policy (n = 424)
About cooling-off (n = 316)
About the cancel deduction (n = 273)
Advantages and disadvantages compared to other financial products (n = 254)
The characteristics of the company compared to other financial institutions (n = 165 )
The tax at the time of receiving insurance money (n = 147)
About the conversion system (n = 116)
None of the above (n = 706 )
1 item (n = 1202)
2 items (n = 834)
3 items (n = 544)
4-5 items (n = 45 5)
6 or more items (n = 280)
Definitely yes Yes
What w
as understoodN
o.of items understood
%
Lev el of being conv inced of the necessity Lev el of price adequacy
Figure 4-10 Level of being convinced of necessity and price adequacy
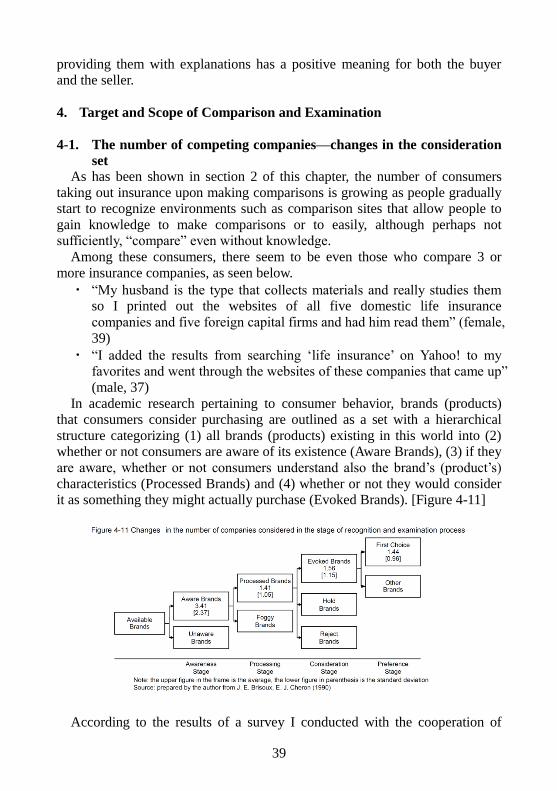
39
providing them with explanations has a positive meaning for both the buyer
and the seller.
4. Target and Scope of Comparison and Examination
4-1. The number of competing companies—changes in the consideration
set
As has been shown in section 2 of this chapter, the number of consumers
taking out insurance upon making comparisons is growing as people gradually
start to recognize environments such as comparison sites that allow people to
gain knowledge to make comparisons or to easily, although perhaps not
sufficiently, “compare” even without knowledge.
Among these consumers, there seem to be even those who compare 3 or
more insurance companies, as seen below.
・ “My husband is the type that collects materials and really studies them
so I printed out the websites of all five domestic life insurance
companies and five foreign capital firms and had him read them” (female,
39)
・ “I added the results from searching ‘life insurance’ on Yahoo! to my
favorites and went through the websites of these companies that came up”
(male, 37)
In academic research pertaining to consumer behavior, brands (products)
that consumers consider purchasing are outlined as a set with a hierarchical
structure categorizing (1) all brands (products) existing in this world into (2)
whether or not consumers are aware of its existence (Aware Brands), (3) if they
are aware, whether or not consumers understand also the brand’s (product’s)
characteristics (Processed Brands) and (4) whether or not they would consider
it as something they might actually purchase (Evoked Brands). [Figure 4-11]
According to the results of a survey I conducted with the cooperation of
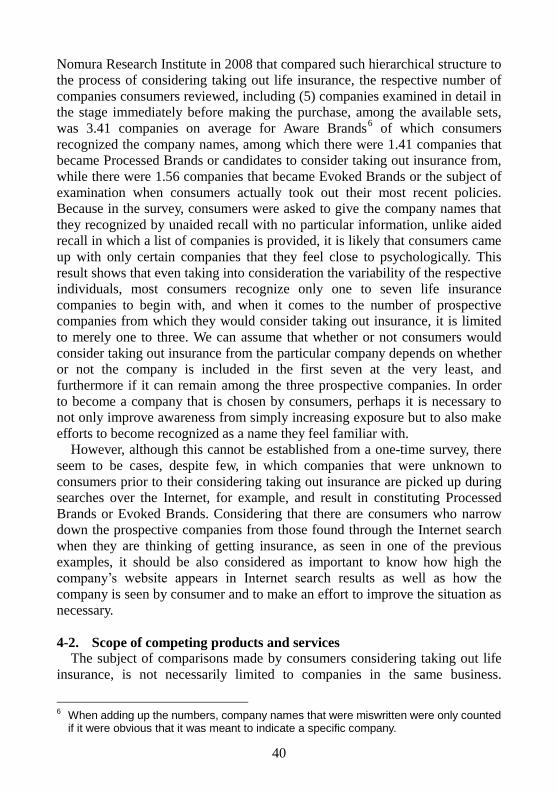
40
Nomura Research Institute in 2008 that compared such hierarchical structure to
the process of considering taking out life insurance, the respective number of
companies consumers reviewed, including (5) companies examined in detail in
the stage immediately before making the purchase, among the available sets,
was 3.41 companies on average for Aware Brands6 of which consumers
recognized the company names, among which there were 1.41 companies that
became Processed Brands or candidates to consider taking out insurance from,
while there were 1.56 companies that became Evoked Brands or the subject of
examination when consumers actually took out their most recent policies.
Because in the survey, consumers were asked to give the company names that
they recognized by unaided recall with no particular information, unlike aided
recall in which a list of companies is provided, it is likely that consumers came
up with only certain companies that they feel close to psychologically. This
result shows that even taking into consideration the variability of the respective
individuals, most consumers recognize only one to seven life insurance
companies to begin with, and when it comes to the number of prospective
companies from which they would consider taking out insurance, it is limited
to merely one to three. We can assume that whether or not consumers would
consider taking out insurance from the particular company depends on whether
or not the company is included in the first seven at the very least, and
furthermore if it can remain among the three prospective companies. In order
to become a company that is chosen by consumers, perhaps it is necessary to
not only improve awareness from simply increasing exposure but to also make
efforts to become recognized as a name they feel familiar with.
However, although this cannot be established from a one-time survey, there
seem to be cases, despite few, in which companies that were unknown to
consumers prior to their considering taking out insurance are picked up during
searches over the Internet, for example, and result in constituting Processed
Brands or Evoked Brands. Considering that there are consumers who narrow
down the prospective companies from those found through the Internet search
when they are thinking of getting insurance, as seen in one of the previous
examples, it should be also considered as important to know how high the
company’s website appears in Internet search results as well as how the
company is seen by consumer and to make an effort to improve the situation as
necessary.
4-2. Scope of competing products and services The subject of comparisons made by consumers considering taking out life
insurance, is not necessarily limited to companies in the same business.
6 When adding up the numbers, company names that were miswritten were only counted
if it were obvious that it was meant to indicate a specific company.
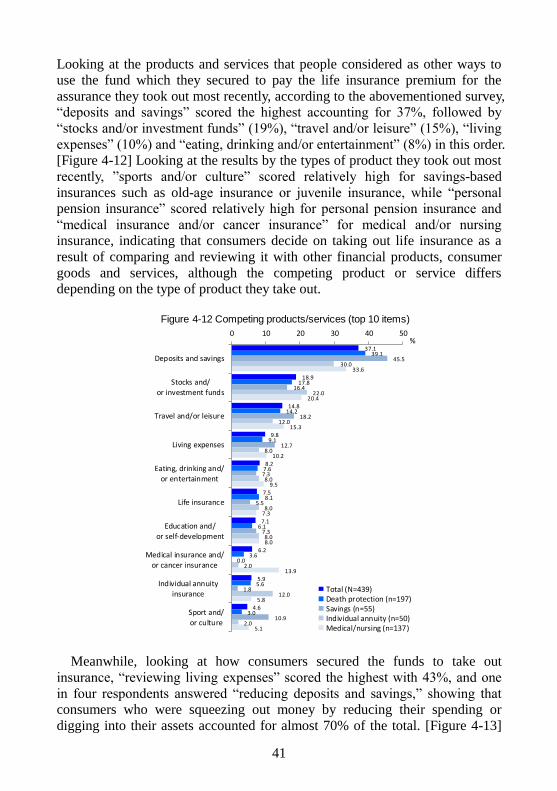
41
Looking at the products and services that people considered as other ways to
use the fund which they secured to pay the life insurance premium for the
assurance they took out most recently, according to the abovementioned survey,
“deposits and savings” scored the highest accounting for 37%, followed by
“stocks and/or investment funds” (19%), “travel and/or leisure” (15%), “living
expenses” (10%) and “eating, drinking and/or entertainment” (8%) in this order.
[Figure 4-12] Looking at the results by the types of product they took out most
recently, ”sports and/or culture” scored relatively high for savings-based
insurances such as old-age insurance or juvenile insurance, while “personal
pension insurance” scored relatively high for personal pension insurance and
“medical insurance and/or cancer insurance” for medical and/or nursing
insurance, indicating that consumers decide on taking out life insurance as a
result of comparing and reviewing it with other financial products, consumer
goods and services, although the competing product or service differs
depending on the type of product they take out.
Meanwhile, looking at how consumers secured the funds to take out
insurance, “reviewing living expenses” scored the highest with 43%, and one
in four respondents answered “reducing deposits and savings,” showing that
consumers who were squeezing out money by reducing their spending or
digging into their assets accounted for almost 70% of the total. [Figure 4-13]
37.1
18.9
14.8
9.8
8.2
7.5
7.1
6.2
5.9
4.6
39.1
17.8
14.2
9.1
7.6
8.1
6.1
3.6
5.6
3.0
45.5
16.4
18.2
12.7
7.3
5.5
7.3
0.0
1.8
10.9
30.0
22.0
12.0
8.0
8.0
8.0
8.0
2.0
12.0
2.0
33.6
20.4
15.3
10.2
9.5
7.3
8.0
13.9
5.8
5.1
0 10 20 30 40 50
Deposits and savings
Stocks and/
or investment funds
Travel and/or leisure
Living expenses
Eating, drinking and/
or entertainment
Life insurance
Education and/or self-development
Medical insurance and/or cancer insurance
Individual annuityinsurance
Sport and/
or culture
Total (N=439)Death protection (n=197)Savings (n=55)Individual annuity (n=50)Medical/nursing (n=137)
%
Figure 4-12 Competing products/services (top 10 items)
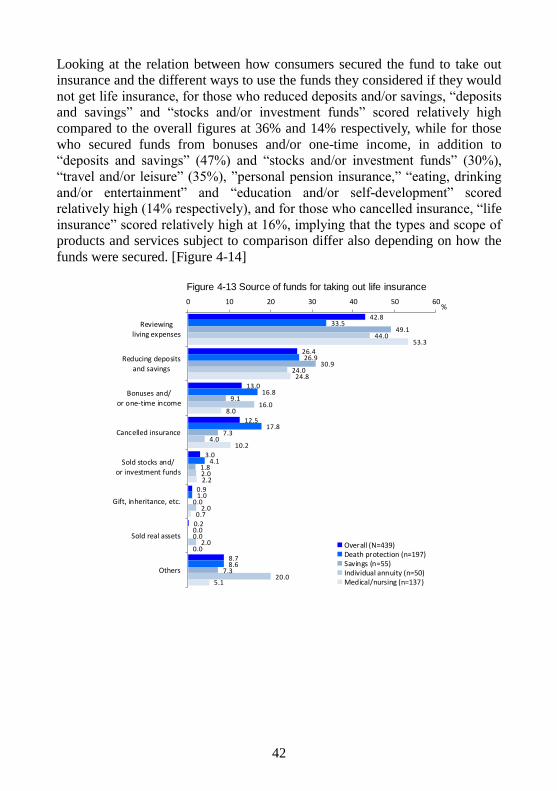
42
Looking at the relation between how consumers secured the fund to take out
insurance and the different ways to use the funds they considered if they would
not get life insurance, for those who reduced deposits and/or savings, “deposits
and savings” and “stocks and/or investment funds” scored relatively high
compared to the overall figures at 36% and 14% respectively, while for those
who secured funds from bonuses and/or one-time income, in addition to
“deposits and savings” (47%) and “stocks and/or investment funds” (30%),
“travel and/or leisure” (35%), ”personal pension insurance,” “eating, drinking
and/or entertainment” and “education and/or self-development” scored
relatively high (14% respectively), and for those who cancelled insurance, “life
insurance” scored relatively high at 16%, implying that the types and scope of
products and services subject to comparison differ also depending on how the
funds were secured. [Figure 4-14]
42.8
26.4
13.0
12.5
3.0
0.9
0.2
8.7
33.5
26.9
16.8
17.8
4.1
1.0
0.0
8.6
49.1
30.9
9.1
7.3
1.8
0.0
0.0
7.3
44.0
24.0
16.0
4.0
2.0
2.0
2.0
20.0
53.3
24.8
8.0
10.2
2.2
0.7
0.0
5.1
0 10 20 30 40 50 60
Reviewingliving expenses
Reducing depositsand savings
Bonuses and/or one-time income
Cancelled insurance
Sold stocks and/or investment funds
Gift, inheritance, etc.
Sold real assets
Others
Overall (N=439)Death protection (n=197)Savings (n=55)Individual annuity (n=50)Medical/nursing (n=137)
%
Figure 4-13 Source of funds for taking out life insurance
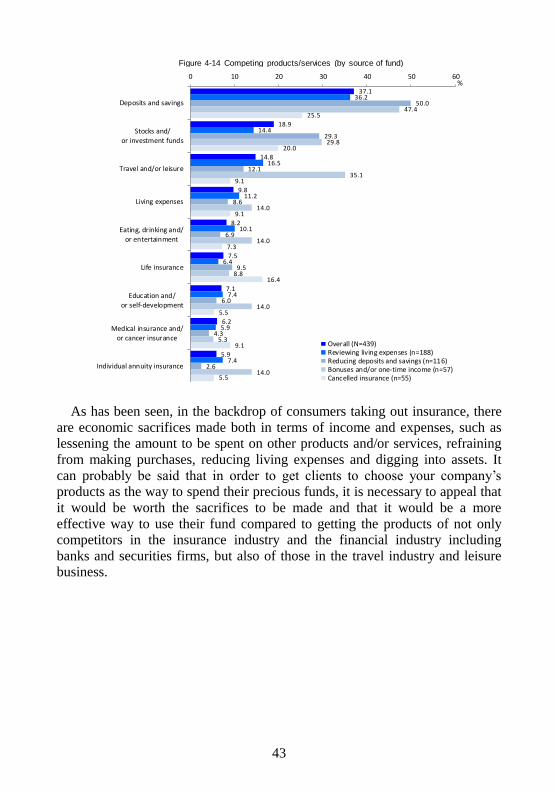
43
As has been seen, in the backdrop of consumers taking out insurance, there
are economic sacrifices made both in terms of income and expenses, such as
lessening the amount to be spent on other products and/or services, refraining
from making purchases, reducing living expenses and digging into assets. It
can probably be said that in order to get clients to choose your company’s
products as the way to spend their precious funds, it is necessary to appeal that
it would be worth the sacrifices to be made and that it would be a more
effective way to use their fund compared to getting the products of not only
competitors in the insurance industry and the financial industry including
banks and securities firms, but also of those in the travel industry and leisure
business.
37.1
18.9
14.8
9.8
8.2
7.5
7.1
6.2
5.9
36.2
14.4
16.5
11.2
10.1
6.4
7.4
5.9
7.4
50.0
29.3
12.1
8.6
6.9
9.5
6.0
4.3
2.6
47.4
29.8
35.1
14.0
14.0
8.8
14.0
5.3
14.0
25.5
20.0
9.1
9.1
7.3
16.4
5.5
9.1
5.5
0 10 20 30 40 50 60
Deposits and savings
Stocks and/
or investment funds
Travel and/or leisure
Living expenses
Eating, drinking and/or entertainment
Life insurance
Education and/or self-development
Medical insurance and/
or cancer insurance
Individual annuity insurance
Overall (N=439)Reviewing living expenses (n=188)Reducing deposits and savings (n=116)Bonuses and/or one-time income (n=57)Cancelled insurance (n=55)
%
Figure 4-14 Competing products/services (by source of fund)
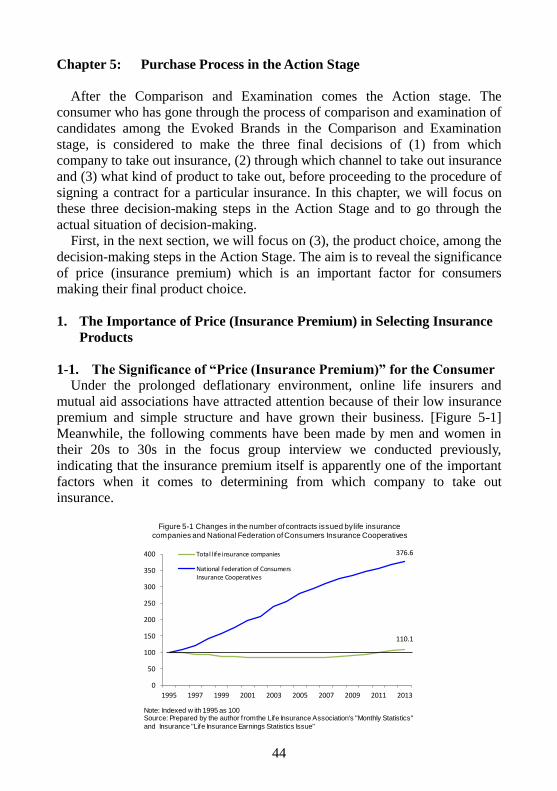
44
Chapter 5: Purchase Process in the Action Stage
After the Comparison and Examination comes the Action stage. The
consumer who has gone through the process of comparison and examination of
candidates among the Evoked Brands in the Comparison and Examination
stage, is considered to make the three final decisions of (1) from which
company to take out insurance, (2) through which channel to take out insurance
and (3) what kind of product to take out, before proceeding to the procedure of
signing a contract for a particular insurance. In this chapter, we will focus on
these three decision-making steps in the Action Stage and to go through the
actual situation of decision-making.
First, in the next section, we will focus on (3), the product choice, among the
decision-making steps in the Action Stage. The aim is to reveal the significance
of price (insurance premium) which is an important factor for consumers
making their final product choice.
1. The Importance of Price (Insurance Premium) in Selecting Insurance
Products
1-1. The Significance of “Price (Insurance Premium)” for the Consumer
Under the prolonged deflationary environment, online life insurers and
mutual aid associations have attracted attention because of their low insurance
premium and simple structure and have grown their business. [Figure 5-1]
Meanwhile, the following comments have been made by men and women in
their 20s to 30s in the focus group interview we conducted previously,
indicating that the insurance premium itself is apparently one of the important
factors when it comes to determining from which company to take out
insurance.
110.1
376.6
0
50
100
150
200
250
300
350
400
1995 1997 1999 2001 2003 2005 2007 2009 2011 2013
Total life insurance companies
National Federation of ConsumersInsurance Cooperatives
Note: Indexed w ith 1995 as 100Source: Prepared by the author from the Life Insurance Association's "Monthly Statistics"
and Insurance "Life Insurance Earnings Statistics Issue"
Figure 5-1 Changes in the number of contracts issued by life insurance companies and National Federation of Consumers Insurance Cooperatives
45
・ I can understand that direct sales is less expensive because there is no
sales agent, so I want to take out insurance from a foreign capital firm
that is clearly cheaper (male, 29)
・ My insurance premium will rise at the age of 40, so I plan to cancel my
policy at that timing. If I were to switch now, I’d go for a life insurance
company with lower insurance premium (male, 33)
・ I’ve taken out a policy without understanding anything in the past and
had to cancel because the insurance premium was so high (female, 31)
In the textbook of insurance, it is considered that the insurance premium that
is the “price” of life insurance products, can be divided into pure premium
which is for paying the insurance money and benefit in case of insured events,
and loading premium. Furthermore, is deemed typical to set the price of a
product by estimating the cost for production and distribution of the product
and then adding on the profit, in this order. Although for the seller, it would
seem natural to determine the price based on such calculation procedure,
looking at the “price” from the perspective of the consumer who is going to
purchase (take out) the product (including life insurance), one notices there is a
different aspect than the simple “cost” + “profit.” A luxury brand is a typical
example. Even though there is no physical difference in the material or sewing
technique, consumers at times happily pay higher prices for a certain product
or service. Moreover, when considering where to go on vacation, consumers
seem to worry if they would be able to receive decent service from
accommodation facilities that set their prices much lower than other nearby
facilities. As these examples show, “price” is said to function as a barometer
for consumers to estimate the value of the contents and quality of the product
or service when they do not have sufficient knowledge or information to make
assessments.
Although the abovementioned comment by a consumer, “If I were to switch
now, I’d go for a life insurance company with lower insurance premium,” does
not say he would cancel his existing contract and switch to a new one
“immediately” but would do so only “before the insurance premium rises (at
the timing of renewal),” and while he does show understanding to the fact that
the product becomes “cheaper” because the channel cost is held down as is the
case with mail-order or online type outlets, perhaps there is a sense of concern
behind such comments for the quality (that he fears it may be inferior in
quality) of the “insurance” to pay benefits, for example.
As seen above, looking at the meaning of “price” from the consumer’s
standpoint, it may be that in the case of life insurance products, the
participation rate for households of which is almost as high as 90% and of
which many consumers should have a certain level of knowledge on the price
range, offering products that are extremely more expensive (or cheaper) than
the products of rival companies may not be accepted by consumers unless there
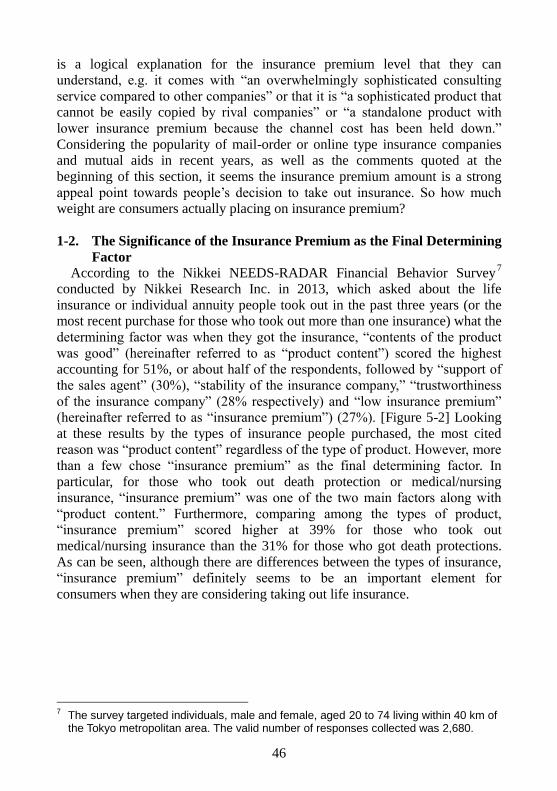
46
is a logical explanation for the insurance premium level that they can
understand, e.g. it comes with “an overwhelmingly sophisticated consulting
service compared to other companies” or that it is “a sophisticated product that
cannot be easily copied by rival companies” or “a standalone product with
lower insurance premium because the channel cost has been held down.”
Considering the popularity of mail-order or online type insurance companies
and mutual aids in recent years, as well as the comments quoted at the
beginning of this section, it seems the insurance premium amount is a strong
appeal point towards people’s decision to take out insurance. So how much
weight are consumers actually placing on insurance premium?
1-2. The Significance of the Insurance Premium as the Final Determining
Factor
According to the Nikkei NEEDS-RADAR Financial Behavior Survey7
conducted by Nikkei Research Inc. in 2013, which asked about the life
insurance or individual annuity people took out in the past three years (or the
most recent purchase for those who took out more than one insurance) what the
determining factor was when they got the insurance, “contents of the product
was good” (hereinafter referred to as “product content”) scored the highest
accounting for 51%, or about half of the respondents, followed by “support of
the sales agent” (30%), “stability of the insurance company,” “trustworthiness
of the insurance company” (28% respectively) and “low insurance premium”
(hereinafter referred to as “insurance premium”) (27%). [Figure 5-2] Looking
at these results by the types of insurance people purchased, the most cited
reason was “product content” regardless of the type of product. However, more
than a few chose “insurance premium” as the final determining factor. In
particular, for those who took out death protection or medical/nursing
insurance, “insurance premium” was one of the two main factors along with
“product content.” Furthermore, comparing among the types of product,
“insurance premium” scored higher at 39% for those who took out
medical/nursing insurance than the 31% for those who got death protections.
As can be seen, although there are differences between the types of insurance,
“insurance premium” definitely seems to be an important element for
consumers when they are considering taking out life insurance.
7 The survey targeted individuals, male and female, aged 20 to 74 living within 40 km of
the Tokyo metropolitan area. The valid number of responses collected was 2,680.
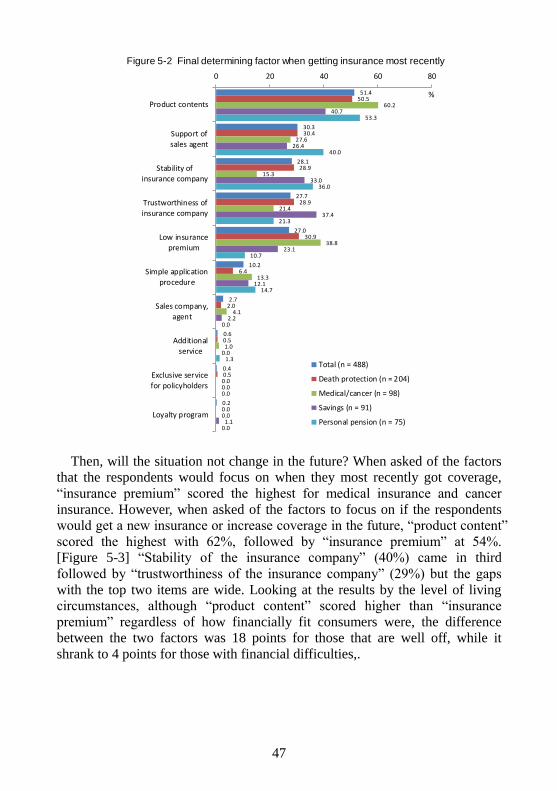
47
Then, will the situation not change in the future? When asked of the factors
that the respondents would focus on when they most recently got coverage,
“insurance premium” scored the highest for medical insurance and cancer
insurance. However, when asked of the factors to focus on if the respondents
would get a new insurance or increase coverage in the future, “product content”
scored the highest with 62%, followed by “insurance premium” at 54%.
[Figure 5-3] “Stability of the insurance company” (40%) came in third
followed by “trustworthiness of the insurance company” (29%) but the gaps
with the top two items are wide. Looking at the results by the level of living
circumstances, although “product content” scored higher than “insurance
premium” regardless of how financially fit consumers were, the difference
between the two factors was 18 points for those that are well off, while it
shrank to 4 points for those with financial difficulties,.
51.4
30.3
28.1
27.7
27.0
10.2
2.7
0.6
0.4
0.2
50.5
30.4
28.9
28.9
30.9
6.4
2.0
0.5
0.5
0.0
60.2
27.6
15.3
21.4
38.8
13.3
4.1
1.0
0.0
0.0
40.7
26.4
33.0
37.4
23.1
12.1
2.2
0.0
0.0
1.1
53.3
40.0
36.0
21.3
10.7
14.7
0.0
1.3
0.0
0.0
0 20 40 60 80
Product contents
Support ofsales agent
Stability ofinsurance company
Trustworthiness ofinsurance company
Low insurancepremium
Simple applicationprocedure
Sales company,agent
Additionalservice
Exclusive servicefor policyholders
Loyalty program
Total (n = 488)
Death protection (n = 204)
Medical/cancer (n = 98)
Savings (n = 91)
Personal pension (n = 75)
%
Figure 5-2 Final determining factor when getting insurance most recently
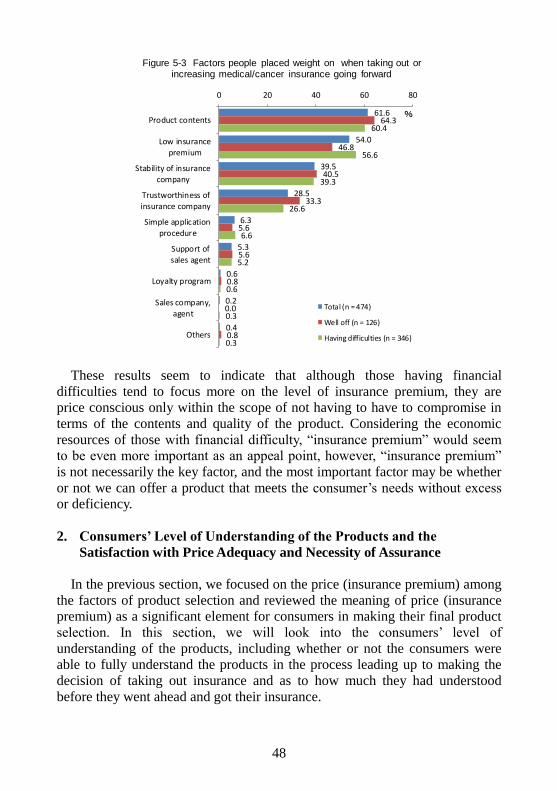
48
These results seem to indicate that although those having financial
difficulties tend to focus more on the level of insurance premium, they are
price conscious only within the scope of not having to have to compromise in
terms of the contents and quality of the product. Considering the economic
resources of those with financial difficulty, “insurance premium” would seem
to be even more important as an appeal point, however, “insurance premium”
is not necessarily the key factor, and the most important factor may be whether
or not we can offer a product that meets the consumer’s needs without excess
or deficiency.
2. Consumers’ Level of Understanding of the Products and the
Satisfaction with Price Adequacy and Necessity of Assurance
In the previous section, we focused on the price (insurance premium) among
the factors of product selection and reviewed the meaning of price (insurance
premium) as a significant element for consumers in making their final product
selection. In this section, we will look into the consumers’ level of
understanding of the products, including whether or not the consumers were able to fully understand the products in the process leading up to making the
decision of taking out insurance and as to how much they had understood
before they went ahead and got their insurance.
61.6
54.0
39.5
28.5
6.3
5.3
0.6
0.2
0.4
64.3
46.8
40.5
33.3
5.6
5.6
0.8
0.0
0.8
60.4
56.6
39.3
26.6
6.6
5.2
0.6
0.3
0.3
0 20 40 60 80
Product contents
Low insurancepremium
Stability of insurancecompany
Trustworthiness ofinsurance company
Simple application
procedure
Support ofsales agent
Loyalty program
Sales company,agent
Others
Total (n = 474)
Well off (n = 126)
Having difficulties (n = 346)
%
Figure 5-3 Factors people placed weight on when taking out or increasing medical/cancer insurance going forward
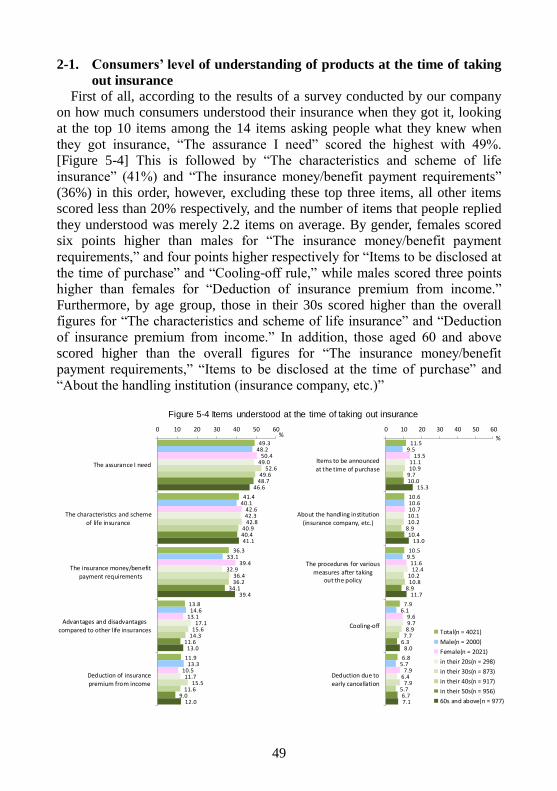
49
2-1. Consumers’ level of understanding of products at the time of taking
out insurance
First of all, according to the results of a survey conducted by our company
on how much consumers understood their insurance when they got it, looking
at the top 10 items among the 14 items asking people what they knew when
they got insurance, “The assurance I need” scored the highest with 49%.
[Figure 5-4] This is followed by “The characteristics and scheme of life
insurance” (41%) and “The insurance money/benefit payment requirements”
(36%) in this order, however, excluding these top three items, all other items
scored less than 20% respectively, and the number of items that people replied
they understood was merely 2.2 items on average. By gender, females scored
six points higher than males for “The insurance money/benefit payment
requirements,” and four points higher respectively for “Items to be disclosed at
the time of purchase” and “Cooling-off rule,” while males scored three points
higher than females for “Deduction of insurance premium from income.”
Furthermore, by age group, those in their 30s scored higher than the overall
figures for “The characteristics and scheme of life insurance” and “Deduction
of insurance premium from income.” In addition, those aged 60 and above
scored higher than the overall figures for “The insurance money/benefit
payment requirements,” “Items to be disclosed at the time of purchase” and
“About the handling institution (insurance company, etc.)”
11.5
10.6
10.5
7.9
6.8
9.5
10.6
9.5
6.1
5.7
13.5
10.7
11.6
9.6
7.9
11.1
10.1
12.4
9.7
6.4
10.9
10.2
10.2
8.9
7.9
9.7
8.9
10.8
7.7
5.7
10.0
10.4
8.9
6.3
6.7
15.3
13.0
11.7
8.0
7.1
0 10 20 30 40 50 60
Items to be announcedat the time of purchase
About the handling institution
(insurance company, etc.)
The procedures for various
measures after takingout the policy
Cooling-off
Deduction due toearly cancellation
Total(n = 4021)
Male(n = 2000)
Female(n = 2021)
in their 20s(n = 298)
in their 30s(n = 873)
in their 40s(n = 917)
in their 50s(n = 956)
60s and above(n = 977)
%
49.3
41.4
36.3
13.8
11.9
48.2
40.1
33.1
14.6
13.3
50.4
42.6
39.4
13.1
10.5
49.0
42.3
32.9
17.1
11.7
52.6
42.8
36.4
15.6
15.5
49.6
40.9
36.2
14.3
11.6
48.7
40.4
34.1
11.6
9.0
46.6
41.1
39.4
13.0
12.0
0 10 20 30 40 50 60
The assurance I need
The characteristics and scheme
of life insurance
The insurance money/benefit
payment requirements
Advantages and disadvantagescompared to other life insurances
Deduction of insurancepremium from income
%
Figure 5-4 Items understood at the time of taking out insurance
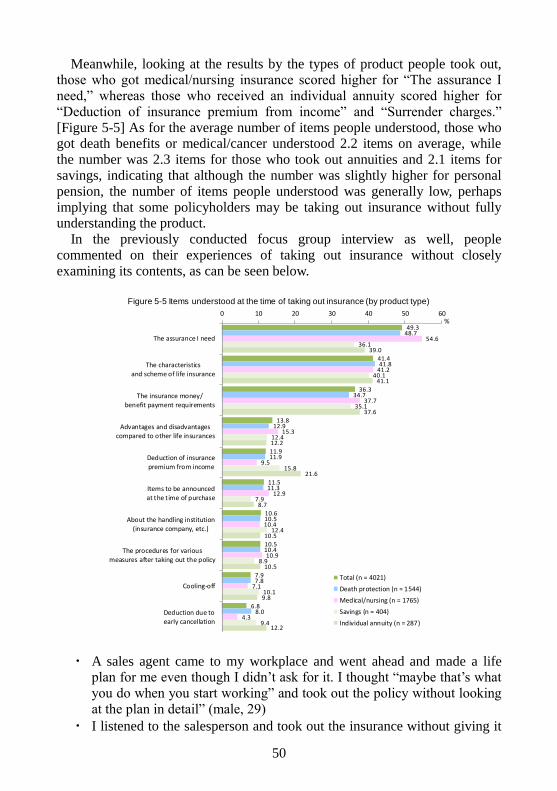
50
Meanwhile, looking at the results by the types of product people took out, those who got medical/nursing insurance scored higher for “The assurance I
need,” whereas those who received an individual annuity scored higher for
“Deduction of insurance premium from income” and “Surrender charges.”
[Figure 5-5] As for the average number of items people understood, those who got death benefits or medical/cancer understood 2.2 items on average, while
the number was 2.3 items for those who took out annuities and 2.1 items for
savings, indicating that although the number was slightly higher for personal
pension, the number of items people understood was generally low, perhaps
implying that some policyholders may be taking out insurance without fully understanding the product.
In the previously conducted focus group interview as well, people
commented on their experiences of taking out insurance without closely
examining its contents, as can be seen below.
・ A sales agent came to my workplace and went ahead and made a life plan for me even though I didn’t ask for it. I thought “maybe that’s what
you do when you start working” and took out the policy without looking
at the plan in detail” (male, 29)
・ I listened to the salesperson and took out the insurance without giving it
49.3
41.4
36.3
13.8
11.9
11.5
10.6
10.5
7.9
6.8
48.7
41.8
34.7
12.9
11.9
11.3
10.5
10.4
7.8
8.0
54.6
41.2
37.7
15.3
9.5
12.9
10.4
10.9
7.1
4.3
36.1
40.1
35.1
12.4
15.8
7.9
12.4
8.9
10.1
9.4
39.0
41.1
37.6
12.2
21.6
8.7
10.5
10.5
9.8
12.2
0 10 20 30 40 50 60
The assurance I need
The characteristics
and scheme of life insurance
The insurance money/benefit payment requirements
Advantages and disadvantagescompared to other life insurances
Deduction of insurancepremium from income
Items to be announced
at the time of purchase
About the handling institution(insurance company, etc.)
The procedures for variousmeasures after taking out the policy
Cooling-off
Deduction due to
early cancellation
Total (n = 4021)
Death protection (n = 1544)
Medical/nursing (n = 1765)
Savings (n = 404)
Individual annuity (n = 287)
%
Figure 5-5 Items understood at the time of taking out insurance (by product type)
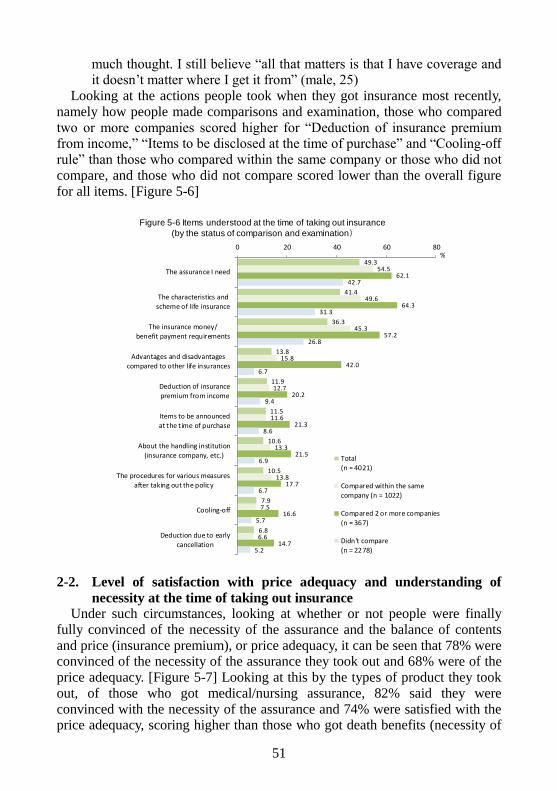
51
much thought. I still believe “all that matters is that I have coverage and it doesn’t matter where I get it from” (male, 25)
Looking at the actions people took when they got insurance most recently,
namely how people made comparisons and examination, those who compared
two or more companies scored higher for “Deduction of insurance premium from income,” “Items to be disclosed at the time of purchase” and “Cooling-off
rule” than those who compared within the same company or those who did not
compare, and those who did not compare scored lower than the overall figure
for all items. [Figure 5-6]
2-2. Level of satisfaction with price adequacy and understanding of
necessity at the time of taking out insurance Under such circumstances, looking at whether or not people were finally
fully convinced of the necessity of the assurance and the balance of contents
and price (insurance premium), or price adequacy, it can be seen that 78% were convinced of the necessity of the assurance they took out and 68% were of the
price adequacy. [Figure 5-7] Looking at this by the types of product they took
out, of those who got medical/nursing assurance, 82% said they were
convinced with the necessity of the assurance and 74% were satisfied with the price adequacy, scoring higher than those who got death benefits (necessity of
49.3
41.4
36.3
13.8
11.9
11.5
10.6
10.5
7.9
6.8
54.5
49.6
45.3
15.8
12.7
11.6
13.3
13.8
7.5
6.6
62.1
64.3
57.2
42.0
20.2
21.3
21.5
17.7
16.6
14.7
42.7
31.3
26.8
6.7
9.4
8.6
6.9
6.7
5.7
5.2
0 20 40 60 80
The assurance I need
The characteristics and
scheme of life insurance
The insurance money/
benefit payment requirements
Advantages and disadvantages
compared to other life insurances
Deduction of insurance
premium from income
Items to be announced
at the time of purchase
About the handling institution
(insurance company, etc.)
The procedures for various measures
after taking out the policy
Cooling-off
Deduction due to early
cancellation
Total
(n = 4021)
Compared within the same
company (n = 1022)
Compared 2 or more companies
(n = 367)
Didn't compare
(n = 2278)
%
Figure 5-6 Items understood at the time of taking out insurance
(by the status of comparison and examination)
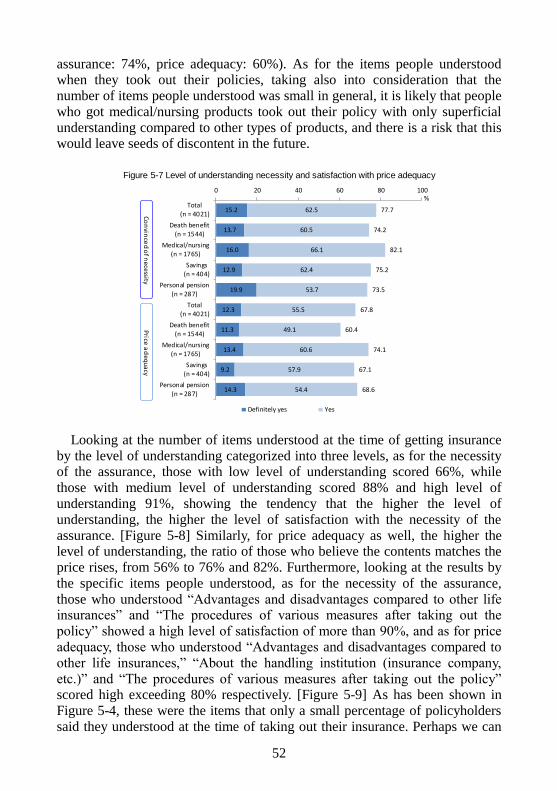
52
assurance: 74%, price adequacy: 60%). As for the items people understood when they took out their policies, taking also into consideration that the
number of items people understood was small in general, it is likely that people
who got medical/nursing products took out their policy with only superficial
understanding compared to other types of products, and there is a risk that this would leave seeds of discontent in the future.
Looking at the number of items understood at the time of getting insurance
by the level of understanding categorized into three levels, as for the necessity of the assurance, those with low level of understanding scored 66%, while
those with medium level of understanding scored 88% and high level of
understanding 91%, showing the tendency that the higher the level of
understanding, the higher the level of satisfaction with the necessity of the
assurance. [Figure 5-8] Similarly, for price adequacy as well, the higher the level of understanding, the ratio of those who believe the contents matches the
price rises, from 56% to 76% and 82%. Furthermore, looking at the results by
the specific items people understood, as for the necessity of the assurance,
those who understood “Advantages and disadvantages compared to other life insurances” and “The procedures of various measures after taking out the
policy” showed a high level of satisfaction of more than 90%, and as for price
adequacy, those who understood “Advantages and disadvantages compared to other life insurances,” “About the handling institution (insurance company,
etc.)” and “The procedures of various measures after taking out the policy” scored high exceeding 80% respectively. [Figure 5-9] As has been shown in
Figure 5-4, these were the items that only a small percentage of policyholders
said they understood at the time of taking out their insurance. Perhaps we can
15.2
13.7
16.0
12.9
19.9
12.3
11.3
13.4
9.2
14.3
62.5
60.5
66.1
62.4
53.7
55.5
49.1
60.6
57.9
54.4
77.7
74.2
82.1
75.2
73.5
67.8
60.4
74.1
67.1
68.6
0 20 40 60 80 100
Total(n = 4021)
Death benefit(n = 1544)
Medical/nursing(n = 1765)
Savings(n = 404)
Personal pension(n = 287)
Total(n = 4021)
Death benefit
(n = 1544)
Medical/nursing
(n = 1765)
Savings
(n = 404)
Personal pension(n = 287)
Definitely yes YesC
on
vince
do
f ne
cessity
Price
ad
eq
ua
cy
%
Figure 5-7 Level of understanding necessity and satisfaction with price adequacy
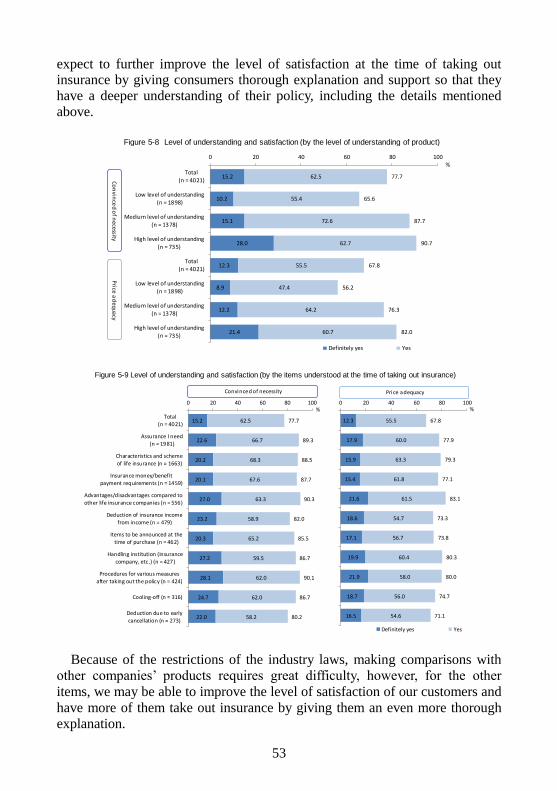
53
expect to further improve the level of satisfaction at the time of taking out insurance by giving consumers thorough explanation and support so that they
have a deeper understanding of their policy, including the details mentioned
above.
Because of the restrictions of the industry laws, making comparisons with
other companies’ products requires great difficulty, however, for the other
items, we may be able to improve the level of satisfaction of our customers and
have more of them take out insurance by giving them an even more thorough
explanation.
15.2
10.2
15.1
28.0
12.3
8.9
12.2
21.4
62.5
55.4
72.6
62.7
55.5
47.4
64.2
60.7
77.7
65.6
87.7
90.7
67.8
56.2
76.3
82.0
0 20 40 60 80 100
Total(n = 4021)
Low level of understanding
(n = 1898)
Medium level of understanding
(n = 1378)
High level of understanding(n = 735)
Total(n = 4021)
Low level of understanding(n = 1898)
Medium level of understanding
(n = 1378)
High level of understanding
(n = 735)
Definitely yes Yes
Con
vince
d of n
ecessityPrice
ad
equacy
%
Figure 5-8 Level of understanding and satisfaction (by the level of understanding of product)
12.3
17.9
15.9
15.4
21.6
18.6
17.1
19.9
21.9
18.7
16.5
55.5
60.0
63.3
61.8
61.5
54.7
56.7
60.4
58.0
56.0
54.6
67.8
77.9
79.3
77.1
83.1
73.3
73.8
80.3
80.0
74.7
71.1
0 20 40 60 80 100
Definitely yes Yes
%
15.2
22.6
20.2
20.1
27.0
23.2
20.3
27.2
28.1
24.7
22.0
62.5
66.7
68.3
67.6
63.3
58.9
65.2
59.5
62.0
62.0
58.2
77.7
89.3
88.5
87.7
90.3
82.0
85.5
86.7
90.1
86.7
80.2
0 20 40 60 80 100
Total(n = 4021)
Assurance I need(n = 1981)
Characteristics and scheme
of life insurance (n = 1663)
Insurance money/benefitpayment requirements (n = 1459)
Advantages/disadvantages compared to
other life insurance companies (n = 556)
Deduction of insurance incomefrom income (n = 479)
Items to be announced at thetime of purchase (n = 462)
Handling institution (insurancecompany, etc.) (n = 427)
Procedures for various measuresafter taking out the policy (n = 424)
Cooling-off (n = 316)
Deduction due to earlycancellation (n = 273)
%
Convinced of necessity Price adequacy
Figure 5-9 Level of understanding and satisfaction (by the items understood at the time of taking out insurance)
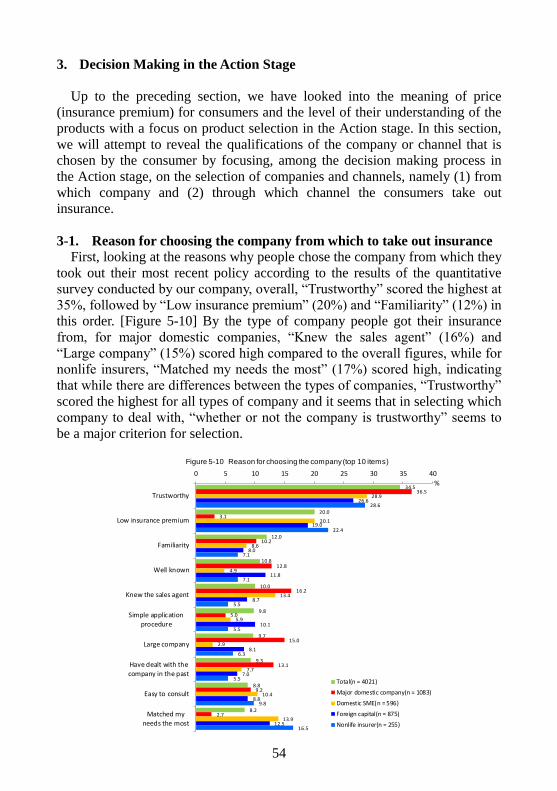
54
3. Decision Making in the Action Stage
Up to the preceding section, we have looked into the meaning of price
(insurance premium) for consumers and the level of their understanding of the
products with a focus on product selection in the Action stage. In this section,
we will attempt to reveal the qualifications of the company or channel that is
chosen by the consumer by focusing, among the decision making process in
the Action stage, on the selection of companies and channels, namely (1) from
which company and (2) through which channel the consumers take out
insurance.
3-1. Reason for choosing the company from which to take out insurance
First, looking at the reasons why people chose the company from which they
took out their most recent policy according to the results of the quantitative
survey conducted by our company, overall, “Trustworthy” scored the highest at
35%, followed by “Low insurance premium” (20%) and “Familiarity” (12%) in
this order. [Figure 5-10] By the type of company people got their insurance
from, for major domestic companies, “Knew the sales agent” (16%) and
“Large company” (15%) scored high compared to the overall figures, while for
nonlife insurers, “Matched my needs the most” (17%) scored high, indicating
that while there are differences between the types of companies, “Trustworthy”
scored the highest for all types of company and it seems that in selecting which
company to deal with, “whether or not the company is trustworthy” seems to
be a major criterion for selection.
34.5
20.0
12.0
10.8
10.0
9.8
9.7
9.3
8.8
8.2
36.5
3.1
10.2
12.8
16.2
5.0
15.0
13.1
9.2
2.7
28.9
20.1
8.6
4.9
13.4
5.9
2.9
7.7
10.4
13.9
26.6
19.0
8.0
11.8
8.7
10.1
8.1
7.0
8.8
12.5
28.6
22.4
7.1
7.1
5.5
5.5
6.3
5.5
9.8
16.5
0 5 10 15 20 25 30 35 40
Trustworthy
Low insurance premium
Familiarity
Well known
Knew the sales agent
Simple application
procedure
Large company
Have dealt with thecompany in the past
Easy to consult
Matched my
needs the most
Total(n = 4021)
Major domestic company(n = 1083)
Domestic SME(n = 596)
Foreign capital(n = 875)
Nonlife insurer(n = 255)
%
Figure 5-10 Reason for choosing the company(top 10 items)
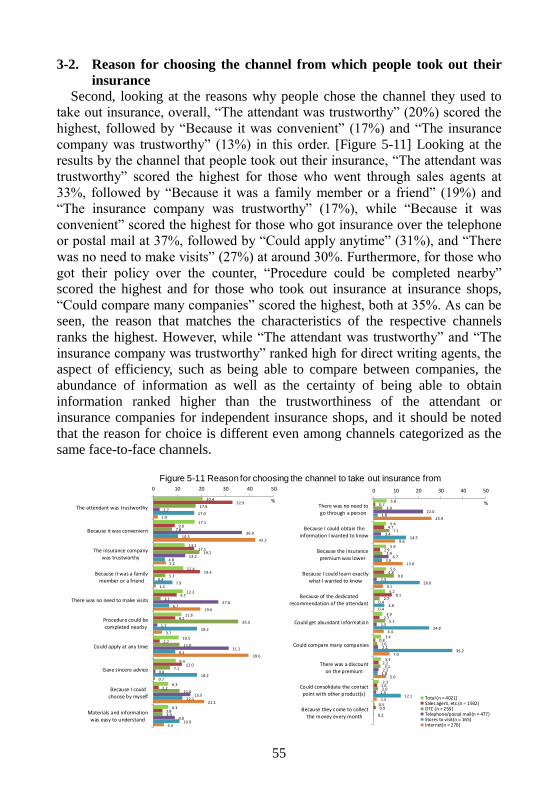
55
3-2. Reason for choosing the channel from which people took out their
insurance
Second, looking at the reasons why people chose the channel they used to
take out insurance, overall, “The attendant was trustworthy” (20%) scored the
highest, followed by “Because it was convenient” (17%) and “The insurance
company was trustworthy” (13%) in this order. [Figure 5-11] Looking at the
results by the channel that people took out their insurance, “The attendant was
trustworthy” scored the highest for those who went through sales agents at
33%, followed by “Because it was a family member or a friend” (19%) and
“The insurance company was trustworthy” (17%), while “Because it was
convenient” scored the highest for those who got insurance over the telephone
or postal mail at 37%, followed by “Could apply anytime” (31%), and “There
was no need to make visits” (27%) at around 30%. Furthermore, for those who
got their policy over the counter, “Procedure could be completed nearby”
scored the highest and for those who took out insurance at insurance shops,
“Could compare many companies” scored the highest, both at 35%. As can be
seen, the reason that matches the characteristics of the respective channels
ranks the highest. However, while “The attendant was trustworthy” and “The
insurance company was trustworthy” ranked high for direct writing agents, the
aspect of efficiency, such as being able to compare between companies, the
abundance of information as well as the certainty of being able to obtain
information ranked higher than the trustworthiness of the attendant or
insurance companies for independent insurance shops, and it should be noted
that the reason for choice is different even among channels categorized as the
same face-to-face channels.
5.8
5.6
5.6
5.6
5.2
3.9
3.4
3.3
2.3
0.5
0.7
4.7
2.9
4.8
8.1
2.7
0.8
2.2
1.6
0.9
3.9
7.1
3.9
9.0
2.7
5.1
1.6
3.1
2.0
22.0
3.4
6.7
1.5
0.4
1.5
2.1
2.3
1.3
0.2
1.8
14.5
3.6
20.6
4.8
24.8
35.2
1.8
12.1
25.9
9.6
13.0
4.1
0.4
4.4
7.0
5.6
1.5
0 10 20 30 40 50
There was no need to
go through a person
Because I could obtain theinformation I wanted to know
Because the insurancepremium was lower
Because I could learn exactly
what I wanted to know
Because of the dedicated
recommendation of the attendant
Could get abundant information
Could compare many companies
There was a discount
on the premium
Could consolidate the contactpoint with other product(s)
Because they come to collect
the money every month
Total (n = 4021)Sales agent, etc.(n = 1932)OTC (n = 255)Telephone/postal mail(n = 477)Stores to visit(n = 165)Internet(n = 270)
%20.4
17.1
13.2
12.4
12.2
11.6
10.5
9.4
6.3
6.3
32.9
9.0
17.1
19.4
9.7
9.2
2.7
12.0
2.2
3.8
17.6
7.8
19.2
5.1
3.1
35.3
11.0
7.1
11.0
3.9
2.7
36.9
13.2
0.4
27.0
1.7
31.2
0.8
15.5
9.0
17.0
10.3
4.8
7.9
6.7
18.2
9.1
18.2
12.1
10.9
1.9
42.2
5.2
1.1
19.6
3.7
39.6
0.7
21.1
4.4
0 10 20 30 40 50
The attendant was trustworthy
Because it was convenient
The insurance companywas trustworthy
Because it was a family
member or a friend
There was no need to make visits
Procedure could becompleted nearby
Could apply at any time
Gave sincere advice
Because I couldchoose by myself
Materials and information
was easy to understand
%
Figure 5-11 Reason for choosing the channel to take out insurance from
56
In fact, in the previously conducted focus group interview, some of the
consumers who got insurance through sales agents commented that they took
out the policy from their trust in the attendant as opposed to examining the
contents of the proposed product as can be seen below.
・ My mother’s acquaintance was selling insurance so I trusted this person
and took out the policy that was recommended (female, 35)
・ The brother-in-law of my superior at work was with an insurance
company and I thought that he could be trusted because he was related to
the boss (male, 32)
Apparently, whether or not they could trust the salesperson they were in
direct contact with, or the insurance company from which they would take out
their policy is a major factor in the criteria for selecting a company or channel
for those who got insurance through personal channels, such as direct writing
agents or sales agencies.
Meanwhile, also among those who currently do not have insurance, there are
people who, although they do wish to fully understand the contents of the
policy and be convinced before taking out insurance, seem to be more inclined
to get to know a seller that they can trust, rather than request materials
themselves and study them carefully, as can be seen below.
・ Rather than reading each policy conditions, I’d like to trust someone and
get insurance from them (male, 35)
・ I don’t want to request materials. I think things are hidden behind slick
sales copies. I’d like to be properly told in words by a person. (male, 28)
As has been described in detail in chapter 4, in the early stages of
considering taking out insurance, consumers proceed with their examination
based on information obtained from WOM, the Internet, and materials they
requested, meanwhile in the Action stage, in which people make the decision to
get insurance and apply for the insurance, many consumers seem to be seeking
human channels they can “trust,” for example, someone who could “give
explanations to their specific concerns in a way that is easy to understand,”
because of reasons, such as (1) they want to have someone answer to their
questions directly or (2) they could feel safe if there’s a “person” as insurance
is not tangible. With consumers who want to have the intervention of a
face-to-face channel, how to earn their trust is perhaps the important challenge
for all such channels.
3-3. The final determining factor in making the decision Then, how much importance do consumers place on trustworthiness of the
company or channel in making the decision to take out life insurance? Looking
at the final determining factor for deciding to take out insurance, “insurance
premium was adequate” scored the highest with 32%, and together with
“contents of coverage was good” (25%), those saying that the product factor
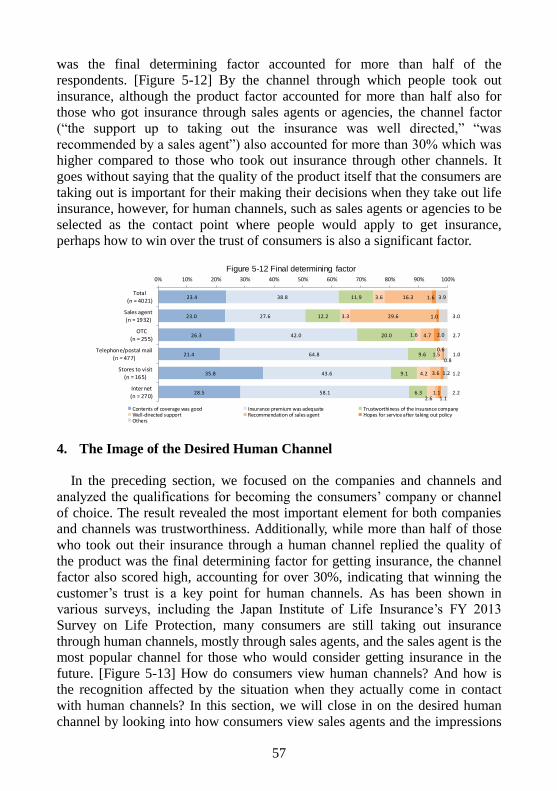
57
was the final determining factor accounted for more than half of the
respondents. [Figure 5-12] By the channel through which people took out
insurance, although the product factor accounted for more than half also for
those who got insurance through sales agents or agencies, the channel factor
(“the support up to taking out the insurance was well directed,” “was
recommended by a sales agent”) also accounted for more than 30% which was
higher compared to those who took out insurance through other channels. It
goes without saying that the quality of the product itself that the consumers are
taking out is important for their making their decisions when they take out life
insurance, however, for human channels, such as sales agents or agencies to be
selected as the contact point where people would apply to get insurance,
perhaps how to win over the trust of consumers is also a significant factor.
4. The Image of the Desired Human Channel
In the preceding section, we focused on the companies and channels and
analyzed the qualifications for becoming the consumers’ company or channel
of choice. The result revealed the most important element for both companies
and channels was trustworthiness. Additionally, while more than half of those
who took out their insurance through a human channel replied the quality of
the product was the final determining factor for getting insurance, the channel
factor also scored high, accounting for over 30%, indicating that winning the
customer’s trust is a key point for human channels. As has been shown in
various surveys, including the Japan Institute of Life Insurance’s FY 2013
Survey on Life Protection, many consumers are still taking out insurance
through human channels, mostly through sales agents, and the sales agent is the most popular channel for those who would consider getting insurance in the
future. [Figure 5-13] How do consumers view human channels? And how is
the recognition affected by the situation when they actually come in contact
with human channels? In this section, we will close in on the desired human
channel by looking into how consumers view sales agents and the impressions
23.4
23.0
26.3
21.4
35.8
28.5
38.8
27.6
42.0
64.8
43.6
58.1
11.9
12.2
20.0
9.6
9.1
6.3
3.6
3.3
1.6
1.5
4.2
2.6
16.3
29.6
4.7
0.6
3.6
1.1
1.6
1.0
2.0
0.8
1.2
1.1
3.9
3.0
2.7
1.0
1.2
2.2
0% 10% 20% 30% 40% 50% 60% 70% 80% 90% 100%
Total(n = 4021)
Sales agent
(n = 1932)
OTC(n = 255)
Telephone/postal mail
(n = 477)
Stores to visit(n = 165)
Internet(n = 270)
Contents of coverage was good Insurance premium was adequate Trustworthiness of the insurance companyWell-directed support Recommendation of sales agent Hopes for service after taking out policyOthers
Figure 5-12 Final determining factor
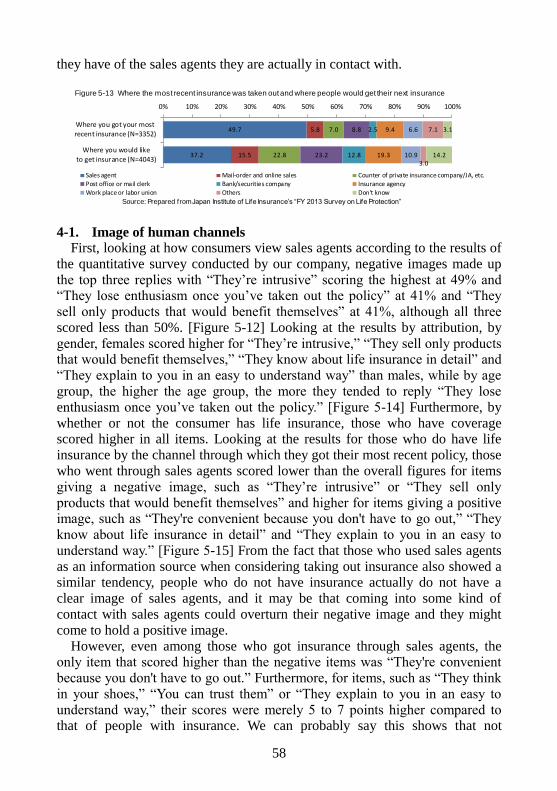
58
they have of the sales agents they are actually in contact with.
4-1. Image of human channels
First, looking at how consumers view sales agents according to the results of
the quantitative survey conducted by our company, negative images made up
the top three replies with “They’re intrusive” scoring the highest at 49% and “They lose enthusiasm once you’ve taken out the policy” at 41% and “They
sell only products that would benefit themselves” at 41%, although all three
scored less than 50%. [Figure 5-12] Looking at the results by attribution, by
gender, females scored higher for “They’re intrusive,” “They sell only products that would benefit themselves,” “They know about life insurance in detail” and
“They explain to you in an easy to understand way” than males, while by age
group, the higher the age group, the more they tended to reply “They lose
enthusiasm once you’ve taken out the policy.” [Figure 5-14] Furthermore, by
whether or not the consumer has life insurance, those who have coverage scored higher in all items. Looking at the results for those who do have life
insurance by the channel through which they got their most recent policy, those
who went through sales agents scored lower than the overall figures for items
giving a negative image, such as “They’re intrusive” or “They sell only
products that would benefit themselves” and higher for items giving a positive image, such as “They're convenient because you don't have to go out,” “They
know about life insurance in detail” and “They explain to you in an easy to
understand way.” [Figure 5-15] From the fact that those who used sales agents
as an information source when considering taking out insurance also showed a similar tendency, people who do not have insurance actually do not have a
clear image of sales agents, and it may be that coming into some kind of
contact with sales agents could overturn their negative image and they might
come to hold a positive image.
However, even among those who got insurance through sales agents, the only item that scored higher than the negative items was “They're convenient
because you don't have to go out.” Furthermore, for items, such as “They think
in your shoes,” “You can trust them” or “They explain to you in an easy to
understand way,” their scores were merely 5 to 7 points higher compared to that of people with insurance. We can probably say this shows that not
49.7
37.2
5.8
15.5
7.0
22.8
8.8
23.2
2.5
12.8
9.4
19.3
6.6
10.9
7.1
3.0
3.1
14.2
0% 10% 20% 30% 40% 50% 60% 70% 80% 90% 100%
Where you got your mostrecent insurance (N=3352)
Where you would like
to get insurance (N=4043)
Sales agent Mail-order and online sales Counter of private insurance company/JA, etc.
Post office or mail clerk Bank/securities company Insurance agency
Work place or labor union Others Don't know
Source: Prepared from Japan Institute of Life Insurance’s “FY 2013 Survey on Life Protection”
Figure 5-13 Where the most recent insurance was taken out and where people would get their next insurance
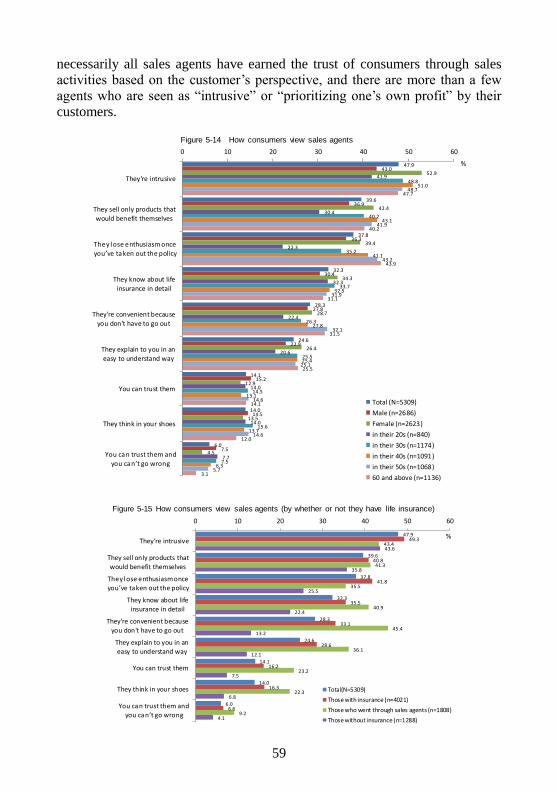
59
necessarily all sales agents have earned the trust of consumers through sales activities based on the customer’s perspective, and there are more than a few
agents who are seen as “intrusive” or “prioritizing one’s own profit” by their
customers.
47.9
39.6
37.8
32.3
28.3
24.6
14.1
14.0
6.0
43.0
36.9
36.3
30.4
27.8
22.9
15.2
14.5
7.5
52.9
42.4
39.4
34.3
28.7
26.4
12.9
13.5
4.5
41.9
30.4
22.3
32.3
22.4
20.6
14.0
14.0
7.7
48.8
40.2
35.2
33.7
26.3
25.5
14.5
15.6
7.5
51.0
43.1
41.1
32.5
27.8
25.4
13.1
13.7
6.3
48.7
41.9
43.2
31.9
32.1
25.1
14.6
14.6
5.7
47.7
40.2
43.9
31.1
31.5
25.5
14.1
12.0
3.1
0 10 20 30 40 50 60
They're intrusive
They sell only products thatwould benefit themselves
They lose enthusiasm once
you’ve taken out the policy
They know about lifeinsurance in detail
They're convenient becauseyou don't have to go out
They explain to you in an
easy to understand way
You can trust them
They think in your shoes
You can trust them and you can’t go wrong
Total (N=5309)
Male (n=2686)
Female (n=2623)
in their 20s (n=840)
in their 30s (n=1174)
in their 40s (n=1091)
in their 50s (n=1068)
60 and above (n=1136)
%
Figure 5-14 How consumers view sales agents
47.9
39.6
37.8
32.3
28.3
24.6
14.1
14.0
6.0
49.3
40.8
41.8
35.5
33.1
28.6
16.2
16.3
6.6
43.4
41.3
35.5
40.9
45.4
36.1
23.2
22.3
9.2
43.6
35.8
25.5
22.4
13.2
12.1
7.5
6.8
4.1
0 10 20 30 40 50 60
They're intrusive
They sell only products that
would benefit themselves
They lose enthusiasm once you’ve taken out the policy
They know about lifeinsurance in detail
They're convenient becauseyou don't have to go out
They explain to you in aneasy to understand way
You can trust them
They think in your shoes
You can trust them and
you can’t go wrong
Total(N=5309)
Those with insurance (n=4021)
Those who went through sales agents (n=1808)
Those without insurance (n=1288)
%
Figure 5-15 How consumers view sales agents (by whether or not they have life insurance)
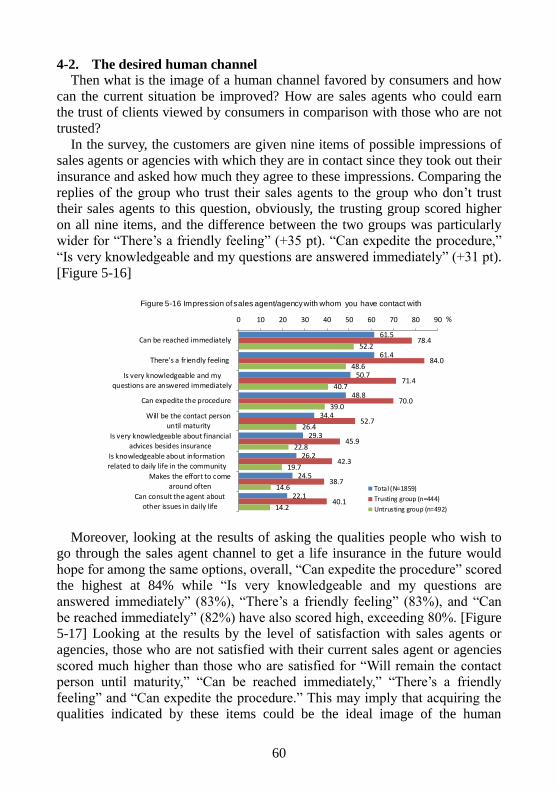
60
4-2. The desired human channel Then what is the image of a human channel favored by consumers and how
can the current situation be improved? How are sales agents who could earn
the trust of clients viewed by consumers in comparison with those who are not
trusted?
In the survey, the customers are given nine items of possible impressions of
sales agents or agencies with which they are in contact since they took out their
insurance and asked how much they agree to these impressions. Comparing the
replies of the group who trust their sales agents to the group who don’t trust
their sales agents to this question, obviously, the trusting group scored higher
on all nine items, and the difference between the two groups was particularly
wider for “There’s a friendly feeling” (+35 pt). “Can expedite the procedure,”
“Is very knowledgeable and my questions are answered immediately” (+31 pt).
[Figure 5-16]
Moreover, looking at the results of asking the qualities people who wish to
go through the sales agent channel to get a life insurance in the future would
hope for among the same options, overall, “Can expedite the procedure” scored
the highest at 84% while “Is very knowledgeable and my questions are
answered immediately” (83%), “There’s a friendly feeling” (83%), and “Can
be reached immediately” (82%) have also scored high, exceeding 80%. [Figure
5-17] Looking at the results by the level of satisfaction with sales agents or
agencies, those who are not satisfied with their current sales agent or agencies
scored much higher than those who are satisfied for “Will remain the contact
person until maturity,” “Can be reached immediately,” “There’s a friendly
feeling” and “Can expedite the procedure.” This may imply that acquiring the
qualities indicated by these items could be the ideal image of the human
61.5
61.4
50.7
48.8
34.4
29.3
26.2
24.5
22.1
78.4
84.0
71.4
70.0
52.7
45.9
42.3
38.7
40.1
52.2
48.6
40.7
39.0
26.4
22.8
19.7
14.6
14.2
0 10 20 30 40 50 60 70 80 90
Can be reached immediately
There's a friendly feeling
Is very knowledgeable and myquestions are answered immediately
Can expedite the procedure
Will be the contact personuntil maturity
Is very knowledgeable about financial
advices besides insurance
Is knowledgeable about information
related to daily life in the community
Makes the effort to comearound often
Can consult the agent aboutother issues in daily life
Total (N=1859)
Trusting group (n=444)
Untrusting group (n=492)
%
Figure 5-16 Impression of sales agent/agencywith whom you have contact with
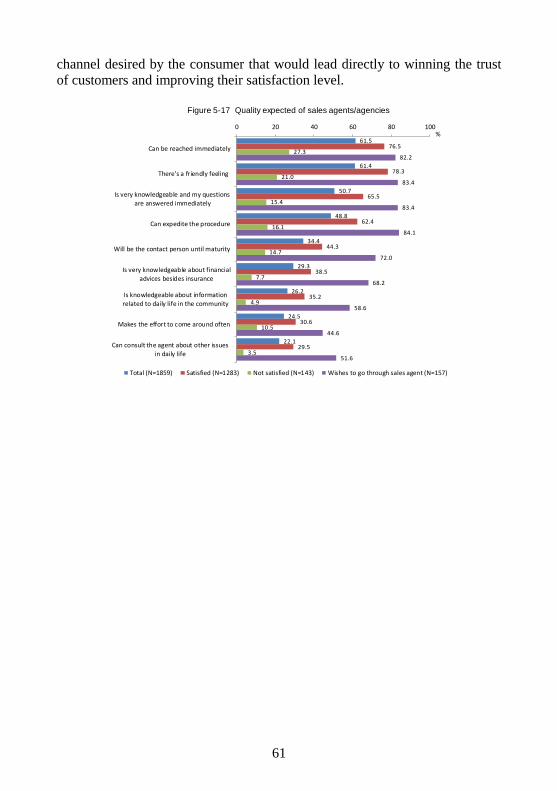
61
channel desired by the consumer that would lead directly to winning the trust
of customers and improving their satisfaction level.
61.5
61.4
50.7
48.8
34.4
29.3
26.2
24.5
22.1
76.5
78.3
65.5
62.4
44.3
38.5
35.2
30.6
29.5
27.3
21.0
15.4
16.1
14.7
7.7
4.9
10.5
3.5
82.2
83.4
83.4
84.1
72.0
68.2
58.6
44.6
51.6
0 20 40 60 80 100
Can be reached immediately
There's a friendly feeling
Is very knowledgeable and my questionsare answered immediately
Can expedite the procedure
Will be the contact person until maturity
Is very knowledgeable about financial
advices besides insurance
Is knowledgeable about informationrelated to daily life in the community
Makes the effort to come around often
Can consult the agent about other issuesin daily life
Total (N=1859) Satisfied (N=1283) Not satisfied (N=143) Wishes to go through sales agent (N=157)
%
Figure 5-17 Quality expected of sales agents/agencies
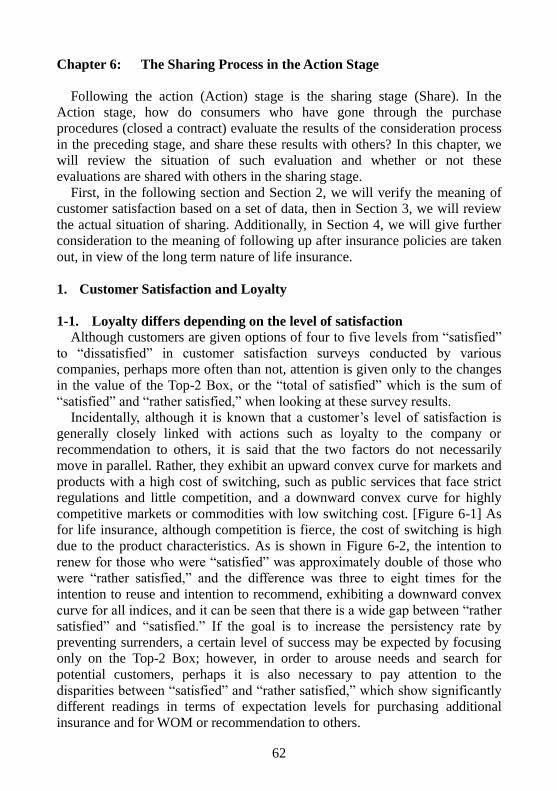
62
Chapter 6: The Sharing Process in the Action Stage
Following the action (Action) stage is the sharing stage (Share). In the
Action stage, how do consumers who have gone through the purchase
procedures (closed a contract) evaluate the results of the consideration process
in the preceding stage, and share these results with others? In this chapter, we
will review the situation of such evaluation and whether or not these
evaluations are shared with others in the sharing stage.
First, in the following section and Section 2, we will verify the meaning of
customer satisfaction based on a set of data, then in Section 3, we will review
the actual situation of sharing. Additionally, in Section 4, we will give further
consideration to the meaning of following up after insurance policies are taken
out, in view of the long term nature of life insurance.
1. Customer Satisfaction and Loyalty
1-1. Loyalty differs depending on the level of satisfaction
Although customers are given options of four to five levels from “satisfied”
to “dissatisfied” in customer satisfaction surveys conducted by various
companies, perhaps more often than not, attention is given only to the changes
in the value of the Top-2 Box, or the “total of satisfied” which is the sum of
“satisfied” and “rather satisfied,” when looking at these survey results.
Incidentally, although it is known that a customer’s level of satisfaction is
generally closely linked with actions such as loyalty to the company or
recommendation to others, it is said that the two factors do not necessarily
move in parallel. Rather, they exhibit an upward convex curve for markets and
products with a high cost of switching, such as public services that face strict
regulations and little competition, and a downward convex curve for highly
competitive markets or commodities with low switching cost. [Figure 6-1] As
for life insurance, although competition is fierce, the cost of switching is high
due to the product characteristics. As is shown in Figure 6-2, the intention to
renew for those who were “satisfied” was approximately double of those who
were “rather satisfied,” and the difference was three to eight times for the
intention to reuse and intention to recommend, exhibiting a downward convex
curve for all indices, and it can be seen that there is a wide gap between “rather
satisfied” and “satisfied.” If the goal is to increase the persistency rate by
preventing surrenders, a certain level of success may be expected by focusing only on the Top-2 Box; however, in order to arouse needs and search for
potential customers, perhaps it is also necessary to pay attention to the
disparities between “satisfied” and “rather satisfied,” which show significantly
different readings in terms of expectation levels for purchasing additional
insurance and for WOM or recommendation to others.
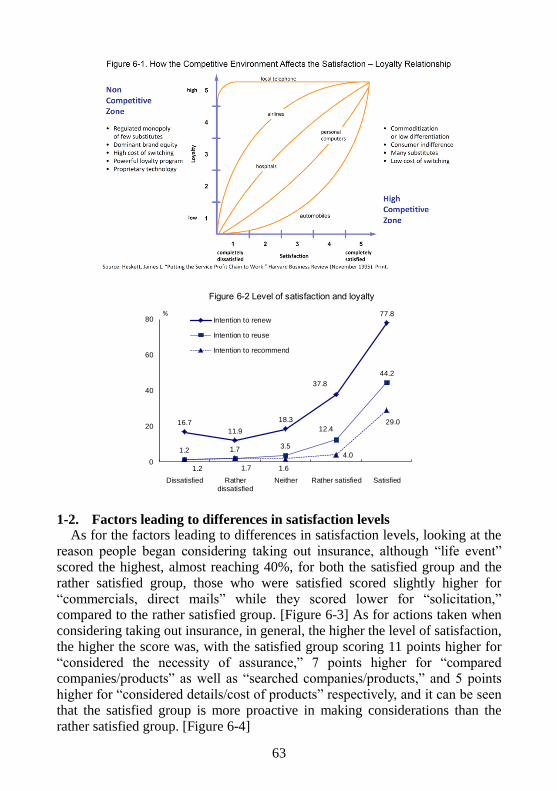
63
1-2. Factors leading to differences in satisfaction levels As for the factors leading to differences in satisfaction levels, looking at the
reason people began considering taking out insurance, although “life event”
scored the highest, almost reaching 40%, for both the satisfied group and the
rather satisfied group, those who were satisfied scored slightly higher for
“commercials, direct mails” while they scored lower for “solicitation,” compared to the rather satisfied group. [Figure 6-3] As for actions taken when
considering taking out insurance, in general, the higher the level of satisfaction,
the higher the score was, with the satisfied group scoring 11 points higher for “considered the necessity of assurance,” 7 points higher for “compared companies/products” as well as “searched companies/products,” and 5 points
higher for “considered details/cost of products” respectively, and it can be seen
that the satisfied group is more proactive in making considerations than the
rather satisfied group. [Figure 6-4]
77.8
37.8
18.3
11.9
16.7
44.2
12.4
3.51.71.2
29.0
4.0
1.61.71.20
20
40
60
80
SatisfiedRather satisfiedNeitherRatherdissatisfied
Dissatisfied
Intention to renew
Intention to reuse
Intention to recommend
%
Figure 6-2 Level of satisfaction and loyalty
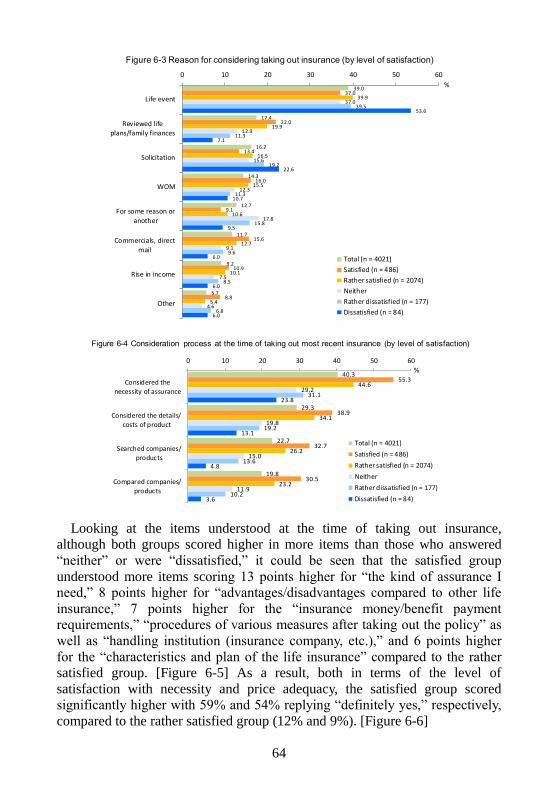
64
Looking at the items understood at the time of taking out insurance,
although both groups scored higher in more items than those who answered
“neither” or were “dissatisfied,” it could be seen that the satisfied group
understood more items scoring 13 points higher for “the kind of assurance I
need,” 8 points higher for “advantages/disadvantages compared to other life
insurance,” 7 points higher for the “insurance money/benefit payment
requirements,” “procedures of various measures after taking out the policy” as
well as “handling institution (insurance company, etc.),” and 6 points higher
for the “characteristics and plan of the life insurance” compared to the rather
satisfied group. [Figure 6-5] As a result, both in terms of the level of
satisfaction with necessity and price adequacy, the satisfied group scored
significantly higher with 59% and 54% replying “definitely yes,” respectively,
compared to the rather satisfied group (12% and 9%). [Figure 6-6]
39.0
17.4
16.2
14.3
12.7
11.7
9.2
5.7
37.0
22.0
13.4
16.0
9.1
15.6
10.9
8.8
39.9
19.9
16.5
15.5
10.6
12.7
10.1
5.4
37.0
12.9
15.6
12.3
17.8
9.1
7.5
4.6
39.5
11.3
19.2
11.3
15.8
9.6
8.5
6.8
53.6
7.1
22.6
10.7
9.5
6.0
6.0
6.0
0 10 20 30 40 50 60
Life event
Reviewed lifeplans/family finances
Solicitation
WOM
For some reason oranother
Commercials, directmail
Rise in income
Other
Total (n = 4021)
Satisfied (n = 486)
Rather satisfied (n = 2074)
Neither
Rather dissatisfied (n = 177)
Dissatisfied (n = 84)
%
Figure 6-3 Reason for considering taking out insurance (by level of satisfaction)
40.3
29.3
22.7
19.8
55.3
38.9
32.7
30.5
44.6
34.1
26.2
23.2
29.2
19.8
15.0
11.9
31.1
19.2
13.6
10.2
23.8
13.1
4.8
3.6
0 10 20 30 40 50 60
Considered thenecessity of assurance
Considered the details/
costs of product
Searched companies/products
Compared companies/
products
Total (n = 4021)
Satisfied (n = 486)
Rather satisfied (n = 2074)
Neither
Rather dissatisfied (n = 177)
Dissatisfied (n = 84)
%
Figure 6-4 Consideration process at the time of taking out most recent insurance (by level of satisfaction)
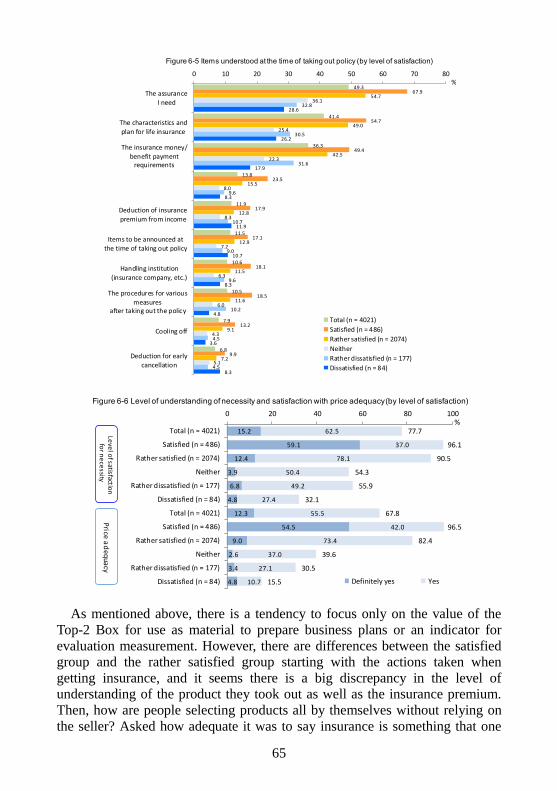
65
As mentioned above, there is a tendency to focus only on the value of the
Top-2 Box for use as material to prepare business plans or an indicator for
evaluation measurement. However, there are differences between the satisfied group and the rather satisfied group starting with the actions taken when
getting insurance, and it seems there is a big discrepancy in the level of
understanding of the product they took out as well as the insurance premium.
Then, how are people selecting products all by themselves without relying on
the seller? Asked how adequate it was to say insurance is something that one
49.3
41.4
36.3
13.8
11.9
11.5
10.6
10.5
7.9
6.8
67.9
54.7
49.4
23.5
17.9
17.1
18.1
18.5
13.2
9.9
54.7
49.0
42.5
15.5
12.8
12.9
11.5
11.6
9.1
7.2
36.1
25.4
22.3
8.0
8.3
7.2
6.3
6.0
4.3
5.1
32.8
30.5
31.6
9.6
10.7
9.0
9.6
10.2
4.5
4.5
28.6
26.2
17.9
8.3
11.9
10.7
8.3
4.8
3.6
8.3
0 10 20 30 40 50 60 70 80
The assurance
I need
The characteristics andplan for life insurance
The insurance money/benefit payment
requirements
Deduction of insurancepremium from income
Items to be announced atthe time of taking out policy
Handling institution
(insurance company, etc.)
The procedures for various
measuresafter taking out the policy
Cooling off
Deduction for earlycancellation
Total (n = 4021)
Satisfied (n = 486)
Rather satisfied (n = 2074)
Neither
Rather dissatisfied (n = 177)
Dissatisfied (n = 84)
%
Figure 6-5 Items understood at the time of taking out policy (by level of satisfaction)
15.2
59.1
12.4
3.9
6.8
4.8
12.3
54.5
9.0
2.6
3.4
4.8
62.5
37.0
78.1
50.4
49.2
27.4
55.5
42.0
73.4
37.0
27.1
10.7
77.7
96.1
90.5
54.3
55.9
32.1
67.8
96.5
82.4
39.6
30.5
15.5
0 20 40 60 80 100
Total (n = 4021)
Satisfied (n = 486)
Rather satisfied (n = 2074)
Neither
Rather dissatisfied (n = 177)
Dissatisfied (n = 84)
Total (n = 4021)
Satisfied (n = 486)
Rather satisfied (n = 2074)
Neither
Rather dissatisfied (n = 177)
Dissatisfied (n = 84) Definitely yes Yes
Leve
l of satisfactio
n
for n
ece
ssityP
rice a
deq
uacy
%
Figure 6-6 Level of understanding of necessity and satisfaction with price adequacy(by level of satisfaction)
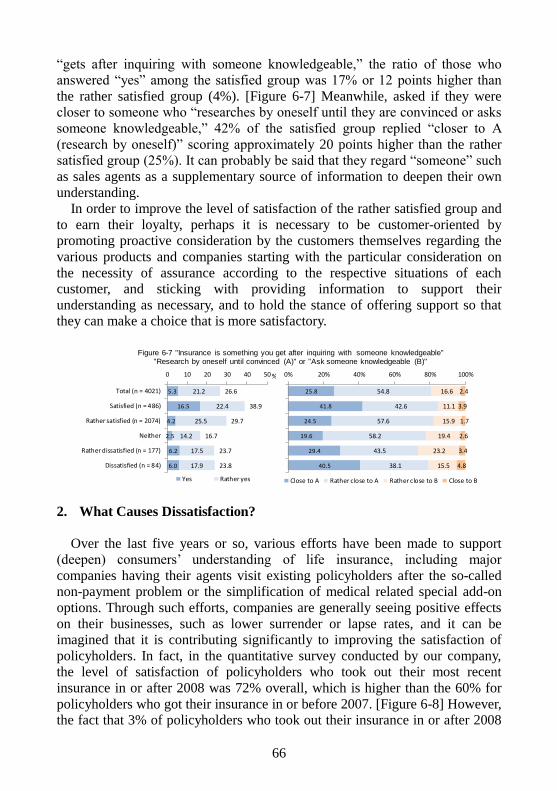
66
“gets after inquiring with someone knowledgeable,” the ratio of those who
answered “yes” among the satisfied group was 17% or 12 points higher than
the rather satisfied group (4%). [Figure 6-7] Meanwhile, asked if they were
closer to someone who “researches by oneself until they are convinced or asks
someone knowledgeable,” 42% of the satisfied group replied “closer to A
(research by oneself)” scoring approximately 20 points higher than the rather
satisfied group (25%). It can probably be said that they regard “someone” such
as sales agents as a supplementary source of information to deepen their own
understanding.
In order to improve the level of satisfaction of the rather satisfied group and
to earn their loyalty, perhaps it is necessary to be customer-oriented by
promoting proactive consideration by the customers themselves regarding the
various products and companies starting with the particular consideration on
the necessity of assurance according to the respective situations of each
customer, and sticking with providing information to support their
understanding as necessary, and to hold the stance of offering support so that
they can make a choice that is more satisfactory.
2. What Causes Dissatisfaction?
Over the last five years or so, various efforts have been made to support
(deepen) consumers’ understanding of life insurance, including major
companies having their agents visit existing policyholders after the so-called
non-payment problem or the simplification of medical related special add-on
options. Through such efforts, companies are generally seeing positive effects
on their businesses, such as lower surrender or lapse rates, and it can be
imagined that it is contributing significantly to improving the satisfaction of
policyholders. In fact, in the quantitative survey conducted by our company,
the level of satisfaction of policyholders who took out their most recent
insurance in or after 2008 was 72% overall, which is higher than the 60% for
policyholders who got their insurance in or before 2007. [Figure 6-8] However,
the fact that 3% of policyholders who took out their insurance in or after 2008
25.8
41.8
24.5
19.6
29.4
40.5
54.8
42.6
57.6
58.2
43.5
38.1
16.6
11.1
15.9
19.4
23.2
15.5
2.4
3.9
1.7
2.6
3.4
4.8
0% 20% 40% 60% 80% 100%
Close to A Rather close to A Rather close to B Close to B
5.3
16.5
4.2
2.5
6.2
6.0
21.2
22.4
25.5
14.2
17.5
17.9
26.6
38.9
29.7
16.7
23.7
23.8
0 10 20 30 40 50
Total (n = 4021)
Satisfied (n = 486)
Rather satisfied (n = 2074)
Neither
Rather dissatisfied (n = 177)
Dissatisfied (n = 84)
Yes Rather yes
%
Figure 6-7 "Insurance is something you get after inquiring with someone knowledgeable" "Research by oneself until convinced (A)" or "Ask someone knowledgeable (B)"
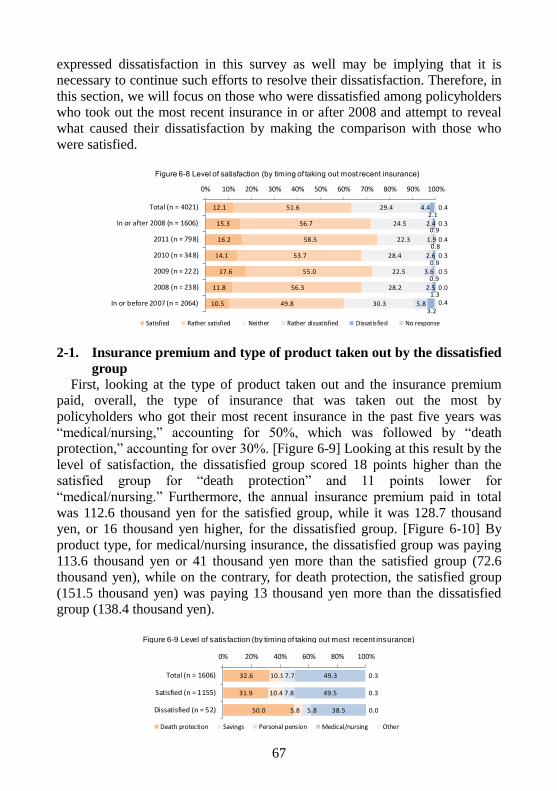
67
expressed dissatisfaction in this survey as well may be implying that it is
necessary to continue such efforts to resolve their dissatisfaction. Therefore, in
this section, we will focus on those who were dissatisfied among policyholders
who took out the most recent insurance in or after 2008 and attempt to reveal
what caused their dissatisfaction by making the comparison with those who
were satisfied.
2-1. Insurance premium and type of product taken out by the dissatisfied
group
First, looking at the type of product taken out and the insurance premium
paid, overall, the type of insurance that was taken out the most by
policyholders who got their most recent insurance in the past five years was
“medical/nursing,” accounting for 50%, which was followed by “death
protection,” accounting for over 30%. [Figure 6-9] Looking at this result by the
level of satisfaction, the dissatisfied group scored 18 points higher than the
satisfied group for “death protection” and 11 points lower for
“medical/nursing.” Furthermore, the annual insurance premium paid in total
was 112.6 thousand yen for the satisfied group, while it was 128.7 thousand
yen, or 16 thousand yen higher, for the dissatisfied group. [Figure 6-10] By
product type, for medical/nursing insurance, the dissatisfied group was paying
113.6 thousand yen or 41 thousand yen more than the satisfied group (72.6
thousand yen), while on the contrary, for death protection, the satisfied group
(151.5 thousand yen) was paying 13 thousand yen more than the dissatisfied
group (138.4 thousand yen).
12.1
15.3
16.2
14.1
17.6
11.8
10.5
51.6
56.7
58.5
53.7
55.0
56.3
49.8
29.4
24.5
22.3
28.4
22.5
28.2
30.3
4.4
2.4
1.9
2.6
3.6
2.5
5.8
2.1
0.9
0.8
0.9
0.9
1.3
3.2
0.4
0.3
0.4
0.3
0.5
0.0
0.4
0% 10% 20% 30% 40% 50% 60% 70% 80% 90% 100%
Total (n = 4021)
In or after 2008 (n = 1606)
2011 (n = 798)
2010 (n = 348)
2009 (n = 222)
2008 (n = 238)
In or before 2007 (n = 2064)
Satisfied Rather satisfied Neither Rather dissatisfied Dissatisfied No response
Figure 6-8 Level of satisfaction (by timing of taking out most recent insurance)
32.6
31.9
50.0
10.1
10.4
5.8
7.7
7.8
5.8
49.3
49.5
38.5
0.3
0.3
0.0
0% 20% 40% 60% 80% 100%
Total (n = 1606)
Satisfied (n = 1155)
Dissatisfied (n = 52)
Death protection Savings Personal pension Medical/nursing Other
Figure 6-9 Level of satisfaction (by timing of taking out most recent insurance)
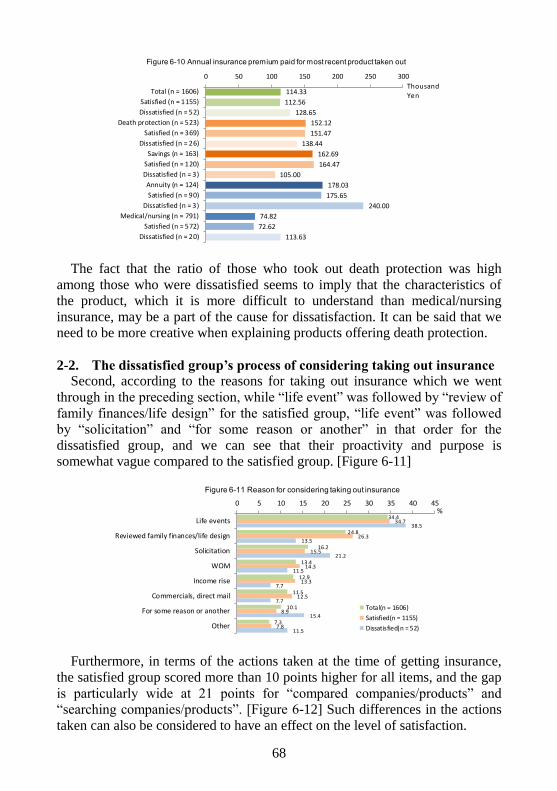
68
The fact that the ratio of those who took out death protection was high
among those who were dissatisfied seems to imply that the characteristics of
the product, which it is more difficult to understand than medical/nursing
insurance, may be a part of the cause for dissatisfaction. It can be said that we
need to be more creative when explaining products offering death protection.
2-2. The dissatisfied group’s process of considering taking out insurance Second, according to the reasons for taking out insurance which we went
through in the preceding section, while “life event” was followed by “review of
family finances/life design” for the satisfied group, “life event” was followed
by “solicitation” and “for some reason or another” in that order for the
dissatisfied group, and we can see that their proactivity and purpose is
somewhat vague compared to the satisfied group. [Figure 6-11]
Furthermore, in terms of the actions taken at the time of getting insurance,
the satisfied group scored more than 10 points higher for all items, and the gap
is particularly wide at 21 points for “compared companies/products” and
“searching companies/products”. [Figure 6-12] Such differences in the actions
taken can also be considered to have an effect on the level of satisfaction.
114.33
112.56
128.65
152.12
151.47
138.44
162.69
164.47
105.00
178.03
175.65
240.00
74.82
72.62
113.63
0 50 100 150 200 250 300
Total (n = 1606)
Satisfied (n = 1155)
Dissatisfied (n = 52)
Death protection (n = 523)
Satisfied (n = 369)
Dissatisfied (n = 26)
Savings (n = 163)
Satisfied (n = 120)
Dissatisfied (n = 3)
Annuity (n = 124)
Satisfied (n = 90)
Dissatisfied (n = 3)
Medical/nursing (n = 791)
Satisfied (n = 572)
Dissatisfied (n = 20)
Thousand Yen
Figure 6-10 Annual insurance premium paid for most recent product taken out
34.4
24.8
16.2
13.4
12.9
11.5
10.1
7.3
34.7
26.3
15.5
14.3
13.3
12.5
8.9
7.8
38.5
13.5
21.2
11.5
7.7
7.7
15.4
11.5
0 5 10 15 20 25 30 35 40 45
Life events
Reviewed family finances/life design
Solicitation
WOM
Income rise
Commercials, direct mail
For some reason or another
Other
Total(n = 1606)
Satisfied(n = 1155)
Dissatisfied(n = 52)
%
Figure 6-11 Reason for considering taking out insurance
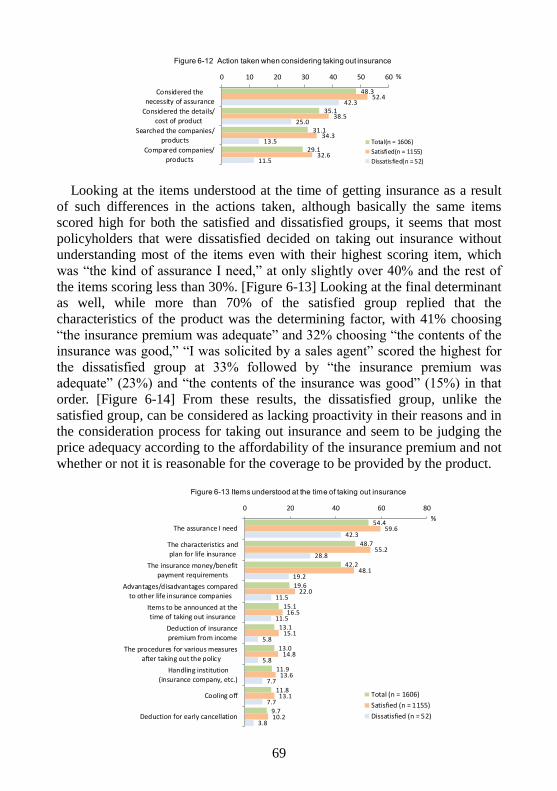
69
Looking at the items understood at the time of getting insurance as a result
of such differences in the actions taken, although basically the same items
scored high for both the satisfied and dissatisfied groups, it seems that most
policyholders that were dissatisfied decided on taking out insurance without
understanding most of the items even with their highest scoring item, which
was “the kind of assurance I need,” at only slightly over 40% and the rest of
the items scoring less than 30%. [Figure 6-13] Looking at the final determinant
as well, while more than 70% of the satisfied group replied that the
characteristics of the product was the determining factor, with 41% choosing
“the insurance premium was adequate” and 32% choosing “the contents of the
insurance was good,” “I was solicited by a sales agent” scored the highest for
the dissatisfied group at 33% followed by “the insurance premium was
adequate” (23%) and “the contents of the insurance was good” (15%) in that
order. [Figure 6-14] From these results, the dissatisfied group, unlike the
satisfied group, can be considered as lacking proactivity in their reasons and in
the consideration process for taking out insurance and seem to be judging the
price adequacy according to the affordability of the insurance premium and not
whether or not it is reasonable for the coverage to be provided by the product.
48.3
35.1
31.1
29.1
52.4
38.5
34.3
32.6
42.3
25.0
13.5
11.5
0 10 20 30 40 50 60
Considered the
necessity of assurance
Considered the details/
cost of product
Searched the companies/products
Compared companies/
products
Total(n = 1606)
Satisfied(n = 1155)
Dissatisfied(n = 52)
%
Figure 6-12 Action taken when considering taking out insurance
54.4
48.7
42.2
19.6
15.1
13.1
13.0
11.9
11.8
9.7
59.6
55.2
48.1
22.0
16.5
15.1
14.8
13.6
13.1
10.2
42.3
28.8
19.2
11.5
11.5
5.8
5.8
7.7
7.7
3.8
0 20 40 60 80
The assurance I need
The characteristics andplan for life insurance
The insurance money/benefitpayment requirements
Advantages/disadvantages comparedto other life insurance companies
Items to be announced at thetime of taking out insurance
Deduction of insurancepremium from income
The procedures for various measuresafter taking out the policy
Handling institution(insurance company, etc.)
Cooling off
Deduction for early cancellation
Total (n = 1606)
Satisfied (n = 1155)
Dissatisfied (n = 52)
%
Figure 6-13 Items understood at the time of taking out insurance
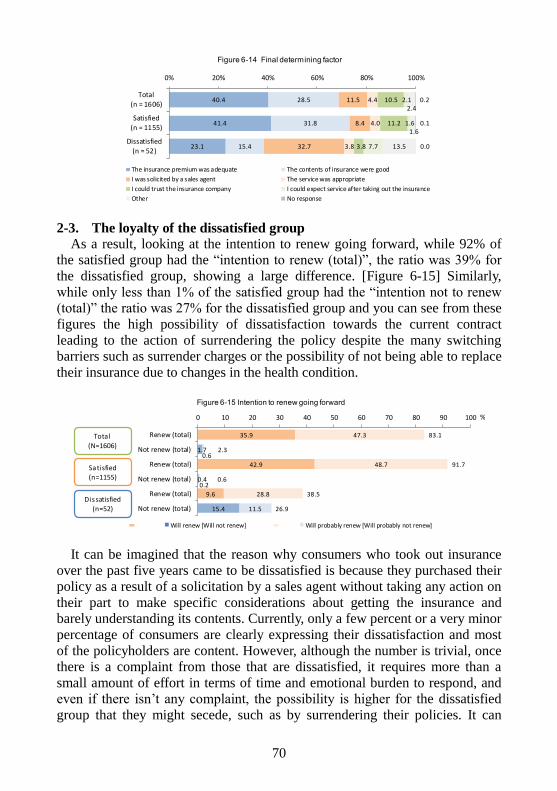
70
2-3. The loyalty of the dissatisfied group
As a result, looking at the intention to renew going forward, while 92% of
the satisfied group had the “intention to renew (total)”, the ratio was 39% for
the dissatisfied group, showing a large difference. [Figure 6-15] Similarly,
while only less than 1% of the satisfied group had the “intention not to renew
(total)” the ratio was 27% for the dissatisfied group and you can see from these
figures the high possibility of dissatisfaction towards the current contract
leading to the action of surrendering the policy despite the many switching
barriers such as surrender charges or the possibility of not being able to replace
their insurance due to changes in the health condition.
It can be imagined that the reason why consumers who took out insurance
over the past five years came to be dissatisfied is because they purchased their
policy as a result of a solicitation by a sales agent without taking any action on
their part to make specific considerations about getting the insurance and
barely understanding its contents. Currently, only a few percent or a very minor
percentage of consumers are clearly expressing their dissatisfaction and most
of the policyholders are content. However, although the number is trivial, once there is a complaint from those that are dissatisfied, it requires more than a
small amount of effort in terms of time and emotional burden to respond, and
even if there isn’t any complaint, the possibility is higher for the dissatisfied
group that they might secede, such as by surrendering their policies. It can
40.4
41.4
23.1
28.5
31.8
15.4
11.5
8.4
32.7
4.4
4.0
3.8
10.5
11.2
3.8
2.1
1.6
7.7
2.4
1.6
13.5
0.2
0.1
0.0
0% 20% 40% 60% 80% 100%
Total
(n = 1606)
Satisfied
(n = 1155)
Dissatisfied
(n = 52)
The insurance premium was adequate The contents of insurance were good
I was solicited by a sales agent The service was appropriate
I could trust the insurance company I could expect service after taking out the insurance
Other No response
Figure 6-14 Final determining factor
Figure 6-15 Intention to renew going forward
35.9
1.7
42.9
0.4
9.6
15.4
47.3
0.6
48.7
0.2
28.8
11.5
83.1
2.3
91.7
0.6
38.5
26.9
0 10 20 30 40 50 60 70 80 90 100
Renew (total)
Not renew (total)
Renew (total)
Not renew (total)
Renew (total)
Not renew (total)
Will renew [Will not renew] Will probably renew [Will probably not renew]
%
Total(N=1606)
Satisfied
(n=1155)
Dissatisfied
(n=52)
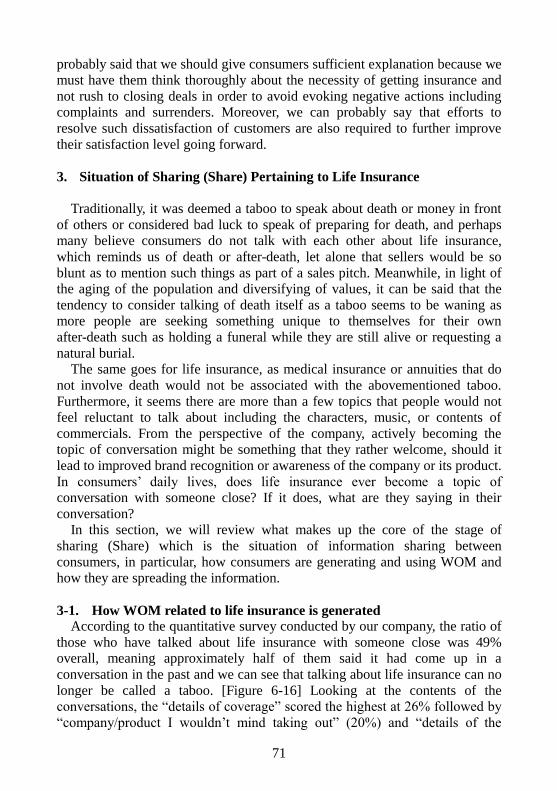
71
probably said that we should give consumers sufficient explanation because we
must have them think thoroughly about the necessity of getting insurance and
not rush to closing deals in order to avoid evoking negative actions including
complaints and surrenders. Moreover, we can probably say that efforts to
resolve such dissatisfaction of customers are also required to further improve
their satisfaction level going forward.
3. Situation of Sharing (Share) Pertaining to Life Insurance
Traditionally, it was deemed a taboo to speak about death or money in front
of others or considered bad luck to speak of preparing for death, and perhaps
many believe consumers do not talk with each other about life insurance,
which reminds us of death or after-death, let alone that sellers would be so
blunt as to mention such things as part of a sales pitch. Meanwhile, in light of
the aging of the population and diversifying of values, it can be said that the
tendency to consider talking of death itself as a taboo seems to be waning as
more people are seeking something unique to themselves for their own
after-death such as holding a funeral while they are still alive or requesting a
natural burial.
The same goes for life insurance, as medical insurance or annuities that do
not involve death would not be associated with the abovementioned taboo.
Furthermore, it seems there are more than a few topics that people would not
feel reluctant to talk about including the characters, music, or contents of
commercials. From the perspective of the company, actively becoming the
topic of conversation might be something that they rather welcome, should it
lead to improved brand recognition or awareness of the company or its product.
In consumers’ daily lives, does life insurance ever become a topic of
conversation with someone close? If it does, what are they saying in their
conversation?
In this section, we will review what makes up the core of the stage of
sharing (Share) which is the situation of information sharing between
consumers, in particular, how consumers are generating and using WOM and
how they are spreading the information.
3-1. How WOM related to life insurance is generated According to the quantitative survey conducted by our company, the ratio of
those who have talked about life insurance with someone close was 49% overall, meaning approximately half of them said it had come up in a
conversation in the past and we can see that talking about life insurance can no
longer be called a taboo. [Figure 6-16] Looking at the contents of the
conversations, the “details of coverage” scored the highest at 26% followed by
“company/product I wouldn’t mind taking out” (20%) and “details of the
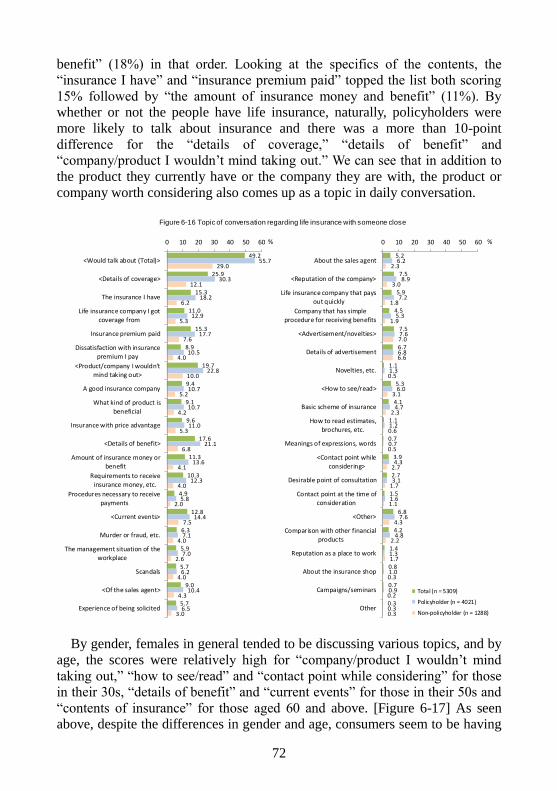
72
benefit” (18%) in that order. Looking at the specifics of the contents, the
“insurance I have” and “insurance premium paid” topped the list both scoring
15% followed by “the amount of insurance money and benefit” (11%). By
whether or not the people have life insurance, naturally, policyholders were
more likely to talk about insurance and there was a more than 10-point
difference for the “details of coverage,” “details of benefit” and
“company/product I wouldn’t mind taking out.” We can see that in addition to
the product they currently have or the company they are with, the product or
company worth considering also comes up as a topic in daily conversation.
By gender, females in general tended to be discussing various topics, and by
age, the scores were relatively high for “company/product I wouldn’t mind
taking out,” “how to see/read” and “contact point while considering” for those
in their 30s, “details of benefit” and “current events” for those in their 50s and
“contents of insurance” for those aged 60 and above. [Figure 6-17] As seen
above, despite the differences in gender and age, consumers seem to be having
5.2
7.5
5.9
4.5
7.5
6.7
1.1
5.3
4.1
1.1
0.7
3.9
2.7
1.5
6.8
4.2
1.4
0.8
0.7
0.3
6.2
8.9
7.2
5.3
7.6
6.8
1.3
6.0
4.7
1.2
0.7
4.3
3.1
1.6
7.6
4.8
1.3
1.0
0.9
0.3
2.3
3.0
1.8
1.9
7.0
6.6
0.5
3.1
2.3
0.6
0.5
2.7
1.7
1.1
4.3
2.2
1.7
0.3
0.2
0.3
0 10 20 30 40 50 60
About the sales agent
<Reputation of the company>
Life insurance company that paysout quickly
Company that has simple
procedure for receiving benefits
<Advertisement/novelties>
Details of advertisement
Novelties, etc.
<How to see/read>
Basic scheme of insurance
How to read estimates,brochures, etc.
Meanings of expressions, words
<Contact point whileconsidering>
Desirable point of consultation
Contact point at the time ofconsideration
<Other>
Comparison with other financialproducts
Reputation as a place to work
About the insurance shop
Campaigns/seminars
Other
Total (n = 5309)
Policyholder (n = 4021)
Non-policyholder (n = 1288)
%
49.2
25.9
15.3
11.0
15.3
8.9
19.7
9.4
9.1
9.6
17.6
11.3
10.3
4.9
12.8
6.3
5.9
5.7
9.0
5.7
55.7
30.3
18.2
12.9
17.7
10.5
22.8
10.7
10.7
11.0
21.1
13.6
12.3
5.8
14.4
7.1
7.0
6.2
10.4
6.5
29.0
12.1
6.2
5.3
7.6
4.0
10.0
5.2
4.2
5.3
6.8
4.1
4.0
2.0
7.5
4.0
2.6
4.0
4.3
3.0
0 10 20 30 40 50 60
<Would talk about (Total)>
<Details of coverage>
The insurance I have
Life insurance company I got
coverage from
Insurance premium paid
Dissatisfaction with insurancepremium I pay
<Product/company I wouldn'tmind taking out>
A good insurance company
What kind of product is
beneficial
Insurance with price advantage
<Details of benefit>
Amount of insurance money orbenefit
Requirements to receiveinsurance money, etc.
Procedures necessary to receive
payments
<Current events>
Murder or fraud, etc.
The management situation of theworkplace
Scandals
<Of the sales agent>
Experience of being solicited
%
Figure 6-16 Topic of conversation regarding life insurance with someone close
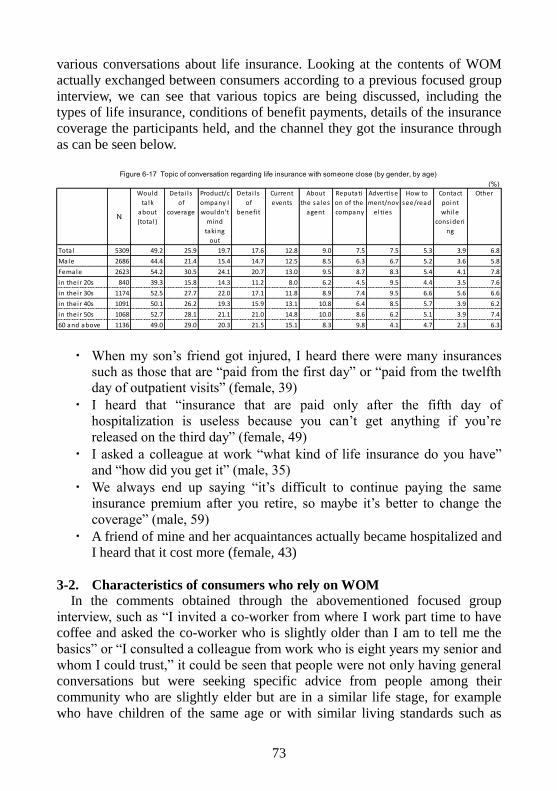
73
various conversations about life insurance. Looking at the contents of WOM
actually exchanged between consumers according to a previous focused group
interview, we can see that various topics are being discussed, including the
types of life insurance, conditions of benefit payments, details of the insurance
coverage the participants held, and the channel they got the insurance through
as can be seen below.
・ When my son’s friend got injured, I heard there were many insurances
such as those that are “paid from the first day” or “paid from the twelfth
day of outpatient visits” (female, 39)
・ I heard that “insurance that are paid only after the fifth day of
hospitalization is useless because you can’t get anything if you’re
released on the third day” (female, 49)
・ I asked a colleague at work “what kind of life insurance do you have”
and “how did you get it” (male, 35)
・ We always end up saying “it’s difficult to continue paying the same
insurance premium after you retire, so maybe it’s better to change the
coverage” (male, 59)
・ A friend of mine and her acquaintances actually became hospitalized and
I heard that it cost more (female, 43)
3-2. Characteristics of consumers who rely on WOM In the comments obtained through the abovementioned focused group
interview, such as “I invited a co-worker from where I work part time to have
coffee and asked the co-worker who is slightly older than I am to tell me the
basics” or “I consulted a colleague from work who is eight years my senior and
whom I could trust,” it could be seen that people were not only having general
conversations but were seeking specific advice from people among their
community who are slightly elder but are in a similar life stage, for example
who have children of the same age or with similar living standards such as
(%)
N
Would
talk
about
(total )
Detai ls
of
coverage
Product/c
ompany I
wouldn't
mind
taking
out
Detai ls
of
benefi t
Current
events
About
the sa les
agent
Reputati
on of the
company
Advertise
ment/nov
elties
How to
see/read
Contact
point
whi le
cons ideri
ng
Other
Total 5309 49.2 25.9 19.7 17.6 12.8 9.0 7.5 7.5 5.3 3.9 6.8
Male 2686 44.4 21.4 15.4 14.7 12.5 8.5 6.3 6.7 5.2 3.6 5.8
Female 2623 54.2 30.5 24.1 20.7 13.0 9.5 8.7 8.3 5.4 4.1 7.8
in their 20s 840 39.3 15.8 14.3 11.2 8.0 6.2 4.5 9.5 4.4 3.5 7.6
in their 30s 1174 52.5 27.7 22.0 17.1 11.8 8.9 7.4 9.5 6.6 5.6 6.6
in their 40s 1091 50.1 26.2 19.3 15.9 13.1 10.8 6.4 8.5 5.7 3.9 6.2
in their 50s 1068 52.7 28.1 21.1 21.0 14.8 10.0 8.6 6.2 5.1 3.9 7.4
60 and above 1136 49.0 29.0 20.3 21.5 15.1 8.3 9.8 4.1 4.7 2.3 6.3
Figure 6-17 Topic of conversation regarding life insurance with someone close (by gender, by age)
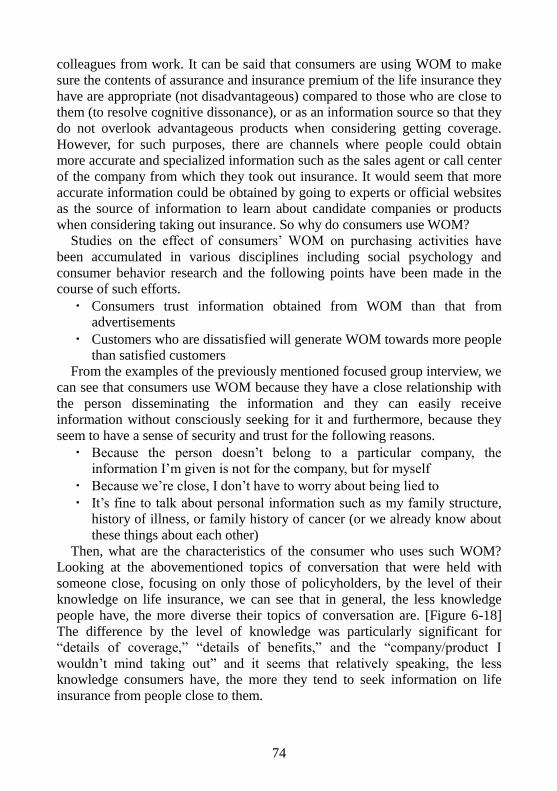
74
colleagues from work. It can be said that consumers are using WOM to make
sure the contents of assurance and insurance premium of the life insurance they
have are appropriate (not disadvantageous) compared to those who are close to
them (to resolve cognitive dissonance), or as an information source so that they
do not overlook advantageous products when considering getting coverage.
However, for such purposes, there are channels where people could obtain
more accurate and specialized information such as the sales agent or call center
of the company from which they took out insurance. It would seem that more
accurate information could be obtained by going to experts or official websites
as the source of information to learn about candidate companies or products
when considering taking out insurance. So why do consumers use WOM?
Studies on the effect of consumers’ WOM on purchasing activities have
been accumulated in various disciplines including social psychology and
consumer behavior research and the following points have been made in the
course of such efforts.
・ Consumers trust information obtained from WOM than that from
advertisements
・ Customers who are dissatisfied will generate WOM towards more people
than satisfied customers
From the examples of the previously mentioned focused group interview, we
can see that consumers use WOM because they have a close relationship with
the person disseminating the information and they can easily receive
information without consciously seeking for it and furthermore, because they
seem to have a sense of security and trust for the following reasons.
・ Because the person doesn’t belong to a particular company, the
information I’m given is not for the company, but for myself
・ Because we’re close, I don’t have to worry about being lied to
・ It’s fine to talk about personal information such as my family structure,
history of illness, or family history of cancer (or we already know about
these things about each other)
Then, what are the characteristics of the consumer who uses such WOM?
Looking at the abovementioned topics of conversation that were held with
someone close, focusing on only those of policyholders, by the level of their
knowledge on life insurance, we can see that in general, the less knowledge
people have, the more diverse their topics of conversation are. [Figure 6-18]
The difference by the level of knowledge was particularly significant for
“details of coverage,” “details of benefits,” and the “company/product I
wouldn’t mind taking out” and it seems that relatively speaking, the less
knowledge consumers have, the more they tend to seek information on life
insurance from people close to them.
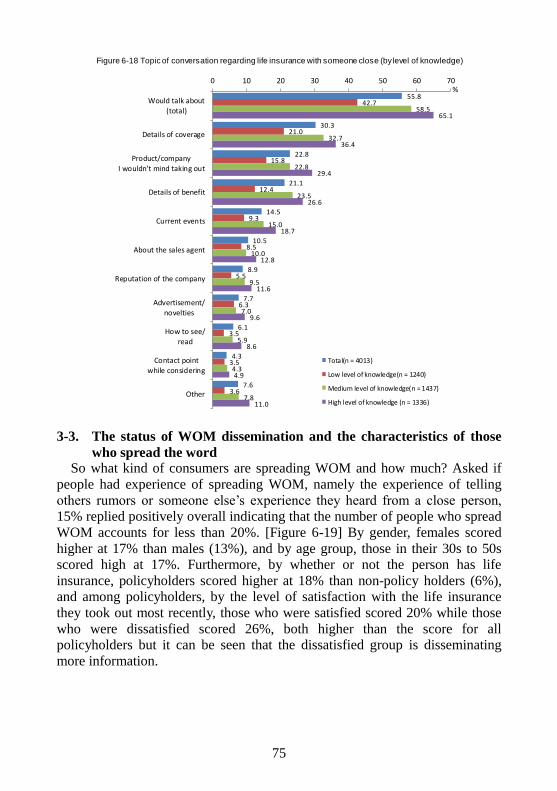
75
3-3. The status of WOM dissemination and the characteristics of those
who spread the word So what kind of consumers are spreading WOM and how much? Asked if
people had experience of spreading WOM, namely the experience of telling
others rumors or someone else’s experience they heard from a close person,
15% replied positively overall indicating that the number of people who spread
WOM accounts for less than 20%. [Figure 6-19] By gender, females scored
higher at 17% than males (13%), and by age group, those in their 30s to 50s
scored high at 17%. Furthermore, by whether or not the person has life
insurance, policyholders scored higher at 18% than non-policy holders (6%),
and among policyholders, by the level of satisfaction with the life insurance
they took out most recently, those who were satisfied scored 20% while those
who were dissatisfied scored 26%, both higher than the score for all
policyholders but it can be seen that the dissatisfied group is disseminating
more information.
55.8
30.3
22.8
21.1
14.5
10.5
8.9
7.7
6.1
4.3
7.6
42.7
21.0
15.8
12.4
9.3
8.5
5.5
6.3
3.5
3.5
3.6
58.5
32.7
22.8
23.5
15.0
10.0
9.5
7.0
5.9
4.3
7.8
65.1
36.4
29.4
26.6
18.7
12.8
11.6
9.6
8.6
4.9
11.0
0 10 20 30 40 50 60 70
Would talk about
(total)
Details of coverage
Product/company
I wouldn't mind taking out
Details of benefit
Current events
About the sales agent
Reputation of the company
Advertisement/novelties
How to see/
read
Contact pointwhile considering
Other
Total(n = 4013)
Low level of knowledge(n = 1240)
Medium level of knowledge(n = 1437)
High level of knowledge (n = 1336)
%
Figure 6-18 Topic of conversation regarding life insurance with someone close (by level of knowledge)
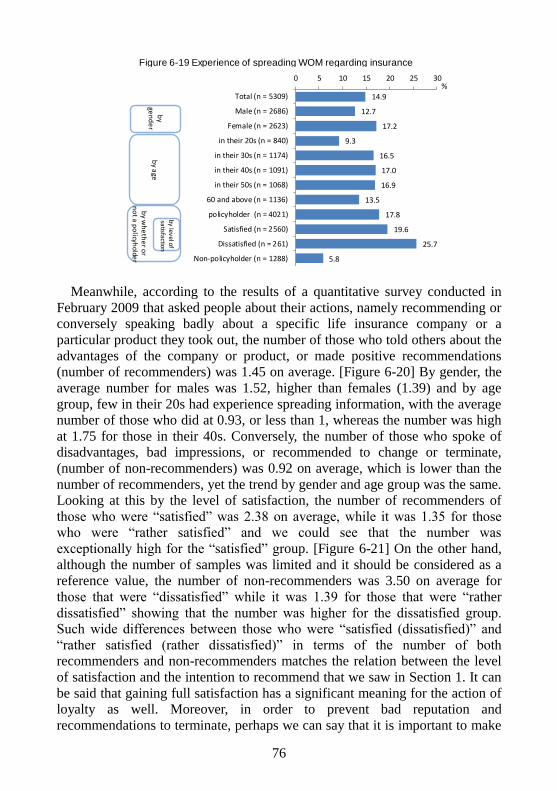
76
Meanwhile, according to the results of a quantitative survey conducted in
February 2009 that asked people about their actions, namely recommending or
conversely speaking badly about a specific life insurance company or a
particular product they took out, the number of those who told others about the
advantages of the company or product, or made positive recommendations
(number of recommenders) was 1.45 on average. [Figure 6-20] By gender, the
average number for males was 1.52, higher than females (1.39) and by age
group, few in their 20s had experience spreading information, with the average
number of those who did at 0.93, or less than 1, whereas the number was high
at 1.75 for those in their 40s. Conversely, the number of those who spoke of
disadvantages, bad impressions, or recommended to change or terminate,
(number of non-recommenders) was 0.92 on average, which is lower than the
number of recommenders, yet the trend by gender and age group was the same.
Looking at this by the level of satisfaction, the number of recommenders of
those who were “satisfied” was 2.38 on average, while it was 1.35 for those
who were “rather satisfied” and we could see that the number was
exceptionally high for the “satisfied” group. [Figure 6-21] On the other hand,
although the number of samples was limited and it should be considered as a
reference value, the number of non-recommenders was 3.50 on average for
those that were “dissatisfied” while it was 1.39 for those that were “rather
dissatisfied” showing that the number was higher for the dissatisfied group.
Such wide differences between those who were “satisfied (dissatisfied)” and
“rather satisfied (rather dissatisfied)” in terms of the number of both recommenders and non-recommenders matches the relation between the level
of satisfaction and the intention to recommend that we saw in Section 1. It can
be said that gaining full satisfaction has a significant meaning for the action of
loyalty as well. Moreover, in order to prevent bad reputation and
recommendations to terminate, perhaps we can say that it is important to make
14.9
12.7
17.2
9.3
16.5
17.0
16.9
13.5
17.8
19.6
25.7
5.8
0 5 10 15 20 25 30
Total (n = 5309)
Male (n = 2686)
Female (n = 2623)
in their 20s (n = 840)
in their 30s (n = 1174)
in their 40s (n = 1091)
in their 50s (n = 1068)
60 and above (n = 1136)
policyholder (n = 4021)
Satisfied (n = 2560)
Dissatisfied (n = 261)
Non-policyholder (n = 1288)
%
by
gen
de
rb
y age
by
wh
eth
er o
r n
ot a
po
licyholde
r
by
lev
el o
f sa
tisfactio
n
Figure 6-19 Experience of spreading WOM regarding insurance
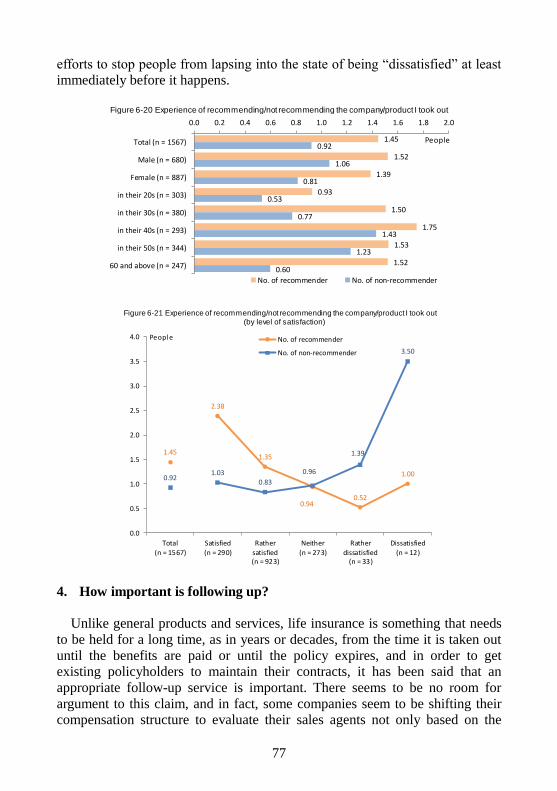
77
efforts to stop people from lapsing into the state of being “dissatisfied” at least
immediately before it happens.
4. How important is following up?
Unlike general products and services, life insurance is something that needs
to be held for a long time, as in years or decades, from the time it is taken out
until the benefits are paid or until the policy expires, and in order to get
existing policyholders to maintain their contracts, it has been said that an
appropriate follow-up service is important. There seems to be no room for
argument to this claim, and in fact, some companies seem to be shifting their
compensation structure to evaluate their sales agents not only based on the
1.45
1.52
1.39
0.93
1.50
1.75
1.53
1.52
0.92
1.06
0.81
0.53
0.77
1.43
1.23
0.60
0.0 0.2 0.4 0.6 0.8 1.0 1.2 1.4 1.6 1.8 2.0
Total (n = 1567)
Male (n = 680)
Female (n = 887)
in their 20s (n = 303)
in their 30s (n = 380)
in their 40s (n = 293)
in their 50s (n = 344)
60 and above (n = 247)
No. of recommender No. of non-recommender
People
Figure 6-20 Experience of recommending/not recommending the company/product I took out
1.45
2.38
1.35
0.940.52
1.000.92
1.030.83
0.96
1.39
3.50
0.0
0.5
1.0
1.5
2.0
2.5
3.0
3.5
4.0
Total(n = 1567)
Satisfied(n = 290)
Rathersatisfied(n = 923)
Neither(n = 273)
Ratherdissatisfied
(n = 33)
Dissatisfied(n = 12)
No. of recommender
No. of non-recommender
People
Figure 6-21 Experience of recommending/not recommending the company/product I took out (by level of satisfaction)
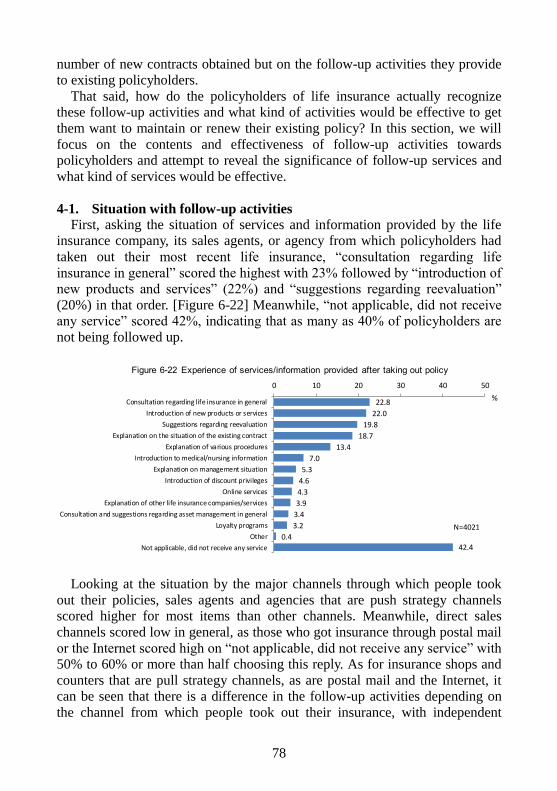
78
number of new contracts obtained but on the follow-up activities they provide
to existing policyholders.
That said, how do the policyholders of life insurance actually recognize
these follow-up activities and what kind of activities would be effective to get
them want to maintain or renew their existing policy? In this section, we will
focus on the contents and effectiveness of follow-up activities towards
policyholders and attempt to reveal the significance of follow-up services and
what kind of services would be effective.
4-1. Situation with follow-up activities
First, asking the situation of services and information provided by the life
insurance company, its sales agents, or agency from which policyholders had
taken out their most recent life insurance, “consultation regarding life
insurance in general” scored the highest with 23% followed by “introduction of
new products and services” (22%) and “suggestions regarding reevaluation”
(20%) in that order. [Figure 6-22] Meanwhile, “not applicable, did not receive
any service” scored 42%, indicating that as many as 40% of policyholders are
not being followed up.
Looking at the situation by the major channels through which people took
out their policies, sales agents and agencies that are push strategy channels
scored higher for most items than other channels. Meanwhile, direct sales
channels scored low in general, as those who got insurance through postal mail
or the Internet scored high on “not applicable, did not receive any service” with 50% to 60% or more than half choosing this reply. As for insurance shops and
counters that are pull strategy channels, as are postal mail and the Internet, it
can be seen that there is a difference in the follow-up activities depending on
the channel from which people took out their insurance, with independent
22.8
22.0
19.8
18.7
13.4
7.0
5.3
4.6
4.3
3.9
3.4
3.2
0.4
42.4
0 10 20 30 40 50
Consultation regarding life insurance in general
Introduction of new products or services
Suggestions regarding reevaluation
Explanation on the situation of the existing contract
Explanation of various procedures
Introduction to medical/nursing information
Explanation on management situation
Introduction of discount privileges
Online services
Explanation of other life insurance companies/services
Consultation and suggestions regarding asset management in general
Loyalty programs
Other
Not applicable, did not receive any service
%
N=4021
Figure 6-22 Experience of services/information provided after taking out policy
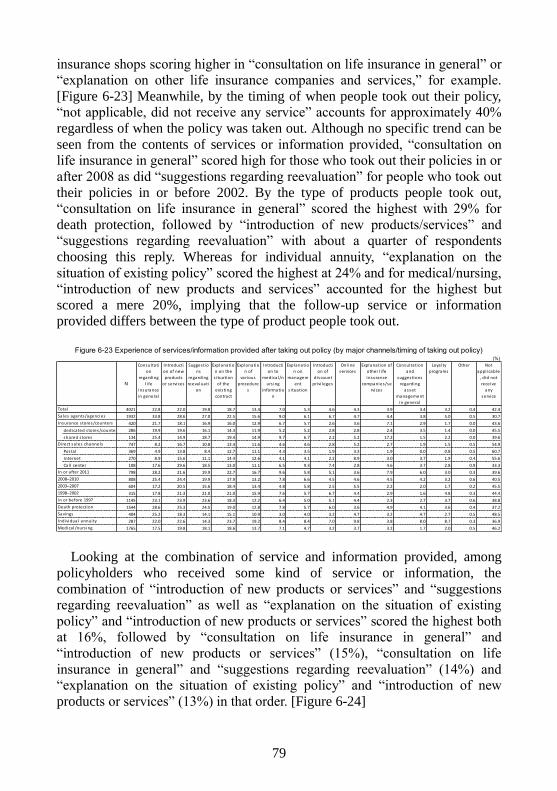
79
insurance shops scoring higher in “consultation on life insurance in general” or
“explanation on other life insurance companies and services,” for example.
[Figure 6-23] Meanwhile, by the timing of when people took out their policy,
“not applicable, did not receive any service” accounts for approximately 40%
regardless of when the policy was taken out. Although no specific trend can be
seen from the contents of services or information provided, “consultation on
life insurance in general” scored high for those who took out their policies in or
after 2008 as did “suggestions regarding reevaluation” for people who took out
their policies in or before 2002. By the type of products people took out,
“consultation on life insurance in general” scored the highest with 29% for
death protection, followed by “introduction of new products/services” and
“suggestions regarding reevaluation” with about a quarter of respondents
choosing this reply. Whereas for individual annuity, “explanation on the
situation of existing policy” scored the highest at 24% and for medical/nursing,
“introduction of new products and services” accounted for the highest but
scored a mere 20%, implying that the follow-up service or information
provided differs between the type of product people took out.
Looking at the combination of service and information provided, among
policyholders who received some kind of service or information, the
combination of “introduction of new products or services” and “suggestions
regarding reevaluation” as well as “explanation on the situation of existing
policy” and “introduction of new products or services” scored the highest both
at 16%, followed by “consultation on life insurance in general” and
“introduction of new products or services” (15%), “consultation on life
insurance in general” and “suggestions regarding reevaluation” (14%) and
“explanation on the situation of existing policy” and “introduction of new
products or services” (13%) in that order. [Figure 6-24]
(%)
N
Consultati
on
regarding
l i fe
insurance
in genera l
Introducti
on of new
products
or services
Suggestio
ns
regarding
reevaluati
on
Explanatio
n on the
s i tuation
of the
exis ting
contract
Explanatio
n of
various
procedure
s
Introducti
on to
medica l/n
urs ing
informatio
n
Explanatio
n on
managem
ent
s i tuation
Introducti
on of
discount
privi leges
Onl ine
services
Explanation of
other l i fe
insurance
companies/se
rvices
Consultation
and
suggestions
regarding
asset
management
in genera l
Loyalty
programs
Other Not
appl icable
, did not
receive
any
service
4021 22.8 22.0 19.8 18.7 13.4 7.0 5.3 4.6 4.3 3.9 3.4 3.2 0.4 42.4
1932 33.8 28.6 27.0 22.5 15.6 9.0 6.1 6.7 4.7 4.4 3.8 5.0 0.5 30.7
420 21.7 18.1 16.9 16.0 12.9 6.7 5.7 2.6 3.6 7.1 2.9 1.7 0.0 43.6
dedicated s tores/counters 286 19.9 19.6 16.1 14.3 11.9 5.2 5.2 2.8 2.8 2.4 3.5 1.4 0.0 45.5
shared s tores 134 25.4 14.9 18.7 19.4 14.9 9.7 6.7 2.2 5.2 17.2 1.5 2.2 0.0 39.6
747 8.2 16.7 10.8 13.4 11.6 4.6 4.6 2.8 5.2 2.7 1.9 1.5 0.5 54.9
Postal 369 4.9 13.8 8.4 12.7 11.1 4.3 3.5 1.9 3.3 1.9 0.0 0.8 0.5 60.7
Internet 270 8.9 15.6 11.1 14.4 12.6 4.1 4.1 2.2 8.9 3.0 3.7 1.9 0.4 55.6
Cal l center 108 17.6 29.6 18.5 13.0 11.1 6.5 9.3 7.4 2.8 4.6 3.7 2.8 0.9 33.3
798 28.2 21.6 19.9 22.7 16.7 9.6 5.8 5.1 3.6 7.9 6.0 3.0 0.3 39.6
808 25.4 24.4 19.9 17.9 13.2 7.8 6.6 4.5 4.6 4.5 4.2 3.2 0.6 40.5
604 17.2 20.5 15.6 18.4 13.4 4.8 5.8 2.5 5.5 2.2 2.0 1.7 0.2 45.5
315 17.8 21.3 21.0 21.0 15.9 7.6 5.7 6.7 4.4 2.9 1.6 4.8 0.3 44.4
1145 23.1 23.9 23.6 18.3 12.2 6.4 5.0 5.1 4.4 2.3 2.7 3.7 0.6 38.8
1544 28.6 25.3 24.5 19.0 12.8 7.8 5.7 6.0 3.6 4.9 4.1 3.6 0.4 37.2
404 25.2 18.3 14.1 15.1 10.9 3.0 4.0 3.2 4.7 3.2 4.7 2.7 0.5 48.5
287 22.0 22.6 14.3 23.7 19.2 8.4 8.4 7.0 9.8 3.8 8.0 8.7 0.3 36.9
1765 17.5 19.8 18.1 18.6 13.7 7.1 4.7 3.2 3.7 3.2 1.7 2.0 0.5 46.2
Figure 6-23 Experience of services/information provided after taking out policy (by major channels/timing of taking out policy)
Total
Sa les agents/agencies
Insurance s tores/counters
Direct sa les channels
In or after 2011
2008–2010
2003–2007
1998–2002
in or before 1997
Death protection
Savings
Individual annuity
Medica l/nurs ing
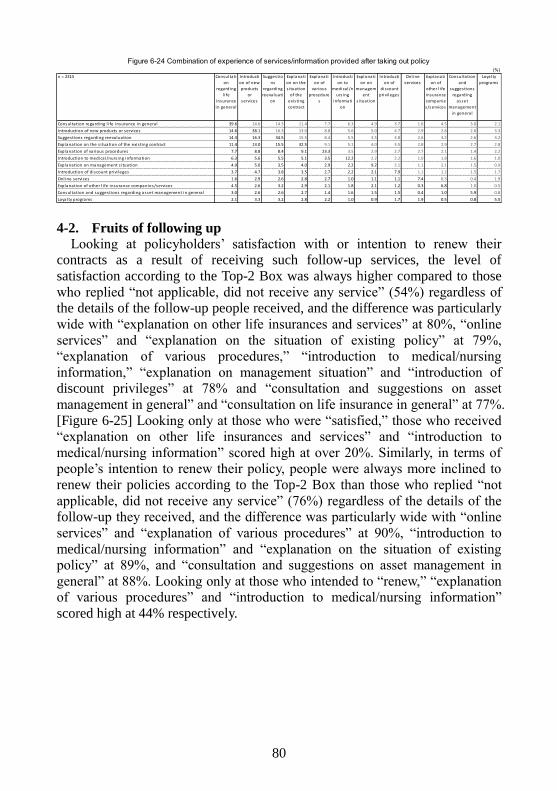
80
4-2. Fruits of following up
Looking at policyholders’ satisfaction with or intention to renew their
contracts as a result of receiving such follow-up services, the level of
satisfaction according to the Top-2 Box was always higher compared to those
who replied “not applicable, did not receive any service” (54%) regardless of
the details of the follow-up people received, and the difference was particularly
wide with “explanation on other life insurances and services” at 80%, “online
services” and “explanation on the situation of existing policy” at 79%,
“explanation of various procedures,” “introduction to medical/nursing
information,” “explanation on management situation” and “introduction of
discount privileges” at 78% and “consultation and suggestions on asset
management in general” and “consultation on life insurance in general” at 77%.
[Figure 6-25] Looking only at those who were “satisfied,” those who received
“explanation on other life insurances and services” and “introduction to
medical/nursing information” scored high at over 20%. Similarly, in terms of
people’s intention to renew their policy, people were always more inclined to
renew their policies according to the Top-2 Box than those who replied “not
applicable, did not receive any service” (76%) regardless of the details of the
follow-up they received, and the difference was particularly wide with “online
services” and “explanation of various procedures” at 90%, “introduction to
medical/nursing information” and “explanation on the situation of existing
policy” at 89%, and “consultation and suggestions on asset management in
general” at 88%. Looking only at those who intended to “renew,” “explanation
of various procedures” and “introduction to medical/nursing information”
scored high at 44% respectively.
(%)
n = 2315 Consultati
on
regarding
l i fe
insurance
in genera l
Introducti
on of new
products
or
services
Suggestio
ns
regarding
reevaluati
on
Explanati
on on the
s i tuation
of the
exis ting
contract
Explanati
on of
various
procedure
s
Introducti
on to
medica l/n
urs ing
informati
on
Explanati
on on
managem
ent
s i tuation
Introducti
on of
discount
privi leges
Onl ine
services
Explanati
on of
other l i fe
insurance
companie
s/services
Consultation
and
suggestions
regarding
asset
management
in genera l
Loyalty
programs
Consultation regarding l i fe insurance in genera l 39.6 14.6 14.3 11.4 7.7 6.3 4.9 3.7 1.6 4.5 3.0 2.1
Introduction of new products or services 14.6 38.1 16.3 13.0 8.8 5.6 5.0 4.7 2.9 2.6 2.6 3.3
Suggestions regarding reevaluation 14.3 16.3 34.5 15.5 8.4 5.5 3.5 3.8 2.6 3.2 2.6 3.2
Explanation on the s i tuation of the exis ting contract 11.4 13.0 15.5 32.5 9.1 5.1 4.0 3.5 2.8 2.9 2.7 2.8
Explanation of various procedures 7.7 8.8 8.4 9.1 23.3 3.5 2.9 2.7 2.7 2.1 1.4 2.2
Introduction to medica l/nurs ing information 6.3 5.6 5.5 5.1 3.5 12.2 2.2 2.2 1.0 1.8 1.6 1.0
Explanation on management s i tuation 4.9 5.0 3.5 4.0 2.9 2.2 9.2 2.1 1.1 2.1 1.5 0.9
Introduction of discount privi leges 3.7 4.7 3.8 3.5 2.7 2.2 2.1 7.9 1.1 1.2 1.5 1.7
Onl ine services 1.6 2.9 2.6 2.8 2.7 1.0 1.1 1.1 7.4 0.3 0.4 1.9
Explanation of other l i fe insurance companies/services 4.5 2.6 3.2 2.9 2.1 1.8 2.1 1.2 0.3 6.8 1.0 0.5
Consultation and suggestions regarding asset management in genera l 3.0 2.6 2.6 2.7 1.4 1.6 1.5 1.5 0.4 1.0 5.9 0.8
Loyalty programs 2.1 3.3 3.2 2.8 2.2 1.0 0.9 1.7 1.9 0.5 0.8 5.5
Figure 6-24 Combination of experience of services/information provided after taking out policy
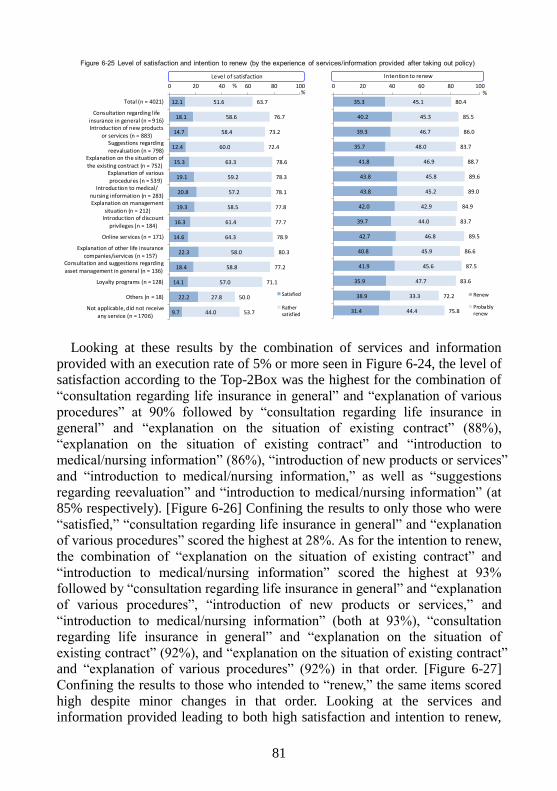
81
Looking at these results by the combination of services and information
provided with an execution rate of 5% or more seen in Figure 6-24, the level of
satisfaction according to the Top-2Box was the highest for the combination of
“consultation regarding life insurance in general” and “explanation of various
procedures” at 90% followed by “consultation regarding life insurance in
general” and “explanation on the situation of existing contract” (88%),
“explanation on the situation of existing contract” and “introduction to
medical/nursing information” (86%), “introduction of new products or services”
and “introduction to medical/nursing information,” as well as “suggestions
regarding reevaluation” and “introduction to medical/nursing information” (at
85% respectively). [Figure 6-26] Confining the results to only those who were
“satisfied,” “consultation regarding life insurance in general” and “explanation
of various procedures” scored the highest at 28%. As for the intention to renew,
the combination of “explanation on the situation of existing contract” and
“introduction to medical/nursing information” scored the highest at 93%
followed by “consultation regarding life insurance in general” and “explanation
of various procedures”, “introduction of new products or services,” and
“introduction to medical/nursing information” (both at 93%), “consultation
regarding life insurance in general” and “explanation on the situation of
existing contract” (92%), and “explanation on the situation of existing contract” and “explanation of various procedures” (92%) in that order. [Figure 6-27]
Confining the results to those who intended to “renew,” the same items scored
high despite minor changes in that order. Looking at the services and
information provided leading to both high satisfaction and intention to renew,
Intention to renew
35.3
40.2
39.3
35.7
41.8
43.8
43.8
42.0
39.7
42.7
40.8
41.9
35.9
38.9
31.4
45.1
45.3
46.7
48.0
46.9
45.8
45.2
42.9
44.0
46.8
45.9
45.6
47.7
33.3
44.4
80.4
85.5
86.0
83.7
88.7
89.6
89.0
84.9
83.7
89.5
86.6
87.5
83.6
72.2
75.8
0 20 40 60 80 100
Renew
Probablyrenew
%
12.1
18.1
14.7
12.4
15.3
19.1
20.8
19.3
16.3
14.6
22.3
18.4
14.1
22.2
9.7
51.6
58.6
58.4
60.0
63.3
59.2
57.2
58.5
61.4
64.3
58.0
58.8
57.0
27.8
44.0
63.7
76.7
73.2
72.4
78.6
78.3
78.1
77.8
77.7
78.9
80.3
77.2
71.1
50.0
53.7
0 20 40 60 80 100
Total (n = 4021)
Consultation regarding life
insurance in general (n = 916)Introduction of new products
or services (n = 883)Suggestions regardingreevaluation (n = 798)
Explanation on the situation ofthe existing contract (n = 752)
Explanation of variousprocedures (n = 539)
Introduction to medical/
nursing information (n = 283)Explanation on management
situation (n = 212)Introduction of discount
privileges (n = 184)
Online services (n = 171)
Explanation of other life insurancecompanies/services (n = 157)
Consultation and suggestions regardingasset management in general (n = 136)
Loyalty programs (n = 128)
Others (n = 18)
Not applicable, did not receive
any service (n = 1706)
Satisfied
Rathersatisfied
%
Level of satisfaction
Figure 6-25 Level of satisfaction and intention to renew (by the experience of services/information provided after taking out policy)
%
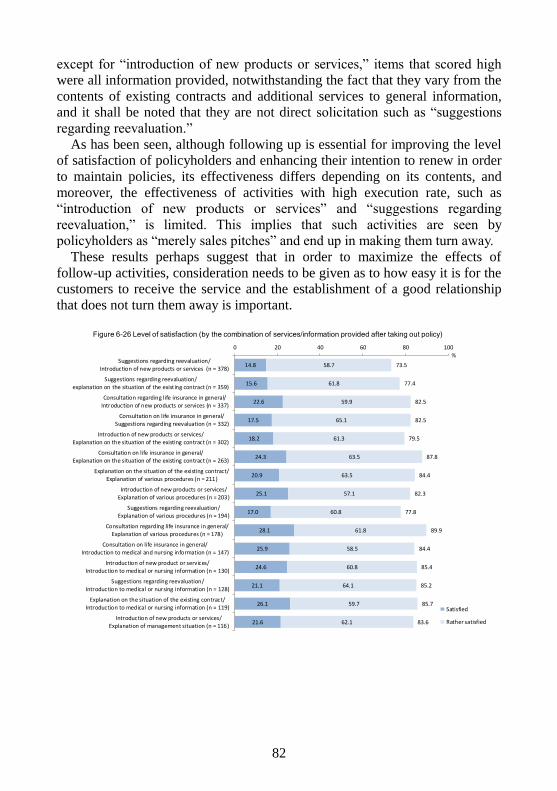
82
except for “introduction of new products or services,” items that scored high
were all information provided, notwithstanding the fact that they vary from the
contents of existing contracts and additional services to general information,
and it shall be noted that they are not direct solicitation such as “suggestions
regarding reevaluation.”
As has been seen, although following up is essential for improving the level
of satisfaction of policyholders and enhancing their intention to renew in order
to maintain policies, its effectiveness differs depending on its contents, and
moreover, the effectiveness of activities with high execution rate, such as
“introduction of new products or services” and “suggestions regarding
reevaluation,” is limited. This implies that such activities are seen by
policyholders as “merely sales pitches” and end up in making them turn away.
These results perhaps suggest that in order to maximize the effects of
follow-up activities, consideration needs to be given as to how easy it is for the
customers to receive the service and the establishment of a good relationship
that does not turn them away is important.
14.8
15.6
22.6
17.5
18.2
24.3
20.9
25.1
17.0
28.1
25.9
24.6
21.1
26.1
21.6
58.7
61.8
59.9
65.1
61.3
63.5
63.5
57.1
60.8
61.8
58.5
60.8
64.1
59.7
62.1
73.5
77.4
82.5
82.5
79.5
87.8
84.4
82.3
77.8
89.9
84.4
85.4
85.2
85.7
83.6
0 20 40 60 80 100
Suggestions regarding reevaluation/Introduction of new products or services (n = 378)
Suggestions regarding reevaluation/explanation on the situation of the existing contract (n = 359)
Consultation regarding life insurance in general/
Introduction of new products or services (n = 337)
Consultation on life insurance in general/Suggestions regarding reevaluation (n = 332)
Introduction of new products or services/
Explanation on the situation of the existing contract (n = 302)
Consultation on life insurance in general/Explanation on the situation of the existing contract (n = 263)
Explanation on the situation of the existing contract/Explanation of various procedures (n = 211)
Introduction of new products or services/
Explanation of various procedures (n = 203)
Suggestions regarding reevaluation/Explanation of various procedures (n = 194)
Consultation regarding life insurance in general/
Explanation of various procedures (n = 178)
Consultation on life insurance in general/Introduction to medical and nursing information (n = 147)
Introduction of new product or services/Introduction to medical or nursing information (n = 130)
Suggestions regarding reevaluation/
Introduction to medical or nursing information (n = 128)
Explanation on the situation of the existing contract/Introduction to medical or nursing information (n = 119)
Introduction of new products or services/
Explanation of management situation (n = 116)
Satisfied
Rather satisfied
%
Figure 6-26 Level of satisfaction (by the combination of services/information provided after taking out policy)

83
36.0
37.9
44.2
39.2
42.7
46.4
43.6
42.4
40.2
46.6
44.9
46.2
43.8
52.9
45.7
50.0
51.0
46.9
47.6
47.4
45.6
47.9
48.3
49.0
46.6
45.6
46.9
47.7
40.3
43.1
86.0
88.9
91.1
86.7
90.1
92.0
91.5
90.6
89.2
93.3
90.5
93.1
91.4
93.3
88.8
0 20 40 60 80 100
Suggestions regarding reevaluation/Introduction of new products or services (n = 378)
Suggestions regarding reevaluation/explanation on the situation of the existing contract (n = 359)
Consultation regarding life insurance in general/Introduction of new products or services (n = 337)
Consultation on life insurance in general/Suggestions regarding reevaluation (n = 332)
Introduction of new products or services/Explanation on the situation of the existing contract (n = 302)
Consultation on life insurance in general/Explanation on the situation of the existing contract (n = 263)
Explanation on the situation of the existing contract/Explanation of various procedures (n = 211)
Introduction of new products or services/Explanation of various procedures (n = 203)
Suggestions regarding reevaluation/Explanation of various procedures (n = 194)
Consultation regarding life insurance in general/Explanation of various procedures (n = 178)
Consultation on life insurance in general/Introduction to medical and nursing information (n = 147)
Introduction of new product or services/Introduction to medical or nursing information (n = 130)
Suggestions regarding reevaluation/Introduction to medical or nursing information (n = 128)
Explanation on the situation of the existing contract/Introduction to medical or nursing information (n = 119)
Introduction of new products or services/Explanation of management situation (n = 116)
Renew
Probablyrenew
%
Figure 6-27 Intention to renew (by the combination of services/information provided after taking out policy)
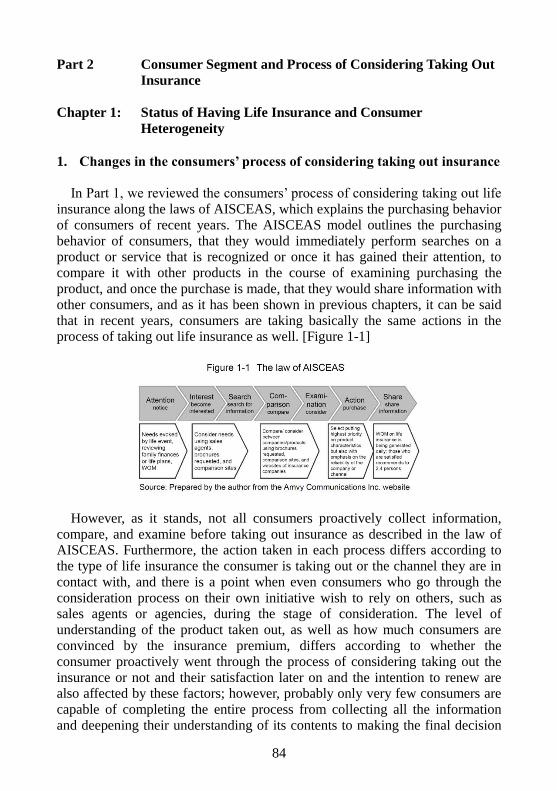
84
Part 2 Consumer Segment and Process of Considering Taking Out
Insurance
Chapter 1: Status of Having Life Insurance and Consumer
Heterogeneity
1. Changes in the consumers’ process of considering taking out insurance
In Part 1, we reviewed the consumers’ process of considering taking out life
insurance along the laws of AISCEAS, which explains the purchasing behavior
of consumers of recent years. The AISCEAS model outlines the purchasing
behavior of consumers, that they would immediately perform searches on a product or service that is recognized or once it has gained their attention, to
compare it with other products in the course of examining purchasing the
product, and once the purchase is made, that they would share information with
other consumers, and as it has been shown in previous chapters, it can be said
that in recent years, consumers are taking basically the same actions in the process of taking out life insurance as well. [Figure 1-1]
However, as it stands, not all consumers proactively collect information,
compare, and examine before taking out insurance as described in the law of AISCEAS. Furthermore, the action taken in each process differs according to
the type of life insurance the consumer is taking out or the channel they are in
contact with, and there is a point when even consumers who go through the
consideration process on their own initiative wish to rely on others, such as sales agents or agencies, during the stage of consideration. The level of
understanding of the product taken out, as well as how much consumers are
convinced by the insurance premium, differs according to whether the consumer proactively went through the process of considering taking out the
insurance or not and their satisfaction later on and the intention to renew are also affected by these factors; however, probably only very few consumers are
capable of completing the entire process from collecting all the information
and deepening their understanding of its contents to making the final decision
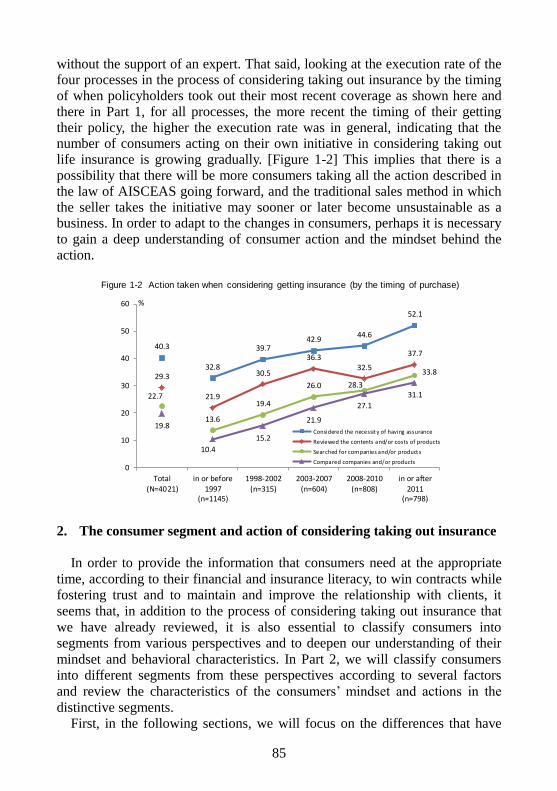
85
without the support of an expert. That said, looking at the execution rate of the four processes in the process of considering taking out insurance by the timing
of when policyholders took out their most recent coverage as shown here and
there in Part 1, for all processes, the more recent the timing of their getting
their policy, the higher the execution rate was in general, indicating that the number of consumers acting on their own initiative in considering taking out
life insurance is growing gradually. [Figure 1-2] This implies that there is a
possibility that there will be more consumers taking all the action described in
the law of AISCEAS going forward, and the traditional sales method in which
the seller takes the initiative may sooner or later become unsustainable as a business. In order to adapt to the changes in consumers, perhaps it is necessary
to gain a deep understanding of consumer action and the mindset behind the
action.
2. The consumer segment and action of considering taking out insurance
In order to provide the information that consumers need at the appropriate
time, according to their financial and insurance literacy, to win contracts while
fostering trust and to maintain and improve the relationship with clients, it
seems that, in addition to the process of considering taking out insurance that
we have already reviewed, it is also essential to classify consumers into
segments from various perspectives and to deepen our understanding of their
mindset and behavioral characteristics. In Part 2, we will classify consumers
into different segments from these perspectives according to several factors
and review the characteristics of the consumers’ mindset and actions in the
distinctive segments.
First, in the following sections, we will focus on the differences that have
40.3
32.8
39.742.9
44.6
52.1
29.3
21.9
30.5
36.332.5
37.7
22.7
13.6
19.4
26.0 28.3
33.8
19.8
10.4
15.2
21.9
27.1
31.1
0
10
20
30
40
50
60
Total(N=4021)
in or before1997
(n=1145)
1998-2002(n=315)
2003-2007(n=604)
2008-2010(n=808)
in or after2011
(n=798)
Considered the necessity of having assurance
Reviewed the contents and/or costs of products
Searched for companies and/or products
Compared companies and/or products
%
Figure 1-2 Action taken when considering getting insurance (by the timing of purchase)
86
developed in the market that is seemingly saturated according to the
penetration rate for households considering the high penetration rate of life
insurance in Japan. Traditionally, the opportunity to receive financial and
economic education has been very limited for many consumers, and it is likely
that their financial and insurance literacy were developed based on the
accumulation of experiences gained through past transactions. This probably
means that consumers considering taking out insurance in such a high
household penetration rate environment have different histories of having
insurance, and they are probably undergoing different consideration processes
according to their history of coverage. Meanwhile, as for the consumers who
do not have life insurance in this high penetration rate market, who are the
minority but do exist, the reason why they do not have insurance and the
characteristics of their attribution seem to vary. These analyses shall help
deepen our understanding of the domestic life insurance market as a whole as
the first step in subdividing life insurance policyholders into categories and
revealing the differences in their consideration process.
In Chapter 2 that follows, we will review in detail the actions of the younger
generation, as well as those in their 30s and 40s in the stage of forming
families based on the segmentation according to the consumers’ demographic
attributions from the perspective that life insurance, in particular death benefits,
is a household asset in essence and closely related to the stages of life.
Together with the analyses made in the preceding chapter, perhaps revealing
the differences between the respective segments through analyses based on the
basic attributions from which it is easy to portray the image of the consumer
will provide valuable information in seeking clues for formulating
communication strategies or developing products.
Furthermore, in Chapter 3, we will focus on the gap among consumers in
terms of life insurance literacy. In Japan, efforts to improve financial literacy
have only just begun, and many consumers are making various decisions
without a sufficient level of literacy on life insurance as well. On the other
hand, with the expansion of the Internet environment, the cost of searching for
information has fallen dramatically for consumers; therefore, even if
consumers took the same action to search for information in the process of
considering taking out insurance, the contents they search for and their level of
understanding would most likely be different depending on their financial and
insurance literacy.
In Chapter 4, we will change the point of view and focus on the two needs of medical coverage and insurance for the aged, which are growing in light of the
aging society, to reveal the differences in the process of considering taking out
insurance by the types of product and also look into the reason why insurance
shops, which have rapidly increased their presence as channels, have become
more diverse in recent years and are popular among consumers. Reviewing the
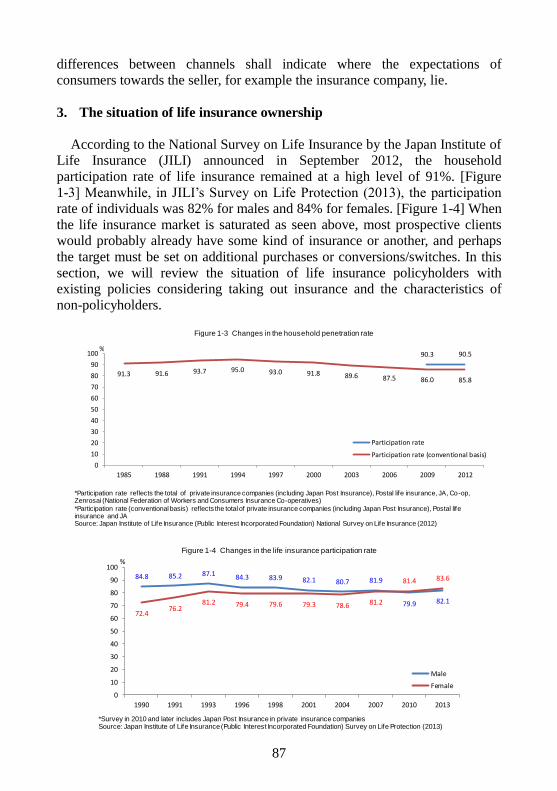
87
differences between channels shall indicate where the expectations of
consumers towards the seller, for example the insurance company, lie.
3. The situation of life insurance ownership
According to the National Survey on Life Insurance by the Japan Institute of
Life Insurance (JILI) announced in September 2012, the household
participation rate of life insurance remained at a high level of 91%. [Figure
1-3] Meanwhile, in JILI’s Survey on Life Protection (2013), the participation
rate of individuals was 82% for males and 84% for females. [Figure 1-4] When
the life insurance market is saturated as seen above, most prospective clients
would probably already have some kind of insurance or another, and perhaps
the target must be set on additional purchases or conversions/switches. In this
section, we will review the situation of life insurance policyholders with
existing policies considering taking out insurance and the characteristics of
non-policyholders.
90.590.3
85.886.087.589.691.893.095.093.791.691.3
0
10
20
30
40
50
60
70
80
90
100
2012200920062003200019971994199119881985
Participation rate
Participation rate (conventional basis)
*Participation rate reflects the total of private insurance companies (including Japan Post Insurance), Postal life insurance, JA, Co-op, Zenrosai (National Federation of Workers and Consumers Insurance Co-operatives)
*Participation rate (conventional basis) reflects the total of private insurance companies (including Japan Post Insurance), Postal life insurance and JASource: Japan Institute of Life Insurance (Public Interest Incorporated Foundation) National Survey on Life Insurance (2012)
%
Figure 1-3 Changes in the household penetration rate
Figure 1-4 Changes in the life insurance participation rate
82.179.9
81.980.782.183.984.387.185.284.8 83.681.4
81.278.679.379.679.481.276.2
72.4
0
10
20
30
40
50
60
70
80
90
100
2013201020072004200119981996199319911990
Male
Female
*Survey in 2010 and later includes Japan Post Insurance in private insurance companiesSource: Japan Institute of Life Insurance(Public Interest Incorporated Foundation) Survey on Life Protection (2013)
%
Figure 1-4 Changes in the life insurance participation rate
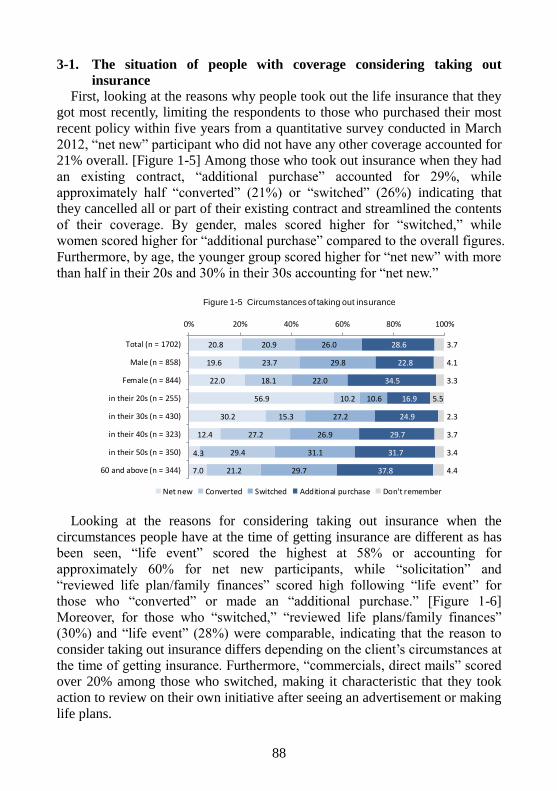
88
3-1. The situation of people with coverage considering taking out
insurance
First, looking at the reasons why people took out the life insurance that they
got most recently, limiting the respondents to those who purchased their most
recent policy within five years from a quantitative survey conducted in March
2012, “net new” participant who did not have any other coverage accounted for
21% overall. [Figure 1-5] Among those who took out insurance when they had
an existing contract, “additional purchase” accounted for 29%, while
approximately half “converted” (21%) or “switched” (26%) indicating that
they cancelled all or part of their existing contract and streamlined the contents
of their coverage. By gender, males scored higher for “switched,” while
women scored higher for “additional purchase” compared to the overall figures.
Furthermore, by age, the younger group scored higher for “net new” with more
than half in their 20s and 30% in their 30s accounting for “net new.”
Looking at the reasons for considering taking out insurance when the
circumstances people have at the time of getting insurance are different as has
been seen, “life event” scored the highest at 58% or accounting for
approximately 60% for net new participants, while “solicitation” and
“reviewed life plan/family finances” scored high following “life event” for
those who “converted” or made an “additional purchase.” [Figure 1-6]
Moreover, for those who “switched,” “reviewed life plans/family finances”
(30%) and “life event” (28%) were comparable, indicating that the reason to
consider taking out insurance differs depending on the client’s circumstances at
the time of getting insurance. Furthermore, “commercials, direct mails” scored
over 20% among those who switched, making it characteristic that they took
action to review on their own initiative after seeing an advertisement or making
life plans.
20.8
19.6
22.0
56.9
30.2
12.4
4.3
7.0
20.9
23.7
18.1
10.2
15.3
27.2
29.4
21.2
26.0
29.8
22.0
10.6
27.2
26.9
31.1
29.7
28.6
22.8
34.5
16.9
24.9
29.7
31.7
37.8
3.7
4.1
3.3
5.5
2.3
3.7
3.4
4.4
0% 20% 40% 60% 80% 100%
Total (n = 1702)
Male (n = 858)
Female (n = 844)
in their 20s (n = 255)
in their 30s (n = 430)
in their 40s (n = 323)
in their 50s (n = 350)
60 and above (n = 344)
Net new Converted Switched Additional purchase Don't remember
Figure 1-5 Circumstances of taking out insurance
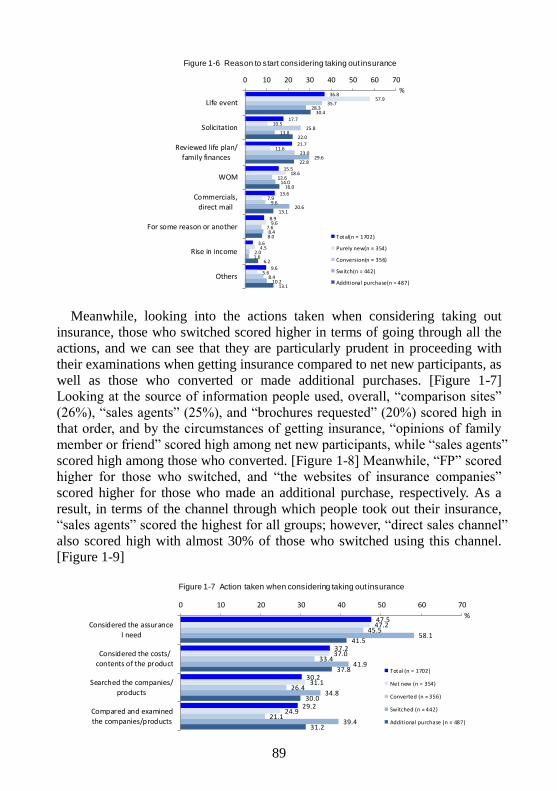
89
Meanwhile, looking into the actions taken when considering taking out
insurance, those who switched scored higher in terms of going through all the
actions, and we can see that they are particularly prudent in proceeding with
their examinations when getting insurance compared to net new participants, as
well as those who converted or made additional purchases. [Figure 1-7]
Looking at the source of information people used, overall, “comparison sites”
(26%), “sales agents” (25%), and “brochures requested” (20%) scored high in
that order, and by the circumstances of getting insurance, “opinions of family
member or friend” scored high among net new participants, while “sales agents”
scored high among those who converted. [Figure 1-8] Meanwhile, “FP” scored
higher for those who switched, and “the websites of insurance companies”
scored higher for those who made an additional purchase, respectively. As a
result, in terms of the channel through which people took out their insurance,
“sales agents” scored the highest for all groups; however, “direct sales channel”
also scored high with almost 30% of those who switched using this channel.
[Figure 1-9]
36.8
17.7
21.7
15.5
13.6
8.9
3.6
9.6
57.9
10.5
11.6
18.6
7.9
9.6
4.5
5.6
35.7
25.8
23.0
12.6
9.6
7.6
2.0
8.4
28.3
13.8
29.6
14.0
20.6
8.4
1.6
10.2
30.4
22.0
22.8
16.0
13.1
8.0
6.2
13.1
0 10 20 30 40 50 60 70
Life event
Solicitation
Reviewed life plan/family finances
WOM
Commercials,direct mail
For some reason or another
Rise in income
Others
Total(n = 1702)
Purely new(n = 354)
Conversion(n = 356)
Switch(n = 442)
Additional purchase(n = 487)
%
Figure 1-6 Reason to start considering taking out insurance
47.5
37.2
30.2
29.2
47.2
37.0
31.1
24.9
45.5
33.4
26.4
21.1
58.1
41.9
34.8
39.4
41.5
37.8
30.0
31.2
0 10 20 30 40 50 60 70
Considered the assuranceI need
Considered the costs/contents of the product
Searched the companies/products
Compared and examinedthe companies/products
Total (n = 1702)
Net new (n = 354)
Converted (n = 356)
Switched (n = 442)
Additional purchase (n = 487)
%
Figure 1-7 Action taken when considering taking out insurance
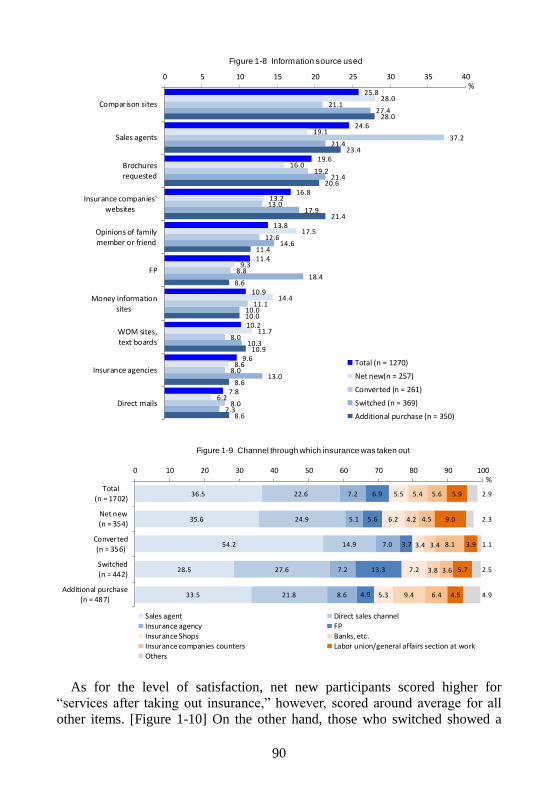
90
As for the level of satisfaction, net new participants scored higher for
“services after taking out insurance,” however, scored around average for all
other items. [Figure 1-10] On the other hand, those who switched showed a
25.8
24.6
19.6
16.8
13.8
11.4
10.9
10.2
9.6
7.8
28.0
19.1
16.0
13.2
17.5
9.3
14.4
11.7
8.6
6.2
21.1
37.2
19.2
13.0
12.6
8.8
11.1
8.0
8.0
8.0
27.4
21.4
21.4
17.9
14.6
18.4
10.0
10.3
13.0
7.3
28.0
23.4
20.6
21.4
11.4
8.6
10.0
10.9
8.6
8.6
0 5 10 15 20 25 30 35 40
Comparison sites
Sales agents
Brochuresrequested
Insurance companies'
websites
Opinions of familymember or friend
FP
Money information
sites
WOM sites,text boards
Insurance agencies
Direct mails
Total (n = 1270)
Net new(n = 257)
Converted (n = 261)
Switched (n = 369)
Additional purchase (n = 350)
%
Figure 1-8 Information source used
36.5
35.6
54.2
28.5
33.5
22.6
24.9
14.9
27.6
21.8
7.2
5.1
7.0
7.2
8.6
6.9
5.6
3.7
13.3
4.9
5.5
6.2
3.4
7.2
5.3
5.4
4.2
3.4
3.8
9.4
5.6
4.5
8.1
3.6
6.4
5.9
9.0
3.9
5.7
4.5
2.9
2.3
1.1
2.5
4.9
0 10 20 30 40 50 60 70 80 90 100
Total
(n = 1702)
Net new(n = 354)
Converted
(n = 356)
Switched(n = 442)
Additional purchase(n = 487)
Sales agent Direct sales channelInsurance agency FPInsurance Shops Banks, etc.Insurance companies counters Labor union/general affairs section at workOthers
%
Figure 1-9 Channel through which insurance was taken out
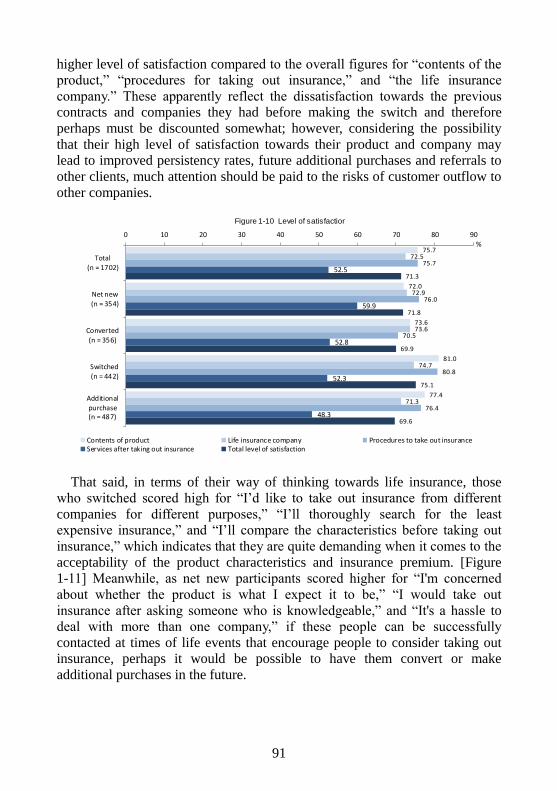
91
higher level of satisfaction compared to the overall figures for “contents of the
product,” “procedures for taking out insurance,” and “the life insurance
company.” These apparently reflect the dissatisfaction towards the previous
contracts and companies they had before making the switch and therefore
perhaps must be discounted somewhat; however, considering the possibility
that their high level of satisfaction towards their product and company may
lead to improved persistency rates, future additional purchases and referrals to
other clients, much attention should be paid to the risks of customer outflow to
other companies.
That said, in terms of their way of thinking towards life insurance, those
who switched scored high for “I’d like to take out insurance from different
companies for different purposes,” “I’ll thoroughly search for the least
expensive insurance,” and “I’ll compare the characteristics before taking out
insurance,” which indicates that they are quite demanding when it comes to the
acceptability of the product characteristics and insurance premium. [Figure
1-11] Meanwhile, as net new participants scored higher for “I'm concerned
about whether the product is what I expect it to be,” “I would take out
insurance after asking someone who is knowledgeable,” and “It's a hassle to
deal with more than one company,” if these people can be successfully
contacted at times of life events that encourage people to consider taking out insurance, perhaps it would be possible to have them convert or make
additional purchases in the future.
75.7
72.0
73.6
81.0
77.4
72.5
72.9
73.6
74.7
71.3
75.7
76.0
70.5
80.8
76.4
52.5
59.9
52.8
52.3
48.3
71.3
71.8
69.9
75.1
69.6
0 10 20 30 40 50 60 70 80 90
Total
(n = 1702)
Net new(n = 354)
Converted(n = 356)
Switched(n = 442)
Additionalpurchase(n = 487)
Contents of product Life insurance company Procedures to take out insuranceServices after taking out insurance Total level of satisfaction
%
Figure 1-10 Level of satisfaction
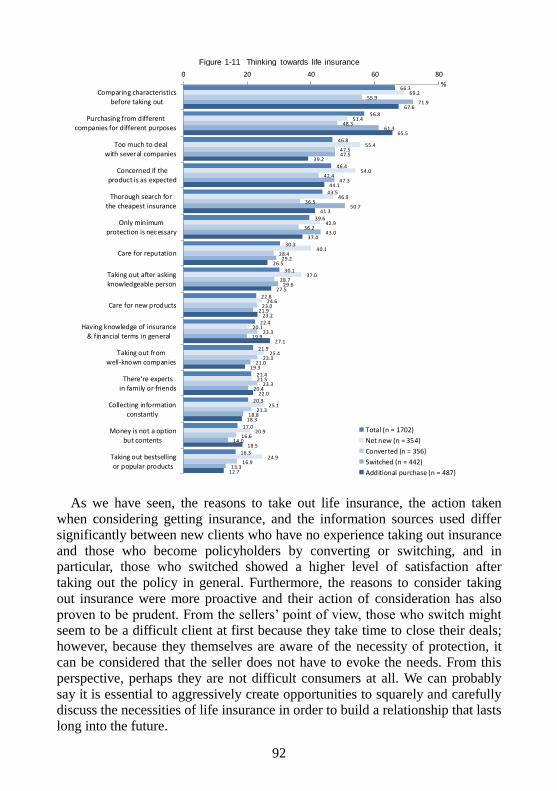
92
As we have seen, the reasons to take out life insurance, the action taken
when considering getting insurance, and the information sources used differ
significantly between new clients who have no experience taking out insurance
and those who become policyholders by converting or switching, and in particular, those who switched showed a higher level of satisfaction after
taking out the policy in general. Furthermore, the reasons to consider taking
out insurance were more proactive and their action of consideration has also
proven to be prudent. From the sellers’ point of view, those who switch might seem to be a difficult client at first because they take time to close their deals;
however, because they themselves are aware of the necessity of protection, it can be considered that the seller does not have to evoke the needs. From this
perspective, perhaps they are not difficult consumers at all. We can probably
say it is essential to aggressively create opportunities to squarely and carefully discuss the necessities of life insurance in order to build a relationship that lasts
long into the future.
66.3
56.8
46.8
46.4
43.5
39.6
30.3
30.1
22.8
22.4
21.9
21.4
20.3
17.0
16.3
69.2
51.4
55.4
54.0
46.9
42.9
40.1
37.0
24.6
20.1
25.4
21.5
25.1
20.9
24.9
55.9
48.3
47.5
42.4
36.5
36.2
28.4
28.7
23.0
23.3
23.3
23.3
21.3
16.6
16.9
71.9
61.3
47.5
47.3
50.7
43.0
29.2
29.6
21.9
19.9
21.0
20.4
18.8
14.0
13.3
67.6
65.5
39.2
44.1
41.3
37.4
26.5
27.5
23.2
27.1
19.3
22.0
18.3
18.5
12.7
0 20 40 60 80
Comparing characteristics
before taking out
Purchasing from differentcompanies for different purposes
Too much to deal
with several companies
Concerned if theproduct is as expected
Thorough search for
the cheapest insurance
Only minimumprotection is necessary
Care for reputation
Taking out after askingknowledgeable person
Care for new products
Having knowledge of insurance& financial terms in general
Taking out from
well-known companies
There're expertsin family or friends
Collecting information
constantly
Money is not a optionbut contents
Taking out bestselling
or popular products
Total (n = 1702)
Net new (n = 354)
Converted (n = 356)
Switched (n = 442)
Additional purchase (n = 487)
%
Figure 1-11 Thinking towards life insurance
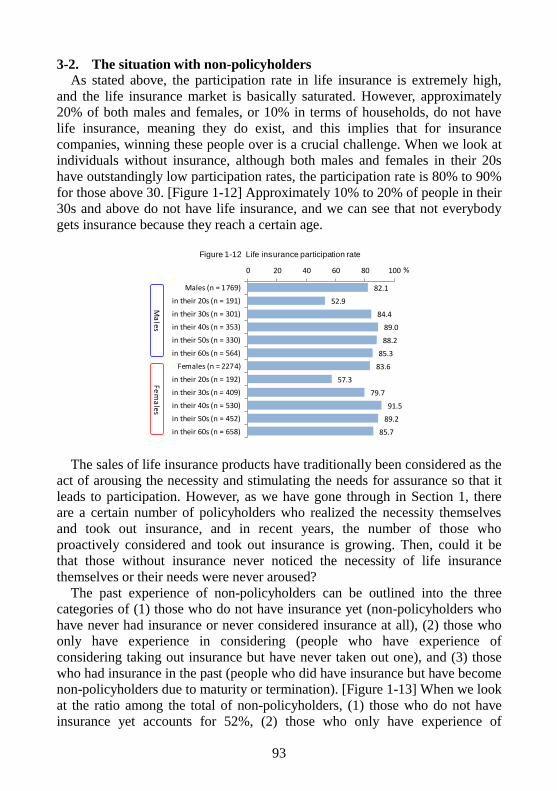
93
3-2. The situation with non-policyholders As stated above, the participation rate in life insurance is extremely high,
and the life insurance market is basically saturated. However, approximately
20% of both males and females, or 10% in terms of households, do not have
life insurance, meaning they do exist, and this implies that for insurance
companies, winning these people over is a crucial challenge. When we look at
individuals without insurance, although both males and females in their 20s
have outstandingly low participation rates, the participation rate is 80% to 90%
for those above 30. [Figure 1-12] Approximately 10% to 20% of people in their
30s and above do not have life insurance, and we can see that not everybody
gets insurance because they reach a certain age.
The sales of life insurance products have traditionally been considered as the
act of arousing the necessity and stimulating the needs for assurance so that it
leads to participation. However, as we have gone through in Section 1, there
are a certain number of policyholders who realized the necessity themselves
and took out insurance, and in recent years, the number of those who
proactively considered and took out insurance is growing. Then, could it be
that those without insurance never noticed the necessity of life insurance
themselves or their needs were never aroused?
The past experience of non-policyholders can be outlined into the three
categories of (1) those who do not have insurance yet (non-policyholders who
have never had insurance or never considered insurance at all), (2) those who
only have experience in considering (people who have experience of
considering taking out insurance but have never taken out one), and (3) those
who had insurance in the past (people who did have insurance but have become
non-policyholders due to maturity or termination). [Figure 1-13] When we look
at the ratio among the total of non-policyholders, (1) those who do not have
insurance yet accounts for 52%, (2) those who only have experience of
82.1
52.9
84.4
89.0
88.2
85.3
83.6
57.3
79.7
91.5
89.2
85.7
0 20 40 60 80 100
Males (n = 1769)
in their 20s (n = 191)
in their 30s (n = 301)
in their 40s (n = 353)
in their 50s (n = 330)
in their 60s (n = 564)
Females (n = 2274)
in their 20s (n = 192)
in their 30s (n = 409)
in their 40s (n = 530)
in their 50s (n = 452)
in their 60s (n = 658)
Ma
lesFe
ma
les
%
Figure 1-12 Life insurance participation rate
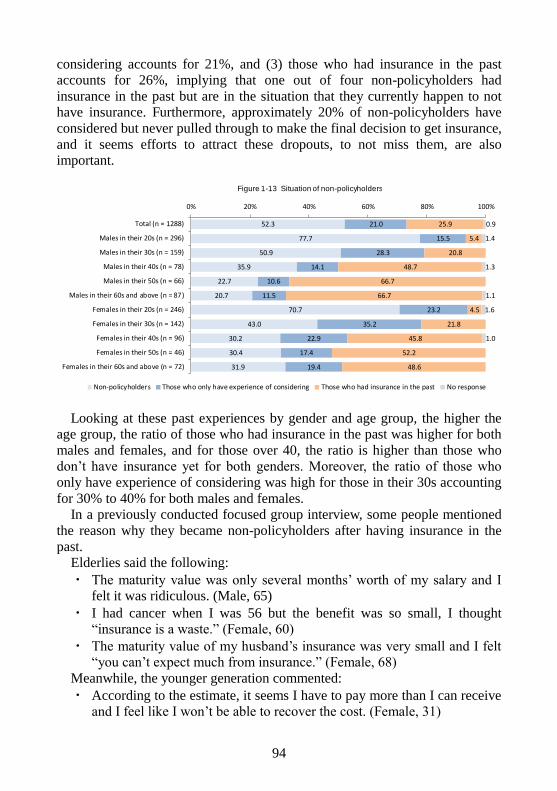
94
considering accounts for 21%, and (3) those who had insurance in the past
accounts for 26%, implying that one out of four non-policyholders had
insurance in the past but are in the situation that they currently happen to not
have insurance. Furthermore, approximately 20% of non-policyholders have
considered but never pulled through to make the final decision to get insurance,
and it seems efforts to attract these dropouts, to not miss them, are also
important.
Looking at these past experiences by gender and age group, the higher the
age group, the ratio of those who had insurance in the past was higher for both
males and females, and for those over 40, the ratio is higher than those who
don’t have insurance yet for both genders. Moreover, the ratio of those who
only have experience of considering was high for those in their 30s accounting
for 30% to 40% for both males and females.
In a previously conducted focused group interview, some people mentioned
the reason why they became non-policyholders after having insurance in the
past.
Elderlies said the following:
・ The maturity value was only several months’ worth of my salary and I
felt it was ridiculous. (Male, 65)
・ I had cancer when I was 56 but the benefit was so small, I thought
“insurance is a waste.” (Female, 60)
・ The maturity value of my husband’s insurance was very small and I felt “you can’t expect much from insurance.” (Female, 68)
Meanwhile, the younger generation commented:
・ According to the estimate, it seems I have to pay more than I can receive
and I feel like I won’t be able to recover the cost. (Female, 31)
52.3
77.7
50.9
35.9
22.7
20.7
70.7
43.0
30.2
30.4
31.9
21.0
15.5
28.3
14.1
10.6
11.5
23.2
35.2
22.9
17.4
19.4
25.9
5.4
20.8
48.7
66.7
66.7
4.5
21.8
45.8
52.2
48.6
0.9
1.4
1.3
1.1
1.6
1.0
0% 20% 40% 60% 80% 100%
Total (n = 1288)
Males in their 20s (n = 296)
Males in their 30s (n = 159)
Males in their 40s (n = 78)
Males in their 50s (n = 66)
Males in their 60s and above (n = 87)
Females in their 20s (n = 246)
Females in their 30s (n = 142)
Females in their 40s (n = 96)
Females in their 50s (n = 46)
Females in their 60s and above (n = 72)
Non-policyholders Those who only have experience of considering Those who had insurance in the past No response
Figure 1-13 Situation of non-policyholders
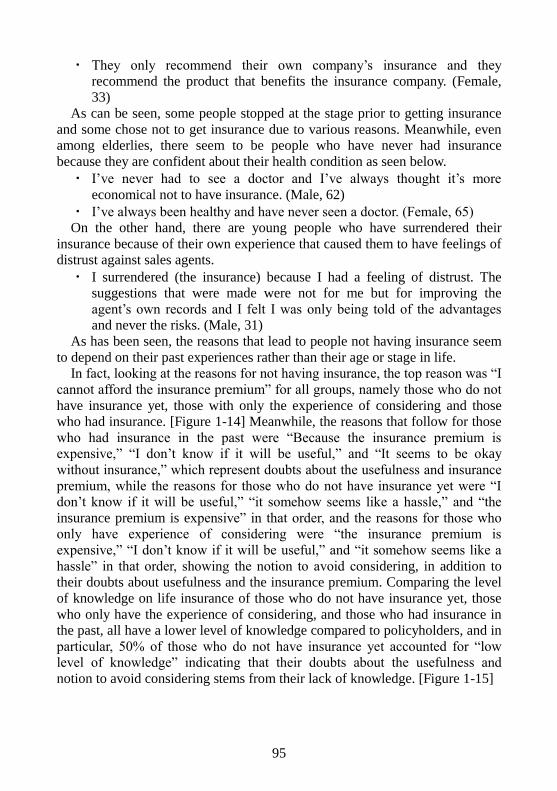
95
・ They only recommend their own company’s insurance and they
recommend the product that benefits the insurance company. (Female,
33)
As can be seen, some people stopped at the stage prior to getting insurance
and some chose not to get insurance due to various reasons. Meanwhile, even
among elderlies, there seem to be people who have never had insurance
because they are confident about their health condition as seen below.
・ I’ve never had to see a doctor and I’ve always thought it’s more
economical not to have insurance. (Male, 62)
・ I’ve always been healthy and have never seen a doctor. (Female, 65)
On the other hand, there are young people who have surrendered their
insurance because of their own experience that caused them to have feelings of
distrust against sales agents.
・ I surrendered (the insurance) because I had a feeling of distrust. The
suggestions that were made were not for me but for improving the
agent’s own records and I felt I was only being told of the advantages
and never the risks. (Male, 31)
As has been seen, the reasons that lead to people not having insurance seem
to depend on their past experiences rather than their age or stage in life.
In fact, looking at the reasons for not having insurance, the top reason was “I
cannot afford the insurance premium” for all groups, namely those who do not
have insurance yet, those with only the experience of considering and those
who had insurance. [Figure 1-14] Meanwhile, the reasons that follow for those
who had insurance in the past were “Because the insurance premium is
expensive,” “I don’t know if it will be useful,” and “It seems to be okay
without insurance,” which represent doubts about the usefulness and insurance
premium, while the reasons for those who do not have insurance yet were “I
don’t know if it will be useful,” “it somehow seems like a hassle,” and “the
insurance premium is expensive” in that order, and the reasons for those who
only have experience of considering were “the insurance premium is
expensive,” “I don’t know if it will be useful,” and “it somehow seems like a
hassle” in that order, showing the notion to avoid considering, in addition to
their doubts about usefulness and the insurance premium. Comparing the level
of knowledge on life insurance of those who do not have insurance yet, those
who only have the experience of considering, and those who had insurance in
the past, all have a lower level of knowledge compared to policyholders, and in
particular, 50% of those who do not have insurance yet accounted for “low level of knowledge” indicating that their doubts about the usefulness and
notion to avoid considering stems from their lack of knowledge. [Figure 1-15]
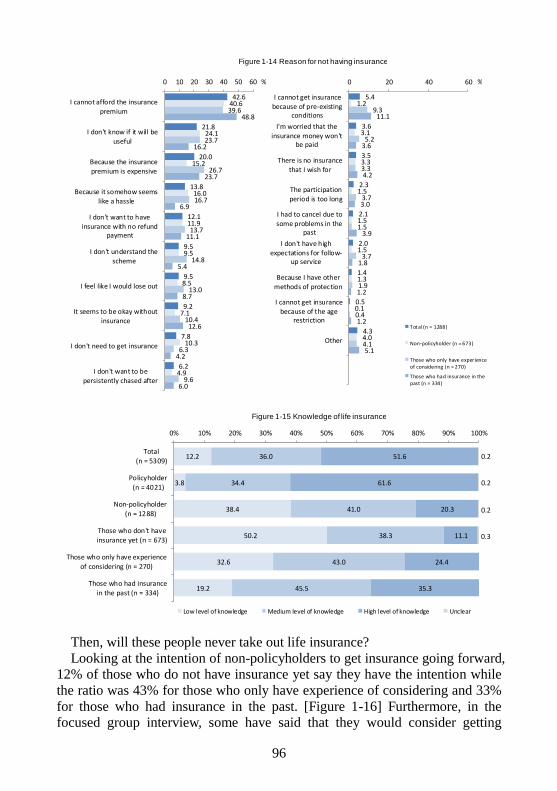
96
Then, will these people never take out life insurance?
Looking at the intention of non-policyholders to get insurance going forward,
12% of those who do not have insurance yet say they have the intention while
the ratio was 43% for those who only have experience of considering and 33%
for those who had insurance in the past. [Figure 1-16] Furthermore, in the
focused group interview, some have said that they would consider getting
42.6
21.8
20.0
13.8
12.1
9.5
9.5
9.2
7.8
6.2
40.6
24.1
15.2
16.0
11.9
9.5
8.5
7.1
10.3
4.9
39.6
23.7
26.7
16.7
13.7
14.8
13.0
10.4
6.3
9.6
48.8
16.2
23.7
6.9
11.1
5.4
8.7
12.6
4.2
6.0
0 10 20 30 40 50 60
I cannot afford the insurance
premium
I don't know if it will beuseful
Because the insurancepremium is expensive
Because it somehow seems
like a hassle
I don't want to have
insurance with no refundpayment
I don't understand thescheme
I feel like I would lose out
It seems to be okay withoutinsurance
I don't need to get insurance
I don't want to be
persistently chased after
%
5.4
3.6
3.5
2.3
2.1
2.0
1.4
0.5
4.3
1.2
3.1
3.3
1.5
1.5
1.5
1.3
0.1
4.0
9.3
5.2
3.3
3.7
1.5
3.7
1.9
0.4
4.1
11.1
3.6
4.2
3.0
3.9
1.8
1.2
1.2
5.1
0 20 40 60
I cannot get insurancebecause of pre-existing
conditions
I'm worried that the
insurance money won'tbe paid
There is no insurancethat I wish for
The participation
period is too long
I had to cancel due to
some problems in thepast
I don't have highexpectations for follow-
up service
Because I have other
methods of protection
I cannot get insurancebecause of the age
restriction
Other
Total (n = 1288)
Non-policyholder (n = 673)
Those who only have experienceof considering (n = 270)
Those who had insurance in thepast (n = 334)
%
Figure 1-14 Reason for not having insurance
12.2
3.8
38.4
50.2
32.6
19.2
36.0
34.4
41.0
38.3
43.0
45.5
51.6
61.6
20.3
11.1
24.4
35.3
0.2
0.2
0.2
0.3
0% 10% 20% 30% 40% 50% 60% 70% 80% 90% 100%
Total(n = 5309)
Policyholder
(n = 4021)
Non-policyholder(n = 1288)
Those who don't haveinsurance yet (n = 673)
Those who only have experience
of considering (n = 270)
Those who had insurancein the past (n = 334)
Low level of knowledge Medium level of knowledge High level of knowledge Unclear
Figure 1-15 Knowledge of life insurance

97
insurance because of concerns about their health condition.
・ When I donated blood, I was told they cannot use my blood because the
test results showed some problematic figures related to my liver function
and I felt I’ve reached that kind of age. (Male, 31)
・ A friend who is a university student is in the hospital and I was told that I
should better get insurance while I’m healthy because once you’re in that
kind of situation, you can’t get medical insurance anymore. I drink quite
a lot so I’m worried about my liver. (Female, 31)
Furthermore, some people start considering getting insurance when someone
close becomes ill.
・ Recently, a colleague of mine was hospitalized for uterine fibroid and
hernia. (Female, 33)
・ A friend was hospitalized. (Female, 33)
On the other hand, among those who had insurance in the past, some
commented that although they want to get insurance, they cannot because of
health reasons.
・ The insurance I had matured and at my age, I basically cannot get
insurance at all. (Male, 68)
As we saw in Part 1, the major reasons for policyholders to begin
considering getting insurance were life events and reviewing of life plans and
family finances. Similarly for non-policyholders, it seems that their life events,
life plans, and experiences of people close to them seem to be factors that make
them conscious of having insurance. As mentioned above, even if
non-policyholders start thinking of taking out life insurance, there is a high
possibility that their low level of knowledge would make them hesitant about getting coverage. In fact, looking at the reasons for not having insurance of
those who do want to get coverage, “I don’t understand the scheme so well”
scored the highest at 40%, followed by “the insurance premium is expensive”
(27%), and “I don’t need to get insurance” (26%) in that order. [Figure 1-17]
Looking at the results by their past experience, more than half of those who
23.9
12.3
42.6
32.9
76.1
87.7
57.4
67.1
0% 10% 20% 30% 40% 50% 60% 70% 80% 90% 100%
Total
(n = 1288)
Those who don't have
insurance yet (n = 673)
Those who only have experienceof considering (n = 270)
Those who had insurancein the past (n = 334)
Wants to get insurance No intention of getting insurance
Figure 1-16 Intention of getting insurance going forward
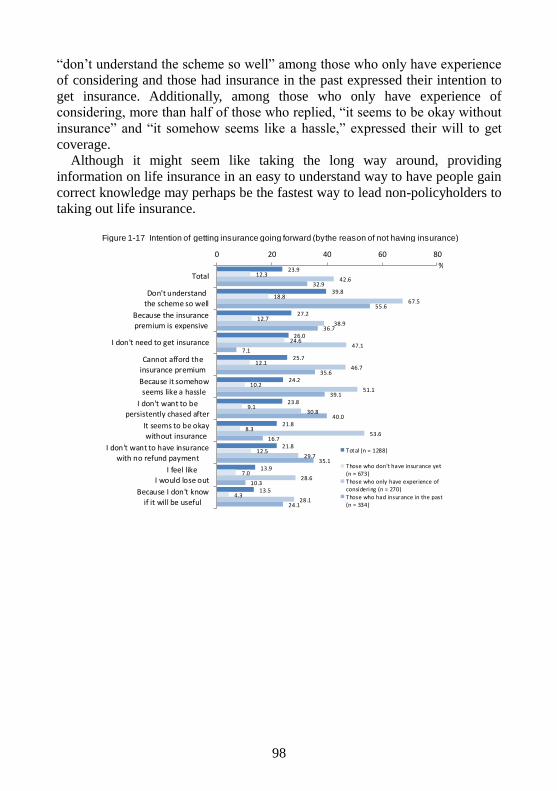
98
“don’t understand the scheme so well” among those who only have experience
of considering and those had insurance in the past expressed their intention to
get insurance. Additionally, among those who only have experience of
considering, more than half of those who replied, “it seems to be okay without
insurance” and “it somehow seems like a hassle,” expressed their will to get
coverage.
Although it might seem like taking the long way around, providing
information on life insurance in an easy to understand way to have people gain
correct knowledge may perhaps be the fastest way to lead non-policyholders to
taking out life insurance.
23.9
39.8
27.2
26.0
25.7
24.2
23.8
21.8
21.8
13.9
13.5
12.3
18.8
12.7
24.6
12.1
10.2
9.1
8.3
12.5
7.0
4.3
42.6
67.5
38.9
47.1
46.7
51.1
30.8
53.6
29.7
28.6
28.1
32.9
55.6
36.7
7.1
35.6
39.1
40.0
16.7
35.1
10.3
24.1
0 20 40 60 80
Total
Don't understandthe scheme so well
Because the insurancepremium is expensive
I don't need to get insurance
Cannot afford the
insurance premium
Because it somehow
seems like a hassle
I don't want to be
persistently chased after
It seems to be okaywithout insurance
I don't want to have insurancewith no refund payment
I feel likeI would lose out
Because I don't know
if it will be useful
Total (n = 1288)
Those who don't have insurance yet(n = 673)
Those who only have experience ofconsidering (n = 270)
Those who had insurance in the past(n = 334)
%
Figure 1-17 Intention of getting insurance going forward (by the reason of not having insurance)
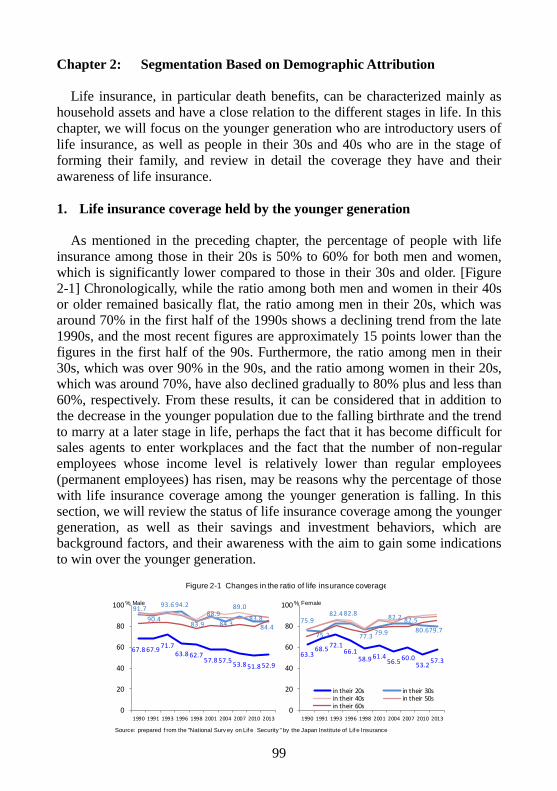
99
Chapter 2: Segmentation Based on Demographic Attribution
Life insurance, in particular death benefits, can be characterized mainly as
household assets and have a close relation to the different stages in life. In this
chapter, we will focus on the younger generation who are introductory users of
life insurance, as well as people in their 30s and 40s who are in the stage of
forming their family, and review in detail the coverage they have and their
awareness of life insurance.
1. Life insurance coverage held by the younger generation
As mentioned in the preceding chapter, the percentage of people with life
insurance among those in their 20s is 50% to 60% for both men and women,
which is significantly lower compared to those in their 30s and older. [Figure
2-1] Chronologically, while the ratio among both men and women in their 40s or older remained basically flat, the ratio among men in their 20s, which was
around 70% in the first half of the 1990s shows a declining trend from the late
1990s, and the most recent figures are approximately 15 points lower than the
figures in the first half of the 90s. Furthermore, the ratio among men in their
30s, which was over 90% in the 90s, and the ratio among women in their 20s, which was around 70%, have also declined gradually to 80% plus and less than
60%, respectively. From these results, it can be considered that in addition to
the decrease in the younger population due to the falling birthrate and the trend
to marry at a later stage in life, perhaps the fact that it has become difficult for sales agents to enter workplaces and the fact that the number of non-regular
employees whose income level is relatively lower than regular employees
(permanent employees) has risen, may be reasons why the percentage of those
with life insurance coverage among the younger generation is falling. In this
section, we will review the status of life insurance coverage among the younger generation, as well as their savings and investment behaviors, which are
background factors, and their awareness with the aim to gain some indications
to win over the younger generation.
Figure 2-1 Changes in the ratio of life insurance coverage
52.951.853.857.557.8
62.763.871.7
67.967.8
84.483.8
89.0
84.3
88.9
83.9
94.293.6
90.4
91.7
0
20
40
60
80
100
2013201020072004200119981996199319911990
% Male
57.353.2
60.056.5
61.458.966.1
72.168.5
63.3
79.780.6
82.582.2
79.977.3
82.882.4
75.2
75.9
0
20
40
60
80
100
2013201020072004200119981996199319911990
in their 20s in their 30sin their 40s in their 50sin their 60s
% Female
Source: prepared f rom the "National Surv ey on Lif e Security " by the Japan Institute of Lif e Insurance
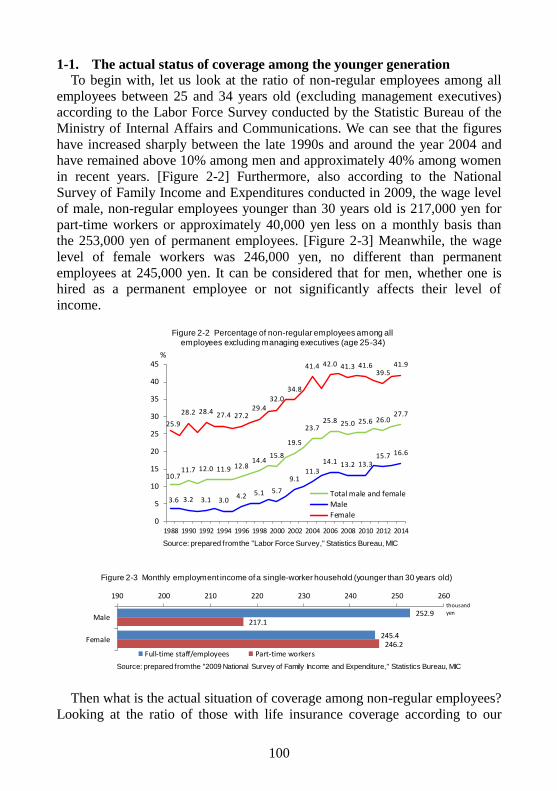
100
1-1. The actual status of coverage among the younger generation To begin with, let us look at the ratio of non-regular employees among all
employees between 25 and 34 years old (excluding management executives)
according to the Labor Force Survey conducted by the Statistic Bureau of the
Ministry of Internal Affairs and Communications. We can see that the figures
have increased sharply between the late 1990s and around the year 2004 and
have remained above 10% among men and approximately 40% among women
in recent years. [Figure 2-2] Furthermore, also according to the National
Survey of Family Income and Expenditures conducted in 2009, the wage level
of male, non-regular employees younger than 30 years old is 217,000 yen for
part-time workers or approximately 40,000 yen less on a monthly basis than
the 253,000 yen of permanent employees. [Figure 2-3] Meanwhile, the wage
level of female workers was 246,000 yen, no different than permanent
employees at 245,000 yen. It can be considered that for men, whether one is
hired as a permanent employee or not significantly affects their level of
income.
Then what is the actual situation of coverage among non-regular employees?
Looking at the ratio of those with life insurance coverage according to our
10.711.7 12.0 11.9 12.8
14.415.8
19.5
23.725.8 25.0 25.6 26.0
27.7
3.6 3.2 3.1 3.04.2 5.1 5.7
9.111.3
14.1 13.2 13.315.7 16.6
25.9
28.2 28.4 27.4 27.229.4
32.0
34.8
41.4 42.0 41.3 41.639.5
41.9
0
5
10
15
20
25
30
35
40
45
1988 1990 1992 1994 1996 1998 2000 2002 2004 2006 2008 2010 2012 2014
Total male and female
Male
Female
Source: prepared from the "Labor Force Survey," Statistics Bureau, MIC
%
Figure 2-2 Percentage of non-regular employees among all employees excluding managing executives (age 25-34)
252.9
245.4
217.1
246.2
190 200 210 220 230 240 250 260
Male
Female
Full-time staff/employees Part-time workers
Source: prepared from the "2009 National Survey of Family Income and Expenditure," Statistics Bureau, MIC
thousandyen
Figure 2-3 Monthly employment income of a single-worker household (younger than 30 years old)
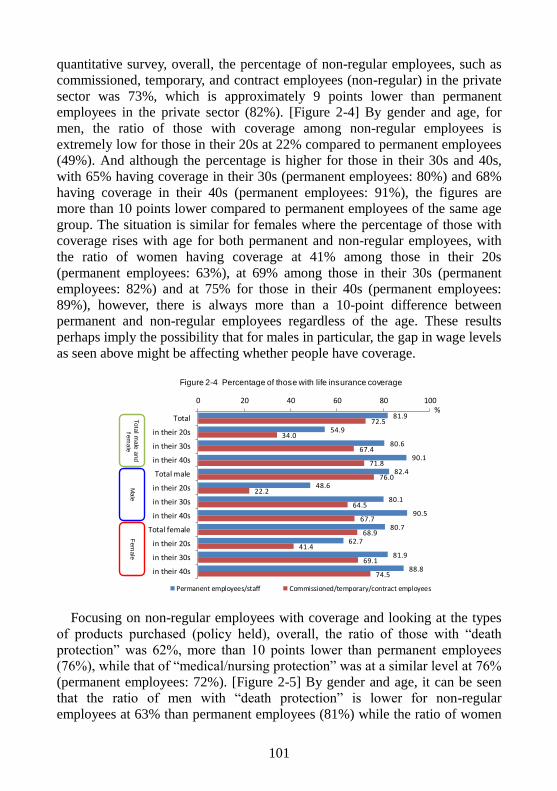
101
quantitative survey, overall, the percentage of non-regular employees, such as
commissioned, temporary, and contract employees (non-regular) in the private
sector was 73%, which is approximately 9 points lower than permanent
employees in the private sector (82%). [Figure 2-4] By gender and age, for
men, the ratio of those with coverage among non-regular employees is
extremely low for those in their 20s at 22% compared to permanent employees
(49%). And although the percentage is higher for those in their 30s and 40s,
with 65% having coverage in their 30s (permanent employees: 80%) and 68%
having coverage in their 40s (permanent employees: 91%), the figures are
more than 10 points lower compared to permanent employees of the same age
group. The situation is similar for females where the percentage of those with
coverage rises with age for both permanent and non-regular employees, with
the ratio of women having coverage at 41% among those in their 20s
(permanent employees: 63%), at 69% among those in their 30s (permanent
employees: 82%) and at 75% for those in their 40s (permanent employees:
89%), however, there is always more than a 10-point difference between
permanent and non-regular employees regardless of the age. These results
perhaps imply the possibility that for males in particular, the gap in wage levels
as seen above might be affecting whether people have coverage.
Focusing on non-regular employees with coverage and looking at the types
of products purchased (policy held), overall, the ratio of those with “death
protection” was 62%, more than 10 points lower than permanent employees (76%), while that of “medical/nursing protection” was at a similar level at 76%
(permanent employees: 72%). [Figure 2-5] By gender and age, it can be seen
that the ratio of men with “death protection” is lower for non-regular
employees at 63% than permanent employees (81%) while the ratio of women
81.9
54.9
80.6
90.1
82.4
48.6
80.1
90.5
80.7
62.7
81.9
88.8
72.5
34.0
67.4
71.8
76.0
22.2
64.5
67.7
68.9
41.4
69.1
74.5
0 20 40 60 80 100
Total
in their 20s
in their 30s
in their 40s
Total male
in their 20s
in their 30s
in their 40s
Total female
in their 20s
in their 30s
in their 40s
Permanent employees/staff Commissioned/temporary/contract employees
To
tal m
ale
an
d
fem
ale
Ma
leF
em
ale
%
Figure 2-4 Percentage of those with life insurance coverage

102
with “annuity insurance” is 9 points lower for non-regular employees at 20%
compared to permanent employees (29%). Furthermore, for females in their
40s, the percentage of non-regular employees with “medical/nursing” was 77%
or more than 10 points higher than that of permanent employees (64%) while
the percentage of non-regular employees with “annuity insurance” was 20%,
which was significantly below that of permanent employees (37%).
Turning our eyes to the annual insurance premium paid, overall, non-regular
employees paid 167,000 yen, or approximately 50,000 yen less compared to
the 219,000 yen paid by permanent employees. [Figure 2-6] By gender and age,
there is not much difference other than the 100,000 yen difference for those in
their 30s for males (permanent employees: 194,000 yen/non-regular
employees: 94,000 yen) and the 72,000 yen difference for those in their 40s for
females (permanent employees 208,000 yen/non-regular employees 135,000
yen).
75.8
81.3
69.0
71.4
74.8
50.0
65.0
61.9
77.0
91.7
71.1
77.1
62.1
50.0
58.6
64.3
63.0
75.0
70.0
57.1
61.1
41.7
52.6
68.6
20.8
18.8
13.8
23.2
22.0
0.0
10.0
28.6
19.5
25.0
15.8
20.0
21.7
0.0
22.4
28.6
21.3
0.0
20.0
23.8
22.1
0.0
23.7
31.4
0 20 40 60 80 100
(N=240)
(n=16)
(n=58)
(n=56)
(n=127)
(n=4)
(n=20)
(n=21)
(n=113)
(n=12)
(n=38)
(n=35)
Annuity insurance Savings
%
Commissioned/temporary/contract employee
男女計
男性
女性
72.2
70.3
73.5
67.9
72.3
69.0
73.1
69.1
71.9
71.6
74.3
64.2
75.5
60.0
71.9
78.4
80.7
67.6
77.1
80.9
62.0
52.7
60.7
70.5
28.6
17.9
24.5
36.1
28.4
15.5
25.9
35.9
28.9
20.3
21.4
36.8
27.5
19.3
30.4
33.1
27.8
19.7
30.2
34.5
26.8
18.9
30.7
28.4
0 20 40 60 80 100
Total(n = 1365)
in their 20s(n = 145)
in their 30s
(n = 441)
in their 40s(n = 399)
Total male
(n = 981)
in their 20s(n = 71)
in their 30s
(n = 301)
in their 40s(n = 304)
Total female
(n = 384)
in their 20s(n = 74)
in their 30s(n=140)
in their 40s(n = 95)
Medical/nursing Death protection
%
Permanent employee/staff
To
tal m
ale
an
d fe
ma
leM
ale
Fe
ma
le
Figure 2-5 Coverage by type of insurance
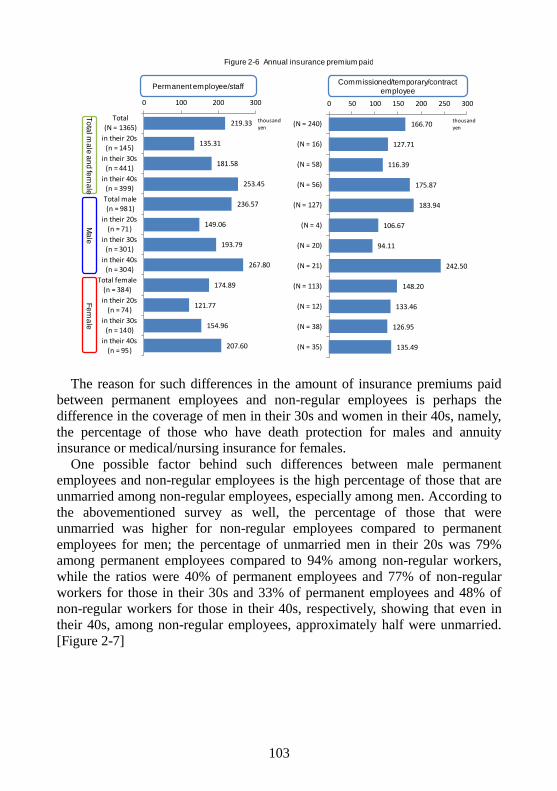
103
The reason for such differences in the amount of insurance premiums paid
between permanent employees and non-regular employees is perhaps the
difference in the coverage of men in their 30s and women in their 40s, namely,
the percentage of those who have death protection for males and annuity
insurance or medical/nursing insurance for females.
One possible factor behind such differences between male permanent
employees and non-regular employees is the high percentage of those that are
unmarried among non-regular employees, especially among men. According to
the abovementioned survey as well, the percentage of those that were
unmarried was higher for non-regular employees compared to permanent
employees for men; the percentage of unmarried men in their 20s was 79%
among permanent employees compared to 94% among non-regular workers,
while the ratios were 40% of permanent employees and 77% of non-regular
workers for those in their 30s and 33% of permanent employees and 48% of
non-regular workers for those in their 40s, respectively, showing that even in
their 40s, among non-regular employees, approximately half were unmarried.
[Figure 2-7]
166.70
127.71
116.39
175.87
183.94
106.67
94.11
242.50
148.20
133.46
126.95
135.49
0 50 100 150 200 250 300
(N = 240)
(N = 16)
(N = 58)
(N = 56)
(N = 127)
(N = 4)
(N = 20)
(N = 21)
(N = 113)
(N = 12)
(N = 38)
(N = 35)
thousandyen
男女計
男性
女性
219.33
135.31
181.58
253.45
236.57
149.06
193.79
267.80
174.89
121.77
154.96
207.60
0 100 200 300
Total(N = 1365)
in their 20s(n = 145)
in their 30s(n = 441)
in their 40s(n = 399)
Total male
(n = 981)
in their 20s
(n = 71)
in their 30s(n = 301)
in their 40s(n = 304)
Total female(n = 384)
in their 20s(n = 74)
in their 30s(n = 140)
in their 40s
(n = 95)
thousandyen
To
tal m
ale
an
d fe
ma
leM
ale
Fe
ma
le
Permanent employee/staffCommissioned/temporary/contract
employee
Figure 2-6 Annual insurance premium paid
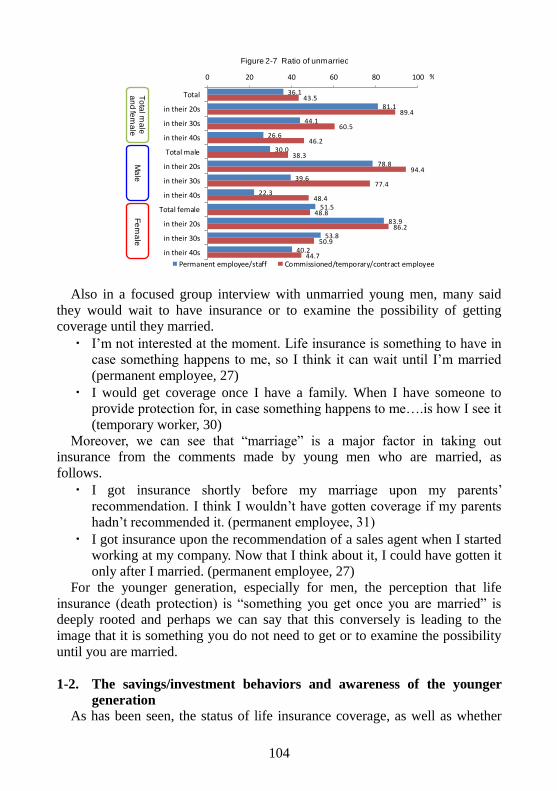
104
Also in a focused group interview with unmarried young men, many said
they would wait to have insurance or to examine the possibility of getting
coverage until they married.
・ I’m not interested at the moment. Life insurance is something to have in
case something happens to me, so I think it can wait until I’m married
(permanent employee, 27)
・ I would get coverage once I have a family. When I have someone to
provide protection for, in case something happens to me….is how I see it
(temporary worker, 30)
Moreover, we can see that “marriage” is a major factor in taking out
insurance from the comments made by young men who are married, as
follows.
・ I got insurance shortly before my marriage upon my parents’
recommendation. I think I wouldn’t have gotten coverage if my parents
hadn’t recommended it. (permanent employee, 31)
・ I got insurance upon the recommendation of a sales agent when I started
working at my company. Now that I think about it, I could have gotten it
only after I married. (permanent employee, 27)
For the younger generation, especially for men, the perception that life
insurance (death protection) is “something you get once you are married” is
deeply rooted and perhaps we can say that this conversely is leading to the
image that it is something you do not need to get or to examine the possibility
until you are married.
1-2. The savings/investment behaviors and awareness of the younger
generation
As has been seen, the status of life insurance coverage, as well as whether
36.1
81.1
44.1
26.6
30.0
78.8
39.6
22.3
51.5
83.9
53.8
40.2
43.5
89.4
60.5
46.2
38.3
94.4
77.4
48.4
48.8
86.2
50.9
44.7
0 20 40 60 80 100
Total
in their 20s
in their 30s
in their 40s
Total male
in their 20s
in their 30s
in their 40s
Total female
in their 20s
in their 30s
in their 40s
Permanent employee/staff Commissioned/temporary/contract employee
To
tal m
ale
a
nd
fem
ale
Ma
leF
em
ale
%
Figure 2-7 Ratio of unmarried
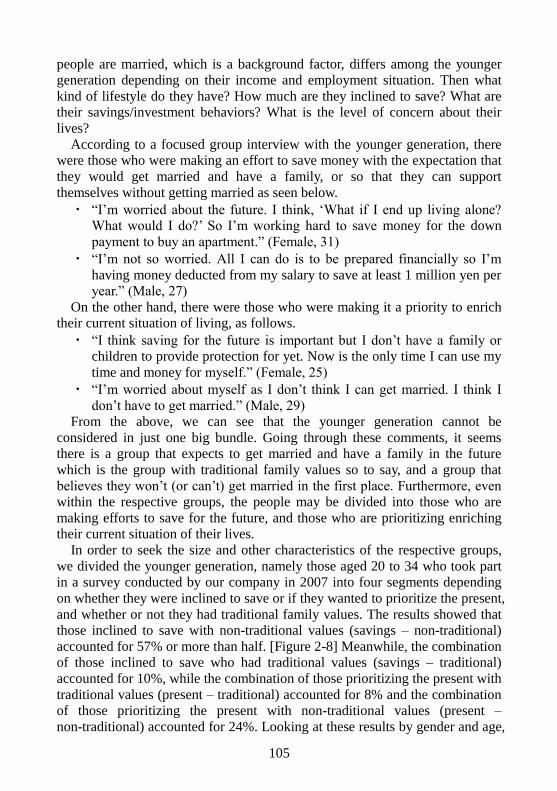
105
people are married, which is a background factor, differs among the younger
generation depending on their income and employment situation. Then what
kind of lifestyle do they have? How much are they inclined to save? What are
their savings/investment behaviors? What is the level of concern about their
lives?
According to a focused group interview with the younger generation, there
were those who were making an effort to save money with the expectation that
they would get married and have a family, or so that they can support
themselves without getting married as seen below.
・ “I’m worried about the future. I think, ‘What if I end up living alone?
What would I do?’ So I’m working hard to save money for the down
payment to buy an apartment.” (Female, 31)
・ “I’m not so worried. All I can do is to be prepared financially so I’m
having money deducted from my salary to save at least 1 million yen per
year.” (Male, 27)
On the other hand, there were those who were making it a priority to enrich
their current situation of living, as follows.
・ “I think saving for the future is important but I don’t have a family or
children to provide protection for yet. Now is the only time I can use my
time and money for myself.” (Female, 25)
・ “I’m worried about myself as I don’t think I can get married. I think I
don’t have to get married.” (Male, 29)
From the above, we can see that the younger generation cannot be
considered in just one big bundle. Going through these comments, it seems
there is a group that expects to get married and have a family in the future
which is the group with traditional family values so to say, and a group that
believes they won’t (or can’t) get married in the first place. Furthermore, even
within the respective groups, the people may be divided into those who are
making efforts to save for the future, and those who are prioritizing enriching
their current situation of their lives.
In order to seek the size and other characteristics of the respective groups,
we divided the younger generation, namely those aged 20 to 34 who took part
in a survey conducted by our company in 2007 into four segments depending
on whether they were inclined to save or if they wanted to prioritize the present,
and whether or not they had traditional family values. The results showed that
those inclined to save with non-traditional values (savings – non-traditional)
accounted for 57% or more than half. [Figure 2-8] Meanwhile, the combination of those inclined to save who had traditional values (savings – traditional)
accounted for 10%, while the combination of those prioritizing the present with
traditional values (present – traditional) accounted for 8% and the combination
of those prioritizing the present with non-traditional values (present –
non-traditional) accounted for 24%. Looking at these results by gender and age,
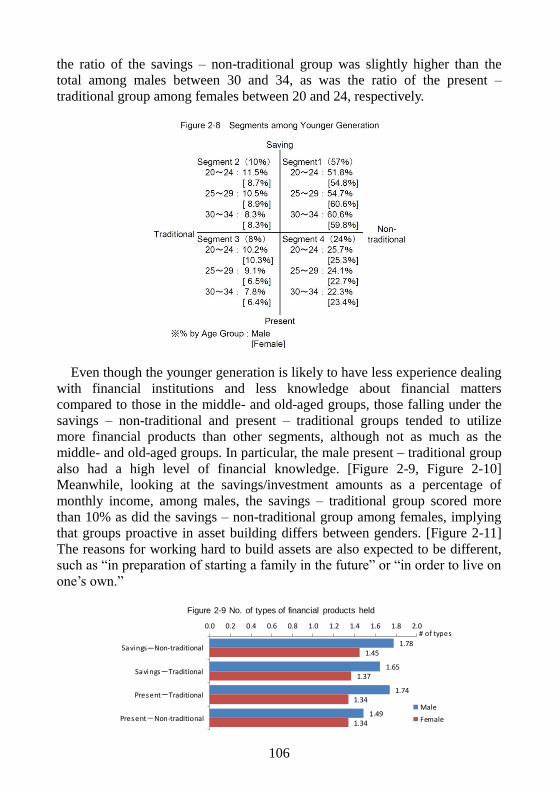
106
the ratio of the savings – non-traditional group was slightly higher than the
total among males between 30 and 34, as was the ratio of the present –
traditional group among females between 20 and 24, respectively.
Even though the younger generation is likely to have less experience dealing
with financial institutions and less knowledge about financial matters
compared to those in the middle- and old-aged groups, those falling under the
savings – non-traditional and present – traditional groups tended to utilize
more financial products than other segments, although not as much as the
middle- and old-aged groups. In particular, the male present – traditional group
also had a high level of financial knowledge. [Figure 2-9, Figure 2-10]
Meanwhile, looking at the savings/investment amounts as a percentage of
monthly income, among males, the savings – traditional group scored more
than 10% as did the savings – non-traditional group among females, implying
that groups proactive in asset building differs between genders. [Figure 2-11]
The reasons for working hard to build assets are also expected to be different,
such as “in preparation of starting a family in the future” or “in order to live on
one’s own.”
1.78
1.65
1.74
1.49
1.45
1.37
1.34
1.34
0.0 0.2 0.4 0.6 0.8 1.0 1.2 1.4 1.6 1.8 2.0
Savings―Non-traditional
Savings-Traditional
Present-Traditional
Present-Non-traditional
Male
Female
# of types
Figure 2-9 No. of types of financial products held
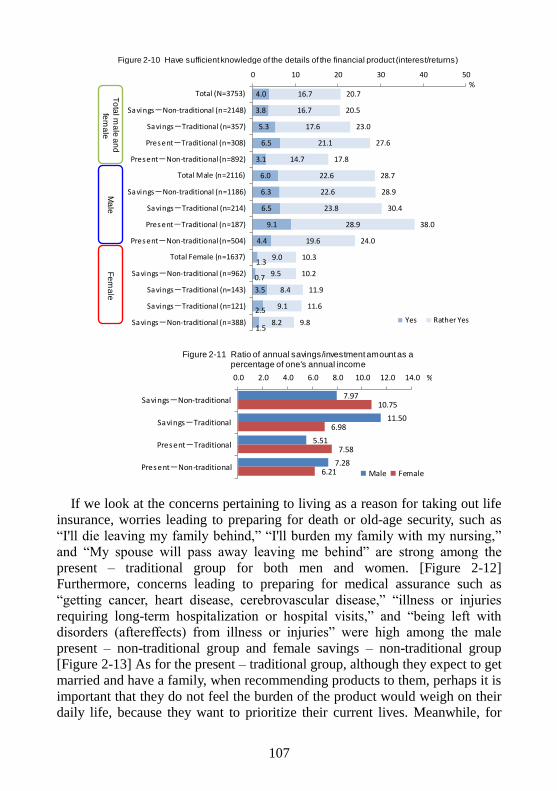
107
If we look at the concerns pertaining to living as a reason for taking out life
insurance, worries leading to preparing for death or old-age security, such as
“I'll die leaving my family behind,” “I'll burden my family with my nursing,”
and “My spouse will pass away leaving me behind” are strong among the
present – traditional group for both men and women. [Figure 2-12]
Furthermore, concerns leading to preparing for medical assurance such as
“getting cancer, heart disease, cerebrovascular disease,” “illness or injuries
requiring long-term hospitalization or hospital visits,” and “being left with
disorders (aftereffects) from illness or injuries” were high among the male
present – non-traditional group and female savings – non-traditional group [Figure 2-13] As for the present – traditional group, although they expect to get
married and have a family, when recommending products to them, perhaps it is
important that they do not feel the burden of the product would weigh on their
daily life, because they want to prioritize their current lives. Meanwhile, for
4.0
3.8
5.3
6.5
3.1
6.0
6.3
6.5
9.1
4.4
1.3
0.7
3.5
2.5
1.5
16.7
16.7
17.6
21.1
14.7
22.6
22.6
23.8
28.9
19.6
9.0
9.5
8.4
9.1
8.2
20.7
20.5
23.0
27.6
17.8
28.7
28.9
30.4
38.0
24.0
10.3
10.2
11.9
11.6
9.8
0 10 20 30 40 50
Total (N=3753)
Savings-Non-traditional (n=2148)
Savings-Traditional (n=357)
Present-Traditional (n=308)
Present-Non-traditional (n=892)
Total Male (n=2116)
Savings-Non-traditional (n=1186)
Savings-Traditional (n=214)
Present-Traditional (n=187)
Present-Non-traditional (n=504)
Total Female (n=1637)
Savings-Non-traditional (n=962)
Savings-Traditional (n=143)
Savings-Traditional (n=121)
Savings-Non-traditional (n=388) Yes Rather Yes
To
tal m
ale
an
d
fem
ale
Ma
leF
em
ale
%
Figure 2-10 Have sufficient knowledge of the details of the financial product (interest/returns)
7.97
11.50
5.51
7.28
10.75
6.98
7.58
6.21
0.0 2.0 4.0 6.0 8.0 10.0 12.0 14.0
Savings-Non-traditional
Savings-Traditional
Present-Traditional
Present-Non-traditionalMale Female
%
Figure 2-11 Ratio of annual savings/investment amount as a percentage of one's annual income
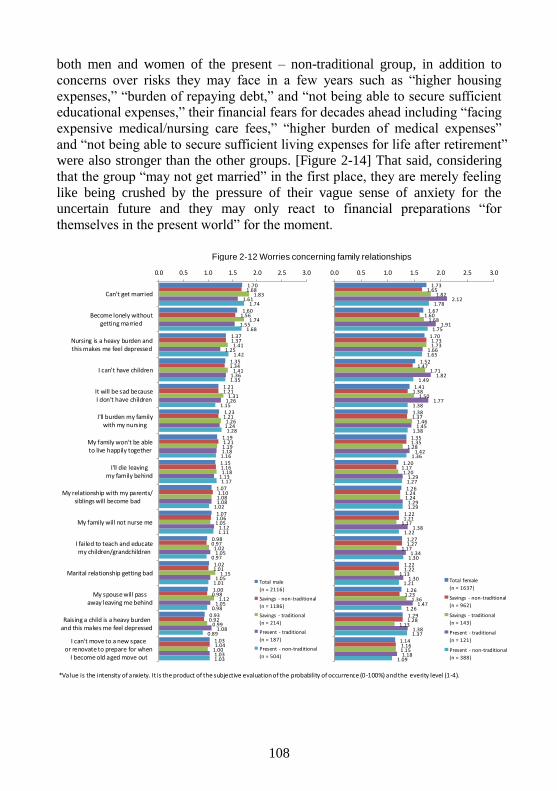
108
both men and women of the present – non-traditional group, in addition to
concerns over risks they may face in a few years such as “higher housing
expenses,” “burden of repaying debt,” and “not being able to secure sufficient
educational expenses,” their financial fears for decades ahead including “facing
expensive medical/nursing care fees,” “higher burden of medical expenses”
and “not being able to secure sufficient living expenses for life after retirement”
were also stronger than the other groups. [Figure 2-14] That said, considering
that the group “may not get married” in the first place, they are merely feeling
like being crushed by the pressure of their vague sense of anxiety for the
uncertain future and they may only react to financial preparations “for
themselves in the present world” for the moment.
1.73
1.67
1.70
1.52
1.41
1.38
1.35
1.20
1.26
1.22
1.27
1.22
1.26
1.29
1.14
1.65
1.60
1.73
1.47
1.38
1.37
1.35
1.17
1.24
1.21
1.27
1.22
1.23
1.28
1.16
1.82
1.68
1.73
1.71
1.50
1.46
1.28
1.20
1.24
1.17
1.17
1.13
1.36
1.13
1.15
2.12
1.91
1.66
1.82
1.77
1.45
1.42
1.29
1.29
1.38
1.34
1.30
1.47
1.38
1.18
1.78
1.75
1.65
1.49
1.38
1.38
1.36
1.27
1.29
1.22
1.30
1.21
1.26
1.37
1.09
0.0 0.5 1.0 1.5 2.0 2.5 3.0
Can't get married
Become lonely withoutgetting married
Nursing is a heavy burden andthis makes me feel depressed
I can't have children
It will be sad becauseI don't have children
I'll burden my familywith my nursing
My family won't be ableto live happily together
I'll die leavingmy family behind
My relationship with my parents/siblings will become bad
My family will not nurse me
I failed to teach and educatemy children/grandchildren
Marital relationship getting bad
My spouse will passaway leaving me behind
Raising a child is a heavy burdenand this makes me feel depressed
I can't move to a new spaceor renovate to prepare for when
I become old aged move out
Total female
(n = 1637)
Savings - non-traditional
(n = 962)
Savings - traditional
(n = 143)
Present - traditional
(n = 121)
Present - non-traditional
(n = 388)
1.70
1.60
1.37
1.35
1.21
1.23
1.19
1.15
1.07
1.07
0.98
1.02
1.00
0.93
1.03
1.68
1.56
1.37
1.34
1.21
1.21
1.21
1.16
1.10
1.06
0.97
1.01
0.98
0.92
1.04
1.83
1.74
1.41
1.41
1.31
1.26
1.19
1.18
1.08
1.05
1.02
1.15
1.12
0.99
1.00
1.61
1.55
1.25
1.36
1.26
1.24
1.18
1.13
1.08
1.12
1.05
1.05
1.05
1.08
1.03
1.74
1.68
1.42
1.35
1.15
1.28
1.16
1.17
1.02
1.11
0.97
1.01
0.98
0.89
1.03
0.0 0.5 1.0 1.5 2.0 2.5 3.0
Can't get married
Become lonely withoutgetting married
Nursing is a heavy burden andthis makes me feel depressed
I can't have children
It will be sad becauseI don't have children
I'll burden my familywith my nursing
My family won't be ableto live happily together
I'll die leavingmy family behind
My relationship with my parents/siblings will become bad
My family will not nurse me
I failed to teach and educatemy children/grandchildren
Marital relationship getting bad
My spouse will passaway leaving me behind
Raising a child is a heavy burdenand this makes me feel depressed
I can't move to a new spaceor renovate to prepare for when
I become old aged move out
Total male
(n = 2116)
Savings - non-traditional
(n = 1186)
Savings - traditional
(n = 214)
Present - traditional
(n = 187)
Present - non-traditional
(n = 504)
Figure 2-12 Worries concerning family relationships
*Value is the intensity of anxiety. It is the product of the subjective evaluation of the probability of occurrence (0-100%) and the everity level (1-4).
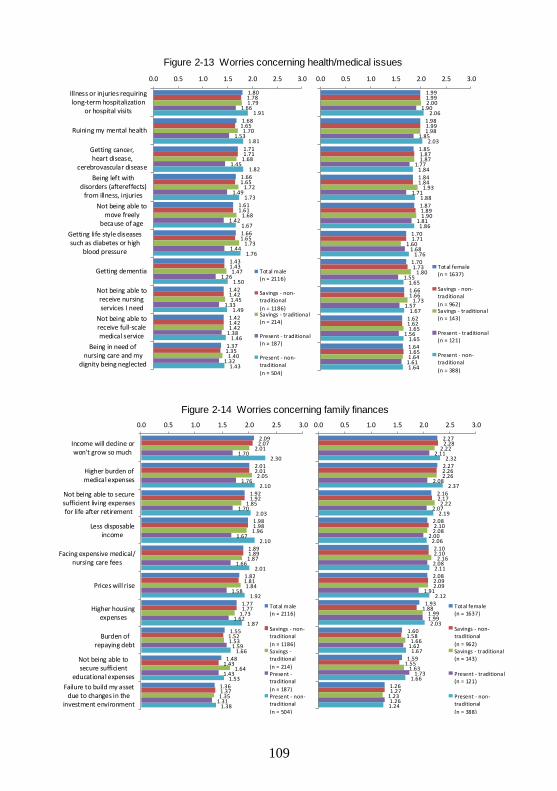
109
1.99
1.98
1.85
1.84
1.87
1.70
1.70
1.66
1.62
1.64
1.99
1.99
1.87
1.84
1.89
1.71
1.73
1.66
1.62
1.65
2.00
1.98
1.87
1.93
1.90
1.60
1.80
1.73
1.65
1.64
1.90
1.85
1.77
1.71
1.81
1.68
1.55
1.57
1.56
1.61
2.06
2.03
1.84
1.88
1.86
1.76
1.65
1.67
1.65
1.64
0.0 0.5 1.0 1.5 2.0 2.5 3.0
Illness or injuries requiringlong-term hospitalization
or hospital visits
Ruining my mental health
Getting cancer,heart disease,
cerebrovascular disease
Being left withdisorders (aftereffects)
from illness, injuries
Not being able tomove freely
because of age
Getting life style diseasessuch as diabetes or high
blood pressure
Getting dementia
Not being able toreceive nursingservices I need
Not being able toreceive full-scalemedical service
Being in need ofnursing care and my
dignity being neglected
Total female(n = 1637)
Savings - non-traditional
(n = 962)Savings - traditional(n = 143)
Present - traditional(n = 121)
Present - non-traditional
(n = 388)
1.80
1.68
1.71
1.66
1.61
1.66
1.43
1.42
1.42
1.37
1.78
1.65
1.71
1.65
1.61
1.65
1.43
1.42
1.42
1.35
1.79
1.70
1.68
1.72
1.68
1.73
1.47
1.45
1.42
1.40
1.66
1.53
1.45
1.49
1.42
1.44
1.26
1.33
1.38
1.32
1.91
1.81
1.82
1.73
1.67
1.76
1.50
1.49
1.46
1.43
0.0 0.5 1.0 1.5 2.0 2.5 3.0
Illness or injuries requiringlong-term hospitalization
or hospital visits
Ruining my mental health
Getting cancer,heart disease,
cerebrovascular disease
Being left withdisorders (aftereffects)
from illness, injuries
Not being able tomove freely
because of age
Getting life style diseasessuch as diabetes or high
blood pressure
Getting dementia
Not being able toreceive nursingservices I need
Not being able toreceive full-scalemedical service
Being in need ofnursing care and my
dignity being neglected
Total male(n = 2116)
Savings - non-traditional
(n = 1186)Savings - traditional(n = 214)
Present - traditional(n = 187)
Present - non-traditional
(n = 504)
Figure 2-13 Worries concerning health/medical issues
2.27
2.27
2.16
2.08
2.10
2.08
1.93
1.60
1.59
1.26
2.28
2.26
2.17
2.10
2.10
2.09
1.88
1.58
1.55
1.27
2.22
2.26
2.22
2.08
2.16
2.09
1.99
1.66
1.63
1.23
2.11
2.08
2.07
2.00
2.08
1.91
1.99
1.62
1.73
1.26
2.32
2.37
2.19
2.06
2.11
2.12
2.03
1.67
1.66
1.24
0.0 0.5 1.0 1.5 2.0 2.5 3.0
Income will decline orwon't grow so much
Higher burden ofmedical expenses
Not being able to securesufficient living expensesfor life after retirement
Less disposableincome
Facing expensive medical/nursing care fees
Prices will rise
Higher housingexpenses
Burden ofrepaying debt
Not being able tosecure sufficient
educational expenses
Failure to build my assetdue to changes in the
investment environment
Total female(n = 1637)
Savings - non-traditional
(n = 962)Savings - traditional(n = 143)
Present - traditional(n = 121)
Present - non-traditional
(n = 388)
2.09
2.01
1.92
1.98
1.89
1.82
1.77
1.55
1.48
1.36
2.07
2.01
1.92
1.98
1.89
1.81
1.77
1.52
1.43
1.37
2.01
2.05
1.85
1.96
1.87
1.84
1.73
1.53
1.64
1.35
1.70
1.76
1.70
1.67
1.66
1.58
1.62
1.59
1.43
1.31
2.30
2.10
2.03
2.10
2.01
1.92
1.87
1.66
1.53
1.38
0.0 0.5 1.0 1.5 2.0 2.5 3.0
Income will decline orwon't grow so much
Higher burden ofmedical expenses
Not being able to securesufficient living expensesfor life after retirement
Less disposableincome
Facing expensive medical/nursing care fees
Prices will rise
Higher housingexpenses
Burden ofrepaying debt
Not being able tosecure sufficient
educational expenses
Failure to build my assetdue to changes in the
investment environment
Total male(n = 2116)
Savings - non-traditional
(n = 1186)Savings -traditional
(n = 214)Present -traditional
(n = 187)Present - non-traditional
(n = 504)
Figure 2-14 Worries concerning family finances
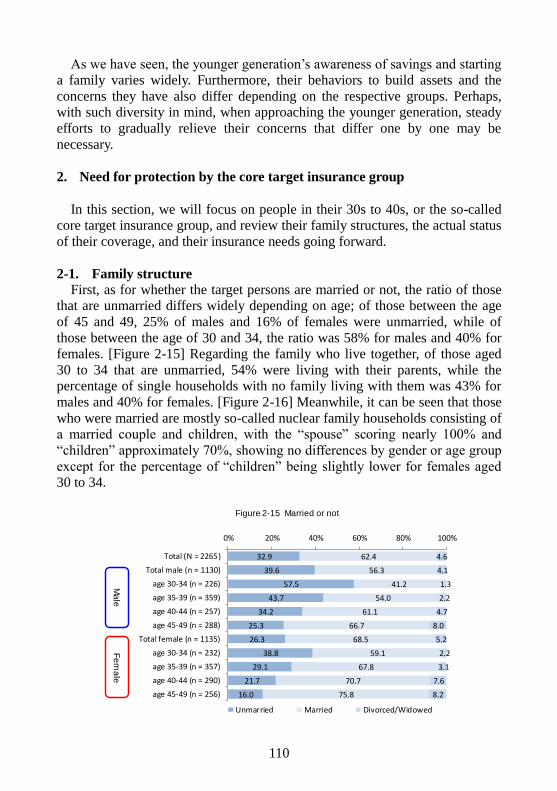
110
As we have seen, the younger generation’s awareness of savings and starting
a family varies widely. Furthermore, their behaviors to build assets and the
concerns they have also differ depending on the respective groups. Perhaps,
with such diversity in mind, when approaching the younger generation, steady
efforts to gradually relieve their concerns that differ one by one may be
necessary.
2. Need for protection by the core target insurance group
In this section, we will focus on people in their 30s to 40s, or the so-called
core target insurance group, and review their family structures, the actual status
of their coverage, and their insurance needs going forward.
2-1. Family structure
First, as for whether the target persons are married or not, the ratio of those
that are unmarried differs widely depending on age; of those between the age
of 45 and 49, 25% of males and 16% of females were unmarried, while of
those between the age of 30 and 34, the ratio was 58% for males and 40% for
females. [Figure 2-15] Regarding the family who live together, of those aged
30 to 34 that are unmarried, 54% were living with their parents, while the
percentage of single households with no family living with them was 43% for
males and 40% for females. [Figure 2-16] Meanwhile, it can be seen that those
who were married are mostly so-called nuclear family households consisting of
a married couple and children, with the “spouse” scoring nearly 100% and
“children” approximately 70%, showing no differences by gender or age group
except for the percentage of “children” being slightly lower for females aged
30 to 34.
32.9
39.6
57.5
43.7
34.2
25.3
26.3
38.8
29.1
21.7
16.0
62.4
56.3
41.2
54.0
61.1
66.7
68.5
59.1
67.8
70.7
75.8
4.6
4.1
1.3
2.2
4.7
8.0
5.2
2.2
3.1
7.6
8.2
0% 20% 40% 60% 80% 100%
Total (N = 2265)
Total male (n = 1130)
age 30-34 (n = 226)
age 35-39 (n = 359)
age 40-44 (n = 257)
age 45-49 (n = 288)
Total female (n = 1135)
age 30-34 (n = 232)
age 35-39 (n = 357)
age 40-44 (n = 290)
age 45-49 (n = 256)
Unmarried Married Divorced/Widowed
Ma
leF
em
ale
Figure 2-15 Married or not
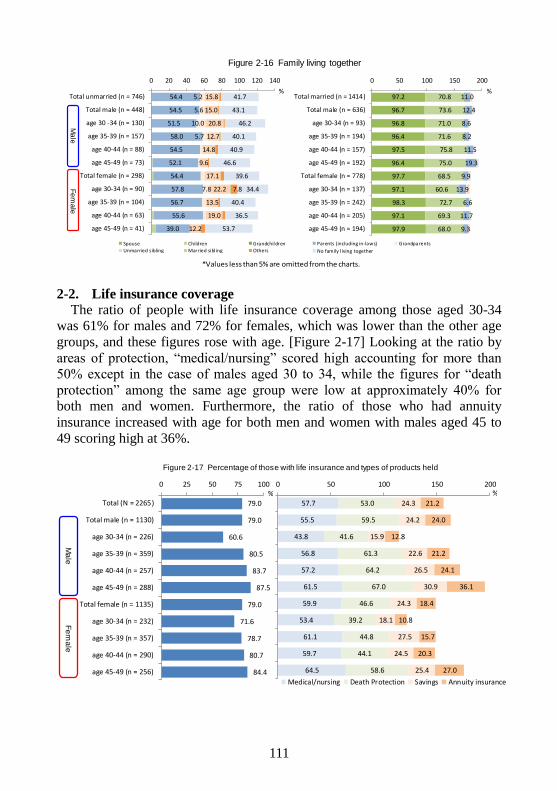
111
2-2. Life insurance coverage
The ratio of people with life insurance coverage among those aged 30-34
was 61% for males and 72% for females, which was lower than the other age
groups, and these figures rose with age. [Figure 2-17] Looking at the ratio by
areas of protection, “medical/nursing” scored high accounting for more than
50% except in the case of males aged 30 to 34, while the figures for “death
protection” among the same age group were low at approximately 40% for
both men and women. Furthermore, the ratio of those who had annuity
insurance increased with age for both men and women with males aged 45 to
49 scoring high at 36%.
54.4
54.5
51.5
58.0
54.5
52.1
54.4
57.8
56.7
55.6
39.0
5.2
5.6
10.0
5.7
7.8
15.8
15.0
20.8
12.7
14.8
9.6
17.1
22.2
13.5
19.0
12.2
7.8
41.7
43.1
46.2
40.1
40.9
46.6
39.6
34.4
40.4
36.5
53.7
0 20 40 60 80 100 120 140
Total unmarried (n = 746)
Total male (n = 448)
age 30 -34 (n = 130)
age 35-39 (n = 157)
age 40-44 (n = 88)
age 45-49 (n = 73)
Total female (n = 298)
age 30-34 (n = 90)
age 35-39 (n = 104)
age 40-44 (n = 63)
age 45-49 (n = 41)
Spouse Children Grandchildren
Unmarried sibling Married sibl ing Others
Ma
leF
em
ale
%
Figure 2-16 Family living together
97.2
96.7
96.8
96.4
97.5
96.4
97.7
97.1
98.3
97.1
97.9
70.8
73.6
71.0
71.6
75.8
75.0
68.5
60.6
72.7
69.3
68.0
11.0
12.4
8.6
8.2
11.5
19.3
9.9
13.9
6.6
11.7
9.3
0 50 100 150 200
Total married (n = 1414)
Total male (n = 636)
age 30-34 (n = 93)
age 35-39 (n = 194)
age 40-44 (n = 157)
age 45-49 (n = 192)
Total female (n = 778)
age 30-34 (n = 137)
age 35-39 (n = 242)
age 40-44 (n = 205)
age 45-49 (n = 194)
Parents (including in-laws) Grandparents
No family l iving together
%
*Values less than 5% is omitted from the charts.*Values less than 5% are omitted from the charts.
57.7
55.5
43.8
56.8
57.2
61.5
59.9
53.4
61.1
59.7
64.5
53.0
59.5
41.6
61.3
64.2
67.0
46.6
39.2
44.8
44.1
58.6
24.3
24.2
15.9
22.6
26.5
30.9
24.3
18.1
27.5
24.5
25.4
21.2
24.0
12.8
21.2
24.1
36.1
18.4
10.8
15.7
20.3
27.0
0 50 100 150 200
Medical/nursing Death Protection Savings Annuity insurance
%
79.0
79.0
60.6
80.5
83.7
87.5
79.0
71.6
78.7
80.7
84.4
0 25 50 75 100
Total (N = 2265)
Total male (n = 1130)
age 30-34 (n = 226)
age 35-39 (n = 359)
age 40-44 (n = 257)
age 45-49 (n = 288)
Total female (n = 1135)
age 30-34 (n = 232)
age 35-39 (n = 357)
age 40-44 (n = 290)
age 45-49 (n = 256)
Ma
leF
em
ale
%
Figure 2-17 Percentage of those with life insurance and types of products held
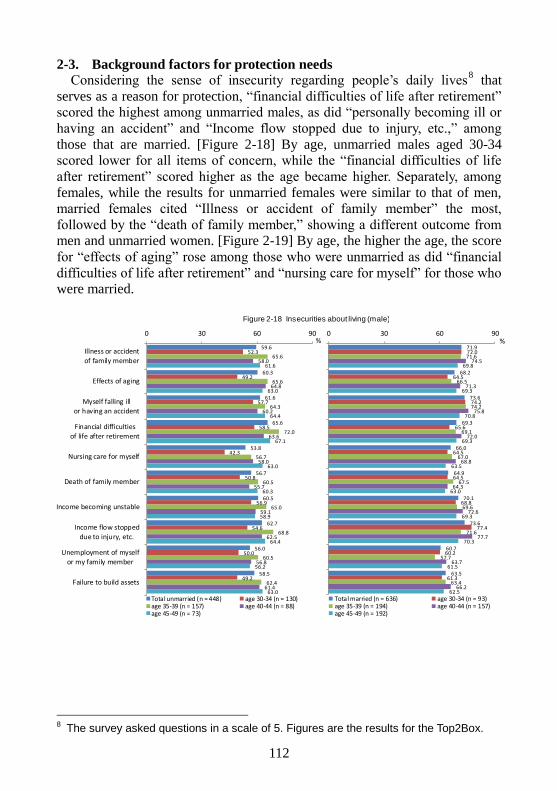
112
2-3. Background factors for protection needs Considering the sense of insecurity regarding people’s daily lives
8 that
serves as a reason for protection, “financial difficulties of life after retirement”
scored the highest among unmarried males, as did “personally becoming ill or
having an accident” and “Income flow stopped due to injury, etc.,” among
those that are married. [Figure 2-18] By age, unmarried males aged 30-34
scored lower for all items of concern, while the “financial difficulties of life
after retirement” scored higher as the age became higher. Separately, among
females, while the results for unmarried females were similar to that of men,
married females cited “Illness or accident of family member” the most,
followed by the “death of family member,” showing a different outcome from
men and unmarried women. [Figure 2-19] By age, the higher the age, the score
for “effects of aging” rose among those who were unmarried as did “financial
difficulties of life after retirement” and “nursing care for myself” for those who
were married.
8 The survey asked questions in a scale of 5. Figures are the results for the Top2Box.
71.9
68.2
73.6
69.3
66.0
64.9
70.1
73.6
60.7
63.5
72.0
64.5
74.2
65.6
64.5
64.5
68.8
77.4
60.2
61.3
71.6
66.5
74.2
69.1
67.0
67.5
69.6
71.6
57.7
63.4
74.5
71.3
75.8
72.0
68.8
64.3
72.6
77.7
63.7
66.2
69.8
69.3
70.8
69.3
63.5
63.0
69.3
70.3
61.5
62.5
0 30 60 90
Total married (n = 636) age 30-34 (n = 93)age 35-39 (n = 194) age 40-44 (n = 157)age 45-49 (n = 192)
%59.6
60.3
61.6
65.6
53.8
56.7
60.5
62.7
56.0
58.5
52.3
49.2
57.7
58.5
42.3
50.8
56.9
54.6
50.0
49.2
65.6
65.6
64.3
72.0
56.7
60.5
65.0
68.8
60.5
62.4
58.0
64.8
60.2
63.6
58.0
55.7
59.1
62.5
56.8
61.4
61.6
63.0
64.4
67.1
63.0
60.3
58.9
64.4
56.2
63.0
0 30 60 90
Illness or accident
of family member
Effects of aging
Myself falling ill
or having an accident
Financial difficultiesof life after retirement
Nursing care for myself
Death of family member
Income becoming unstable
Income flow stoppeddue to injury, etc.
Unemployment of myself
or my family member
Failure to build assets
Total unmarried (n = 448) age 30-34 (n = 130)age 35-39 (n = 157) age 40-44 (n = 88)age 45-49 (n = 73)
%
Figure 2-18 Insecurities about living (male)
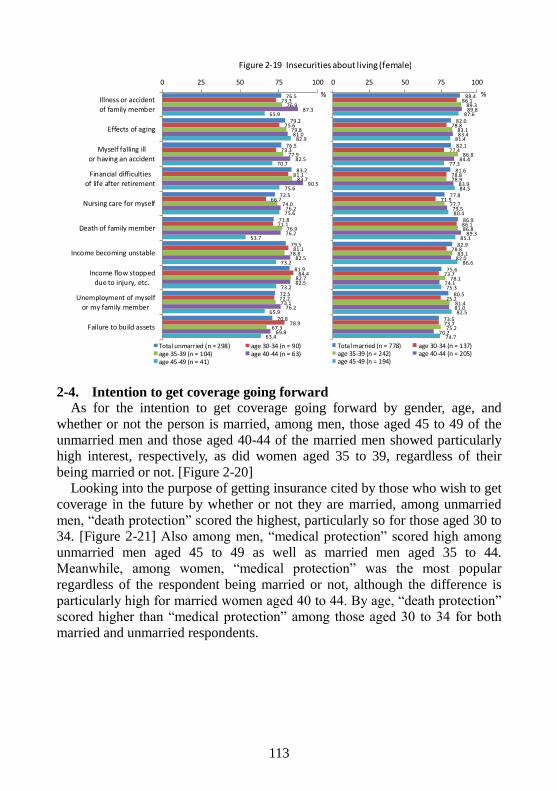
113
2-4. Intention to get coverage going forward As for the intention to get coverage going forward by gender, age, and
whether or not the person is married, among men, those aged 45 to 49 of the
unmarried men and those aged 40-44 of the married men showed particularly
high interest, respectively, as did women aged 35 to 39, regardless of their
being married or not. [Figure 2-20]
Looking into the purpose of getting insurance cited by those who wish to get
coverage in the future by whether or not they are married, among unmarried
men, “death protection” scored the highest, particularly so for those aged 30 to
34. [Figure 2-21] Also among men, “medical protection” scored high among
unmarried men aged 45 to 49 as well as married men aged 35 to 44.
Meanwhile, among women, “medical protection” was the most popular
regardless of the respondent being married or not, although the difference is
particularly high for married women aged 40 to 44. By age, “death protection”
scored higher than “medical protection” among those aged 30 to 34 for both
married and unmarried respondents.
88.4
82.0
82.1
81.6
77.8
86.9
82.9
75.6
80.5
73.5
86.1
78.8
77.4
78.8
71.5
86.1
78.8
73.7
75.2
73.7
89.3
83.1
86.8
78.9
77.7
86.8
83.1
78.1
81.4
75.2
89.8
83.4
84.4
83.9
79.5
89.3
82.0
74.1
81.0
70.2
87.6
81.4
77.3
84.5
80.4
85.1
86.6
75.3
82.5
74.7
0 25 50 75 100
Total married (n = 778) age 30-34 (n = 137)age 35-39 (n = 242) age 40-44 (n = 205)age 45-49 (n = 194)
%76.5
79.2
76.5
83.2
72.5
71.8
79.5
81.9
72.5
70.8
73.3
75.6
73.3
81.1
66.7
71.1
81.1
84.4
72.2
78.9
76.9
79.8
77.9
83.7
74.0
76.9
78.8
82.7
73.1
67.3
87.3
81.0
82.5
90.5
76.2
76.2
82.5
82.5
76.2
69.8
65.9
82.9
70.7
75.6
75.6
53.7
73.2
73.2
65.9
63.4
0 25 50 75 100
Illness or accident
of family member
Effects of aging
Myself falling illor having an accident
Financial difficultiesof life after retirement
Nursing care for myself
Death of family member
Income becoming unstable
Income flow stopped
due to injury, etc.
Unemployment of myself
or my family member
Failure to build assets
Total unmarried (n = 298) age 30-34 (n = 90)age 35-39 (n = 104) age 40-44 (n = 63)age 45-49 (n = 41)
%
Figure 2-19 Insecurities about living (female)
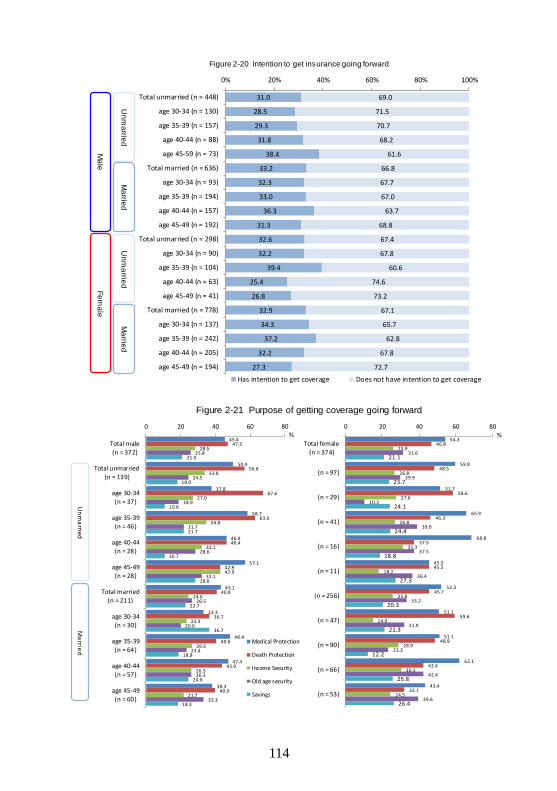
114
31.0
28.5
29.3
31.8
38.4
33.2
32.3
33.0
36.3
31.3
32.6
32.2
39.4
25.4
26.8
32.9
34.3
37.2
32.2
27.3
69.0
71.5
70.7
68.2
61.6
66.8
67.7
67.0
63.7
68.8
67.4
67.8
60.6
74.6
73.2
67.1
65.7
62.8
67.8
72.7
0% 20% 40% 60% 80% 100%
Total unmarried (n = 448)
age 30-34 (n = 130)
age 35-39 (n = 157)
age 40-44 (n = 88)
age 45-59 (n = 73)
Total married (n = 636)
age 30-34 (n = 93)
age 35-39 (n = 194)
age 40-44 (n = 157)
age 45-49 (n = 192)
Total unmarried (n = 298)
age 30-34 (n = 90)
age 35-39 (n = 104)
age 40-44 (n = 63)
age 45-49 (n = 41)
Total married (n = 778)
age 30-34 (n = 137)
age 35-39 (n = 242)
age 40-44 (n = 205)
age 45-49 (n = 194)
Has intention to get coverage Does not have intention to get coverage
Ma
leF
em
ale
Un
ma
rried
Ma
rried
Un
ma
rried
Ma
rried
Figure 2-20 Intention to get insurance going forward
54.3
59.8
51.7
65.9
68.8
45.5
52.3
51.1
51.1
62.1
43.4
46.8
48.5
58.6
46.3
37.5
45.5
45.7
59.6
48.9
42.4
32.1
25.9
26.8
27.6
26.8
31.3
18.2
25.8
14.9
28.9
30.3
24.5
31.6
29.9
10.3
39.0
37.5
36.4
33.2
31.9
23.3
42.4
39.6
21.1
23.7
24.1
24.4
18.8
27.3
20.3
21.3
12.2
25.8
26.4
0 20 40 60 80
Total female
(n = 374)
(n = 97)
(n = 29)
(n = 41)
(n = 16)
(n = 11)
(n = 256)
(n = 47)
(n = 90)
(n = 66)
(n = 53)
%45.4
50.4
37.8
58.7
46.4
57.1
43.1
33.3
48.4
47.4
38.3
47.3
56.8
67.6
63.0
46.4
42.9
40.8
36.7
40.6
43.9
40.0
28.5
33.8
27.0
34.8
32.1
42.9
24.6
23.3
26.6
26.3
21.7
25.8
24.5
18.9
21.7
28.6
32.1
26.5
20.0
23.4
26.3
33.3
21.0
18.0
10.8
21.7
10.7
28.6
22.7
36.7
18.8
24.6
18.3
0 20 40 60 80
Total male(n = 372)
Total unmarried
(n = 139)
age 30-34(n = 37)
age 35-39(n = 46)
age 40-44(n = 28)
age 45-49(n = 28)
Total married
(n = 211)
age 30-34(n = 30)
age 35-39
(n = 64)
age 40-44(n = 57)
age 45-49(n = 60)
Medical Protection
Death Protection
Income Security
Old age security
Savings
Un
ma
rriedM
arrie
d
%
Figure 2-21 Purpose of getting coverage going forward
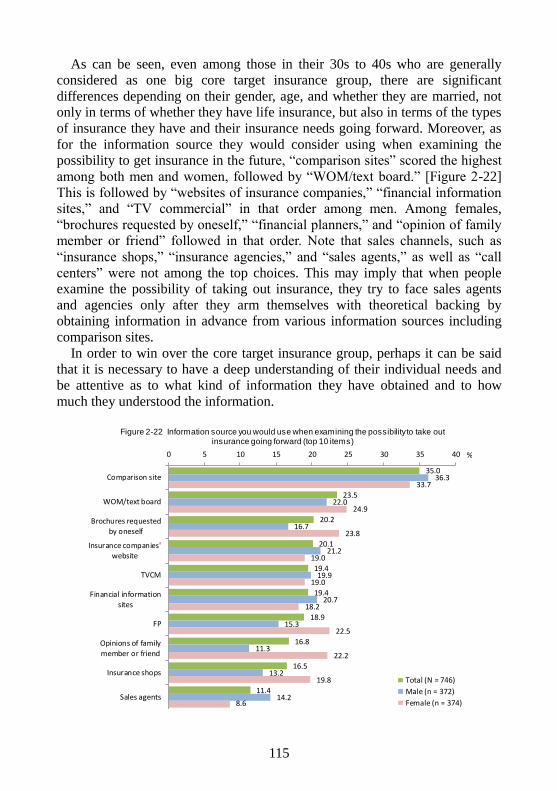
115
As can be seen, even among those in their 30s to 40s who are generally
considered as one big core target insurance group, there are significant
differences depending on their gender, age, and whether they are married, not
only in terms of whether they have life insurance, but also in terms of the types
of insurance they have and their insurance needs going forward. Moreover, as
for the information source they would consider using when examining the
possibility to get insurance in the future, “comparison sites” scored the highest
among both men and women, followed by “WOM/text board.” [Figure 2-22]
This is followed by “websites of insurance companies,” “financial information
sites,” and “TV commercial” in that order among men. Among females,
“brochures requested by oneself,” “financial planners,” and “opinion of family
member or friend” followed in that order. Note that sales channels, such as
“insurance shops,” “insurance agencies,” and “sales agents,” as well as “call
centers” were not among the top choices. This may imply that when people
examine the possibility of taking out insurance, they try to face sales agents
and agencies only after they arm themselves with theoretical backing by
obtaining information in advance from various information sources including
comparison sites.
In order to win over the core target insurance group, perhaps it can be said
that it is necessary to have a deep understanding of their individual needs and
be attentive as to what kind of information they have obtained and to how
much they understood the information.
35.0
23.5
20.2
20.1
19.4
19.4
18.9
16.8
16.5
11.4
36.3
22.0
16.7
21.2
19.9
20.7
15.3
11.3
13.2
14.2
33.7
24.9
23.8
19.0
19.0
18.2
22.5
22.2
19.8
8.6
0 5 10 15 20 25 30 35 40
Comparison site
WOM/text board
Brochures requestedby oneself
Insurance companies'website
TVCM
Financial informationsites
FP
Opinions of familymember or friend
Insurance shops
Sales agents
Total (N = 746)
Male (n = 372)
Female (n = 374)
%
Figure 2-22 Information source you would use when examining the possibility to take out insurance going forward (top 10 items)
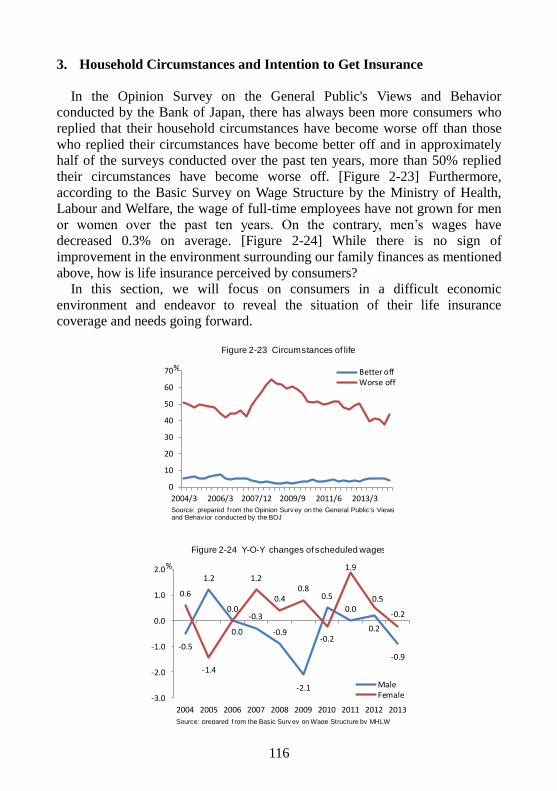
116
3. Household Circumstances and Intention to Get Insurance
In the Opinion Survey on the General Public's Views and Behavior
conducted by the Bank of Japan, there has always been more consumers who
replied that their household circumstances have become worse off than those
who replied their circumstances have become better off and in approximately
half of the surveys conducted over the past ten years, more than 50% replied
their circumstances have become worse off. [Figure 2-23] Furthermore,
according to the Basic Survey on Wage Structure by the Ministry of Health,
Labour and Welfare, the wage of full-time employees have not grown for men
or women over the past ten years. On the contrary, men’s wages have
decreased 0.3% on average. [Figure 2-24] While there is no sign of
improvement in the environment surrounding our family finances as mentioned
above, how is life insurance perceived by consumers?
In this section, we will focus on consumers in a difficult economic
environment and endeavor to reveal the situation of their life insurance
coverage and needs going forward.
0
10
20
30
40
50
60
70
2004/3 2006/3 2007/12 2009/9 2011/6 2013/3
Better offWorse off
Source: prepared f rom the Opinion Surv ey on the General Public's Views and Behav ior conducted by the BOJ
%
Figure 2-23 Circumstances of life
-0.5
1.2
0.0-0.3
-0.9
-2.1
0.5
0.0
0.2
-0.9
0.6
-1.4
0.0
1.2
0.40.8
-0.2
1.9
0.5
-0.2
-3.0
-2.0
-1.0
0.0
1.0
2.0
2004 2005 2006 2007 2008 2009 2010 2011 2012 2013
MaleFemale
%
Source: prepared f rom the Basic Surv ey on Wage Structure by MHLW
Figure 2-24 Y-O-Y changes of scheduled wages
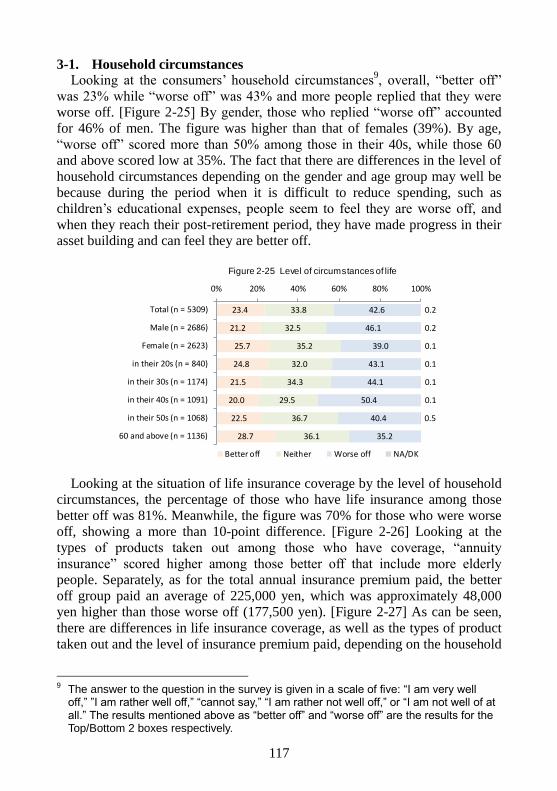
117
3-1. Household circumstances Looking at the consumers’ household circumstances
9, overall, “better off”
was 23% while “worse off” was 43% and more people replied that they were
worse off. [Figure 2-25] By gender, those who replied “worse off” accounted
for 46% of men. The figure was higher than that of females (39%). By age,
“worse off” scored more than 50% among those in their 40s, while those 60
and above scored low at 35%. The fact that there are differences in the level of
household circumstances depending on the gender and age group may well be
because during the period when it is difficult to reduce spending, such as
children’s educational expenses, people seem to feel they are worse off, and
when they reach their post-retirement period, they have made progress in their
asset building and can feel they are better off.
Looking at the situation of life insurance coverage by the level of household
circumstances, the percentage of those who have life insurance among those
better off was 81%. Meanwhile, the figure was 70% for those who were worse
off, showing a more than 10-point difference. [Figure 2-26] Looking at the
types of products taken out among those who have coverage, “annuity
insurance” scored higher among those better off that include more elderly
people. Separately, as for the total annual insurance premium paid, the better
off group paid an average of 225,000 yen, which was approximately 48,000
yen higher than those worse off (177,500 yen). [Figure 2-27] As can be seen,
there are differences in life insurance coverage, as well as the types of product
taken out and the level of insurance premium paid, depending on the household
9 The answer to the question in the survey is given in a scale of five: “I am very well
off,” ”I am rather well off,” “cannot say,” “I am rather not well off,” or “I am not well of at all.” The results mentioned above as “better off” and “worse off” are the results for the Top/Bottom 2 boxes respectively.
23.4
21.2
25.7
24.8
21.5
20.0
22.5
28.7
33.8
32.5
35.2
32.0
34.3
29.5
36.7
36.1
42.6
46.1
39.0
43.1
44.1
50.4
40.4
35.2
0.2
0.2
0.1
0.1
0.1
0.1
0.5
0% 20% 40% 60% 80% 100%
Total (n = 5309)
Male (n = 2686)
Female (n = 2623)
in their 20s (n = 840)
in their 30s (n = 1174)
in their 40s (n = 1091)
in their 50s (n = 1068)
60 and above (n = 1136)
Better off Neither Worse off NA/DK
Figure 2-25 Level of circumstances of life
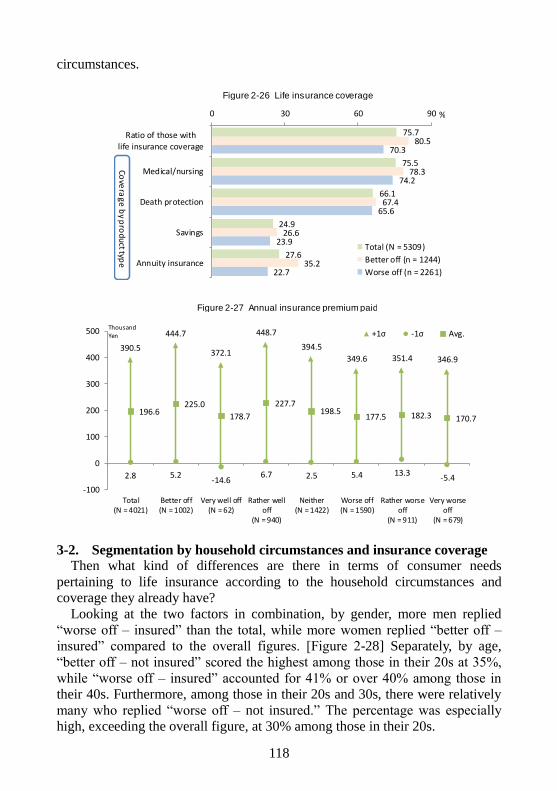
118
circumstances.
3-2. Segmentation by household circumstances and insurance coverage Then what kind of differences are there in terms of consumer needs
pertaining to life insurance according to the household circumstances and
coverage they already have?
Looking at the two factors in combination, by gender, more men replied
“worse off – insured” than the total, while more women replied “better off –
insured” compared to the overall figures. [Figure 2-28] Separately, by age,
“better off – not insured” scored the highest among those in their 20s at 35%,
while “worse off – insured” accounted for 41% or over 40% among those in
their 40s. Furthermore, among those in their 20s and 30s, there were relatively
many who replied “worse off – not insured.” The percentage was especially
high, exceeding the overall figure, at 30% among those in their 20s.
75.7
75.5
66.1
24.9
27.6
80.5
78.3
67.4
26.6
35.2
70.3
74.2
65.6
23.9
22.7
0 30 60 90
Ratio of those withlife insurance coverage
Medical/nursing
Death protection
Savings
Annuity insurance
Total (N = 5309)
Better off (n = 1244)
Worse off (n = 2261)
%
Co
vera
ge b
y pro
du
cttype
Figure 2-26 Life insurance coverage
390.5
444.7
372.1
448.7
394.5
349.6 351.4 346.9
2.8 5.2-14.6
6.7 2.5 5.4 13.3-5.4
196.6225.0
178.7
227.7198.5
177.5 182.3 170.7
-100
0
100
200
300
400
500
Total(N = 4021)
Better off(N = 1002)
Very well off(N = 62)
Rather welloff
(N = 940)
Neither(N = 1422)
Worse off(N = 1590)
Rather worseoff
(N = 911)
Very worseoff
(N = 679)
+1σ -1σ Avg.ThousandYen
Figure 2-27 Annual insurance premium paid
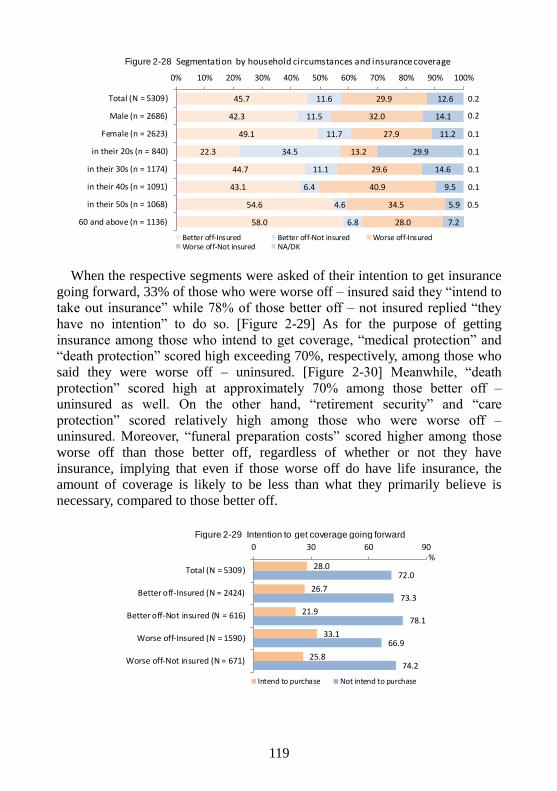
119
When the respective segments were asked of their intention to get insurance
going forward, 33% of those who were worse off – insured said they “intend to
take out insurance” while 78% of those better off – not insured replied “they
have no intention” to do so. [Figure 2-29] As for the purpose of getting
insurance among those who intend to get coverage, “medical protection” and
“death protection” scored high exceeding 70%, respectively, among those who
said they were worse off – uninsured. [Figure 2-30] Meanwhile, “death
protection” scored high at approximately 70% among those better off –
uninsured as well. On the other hand, “retirement security” and “care
protection” scored relatively high among those who were worse off –
uninsured. Moreover, “funeral preparation costs” scored higher among those
worse off than those better off, regardless of whether or not they have
insurance, implying that even if those worse off do have life insurance, the
amount of coverage is likely to be less than what they primarily believe is
necessary, compared to those better off.
45.7
42.3
49.1
22.3
44.7
43.1
54.6
58.0
11.6
11.5
11.7
34.5
11.1
6.4
4.6
6.8
29.9
32.0
27.9
13.2
29.6
40.9
34.5
28.0
12.6
14.1
11.2
29.9
14.6
9.5
5.9
7.2
0.2
0.2
0.1
0.1
0.1
0.1
0.5
0% 10% 20% 30% 40% 50% 60% 70% 80% 90% 100%
Total (N = 5309)
Male (n = 2686)
Female (n = 2623)
in their 20s (n = 840)
in their 30s (n = 1174)
in their 40s (n = 1091)
in their 50s (n = 1068)
60 and above (n = 1136)
Better off-Insured Better off-Not insured Worse off-InsuredWorse off-Not insured NA/DK
Figure 2-28 Segmentation by household circumstances and insurance coverage
28.0
26.7
21.9
33.1
25.8
72.0
73.3
78.1
66.9
74.2
0 30 60 90
Total (N = 5309)
Better off-Insured (N = 2424)
Better off-Not insured (N = 616)
Worse off-Insured (N = 1590)
Worse off-Not insured (N = 671)
Intend to purchase Not intend to purchase
%
Figure 2-29 Intention to get coverage going forward
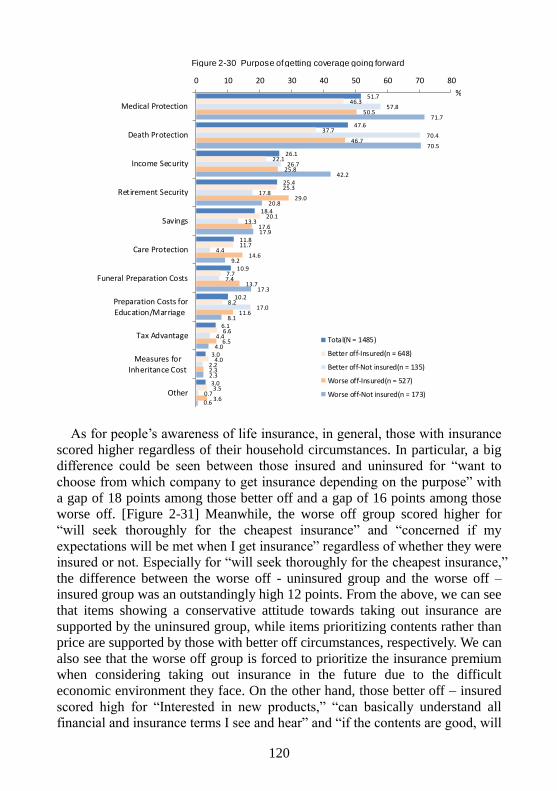
120
As for people’s awareness of life insurance, in general, those with insurance
scored higher regardless of their household circumstances. In particular, a big
difference could be seen between those insured and uninsured for “want to
choose from which company to get insurance depending on the purpose” with
a gap of 18 points among those better off and a gap of 16 points among those
worse off. [Figure 2-31] Meanwhile, the worse off group scored higher for
“will seek thoroughly for the cheapest insurance” and “concerned if my
expectations will be met when I get insurance” regardless of whether they were
insured or not. Especially for “will seek thoroughly for the cheapest insurance,”
the difference between the worse off - uninsured group and the worse off –
insured group was an outstandingly high 12 points. From the above, we can see
that items showing a conservative attitude towards taking out insurance are
supported by the uninsured group, while items prioritizing contents rather than
price are supported by those with better off circumstances, respectively. We can
also see that the worse off group is forced to prioritize the insurance premium
when considering taking out insurance in the future due to the difficult
economic environment they face. On the other hand, those better off – insured
scored high for “Interested in new products,” “can basically understand all
financial and insurance terms I see and hear” and “if the contents are good, will
51.7
47.6
26.1
25.4
18.4
11.8
10.9
10.2
6.1
3.0
3.0
46.3
37.7
22.1
25.3
20.1
11.7
7.7
8.2
6.6
4.0
3.5
57.8
70.4
26.7
17.8
13.3
4.4
7.4
17.0
4.4
2.2
0.7
50.5
46.7
25.8
29.0
17.6
14.6
13.7
11.6
6.5
2.3
3.6
71.7
70.5
42.2
20.8
17.9
9.2
17.3
8.1
4.0
2.3
0.6
0 10 20 30 40 50 60 70 80
Medical Protection
Death Protection
Income Security
Retirement Security
Savings
Care Protection
Funeral Preparation Costs
Preparation Costs for
Education/Marriage
Tax Advantage
Measures forInheritance Cost
Other
Total(N = 1485)
Better off-Insured(n = 648)
Better off-Not insured(n = 135)
Worse off-Insured(n = 527)
Worse off-Not insured(n = 173)
%
Figure 2-30 Purpose of getting coverage going forward
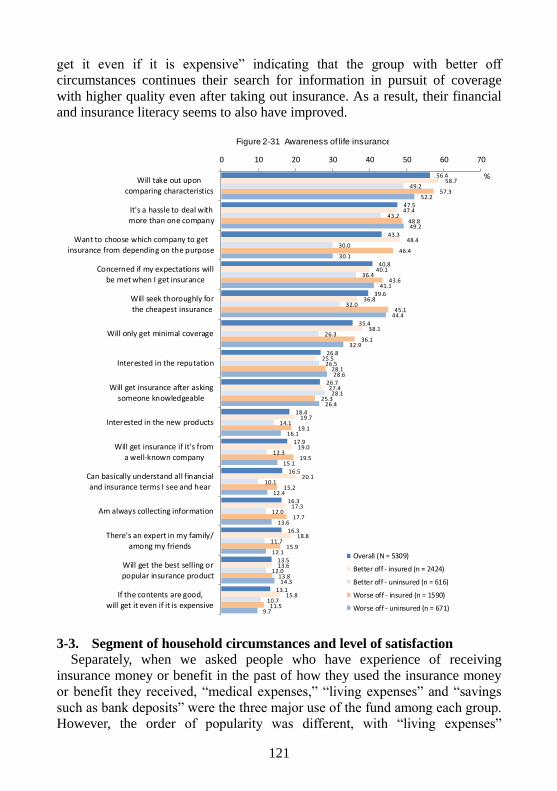
121
get it even if it is expensive” indicating that the group with better off
circumstances continues their search for information in pursuit of coverage
with higher quality even after taking out insurance. As a result, their financial
and insurance literacy seems to also have improved.
3-3. Segment of household circumstances and level of satisfaction
Separately, when we asked people who have experience of receiving
insurance money or benefit in the past of how they used the insurance money
or benefit they received, “medical expenses,” “living expenses” and “savings
such as bank deposits” were the three major use of the fund among each group.
However, the order of popularity was different, with “living expenses”
56.4
47.5
43.3
40.8
39.6
35.4
26.8
26.7
18.4
17.9
16.5
16.3
16.3
13.5
13.1
58.7
47.4
48.4
40.1
36.8
38.1
25.5
27.4
19.7
19.0
20.1
17.3
18.8
13.6
15.8
49.2
43.2
30.0
36.4
32.0
26.3
26.5
28.1
14.1
12.3
10.1
12.0
11.7
12.0
10.7
57.3
48.8
46.4
43.6
45.1
36.1
28.1
25.3
19.1
19.5
15.2
17.7
15.9
13.8
11.5
52.2
49.2
30.1
41.1
44.4
32.9
28.6
26.4
16.1
15.1
12.4
13.6
12.1
14.3
9.7
0 10 20 30 40 50 60 70
Will take out upon
comparing characteristics
It's a hassle to deal withmore than one company
Want to choose which company to get
insurance from depending on the purpose
Concerned if my expectations willbe met when I get insurance
Will seek thoroughly for
the cheapest insurance
Will only get minimal coverage
Interested in the reputation
Will get insurance after asking
someone knowledgeable
Interested in the new products
Will get insurance if it's from
a well-known company
Can basically understand all financialand insurance terms I see and hear
Am always collecting information
There's an expert in my family/among my friends
Will get the best selling or
popular insurance product
If the contents are good,will get it even if it is expensive
Overall (N = 5309)
Better off - insured (n = 2424)
Better off - uninsured (n = 616)
Worse off - insured (n = 1590)
Worse off - uninsured (n = 671)
%
Figure 2-31 Awareness of life insurance
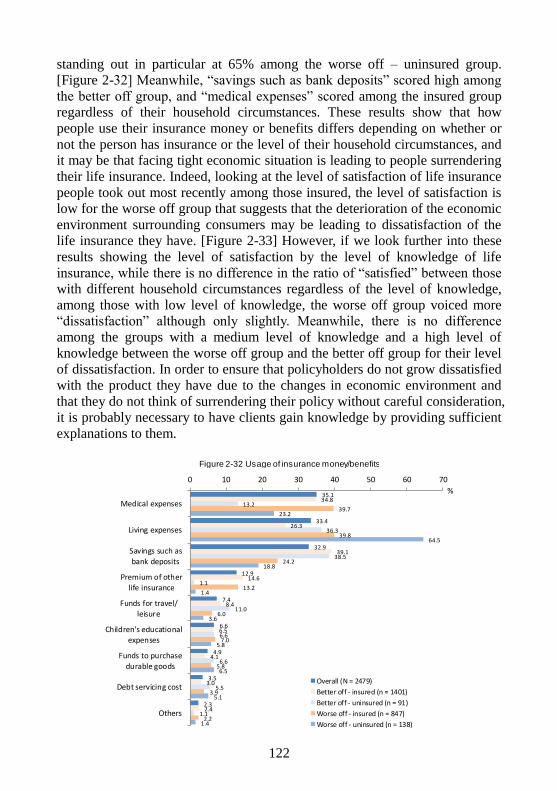
122
standing out in particular at 65% among the worse off – uninsured group.
[Figure 2-32] Meanwhile, “savings such as bank deposits” scored high among
the better off group, and “medical expenses” scored among the insured group
regardless of their household circumstances. These results show that how
people use their insurance money or benefits differs depending on whether or
not the person has insurance or the level of their household circumstances, and
it may be that facing tight economic situation is leading to people surrendering
their life insurance. Indeed, looking at the level of satisfaction of life insurance
people took out most recently among those insured, the level of satisfaction is
low for the worse off group that suggests that the deterioration of the economic
environment surrounding consumers may be leading to dissatisfaction of the
life insurance they have. [Figure 2-33] However, if we look further into these
results showing the level of satisfaction by the level of knowledge of life
insurance, while there is no difference in the ratio of “satisfied” between those
with different household circumstances regardless of the level of knowledge,
among those with low level of knowledge, the worse off group voiced more
“dissatisfaction” although only slightly. Meanwhile, there is no difference
among the groups with a medium level of knowledge and a high level of
knowledge between the worse off group and the better off group for their level
of dissatisfaction. In order to ensure that policyholders do not grow dissatisfied
with the product they have due to the changes in economic environment and
that they do not think of surrendering their policy without careful consideration,
it is probably necessary to have clients gain knowledge by providing sufficient
explanations to them.
35.1
33.4
32.9
12.9
7.4
6.6
4.9
3.5
2.3
34.8
26.3
39.1
14.6
8.4
6.5
4.1
3.0
2.4
13.2
36.3
38.5
1.1
11.0
6.6
6.6
5.5
1.1
39.7
39.8
24.2
13.2
6.0
7.0
5.8
3.9
2.2
23.2
64.5
18.8
1.4
3.6
5.8
6.5
5.1
1.4
0 10 20 30 40 50 60 70
Medical expenses
Living expenses
Savings such as
bank deposits
Premium of other
life insurance
Funds for travel/
leisure
Children's educationalexpenses
Funds to purchasedurable goods
Debt servicing cost
Others
Overall (N = 2479)
Better off - insured (n = 1401)
Better off - uninsured (n = 91)
Worse off - insured (n = 847)
Worse off - uninsured (n = 138)
%
Figure 2-32 Usage of insurance money/benefits
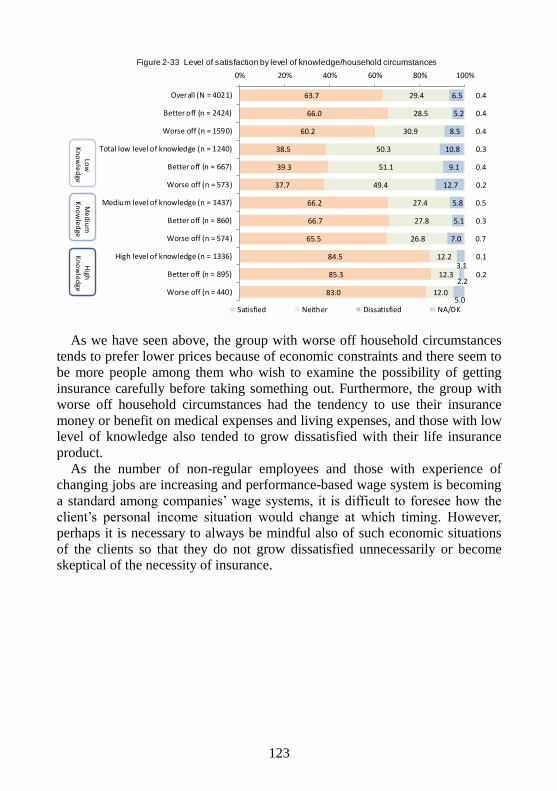
123
As we have seen above, the group with worse off household circumstances
tends to prefer lower prices because of economic constraints and there seem to
be more people among them who wish to examine the possibility of getting
insurance carefully before taking something out. Furthermore, the group with
worse off household circumstances had the tendency to use their insurance
money or benefit on medical expenses and living expenses, and those with low
level of knowledge also tended to grow dissatisfied with their life insurance
product.
As the number of non-regular employees and those with experience of
changing jobs are increasing and performance-based wage system is becoming
a standard among companies’ wage systems, it is difficult to foresee how the
client’s personal income situation would change at which timing. However,
perhaps it is necessary to always be mindful also of such economic situations
of the clients so that they do not grow dissatisfied unnecessarily or become
skeptical of the necessity of insurance.
63.7
66.0
60.2
38.5
39.3
37.7
66.2
66.7
65.5
84.5
85.3
83.0
29.4
28.5
30.9
50.3
51.1
49.4
27.4
27.8
26.8
12.2
12.3
12.0
6.5
5.2
8.5
10.8
9.1
12.7
5.8
5.1
7.0
3.1
2.2
5.0
0.4
0.4
0.4
0.3
0.4
0.2
0.5
0.3
0.7
0.1
0.2
0% 20% 40% 60% 80% 100%
Overall (N = 4021)
Better off (n = 2424)
Worse off (n = 1590)
Total low level of knowledge (n = 1240)
Better off (n = 667)
Worse off (n = 573)
Medium level of knowledge (n = 1437)
Better off (n = 860)
Worse off (n = 574)
High level of knowledge (n = 1336)
Better off (n = 895)
Worse off (n = 440)
Satisfied Neither Dissatisfied NA/DK
Low
K
no
wle
dge
Me
diu
m
Kn
ow
led
geH
igh
Kn
ow
led
ge
Figure 2-33 Level of satisfaction by level of knowledge/household circumstances
124
Chapter 3: Consumer Insurance Literacy and Actions to Examine the
Possibility of Getting Insurance
As has been mentioned here and there in Part 1 and in the previous chapters,
there are disparities in consumer knowledge of insurance and the examination
process, and the information sources people use when examining the
possibility of taking out insurance differ depending on the level of knowledge
of insurance. Therefore, it has been pointed out that it is necessary to
accommodate such differences. So what are the factors creating such
disparities in knowledge between consumers? And what kinds of differences
are these disparities in knowledge making in the overall process of
examination?
In this chapter, we will focus on consumer literacy of insurance and review
the factors leading to these disparities in insurance literacy, as well as the
differences the disparities in literacy are making in the examination process.
1. Formative Factors of Insurance Literacy
1-1. Basic knowledge of insurance We reviewed how correct or incorrect individuals’ understanding of basic
items was from a ten-item quiz10
on basic knowledge of life insurance in
which people were asked to choose which items were correct. [Figure 3-1]
According to the results, items with a high percentage of correct answers
overall were, “you cannot take out insurance over the Internet” scoring the
highest at 78%, followed by “with medical insurance and cancer insurance,
there are cases in which you cannot receive insurance money/benefits
depending on the type or degree of illness” (67%) and “you can receive
benefits from only one company even if you took out medical insurance from
multiple companies” (64%), up to which 60% of people answered correctly.
[Figure 3-2] Conversely, items with a low percentage of correct answers scored
even less than 30% with “term insurance provides maturity proceeds at the
time of expiration of the indemnity period” at 25% and “general medical
insurance does not provide coverage for illness specific to females” at 26%.
This means there are items of which more than 70% of consumers either have
an incorrect understanding or cannot tell right from wrong. Although those
who have insurance showed a somewhat higher percentage of correct answers
than the overall figures, which includes the results of non-policyholders, the situation was not so different for policyholders with the percentage of
questions answered correctly falling below 30% for the bottom 2 box,
10 In this survey, people were asked to choose one of the three options of “correct,”
“incorrect,” and “don’t know” for the ten items shown in Figure 3-1.
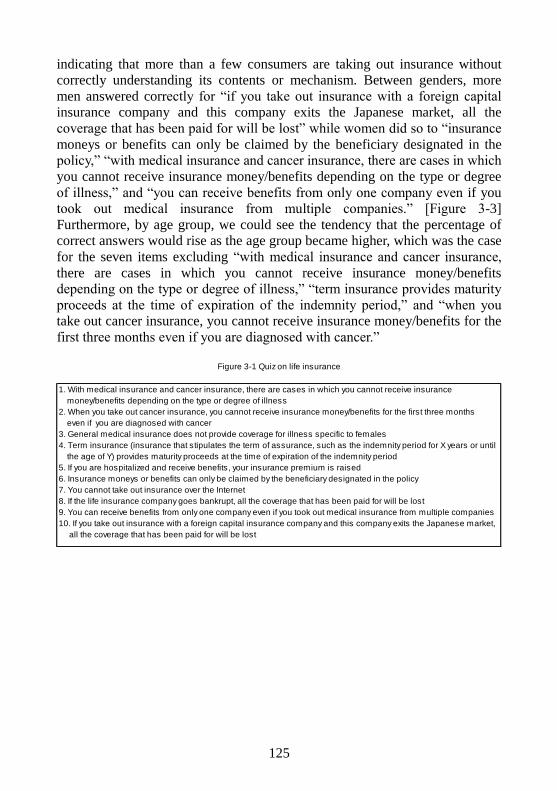
125
indicating that more than a few consumers are taking out insurance without
correctly understanding its contents or mechanism. Between genders, more
men answered correctly for “if you take out insurance with a foreign capital
insurance company and this company exits the Japanese market, all the
coverage that has been paid for will be lost” while women did so to “insurance
moneys or benefits can only be claimed by the beneficiary designated in the
policy,” “with medical insurance and cancer insurance, there are cases in which
you cannot receive insurance money/benefits depending on the type or degree
of illness,” and “you can receive benefits from only one company even if you
took out medical insurance from multiple companies.” [Figure 3-3]
Furthermore, by age group, we could see the tendency that the percentage of
correct answers would rise as the age group became higher, which was the case
for the seven items excluding “with medical insurance and cancer insurance,
there are cases in which you cannot receive insurance money/benefits
depending on the type or degree of illness,” “term insurance provides maturity
proceeds at the time of expiration of the indemnity period,” and “when you
take out cancer insurance, you cannot receive insurance money/benefits for the
first three months even if you are diagnosed with cancer.”
Figure 3-1 Quiz on life insurance
1. With medical insurance and cancer insurance, there are cases in which you cannot receive insurance
money/benefits depending on the type or degree of illness
2. When you take out cancer insurance, you cannot receive insurance money/benefits for the first three months
even if you are diagnosed with cancer
3. General medical insurance does not provide coverage for illness specific to females
4. Term insurance (insurance that stipulates the term of assurance, such as the indemnity period for X years or until
the age of Y) provides maturity proceeds at the time of expiration of the indemnity period
5. If you are hospitalized and receive benefits, your insurance premium is raised
6. Insurance moneys or benefits can only be claimed by the beneficiary designated in the policy
7. You cannot take out insurance over the Internet
8. If the life insurance company goes bankrupt, all the coverage that has been paid for will be lost
9. You can receive benefits from only one company even if you took out medical insurance from multiple companies
10. If you take out insurance with a foreign capital insurance company and this company exits the Japanese market,
all the coverage that has been paid for will be lost
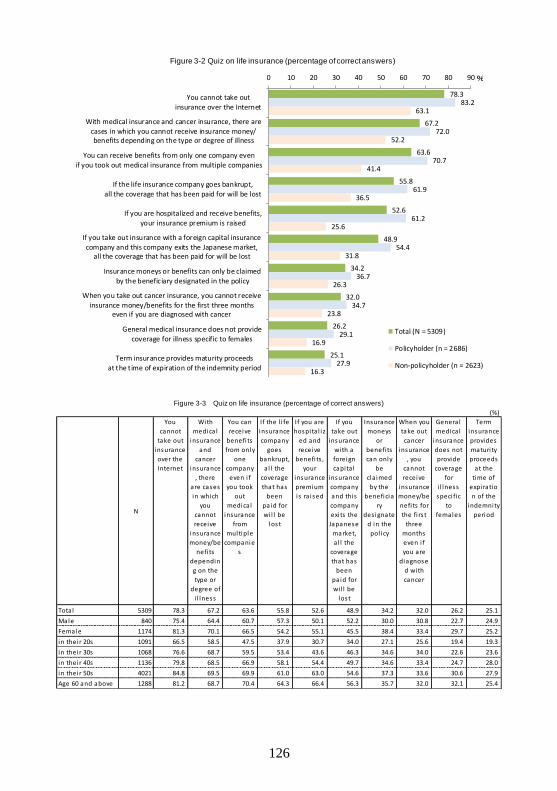
126
78.3
67.2
63.6
55.8
52.6
48.9
34.2
32.0
26.2
25.1
83.2
72.0
70.7
61.9
61.2
54.4
36.7
34.7
29.1
27.9
63.1
52.2
41.4
36.5
25.6
31.8
26.3
23.8
16.9
16.3
0 10 20 30 40 50 60 70 80 90
You cannot take outinsurance over the Internet
With medical insurance and cancer insurance, there are
cases in which you cannot receive insurance money/benefits depending on the type or degree of illness
You can receive benefits from only one company even
if you took out medical insurance from multiple companies
If the life insurance company goes bankrupt,all the coverage that has been paid for will be lost
If you are hospitalized and receive benefits,your insurance premium is raised
If you take out insurance with a foreign capital insurancecompany and this company exits the Japanese market,
all the coverage that has been paid for will be lost
Insurance moneys or benefits can only be claimed
by the beneficiary designated in the policy
When you take out cancer insurance, you cannot receiveinsurance money/benefits for the first three months
even if you are diagnosed with cancer
General medical insurance does not providecoverage for illness specific to females
Term insurance provides maturity proceedsat the time of expiration of the indemnity period
Total (N = 5309)
Policyholder (n = 2686)
Non-policyholder (n = 2623)
%
Figure 3-2 Quiz on life insurance (percentage of correct answers)
(%)
N
You
cannot
take out
insurance
over the
Internet
With
medica l
insurance
and
cancer
insurance
, there
are cases
in which
you
cannot
receive
insurance
money/be
nefi ts
dependin
g on the
type or
degree of
i l lness
You can
receive
benefi ts
from only
one
company
even i f
you took
out
medica l
insurance
from
multiple
companie
s
If the l i fe
insurance
company
goes
bankrupt,
a l l the
coverage
that has
been
paid for
wi l l be
lost
If you are
hospita l i z
ed and
receive
benefi ts ,
your
insurance
premium
is ra ised
If you
take out
insurance
with a
foreign
capita l
insurance
company
and this
company
exits the
Japanese
market,
a l l the
coverage
that has
been
paid for
wi l l be
lost
Insurance
moneys
or
benefi ts
can only
be
cla imed
by the
beneficia
ry
des ignate
d in the
pol icy
When you
take out
cancer
insurance
, you
cannot
receive
insurance
money/be
nefi ts for
the fi rs t
three
months
even i f
you are
diagnose
d with
cancer
General
medica l
insurance
does not
provide
coverage
for
i l lness
speci fic
to
females
Term
insurance
provides
maturi ty
proceeds
at the
time of
expiratio
n of the
indemnity
period
Total 5309 78.3 67.2 63.6 55.8 52.6 48.9 34.2 32.0 26.2 25.1
Male 840 75.4 64.4 60.7 57.3 50.1 52.2 30.0 30.8 22.7 24.9
Female 1174 81.3 70.1 66.5 54.2 55.1 45.5 38.4 33.4 29.7 25.2
in their 20s 1091 66.5 58.5 47.5 37.9 30.7 34.0 27.1 25.6 19.4 19.3
in their 30s 1068 76.6 68.7 59.5 53.4 43.6 46.3 34.6 34.0 22.6 23.6
in their 40s 1136 79.8 68.5 66.9 58.1 54.4 49.7 34.6 33.4 24.7 28.0
in their 50s 4021 84.8 69.5 69.9 61.0 63.0 54.6 37.3 33.6 30.6 27.9
Age 60 and above 1288 81.2 68.7 70.4 64.3 66.4 56.3 35.7 32.0 32.1 25.4
Figure 3-3 Quiz on life insurance (percentage of correct answers)
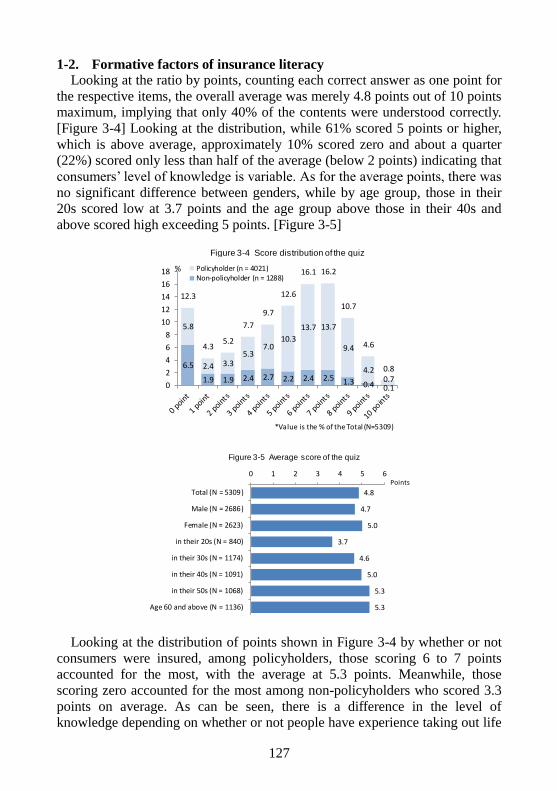
127
1-2. Formative factors of insurance literacy Looking at the ratio by points, counting each correct answer as one point for
the respective items, the overall average was merely 4.8 points out of 10 points
maximum, implying that only 40% of the contents were understood correctly.
[Figure 3-4] Looking at the distribution, while 61% scored 5 points or higher,
which is above average, approximately 10% scored zero and about a quarter
(22%) scored only less than half of the average (below 2 points) indicating that
consumers’ level of knowledge is variable. As for the average points, there was
no significant difference between genders, while by age group, those in their
20s scored low at 3.7 points and the age group above those in their 40s and
above scored high exceeding 5 points. [Figure 3-5]
Looking at the distribution of points shown in Figure 3-4 by whether or not
consumers were insured, among policyholders, those scoring 6 to 7 points
accounted for the most, with the average at 5.3 points. Meanwhile, those
scoring zero accounted for the most among non-policyholders who scored 3.3
points on average. As can be seen, there is a difference in the level of
knowledge depending on whether or not people have experience taking out life
6.5
1.9 1.9 2.4 2.7 2.2 2.4 2.5 1.3 0.4 0.1
5.8
2.4 3.35.3
7.010.3
13.7 13.7
9.4
4.20.7
12.3
4.35.2
7.7
9.7
12.6
16.1 16.2
10.7
4.6
0.8
0
2
4
6
8
10
12
14
16
18 Policyholder (n = 4021)Non-policyholder (n = 1288)
%
*Value is the % of the Total (N=5309)
Figure 3-4 Score distribution of the quiz
4.8
4.7
5.0
3.7
4.6
5.0
5.3
5.3
0 1 2 3 4 5 6
Total (N = 5309)
Male (N = 2686)
Female (N = 2623)
in their 20s (N = 840)
in their 30s (N = 1174)
in their 40s (N = 1091)
in their 50s (N = 1068)
Age 60 and above (N = 1136)
Points
Figure 3-5 Average score of the quiz
128
insurance. However, even among those with life insurance, the scores were
distributed widely between zero and 10 points with 10% scoring less than 2
points. Moreover, a little less than 10% of non-policyholders did score higher
than the average, indicating that the formative factors for insurance literacy are
not confined simply to whether the person has insurance or not.
In a focused group interview performed in the past as well, there were
comments as shown below, from which it can be assumed that there are
consumers who try to arm themselves with knowledge before facing the seller
in order to reduce the information asymmetry as much as possible.
・ It’s better to request information after obtaining a certain degree of
knowledge by looking into the costs at insurance companies’ websites or
the kind of riders available with which company, and what is the best
way for what than to do so without knowing anything. (Male, 37)
・ I thought I wanted to see for myself what’s out there for about a month
after I decided to switch. I contacted a sales agent upon checking out the
kind of background knowledge such as what kind of differences there are,
what kind of options there are, and if there was anything that suits my
situation. (Male, 51)
Then, what are the factors creating disparities in insurance literacy among
consumers?
Looking at the source of information in daily life by the level of
knowledge,11
overall, “TV programs” scored the highest at 81% followed by
“portal sites/news sites” (71%) and “general newspapers” (59%) up to which
more than half of the respondents were watching or reading. [Figure 3-6] By
level of knowledge, people with a high level of knowledge scored higher for
most items compared to those with a low level of knowledge. In particular, for
“general newspapers,” while those with a low level of knowledge scored 49%
or less than half, those with a high level of knowledge scored 72%, showing a
large discrepancy. In addition, those with a high level of knowledge scored
higher for “catalogues/brochures” (eleven-point difference), as well as for
“websites of individual companies,” “magazines” and “direct mails”
(eight-point difference respectively). Meanwhile, the only item for which those
with a low level of knowledge scored higher was “blogs/twitter” at 22% or a
six-point difference.12
11 Respondents classified according to the score distribution of the quiz with those
scoring 4 points or less as people with a low level of knowledge, those between 5-7 points as people with a medium level of knowledge, and those scoring 8 points or higher as people with a high level of knowledge.
12 The fact that “blogs/twitter” scored high among those with a low level of knowledge is likely because many of those who chose this item were those of the younger generation whose average score is low.

129
As has been seen, the source of information in daily life differs according to
the level of insurance literacy and those with a high level of knowledge access
different information sources on a regular basis with “general newspapers” as
their main source. Furthermore, as we have seen in the preceding chapter, the
percentage of those who would “constantly gather information” on a regular
basis was higher for policyholders than non-policyholders. The disparity in
insurance literacy seems to come from the differences in the media people
regularly come into contact with and the actual experience of examining the
possibility of taking out insurance.
Consumers with different levels of insurance literacy also show a difference
in their purchasing behaviors for items other than insurance. In fact, looking at
the execution rate of actions when examining the possibilities of taking out
insurance by the actions people take in making daily purchases, namely between “A: I am of the type who researches myself until convinced” and “B: I
am of the type who wants to receive explanations from someone
knowledgeable,” among those of the type A who research until they are
convinced, 42% said they “examine the necessity of assurance” whereas the
percentage was 35% for those of type B who wish to receive explanations by
81.1
71.0
59.4
28.5
26.7
26.1
24.7
22.3
21.0
19.2
19.0
18.8
18.7
17.5
14.4
77.8
68.5
49.2
26.5
24.1
23.7
21.4
19.7
17.7
15.1
21.6
14.7
16.8
14.8
16.4
82.9
72.3
63.7
30.4
28.3
26.2
26.0
23.9
23.2
21.3
18.0
20.1
20.4
18.5
13.4
84.2
73.2
72.0
27.9
28.8
31.9
29.0
24.3
23.1
23.3
15.6
25.3
18.4
21.2
12.5
0 20 40 60 80 100
TV programs
Portal sites/news sites
(General) newspapers
Friends/acquaintances
Family
Websites ofindividual companies
Magazines
Mail magazines
Store counters
Direct mails
Blogs/twitter
Catalogues/brochures
Radio program
Free papers
SNS
Total (N = 5309)
Group with low-level of knowledge (n = 2075)
Group with medium-level of knowledge (n = 2381)
Group with high-level of knowledge (n = 853)
%
Figure 3-6 The source of information in daily life (top 15 items)
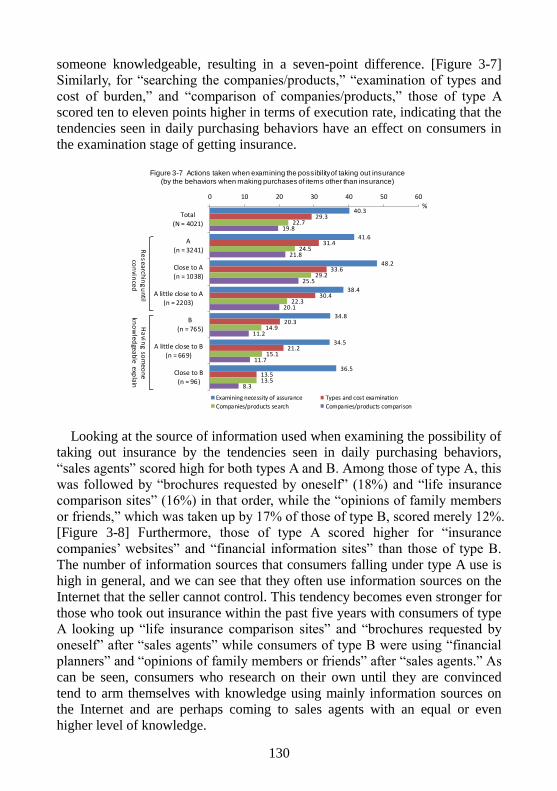
130
someone knowledgeable, resulting in a seven-point difference. [Figure 3-7]
Similarly, for “searching the companies/products,” “examination of types and
cost of burden,” and “comparison of companies/products,” those of type A
scored ten to eleven points higher in terms of execution rate, indicating that the
tendencies seen in daily purchasing behaviors have an effect on consumers in
the examination stage of getting insurance.
Looking at the source of information used when examining the possibility of
taking out insurance by the tendencies seen in daily purchasing behaviors,
“sales agents” scored high for both types A and B. Among those of type A, this
was followed by “brochures requested by oneself” (18%) and “life insurance
comparison sites” (16%) in that order, while the “opinions of family members
or friends,” which was taken up by 17% of those of type B, scored merely 12%.
[Figure 3-8] Furthermore, those of type A scored higher for “insurance
companies’ websites” and “financial information sites” than those of type B.
The number of information sources that consumers falling under type A use is
high in general, and we can see that they often use information sources on the
Internet that the seller cannot control. This tendency becomes even stronger for
those who took out insurance within the past five years with consumers of type
A looking up “life insurance comparison sites” and “brochures requested by
oneself” after “sales agents” while consumers of type B were using “financial planners” and “opinions of family members or friends” after “sales agents.” As
can be seen, consumers who research on their own until they are convinced
tend to arm themselves with knowledge using mainly information sources on
the Internet and are perhaps coming to sales agents with an equal or even
higher level of knowledge.
40.3
41.6
48.2
38.4
34.8
34.5
36.5
29.3
31.4
33.6
30.4
20.3
21.2
13.5
22.7
24.5
29.2
22.3
14.9
15.1
13.5
19.8
21.8
25.5
20.1
11.2
11.7
8.3
0 10 20 30 40 50 60
Total(N = 4021)
A(n = 3241)
Close to A
(n = 1038)
A little close to A(n = 2203)
B
(n = 765)
A little close to B(n = 669)
Close to B(n = 96)
Examining necessity of assurance Types and cost examination
Companies/products search Companies/products comparison
%
Re
search
ing
un
til
con
vinced
Ha
ving so
meo
ne
kno
wled
geable explain
Figure 3-7 Actions taken when examining the possibility of taking out insurance (by the behaviors when making purchases of items other than insurance)
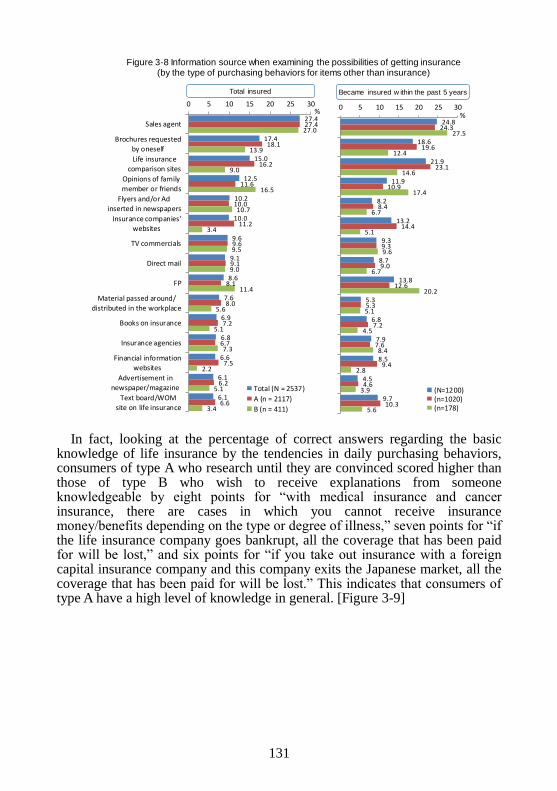
131
In fact, looking at the percentage of correct answers regarding the basic knowledge of life insurance by the tendencies in daily purchasing behaviors, consumers of type A who research until they are convinced scored higher than those of type B who wish to receive explanations from someone knowledgeable by eight points for “with medical insurance and cancer insurance, there are cases in which you cannot receive insurance money/benefits depending on the type or degree of illness,” seven points for “if the life insurance company goes bankrupt, all the coverage that has been paid for will be lost,” and six points for “if you take out insurance with a foreign capital insurance company and this company exits the Japanese market, all the coverage that has been paid for will be lost.” This indicates that consumers of type A have a high level of knowledge in general. [Figure 3-9]
生命保険の口コミサイト・掲示板
24.8
18.6
21.9
11.9
8.2
13.2
9.3
8.7
13.8
5.3
6.8
7.9
8.5
4.5
9.7
24.3
19.6
23.1
10.9
8.4
14.4
9.3
9.0
12.6
5.3
7.2
7.6
9.4
4.6
10.3
27.5
12.4
14.6
17.4
6.7
5.1
9.6
6.7
20.2
5.1
4.5
8.4
2.8
3.9
5.6
0 5 10 15 20 25 30
営業職員
自ら請求
した資料生命保険の
比較サイト家族、友
人等の話折込広告
やチラシ保険会社
のサイト
TVCM
DM
FP
勤務先の
配布・回覧保険に関
する書籍
保険代理店
マネー情
報サイト新聞・
雑誌広告生命保険の口コミ
サイト・掲示板
(N=1200)(n=1020)(n=178)
%27.4
17.4
15.0
12.5
10.2
10.0
9.6
9.1
8.6
7.6
6.9
6.8
6.6
6.1
6.1
27.4
18.1
16.2
11.6
10.0
11.2
9.6
9.1
8.1
8.0
7.2
6.7
7.5
6.2
6.6
27.0
13.9
9.0
16.5
10.7
3.4
9.5
9.0
11.4
5.6
5.1
7.3
2.2
5.1
3.4
0 5 10 15 20 25 30
Sales agent
Brochures requested
by oneself
Life insurancecomparison sites
Opinions of family
member or friends
Flyers and/or Adinserted in newspapers
Insurance companies'websites
TV commercials
Direct mail
FP
Material passed around/
distributed in the workplace
Books on insurance
Insurance agencies
Financial information
websites
Advertisement innewspaper/magazine
Text board/WOM
site on life insurance
Total (N = 2537)
A (n = 2117)
B (n = 411)
%
Total insured Became insured w ithin the past 5 years
Figure 3-8 Information source when examining the possibilities of getting insurance(by the type of purchasing behaviors for items other than insurance)
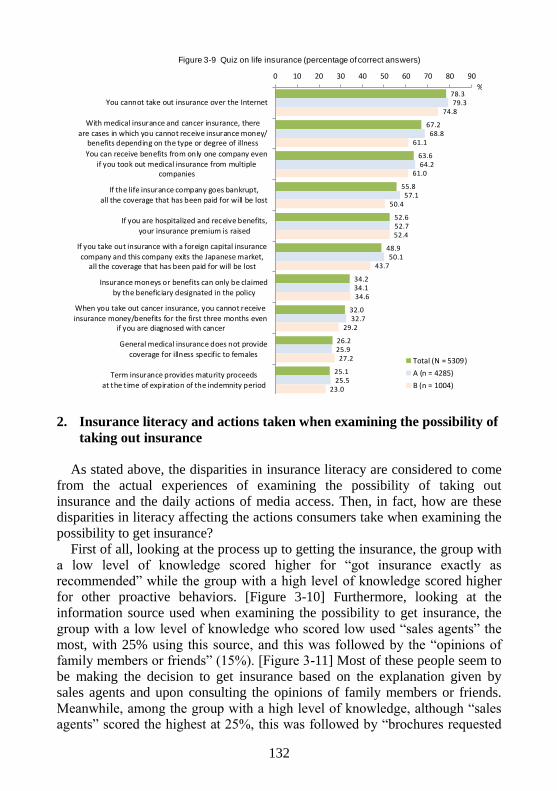
132
2. Insurance literacy and actions taken when examining the possibility of
taking out insurance
As stated above, the disparities in insurance literacy are considered to come
from the actual experiences of examining the possibility of taking out
insurance and the daily actions of media access. Then, in fact, how are these disparities in literacy affecting the actions consumers take when examining the
possibility to get insurance?
First of all, looking at the process up to getting the insurance, the group with
a low level of knowledge scored higher for “got insurance exactly as recommended” while the group with a high level of knowledge scored higher
for other proactive behaviors. [Figure 3-10] Furthermore, looking at the
information source used when examining the possibility to get insurance, the
group with a low level of knowledge who scored low used “sales agents” the
most, with 25% using this source, and this was followed by the “opinions of family members or friends” (15%). [Figure 3-11] Most of these people seem to
be making the decision to get insurance based on the explanation given by
sales agents and upon consulting the opinions of family members or friends.
Meanwhile, among the group with a high level of knowledge, although “sales agents” scored the highest at 25%, this was followed by “brochures requested
78.3
67.2
63.6
55.8
52.6
48.9
34.2
32.0
26.2
25.1
79.3
68.8
64.2
57.1
52.7
50.1
34.1
32.7
25.9
25.5
74.8
61.1
61.0
50.4
52.4
43.7
34.6
29.2
27.2
23.0
0 10 20 30 40 50 60 70 80 90
You cannot take out insurance over the Internet
With medical insurance and cancer insurance, thereare cases in which you cannot receive insurance money/
benefits depending on the type or degree of illness
You can receive benefits from only one company even
if you took out medical insurance from multiplecompanies
If the life insurance company goes bankrupt,all the coverage that has been paid for will be lost
If you are hospitalized and receive benefits,your insurance premium is raised
If you take out insurance with a foreign capital insurance
company and this company exits the Japanese market,all the coverage that has been paid for will be lost
Insurance moneys or benefits can only be claimedby the beneficiary designated in the policy
When you take out cancer insurance, you cannot receiveinsurance money/benefits for the first three months even
if you are diagnosed with cancer
General medical insurance does not provide
coverage for illness specific to females
Term insurance provides maturity proceedsat the time of expiration of the indemnity period
Total (N = 5309)
A (n = 4285)
B (n = 1004)
%
Figure 3-9 Quiz on life insurance (percentage of correct answers)
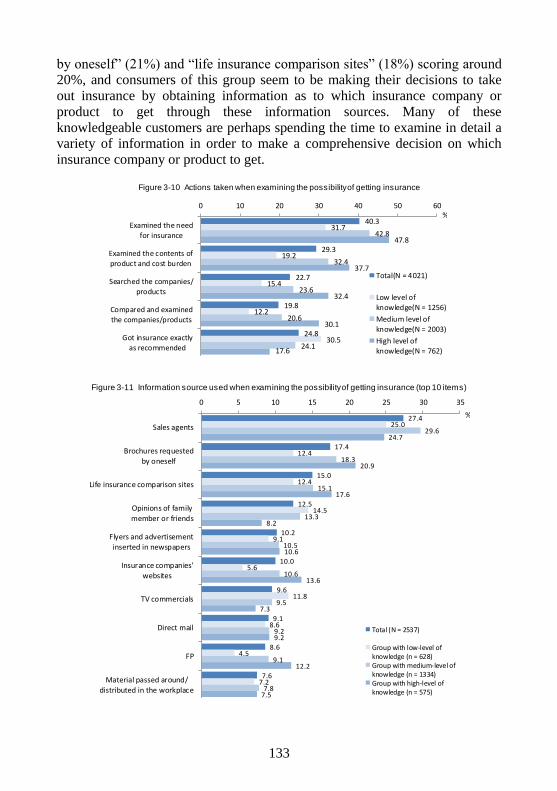
133
by oneself” (21%) and “life insurance comparison sites” (18%) scoring around 20%, and consumers of this group seem to be making their decisions to take
out insurance by obtaining information as to which insurance company or
product to get through these information sources. Many of these
knowledgeable customers are perhaps spending the time to examine in detail a variety of information in order to make a comprehensive decision on which
insurance company or product to get.
40.3
29.3
22.7
19.8
24.8
31.7
19.2
15.4
12.2
30.5
42.8
32.4
23.6
20.6
24.1
47.8
37.7
32.4
30.1
17.6
0 10 20 30 40 50 60
Examined the needfor insurance
Examined the contents ofproduct and cost burden
Searched the companies/
products
Compared and examined
the companies/products
Got insurance exactlyas recommended
Total(N = 4021)
Low level ofknowledge(N = 1256)
Medium level of
knowledge(N = 2003)
High level ofknowledge(N = 762)
%
Figure 3-10 Actions taken when examining the possibility of getting insurance
27.4
17.4
15.0
12.5
10.2
10.0
9.6
9.1
8.6
7.6
25.0
12.4
12.4
14.5
9.1
5.6
11.8
8.6
4.5
7.2
29.6
18.3
15.1
13.3
10.5
10.6
9.5
9.2
9.1
7.8
24.7
20.9
17.6
8.2
10.6
13.6
7.3
9.2
12.2
7.5
0 5 10 15 20 25 30 35
Sales agents
Brochures requestedby oneself
Life insurance comparison sites
Opinions of familymember or friends
Flyers and advertisementinserted in newspapers
Insurance companies'websites
TV commercials
Direct mail
FP
Material passed around/distributed in the workplace
Total (N = 2537)
Group with low-level ofknowledge (n = 628)Group with medium-level ofknowledge (n = 1334)Group with high-level ofknowledge (n = 575)
%
Figure 3-11 Information source used when examining the possibility of getting insurance (top 10 items)
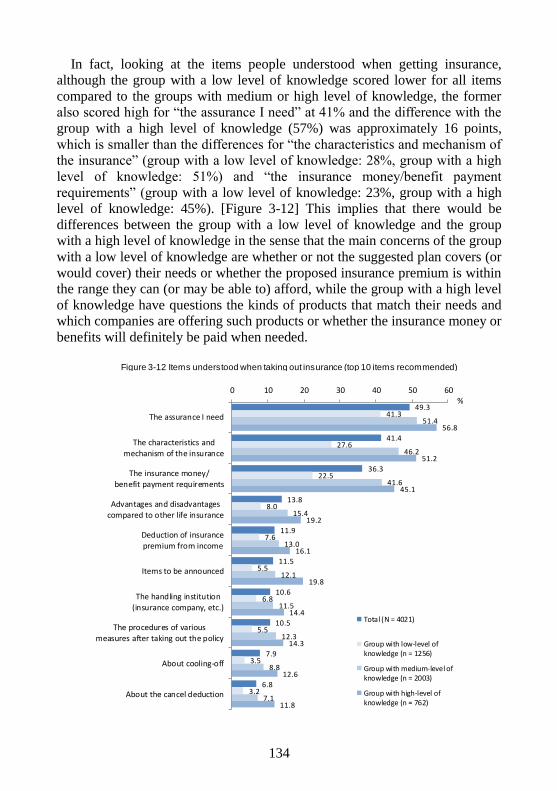
134
In fact, looking at the items people understood when getting insurance,
although the group with a low level of knowledge scored lower for all items
compared to the groups with medium or high level of knowledge, the former
also scored high for “the assurance I need” at 41% and the difference with the
group with a high level of knowledge (57%) was approximately 16 points,
which is smaller than the differences for “the characteristics and mechanism of
the insurance” (group with a low level of knowledge: 28%, group with a high
level of knowledge: 51%) and “the insurance money/benefit payment
requirements” (group with a low level of knowledge: 23%, group with a high
level of knowledge: 45%). [Figure 3-12] This implies that there would be
differences between the group with a low level of knowledge and the group
with a high level of knowledge in the sense that the main concerns of the group
with a low level of knowledge are whether or not the suggested plan covers (or
would cover) their needs or whether the proposed insurance premium is within
the range they can (or may be able to) afford, while the group with a high level
of knowledge have questions the kinds of products that match their needs and
which companies are offering such products or whether the insurance money or
benefits will definitely be paid when needed.
49.3
41.4
36.3
13.8
11.9
11.5
10.6
10.5
7.9
6.8
41.3
27.6
22.5
8.0
7.6
5.5
6.8
5.5
3.5
3.2
51.4
46.2
41.6
15.4
13.0
12.1
11.5
12.3
8.8
7.1
56.8
51.2
45.1
19.2
16.1
19.8
14.4
14.3
12.6
11.8
0 10 20 30 40 50 60
The assurance I need
The characteristics andmechanism of the insurance
The insurance money/benefit payment requirements
Advantages and disadvantagescompared to other life insurance
Deduction of insurancepremium from income
Items to be announced
The handling institution
(insurance company, etc.)
The procedures of variousmeasures after taking out the policy
About cooling-off
About the cancel deduction
Total (N = 4021)
Group with low-level ofknowledge (n = 1256)
Group with medium-level ofknowledge (n = 2003)
Group with high-level ofknowledge (n = 762)
%
Figure 3-12 Items understood when taking out insurance (top 10 items recommended)
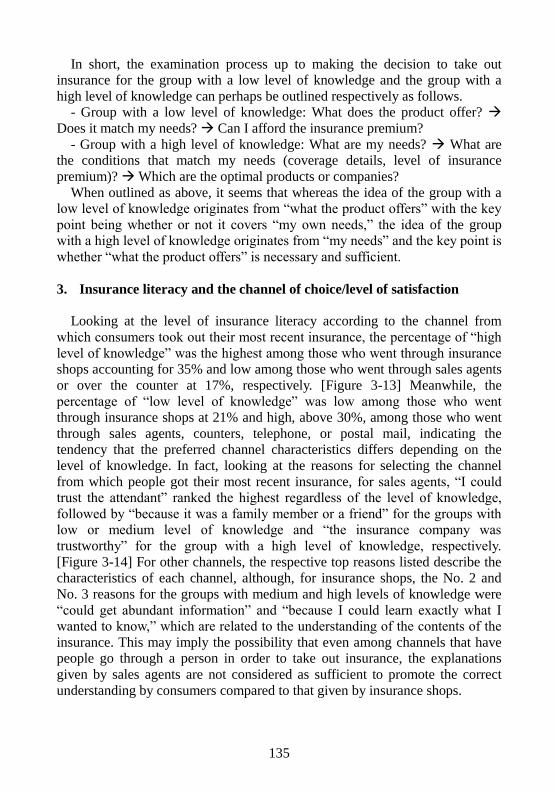
135
In short, the examination process up to making the decision to take out
insurance for the group with a low level of knowledge and the group with a
high level of knowledge can perhaps be outlined respectively as follows.
- Group with a low level of knowledge: What does the product offer?
Does it match my needs? Can I afford the insurance premium?
- Group with a high level of knowledge: What are my needs? What are
the conditions that match my needs (coverage details, level of insurance
premium)? Which are the optimal products or companies?
When outlined as above, it seems that whereas the idea of the group with a
low level of knowledge originates from “what the product offers” with the key
point being whether or not it covers “my own needs,” the idea of the group
with a high level of knowledge originates from “my needs” and the key point is
whether “what the product offers” is necessary and sufficient.
3. Insurance literacy and the channel of choice/level of satisfaction
Looking at the level of insurance literacy according to the channel from
which consumers took out their most recent insurance, the percentage of “high
level of knowledge” was the highest among those who went through insurance
shops accounting for 35% and low among those who went through sales agents
or over the counter at 17%, respectively. [Figure 3-13] Meanwhile, the
percentage of “low level of knowledge” was low among those who went
through insurance shops at 21% and high, above 30%, among those who went
through sales agents, counters, telephone, or postal mail, indicating the
tendency that the preferred channel characteristics differs depending on the
level of knowledge. In fact, looking at the reasons for selecting the channel
from which people got their most recent insurance, for sales agents, “I could
trust the attendant” ranked the highest regardless of the level of knowledge,
followed by “because it was a family member or a friend” for the groups with
low or medium level of knowledge and “the insurance company was
trustworthy” for the group with a high level of knowledge, respectively.
[Figure 3-14] For other channels, the respective top reasons listed describe the
characteristics of each channel, although, for insurance shops, the No. 2 and
No. 3 reasons for the groups with medium and high levels of knowledge were
“could get abundant information” and “because I could learn exactly what I
wanted to know,” which are related to the understanding of the contents of the
insurance. This may imply the possibility that even among channels that have people go through a person in order to take out insurance, the explanations
given by sales agents are not considered as sufficient to promote the correct
understanding by consumers compared to that given by insurance shops.
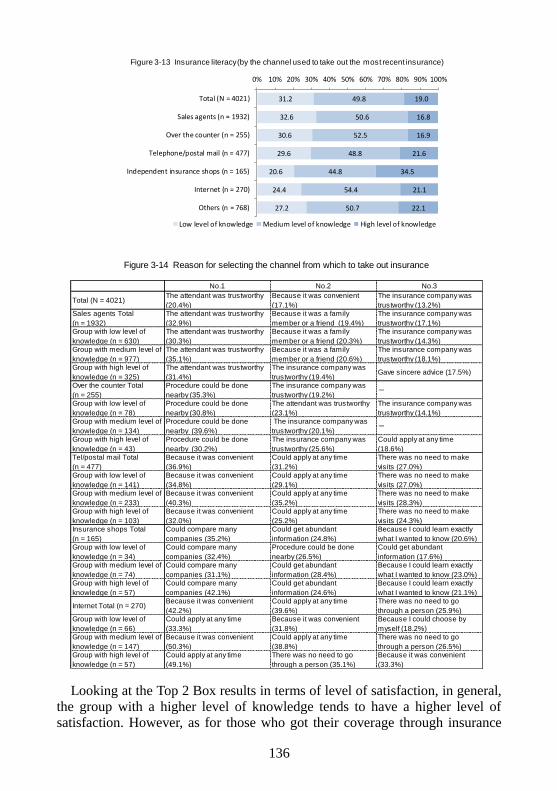
136
Looking at the Top 2 Box results in terms of level of satisfaction, in general,
the group with a higher level of knowledge tends to have a higher level of
satisfaction. However, as for those who got their coverage through insurance
31.2
32.6
30.6
29.6
20.6
24.4
27.2
49.8
50.6
52.5
48.8
44.8
54.4
50.7
19.0
16.8
16.9
21.6
34.5
21.1
22.1
0% 10% 20% 30% 40% 50% 60% 70% 80% 90% 100%
Total (N = 4021)
Sales agents (n = 1932)
Over the counter (n = 255)
Telephone/postal mail (n = 477)
Independent insurance shops (n = 165)
Internet (n = 270)
Others (n = 768)
Low level of knowledge Medium level of knowledge High level of knowledge
Figure 3-13 Insurance literacy (by the channel used to take out the most recent insurance)
No.1 No.2 No.3
Total (N = 4021)The attendant was trustworthy
(20.4%)
Because it was convenient
(17.1%)
The insurance company was
trustworthy (13.2%)Sales agents Total
(n = 1932)
The attendant was trustworthy
(32.9%)
Because it was a family
member or a friend (19.4%)
The insurance company was
trustworthy (17.1%)Group with low level of
knowledge (n = 630)
The attendant was trustworthy
(30.3%)
Because it was a family
member or a friend (20.3%)
The insurance company was
trustworthy (14.3%)Group with medium level of
knowledge (n = 977)
The attendant was trustworthy
(35.1%)
Because it was a family
member or a friend (20.6%)
The insurance company was
trustworthy (18.1%)Group with high level of
knowledge (n = 325)
The attendant was trustworthy
(31.4%)
The insurance company was
trustworthy (19.4%)Gave sincere advice (17.5%)
Over the counter Total
(n = 255)
Procedure could be done
nearby (35.3%)
The insurance company was
trustworthy (19.2%)-
Group with low level of
knowledge (n = 78)
Procedure could be done
nearby (30.8%)
The attendant was trustworthy
(23.1%)
The insurance company was
trustworthy (14.1%)Group with medium level of
knowledge (n = 134)
Procedure could be done
nearby (39.6%)
The insurance company was
trustworthy (20.1%)-
Group with high level of
knowledge (n = 43)
Procedure could be done
nearby (30.2%)
The insurance company was
trustworthy (25.6%)
Could apply at any time
(18.6%)Tel/postal mail Total
(n = 477)
Because it was convenient
(36.9%)
Could apply at any time
(31.2%)
There was no need to make
visits (27.0%)Group with low level of
knowledge (n = 141)
Because it was convenient
(34.8%)
Could apply at any time
(29.1%)
There was no need to make
visits (27.0%)Group with medium level of
knowledge (n = 233)
Because it was convenient
(40.3%)
Could apply at any time
(35.2%)
There was no need to make
visits (28.3%)Group with high level of
knowledge (n = 103)
Because it was convenient
(32.0%)
Could apply at any time
(25.2%)
There was no need to make
visits (24.3%)Insurance shops Total
(n = 165)
Could compare many
companies (35.2%)
Could get abundant
information (24.8%)
Because I could learn exactly
what I wanted to know (20.6%)Group with low level of
knowledge (n = 34)
Could compare many
companies (32.4%)
Procedure could be done
nearby (26.5%)
Could get abundant
information (17.6%)Group with medium level of
knowledge (n = 74)
Could compare many
companies (31.1%)
Could get abundant
information (28.4%)
Because I could learn exactly
what I wanted to know (23.0%)Group with high level of
knowledge (n = 57)
Could compare many
companies (42.1%)
Could get abundant
information (24.6%)
Because I could learn exactly
what I wanted to know (21.1%)
Internet Total (n = 270)Because it was convenient
(42.2%)
Could apply at any time
(39.6%)
There was no need to go
through a person (25.9%)Group with low level of
knowledge (n = 66)
Could apply at any time
(33.3%)
Because it was convenient
(31.8%)
Because I could choose by
myself (18.2%)Group with medium level of
knowledge (n = 147)
Because it was convenient
(50.3%)
Could apply at any time
(38.8%)
There was no need to go
through a person (26.5%)Group with high level of
knowledge (n = 57)
Could apply at any time
(49.1%)
There was no need to go
through a person (35.1%)
Because it was convenient
(33.3%)
Figure 3-14 Reason for selecting the channel from which to take out insurance
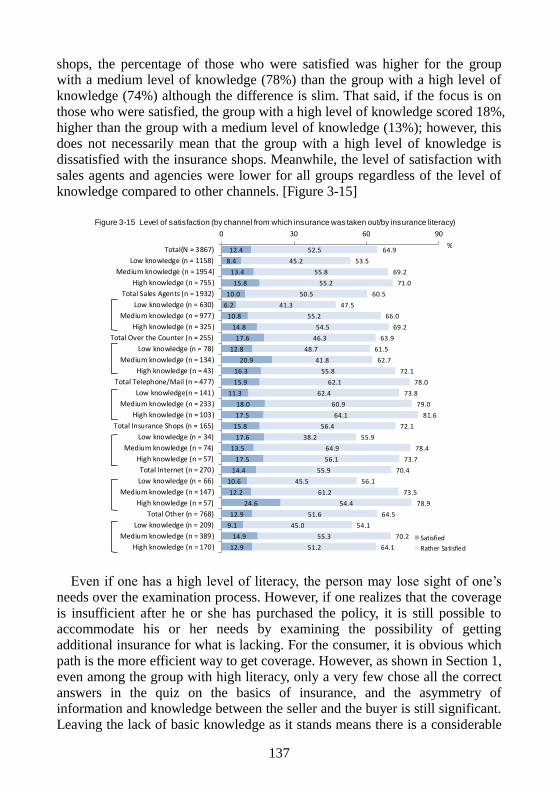
137
shops, the percentage of those who were satisfied was higher for the group with a medium level of knowledge (78%) than the group with a high level of
knowledge (74%) although the difference is slim. That said, if the focus is on
those who were satisfied, the group with a high level of knowledge scored 18%,
higher than the group with a medium level of knowledge (13%); however, this does not necessarily mean that the group with a high level of knowledge is
dissatisfied with the insurance shops. Meanwhile, the level of satisfaction with
sales agents and agencies were lower for all groups regardless of the level of
knowledge compared to other channels. [Figure 3-15]
Even if one has a high level of literacy, the person may lose sight of one’s
needs over the examination process. However, if one realizes that the coverage
is insufficient after he or she has purchased the policy, it is still possible to accommodate his or her needs by examining the possibility of getting
additional insurance for what is lacking. For the consumer, it is obvious which path is the more efficient way to get coverage. However, as shown in Section 1,
even among the group with high literacy, only a very few chose all the correct
answers in the quiz on the basics of insurance, and the asymmetry of information and knowledge between the seller and the buyer is still significant.
Leaving the lack of basic knowledge as it stands means there is a considerable
12.4
8.4
13.4
15.8
10.0
6.2
10.8
14.8
17.6
12.8
20.9
16.3
15.9
11.3
18.0
17.5
15.8
17.6
13.5
17.5
14.4
10.6
12.2
24.6
12.9
9.1
14.9
12.9
52.5
45.2
55.8
55.2
50.5
41.3
55.2
54.5
46.3
48.7
41.8
55.8
62.1
62.4
60.9
64.1
56.4
38.2
64.9
56.1
55.9
45.5
61.2
54.4
51.6
45.0
55.3
51.2
64.9
53.5
69.2
71.0
60.5
47.5
66.0
69.2
63.9
61.5
62.7
72.1
78.0
73.8
79.0
81.6
72.1
55.9
78.4
73.7
70.4
56.1
73.5
78.9
64.5
54.1
70.2
64.1
0 30 60 90
Total(N = 3867)
Low knowledge (n = 1158)
Medium knowledge (n = 1954)
High knowledge (n = 755)
Total Sales Agents (n = 1932)
Low knowledge (n = 630)
Medium knowledge (n = 977)
High knowledge (n = 325)
Total Over the Counter (n = 255)
Low knowledge (n = 78)
Medium knowledge (n = 134)
High knowledge (n = 43)
Total Telephone/Mail (n = 477)
Low knowledge(n = 141)
Medium knowledge (n = 233)
High knowledge (n = 103)
Total Insurance Shops (n = 165)
Low knowledge (n = 34)
Medium knowledge (n = 74)
High knowledge (n = 57)
Total Internet (n = 270)
Low knowledge (n = 66)
Medium knowledge (n = 147)
High knowledge (n = 57)
Total Other (n = 768)
Low knowledge (n = 209)
Medium knowledge (n = 389)
High knowledge (n = 170)Satisfied
Rather Satisfied%
Figure 3-15 Level of satisfaction (by channel from which insurance was taken out/by insurance literacy)
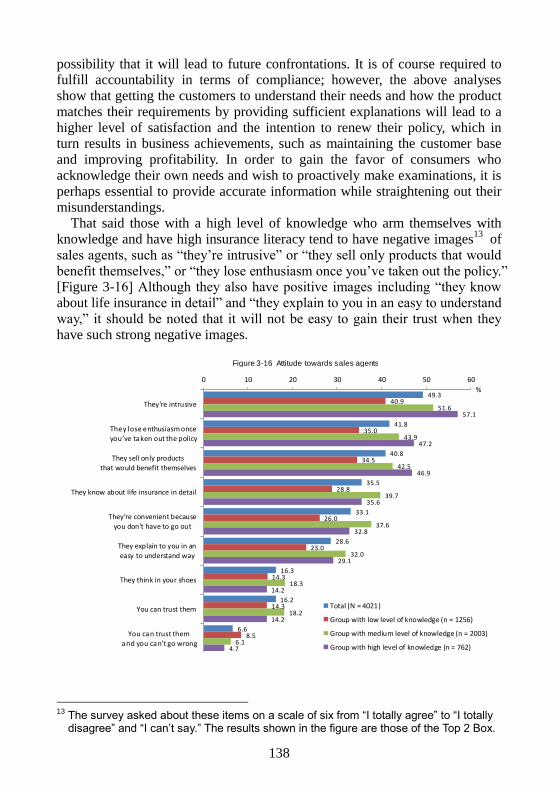
138
possibility that it will lead to future confrontations. It is of course required to fulfill accountability in terms of compliance; however, the above analyses
show that getting the customers to understand their needs and how the product
matches their requirements by providing sufficient explanations will lead to a
higher level of satisfaction and the intention to renew their policy, which in turn results in business achievements, such as maintaining the customer base
and improving profitability. In order to gain the favor of consumers who
acknowledge their own needs and wish to proactively make examinations, it is
perhaps essential to provide accurate information while straightening out their
misunderstandings. That said those with a high level of knowledge who arm themselves with
knowledge and have high insurance literacy tend to have negative images13
of
sales agents, such as “they’re intrusive” or “they sell only products that would
benefit themselves,” or “they lose enthusiasm once you’ve taken out the policy.” [Figure 3-16] Although they also have positive images including “they know
about life insurance in detail” and “they explain to you in an easy to understand
way,” it should be noted that it will not be easy to gain their trust when they
have such strong negative images.
13 The survey asked about these items on a scale of six from “I totally agree” to “I totally
disagree” and “I can’t say.” The results shown in the figure are those of the Top 2 Box.
= L385-L383
49.3
41.8
40.8
35.5
33.1
28.6
16.3
16.2
6.6
40.9
35.0
34.5
28.8
26.0
23.0
14.3
14.3
8.5
51.6
43.9
42.5
39.7
37.6
32.0
18.3
18.2
6.1
57.1
47.2
46.9
35.6
32.8
29.1
14.2
14.2
4.7
0 10 20 30 40 50 60
They're intrusive
They lose enthusiasm once you’ve taken out the policy
They sell only products
that would benefit themselves
They know about life insurance in detail
They're convenient becauseyou don't have to go out
They explain to you in an
easy to understand way
They think in your shoes
You can trust them
You can trust them
and you can’t go wrong
Total (N = 4021)
Group with low level of knowledge (n = 1256)
Group with medium level of knowledge (n = 2003)
Group with high level of knowledge (n = 762)
%
Figure 3-16 Attitude towards sales agents
139
4. The Brand of the Life Insurance Company and Actions to Take Out
Insurance
As has been described in the preceding sections, consumers who have made
an effort to arm themselves with knowledge through experience and acquiring
knowledge seem to be selecting insurance that offers exactly the coverage they
need for a relatively reasonable insurance premium by requesting product
brochures from various companies and comparing estimates. Meanwhile, there
are still a considerable number of consumers who take out insurance based on
the brand image of the underwriter and not based on the price (insurance
premium) or the contents of the product as can be seen in comments, such as “I
searched around but they all seemed similar and I couldn’t tell the difference so
I thought I would be safe if I went with a major company” or “I looked things
up on the Internet but didn’t really understand so in the end, decided to take out
the insurance because it was the brand I’ve always liked” or “I made
comparisons but the contents and price weren’t all that different so I decided
on the company that gave a good impression.”
Life insurance is a product that is easy to copy due to its product
characteristics, and it is extremely difficult for consumers to technically
compare the differences between the respective products by themselves.
Meanwhile, as has been mentioned in the beginning of this chapter, in reality,
the number of consumers with literacy high enough to make a sound
comparison and form a decision is limited. As a result, even if the number of
consumers who try to compare by themselves increases, many of them may
end up deciding on the product to take out based on the corporate brand,
including the size of the company or how well its name is recognized or based
on their trust in the channel.
In this section, we will review how consumers feel about the brand image of
life insurance companies and how these brand images of life insurance
companies are affecting consumer actions to take out insurance.
4-1. Brand in marketing
In marketing theories, “brand” is outlined in the three functions of (1) the
function to guarantee, (2) the function to differentiate, and (3) the function to
evoke. [Figure 3-17] Among these, (1) the function to guarantee refers to the
fact that the quality of a product or service is clearly assured by the company
with the specific name or logo attached to the product or service while (2) the function to differentiate means the product or service is clearly distinguished
from similar products or services of other companies with the specific name or
logo being attached to the product or service.
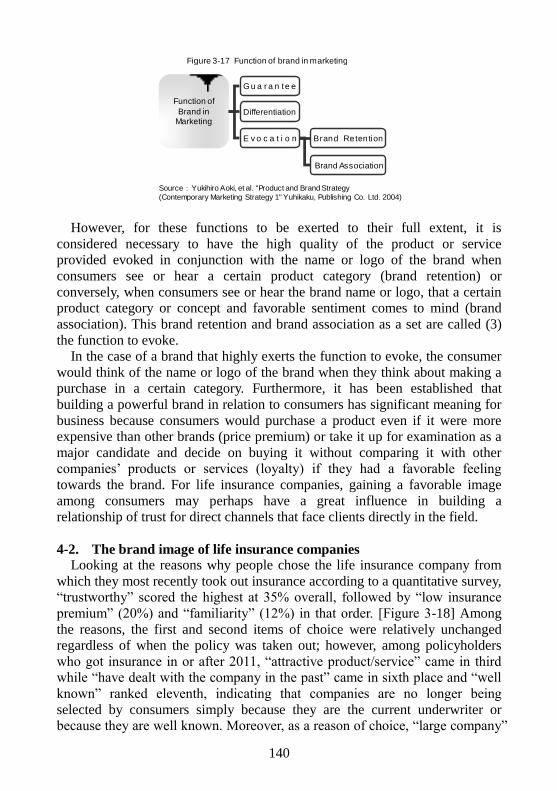
140
However, for these functions to be exerted to their full extent, it is
considered necessary to have the high quality of the product or service
provided evoked in conjunction with the name or logo of the brand when
consumers see or hear a certain product category (brand retention) or
conversely, when consumers see or hear the brand name or logo, that a certain
product category or concept and favorable sentiment comes to mind (brand
association). This brand retention and brand association as a set are called (3)
the function to evoke.
In the case of a brand that highly exerts the function to evoke, the consumer
would think of the name or logo of the brand when they think about making a
purchase in a certain category. Furthermore, it has been established that
building a powerful brand in relation to consumers has significant meaning for
business because consumers would purchase a product even if it were more
expensive than other brands (price premium) or take it up for examination as a
major candidate and decide on buying it without comparing it with other
companies’ products or services (loyalty) if they had a favorable feeling
towards the brand. For life insurance companies, gaining a favorable image
among consumers may perhaps have a great influence in building a
relationship of trust for direct channels that face clients directly in the field.
4-2. The brand image of life insurance companies Looking at the reasons why people chose the life insurance company from
which they most recently took out insurance according to a quantitative survey,
“trustworthy” scored the highest at 35% overall, followed by “low insurance
premium” (20%) and “familiarity” (12%) in that order. [Figure 3-18] Among
the reasons, the first and second items of choice were relatively unchanged
regardless of when the policy was taken out; however, among policyholders
who got insurance in or after 2011, “attractive product/service” came in third
while “have dealt with the company in the past” came in sixth place and “well
known” ranked eleventh, indicating that companies are no longer being
selected by consumers simply because they are the current underwriter or
because they are well known. Moreover, as a reason of choice, “large company”
Figure 3-17 Function of brand in marketing
Gu a r a n te e
Differentiation
E v o c a t i o n
Brand Association
Brand Retention
Function of
Brand in Marketing
Source:Yukihiro Aoki, et al. "Product and Brand Strategy
(Contemporary Marketing Strategy 1" Yuhikaku, Publishing Co. Ltd. 2004)
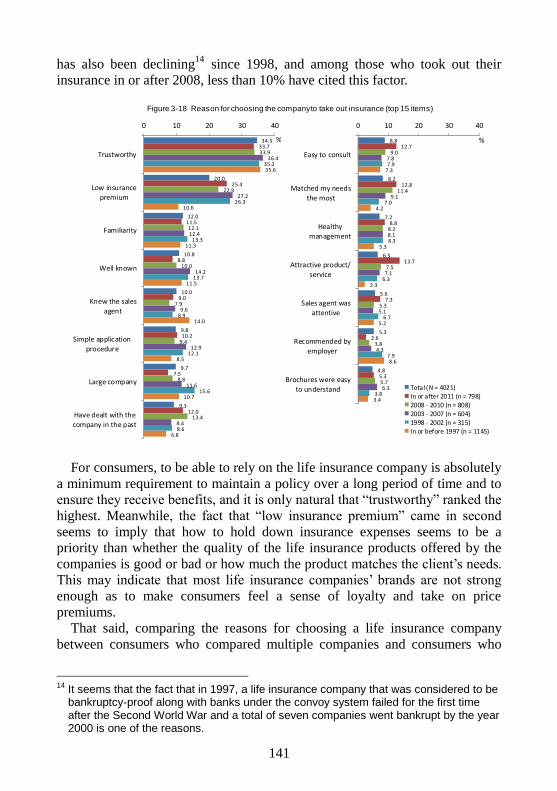
141
has also been declining14
since 1998, and among those who took out their
insurance in or after 2008, less than 10% have cited this factor.
For consumers, to be able to rely on the life insurance company is absolutely
a minimum requirement to maintain a policy over a long period of time and to
ensure they receive benefits, and it is only natural that “trustworthy” ranked the
highest. Meanwhile, the fact that “low insurance premium” came in second
seems to imply that how to hold down insurance expenses seems to be a
priority than whether the quality of the life insurance products offered by the
companies is good or bad or how much the product matches the client’s needs.
This may indicate that most life insurance companies’ brands are not strong
enough as to make consumers feel a sense of loyalty and take on price
premiums.
That said, comparing the reasons for choosing a life insurance company
between consumers who compared multiple companies and consumers who
14 It seems that the fact that in 1997, a life insurance company that was considered to be
bankruptcy-proof along with banks under the convoy system failed for the first time after the Second World War and a total of seven companies went bankrupt by the year 2000 is one of the reasons.
8.8
8.2
7.2
6.5
5.6
5.3
4.8
12.7
12.8
8.8
13.7
7.3
2.6
5.3
9.0
11.4
8.2
7.5
5.3
3.8
5.7
7.8
9.1
8.1
7.1
5.1
4.3
6.3
7.9
7.0
8.3
6.3
6.7
7.9
3.8
7.3
4.2
5.3
2.3
5.2
8.6
3.4
0 10 20 30 40
Easy to consult
Matched my needsthe most
Healthymanagement
Attractive product/service
Sales agent was
attentive
Recommended by
employer
Brochures were easy
to understand Total (N = 4021)In or after 2011 (n = 798)2008 - 2010 (n = 808)2003 - 2007 (n = 604)1998 - 2002 (n = 315)In or before 1997 (n = 1145)
%34.5
20.0
12.0
10.8
10.0
9.8
9.7
9.3
33.7
25.4
11.5
8.8
9.0
10.2
7.5
12.0
33.9
22.9
12.1
10.0
7.9
9.4
8.8
13.4
36.4
27.2
12.4
14.2
9.6
12.9
11.6
8.4
35.2
26.3
13.3
13.7
8.9
12.1
15.6
8.6
35.6
10.6
11.3
11.5
14.0
8.5
10.7
6.8
0 10 20 30 40
Trustworthy
Low insurance
premium
Familiarity
Well known
Knew the salesagent
Simple application
procedure
Large company
Have dealt with the
company in the past
%
Figure 3-18 Reason for choosing the company to take out insurance (top 15 items)
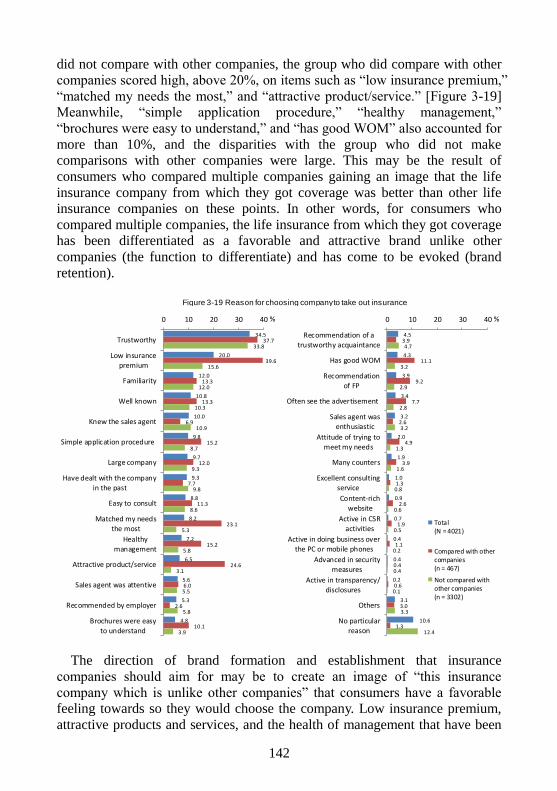
142
did not compare with other companies, the group who did compare with other
companies scored high, above 20%, on items such as “low insurance premium,”
“matched my needs the most,” and “attractive product/service.” [Figure 3-19]
Meanwhile, “simple application procedure,” “healthy management,”
“brochures were easy to understand,” and “has good WOM” also accounted for
more than 10%, and the disparities with the group who did not make
comparisons with other companies were large. This may be the result of
consumers who compared multiple companies gaining an image that the life
insurance company from which they got coverage was better than other life
insurance companies on these points. In other words, for consumers who
compared multiple companies, the life insurance from which they got coverage
has been differentiated as a favorable and attractive brand unlike other
companies (the function to differentiate) and has come to be evoked (brand
retention).
The direction of brand formation and establishment that insurance
companies should aim for may be to create an image of “this insurance
company which is unlike other companies” that consumers have a favorable
feeling towards so they would choose the company. Low insurance premium,
attractive products and services, and the health of management that have been
34.5
20.0
12.0
10.8
10.0
9.8
9.7
9.3
8.8
8.2
7.2
6.5
5.6
5.3
4.8
37.7
39.6
13.3
13.3
6.9
15.2
12.0
7.7
11.3
23.1
15.2
24.6
6.0
2.6
10.1
33.8
15.6
12.0
10.3
10.9
8.7
9.3
9.8
8.6
5.3
5.8
3.1
5.5
5.8
3.9
0 10 20 30 40
Trustworthy
Low insurancepremium
Familiarity
Well known
Knew the sales agent
Simple application procedure
Large company
Have dealt with the companyin the past
Easy to consult
Matched my needsthe most
Healthymanagement
Attractive product/service
Sales agent was attentive
Recommended by employer
Brochures were easy
to understand
%
4.5
4.3
3.9
3.4
3.2
2.0
1.9
1.0
0.9
0.7
0.4
0.4
0.2
3.1
10.6
3.9
11.1
9.2
7.7
2.6
4.9
3.9
1.3
2.6
1.9
1.1
0.4
0.6
3.0
1.3
4.7
3.2
2.9
2.8
3.2
1.3
1.6
0.8
0.6
0.5
0.2
0.4
0.1
3.3
12.4
0 10 20 30 40
Recommendation of atrustworthy acquaintance
Has good WOM
Recommendation
of FP
Often see the advertisement
Sales agent wasenthusiastic
Attitude of trying to
meet my needs
Many counters
Excellent consultingservice
Content-richwebsite
Active in CSR
activities
Active in doing business overthe PC or mobile phones
Advanced in securitymeasures
Active in transparency/
disclosures
Others
No particularreason
Total(N = 4021)
Compared with othercompanies(n = 467)
Not compared withother companies(n = 3302)
%
Figure 3-19 Reason for choosing company to take out insurance
143
analyzed above are elements that need to be tackled as a life insurance
company as a whole towards creating a brand image; however, there may be
things that could be changed through simple efforts at the point of contact with
customers, such as proposing products that match the consumer’s needs or
offering easy to understand brochures and explanations.
Insurance as a service product cannot be evaluated simply by looking at it or
taking it in one’s hands. Therefore, consumers are likely forming their image of
the product’s value and corporate policy (brand image) not only from
commercials or publications but also through their communication with sales
channels, such as sales agents and agencies. We often tend to consider that the
role of the channel is merely to gain, maintain, and cultivate contracts, but the
responsibilities to establish and sustain the brand perhaps also rests on the
shoulders of the individual employees who come in contact with clients on a
daily basis.
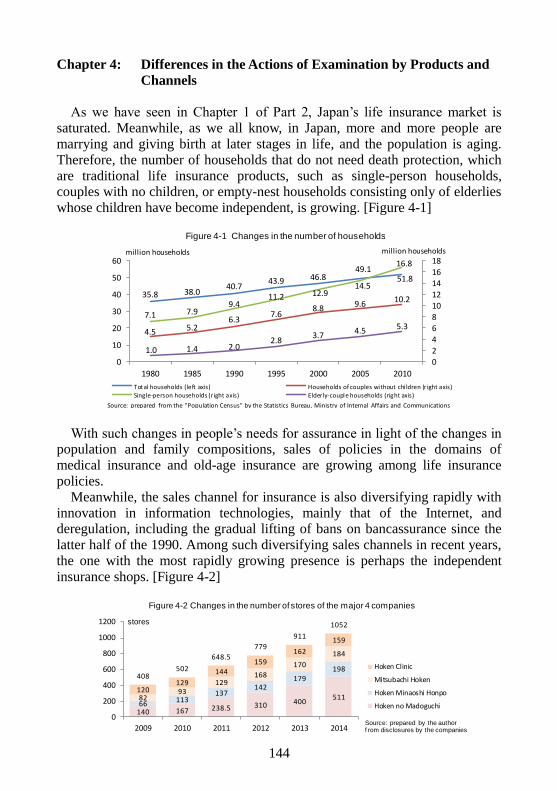
144
Chapter 4: Differences in the Actions of Examination by Products and
Channels
As we have seen in Chapter 1 of Part 2, Japan’s life insurance market is
saturated. Meanwhile, as we all know, in Japan, more and more people are
marrying and giving birth at later stages in life, and the population is aging.
Therefore, the number of households that do not need death protection, which
are traditional life insurance products, such as single-person households, couples with no children, or empty-nest households consisting only of elderlies
whose children have become independent, is growing. [Figure 4-1]
With such changes in people’s needs for assurance in light of the changes in population and family compositions, sales of policies in the domains of
medical insurance and old-age insurance are growing among life insurance
policies.
Meanwhile, the sales channel for insurance is also diversifying rapidly with
innovation in information technologies, mainly that of the Internet, and deregulation, including the gradual lifting of bans on bancassurance since the
latter half of the 1990. Among such diversifying sales channels in recent years,
the one with the most rapidly growing presence is perhaps the independent
insurance shops. [Figure 4-2]
35.8 38.040.7
43.9 46.849.1
51.8
4.5 5.26.3
7.68.8 9.6
10.2
7.1 7.99.4
11.2 12.914.5
16.8
1.0 1.4 2.02.8
3.74.5 5.3
024681012141618
0
10
20
30
40
50
60
1980 1985 1990 1995 2000 2005 2010
Total households (left axis) Households of couples without chi ldren (r ight axis)Single-person households (r ight axis) Elderly-couple households (right axis)
million households million households
Source: prepared from the "Population Census" by the Statistics Bureau, Ministry of Internal Affairs and Communications
Figure 4-1 Changes in the number of households
140 167 238.5 310 400511
66113
137142
179198
8293
129168
170
184
120129
144
159
162
159
408502
648.5
779
911
1052
0
200
400
600
800
1000
1200
2009 2010 2011 2012 2013 2014
Hoken Clinic
Mitsubachi Hoken
Hoken Minaoshi Honpo
Hoken no Madoguchi
Source: prepared by the author f rom disclosures by the companies
stores
Figure 4-2 Changes in the number of stores of the major 4 companies
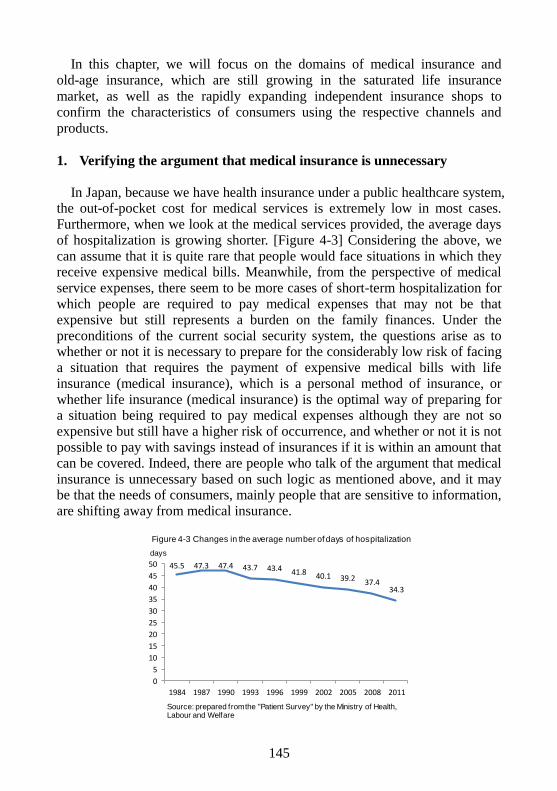
145
In this chapter, we will focus on the domains of medical insurance and
old-age insurance, which are still growing in the saturated life insurance
market, as well as the rapidly expanding independent insurance shops to
confirm the characteristics of consumers using the respective channels and
products.
1. Verifying the argument that medical insurance is unnecessary
In Japan, because we have health insurance under a public healthcare system,
the out-of-pocket cost for medical services is extremely low in most cases.
Furthermore, when we look at the medical services provided, the average days
of hospitalization is growing shorter. [Figure 4-3] Considering the above, we
can assume that it is quite rare that people would face situations in which they receive expensive medical bills. Meanwhile, from the perspective of medical
service expenses, there seem to be more cases of short-term hospitalization for
which people are required to pay medical expenses that may not be that
expensive but still represents a burden on the family finances. Under the
preconditions of the current social security system, the questions arise as to whether or not it is necessary to prepare for the considerably low risk of facing
a situation that requires the payment of expensive medical bills with life
insurance (medical insurance), which is a personal method of insurance, or
whether life insurance (medical insurance) is the optimal way of preparing for a situation being required to pay medical expenses although they are not so
expensive but still have a higher risk of occurrence, and whether or not it is not
possible to pay with savings instead of insurances if it is within an amount that
can be covered. Indeed, there are people who talk of the argument that medical
insurance is unnecessary based on such logic as mentioned above, and it may be that the needs of consumers, mainly people that are sensitive to information,
are shifting away from medical insurance.
45.5 47.3 47.4 43.7 43.4 41.8 40.1 39.2 37.434.3
0
5
10
15
20
25
30
35
40
45
50
1984 1987 1990 1993 1996 1999 2002 2005 2008 2011
Source: prepared from the "Patient Survey" by the Ministry of Health, Labour and Welfare
Figure 4-3 Changes in the average number of days of hospitalization
days
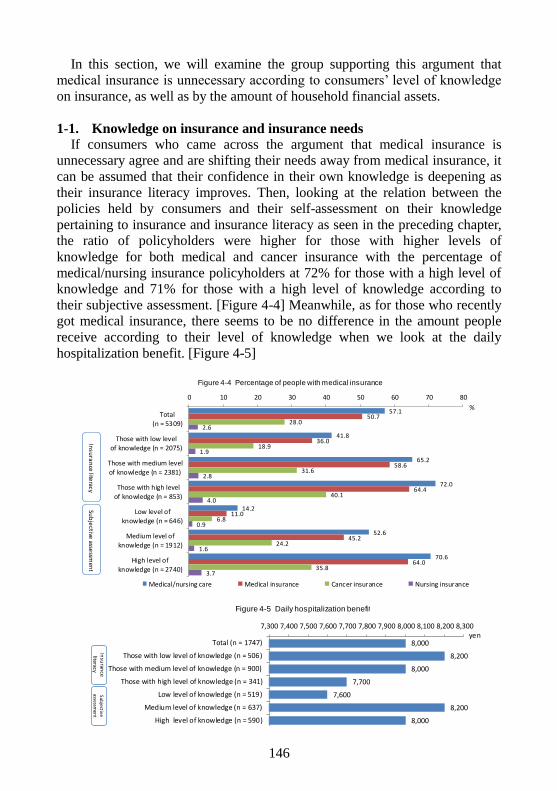
146
In this section, we will examine the group supporting this argument that
medical insurance is unnecessary according to consumers’ level of knowledge
on insurance, as well as by the amount of household financial assets.
1-1. Knowledge on insurance and insurance needs
If consumers who came across the argument that medical insurance is
unnecessary agree and are shifting their needs away from medical insurance, it
can be assumed that their confidence in their own knowledge is deepening as
their insurance literacy improves. Then, looking at the relation between the
policies held by consumers and their self-assessment on their knowledge
pertaining to insurance and insurance literacy as seen in the preceding chapter,
the ratio of policyholders were higher for those with higher levels of
knowledge for both medical and cancer insurance with the percentage of
medical/nursing insurance policyholders at 72% for those with a high level of
knowledge and 71% for those with a high level of knowledge according to
their subjective assessment. [Figure 4-4] Meanwhile, as for those who recently
got medical insurance, there seems to be no difference in the amount people
receive according to their level of knowledge when we look at the daily
hospitalization benefit. [Figure 4-5]
57.1
41.8
65.2
72.0
14.2
52.6
70.6
50.7
36.0
58.6
64.4
11.0
45.2
64.0
28.0
18.9
31.6
40.1
6.8
24.2
35.8
2.6
1.9
2.8
4.0
0.9
1.6
3.7
0 10 20 30 40 50 60 70 80
Total(n = 5309)
Those with low levelof knowledge (n = 2075)
Those with medium levelof knowledge (n = 2381)
Those with high levelof knowledge (n = 853)
Low level ofknowledge (n = 646)
Medium level ofknowledge (n = 1912)
High level ofknowledge (n = 2740)
Medical/nursing care Medical insurance Cancer insurance Nursing insurance
%
Insu
ran
ce literacy
Sub
jective
assessm
ent
Figure 4-4 Percentage of people with medical insurance
8,000
8,200
8,000
7,700
7,600
8,200
8,000
7,300 7,400 7,500 7,600 7,700 7,800 7,900 8,000 8,100 8,200 8,300
Total (n = 1747)
Those with low level of knowledge (n = 506)
Those with medium level of knowledge (n = 900)
Those with high level of knowledge (n = 341)
Low level of knowledge (n = 519)
Medium level of knowledge (n = 637)
High level of knowledge (n = 590)
Insu
rance
literacySubjective
assessmen
t
yen
Figure 4-5 Daily hospitalization benefit
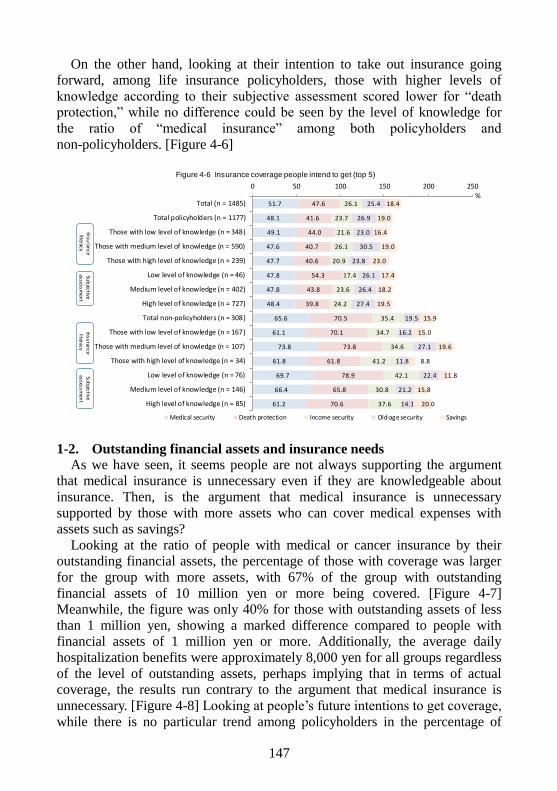
147
On the other hand, looking at their intention to take out insurance going
forward, among life insurance policyholders, those with higher levels of
knowledge according to their subjective assessment scored lower for “death
protection,” while no difference could be seen by the level of knowledge for
the ratio of “medical insurance” among both policyholders and
non-policyholders. [Figure 4-6]
1-2. Outstanding financial assets and insurance needs
As we have seen, it seems people are not always supporting the argument
that medical insurance is unnecessary even if they are knowledgeable about
insurance. Then, is the argument that medical insurance is unnecessary
supported by those with more assets who can cover medical expenses with
assets such as savings?
Looking at the ratio of people with medical or cancer insurance by their
outstanding financial assets, the percentage of those with coverage was larger
for the group with more assets, with 67% of the group with outstanding
financial assets of 10 million yen or more being covered. [Figure 4-7]
Meanwhile, the figure was only 40% for those with outstanding assets of less
than 1 million yen, showing a marked difference compared to people with
financial assets of 1 million yen or more. Additionally, the average daily
hospitalization benefits were approximately 8,000 yen for all groups regardless
of the level of outstanding assets, perhaps implying that in terms of actual
coverage, the results run contrary to the argument that medical insurance is
unnecessary. [Figure 4-8] Looking at people’s future intentions to get coverage,
while there is no particular trend among policyholders in the percentage of
51.7
48.1
49.1
47.6
47.7
47.8
47.8
48.4
65.6
61.1
73.8
61.8
69.7
66.4
61.2
47.6
41.6
44.0
40.7
40.6
54.3
43.8
39.8
70.5
70.1
73.8
61.8
78.9
65.8
70.6
26.1
23.7
21.6
26.1
20.9
17.4
23.6
24.2
35.4
34.7
34.6
41.2
42.1
30.8
37.6
25.4
26.9
23.0
30.5
23.8
26.1
26.4
27.4
19.5
16.2
27.1
11.8
22.4
21.2
14.1
18.4
19.0
16.4
19.0
23.0
17.4
18.2
19.5
15.9
15.0
19.6
8.8
11.8
15.8
20.0
0 50 100 150 200 250
Total (n = 1485)
Total policyholders (n = 1177)
Those with low level of knowledge (n = 348)
Those with medium level of knowledge (n = 590)
Those with high level of knowledge (n = 239)
Low level of knowledge (n = 46)
Medium level of knowledge (n = 402)
High level of knowledge (n = 727)
Total non-policyholders (n = 308)
Those with low level of knowledge (n = 167)
Those with medium level of knowledge (n = 107)
Those with high level of knowledge (n = 34)
Low level of knowledge (n = 76)
Medium level of knowledge (n = 146)
High level of knowledge (n = 85)
Medical security Death protection Income security Old-age security Savings
%
Insu
rance
literacySu
bjective
assessmen
tIn
suran
ce literacy
Sub
jective assessm
ent
Figure 4-6 Insurance coverage people intend to get (top 5)
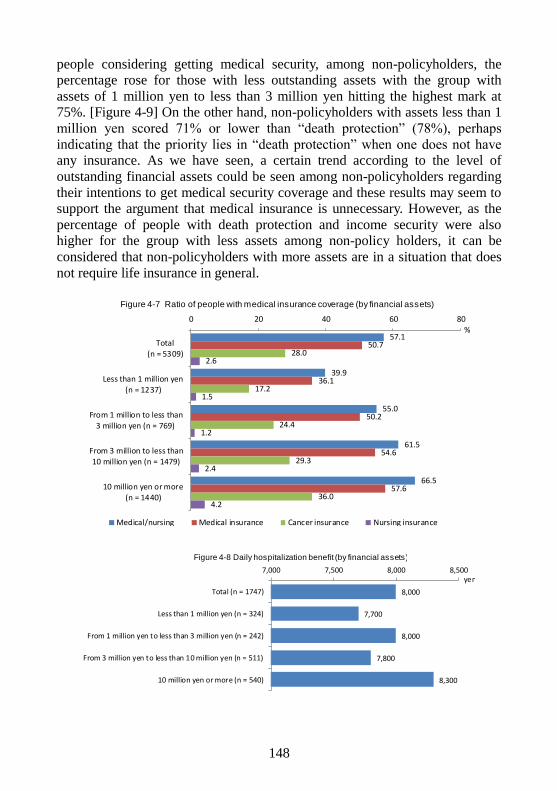
148
people considering getting medical security, among non-policyholders, the
percentage rose for those with less outstanding assets with the group with
assets of 1 million yen to less than 3 million yen hitting the highest mark at
75%. [Figure 4-9] On the other hand, non-policyholders with assets less than 1
million yen scored 71% or lower than “death protection” (78%), perhaps
indicating that the priority lies in “death protection” when one does not have
any insurance. As we have seen, a certain trend according to the level of
outstanding financial assets could be seen among non-policyholders regarding
their intentions to get medical security coverage and these results may seem to
support the argument that medical insurance is unnecessary. However, as the
percentage of people with death protection and income security were also
higher for the group with less assets among non-policy holders, it can be
considered that non-policyholders with more assets are in a situation that does
not require life insurance in general.
57.1
39.9
55.0
61.5
66.5
50.7
36.1
50.2
54.6
57.6
28.0
17.2
24.4
29.3
36.0
2.6
1.5
1.2
2.4
4.2
0 20 40 60 80
Total(n = 5309)
Less than 1 million yen(n = 1237)
From 1 million to less than
3 million yen (n = 769)
From 3 million to less than10 million yen (n = 1479)
10 million yen or more(n = 1440)
Medical/nursing Medical insurance Cancer insurance Nursing insurance
%
Figure 4-7 Ratio of people with medical insurance coverage (by financial assets)
8,000
7,700
8,000
7,800
8,300
7,000 7,500 8,000 8,500
Total (n = 1747)
Less than 1 million yen (n = 324)
From 1 million yen to less than 3 million yen (n = 242)
From 3 million yen to less than 10 million yen (n = 511)
10 million yen or more (n = 540)
yen
Figure 4-8 Daily hospitalization benefit (by financial assets)
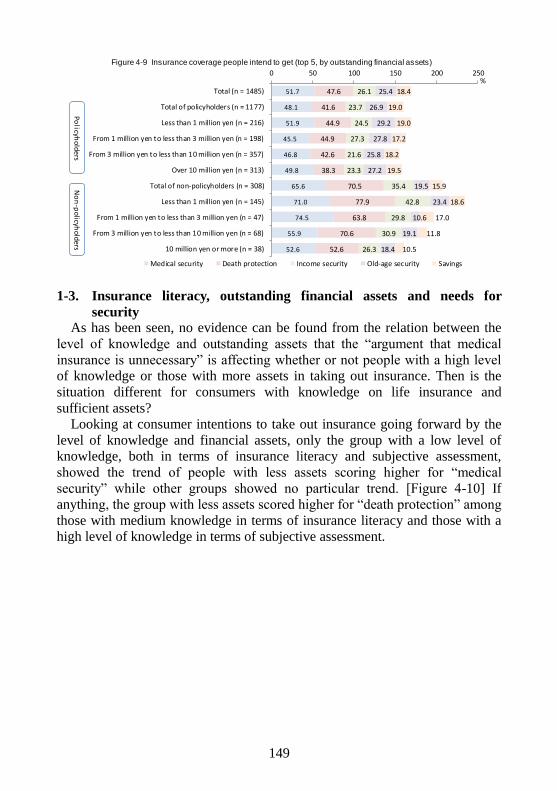
149
1-3. Insurance literacy, outstanding financial assets and needs for
security As has been seen, no evidence can be found from the relation between the
level of knowledge and outstanding assets that the “argument that medical
insurance is unnecessary” is affecting whether or not people with a high level
of knowledge or those with more assets in taking out insurance. Then is the
situation different for consumers with knowledge on life insurance and
sufficient assets?
Looking at consumer intentions to take out insurance going forward by the
level of knowledge and financial assets, only the group with a low level of
knowledge, both in terms of insurance literacy and subjective assessment,
showed the trend of people with less assets scoring higher for “medical
security” while other groups showed no particular trend. [Figure 4-10] If
anything, the group with less assets scored higher for “death protection” among
those with medium knowledge in terms of insurance literacy and those with a
high level of knowledge in terms of subjective assessment.
51.7
48.1
51.9
45.5
46.8
49.8
65.6
71.0
74.5
55.9
52.6
47.6
41.6
44.9
44.9
42.6
38.3
70.5
77.9
63.8
70.6
52.6
26.1
23.7
24.5
27.3
21.6
23.3
35.4
42.8
29.8
30.9
26.3
25.4
26.9
29.2
27.8
25.8
27.2
19.5
23.4
10.6
19.1
18.4
18.4
19.0
19.0
17.2
18.2
19.5
15.9
18.6
17.0
11.8
10.5
0 50 100 150 200 250
Total (n = 1485)
Total of policyholders (n = 1177)
Less than 1 million yen (n = 216)
From 1 million yen to less than 3 million yen (n = 198)
From 3 million yen to less than 10 million yen (n = 357)
Over 10 million yen (n = 313)
Total of non-policyholders (n = 308)
Less than 1 million yen (n = 145)
From 1 million yen to less than 3 million yen (n = 47)
From 3 million yen to less than 10 million yen (n = 68)
10 million yen or more (n = 38)
Medical security Death protection Income security Old-age security Savings
%
Po
licyho
lde
rsN
on
-po
licyho
lde
rs
Figure 4-9 Insurance coverage people intend to get (top 5, by outstanding financial assets)

150
As we have seen, although the argument that medical insurance is unnecessary may have spread to some consumers, it has yet to receive the
support of the mass at this point. Perhaps this is because the younger
generation who are likely relatively sensitive to information have not yet built
up enough assets as to refrain from getting medical insurance according to the
argument that medical insurance is unnecessary. Or perhaps the middle to old age group who already have sufficient assets had taken out medical insurance
products by the time they received this information and have not yet taken
actions, such as reviewing their policies or deciding to cancel the policy.
In fact, it could also be seen in a focused group interview we conducted in the past that even among consumers who were sensitive to information and
took out their insurance upon collecting and comparing various information, there are those who prioritize medical security or who select their medical
security upon determining with composure the risks they face in living their
lives, regardless of the level of assets they own, as can be seen below.
・ Took out lifetime medical insurance “because I felt it was extremely
important to have coverage for hospital visits after being discharged
51.7
53.0
60.7
50.0
48.4
45.1
51.6
60.4
52.3
48.6
51.7
49.5
53.1
48.6
47.0
52.3
61.5
75.6
58.3
58.1
41.2
52.7
62.7
48.3
47.3
51.2
49.8
53.5
51.5
47.6
50.2
47.6
52.4
63.5
45.1
52.3
40.7
45.8
53.0
48.4
46.7
39.1
43.2
53.1
57.1
39.8
40.7
69.7
80.0
58.3
64.5
64.7
49.6
61.3
46.0
50.3
37.8
43.0
50.0
48.5
42.4
39.1
26.1
25.8
30.9
20.7
26.6
19.8
27.4
35.8
28.9
21.5
27.0
23.4
24.5
40.0
21.7
20.9
32.8
37.8
25.0
41.9
23.5
25.5
33.8
24.1
21.8
21.3
25.6
29.1
30.6
21.4
25.1
25.4
20.8
22.5
20.7
20.3
19.8
30.0
35.8
25.0
28.5
30.5
22.3
18.4
31.4
21.7
24.4
23.8
26.7
25.0
29.0
11.8
25.0
28.9
24.1
23.6
23.6
26.0
25.6
24.6
24.9
29.0
18.4
15.9
18.5
17.1
13.3
9.9
19.1
20.1
18.0
18.7
19.0
21.2
16.3
14.3
19.3
26.7
13.9
22.2
4.2
9.7
5.9
17.5
16.9
18.4
17.6
15.0
19.6
19.2
18.7
17.9
21.7
0 50 100 150 200 250
Total (n = 1485)
Total of those with low level of knowledge (n = 515)
Less than 1 million yen (n = 178)
From 1 million to less than 3 million yen (n = 82)
From 3 million to less than 10 million yen (n = 128)
10 million yen or more (n = 91)
Total of those with medium level of knowledge (n = 697)
Less than 1 million yen (n = 134)
From 1 million to less than 3 million yen (n = 128)
From 3 million to less than 10 million yen (n = 214)
10 million yen or more (n = 174)
Total of those with high level of knowledge (n = 273)
Less than 1 million yen (n = 49)
From 1 million to less than 3 million yen (n = 35)
From 3 million to less than 10 million yen (n = 83)
10 million yen or more (n = 86)
Total of low level of knowledge (n = 122)
Less than 1 million yen (n = 45)
From 1 million to less than 3 million yen (n = 24)
From 3 million to less than 10 million yen (n = 31)
10 million yen or more (n = 17)
Total of medium level of knowledge (n = 548)
Less than 1 million yen (n = 142)
From 1 million to less than 3 million yen (n = 87)
From 3 million to less than 10 million yen (n = 165)
10 million yen or more (n = 127)
Total of high level of knowledge (n = 812)
Less than 1 million yen (n = 172)
From 1 million to less than 3 million yen (n = 134)
From 3 million to less than 10 million yen (n = 229)
10 million yen or more (n = 207)
Medical security Death protection Income security Old-age security Savings
%
Insuran
ce literacySu
bje
ctive assessment
Figure 4-10 Insurance coverage people intend to get (top 5)
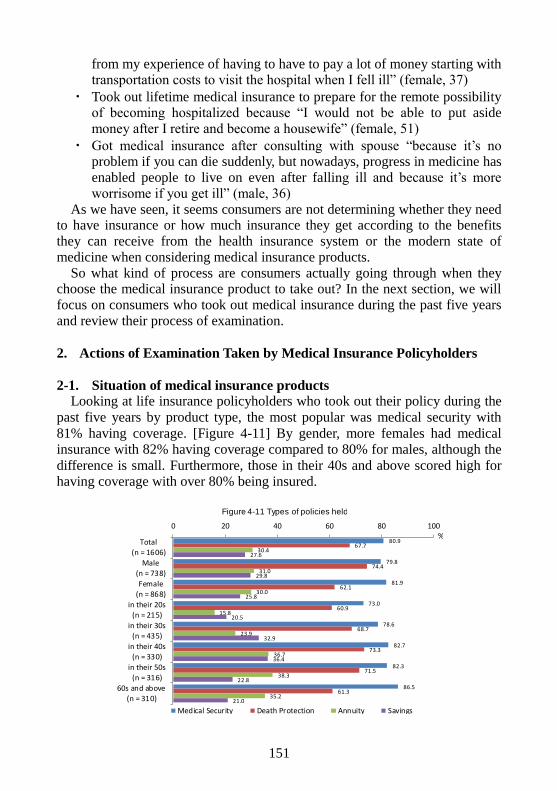
151
from my experience of having to have to pay a lot of money starting with transportation costs to visit the hospital when I fell ill” (female, 37)
・ Took out lifetime medical insurance to prepare for the remote possibility of becoming hospitalized because “I would not be able to put aside
money after I retire and become a housewife” (female, 51)
・ Got medical insurance after consulting with spouse “because it’s no problem if you can die suddenly, but nowadays, progress in medicine has
enabled people to live on even after falling ill and because it’s more
worrisome if you get ill” (male, 36)
As we have seen, it seems consumers are not determining whether they need to have insurance or how much insurance they get according to the benefits
they can receive from the health insurance system or the modern state of
medicine when considering medical insurance products.
So what kind of process are consumers actually going through when they choose the medical insurance product to take out? In the next section, we will
focus on consumers who took out medical insurance during the past five years
and review their process of examination.
2. Actions of Examination Taken by Medical Insurance Policyholders
2-1. Situation of medical insurance products Looking at life insurance policyholders who took out their policy during the
past five years by product type, the most popular was medical security with
81% having coverage. [Figure 4-11] By gender, more females had medical
insurance with 82% having coverage compared to 80% for males, although the
difference is small. Furthermore, those in their 40s and above scored high for
having coverage with over 80% being insured.
80.9
79.8
81.9
73.0
78.6
82.7
82.3
86.5
67.7
74.4
62.1
60.9
68.7
73.3
71.5
61.3
30.4
31.0
30.0
15.8
23.9
36.7
38.3
35.2
27.6
29.8
25.8
20.5
32.9
36.4
22.8
21.0
0 20 40 60 80 100
Total
(n = 1606)
Male
(n = 738)
Female
(n = 868)
in their 20s(n = 215)
in their 30s(n = 435)
in their 40s(n = 330)
in their 50s(n = 316)
60s and above(n = 310)
Medical Security Death Protection Annuity Savings
%
Figure 4-11 Types of policies held
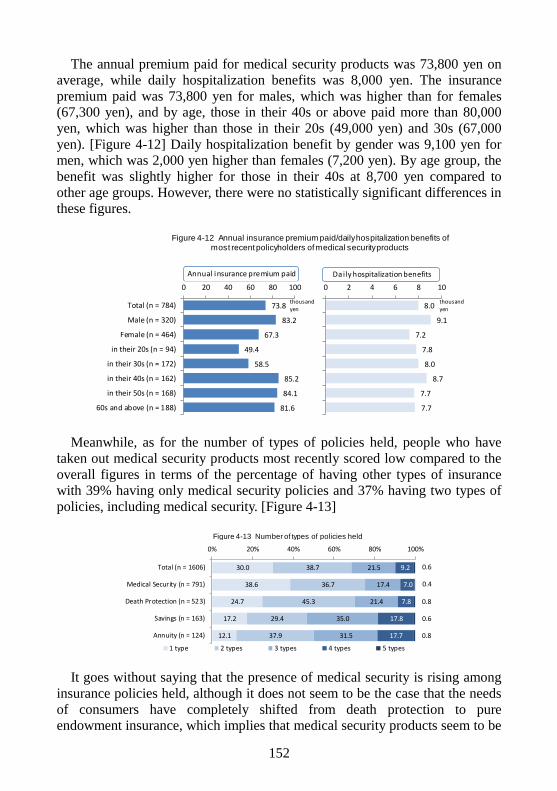
152
The annual premium paid for medical security products was 73,800 yen on
average, while daily hospitalization benefits was 8,000 yen. The insurance
premium paid was 73,800 yen for males, which was higher than for females
(67,300 yen), and by age, those in their 40s or above paid more than 80,000
yen, which was higher than those in their 20s (49,000 yen) and 30s (67,000
yen). [Figure 4-12] Daily hospitalization benefit by gender was 9,100 yen for
men, which was 2,000 yen higher than females (7,200 yen). By age group, the
benefit was slightly higher for those in their 40s at 8,700 yen compared to
other age groups. However, there were no statistically significant differences in
these figures.
Meanwhile, as for the number of types of policies held, people who have
taken out medical security products most recently scored low compared to the
overall figures in terms of the percentage of having other types of insurance
with 39% having only medical security policies and 37% having two types of
policies, including medical security. [Figure 4-13]
It goes without saying that the presence of medical security is rising among
insurance policies held, although it does not seem to be the case that the needs
of consumers have completely shifted from death protection to pure
endowment insurance, which implies that medical security products seem to be
Figure 4-12 Annual insurance premium paid/daily hospitalization benefits of most recent policyholders of medical security products
8.0
9.1
7.2
7.8
8.0
8.7
7.7
7.7
0 2 4 6 8 10
Total (n = 784)
Male (n = 320)
Female (n = 464)
in their 20s (n = 94)
in their 30s (n = 172)
in their 40s (n = 162)
in their 50s (n = 168)
60s and above (n = 188)
thousand yen
Dai ly hospitalization benefitsAnnual insurance premium paid
73.8
83.2
67.3
49.4
58.5
85.2
84.1
81.6
0 20 40 60 80 100
Total (n = 784)
Male (n = 320)
Female (n = 464)
in their 20s (n = 94)
in their 30s (n = 172)
in their 40s (n = 162)
in their 50s (n = 168)
60s and above (n = 188)
thousand yen
30.0
38.6
24.7
17.2
12.1
38.7
36.7
45.3
29.4
37.9
21.5
17.4
21.4
35.0
31.5
9.2
7.0
7.8
17.8
17.7
0.6
0.4
0.8
0.6
0.8
0% 20% 40% 60% 80% 100%
Total (n = 1606)
Medical Security (n = 791)
Death Protection (n = 523)
Savings (n = 163)
Annuity (n = 124)
1 type 2 types 3 types 4 types 5 types
Figure 4-13 Number of types of policies held
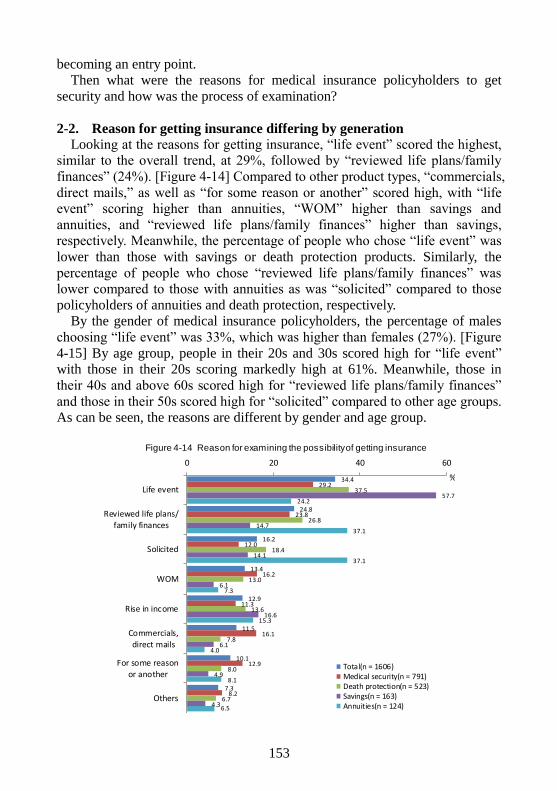
153
becoming an entry point.
Then what were the reasons for medical insurance policyholders to get
security and how was the process of examination?
2-2. Reason for getting insurance differing by generation
Looking at the reasons for getting insurance, “life event” scored the highest,
similar to the overall trend, at 29%, followed by “reviewed life plans/family
finances” (24%). [Figure 4-14] Compared to other product types, “commercials,
direct mails,” as well as “for some reason or another” scored high, with “life
event” scoring higher than annuities, “WOM” higher than savings and
annuities, and “reviewed life plans/family finances” higher than savings,
respectively. Meanwhile, the percentage of people who chose “life event” was
lower than those with savings or death protection products. Similarly, the
percentage of people who chose “reviewed life plans/family finances” was
lower compared to those with annuities as was “solicited” compared to those
policyholders of annuities and death protection, respectively.
By the gender of medical insurance policyholders, the percentage of males
choosing “life event” was 33%, which was higher than females (27%). [Figure
4-15] By age group, people in their 20s and 30s scored high for “life event”
with those in their 20s scoring markedly high at 61%. Meanwhile, those in
their 40s and above 60s scored high for “reviewed life plans/family finances”
and those in their 50s scored high for “solicited” compared to other age groups.
As can be seen, the reasons are different by gender and age group.
34.4
24.8
16.2
13.4
12.9
11.5
10.1
7.3
29.2
23.8
12.0
16.2
11.3
16.1
12.9
8.2
37.5
26.8
18.4
13.0
13.6
7.8
8.0
6.7
57.7
14.7
14.1
6.1
16.6
6.1
4.9
4.3
24.2
37.1
37.1
7.3
15.3
4.0
8.1
6.5
0 20 40 60
Life event
Reviewed life plans/
family finances
Solicited
WOM
Rise in income
Commercials,direct mails
For some reasonor another
Others
Total(n = 1606)Medical security(n = 791)Death protection(n = 523)Savings(n = 163)Annuities(n = 124)
%
Figure 4-14 Reason for examining the possibility of getting insurance
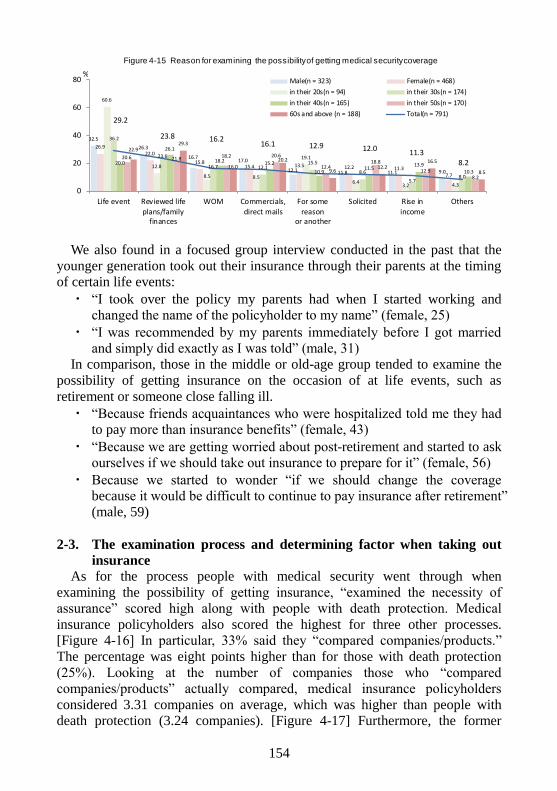
154
We also found in a focused group interview conducted in the past that the
younger generation took out their insurance through their parents at the timing
of certain life events:
・ “I took over the policy my parents had when I started working and
changed the name of the policyholder to my name” (female, 25)
・ “I was recommended by my parents immediately before I got married
and simply did exactly as I was told” (male, 31)
In comparison, those in the middle or old-age group tended to examine the
possibility of getting insurance on the occasion of at life events, such as
retirement or someone close falling ill.
・ “Because friends acquaintances who were hospitalized told me they had
to pay more than insurance benefits” (female, 43)
・ “Because we are getting worried about post-retirement and started to ask
ourselves if we should take out insurance to prepare for it” (female, 56)
・ Because we started to wonder “if we should change the coverage
because it would be difficult to continue to pay insurance after retirement”
(male, 59)
2-3. The examination process and determining factor when taking out
insurance
As for the process people with medical security went through when
examining the possibility of getting insurance, “examined the necessity of
assurance” scored high along with people with death protection. Medical
insurance policyholders also scored the highest for three other processes.
[Figure 4-16] In particular, 33% said they “compared companies/products.”
The percentage was eight points higher than for those with death protection
(25%). Looking at the number of companies those who “compared
companies/products” actually compared, medical insurance policyholders
considered 3.31 companies on average, which was higher than people with
death protection (3.24 companies). [Figure 4-17] Furthermore, the former
32.5
26.3
16.717.0
12.1 11.8 11.1 9.0
26.922.0
15.815.4 13.5 12.2 11.3
7.7
60.6
12.8
8.5 8.5
19.1
6.43.2 4.3
36.2
23.6
16.7 12.115.5
8.6
5.78.0
20.0
26.1
18.2 15.2
10.911.5
13.9
10.3
20.6 21.8 18.2 20.6
12.418.8
12.98.2
22.929.3
16.020.2
9.612.2
16.5
8.5
29.2
23.8 16.216.1 12.9 12.0
11.38.2
0
20
40
60
80
Life event Reviewed life
plans/familyfinances
WOM Commercials,
direct mails
For some
reasonor another
Solicited Rise in
income
Others
Male(n = 323) Female(n = 468)
in their 20s(n = 94) in their 30s(n = 174)
in their 40s(n = 165) in their 50s(n = 170)
60s and above (n = 188) Total(n = 791)
%
Figure 4-15 Reason for examining the possibility of getting medical security coverage
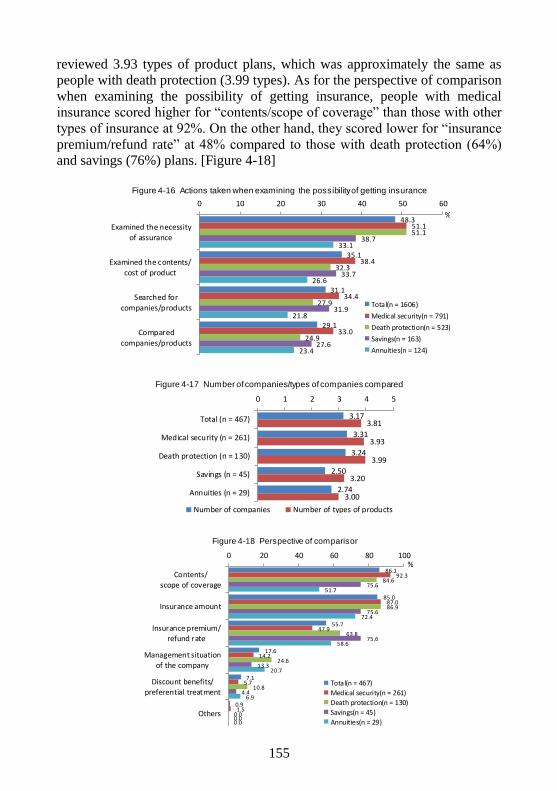
155
reviewed 3.93 types of product plans, which was approximately the same as
people with death protection (3.99 types). As for the perspective of comparison
when examining the possibility of getting insurance, people with medical
insurance scored higher for “contents/scope of coverage” than those with other
types of insurance at 92%. On the other hand, they scored lower for “insurance
premium/refund rate” at 48% compared to those with death protection (64%)
and savings (76%) plans. [Figure 4-18]
48.3
35.1
31.1
29.1
51.1
38.4
34.4
33.0
51.1
32.3
27.9
24.9
38.7
33.7
31.9
27.6
33.1
26.6
21.8
23.4
0 10 20 30 40 50 60
Examined the necessityof assurance
Examined the contents/cost of product
Searched forcompanies/products
Compared
companies/products
Total(n = 1606)
Medical security(n = 791)
Death protection(n = 523)
Savings(n = 163)
Annuities(n = 124)
%
Figure 4-16 Actions taken when examining the possibility of getting insurance
3.17
3.31
3.24
2.50
2.74
3.81
3.93
3.99
3.20
3.00
0 1 2 3 4 5
Total (n = 467)
Medical security (n = 261)
Death protection (n = 130)
Savings (n = 45)
Annuities (n = 29)
Number of companies Number of types of products
Figure 4-17 Number of companies/types of companies compared
86.1
85.0
55.7
17.6
7.1
0.9
92.3
87.0
47.9
14.2
5.7
1.5
84.6
86.9
63.8
24.6
10.8
0.0
75.6
75.6
75.6
13.3
4.4
0.0
51.7
72.4
58.6
20.7
6.9
0.0
0 20 40 60 80 100
Contents/scope of coverage
Insurance amount
Insurance premium/refund rate
Management situationof the company
Discount benefits/
preferential treatment
Others
Total(n = 467)
Medical security(n = 261)
Death protection(n = 130)
Savings(n = 45)
Annuities(n = 29)
%
Figure 4-18 Perspective of comparison
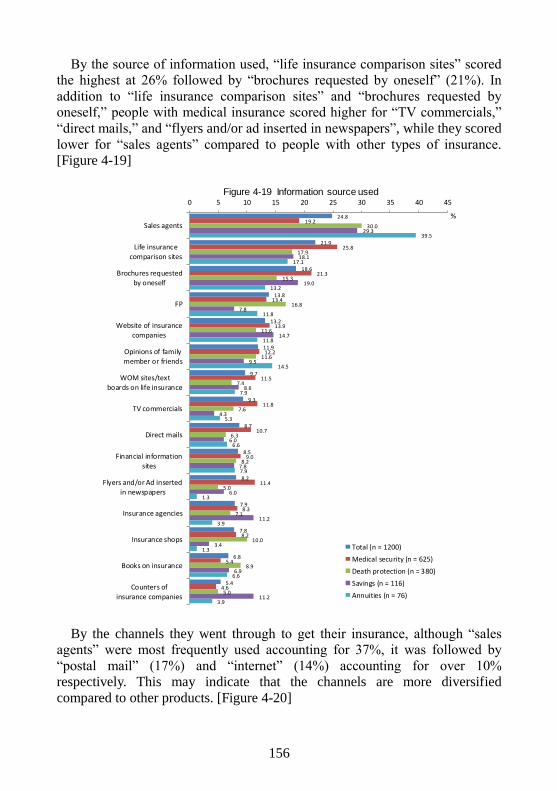
156
By the source of information used, “life insurance comparison sites” scored
the highest at 26% followed by “brochures requested by oneself” (21%). In
addition to “life insurance comparison sites” and “brochures requested by
oneself,” people with medical insurance scored higher for “TV commercials,”
“direct mails,” and “flyers and/or ad inserted in newspapers”, while they scored
lower for “sales agents” compared to people with other types of insurance.
[Figure 4-19]
By the channels they went through to get their insurance, although “sales
agents” were most frequently used accounting for 37%, it was followed by
“postal mail” (17%) and “internet” (14%) accounting for over 10%
respectively. This may indicate that the channels are more diversified
compared to other products. [Figure 4-20]
24.8
21.9
18.6
13.8
13.2
11.9
9.7
9.3
8.7
8.5
8.2
7.9
7.8
6.8
5.4
19.2
25.8
21.3
13.4
13.9
12.2
11.5
11.8
10.7
9.0
11.4
8.3
8.2
5.4
4.6
30.0
17.9
15.3
16.8
11.6
11.6
7.4
7.6
6.3
8.2
5.0
7.1
10.0
8.9
5.0
29.3
18.1
19.0
7.8
14.7
9.5
8.6
4.3
6.0
7.8
6.0
11.2
3.4
6.9
11.2
39.5
17.1
13.2
11.8
11.8
14.5
7.9
5.3
6.6
7.9
1.3
3.9
1.3
6.6
3.9
0 5 10 15 20 25 30 35 40 45
Sales agents
Life insurance
comparison sites
Brochures requestedby oneself
FP
Website of insurance
companies
Opinions of family
member or friends
WOM sites/textboards on life insurance
TV commercials
Direct mails
Financial informationsites
Flyers and/or Ad insertedin newspapers
Insurance agencies
Insurance shops
Books on insurance
Counters ofinsurance companies
Total (n = 1200)
Medical security (n = 625)
Death protection (n = 380)
Savings (n = 116)
Annuities (n = 76)
%
Figure 4-19 Information source used
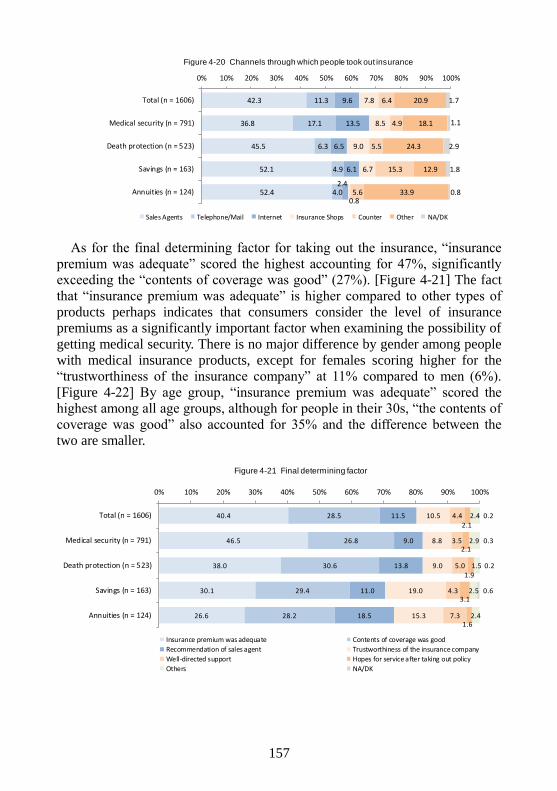
157
As for the final determining factor for taking out the insurance, “insurance
premium was adequate” scored the highest accounting for 47%, significantly
exceeding the “contents of coverage was good” (27%). [Figure 4-21] The fact
that “insurance premium was adequate” is higher compared to other types of
products perhaps indicates that consumers consider the level of insurance
premiums as a significantly important factor when examining the possibility of
getting medical security. There is no major difference by gender among people
with medical insurance products, except for females scoring higher for the
“trustworthiness of the insurance company” at 11% compared to men (6%).
[Figure 4-22] By age group, “insurance premium was adequate” scored the
highest among all age groups, although for people in their 30s, “the contents of
coverage was good” also accounted for 35% and the difference between the
two are smaller.
42.3
36.8
45.5
52.1
52.4
11.3
17.1
6.3
4.9
4.0
9.6
13.5
6.5
6.1
2.4
7.8
8.5
9.0
6.7
0.8
6.4
4.9
5.5
15.3
5.6
20.9
18.1
24.3
12.9
33.9
1.7
1.1
2.9
1.8
0.8
0% 10% 20% 30% 40% 50% 60% 70% 80% 90% 100%
Total (n = 1606)
Medical security (n = 791)
Death protection (n = 523)
Savings (n = 163)
Annuities (n = 124)
Sales Agents Telephone/Mail Internet Insurance Shops Counter Other NA/DK
Figure 4-20 Channels through which people took out insurance
40.4
46.5
38.0
30.1
26.6
28.5
26.8
30.6
29.4
28.2
11.5
9.0
13.8
11.0
18.5
10.5
8.8
9.0
19.0
15.3
4.4
3.5
5.0
4.3
7.3
2.1
2.1
1.9
3.1
1.6
2.4
2.9
1.5
2.5
2.4
0.2
0.3
0.2
0.6
0% 10% 20% 30% 40% 50% 60% 70% 80% 90% 100%
Total (n = 1606)
Medical security (n = 791)
Death protection (n = 523)
Savings (n = 163)
Annuities (n = 124)
Insurance premium was adequate Contents of coverage was good
Recommendation of sales agent Trustworthiness of the insurance company
Well-directed support Hopes for service after taking out policy
Others NA/DK
Figure 4-21 Final determining factor
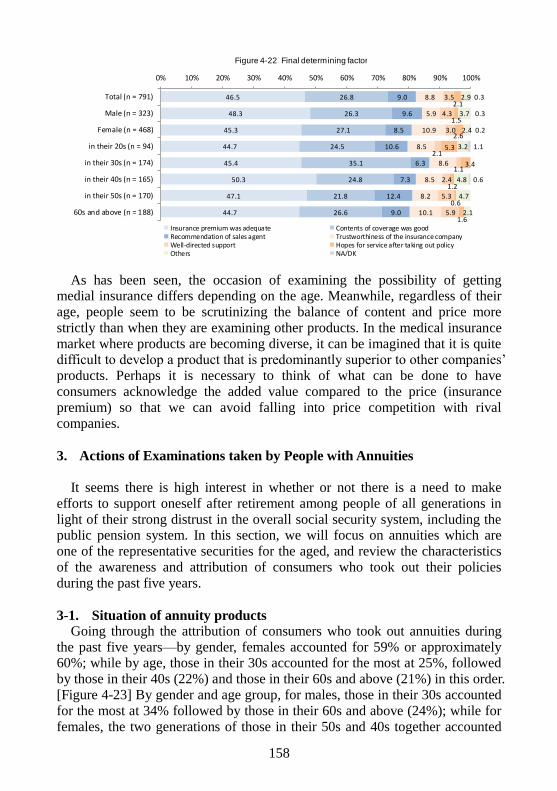
158
As has been seen, the occasion of examining the possibility of getting medial insurance differs depending on the age. Meanwhile, regardless of their
age, people seem to be scrutinizing the balance of content and price more
strictly than when they are examining other products. In the medical insurance
market where products are becoming diverse, it can be imagined that it is quite difficult to develop a product that is predominantly superior to other companies’
products. Perhaps it is necessary to think of what can be done to have
consumers acknowledge the added value compared to the price (insurance
premium) so that we can avoid falling into price competition with rival
companies.
3. Actions of Examinations taken by People with Annuities
It seems there is high interest in whether or not there is a need to make
efforts to support oneself after retirement among people of all generations in
light of their strong distrust in the overall social security system, including the public pension system. In this section, we will focus on annuities which are
one of the representative securities for the aged, and review the characteristics
of the awareness and attribution of consumers who took out their policies
during the past five years.
3-1. Situation of annuity products Going through the attribution of consumers who took out annuities during
the past five years—by gender, females accounted for 59% or approximately 60%; while by age, those in their 30s accounted for the most at 25%, followed
by those in their 40s (22%) and those in their 60s and above (21%) in this order.
[Figure 4-23] By gender and age group, for males, those in their 30s accounted
for the most at 34% followed by those in their 60s and above (24%); while for
females, the two generations of those in their 50s and 40s together accounted
46.5
48.3
45.3
44.7
45.4
50.3
47.1
44.7
26.8
26.3
27.1
24.5
35.1
24.8
21.8
26.6
9.0
9.6
8.5
10.6
6.3
7.3
12.4
9.0
8.8
5.9
10.9
8.5
8.6
8.5
8.2
10.1
3.5
4.3
3.0
2.1
1.1
2.4
5.3
5.9
2.1
1.5
2.6
5.3
3.4
1.2
0.6
1.6
2.9
3.7
2.4
3.2
4.8
4.7
2.1
0.3
0.3
0.2
1.1
0.6
0% 10% 20% 30% 40% 50% 60% 70% 80% 90% 100%
Total (n = 791)
Male (n = 323)
Female (n = 468)
in their 20s (n = 94)
in their 30s (n = 174)
in their 40s (n = 165)
in their 50s (n = 170)
60s and above (n = 188)
Insurance premium was adequate Contents of coverage was goodRecommendation of sales agent Trustworthiness of the insurance companyWell-directed support Hopes for service after taking out policyOthers NA/DK
Figure 4-22 Final determining factor
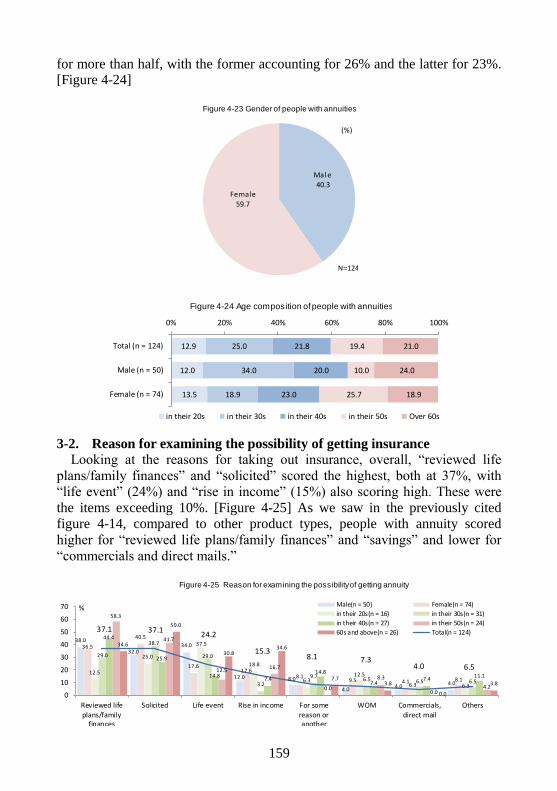
159
for more than half, with the former accounting for 26% and the latter for 23%. [Figure 4-24]
3-2. Reason for examining the possibility of getting insurance
Looking at the reasons for taking out insurance, overall, “reviewed life
plans/family finances” and “solicited” scored the highest, both at 37%, with
“life event” (24%) and “rise in income” (15%) also scoring high. These were
the items exceeding 10%. [Figure 4-25] As we saw in the previously cited
figure 4-14, compared to other product types, people with annuity scored
higher for “reviewed life plans/family finances” and “savings” and lower for
“commercials and direct mails.”
Male40.3
Female59.7
(%)
N=124
Figure 4-23 Gender of people with annuities
12.9
12.0
13.5
25.0
34.0
18.9
21.8
20.0
23.0
19.4
10.0
25.7
21.0
24.0
18.9
0% 20% 40% 60% 80% 100%
Total (n = 124)
Male (n = 50)
Female (n = 74)
in their 20s in their 30s in their 40s in their 50s Over 60s
Figure 4-24 Age composition of people with annuities
38.0
32.034.0
12.0 8.0
4.04.0
4.0
36.5
40.5
17.617.6
8.19.5 4.1 8.1
12.5
25.0
37.5
18.8
6.312.5
6.3 6.3
29.0
38.7
29.0
3.2
9.76.5 6.5 6.5
44.4
25.9
14.87.4
14.8
7.47.4
11.1
58.3
41.7
12.516.7
0.0
8.3
0.04.2
34.6
50.0
30.834.6
7.73.8
0.0
3.8
37.1 37.124.2
15.38.1 7.3
4.0 6.5
0
10
20
30
40
50
60
70
Reviewed life
plans/familyfinances
Solicited Life event Rise in income For some
reason oranother
WOM Commercials,
direct mail
Others
Male(n = 50) Female(n = 74)
in their 20s(n = 16) in their 30s(n = 31)
in their 40s(n = 27) in their 50s(n = 24)
60s and above(n = 26) Total(n = 124)
%
Figure 4-25 Reason for examining the possibility of getting annuity
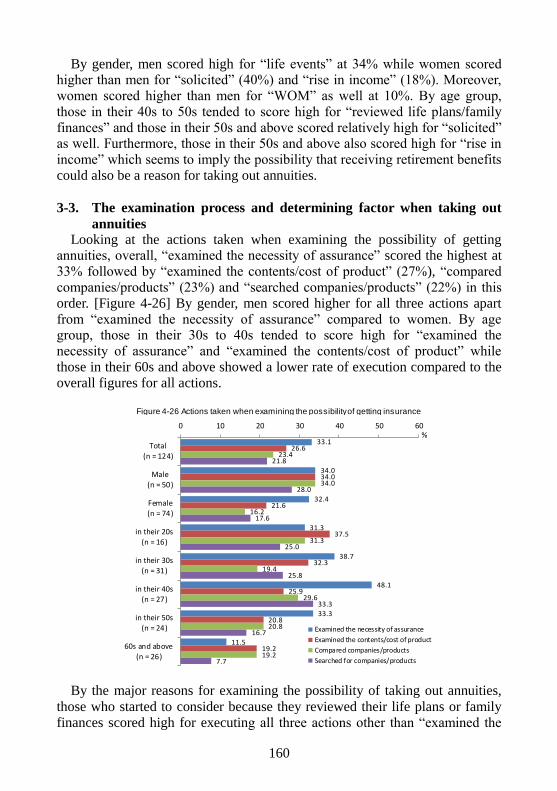
160
By gender, men scored high for “life events” at 34% while women scored higher than men for “solicited” (40%) and “rise in income” (18%). Moreover,
women scored higher than men for “WOM” as well at 10%. By age group,
those in their 40s to 50s tended to score high for “reviewed life plans/family
finances” and those in their 50s and above scored relatively high for “solicited” as well. Furthermore, those in their 50s and above also scored high for “rise in
income” which seems to imply the possibility that receiving retirement benefits
could also be a reason for taking out annuities.
3-3. The examination process and determining factor when taking out
annuities Looking at the actions taken when examining the possibility of getting
annuities, overall, “examined the necessity of assurance” scored the highest at
33% followed by “examined the contents/cost of product” (27%), “compared
companies/products” (23%) and “searched companies/products” (22%) in this
order. [Figure 4-26] By gender, men scored higher for all three actions apart
from “examined the necessity of assurance” compared to women. By age group, those in their 30s to 40s tended to score high for “examined the
necessity of assurance” and “examined the contents/cost of product” while
those in their 60s and above showed a lower rate of execution compared to the
overall figures for all actions.
By the major reasons for examining the possibility of taking out annuities,
those who started to consider because they reviewed their life plans or family
finances scored high for executing all three actions other than “examined the
33.1
34.0
32.4
31.3
38.7
48.1
33.3
11.5
26.6
34.0
21.6
37.5
32.3
25.9
20.8
19.2
23.4
34.0
16.2
31.3
19.4
29.6
20.8
19.2
21.8
28.0
17.6
25.0
25.8
33.3
16.7
7.7
0 10 20 30 40 50 60
Total(n = 124)
Male(n = 50)
Female
(n = 74)
in their 20s(n = 16)
in their 30s(n = 31)
in their 40s
(n = 27)
in their 50s(n = 24)
60s and above(n = 26)
Examined the necessity of assurance
Examined the contents/cost of product
Compared companies/products
Searched for companies/products
%
Figure 4-26 Actions taken when examining the possibility of getting insurance
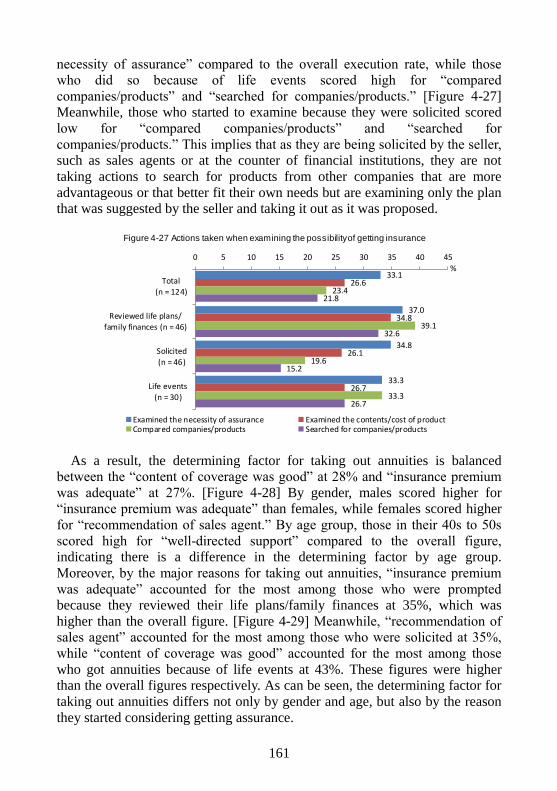
161
necessity of assurance” compared to the overall execution rate, while those
who did so because of life events scored high for “compared
companies/products” and “searched for companies/products.” [Figure 4-27]
Meanwhile, those who started to examine because they were solicited scored
low for “compared companies/products” and “searched for
companies/products.” This implies that as they are being solicited by the seller,
such as sales agents or at the counter of financial institutions, they are not
taking actions to search for products from other companies that are more
advantageous or that better fit their own needs but are examining only the plan
that was suggested by the seller and taking it out as it was proposed.
As a result, the determining factor for taking out annuities is balanced
between the “content of coverage was good” at 28% and “insurance premium
was adequate” at 27%. [Figure 4-28] By gender, males scored higher for
“insurance premium was adequate” than females, while females scored higher
for “recommendation of sales agent.” By age group, those in their 40s to 50s
scored high for “well-directed support” compared to the overall figure,
indicating there is a difference in the determining factor by age group.
Moreover, by the major reasons for taking out annuities, “insurance premium
was adequate” accounted for the most among those who were prompted
because they reviewed their life plans/family finances at 35%, which was
higher than the overall figure. [Figure 4-29] Meanwhile, “recommendation of
sales agent” accounted for the most among those who were solicited at 35%,
while “content of coverage was good” accounted for the most among those
who got annuities because of life events at 43%. These figures were higher
than the overall figures respectively. As can be seen, the determining factor for
taking out annuities differs not only by gender and age, but also by the reason
they started considering getting assurance.
33.1
37.0
34.8
33.3
26.6
34.8
26.1
26.7
23.4
39.1
19.6
33.3
21.8
32.6
15.2
26.7
0 5 10 15 20 25 30 35 40 45
Total(n = 124)
Reviewed life plans/
family finances (n = 46)
Solicited(n = 46)
Life events(n = 30)
Examined the necessity of assurance Examined the contents/cost of productCompared companies/products Searched for companies/products
%
Figure 4-27 Actions taken when examining the possibility of getting insurance
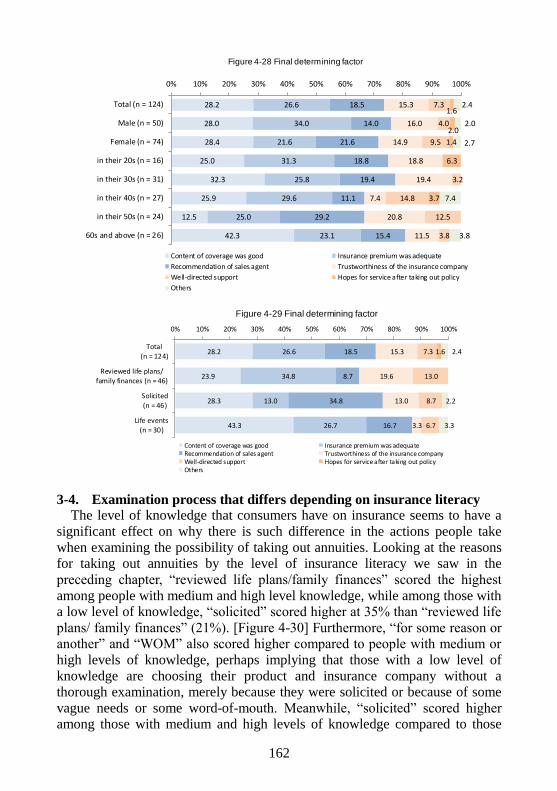
162
3-4. Examination process that differs depending on insurance literacy The level of knowledge that consumers have on insurance seems to have a
significant effect on why there is such difference in the actions people take
when examining the possibility of taking out annuities. Looking at the reasons
for taking out annuities by the level of insurance literacy we saw in the
preceding chapter, “reviewed life plans/family finances” scored the highest
among people with medium and high level knowledge, while among those with
a low level of knowledge, “solicited” scored higher at 35% than “reviewed life
plans/ family finances” (21%). [Figure 4-30] Furthermore, “for some reason or
another” and “WOM” also scored higher compared to people with medium or
high levels of knowledge, perhaps implying that those with a low level of
knowledge are choosing their product and insurance company without a
thorough examination, merely because they were solicited or because of some
vague needs or some word-of-mouth. Meanwhile, “solicited” scored higher
among those with medium and high levels of knowledge compared to those
28.2
28.0
28.4
25.0
32.3
25.9
12.5
42.3
26.6
34.0
21.6
31.3
25.8
29.6
25.0
23.1
18.5
14.0
21.6
18.8
19.4
11.1
29.2
15.4
15.3
16.0
14.9
18.8
19.4
7.4
20.8
11.5
7.3
4.0
9.5
3.2
14.8
12.5
3.8
1.6
2.0
1.4
6.3
3.7
2.4
2.0
2.7
7.4
3.8
0% 10% 20% 30% 40% 50% 60% 70% 80% 90% 100%
Total (n = 124)
Male (n = 50)
Female (n = 74)
in their 20s (n = 16)
in their 30s (n = 31)
in their 40s (n = 27)
in their 50s (n = 24)
60s and above (n = 26)
Content of coverage was good Insurance premium was adequate
Recommendation of sales agent Trustworthiness of the insurance company
Well-directed support Hopes for service after taking out policy
Others
Figure 4-28 Final determining factor
28.2
23.9
28.3
43.3
26.6
34.8
13.0
26.7
18.5
8.7
34.8
16.7
15.3
19.6
13.0
3.3
7.3
13.0
8.7
6.7
1.6 2.4
2.2
3.3
0% 10% 20% 30% 40% 50% 60% 70% 80% 90% 100%
Total
(n = 124)
Reviewed life plans/family finances (n = 46)
Solicited
(n = 46)
Life events(n = 30)
Content of coverage was good Insurance premium was adequateRecommendation of sales agent Trustworthiness of the insurance companyWell-directed support Hopes for service after taking out policyOthers
Figure 4-29 Final determining factor
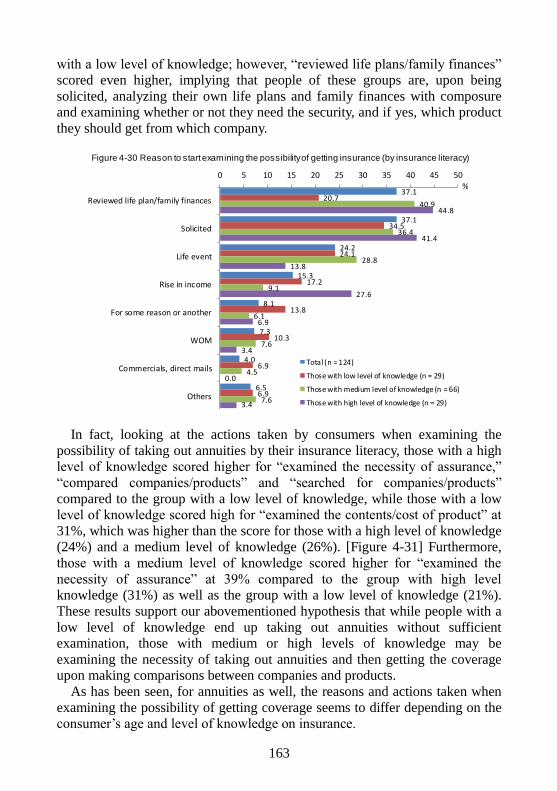
163
with a low level of knowledge; however, “reviewed life plans/family finances”
scored even higher, implying that people of these groups are, upon being
solicited, analyzing their own life plans and family finances with composure
and examining whether or not they need the security, and if yes, which product
they should get from which company.
In fact, looking at the actions taken by consumers when examining the
possibility of taking out annuities by their insurance literacy, those with a high
level of knowledge scored higher for “examined the necessity of assurance,”
“compared companies/products” and “searched for companies/products”
compared to the group with a low level of knowledge, while those with a low
level of knowledge scored high for “examined the contents/cost of product” at
31%, which was higher than the score for those with a high level of knowledge
(24%) and a medium level of knowledge (26%). [Figure 4-31] Furthermore,
those with a medium level of knowledge scored higher for “examined the
necessity of assurance” at 39% compared to the group with high level
knowledge (31%) as well as the group with a low level of knowledge (21%).
These results support our abovementioned hypothesis that while people with a
low level of knowledge end up taking out annuities without sufficient
examination, those with medium or high levels of knowledge may be
examining the necessity of taking out annuities and then getting the coverage
upon making comparisons between companies and products.
As has been seen, for annuities as well, the reasons and actions taken when
examining the possibility of getting coverage seems to differ depending on the
consumer’s age and level of knowledge on insurance.
37.1
37.1
24.2
15.3
8.1
7.3
4.0
6.5
20.7
34.5
24.1
17.2
13.8
10.3
6.9
6.9
40.9
36.4
28.8
9.1
6.1
7.6
4.5
7.6
44.8
41.4
13.8
27.6
6.9
3.4
0.0
3.4
0 5 10 15 20 25 30 35 40 45 50
Reviewed life plan/family finances
Solicited
Life event
Rise in income
For some reason or another
WOM
Commercials, direct mails
Others
Total (n = 124)
Those with low level of knowledge (n = 29)
Those with medium level of knowledge (n = 66)
Those with high level of knowledge (n = 29)
%
Figure 4-30 Reason to start examining the possibility of getting insurance (by insurance literacy)
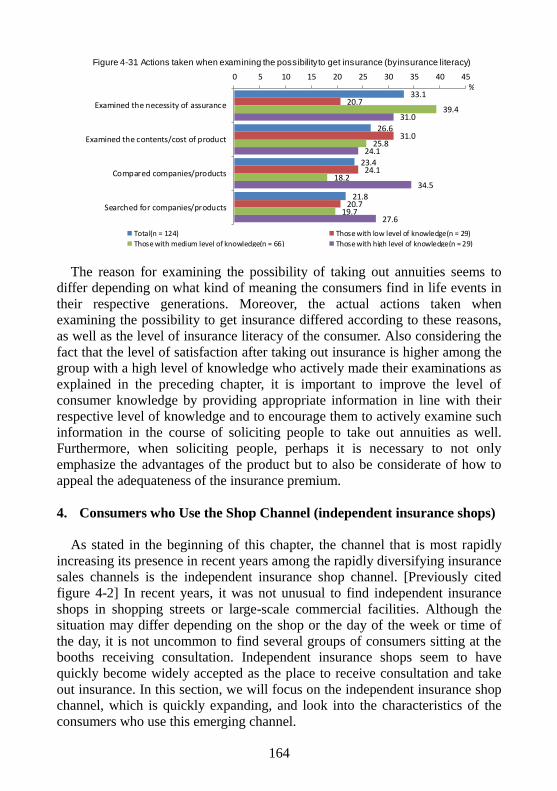
164
The reason for examining the possibility of taking out annuities seems to
differ depending on what kind of meaning the consumers find in life events in
their respective generations. Moreover, the actual actions taken when
examining the possibility to get insurance differed according to these reasons,
as well as the level of insurance literacy of the consumer. Also considering the
fact that the level of satisfaction after taking out insurance is higher among the
group with a high level of knowledge who actively made their examinations as
explained in the preceding chapter, it is important to improve the level of
consumer knowledge by providing appropriate information in line with their
respective level of knowledge and to encourage them to actively examine such
information in the course of soliciting people to take out annuities as well.
Furthermore, when soliciting people, perhaps it is necessary to not only
emphasize the advantages of the product but to also be considerate of how to
appeal the adequateness of the insurance premium.
4. Consumers who Use the Shop Channel (independent insurance shops)
As stated in the beginning of this chapter, the channel that is most rapidly
increasing its presence in recent years among the rapidly diversifying insurance
sales channels is the independent insurance shop channel. [Previously cited
figure 4-2] In recent years, it was not unusual to find independent insurance
shops in shopping streets or large-scale commercial facilities. Although the
situation may differ depending on the shop or the day of the week or time of
the day, it is not uncommon to find several groups of consumers sitting at the booths receiving consultation. Independent insurance shops seem to have
quickly become widely accepted as the place to receive consultation and take
out insurance. In this section, we will focus on the independent insurance shop
channel, which is quickly expanding, and look into the characteristics of the
consumers who use this emerging channel.
33.1
26.6
23.4
21.8
20.7
31.0
24.1
20.7
39.4
25.8
18.2
19.7
31.0
24.1
34.5
27.6
0 5 10 15 20 25 30 35 40 45
Examined the necessity of assurance
Examined the contents/cost of product
Compared companies/products
Searched for companies/products
Total(n = 124) Those with low level of knowledge(n = 29)
Those with medium level of knowledge(n = 66) Those with high level of knowledge(n = 29)
%
Figure 4-31 Actions taken when examining the possibility to get insurance (by insurance literacy)
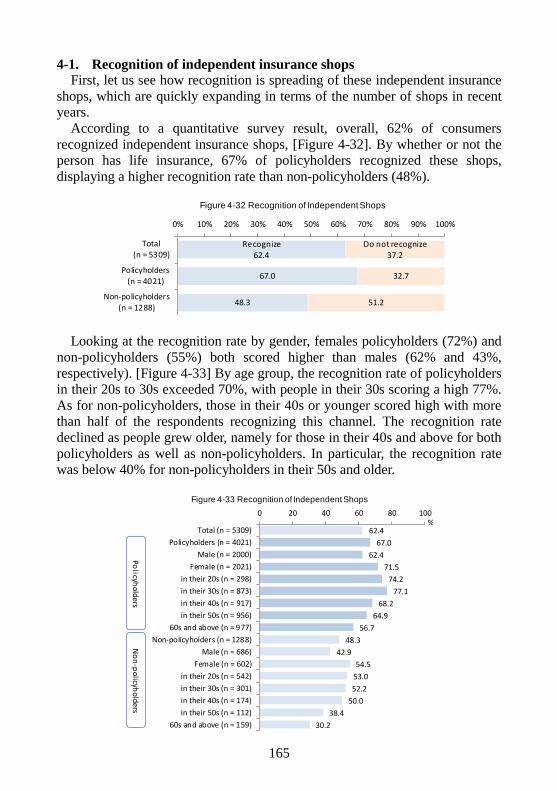
165
4-1. Recognition of independent insurance shops First, let us see how recognition is spreading of these independent insurance
shops, which are quickly expanding in terms of the number of shops in recent
years.
According to a quantitative survey result, overall, 62% of consumers
recognized independent insurance shops, [Figure 4-32]. By whether or not the
person has life insurance, 67% of policyholders recognized these shops,
displaying a higher recognition rate than non-policyholders (48%).
Looking at the recognition rate by gender, females policyholders (72%) and
non-policyholders (55%) both scored higher than males (62% and 43%,
respectively). [Figure 4-33] By age group, the recognition rate of policyholders
in their 20s to 30s exceeded 70%, with people in their 30s scoring a high 77%.
As for non-policyholders, those in their 40s or younger scored high with more
than half of the respondents recognizing this channel. The recognition rate
declined as people grew older, namely for those in their 40s and above for both
policyholders as well as non-policyholders. In particular, the recognition rate
was below 40% for non-policyholders in their 50s and older.
Recognize62.4
67.0
48.3
Do not recognize37.2
32.7
51.2
0% 10% 20% 30% 40% 50% 60% 70% 80% 90% 100%
Total(n = 5309)
Policyholders
(n = 4021)
Non-policyholders(n = 1288)
Figure 4-32 Recognition of Independent Shops
62.4
67.0
62.4
71.5
74.2
77.1
68.2
64.9
56.7
48.3
42.9
54.5
53.0
52.2
50.0
38.4
30.2
0 20 40 60 80 100
Total (n = 5309)
Policyholders (n = 4021)
Male (n = 2000)
Female (n = 2021)
in their 20s (n = 298)
in their 30s (n = 873)
in their 40s (n = 917)
in their 50s (n = 956)
60s and above (n = 977)
Non-policyholders (n = 1288)
Male (n = 686)
Female (n = 602)
in their 20s (n = 542)
in their 30s (n = 301)
in their 40s (n = 174)
in their 50s (n = 112)
60s and above (n = 159)
%
Policyh
oldersN
on
-po
licyho
lders
Figure 4-33 Recognition of Independent Shops

166
4-2. Use of independent insurance shops As has been seen, currently more than 60% of people who have life
insurance, as well as almost half of non-policyholders, recognize independent
insurance shops. So how much are these shops actually being used and what
kind of consumers is using these outlets?
Looking at the use of independent insurance shops as a source of
information when examining the possibility of getting insurance among
consumers who took out life insurance during the past five years, overall only
8%, or less than 10%, have used these shops. [Figure 4-34] That said, by the
timing of when the people took out their insurance, the usage rate has gradually
risen to double from the 5% in 2008 to 10% for those who got their policy in
2011 or later. Looking at the attribution of users, by gender, more females than
males used independent insurance shops as an information source with 10% of
females replying positively compared to 6% of males. By age group, more
people in their 20s to 30s replied positively than those in their 40s or older with
over 10% of the younger generation using independent insurance shops as an
information source. [Figure 4-35]
7.8
4.5
5.7
6.8
9.7
0
2
4
6
8
10
Total
(n = 1200)
2008
(n = 156)
2009
(n = 159)
2010
(n = 264)
2011 or
later(n = 621)
%
Figure 4-34 Use of Independent Shops as information source
7.8
5.9
9.7
10.3
12.1
5.7
4.8
5.1
5.6
7.1
11.5
0 2 4 6 8 10 12 14
Total (n = 1200)
Male (n = 580)
Female (n = 620)
in their 20s (n = 156)
in their 30s (n = 338)
in their 40s (n = 261)
in their 50s (n = 229)
60s and above (n = 216)
Those with low level of knowledge (n = 268)
Those with medium level of knowledge (n = 645)
Those with high level of knowledge (n = 287)
%
Insuran
celite
racy
By
ag
eB
y
gen
der
Figure 4-35 Use of Independent Shops as information source
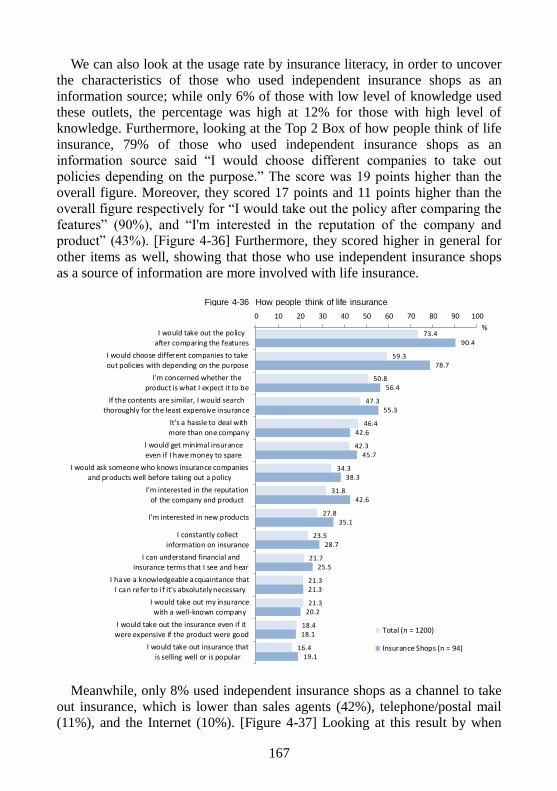
167
We can also look at the usage rate by insurance literacy, in order to uncover
the characteristics of those who used independent insurance shops as an
information source; while only 6% of those with low level of knowledge used
these outlets, the percentage was high at 12% for those with high level of
knowledge. Furthermore, looking at the Top 2 Box of how people think of life
insurance, 79% of those who used independent insurance shops as an
information source said “I would choose different companies to take out
policies depending on the purpose.” The score was 19 points higher than the
overall figure. Moreover, they scored 17 points and 11 points higher than the
overall figure respectively for “I would take out the policy after comparing the
features” (90%), and “I'm interested in the reputation of the company and
product” (43%). [Figure 4-36] Furthermore, they scored higher in general for
other items as well, showing that those who use independent insurance shops
as a source of information are more involved with life insurance.
Meanwhile, only 8% used independent insurance shops as a channel to take
out insurance, which is lower than sales agents (42%), telephone/postal mail
(11%), and the Internet (10%). [Figure 4-37] Looking at this result by when
73.4
59.3
50.8
47.3
46.4
42.3
34.3
31.8
27.8
23.5
21.7
21.3
21.3
18.4
16.4
90.4
78.7
56.4
55.3
42.6
45.7
38.3
42.6
35.1
28.7
25.5
21.3
20.2
18.1
19.1
0 10 20 30 40 50 60 70 80 90 100
I would take out the policy
after comparing the features
I would choose different companies to take
out policies with depending on the purpose
I'm concerned whether the
product is what I expect it to be
If the contents are similar, I would search
thoroughly for the least expensive insurance
It's a hassle to deal with
more than one company
I would get minimal insurance
even if I have money to spare
I would ask someone who knows insurance companies
and products well before taking out a policy
I'm interested in the reputation
of the company and product
I'm interested in new products
I constantly collect
information on insurance
I can understand financial and
insurance terms that I see and hear
I have a knowledgeable acquaintance that
I can refer to i f it’s absolutely necessary
I would take out my insurance
with a well-known company
I would take out the insurance even if it
were expensive if the product were good
I would take out insurance that
is selling well or is popular
Total (n = 1200)
Insurance Shops (n = 94)
%
Figure 4-36 How people think of life insurance
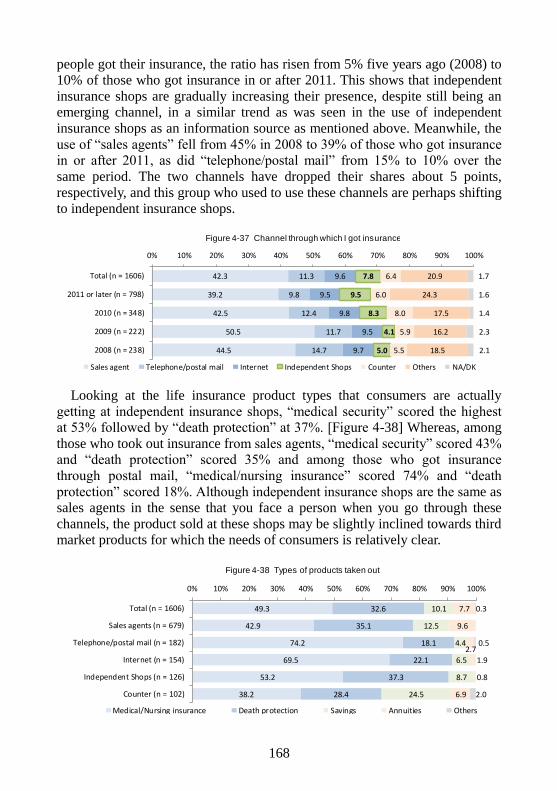
168
people got their insurance, the ratio has risen from 5% five years ago (2008) to
10% of those who got insurance in or after 2011. This shows that independent
insurance shops are gradually increasing their presence, despite still being an
emerging channel, in a similar trend as was seen in the use of independent
insurance shops as an information source as mentioned above. Meanwhile, the
use of “sales agents” fell from 45% in 2008 to 39% of those who got insurance
in or after 2011, as did “telephone/postal mail” from 15% to 10% over the
same period. The two channels have dropped their shares about 5 points,
respectively, and this group who used to use these channels are perhaps shifting
to independent insurance shops.
Looking at the life insurance product types that consumers are actually
getting at independent insurance shops, “medical security” scored the highest
at 53% followed by “death protection” at 37%. [Figure 4-38] Whereas, among
those who took out insurance from sales agents, “medical security” scored 43%
and “death protection” scored 35% and among those who got insurance
through postal mail, “medical/nursing insurance” scored 74% and “death
protection” scored 18%. Although independent insurance shops are the same as
sales agents in the sense that you face a person when you go through these
channels, the product sold at these shops may be slightly inclined towards third
market products for which the needs of consumers is relatively clear.
42.3
39.2
42.5
50.5
44.5
11.3
9.8
12.4
11.7
14.7
9.6
9.5
9.8
9.5
9.7
7.8
9.5
8.3
4.1
5.0
6.4
6.0
8.0
5.9
5.5
20.9
24.3
17.5
16.2
18.5
1.7
1.6
1.4
2.3
2.1
0% 10% 20% 30% 40% 50% 60% 70% 80% 90% 100%
Total (n = 1606)
2011 or later (n = 798)
2010 (n = 348)
2009 (n = 222)
2008 (n = 238)
Sales agent Telephone/postal mail Internet Independent Shops Counter Others NA/DK
Figure 4-37 Channel through which I got insurance
49.3
42.9
74.2
69.5
53.2
38.2
32.6
35.1
18.1
22.1
37.3
28.4
10.1
12.5
4.4
6.5
8.7
24.5
7.7
9.6
2.7
1.9
0.8
6.9
0.3
0.5
2.0
0% 10% 20% 30% 40% 50% 60% 70% 80% 90% 100%
Total (n = 1606)
Sales agents (n = 679)
Telephone/postal mail (n = 182)
Internet (n = 154)
Independent Shops (n = 126)
Counter (n = 102)
Medical/Nursing insurance Death protection Savings Annuities Others
Figure 4-38 Types of products taken out
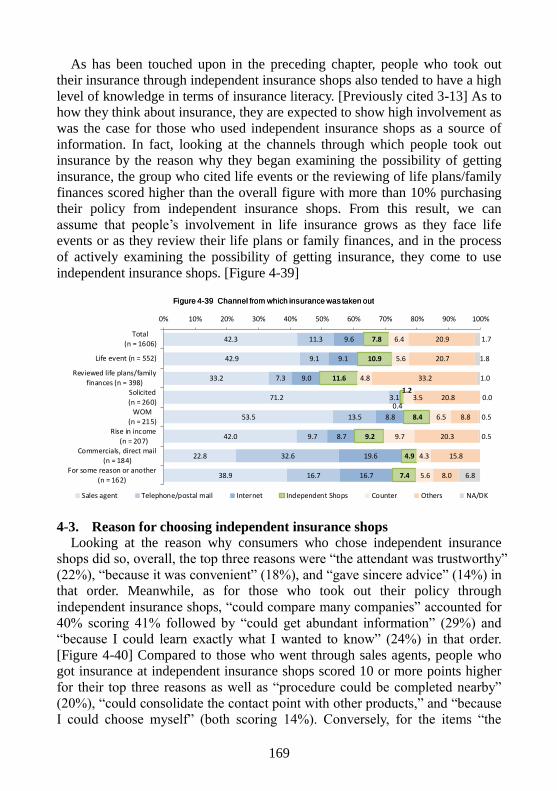
169
As has been touched upon in the preceding chapter, people who took out
their insurance through independent insurance shops also tended to have a high
level of knowledge in terms of insurance literacy. [Previously cited 3-13] As to
how they think about insurance, they are expected to show high involvement as
was the case for those who used independent insurance shops as a source of
information. In fact, looking at the channels through which people took out
insurance by the reason why they began examining the possibility of getting
insurance, the group who cited life events or the reviewing of life plans/family
finances scored higher than the overall figure with more than 10% purchasing
their policy from independent insurance shops. From this result, we can
assume that people’s involvement in life insurance grows as they face life
events or as they review their life plans or family finances, and in the process
of actively examining the possibility of getting insurance, they come to use
independent insurance shops. [Figure 4-39]
4-3. Reason for choosing independent insurance shops
Looking at the reason why consumers who chose independent insurance
shops did so, overall, the top three reasons were “the attendant was trustworthy”
(22%), “because it was convenient” (18%), and “gave sincere advice” (14%) in
that order. Meanwhile, as for those who took out their policy through
independent insurance shops, “could compare many companies” accounted for
40% scoring 41% followed by “could get abundant information” (29%) and
“because I could learn exactly what I wanted to know” (24%) in that order.
[Figure 4-40] Compared to those who went through sales agents, people who
got insurance at independent insurance shops scored 10 or more points higher
for their top three reasons as well as “procedure could be completed nearby”
(20%), “could consolidate the contact point with other products,” and “because
I could choose myself” (both scoring 14%). Conversely, for the items “the
Figure 4-39 Channel from which insurance was taken out
42.3
42.9
33.2
71.2
53.5
42.0
22.8
38.9
11.3
9.1
7.3
3.1
13.5
9.7
32.6
16.7
9.6
9.1
9.0
0.4
8.8
8.7
19.6
16.7
7.8
10.9
11.6
1.2
8.4
9.2
4.9
7.4
6.4
5.6
4.8
3.5
6.5
9.7
4.3
5.6
20.9
20.7
33.2
20.8
8.8
20.3
15.8
8.0
1.7
1.8
1.0
0.0
0.5
0.5
6.8
0% 10% 20% 30% 40% 50% 60% 70% 80% 90% 100%
Total
(n = 1606)
Life event (n = 552)
Reviewed life plans/familyfinances (n = 398)
Solicited(n = 260)
WOM(n = 215)
Rise in income
(n = 207)Commercials, direct mail
(n = 184)For some reason or another
(n = 162)
Sales agent Telephone/postal mail Internet Independent Shops Counter Others NA/DK
Figure 4-39 Channel from which insurance was taken out
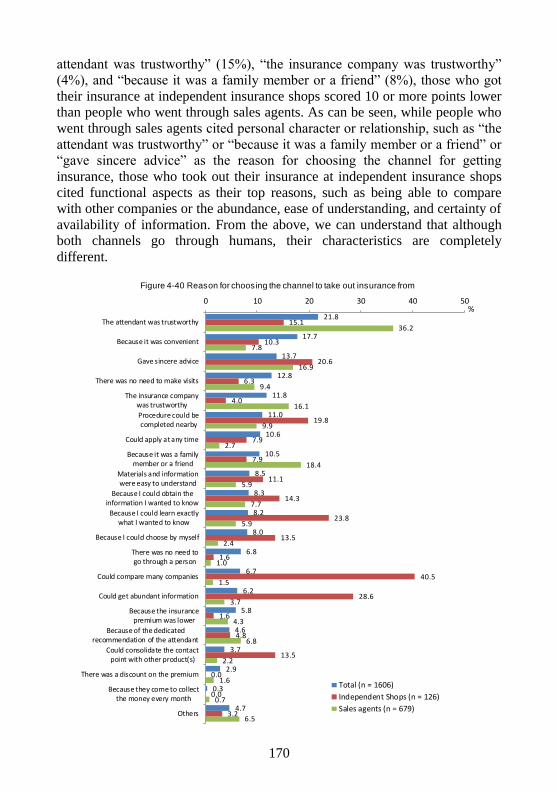
170
attendant was trustworthy” (15%), “the insurance company was trustworthy”
(4%), and “because it was a family member or a friend” (8%), those who got
their insurance at independent insurance shops scored 10 or more points lower
than people who went through sales agents. As can be seen, while people who
went through sales agents cited personal character or relationship, such as “the
attendant was trustworthy” or “because it was a family member or a friend” or
“gave sincere advice” as the reason for choosing the channel for getting
insurance, those who took out their insurance at independent insurance shops
cited functional aspects as their top reasons, such as being able to compare
with other companies or the abundance, ease of understanding, and certainty of
availability of information. From the above, we can understand that although
both channels go through humans, their characteristics are completely
different.
21.8
17.7
13.7
12.8
11.8
11.0
10.6
10.5
8.5
8.3
8.2
8.0
6.8
6.7
6.2
5.8
4.6
3.7
2.9
0.3
4.7
15.1
10.3
20.6
6.3
4.0
19.8
7.9
7.9
11.1
14.3
23.8
13.5
1.6
40.5
28.6
1.6
4.8
13.5
0.0
0.0
3.2
36.2
7.8
16.9
9.4
16.1
9.9
2.7
18.4
5.9
7.7
5.9
2.4
1.0
1.5
3.7
4.3
6.8
2.2
1.6
0.7
6.5
0 10 20 30 40 50
The attendant was trustworthy
Because it was convenient
Gave sincere advice
There was no need to make visits
The insurance companywas trustworthy
Procedure could becompleted nearby
Could apply at any time
Because it was a familymember or a friend
Materials and informationwere easy to understand
Because I could obtain theinformation I wanted to know
Because I could learn exactlywhat I wanted to know
Because I could choose by myself
There was no need togo through a person
Could compare many companies
Could get abundant information
Because the insurancepremium was lower
Because of the dedicatedrecommendation of the attendant
Could consolidate the contactpoint with other product(s)
There was a discount on the premium
Because they come to collectthe money every month
Others
Total (n = 1606)
Independent Shops (n = 126)
Sales agents (n = 679)
%
Figure 4-40 Reason for choosing the channel to take out insurance from
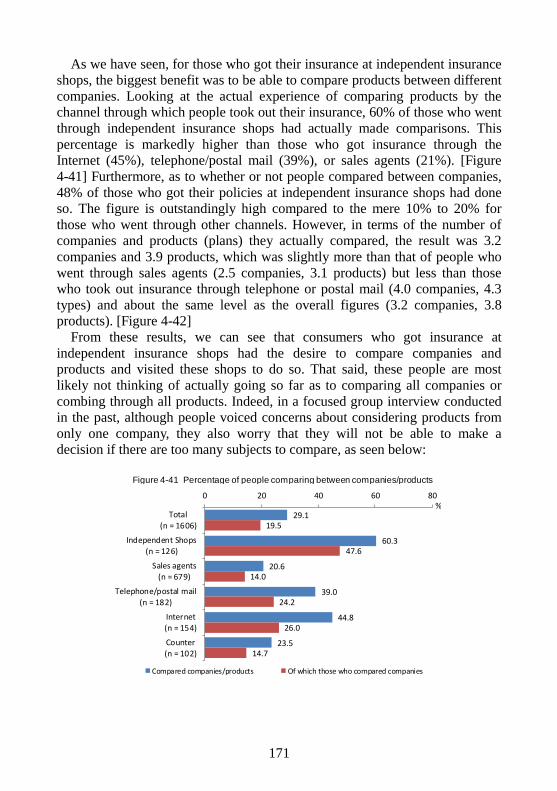
171
As we have seen, for those who got their insurance at independent insurance
shops, the biggest benefit was to be able to compare products between different
companies. Looking at the actual experience of comparing products by the
channel through which people took out their insurance, 60% of those who went
through independent insurance shops had actually made comparisons. This
percentage is markedly higher than those who got insurance through the
Internet (45%), telephone/postal mail (39%), or sales agents (21%). [Figure
4-41] Furthermore, as to whether or not people compared between companies,
48% of those who got their policies at independent insurance shops had done
so. The figure is outstandingly high compared to the mere 10% to 20% for
those who went through other channels. However, in terms of the number of
companies and products (plans) they actually compared, the result was 3.2
companies and 3.9 products, which was slightly more than that of people who
went through sales agents (2.5 companies, 3.1 products) but less than those
who took out insurance through telephone or postal mail (4.0 companies, 4.3
types) and about the same level as the overall figures (3.2 companies, 3.8
products). [Figure 4-42]
From these results, we can see that consumers who got insurance at
independent insurance shops had the desire to compare companies and
products and visited these shops to do so. That said, these people are most
likely not thinking of actually going so far as to comparing all companies or
combing through all products. Indeed, in a focused group interview conducted
in the past, although people voiced concerns about considering products from
only one company, they also worry that they will not be able to make a
decision if there are too many subjects to compare, as seen below:
29.1
60.3
20.6
39.0
44.8
23.5
19.5
47.6
14.0
24.2
26.0
14.7
0 20 40 60 80
Total(n = 1606)
Independent Shops(n = 126)
Sales agents(n = 679)
Telephone/postal mail
(n = 182)
Internet(n = 154)
Counter(n = 102)
Compared companies/products Of which those who compared companies
%
Figure 4-41 Percentage of people comparing between companies/products
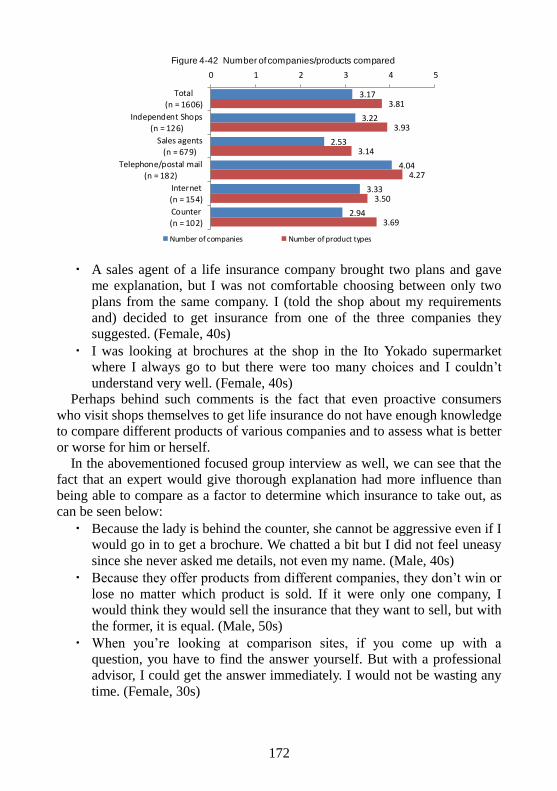
172
・ A sales agent of a life insurance company brought two plans and gave
me explanation, but I was not comfortable choosing between only two
plans from the same company. I (told the shop about my requirements
and) decided to get insurance from one of the three companies they
suggested. (Female, 40s)
・ I was looking at brochures at the shop in the Ito Yokado supermarket
where I always go to but there were too many choices and I couldn’t
understand very well. (Female, 40s)
Perhaps behind such comments is the fact that even proactive consumers
who visit shops themselves to get life insurance do not have enough knowledge
to compare different products of various companies and to assess what is better
or worse for him or herself.
In the abovementioned focused group interview as well, we can see that the
fact that an expert would give thorough explanation had more influence than
being able to compare as a factor to determine which insurance to take out, as
can be seen below:
・ Because the lady is behind the counter, she cannot be aggressive even if I
would go in to get a brochure. We chatted a bit but I did not feel uneasy
since she never asked me details, not even my name. (Male, 40s)
・ Because they offer products from different companies, they don’t win or
lose no matter which product is sold. If it were only one company, I
would think they would sell the insurance that they want to sell, but with
the former, it is equal. (Male, 50s)
・ When you’re looking at comparison sites, if you come up with a question, you have to find the answer yourself. But with a professional
advisor, I could get the answer immediately. I would not be wasting any
time. (Female, 30s)
3.17
3.22
2.53
4.04
3.33
2.94
3.81
3.93
3.14
4.27
3.50
3.69
0 1 2 3 4 5
Total
(n = 1606)
Independent Shops
(n = 126)
Sales agents
(n = 679)
Telephone/postal mail
(n = 182)
Internet
(n = 154)
Counter
(n = 102)
Number of companies Number of product types
Figure 4-42 Number of companies/products compared
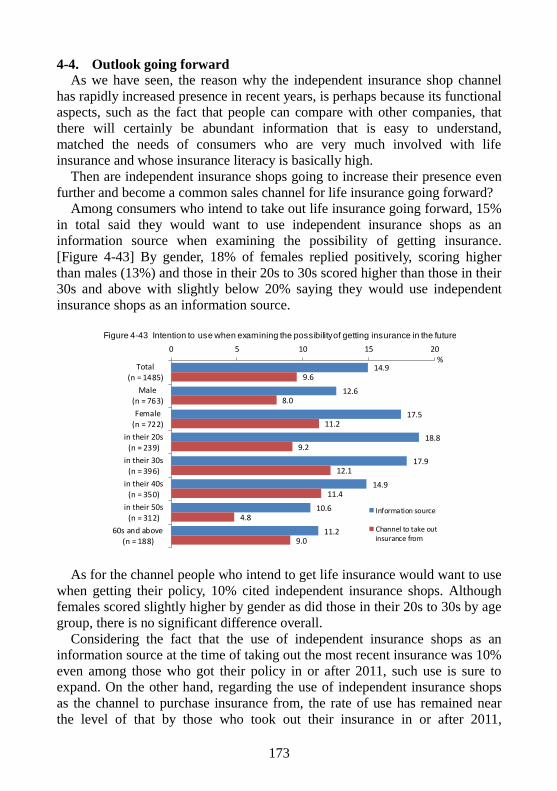
173
4-4. Outlook going forward As we have seen, the reason why the independent insurance shop channel
has rapidly increased presence in recent years, is perhaps because its functional
aspects, such as the fact that people can compare with other companies, that
there will certainly be abundant information that is easy to understand,
matched the needs of consumers who are very much involved with life
insurance and whose insurance literacy is basically high.
Then are independent insurance shops going to increase their presence even
further and become a common sales channel for life insurance going forward?
Among consumers who intend to take out life insurance going forward, 15%
in total said they would want to use independent insurance shops as an
information source when examining the possibility of getting insurance.
[Figure 4-43] By gender, 18% of females replied positively, scoring higher
than males (13%) and those in their 20s to 30s scored higher than those in their
30s and above with slightly below 20% saying they would use independent
insurance shops as an information source.
As for the channel people who intend to get life insurance would want to use
when getting their policy, 10% cited independent insurance shops. Although
females scored slightly higher by gender as did those in their 20s to 30s by age
group, there is no significant difference overall.
Considering the fact that the use of independent insurance shops as an information source at the time of taking out the most recent insurance was 10%
even among those who got their policy in or after 2011, such use is sure to
expand. On the other hand, regarding the use of independent insurance shops
as the channel to purchase insurance from, the rate of use has remained near
the level of that by those who took out their insurance in or after 2011,
14.9
12.6
17.5
18.8
17.9
14.9
10.6
11.2
9.6
8.0
11.2
9.2
12.1
11.4
4.8
9.0
0 5 10 15 20
Total(n = 1485)
Male(n = 763)
Female(n = 722)
in their 20s(n = 239)
in their 30s(n = 396)
in their 40s(n = 350)
in their 50s(n = 312)
60s and above(n = 188)
Information source
Channel to take outinsurance from
%
Figure 4-43 Intention to use when examining the possibility of getting insurance in the future
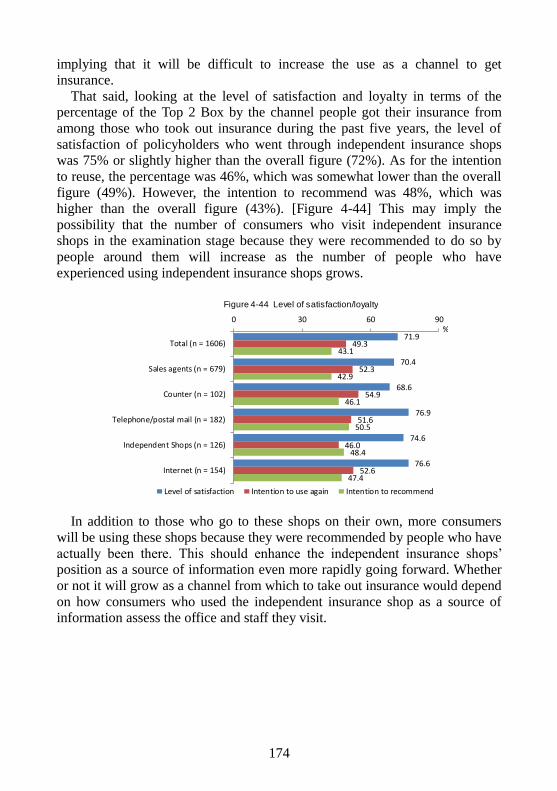
174
implying that it will be difficult to increase the use as a channel to get
insurance.
That said, looking at the level of satisfaction and loyalty in terms of the
percentage of the Top 2 Box by the channel people got their insurance from
among those who took out insurance during the past five years, the level of
satisfaction of policyholders who went through independent insurance shops
was 75% or slightly higher than the overall figure (72%). As for the intention
to reuse, the percentage was 46%, which was somewhat lower than the overall
figure (49%). However, the intention to recommend was 48%, which was
higher than the overall figure (43%). [Figure 4-44] This may imply the
possibility that the number of consumers who visit independent insurance
shops in the examination stage because they were recommended to do so by
people around them will increase as the number of people who have
experienced using independent insurance shops grows.
In addition to those who go to these shops on their own, more consumers
will be using these shops because they were recommended by people who have
actually been there. This should enhance the independent insurance shops’
position as a source of information even more rapidly going forward. Whether
or not it will grow as a channel from which to take out insurance would depend
on how consumers who used the independent insurance shop as a source of
information assess the office and staff they visit.
71.9
70.4
68.6
76.9
74.6
76.6
49.3
52.3
54.9
51.6
46.0
52.6
43.1
42.9
46.1
50.5
48.4
47.4
0 30 60 90
Total (n = 1606)
Sales agents (n = 679)
Counter (n = 102)
Telephone/postal mail (n = 182)
Independent Shops (n = 126)
Internet (n = 154)
Level of satisfaction Intention to use again Intention to recommend
%
Figure 4-44 Level of satisfaction/loyalty
175
References
In English
1. Crosby, L. A. and Stephens, N.(1987),"Effects of Relationship Marketing
on Satisfaction, Retention, and Prices in the Life Insurance Industry"
Journal of Marketing Research, XXIV, pp404-411.
2. Heskett, James L. (1995) "Putting the Service Profit Chain to Work."
Harvard Business Review (Nov. 1995). Print.
3. J. E. Brisoux, E. J. Cheron (1990) "Brand Categorization and Product
Involvement", Advances in Consumer Research Volume 17, pp.101-109.
4. J. R. Hauser, B. Wernerfelt, 1990, “An Evaluation Cost Model of Evoked
Sets”, Journal of Consumer Research, Vol.16, pp.393-408.
5. John E. Swan and Linda Jones Combs (1976)“Product Performance and
Consumer Satisfaction: A New Concept” Journal of Marketing Vol. 40
No. 2 pp.25-33.
6. Oliver, Richard.L.(1980),"A Cognitive Model of the Antecedents and
Consequences of Satisfaction Decisions," Journal of Marketing Research,
17(Nov),pp460-469.
7. Srinivas Durvasula, Steven Lysonski, Subhash C. Mehta, Buck Peng Tang
(2004) “Forging relationships with services: The antecedents that have an
impact on behavioural outcomes in the life insurance industry” Journal of
Financial Service Marketing Vol.8No.4 pp.314-326.
8. Tracy Panther, Jillian Dawes Farquhar (2004) “Consumer response to
dissatisfaction with financial service providers: An exploration of why
some stay while others swith” Journal of Financial Service Marketing
Vol.8No.4 pp.343-353.
In Japanese
9. C. Grönroos(2007)"Service Management and Marketing -Customer
Management in Service Competition",Wiley; 3 edition(邦訳:近藤宏一
監訳(2013)『北欧型サービス志向のマネジメント-競争を生き抜
くマーケティングの新潮流-』,ミネルヴァ書房)
10. Lovelock, Christopher H. (1999)"Principles of Service Marketing and
Management" Prentice-Hall(邦訳:小宮路雅博監訳(2007)『サービ
ス・マーケティング原理』白桃書房)
11. 青木幸弘 他 (2004)「製品・ブランド戦略-現代のマーケティング
戦略<1>」有斐閣アルマ
176
12. 井上智紀(2000)「インターネットが金融商品の情報探索に与える影
響」『生命保険経営』第 68巻第5号,pp.19-36
13. 井上智紀(2007)「生命保険加入プロセスにおける考慮集合の形成と
満足構造」『ニッセイ基礎研 所報』Vol.46,pp.128-145
14. 井上智紀(2009)「製販分離環境下の生保満足構造モデルの検討」『生
命保険経営』第 77巻第2号,pp.28-46
15. 井上智紀(2011)「消費者意識からみた来店型販売チャネルの動向」
『生命保険経営』第 79巻第2号,pp.105-125.
16. 鞍谷日出夫(1998)「サイコグラフィック要因を駆使したプロダク
ト・セグメンテーション戦略」『生命保険経営』第 66 巻第2
号,pp.22-43
17. (公財)生命保険文化センター(2012)『平成 24年度 生命保険に
関する全国実態調査』
18. (公財)生命保険文化センター(2013)『平成 25年度 生活保障に
関する調査』
19. 嶋口充輝(1994)「顧客満足型マーケティングの構図」,有斐閣
20. 清水聰(1999)『新しい消費者行動』,千倉書房
21. 清水聰(2006)『戦略的消費者行動論』,千倉書房
22. 清水聰(2013)『日本発のマーケティング』,千倉書房
23. 田中敬久(1999)「生命保険商品の顧客満足構造に関する一考察」『生
命保険経営』第 67巻第1号,pp.17-39
24. 田中洋(2009)『消費者行動論体系』,中央経済社
25. 田村正紀(2002)『金融リテール改革-サービス・マーケティング・
アプローチ』,千倉書房
26. 戸谷圭子・西尾チヅル・椿広計(2006)「消費者の価値観とリテー
ル金融商品選好」『マーケティングサイエンス』Vol.14No.2,日本マー
ケティングサイエンス学会,pp.21-38
27. 戸谷圭子(2006)『リテール金融マーケティング』東洋経済新報社
28. 長井毅(1999)「顧客維持戦略としての人的チャネルの有効性」『生命
保険経営』第 67巻第5号,pp.20-39
29. 西久保浩二(1996)「金融商品選択の異質性」『生命保険経営』第 64
巻第5号,pp.43-61
177
30. 西久保浩二(1999)「金融商品における顧客満足の形成要因と経営的
成果」『生命保険経営』第 67巻第4号,pp.90-110
31. 西久保浩二(2000)「金融マーケティングにおける顧客満足志向の有
効性」, 朝野熙彦・木島正明編『金融マーケティング』 ,朝倉書
店,pp199-208.
32. 山下貴子(2011)『金融行動のダイナミクス-少子高齢化と流通革命』,
千倉書房
33. 山本昭二(1999)『サービス・クオリティ』,千倉書房

178
All rights reserved. No part of this publication may be reproduced without the prior permission of the publisher.
Public Interest Incorporated Foundation
Oriental Life Insurance Cultural Development Center
The Prudential Tower 20F, 2-13-10 Nagata-cho,
Chiyoda-ku, Tokyo 100-0014, Japan
Telephone: 81-3-5501-6570 Fax: 81-3-5501-6448
E-mail: [email protected]
Website: www.olis.or.jp