life insurance purchase behavior analysis for retired people
TRANSCRIPT
Life Insurance Purchase Behavior Analysis for Retired People
BY CONNOR FRAUENDORF
ADVISOR • Dr. Gao Niu EDITORIAL REVIEWER • Dr. Rick Gorvett _________________________________________________________________________________________ Submitted in partial fulfillment of the requirements for graduation with honors in the Bryant University Honors Program MAY 2020

Bryant University Honors Program
Honors Thesis
Student: Connor Frauendorf
Faculty Advisor: Dr. Gao Niu
Editorial Reviewer: Dr. Rick Gorvett
May 2020
Life Insurance Purchase Behavior Analysis for Retired People

Life Insurance Purchase Behavior Analysis for Retired People Honors Thesis for Connor Frauendorf
1
Table of Contents
Abstract .............................................................................................................................. 2 Introduction ........................................................................................................................ 3 Literature Review................................................................................................................ 4 Research Questions ............................................................................................................. 6 Research Methodology ........................................................................................................ 8 Findings .............................................................................................................................. 9 Implications and Conclusions ............................................................................................ 13 Appendices ....................................................................................................................... 18 Appendix A – Individual Regressions ................................................................................ 19 Appendix B – Final Variable Regressions and Multiple Regressions .................................. 28 Appendix C – Correlation Matrix ...................................................................................... 31 References ........................................................................................................................ 32

Life Insurance Purchase Behavior Analysis for Retired People Honors Thesis for Connor Frauendorf
2
Abstract
Life insurance is an important need for many people in the United States. It is an insurance that
the purchaser will never get to receive the benefit, instead, upon death, their beneficiaries will
receive it to supplement their income. This study will be analyzing the Health and Retirement
Study dataset in order to identify and model the variables that are most related and/or correlated
to the purchasing behavior of life insurance in the United States. Using different mathematical
applications, such as linear modeling through R and correlations through Excel, the data has been
scanned thoroughly to isolate potential significant variables. There is a lot of literature on life
insurance itself and the purchasing behavior of life insurance, however, there is limited literature
using the Health and Retirement Study dataset. Therefore, this is an opportunity to make new
findings on this topic. The key findings show that there were seven variables, such as age and
education level, that most correlated and related to the purchasing behavior of life insurance.
Based on these findings, this study will provide some recommendations that can help life
insurance companies better understand their market and utilize the findings accordingly.
Life Insurance Purchase Behavior Analysis for Retired People Honors Thesis for Connor Frauendorf
3
Introduction
This Honors Thesis will take an in-depth analysis of the Health and Retirement Study dataset
that covers a variety of citizens of the United States attributes such as age, gender, familial
status, economic status, and many other variables and most importantly the status of owning life
insurance over a 40 year period. This dataset includes more than a thousand entries and many
more data points that were combed through to narrow down the large number of variables to
around 20-30 key ones. From this point, the variables were then run through some linear
modeling in order to calculate which variables are most statistically significant in determining
the purchasing behavior for life insurance, and from there, they were narrowed down to the final
8 variables. From a preliminary outlook, my hypothesis was that the conclusions would support
that age, familial status, number of dependents, and economic status would be the main variables
that affect the purchasing behavior of life insurance. Using R and Microsoft Excel, the data was
simplified and condensed into one that is easier and more efficiently utilized to analyze. An
analysis was then done to determine which variables were most significant and implications and
conclusions were drawn from these findings.
Life Insurance Purchase Behavior Analysis for Retired People Honors Thesis for Connor Frauendorf
4
Literature Review
These articles included within my bibliography are meaningful for the overall topic of life
insurance, however, some are not fully revolving around my topic and instead could dictate the
general market around life insurance not only in the United States, but also around the world. All
of these articles are related to the insurance industry and were very beneficial towards this study.
These articles discuss the data analytics involved in the computations at insurance companies on
top of articles that discuss profitability and behavior of consumers along with the actions taken
by the insurance companies to best suit the consumers’ needs while also benefitting ourselves.
Life insurance is a different type of insurance compared to health, property, and other financial
insurances. It is an insurance that the insured person will never use themselves, but instead, it
will go to their beneficiaries to support them financially after the insured’s death. There are two
types of life insurance: term life and whole life/cash value. There are many factors that affect
people’s decisions to purchase life insurance including age, number of dependents, income level,
and marital status among many others. Rates are determined for premiums using many of these
variables as well which also can affect purchasing behavior for cost-benefit analysis for
consumers. There is typically a market premium for those who wish to purchase insurance at an
older age. Throughout the past decade, there have been many theses and reports on life insurance
in the United States concerning purchasing behavior and premium analysis, however there has
not been any that have utilized the Health and Retirement Study data set up until this point.
Therefore, this thesis will draw a conclusion that has not been previously found in another report
while utilizing other dataset conclusions as a benchmark.

Life Insurance Purchase Behavior Analysis for Retired People Honors Thesis for Connor Frauendorf
5
E.P. Davis claims that investing and the life insurance/pension fund markets are consistently
growing over the past decade. With the growth of single parent families, two working parent
families, and other non-traditional families, along with the increase in the average age of death,
leading to older people that their families have to financially support, the demand for life
insurance as a back-up source of funds has continued to grow even with the decline of traditional
one working parent families. This trend is very important when looking at the variables that
affect purchasing behavior as the trend of purchasing behavior is heavily influenced by socio-
economic factors that can change the viewpoint and behavior of many people. The increase in
knowledge across the social classes over the years in the United States has also increased the
demand for life insurance as consumers are becoming more aware and informed about their
financial options and decisions.
My thesis analyzes the Health and Retirement Study data set which allowed me to view the
attributes and details about a large group of people in the United States that is a representation of
the socio-economic, and ethnic divisions of the US population. Using the basic behavioral
patterns for life insurance that has been researched in other papers, this study based the research
results on those to compare the differences on using different data sets and how that also affects
the purchasing behavior of life insurance.

Life Insurance Purchase Behavior Analysis for Retired People Honors Thesis for Connor Frauendorf
6
Research Questions
This study looks to understand the supply, demand, and other variables that factor into the
behaviors of purchasing life insurance from the data set that I have obtained through the Health
and Retirement Study. There were 37 variables to analyze and narrow down the amount until
there were enough factors to determine consistent data that supports a conclusion. The data is
filled with consistent information that can be helped to determine the purchasing pattern for life
insurance, and there was at first a focus on economic status, marital status, number of children,
and health status until the data set was more intensely analyzed with models. These were useful
in determining whether people buy life insurance or not and gave a more wholistic representation
of the United States and their behavior with utilizing life insurance.
This study was an in-depth analysis of the more than 10,000 individuals available through the
Health and Retirement Study which includes surveys spanning across 40 years in order to
determine which variables are drivers for purchasing behavior of life insurance. The study only
focuses on the most recent survey from 2016, however, since it was most representative of the
current climate for life insurance. The age and spending by each sector are potential variables
that were possibly needed in order to evaluate the set of retired individuals and were then used to
create an overview of the supply, demand, and variables that influence consumers of life
insurance.
This topic is very important to other scholars and researchers in this field as it will help give a
general view on what factors influence the purchasing behavior for life insurance. Life insurance
is an unsought product, meaning that people do not normally take the time to go and look for life
insurance on a regular basis and few want to discuss it. This project will hopefully help many to

Life Insurance Purchase Behavior Analysis for Retired People Honors Thesis for Connor Frauendorf
7
better understand the variables involved with purchasing life insurance in order to give the
companies more understanding of who they should target and what potential factors can predict
who is more likely to buy life insurance and when they will. I will also be working with my
mentor to potentially get this thesis published after going through many revisions and the
processes of publishing a thesis.

Life Insurance Purchase Behavior Analysis for Retired People Honors Thesis for Connor Frauendorf
8
Research Methodology
This thesis is an empirical research project since it combs through the Health and Retirement
Study Data Set in order to highlight certain variables. There was a use of linear modeling, as well
as other statistical models, in order to help model the data in a more clear and concise form. On
top of this, there is a referencing of other articles and journals that delve into the life insurance
marketplace in order to get a better understanding of other factors and information that may not
have been able to be found in the HRS Data Set. Microsoft Excel was used so that the data could
be further refined and streamlined the data much more easily.
On top of this, Excel was used for Pivot Tables and for the correlation matrix. R was used to run
both individual linear models and for the multiple linear models. This was all appropriate and
relevant to the actuary field as Microsoft Excel and many programming applications are used
every day by employees for insurance companies and this is also similar to market behavior
teams who work for life insurance companies. Analyzing data and calculating variables that are
most effective in determining purchasing behavior is crucial to the actuarial field in order to
factor in different variables of the clientele and also the population as a whole for the premium
and risk for the insurance companies. It can also help with the marketing sector for these
companies to target those families/individuals who fall under a certain category of variables to
increase profits.
Life Insurance Purchase Behavior Analysis for Retired People Honors Thesis for Connor Frauendorf
9
Findings
Out of the more than 20,900 individuals that responded to the survey, the data showed that 54%
of them or around 11,300 have life insurance. This shows an even spread of the respondents that
have life insurance. Once the data was refined into the 37 variables after an initial look through
of all variables, each of the 37 variables were run through a linear model singularly with the
presence of life insurance acting as the dependent variable. This was an important step as it
would show if the variables chosen were significant for the purchasing behavior of life
insurance. Each individual regression can be seen in Appendix A. The variables that showed that
they had the most significance out of the 37 isolated variables were age, health status, education
level, marital status, weight, if they had Medicare, if they had Long Term Care insurance, and
how many times they visited the doctor within the past two years. The preliminary results show
that this did not support my initial hypothesis. However, it did follow what previous reports have
found in which certain variables such as age and education level are significant in determining
purchase behavior of life insurance.
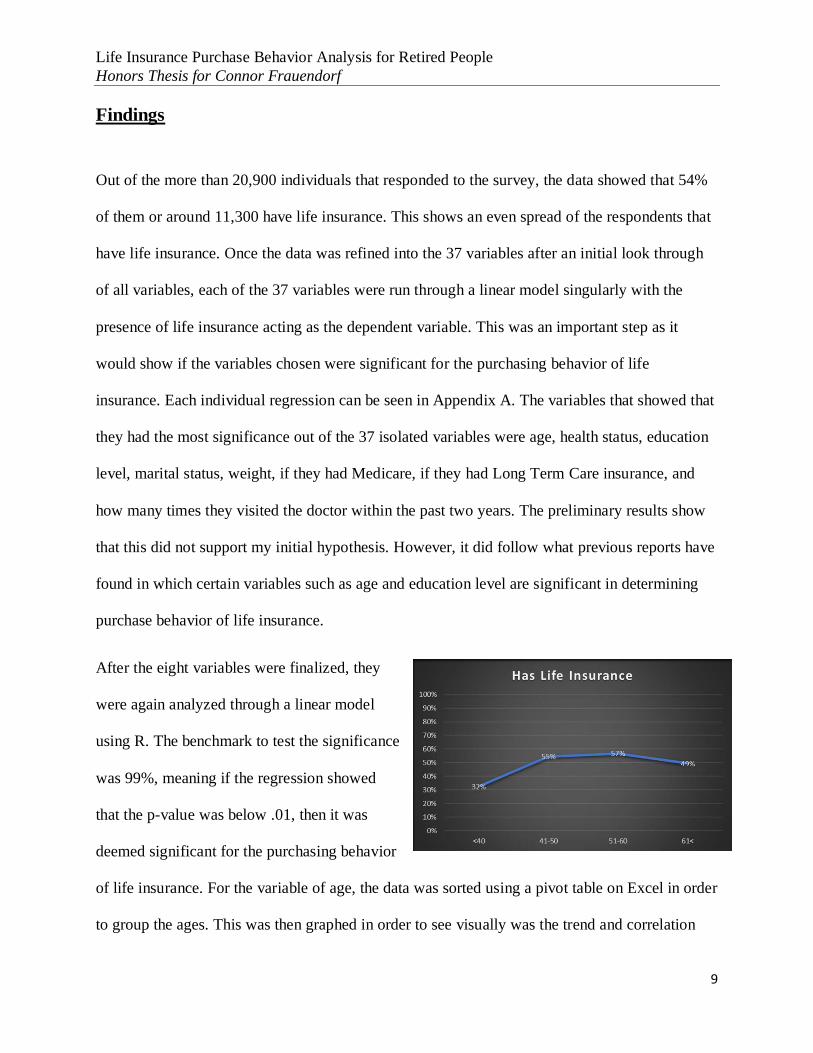
After the eight variables were finalized, they
were again analyzed through a linear model
using R. The benchmark to test the significance
was 99%, meaning if the regression showed
that the p-value was below .01, then it was
deemed significant for the purchasing behavior
of life insurance. For the variable of age, the data was sorted using a pivot table on Excel in order
to group the ages. This was then graphed in order to see visually was the trend and correlation
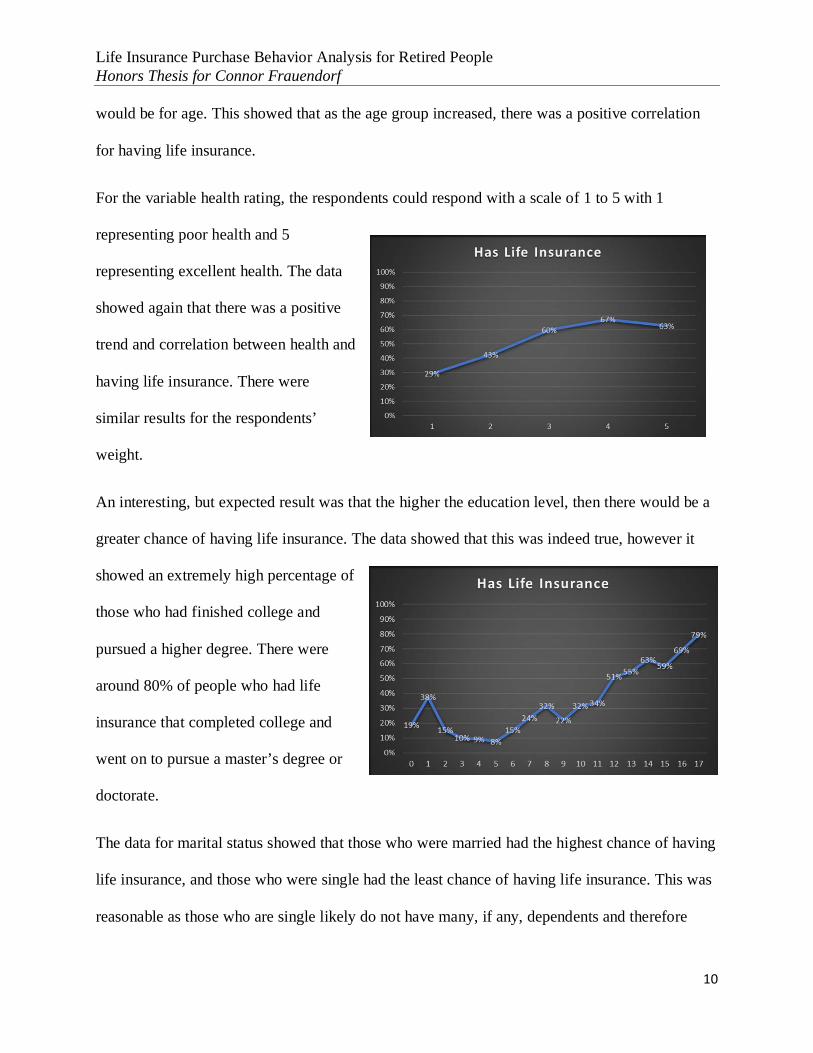
Life Insurance Purchase Behavior Analysis for Retired People Honors Thesis for Connor Frauendorf
10
would be for age. This showed that as the age group increased, there was a positive correlation
for having life insurance.
For the variable health rating, the respondents could respond with a scale of 1 to 5 with 1
representing poor health and 5
representing excellent health. The data
showed again that there was a positive
trend and correlation between health and
having life insurance. There were
similar results for the respondents’
weight.
An interesting, but expected result was that the higher the education level, then there would be a
greater chance of having life insurance. The data showed that this was indeed true, however it
showed an extremely high percentage of
those who had finished college and
pursued a higher degree. There were
around 80% of people who had life
insurance that completed college and
went on to pursue a master’s degree or
doctorate.
The data for marital status showed that those who were married had the highest chance of having
life insurance, and those who were single had the least chance of having life insurance. This was
reasonable as those who are single likely do not have many, if any, dependents and therefore
Life Insurance Purchase Behavior Analysis for Retired People Honors Thesis for Connor Frauendorf
11
would have less reason or need to purchase life insurance. Contrastingly, those who are married
have their partner to support and possibly children, therefore, they would theoretically have a
greater need for life insurance.
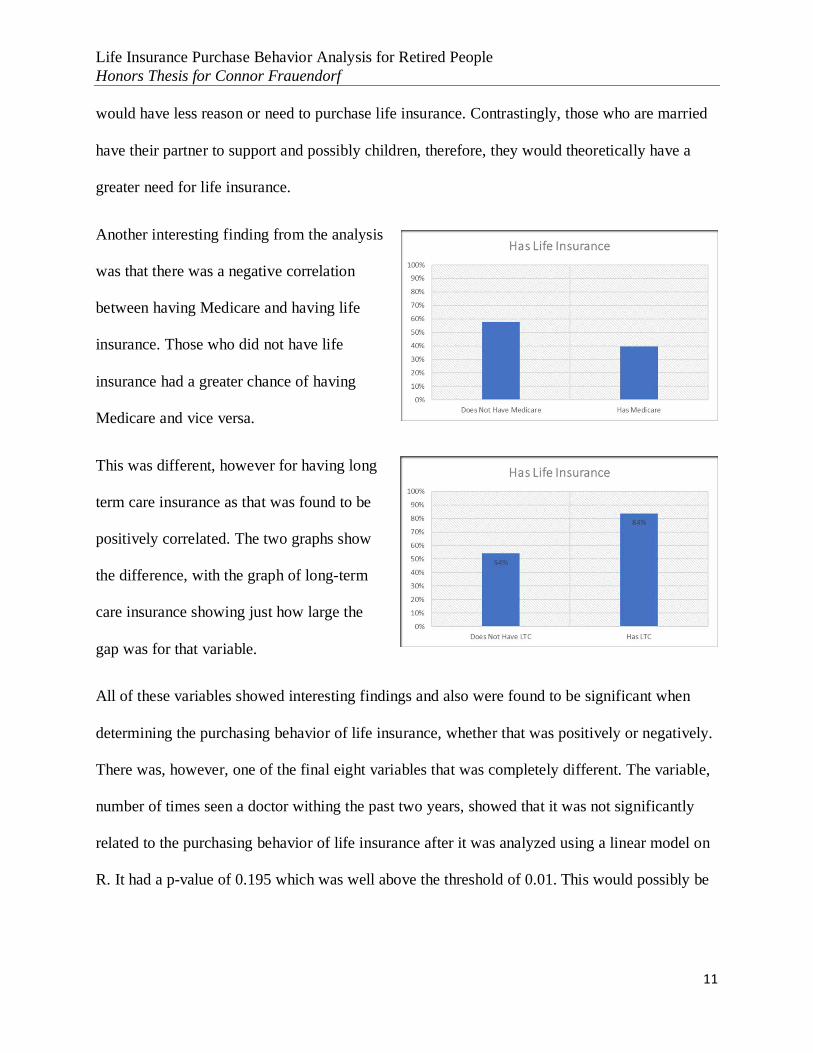
Another interesting finding from the analysis
was that there was a negative correlation
between having Medicare and having life
insurance. Those who did not have life
insurance had a greater chance of having
Medicare and vice versa.
This was different, however for having long
term care insurance as that was found to be
positively correlated. The two graphs show
the difference, with the graph of long-term
care insurance showing just how large the
gap was for that variable.
All of these variables showed interesting findings and also were found to be significant when
determining the purchasing behavior of life insurance, whether that was positively or negatively.
There was, however, one of the final eight variables that was completely different. The variable,
number of times seen a doctor withing the past two years, showed that it was not significantly
related to the purchasing behavior of life insurance after it was analyzed using a linear model on
R. It had a p-value of 0.195 which was well above the threshold of 0.01. This would possibly be

Life Insurance Purchase Behavior Analysis for Retired People Honors Thesis for Connor Frauendorf
12
significant if using a different threshold or confidence interval, but for this study it did not meet
the requirements.
After these variables were analyzed individually, it was analyzed on R using a multiple
regression approach. The seven final variables were the independent variables with having life
insurance acting as the dependent variable. The linear model can be found in Appendix B. It
showed that age, health status, education level, marital status (only single and married), weight,
having Medicare, and having long term care insurance were significant in determining the
purchase behavior of life insurance. This is important as it shows that each variable alone is
significant, and when paired together they remain significant regardless of the interactions that is
present.
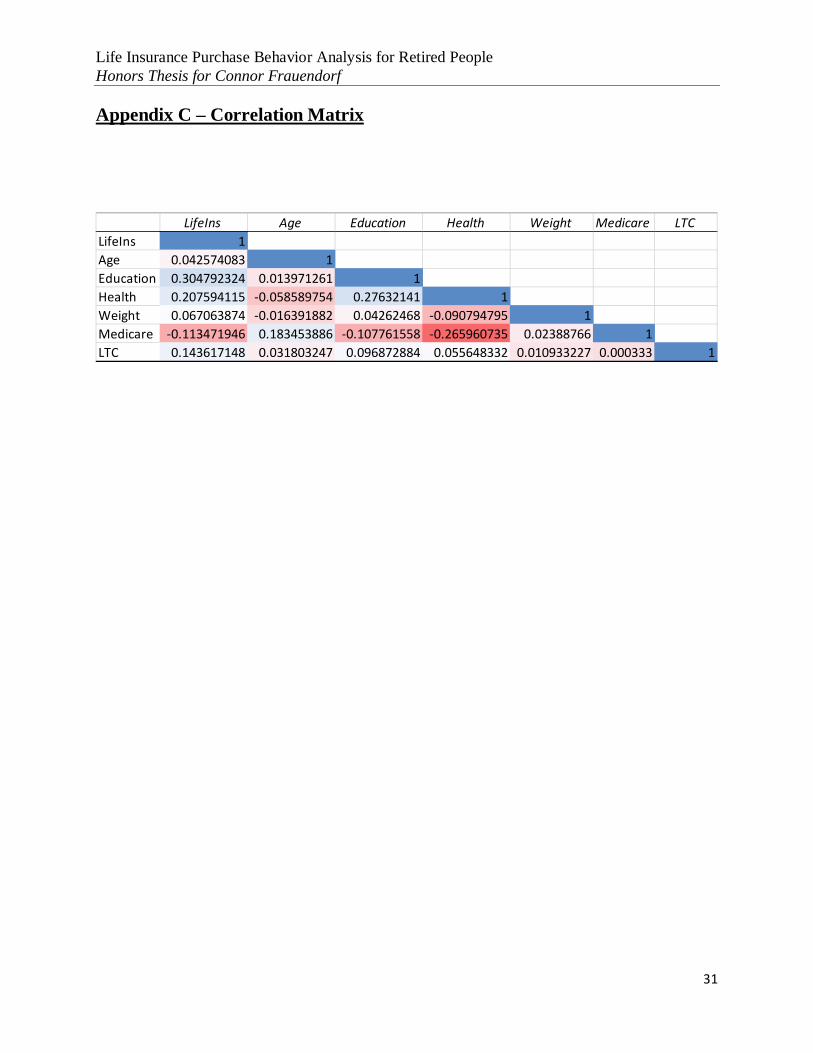
Once the variables were confirmed through the multiple regression, those variables were then put
into Microsoft Excel and a correlation matrix was run. This matrix showed that all of the
variables were positively correlated with only having Medicare negatively correlated. It also
showed that
education level,
health status,
having Medicare,
and having long term care insurance were the most correlated to having life insurance. This was
important when looking at the implications and conclusions.
Life Insurance Purchase Behavior Analysis for Retired People Honors Thesis for Connor Frauendorf
13
Implications and Conclusions
There were some limitations to this study. Firstly, there was a data limitation. The data itself did
not contain all variables that are potentially necessary such as gender. This could have impacted
the data if included or could have greater expanded upon the conclusions reached. On top of this,
there was a model limitation. For each of the variables, and even the multiple variable findings,
some of the variables could have been not fully linear. This could have skewed the data possibly
and could have affected the findings.
My research question was, what variables most affect or correlate to the purchasing behavior of
life insurance? Some interesting findings that were concluded upon from the data were that both
location of living, and economic status/wealth were not found to be significant. For the location
variable, not enough respondents stated which state they lived in. This led to not enough data to
definitively conclude something either for or against it. For economic status/wealth, however, it
was supported through the data that they were not significant in determining the purchase
behavior of life insurance. The p-value for salary earned was 0.381 which was extremely high
and shows that salary did not significant affect purchase behavior within my constraints and
thresholds. The p-value of net earnings was 0.485 which was even higher and showed that it was
not significant in determining purchase behavior. The hypothesis stated that economic status
would be significant, and the data supported the opposite.
The variables that were indeed significant in determining the purchase behavior of life insurance
were health status, marital status, education level, the presence of Medicare, and the presence of
long-term care insurance. These variables were most significant out of the seven variables
isolated. For health status, the higher the level of perceived health, then the higher the chance of

Life Insurance Purchase Behavior Analysis for Retired People Honors Thesis for Connor Frauendorf
14
owning life insurance. This shows that those who believe they are healthy wish to insure that
health in the off chance that anything goes wrong with their life. It also shows that those who
have low perceived health do not put as much stock or thought into life insurance. It could also
be more expensive for those with poor health and this could lead to different allocation of their
funds which would not include life insurance.
For marital status, there was a significant disparity between those who were married and those
who were single regarding the purchase of life insurance. Those who were married had a much
higher chance of owning life insurance than those who were single. This can be explained by the
fact that married individuals have more dependents than single people in most cases. Those who
are married are more likely to purchase life insurance in order to help their spouse and possibly
children financially in the event of their passing. For those who are single, they do not have as
many dependents; they possibly have dependents of children or elderly parents, however.
For education level, the findings were almost identical to the hypothesis. The findings showed
that the more education one receives, the greater the chance that they own life insurance. This
can be explained by a higher salary for those who are more educated in most cases and also the
level of information that they know about life insurance increases as they receive more
education. The presence of Medicare was the only variable that was negatively correlated to
owning life insurance. There was a higher chance of someone owning life insurance if they did
not own Medicare and vice versa. This could be explained by the fact that those who own
Medicare are over the age of 65 and therefore do not have many, if any, dependents to worry
about and they theoretically have saved enough over their career to not need life insurance.
Contrastingly, those without Medicare are younger than 65 and could still have years of their
career left and dependents to support financially in the event of their passing.

Life Insurance Purchase Behavior Analysis for Retired People Honors Thesis for Connor Frauendorf
15
Lastly, there was a positive correlation for the presence of long-term care insurance. Those who
owned long-term care insurance were more likely to own life insurance. This is explained by the
fact that long-term care insurance and life insurance go hand in hand. If someone purchases long-
term care insurance, then they are most likely worried about future problems that could be very
costly. Similarly, they would then be more willing to purchase life insurance in the event of their
death to support their dependents financially for expenses that they would need to afford.
There are a few implications that can therefore be drawn from these findings. The Some of these
implications are strictly analytical and show that some variables are more important than others
in determining the purchase behavior of life insurance. Applying these findings to the life
insurance industry can show further implications. Four implications were drawn when looking at
the life insurance industry.
The first implication is that life insurance companies should target those with long-term care
insurance or possibly offer a bundle deal of life insurance and long-term care insurance. This will
allow life insurance companies to greater penetrate the market and target those who have long-
term care insurance as these people typically will purchase life insurance. They should still target
those without long term care insurance however it seems as if the two insurances are paired by
many customers and a bundle would attract more new customers and entice old customers to
remain with the company.
The next implication stems from the fact that the data showed that those who are more highly
educated have a higher chance of purchasing life insurance. This means that life insurance
companies can target those who are more highly educated for their product. On top of this
however, it shows that those who are less educated could possibly not know or fully understand

Life Insurance Purchase Behavior Analysis for Retired People Honors Thesis for Connor Frauendorf
16
what life insurance is and how beneficial it can be. Therefore, it would be useful for insurance
companies and possibly the government to advocate and inform the public of the uses and
benefits of life insurance. This will help many millions of Americans possibly protect themselves
again risk even more and also help insurance companies bring in new customers.
The next implication revolves around owning Medicare. Since those who do not own Medicare
have a higher chance of owning life insurance, life insurance companies can target their
marketing towards this group of people. The data did show that those with Medicare still own
life insurance with about 40% of them owning it. This means that it is still a viable market for
life insurance companies to target and sell life insurance to.
The last implication that was drawn from the findings and this study focuses on the fact that
economic status was found to not be significant in determining the purchase behavior of life
insurance. This is a surprise for many as life insurance can be expensive and also many do not
view it as a necessity. This means that life insurance companies should focus their efforts on
marketing similar packages to all of the classes, specifically the lower class. It can be found that
those in the lower class are most at risk with deaths of the main money making member of their
families as they will have to work even more than they currently do to make up for the lost
income. Therefore, those of the lower class could be a market with untapped potential for life
insurance companies that will greatly benefit the American society as a whole if those in the
lower class can have a support netting of finances in the unfortunate event of a death.
Overall, many more implications can be drawn from these findings. There are also other
variables that can be looked at and incorporated into the study that was not previously used. This
study could be expanded to become a cross-decade study of the HRS dataset to look at trends in

Life Insurance Purchase Behavior Analysis for Retired People Honors Thesis for Connor Frauendorf
17
the American population regarding life insurance over time. That could have more implications
that are very significant. This study, however, has many findings that can be implemented and
tested by life insurance companies nationwide to benefit not only their own company, but also
the United States population as a whole.

Life Insurance Purchase Behavior Analysis for Retired People Honors Thesis for Connor Frauendorf
18
Appendices

Life Insurance Purchase Behavior Analysis for Retired People Honors Thesis for Connor Frauendorf
19
Appendix A – Individual Regressions lm(formula = LifeIns ~ Age, data = Train) Residuals: Min 1Q Median 3Q Max -2.054 -1.869 -1.798 2.131 6.274 Coefficients: Estimate Std. Error t value Pr(>|t|) (Intercept) 2.513300 0.081745 30.746 < 2e-16 *** Age 0.005466 0.001224 4.464 8.09e-06 ***
lm(formula = LifeIns ~ Health, data = Train) Residuals: Min 1Q Median 3Q Max -3.322 -1.883 -1.403 2.117 6.597 Coefficients: Estimate Std. Error t value Pr(>|t|) (Intercept) 2.16327 0.04175 51.81 <2e-16 *** Health 0.23983 0.01326 18.08 <2e-16 ***
lm(formula = LifeIns ~ Education, data = Train) Residuals: Min 1Q Median 3Q Max -2.026 -1.855 -1.818 2.121 7.158 Coefficients: Estimate Std. Error t value Pr(>|t|) (Intercept) 3.025757 0.050927 59.414 < 2e-16 *** Education -0.012201 0.002809 -4.343 1.44e-05 ***
lm(formula = LifeIns ~ Race, data = Train) Residuals: Min 1Q Median 3Q Max -1.916 -1.916 -1.916 2.084 5.084 Coefficients: (1 not defined because of singularities) Estimate Std. Error t value Pr(>|t|) (Intercept) 2.916 0.128 22.79 <2e-16 *** RaceTRUE NA NA NA NA

Life Insurance Purchase Behavior Analysis for Retired People Honors Thesis for Connor Frauendorf
20
lm(formula = LifeIns ~ Children, data = Train) Residuals: Min 1Q Median 3Q Max -3.870 -1.841 -1.799 2.159 6.201 Coefficients: Estimate Std. Error t value Pr(>|t|) (Intercept) 2.79892 0.03525 79.400 <2e-16 *** Children 0.02092 0.00736 2.842 0.0045 **
lm(formula = LifeIns ~ Military, data = Train) Residuals: Min 1Q Median 3Q Max -2.187 -1.885 -1.482 2.115 6.519 Coefficients: Estimate Std. Error t value Pr(>|t|) (Intercept) 2.38067 0.12872 18.495 < 2e-16 *** Military 0.10084 0.02691 3.747 0.000181 ***
lm(formula = LifeIns ~ Religion, data = Train) Residuals: Min 1Q Median 3Q Max -2.019 -1.841 -1.815 2.159 6.184 Coefficients: Estimate Std. Error t value Pr(>|t|) (Intercept) 2.79004 0.04972 56.12 <2e-16 *** Religion 0.02546 0.01686 1.51 0.131
lm(formula = LifeIns ~ MaritalStatus, data = Train) Residuals: Min 1Q Median 3Q Max -2.687 -1.661 -1.661 1.954 6.339 Coefficients: Estimate Std. Error t value Pr(>|t|) (Intercept) 2.533185 0.024320 104.16 <2e-16 *** MaritalStatus 0.128208 0.007427 17.26 <2e-16 ***
Life Insurance Purchase Behavior Analysis for Retired People Honors Thesis for Connor Frauendorf
21
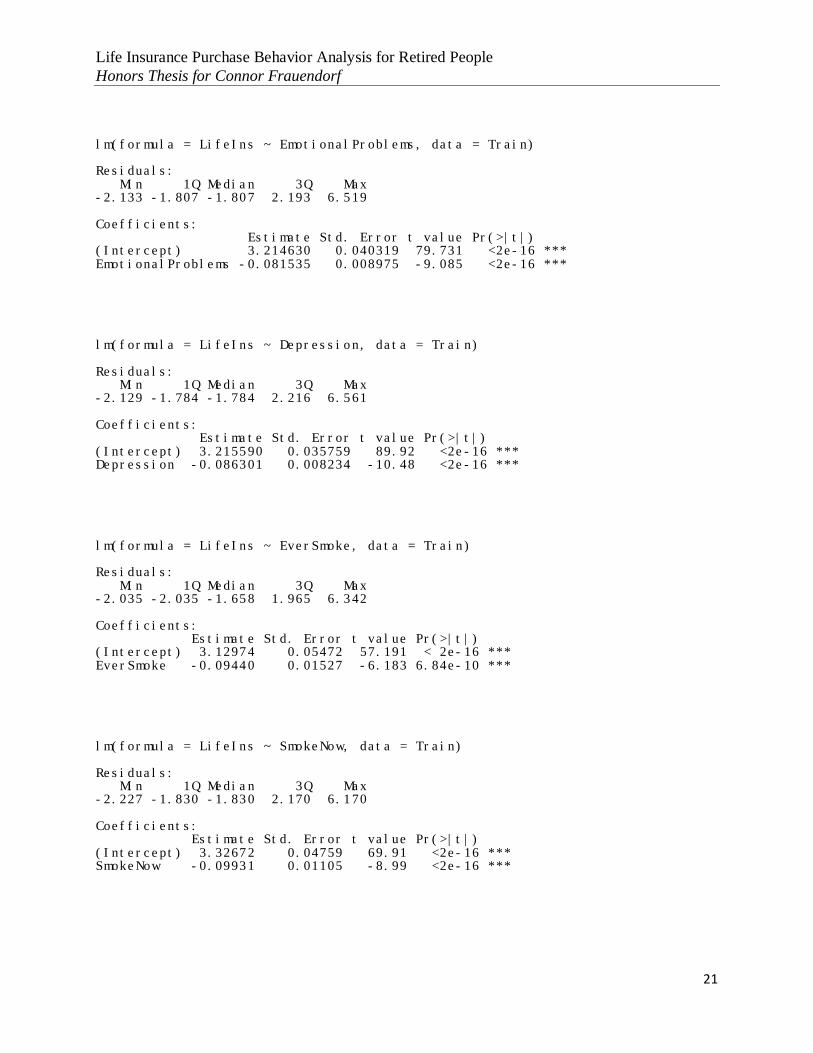
lm(formula = LifeIns ~ EmotionalProblems, data = Train) Residuals: Min 1Q Median 3Q Max -2.133 -1.807 -1.807 2.193 6.519 Coefficients: Estimate Std. Error t value Pr(>|t|) (Intercept) 3.214630 0.040319 79.731 <2e-16 *** EmotionalProblems -0.081535 0.008975 -9.085 <2e-16 ***
lm(formula = LifeIns ~ Depression, data = Train) Residuals: Min 1Q Median 3Q Max -2.129 -1.784 -1.784 2.216 6.561 Coefficients: Estimate Std. Error t value Pr(>|t|) (Intercept) 3.215590 0.035759 89.92 <2e-16 *** Depression -0.086301 0.008234 -10.48 <2e-16 ***
lm(formula = LifeIns ~ EverSmoke, data = Train) Residuals: Min 1Q Median 3Q Max -2.035 -2.035 -1.658 1.965 6.342 Coefficients: Estimate Std. Error t value Pr(>|t|) (Intercept) 3.12974 0.05472 57.191 < 2e-16 *** EverSmoke -0.09440 0.01527 -6.183 6.84e-10 ***
lm(formula = LifeIns ~ SmokeNow, data = Train) Residuals: Min 1Q Median 3Q Max -2.227 -1.830 -1.830 2.170 6.170 Coefficients: Estimate Std. Error t value Pr(>|t|) (Intercept) 3.32672 0.04759 69.91 <2e-16 *** SmokeNow -0.09931 0.01105 -8.99 <2e-16 ***

Life Insurance Purchase Behavior Analysis for Retired People Honors Thesis for Connor Frauendorf
22
lm(formula = LifeIns ~ EverDrinkAlcohol, data = Train) Residuals: Min 1Q Median 3Q Max -2.333 -1.750 -1.750 2.250 6.250 Coefficients: Estimate Std. Error t value Pr(>|t|) (Intercept) 2.677489 0.024239 110.462 <2e-16 *** EverDrinkAlcohol 0.072865 0.007289 9.997 <2e-16 ***
lm(formula = LifeIns ~ DaysAlc, data = Train) Residuals: Min 1Q Median 3Q Max -1.754 -1.748 -1.747 2.252 6.253 Coefficients: Estimate Std. Error t value Pr(>|t|) (Intercept) 2.7472461 0.0250155 109.822 <2e-16 *** DaysAlc 0.0007882 0.0083673 0.094 0.925
lm(formula = LifeIns ~ Weight, data = Train) Residuals: Min 1Q Median 3Q Max -1.940 -1.880 -1.834 2.115 6.612 Coefficients: Estimate Std. Error t value Pr(>|t|) (Intercept) 2.9852002 0.0326775 91.353 < 2e-16 *** Weight -0.0005977 0.0001554 -3.846 0.00012 ***
lm(formula = LifeIns ~ Height, data = Train) Residuals: Min 1Q Median 3Q Max -2.181 -1.836 -1.836 2.164 6.250 Coefficients: Estimate Std. Error t value Pr(>|t|) (Intercept) 2.40586 0.18705 12.86 <2e-16 *** Height 0.08610 0.03634 2.37 0.0178 *

Life Insurance Purchase Behavior Analysis for Retired People Honors Thesis for Connor Frauendorf
23
lm(formula = LifeIns ~ Height2, data = Train) Residuals: Min 1Q Median 3Q Max -1.824 -1.823 -1.821 2.177 6.179 Coefficients: Estimate Std. Error t value Pr(>|t|) (Intercept) 2.8242482 0.0264337 106.843 <2e-16 *** Height2 -0.0003431 0.0034828 -0.099 0.922
lm(formula = LifeIns ~ CurrentJob, data = Train) Residuals: Min 1Q Median 3Q Max -7.211 -1.903 -1.736 2.041 6.264 Coefficients: Estimate Std. Error t value Pr(>|t|) (Intercept) 2.680076 0.019404 138.12 <2e-16 *** CurrentJob 0.055867 0.003793 14.73 <2e-16 ***
lm(formula = LifeIns ~ RetireYR, data = Train) Residuals: Min 1Q Median 3Q Max -2.285 -1.920 -1.919 2.080 6.081 Coefficients: Estimate Std. Error t value Pr(>|t|) (Intercept) 2.828e+00 9.761e-02 28.973 <2e-16 *** RetireYR 4.572e-05 3.295e-05 1.388 0.165
lm(formula = LifeIns ~ Salary, data = Train) Residuals: Min 1Q Median 3Q Max -2.527 -2.234 1.473 1.766 5.473 Coefficients: Estimate Std. Error t value Pr(>|t|) (Intercept) 3.234e+00 1.630e-01 19.841 <2e-16 *** Salary 2.930e-07 3.337e-07 0.878 0.381

Life Insurance Purchase Behavior Analysis for Retired People Honors Thesis for Connor Frauendorf
24
lm(formula = LifeIns ~ Earnings, data = Train) Residuals: Min 1Q Median 3Q Max -2.373 -2.220 1.627 1.780 5.627 Coefficients: Estimate Std. Error t value Pr(>|t|) (Intercept) 3.219e+00 1.220e-01 26.392 <2e-16 *** Earnings 1.547e-07 2.215e-07 0.698 0.485
lm(formula = LifeIns ~ EarningWhenLeft, data = Train) Residuals: Min 1Q Median 3Q Max -2.084 -1.853 -1.849 2.150 6.150 Coefficients: Estimate Std. Error t value Pr(>|t|) (Intercept) 2.850e+00 4.740e-02 60.113 <2e-16 *** EarningWhenLeft 2.343e-07 1.381e-07 1.696 0.09 .
lm(formula = LifeIns ~ HealthProb, data = Train) Residuals: Min 1Q Median 3Q Max -2.036 -1.782 -1.782 2.218 6.472 Coefficients: Estimate Std. Error t value Pr(>|t|) (Intercept) 3.099622 0.032446 95.531 < 2e-16 *** HealthProb -0.063514 0.008072 -7.868 3.82e-15 ***
lm(formula = LifeIns ~ Medicare, data = Train) Residuals: Min 1Q Median 3Q Max -1.934 -1.934 -1.807 2.066 6.319 Coefficients: Estimate Std. Error t value Pr(>|t|) (Intercept) 2.965636 0.025333 117.064 < 2e-16 *** Medicare -0.031685 0.007086 -4.472 7.8e-06 ***

Life Insurance Purchase Behavior Analysis for Retired People Honors Thesis for Connor Frauendorf
25
lm(formula = LifeIns ~ PremiumsMO, data = Train) Residuals: Min 1Q Median 3Q Max -2.155 -2.074 1.845 1.926 5.927 Coefficients: Estimate Std. Error t value Pr(>|t|) (Intercept) 3.073e+00 4.101e-02 74.940 <2e-16 *** PremiumsMO 8.182e-06 8.361e-06 0.979 0.328
lm(formula = LifeIns ~ LTC, data = Train) Residuals: Min 1Q Median 3Q Max -2.561 -1.931 -1.301 2.069 6.699 Coefficients: Estimate Std. Error t value Pr(>|t|) (Intercept) 2.14358 0.05170 41.46 <2e-16 *** LTC 0.15746 0.01073 14.68 <2e-16 ***
lm(formula = LifeIns ~ TimesSeenDoctorIn2Yrs, data = Train) Residuals: Min 1Q Median 3Q Max -2.383 -1.814 -1.810 2.187 6.190 Coefficients: Estimate Std. Error t value Pr(>|t|) (Intercept) 2.810e+00 1.531e-02 183.48 <2e-16 *** TimesSeenDoctorIn2Yrs 5.740e-04 4.814e-05 11.92 <2e-16 ***
lm(formula = LifeIns ~ Inheritance10k, data = Train) Residuals: Min 1Q Median 3Q Max -2.234 -1.855 -1.818 2.151 6.182 Coefficients: Estimate Std. Error t value Pr(>|t|) (Intercept) 2.818e+00 1.669e-02 168.867 < 2e-16 *** Inheritance10k 4.167e-04 8.299e-05 5.021 5.18e-07 ***

Life Insurance Purchase Behavior Analysis for Retired People Honors Thesis for Connor Frauendorf
26
lm(formula = LifeIns ~ Inheritance100k, data = Train) Residuals: Min 1Q Median 3Q Max -1.631 -1.614 -1.598 2.372 6.700 Coefficients: Estimate Std. Error t value Pr(>|t|) (Intercept) 2.6309748 0.0186199 141.299 <2e-16 *** Inheritance100k -0.0003313 0.0001538 -2.154 0.0313 *
lm(formula = LifeIns ~ Inheritance500kormore, data = Train) Residuals: Min 1Q Median 3Q Max -2.008 -1.511 -1.501 2.484 6.499 Coefficients: Estimate Std. Error t value Pr(>|t|) (Intercept) 2.5008593 0.0193806 129.039 <2e-16 *** Inheritance500kormore 0.0005074 0.0001984 2.557 0.0106 *
lm(formula = LifeIns ~ AnyInheritance, data = Train) Residuals: Min 1Q Median 3Q Max -2.764 -2.749 1.236 1.236 5.531 Coefficients: Estimate Std. Error t value Pr(>|t|) (Intercept) 3.7639573 0.0334771 112.434 <2e-16 *** AnyInheritance -0.0002955 0.0003076 -0.961 0.337
lm(formula = LifeIns ~ ReceiveLifeInsSettlement, data = Train) Residuals: Min 1Q Median 3Q Max -3.816 -1.256 -1.256 1.464 5.744 Coefficients: Estimate Std. Error t value Pr(>|t|) (Intercept) 1.93607 0.16521 11.719 < 2e-16 *** ReceiveLifeInsSettlement 0.32001 0.04075 7.854 2.17e-14 ***

Life Insurance Purchase Behavior Analysis for Retired People Honors Thesis for Connor Frauendorf
27
lm(formula = LifeIns ~ State, data = Train) Residuals: Min 1Q Median 3Q Max -2.586 -1.997 1.414 2.003 6.003 Coefficients: Estimate Std. Error t value Pr(>|t|) (Intercept) 2.50639 0.15650 16.016 < 2e-16 *** State 0.09814 0.02537 3.868 0.000116 ***
lm(formula = LifeIns ~ Married, data = Train) Residuals: Min 1Q Median 3Q Max -2.140 -2.140 1.860 1.860 6.034 Coefficients: Estimate Std. Error t value Pr(>|t|) (Intercept) 2.92283 0.11329 25.800 <2e-16 *** Married 0.04339 0.02337 1.857 0.0633 .
lm(formula = LifeIns ~ Cohort, data = Train) Residuals: Min 1Q Median 3Q Max -2.080 -1.861 -1.752 2.139 6.248 Coefficients: Estimate Std. Error t value Pr(>|t|) (Intercept) 3.134768 0.043408 72.216 < 2e-16 *** Cohort -0.054709 0.008541 -6.406 1.53e-10 ***

Life Insurance Purchase Behavior Analysis for Retired People Honors Thesis for Connor Frauendorf
28
Appendix B – Final Variable Regressions and Multiple Regressions lm(formula = LifeIns ~ Age, data = Train) Residuals: Min 1Q Median 3Q Max -0.7066 -0.5592 0.4265 0.4408 0.5549 Coefficients: Estimate Std. Error t value Pr(>|t|) (Intercept) 0.307258 0.092629 3.317 0.000918 *** Age 0.004754 0.001744 2.726 0.006440 **
lm(formula = LifeIns ~ Education, data = Train) Residuals: Min 1Q Median 3Q Max -0.7558 -0.4970 0.2442 0.3995 1.1240 Coefficients: Estimate Std. Error t value Pr(>|t|) (Intercept) -0.123977 0.034166 -3.629 0.000288 *** Education 0.051749 0.002528 20.471 < 2e-16 ***
lm(formula = LifeIns ~ MaritalStatus, data = Train) Residuals: Min 1Q Median 3Q Max -0.6342 -0.5245 0.3658 0.3658 0.5908 Coefficients: Estimate Std. Error t value Pr(>|t|) (Intercept) 0.52454 0.01614 32.498 < 2e-16 *** MaritalStatusMarried 0.10964 0.01920 5.709 1.21e-08 *** MaritalStatusNever Married -0.11537 0.02552 -4.520 6.36e-06 *** MaritalStatusSeparated -0.09184 0.03754 -2.447 0.0145 * MaritalStatusWidowed -0.07717 0.04280 -1.803 0.0715 .
lm(formula = LifeIns ~ Health, data = Train) Residuals: Min 1Q Median 3Q Max -0.7378 -0.5486 0.2622 0.4514 0.6406 Coefficients: Estimate Std. Error t value Pr(>|t|) (Intercept) 0.264850 0.022951 11.54 <2e-16 *** Health 0.094586 0.006968 13.57 <2e-16 ***

Life Insurance Purchase Behavior Analysis for Retired People Honors Thesis for Connor Frauendorf
29
lm(formula = LifeIns ~ Weight, data = Train) Residuals: Min 1Q Median 3Q Max -0.8951 -0.5502 0.4163 0.4464 0.4899 Coefficients: Estimate Std. Error t value Pr(>|t|) (Intercept) 4.770e-01 2.056e-02 23.2 < 2e-16 *** Weight 4.185e-04 9.733e-05 4.3 1.75e-05 ***
lm(formula = LifeIns ~ Medicare, data = Train) Residuals: Min 1Q Median 3Q Max -0.5783 -0.5783 0.4217 0.4217 0.6041 Coefficients: Estimate Std. Error t value Pr(>|t|) (Intercept) 0.57834 0.00816 70.879 < 2e-16 *** Medicare -0.18246 0.02498 -7.306 3.3e-13 ***
lm(formula = LifeIns ~ LTC, data = Train) Residuals: Min 1Q Median 3Q Max -0.8373 -0.5406 0.4594 0.4594 0.4594 Coefficients: Estimate Std. Error t value Pr(>|t|) (Intercept) 0.540604 0.007929 68.177 <2e-16 *** LTC 0.296698 0.031961 9.283 <2e-16 ***
lm(formula = LifeIns ~ TimesSeenDoctorIn2Yrs, data = Train) Residuals: Min 1Q Median 3Q Max -0.5624 -0.5608 0.4380 0.4396 0.6360 Coefficients: Estimate Std. Error t value Pr(>|t|) (Intercept) 0.5623738 0.0082185 68.428 <2e-16 *** TimesSeenDoctorIn2Yrs -0.0003968 0.0003061 -1.296 0.195

Life Insurance Purchase Behavior Analysis for Retired People Honors Thesis for Connor Frauendorf
30
lm(formula = LifeIns ~ Age + Education + MaritalStatus + Health + Weight + Medicare + LTC + TimesSeenDoctorIn2Yrs, data = Train) Residuals: Min 1Q Median 3Q Max -1.3405 -0.4521 0.1791 0.3975 1.1377 Coefficients: Estimate Std. Error t value Pr(>|t|) (Intercept) -6.544e-01 9.791e-02 -6.684 2.65e-11 *** Age 7.167e-03 1.657e-03 4.326 1.55e-05 *** Education 4.091e-02 2.583e-03 15.838 < 2e-16 *** MaritalStatusMarried 9.720e-02 1.821e-02 5.338 9.93e-08 *** MaritalStatusNever Married -8.827e-02 2.405e-02 -3.670 0.000246 *** MaritalStatusSeparated -2.665e-02 3.533e-02 -0.754 0.450751 MaritalStatusWidowed -4.664e-02 4.027e-02 -1.158 0.246824 Health 5.288e-02 7.243e-03 7.302 3.40e-13 *** Weight 4.440e-04 9.064e-05 4.898 1.01e-06 *** Medicare -8.540e-02 2.463e-02 -3.467 0.000531 *** LTC 2.266e-01 2.997e-02 7.559 4.97e-14 *** TimesSeenDoctorIn2Yrs 2.254e-04 2.894e-04 0.779 0.436117
lm(formula = LifeIns ~ Age + Education + MaritalStatus + Health + Weight + Medicare + LTC, data = Train) Residuals: Min 1Q Median 3Q Max -1.3389 -0.4522 0.1799 0.3969 1.1582 Coefficients: Estimate Std. Error t value Pr(>|t|) (Intercept) -6.493e-01 9.768e-02 -6.647 3.40e-11 *** Age 7.141e-03 1.656e-03 4.312 1.66e-05 *** Education 4.104e-02 2.577e-03 15.923 < 2e-16 *** MaritalStatusMarried 9.683e-02 1.820e-02 5.320 1.10e-07 *** MaritalStatusNever Married -8.854e-02 2.405e-02 -3.682 0.000234 *** Health 5.188e-02 7.127e-03 7.280 3.99e-13 *** Weight 4.425e-04 9.062e-05 4.883 1.09e-06 *** Medicare -8.388e-02 2.455e-02 -3.417 0.000640 *** LTC 2.268e-01 2.997e-02 7.566 4.72e-14 ***
Life Insurance Purchase Behavior Analysis for Retired People Honors Thesis for Connor Frauendorf
31
Appendix C – Correlation Matrix
LifeIns Age Education Health Weight Medicare LTCLifeIns 1Age 0.042574083 1Education 0.304792324 0.013971261 1Health 0.207594115 -0.058589754 0.27632141 1Weight 0.067063874 -0.016391882 0.04262468 -0.090794795 1Medicare -0.113471946 0.183453886 -0.107761558 -0.265960735 0.02388766 1LTC 0.143617148 0.031803247 0.096872884 0.055648332 0.010933227 0.000333 1
Life Insurance Purchase Behavior Analysis for Retired People Honors Thesis for Connor Frauendorf
32
References Browne, Mark J., and Kihong Kim. “An International Analysis of Life Insurance Demand.” The
Journal of Risk and Insurance, vol. 60, no. 4, 1993, pp. 616–634.
“Customer Profitability Forecasting Using Big Data Analytics: A Case Study of the Insurance
Industry.” Computers & Industrial Engineering, Pergamon, 15 Sept. 2016.
Davis, E P. “Financial Market Activity of Life Insurance Companies and Pension Funds.” The
Bank for International Settlements, 1 Jan. 1988.
Gatzert, Nadine. “The Secondary Market for Life Insurance in the United Kingdom, Germany,
and the United States: Comparison and Overview.” Risk Management and Insurance Review, John Wiley & Sons, Ltd (10.1111), 2 Aug. 2010.
Glover, James W. United States Life Tables, 1890, 1901, 1910, and 1901-1910: Explanatory
Text, Mathematical Theory, Computations, Graphs, and Original Statistics: Also Tables of United States Life Annuities, Life Tables of Foreign Countries, Mortality Tables of Life Insurance Companies. G.P.O., 1921.
Grace, Martin F., and Stephen G. Timme. “An Examination of Cost Economies in the United
States Life Insurance Industry.” The Journal of Risk and Insurance, vol. 59, no. 1, 1992, pp. 72–103.
“Health and Retirement Study Data File.” RAND Corporation.
Jeffrey R. Brown and Austan Goolsbee, "Does the Internet Make Markets More Competitive?
Evidence from the Life Insurance Industry," Journal of Political Economy 110, no. 3 (June 2002): 481-507.
Kuusela, Hannu. “How Consumers Select Life Insurance Policies.” Journal of Professional
Services Marketing, vol. 18, no. 1, 1999, pp. 49–63.
Outreville, J.François. “Whole-Life Insurance Lapse Rates and the Emergency Fund
Hypothesis.” Insurance: Mathematics and Economics, North-Holland, 1 Mar. 2002.
Riesenfeld, Stefan. “Life Insurance and Creditors' Remedies in the United States.” HeinOnline,
1957.
Life Insurance Purchase Behavior Analysis for Retired People Honors Thesis for Connor Frauendorf
33
“Risk Taking Behaviour and Managerial Ownership in the United States Life Insurance
Industry.” Applied Financial Economics. Taylor & Francis.
Stalson, J Owen. “Marketing Life Insurance: Its History in America.” Business Historical
Society. Bulletin of the Business Historical Society (Pre-1986); Boston Vol. 16, Iss. 000001, (Feb 1942): 1.
Van Itallie TB. Health Implications of Overweight and Obesity in the United States. Ann Intern
Med. 1985; 103:983–988.
Zelizer, Viviana. “Human Values and the Market: The Case of Life Insurance and Death in 19th-
Century America.” American Journal of Sociology, 1978.
Zelizer, Viviana A. Rotman, and Kieran Healy. Morals and Markets: the Development of Life
Insurance in the United States. Columbia University Press, 2017.