life-cycle cost analysis user · pdf filepurpose of the user manual 5 about lcca 5 ... data...
TRANSCRIPT

ContentsList of Tables 4List of Figures 4Introduction 5
Purpose of the User Manual 5About LCCA 5About RealCost 7Suggested Reading 9
Installation 12System Requirements 12Installing RealCost 12
Startup, Navigation, and Exiting 13Before First Use 13Starting RealCost 14Moving Between the Switchboard and Worksheets 15Administrative Functions on the Switchboard 17Closing RealCost 18
RealCost Switchboard Functions 18
Entering, Saving, and Loading Data 22Project-Level Versus Alternative-Level Data 22Project-Level Data Input Forms 24Saving and Loading Project-Level Data 32Alternative-Level Data Input Forms 33Saving and Loading Alternative-Level Data 35Probabilistic Inputs 36
Simulation and Output 39Deterministic Results 39Probabilistic Analysis 40
Glossary 45References 47
Using RealCost in Life-Cycle Cost Analysis
The Basics
4
List of Tables1. RealCost forms and command buttons and their functions. 202. Life-cycle cost analysis steps and RealCost forms. 223. Analysis Options form inputs. 264. Traffic Data form inputs. 285. Traffic Hourly Distribution form inputs. 316. Alternative 1 and Alternative 2 form inputs. 347. Examples of input probabilistic distributions available. 378. Most favorable 10 percent of expected agency cost outcomes 44
List of Figures1. Example data entry form, Value of User Time. 82. Example worksheet extract, Value of User Time. 93. Excel 2000 macro security form. 134. RealCost on the Windows Start menu. 145. Excel 2000 macro options form. 156. RealCost Switchboard. 157. Opening the Switchboard from the RealCost menu. 168. Administrative Functions in RealCost. 179. The five sections of the RealCost Switchboard. 19
10. Hierarchy of project-level and alternative-level data. 2311. Project Details form. 2412. Analysis Options form. 2513. Traffic Data form. 2714. Value of User Time form. 2915. Traffic Hourly Distribution form. 3016. Added Time and Vehicle Stopping Costs form. 3117. Switchboard buttons to save and open project-level inputs. 3218. Alternative 1 form (identical to Alternative 2 form). 3319. Ellipsis button, which accesses probabilistic inputs. 3620. Creating a probabilistic input. 3821. Deterministic Results form. 3922. Simulation form. 4023. Simulation form at the conclusion of a simulation run. 4124. Probabilistic Results form. 4225. Probabilistic distribution density and cumulative density functions. 4326. Correlation coefficient graph. 4327. Tail analysis outputs. 44
5
IntroductionPurpose of the User ManualThis manual provides basic instruction for using RealCost, software that wasdeveloped by the Federal Highway Administration (FHWA) to support theapplication of life-cycle cost analysis (LCCA) in the pavement project-leveldecisionmaking process. The manual provides direction on how to enter thedata required to perform LCCA and how to incorporate the software’s outputsinto project-level decisionmaking. The User Manual is addressed to pavementdesigners and design decisionmakers who wish to use LCCA and RealCost tocompare the cost-effectiveness of alternative project proposals. Following thisintroduction, the manual contains instructions on installing RealCost, descrip-tions of its features, and directions on using the software in performing pave-ment decisionmaking analyses.
About LCCALCCA is an engineering economic analysis tool useful in comparing therelative economic merits of competing construction or rehabilitation designalternatives for a single project. By considering all of the relevant costs—agency and user—incurred during the projected service life of an asset, thisanalytical process helps transportation officials to identify the lowest costoption. Additionally, LCCA introduces a structured methodology that quanti-fies the effects of agency activities on transportation users and provides ameans to balance those effects with the construction, rehabilitation, andpreservation needs of the system itself.
LCCA can be used in making certain transportation investment decisions.Specifically, when a project has been selected for implementation, LCCA willassist in determining the lowest cost way to accomplish the performanceobjectives of the project. LCCA cannot, however, be used to compare theeconomic merits of projects that provide different levels of benefit for highwayusers, such as comparing a road-widening project with a rehabilitation of existingroadway lanes. A cost-centric analysis, LCCA accounts only for cost differencesbetween project alternatives and is applicable only to decisions where benefits areequal for all alternatives being considered.
In brief, the LCCA process begins with the development of alternatives toaccomplish the structural and performance objectives for a project. Theanalyst then defines the schedule of initial and future activities involved inimplementing each of the project design alternatives. Next, costs of theseactivities are estimated. Best practice LCCA calls for including not only directagency expenditures (for example, construction or maintenance activities), butalso costs to the project’s users that result from agency work zone operations.
6
The predicted schedule of activities and their associated agency and user costsform the projected life-cycle cost stream for each design alternative. Using an
economic technique known as discounting, thesecosts are converted into present dollars and thensummed for each alternative. The analyst can thendetermine which alternative is the most cost-effective.
Two different computational approaches can beused in LCCA, deterministic and probabilistic. Themethods differ in the way they address the variabil-ity associated with the LCCA input values.
In the deterministic approach, the analyst assigns each LCCA input variable afixed, discrete value. The analyst determines the value most likely to occur foreach parameter, usually basing the determination on historical evidence orprofessional judgment. Collectively, the input values are used to compute asingle life-cycle cost estimate for the alternative under consideration.
Traditionally, applications of LCCA have been deterministic. A deterministiclife-cycle cost computation is straightforward and can be conducted manuallywith a calculator or automatically with a spreadsheet. Sensitivity analysesmay be conducted to test input assumptions by varying one input, holdingother inputs constant, and determining the effect of the variation on the out-puts. The deterministic approach, however, fails to address simultaneousvariation in multiple inputs, and it also fails to convey the degree of uncer-tainty associated with the life-cycle cost estimates.
Probabilistic LCCA inputs are described by probability functions that conveyboth the range of likely inputs and the likelihood of their occurrence. Probabi-listic LCCA also allows for the simultaneous computation of differing as-sumptions for many different variables. Outputs, like inputs, express thelikelihood that a particular life-cycle cost will actually occur. Because of thedramatic increases in computer processing capabilities of the last two decades,the process of probabilistic analysis has become more practical. Simulatingand accounting for simultaneous changes in LCCA input parameters can nowbe accomplished easily and quickly.
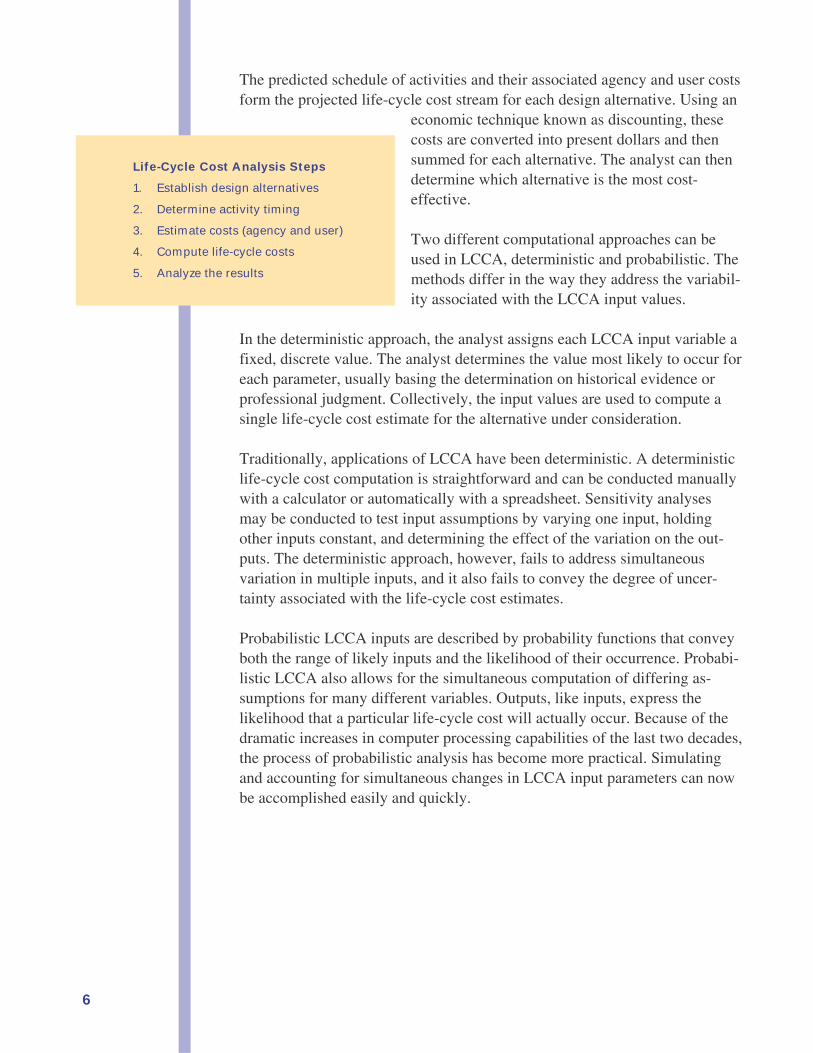
Life-Cycle Cost Analysis Steps
1. Establish design alternatives
2. Determine activity timing
3. Estimate costs (agency and user)
4. Compute life-cycle costs
5. Analyze the results
7
About RealCostRealCost was created with two distinct purposes. The first is to provide aninstructional tool for pavement design decisionmakers who want to learnabout LCCA. The software allows the student of LCCA to investigate theeffects of cost, service life, and economic inputs on life-cycle cost. For thispurpose, a graphical user interface (GUI) was designed to make the softwareeasy to use. The second purpose is to provide an actual tool for pavementdesigners, which they can use to incorporate life-cycle costs into their pave-ment investment decisions.
RealCost automates FHWA’s LCCA methodology as it applies to pavements.The software calculates life-cycle values for both agency and user costsassociated with construction and rehabilitation. The software can performboth deterministic and probabilistic modeling of pavement LCCA problems.Outputs are provided in tabular and graphic format. Additionally, RealCostsupports deterministic sensitivity analyses and probabilistic risk analyses.
While RealCost compares two alternatives at a time, it has been designed togive the pavement engineer the ability to compare an unlimited number ofalternatives. By saving the input files of all alternatives being considered, theanalyst can compare any number of alternatives. Furthermore, the softwarehas been designed so that a basic understanding of the LCCA process issufficient to operate the software.
The software automates FHWA’s work zone user cost calculation method.This method for calculating user costs compares traffic demand to roadwaycapacity on an hour-by-hour basis, revealing the resulting traffic conditions.The method is computation intensive and ideally suited to a spreadsheetapplication.
The software does not calculate agency costs or service lives for individualconstruction or rehabilitation activities. These values must be input by theanalyst and should reflect the construction and rehabilitation practices of theagency.
While RealCost compares the agency and user life-cycle costs of alternatives,its analysis outputs alone do not identify which alternative is the best choicefor implementing a project. The lowest life-cycle cost option may not beimplemented when other considerations such as risk, available budgets, andpolitical and environmental concerns are taken into account. As with anyeconomic tool, LCCA provides critical information to the overall decision-making process, but not the answer itself.
8
How RealCost Works
RealCost consists of a Microsoft Excel 2000 worksheet with additional VisualBasic for Applications (VBA) code. The VBA code provides the ability toperform Monte Carlo simulation in the analysis, and it is used to construct theGUI. The software has two interface mechanisms, the form and the worksheet.
Form Interface
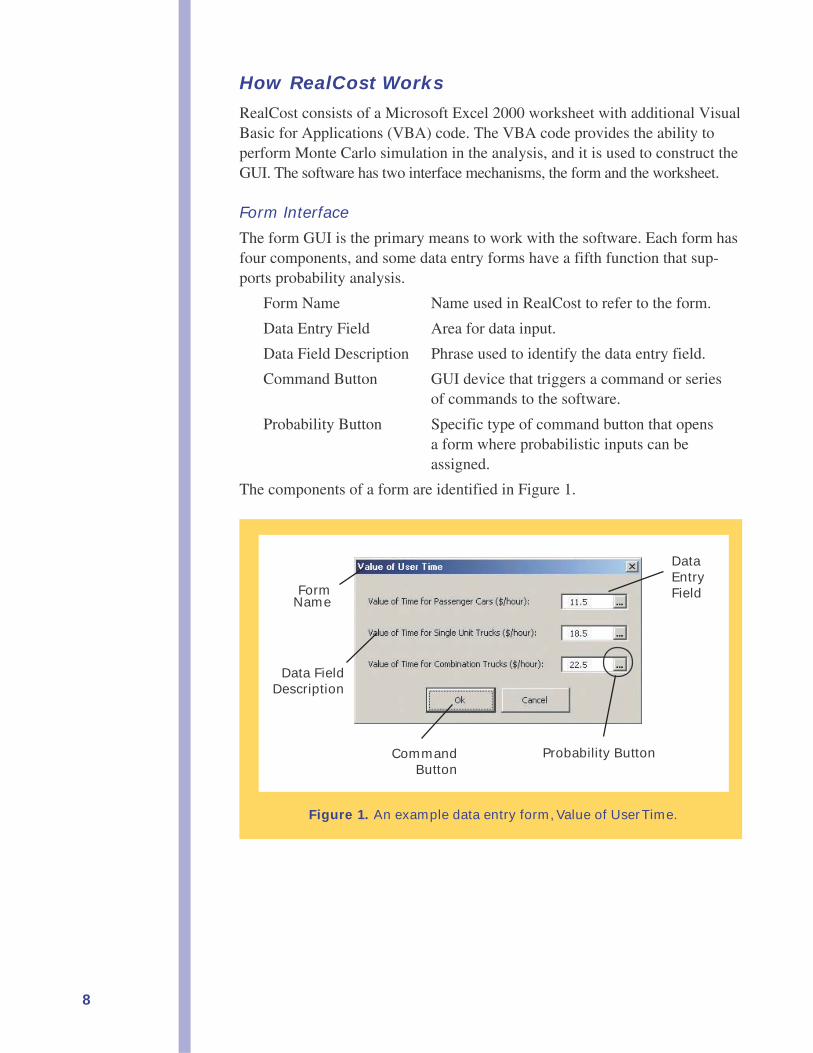
The form GUI is the primary means to work with the software. Each form hasfour components, and some data entry forms have a fifth function that sup-ports probability analysis.
Form Name Name used in RealCost to refer to the form.
Data Entry Field Area for data input.
Data Field Description Phrase used to identify the data entry field.
Command Button GUI device that triggers a command or seriesof commands to the software.
Probability Button Specific type of command button that opensa form where probabilistic inputs can beassigned.
The components of a form are identified in Figure 1.
Figure 1. An example data entry form, Value of User Time.
FormName
Data FieldDescription
CommandButton
Probability Button
DataEntryField
9
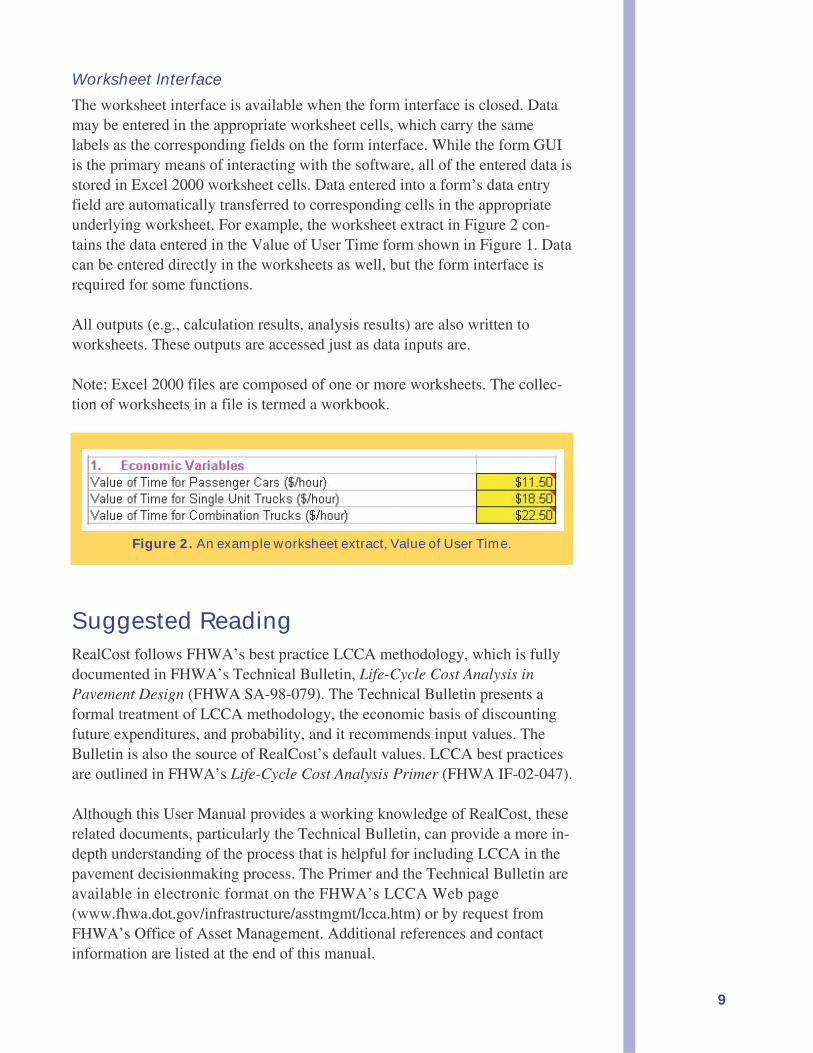
Worksheet Interface
The worksheet interface is available when the form interface is closed. Datamay be entered in the appropriate worksheet cells, which carry the samelabels as the corresponding fields on the form interface. While the form GUIis the primary means of interacting with the software, all of the entered data isstored in Excel 2000 worksheet cells. Data entered into a form’s data entryfield are automatically transferred to corresponding cells in the appropriateunderlying worksheet. For example, the worksheet extract in Figure 2 con-tains the data entered in the Value of User Time form shown in Figure 1. Datacan be entered directly in the worksheets as well, but the form interface isrequired for some functions.
All outputs (e.g., calculation results, analysis results) are also written toworksheets. These outputs are accessed just as data inputs are.
Note: Excel 2000 files are composed of one or more worksheets. The collec-tion of worksheets in a file is termed a workbook.
Suggested ReadingRealCost follows FHWA’s best practice LCCA methodology, which is fullydocumented in FHWA’s Technical Bulletin, Life-Cycle Cost Analysis inPavement Design (FHWA SA-98-079). The Technical Bulletin presents aformal treatment of LCCA methodology, the economic basis of discountingfuture expenditures, and probability, and it recommends input values. TheBulletin is also the source of RealCost’s default values. LCCA best practicesare outlined in FHWA’s Life-Cycle Cost Analysis Primer (FHWA IF-02-047).
Although this User Manual provides a working knowledge of RealCost, theserelated documents, particularly the Technical Bulletin, can provide a more in-depth understanding of the process that is helpful for including LCCA in thepavement decisionmaking process. The Primer and the Technical Bulletin areavailable in electronic format on the FHWA’s LCCA Web page(www.fhwa.dot.gov/infrastructure/asstmgmt/lcca.htm) or by request fromFHWA’s Office of Asset Management. Additional references and contactinformation are listed at the end of this manual.
Figure 2. An example worksheet extract, Value of User Time.
The Basics
InstallationStartup, Navigation, and ExitingRealCost Switchboard Functions
12
InstallationSystem RequirementsRealCost is designed to run in Microsoft Excel 2000 and is not supported byversions earlier than Excel 2000. In addition, up-to-date service packs forWindows and Office 2000 (or Excel 2000) are essential to run the software.
Following are the recommended minimum system requirements for usingRealCost:
n Excel 2000 with current service pack loaded
n Windows 98 (or higher) with current service pack loaded
n Printer (RealCost requires a printer driver in order to function properly)
n 350 MHz Pentium processor
n 128 MB RAM
n 100 MB HD available
Installing RealCostTo install RealCost, run the file, “Setup.exe.” It is recommended that you allowthe installation program to install the software to its preselected location.
Setup.exe contains an Excel 2000 workbook file named “RealCost.xls” andseveral dynamic link library (DLL) files. A DLL is a collection of smallprograms that can be called upon when needed by the LCCA worksheet. TheDLL provides instructions to the LCCA worksheet to carry out particularfunctions.
Current Microsoft service packs are required to run RealCost
successfully. Check your computer online at
http://v4.windowsupdate.microsoft.com/en/default.asp
or by running Windows Update on the Start Menu.
TIP
13
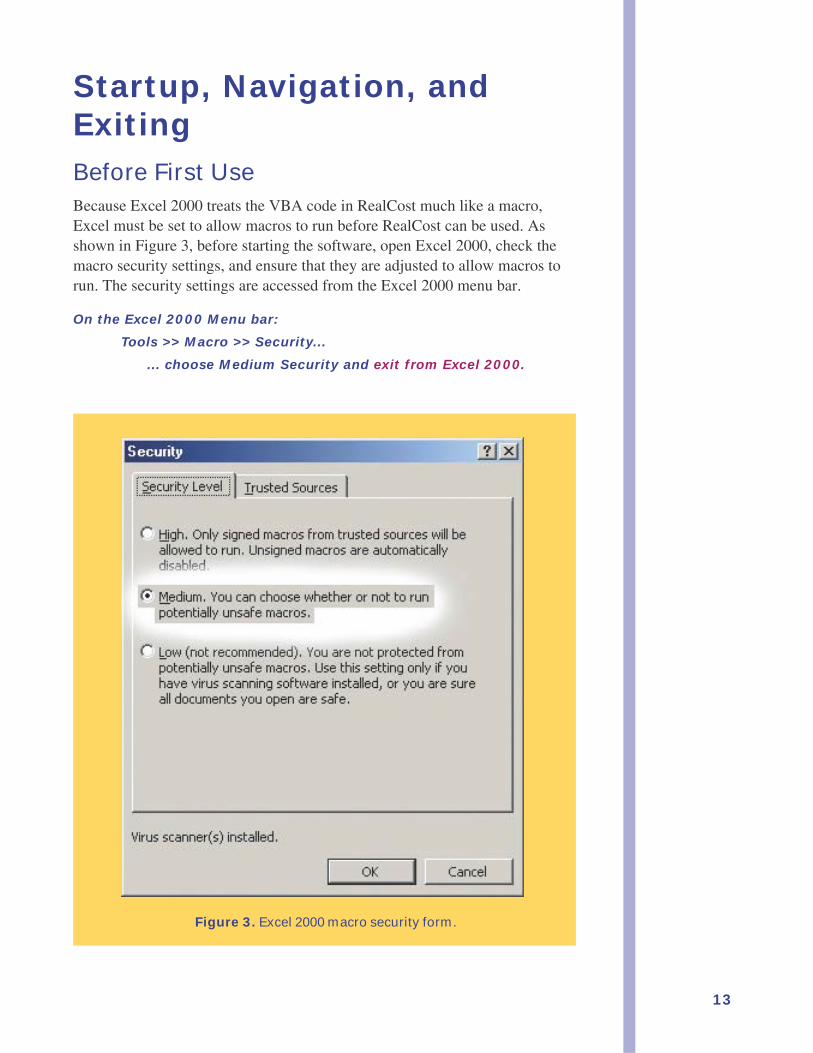
Figure 3. Excel 2000 macro security form.
Startup, Navigation, andExitingBefore First UseBecause Excel 2000 treats the VBA code in RealCost much like a macro,Excel must be set to allow macros to run before RealCost can be used. Asshown in Figure 3, before starting the software, open Excel 2000, check themacro security settings, and ensure that they are adjusted to allow macros torun. The security settings are accessed from the Excel 2000 menu bar.
On the Excel 2000 Menu bar:
Tools >> Macro >> Security...
... choose Medium Security and exit from Excel 2000.
14
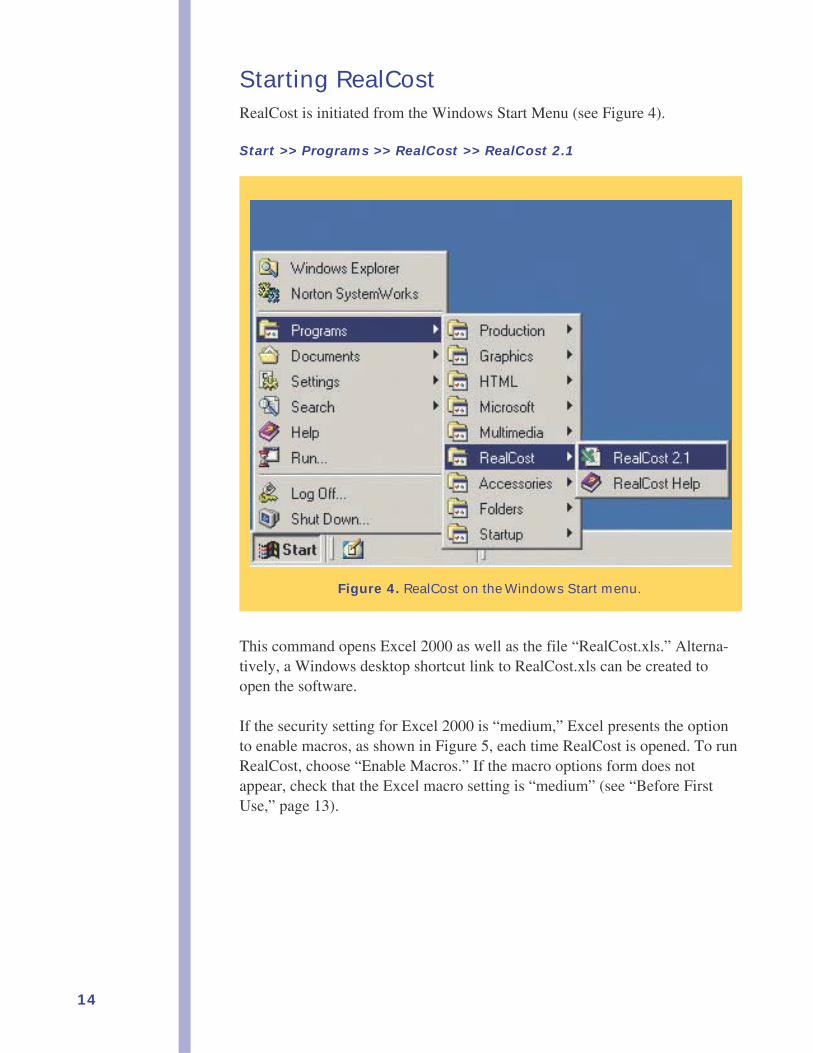
Starting RealCostRealCost is initiated from the Windows Start Menu (see Figure 4).
Start >> Programs >> RealCost >> RealCost 2.1
This command opens Excel 2000 as well as the file “RealCost.xls.” Alterna-tively, a Windows desktop shortcut link to RealCost.xls can be created toopen the software.
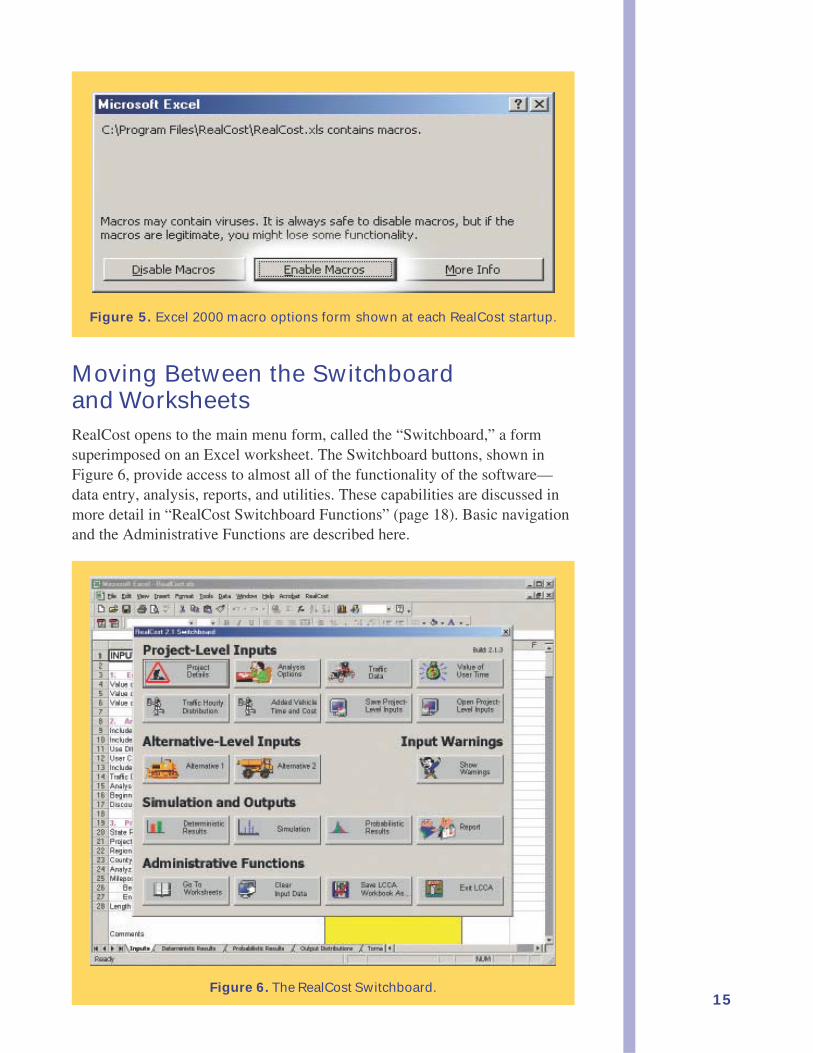
If the security setting for Excel 2000 is “medium,” Excel presents the optionto enable macros, as shown in Figure 5, each time RealCost is opened. To runRealCost, choose “Enable Macros.” If the macro options form does notappear, check that the Excel macro setting is “medium” (see “Before FirstUse,” page 13).
Figure 4. RealCost on the Windows Start menu.
15
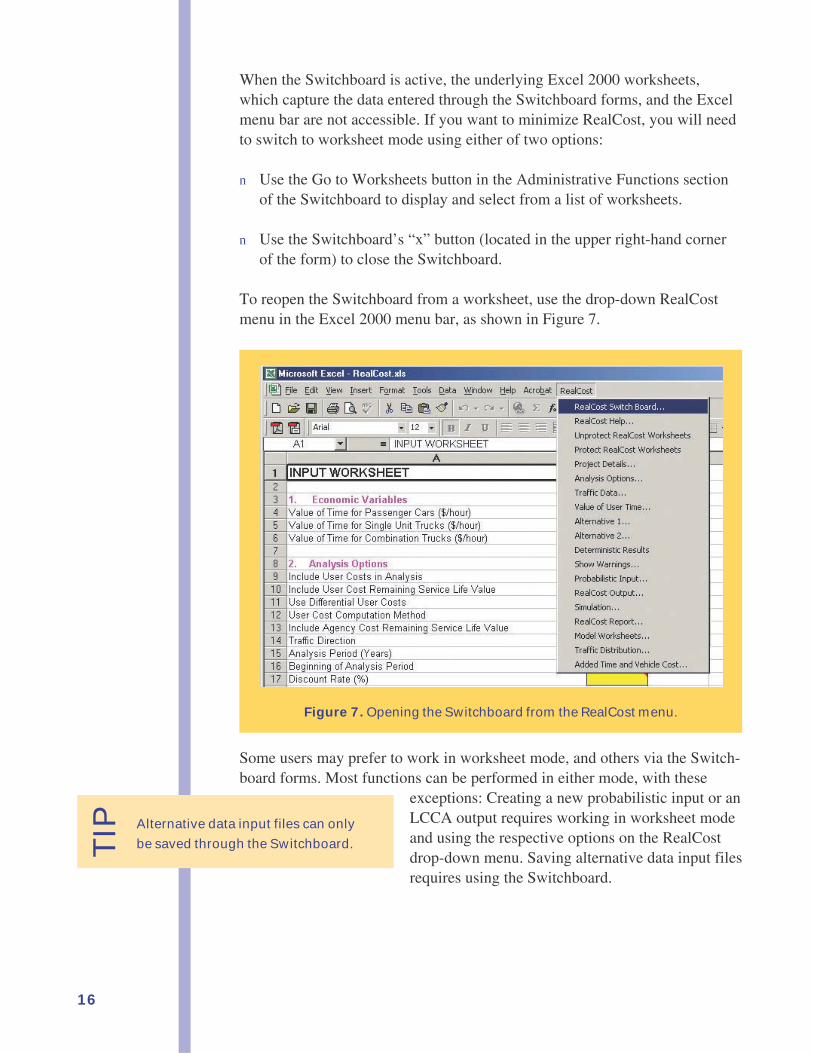
Moving Between the Switchboardand WorksheetsRealCost opens to the main menu form, called the “Switchboard,” a formsuperimposed on an Excel worksheet. The Switchboard buttons, shown inFigure 6, provide access to almost all of the functionality of the software—data entry, analysis, reports, and utilities. These capabilities are discussed inmore detail in “RealCost Switchboard Functions” (page 18). Basic navigationand the Administrative Functions are described here.
Figure 6. The RealCost Switchboard.
Figure 5. Excel 2000 macro options form shown at each RealCost startup.
16
When the Switchboard is active, the underlying Excel 2000 worksheets,which capture the data entered through the Switchboard forms, and the Excelmenu bar are not accessible. If you want to minimize RealCost, you will needto switch to worksheet mode using either of two options:
n Use the Go to Worksheets button in the Administrative Functions sectionof the Switchboard to display and select from a list of worksheets.
n Use the Switchboard’s “x” button (located in the upper right-hand cornerof the form) to close the Switchboard.
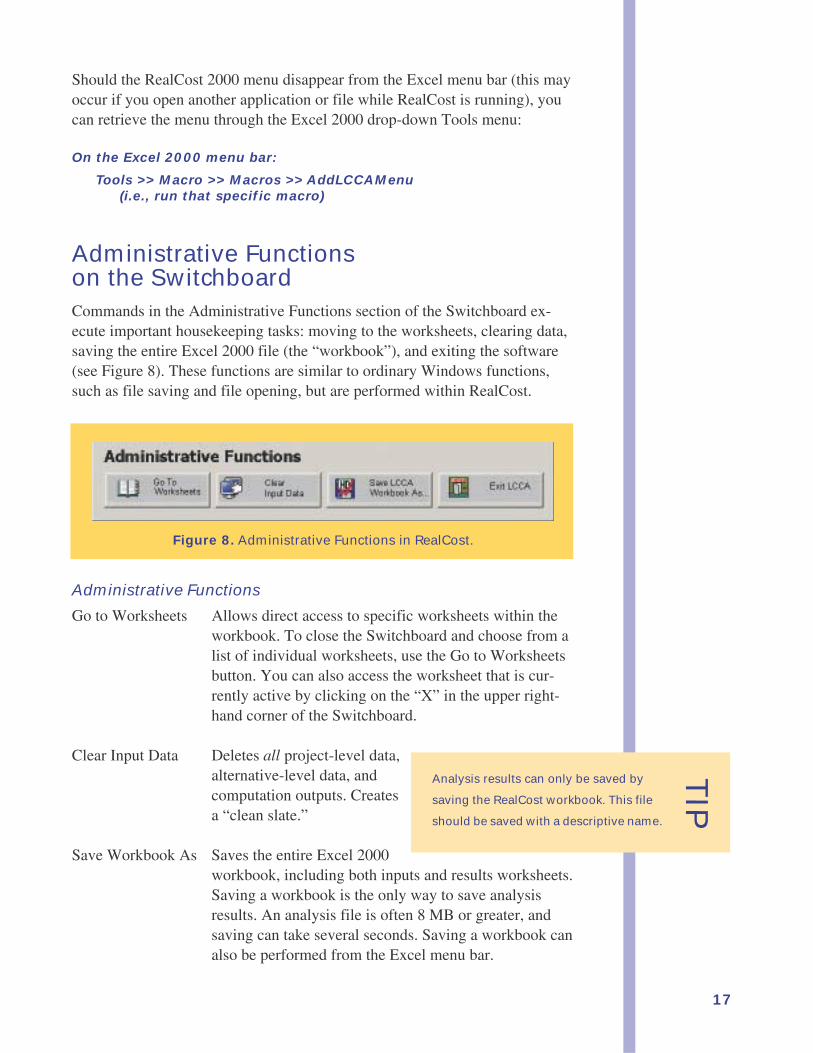
To reopen the Switchboard from a worksheet, use the drop-down RealCostmenu in the Excel 2000 menu bar, as shown in Figure 7.
Some users may prefer to work in worksheet mode, and others via the Switch-board forms. Most functions can be performed in either mode, with these
exceptions: Creating a new probabilistic input or anLCCA output requires working in worksheet modeand using the respective options on the RealCostdrop-down menu. Saving alternative data input filesrequires using the Switchboard.
Alternative data input files can only
be saved through the Switchboard.TIP
Figure 7. Opening the Switchboard from the RealCost menu.
17
Should the RealCost 2000 menu disappear from the Excel menu bar (this mayoccur if you open another application or file while RealCost is running), youcan retrieve the menu through the Excel 2000 drop-down Tools menu:
On the Excel 2000 menu bar:
Tools >> Macro >> Macros >> AddLCCAMenu(i.e., run that specific macro)
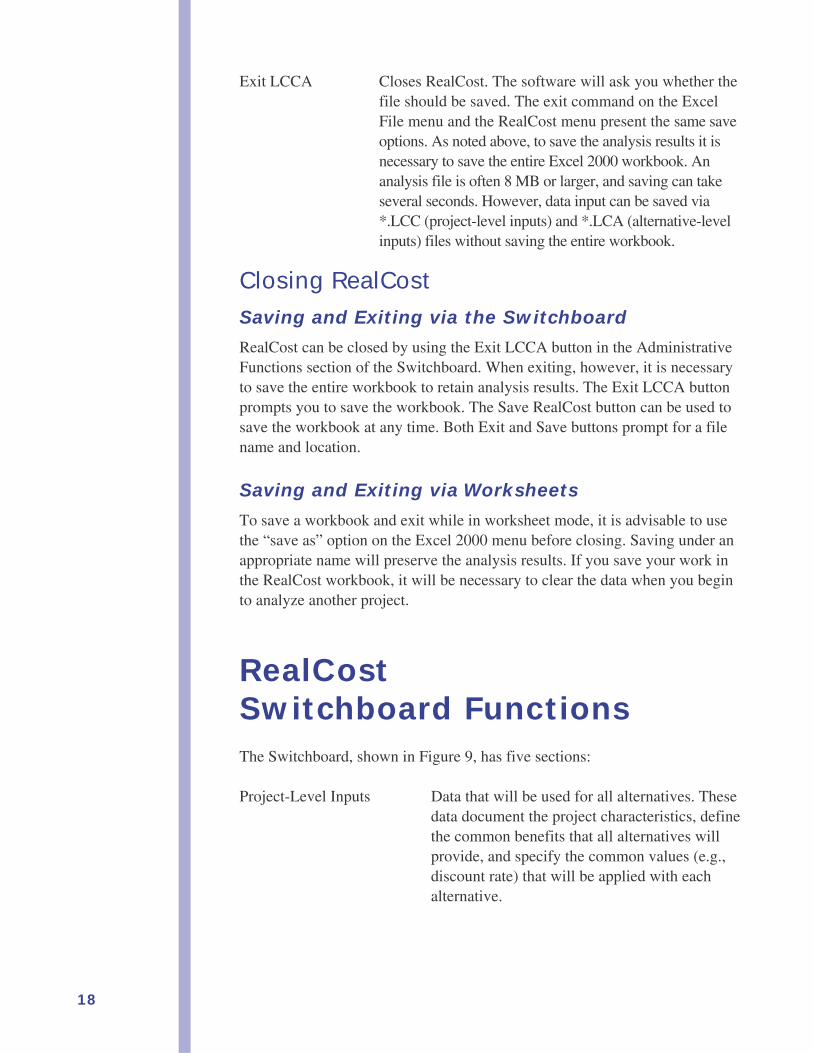
Administrative Functionson the SwitchboardCommands in the Administrative Functions section of the Switchboard ex-ecute important housekeeping tasks: moving to the worksheets, clearing data,saving the entire Excel 2000 file (the “workbook”), and exiting the software(see Figure 8). These functions are similar to ordinary Windows functions,such as file saving and file opening, but are performed within RealCost.
Administrative Functions
Go to Worksheets Allows direct access to specific worksheets within theworkbook. To close the Switchboard and choose from alist of individual worksheets, use the Go to Worksheetsbutton. You can also access the worksheet that is cur-rently active by clicking on the “X” in the upper right-hand corner of the Switchboard.
Clear Input Data Deletes all project-level data,alternative-level data, andcomputation outputs. Createsa “clean slate.”
Save Workbook As Saves the entire Excel 2000workbook, including both inputs and results worksheets.Saving a workbook is the only way to save analysisresults. An analysis file is often 8 MB or greater, andsaving can take several seconds. Saving a workbook canalso be performed from the Excel menu bar.
Analysis results can only be saved by
saving the RealCost workbook. This file
should be saved with a descriptive name.
TIP
Figure 8. Administrative Functions in RealCost.
18
Exit LCCA Closes RealCost. The software will ask you whether thefile should be saved. The exit command on the ExcelFile menu and the RealCost menu present the same saveoptions. As noted above, to save the analysis results it isnecessary to save the entire Excel 2000 workbook. Ananalysis file is often 8 MB or larger, and saving can takeseveral seconds. However, data input can be saved via*.LCC (project-level inputs) and *.LCA (alternative-levelinputs) files without saving the entire workbook.
Closing RealCostSaving and Exiting via the SwitchboardRealCost can be closed by using the Exit LCCA button in the AdministrativeFunctions section of the Switchboard. When exiting, however, it is necessaryto save the entire workbook to retain analysis results. The Exit LCCA buttonprompts you to save the workbook. The Save RealCost button can be used tosave the workbook at any time. Both Exit and Save buttons prompt for a filename and location.
Saving and Exiting via Worksheets
To save a workbook and exit while in worksheet mode, it is advisable to usethe “save as” option on the Excel 2000 menu before closing. Saving under anappropriate name will preserve the analysis results. If you save your work inthe RealCost workbook, it will be necessary to clear the data when you beginto analyze another project.
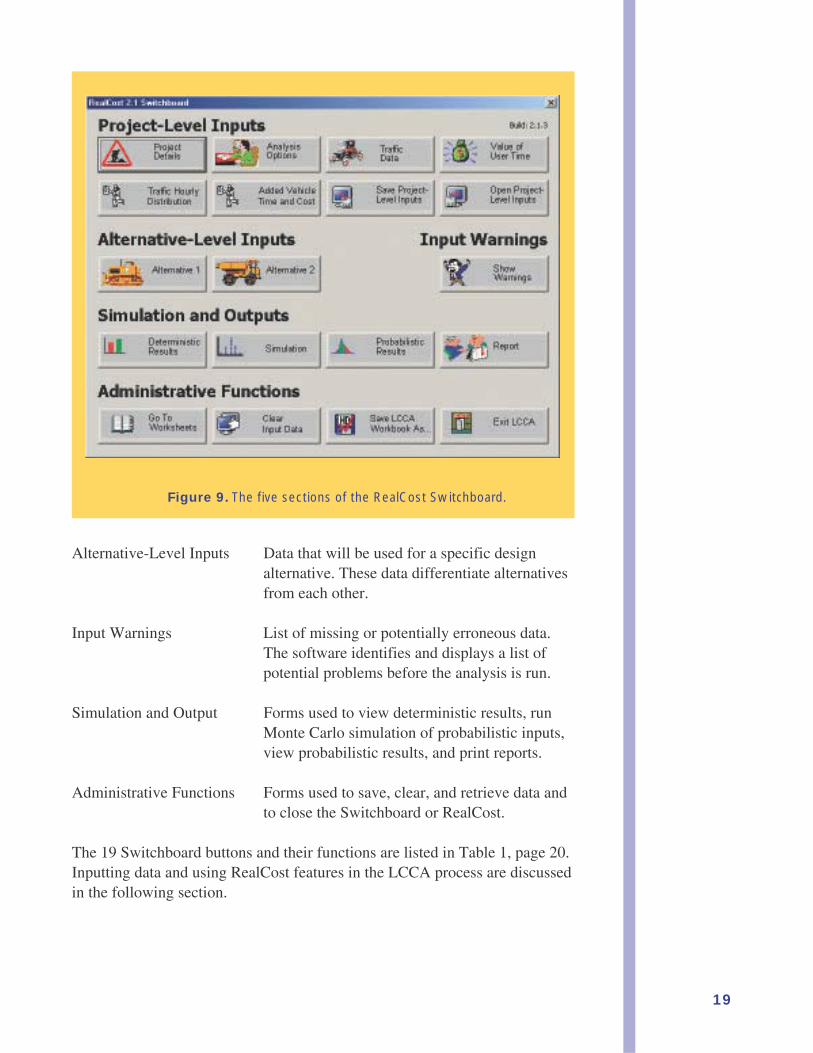
RealCostSwitchboard FunctionsThe Switchboard, shown in Figure 9, has five sections:
Project-Level Inputs Data that will be used for all alternatives. Thesedata document the project characteristics, definethe common benefits that all alternatives willprovide, and specify the common values (e.g.,discount rate) that will be applied with eachalternative.
19
Figure 9. The five sections of the RealCost Switchboard.
Alternative-Level Inputs Data that will be used for a specific designalternative. These data differentiate alternativesfrom each other.
Input Warnings List of missing or potentially erroneous data.The software identifies and displays a list ofpotential problems before the analysis is run.
Simulation and Output Forms used to view deterministic results, runMonte Carlo simulation of probabilistic inputs,view probabilistic results, and print reports.
Administrative Functions Forms used to save, clear, and retrieve data andto close the Switchboard or RealCost.
The 19 Switchboard buttons and their functions are listed in Table 1, page 20.Inputting data and using RealCost features in the LCCA process are discussedin the following section.
20
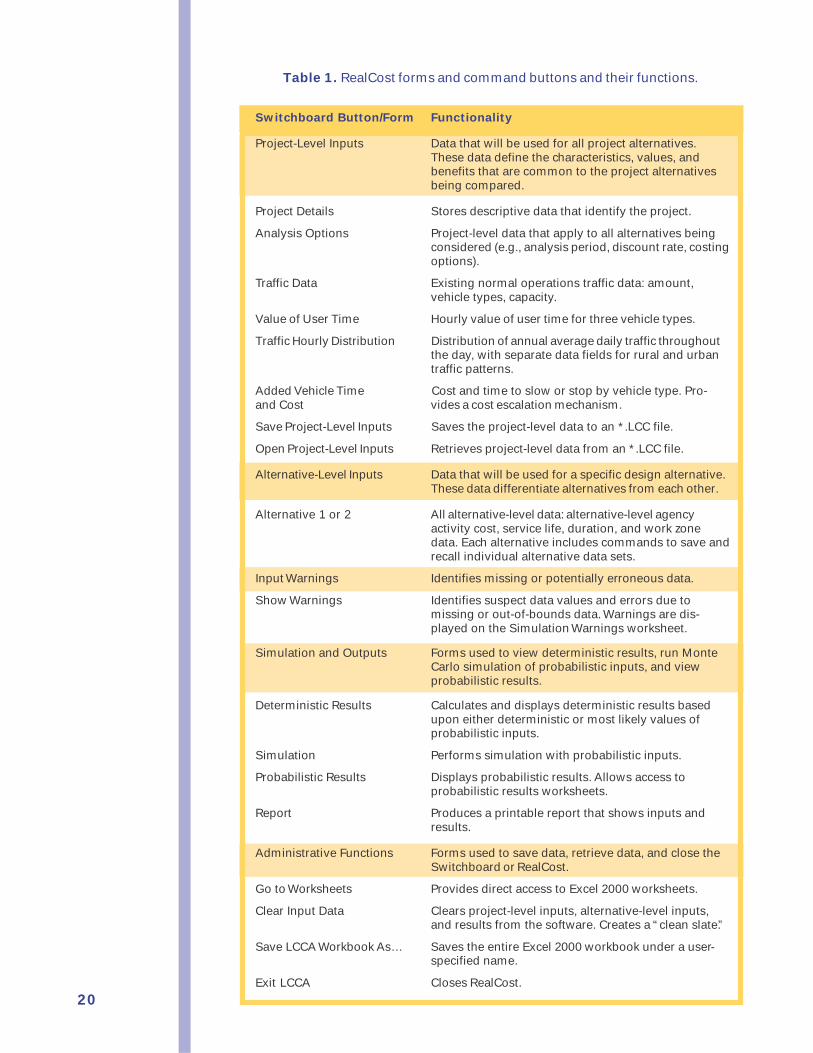
Switchboard Button/Form Functionality
Project-Level Inputs Data that will be used for all project alternatives.These data define the characteristics, values, andbenefits that are common to the project alternativesbeing compared.
Project Details Stores descriptive data that identify the project.
Analysis Options Project-level data that apply to all alternatives beingconsidered (e.g., analysis period, discount rate, costingoptions).
Traffic Data Existing normal operations traffic data: amount,vehicle types, capacity.
Value of User Time Hourly value of user time for three vehicle types.
Traffic Hourly Distribution Distribution of annual average daily traffic throughoutthe day, with separate data fields for rural and urbantraffic patterns.
Added Vehicle Time Cost and time to slow or stop by vehicle type. Pro-and Cost vides a cost escalation mechanism.
Save Project-Level Inputs Saves the project-level data to an *.LCC file.
Open Project-Level Inputs Retrieves project-level data from an *.LCC file.
Alternative-Level Inputs Data that will be used for a specific design alternative.These data differentiate alternatives from each other.
Alternative 1 or 2 All alternative-level data: alternative-level agencyactivity cost, service life, duration, and work zonedata. Each alternative includes commands to save andrecall individual alternative data sets.
Input Warnings Identifies missing or potentially erroneous data.
Show Warnings Identifies suspect data values and errors due tomissing or out-of-bounds data. Warnings are dis-played on the Simulation Warnings worksheet.
Simulation and Outputs Forms used to view deterministic results, run MonteCarlo simulation of probabilistic inputs, and viewprobabilistic results.
Deterministic Results Calculates and displays deterministic results basedupon either deterministic or most likely values ofprobabilistic inputs.
Simulation Performs simulation with probabilistic inputs.
Probabilistic Results Displays probabilistic results. Allows access toprobabilistic results worksheets.
Report Produces a printable report that shows inputs andresults.
Administrative Functions Forms used to save data, retrieve data, and close theSwitchboard or RealCost.
Go to Worksheets Provides direct access to Excel 2000 worksheets.
Clear Input Data Clears project-level inputs, alternative-level inputs,and results from the software. Creates a “clean slate.”
Save LCCA Workbook As… Saves the entire Excel 2000 workbook under a user-specified name.
Exit LCCA Closes RealCost.
Table 1. RealCost forms and command buttons and their functions.
21
Using RealCost inLife-Cycle Cost Analysis
Entering, Saving, and Loading DataSimulation and Output
22
Project-Level Versus Alternative-Level DataThe LCCA process requires two levels of information: 1) data pertaining tothe proposed pavement project and 2) data defining the pavement designalternatives that are being compared for accomplishing the project.
Project-level data apply to all alternatives being considered for theproject at hand. FHWA’s best practice LCCA methodology re-quires that the analysis period, discount rate, normal operationstraffic data, and normal operations roadway geometry be the samefor all alternatives.
Entering, Saving, andLoading DataRealCost data needs are identical to the data needs of the FHWA’s bestpractice LCCA process. When the data have been entered, the softwareperforms the required calculations to produce life-cycle costs. Furthermore,the software permits the analyst to quickly consider natural modifications tothe data that result from analysis of earlier LCCA iterations. The LCCA stepsand their corresponding data entry and output forms are listed in Table 2.
Table 2. Life-cycle cost analysis (LCCA) steps and
corresponding RealCost forms.
FHWA LCCA Steps RealCost Data Entry and Output Forms
1. Establish Design Alternatives Project Details
Analysis Options
Traffic Data
Traffic Hourly Distribution
Value of User Time
Added Vehicle Time and Cost
2. Determine Activity Timing Alternative 1 and Alternative 2
3. Estimate Agency and User Costs Alternative 1 and Alternative 2
4. Compute Life-Cycle Costs Deterministic Results
Simulation
5. Analyze the Results Deterministic Results
Probabilistic Results
23
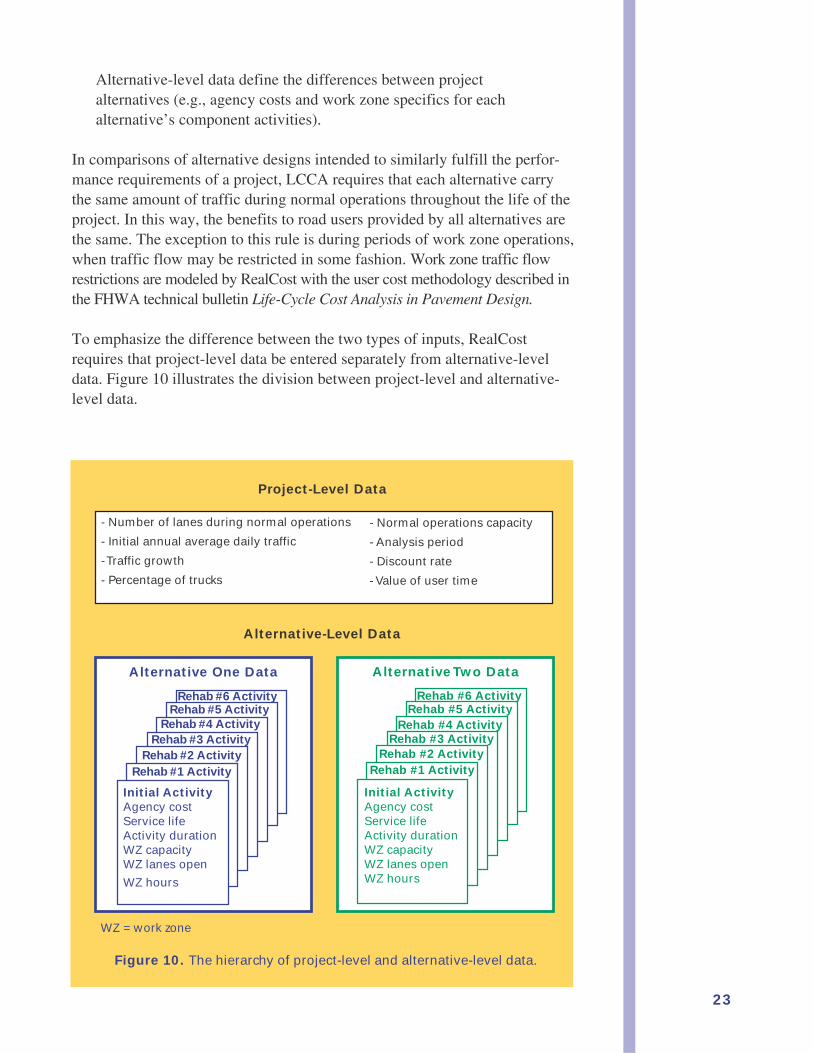
Alternative-level data define the differences between projectalternatives (e.g., agency costs and work zone specifics for eachalternative’s component activities).
In comparisons of alternative designs intended to similarly fulfill the perfor-mance requirements of a project, LCCA requires that each alternative carrythe same amount of traffic during normal operations throughout the life of theproject. In this way, the benefits to road users provided by all alternatives arethe same. The exception to this rule is during periods of work zone operations,when traffic flow may be restricted in some fashion. Work zone traffic flowrestrictions are modeled by RealCost with the user cost methodology described inthe FHWA technical bulletin Life-Cycle Cost Analysis in Pavement Design.
To emphasize the difference between the two types of inputs, RealCostrequires that project-level data be entered separately from alternative-leveldata. Figure 10 illustrates the division between project-level and alternative-level data.
WZ = work zone
Figure 10. The hierarchy of project-level and alternative-level data.
Project-Level Data
Alternative-Level Data
Alternative Two Data
Rehab #6 Activity
Rehab #4 ActivityRehab #3 Activity
Rehab #2 ActivityRehab #1 Activity
Rehab #5 Activity
Initial ActivityAgency costService lifeActivity durationWZ capacityWZ lanes open
WZ hours
Alternative One Data
Rehab #6 Activity
Rehab #3 Activity
Rehab #5 Activity
Initial ActivityAgency costService lifeActivity durationWZ capacityWZ lanes openWZ hours
Rehab #2 Activity
Rehab #4 Activity
Rehab #1 Activity
- Number of lanes during normal operations
- Initial annual average daily traffic
- Traffic growth
- Percentage of trucks
- Normal operations capacity
- Analysis period
- Discount rate
- Value of user time
24
Project-Level Data Input FormsThe options selected and data entered in the project-level data input formsapply to all alternatives being considered to fulfill the performance require-ments of the single project. If the project-level data or options are changed, allalternatives must be reconsidered with the new data and options in order to beproperly compared. Alternatives analyzed using different project-level optionscannot be directly compared in LCCA.
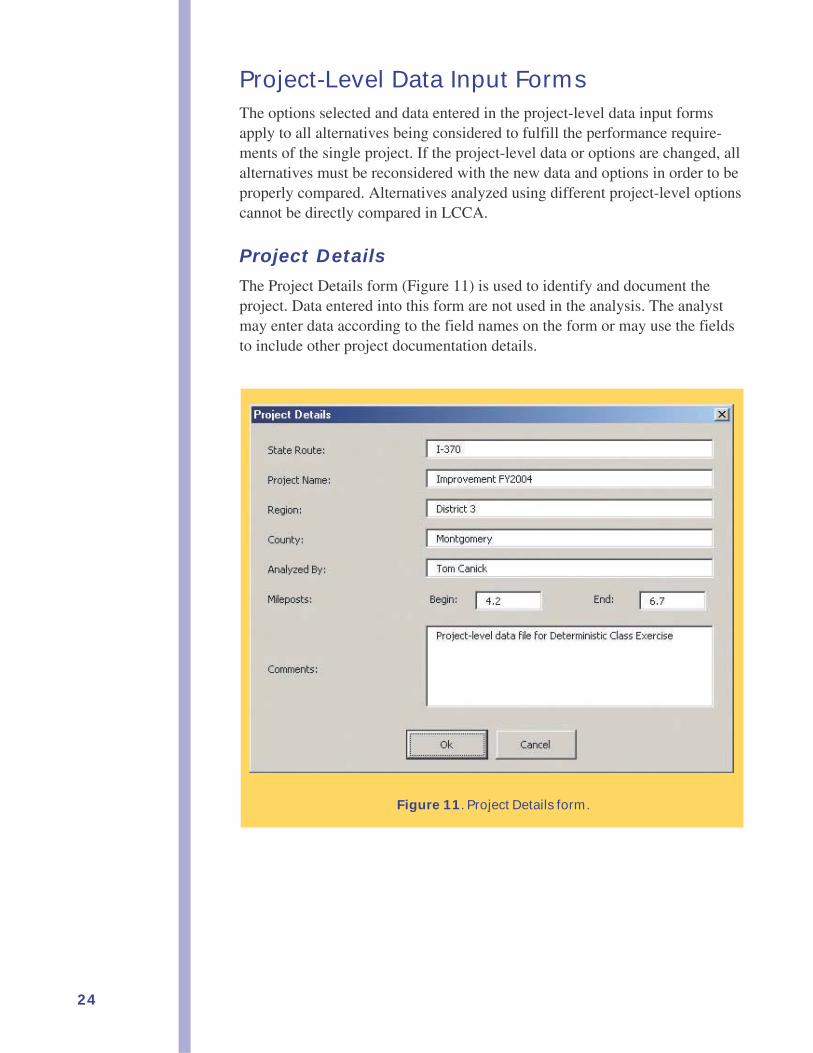
Project DetailsThe Project Details form (Figure 11) is used to identify and document theproject. Data entered into this form are not used in the analysis. The analystmay enter data according to the field names on the form or may use the fieldsto include other project documentation details.
Figure 11. Project Details form.
25
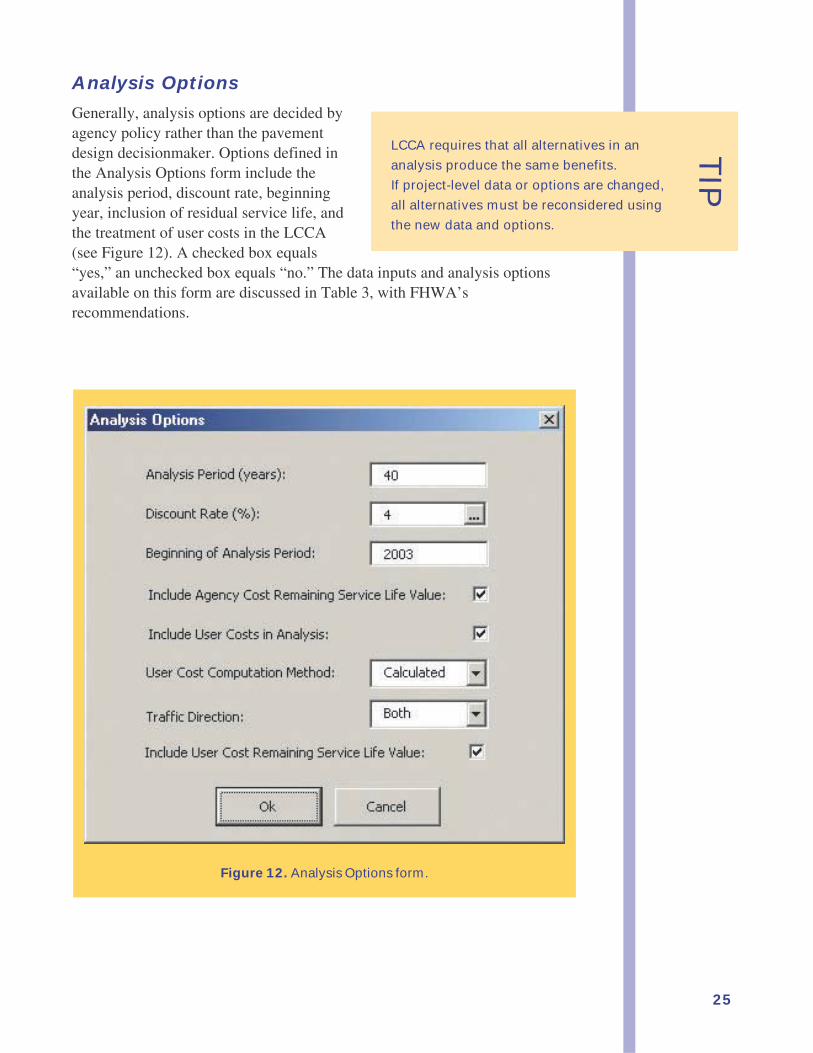
Analysis Options
Generally, analysis options are decided byagency policy rather than the pavementdesign decisionmaker. Options defined inthe Analysis Options form include theanalysis period, discount rate, beginningyear, inclusion of residual service life, andthe treatment of user costs in the LCCA(see Figure 12). A checked box equals“yes,” an unchecked box equals “no.” The data inputs and analysis optionsavailable on this form are discussed in Table 3, with FHWA’srecommendations.
Figure 12. Analysis Options form.
LCCA requires that all alternatives in an
analysis produce the same benefits.
If project-level data or options are changed,
all alternatives must be reconsidered using
the new data and options.
TIP
26
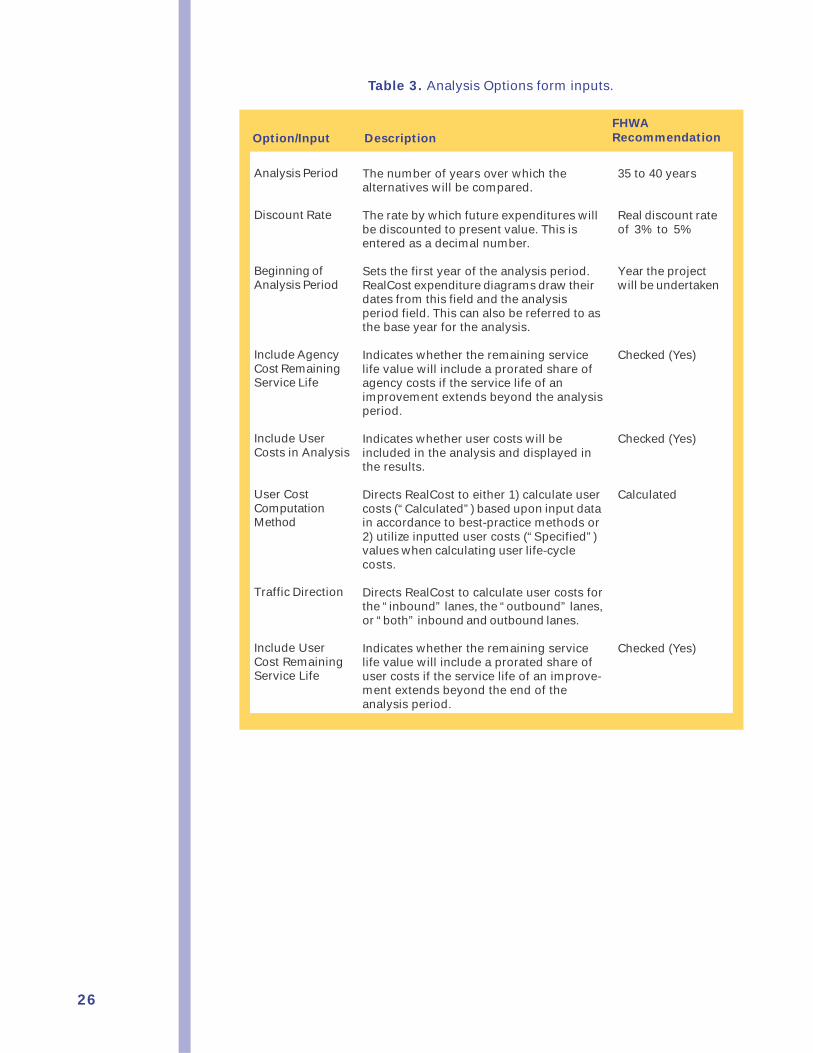
Table 3. Analysis Options form inputs.
FHWARecommendationOption/Input Description
The number of years over which thealternatives will be compared.
The rate by which future expenditures willbe discounted to present value. This isentered as a decimal number.
Sets the first year of the analysis period.RealCost expenditure diagrams draw theirdates from this field and the analysisperiod field. This can also be referred to asthe base year for the analysis.
Indicates whether the remaining servicelife value will include a prorated share ofagency costs if the service life of animprovement extends beyond the analysisperiod.
Indicates whether user costs will beincluded in the analysis and displayed inthe results.
Directs RealCost to either 1) calculate usercosts (“Calculated”) based upon input datain accordance to best-practice methods or2) utilize inputted user costs (“Specified”)values when calculating user life-cyclecosts.
Directs RealCost to calculate user costs forthe “inbound” lanes, the “outbound” lanes,or “both” inbound and outbound lanes.
Indicates whether the remaining servicelife value will include a prorated share ofuser costs if the service life of an improve-ment extends beyond the end of theanalysis period.
35 to 40 years
Real discount rateof 3% to 5%
Year the projectwill be undertaken
Checked (Yes)
Checked (Yes)
Calculated
Checked (Yes)
Analysis Period
Discount Rate
Beginning ofAnalysis Period
Include AgencyCost RemainingService Life
Include UserCosts in Analysis
User CostComputationMethod
Traffic Direction
Include UserCost RemainingService Life
27
Traffic Data
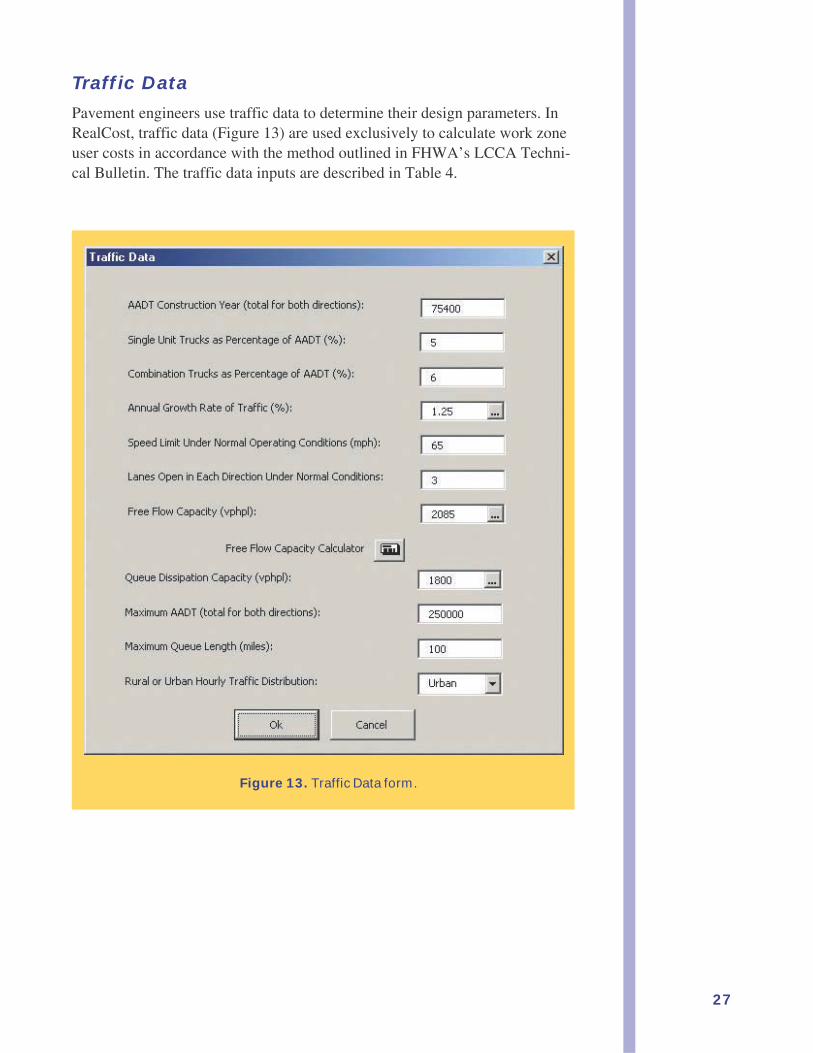
Pavement engineers use traffic data to determine their design parameters. InRealCost, traffic data (Figure 13) are used exclusively to calculate work zoneuser costs in accordance with the method outlined in FHWA’s LCCA Techni-cal Bulletin. The traffic data inputs are described in Table 4.
Figure 13. Traffic Data form.
28
Table 4. Traffic Data form inputs.
Input Description
AADT in BothDirections
Single Unit Trucks
Combo Trucks
Annual GrowthRate of Traffic
Normal OperationsSpeed Limit
Normal Number ofLanes Open
Queue DissipationCapacity
Normal Free FlowCapacity
Free Flow CapacityCalculator
Maximum AADT inboth Directions
Maximum QueueLength
Rural or UrbanTraffic
This is the annual average daily traffic in the construction orbase year of the analysis. This is the total AADT for bothdirections.
The percentage of the AADT that is single unit trucks.
The percentage of the AADT that is combination trucks.
The percentage by which "AADT in both directions" increaseseach year.
Speed limit in normal operating conditions (the time periodsbetween agency work zones).
Number of roadway lanes available under normal operatingconditions.
Capacity of each lane during queue dissipation operatingconditions.
Capacity of each lane under normal operating conditions.
This button opens a form that calculates free flow lane capaci-ties based upon the Highway Capacity Manual, 3rd Ed.
Caps the traffic growth at this number. If traffic grows beyondthis value, this value is substituted for the computed futureAADT figure and future user costs are calculated based uponthis maximum AADT figure. This is used to prevent growthbeyond possible capacity.
Models the effects of self-imposed detours (traffic exiting fromthe work zone route yet still incurring some user costs). Queue-related user costs, which are based upon queue length, arecalculated with this figure instead of the calculated queuelength. However, all vehicles, even those that detour, arecharged queue costs.
Allows the choice between two hourly traffic distributions.Default values for these distributions (the defaults are acces-sible in the software) are taken from the Texas TransportationInstitute’s MicroBENCOST.
29
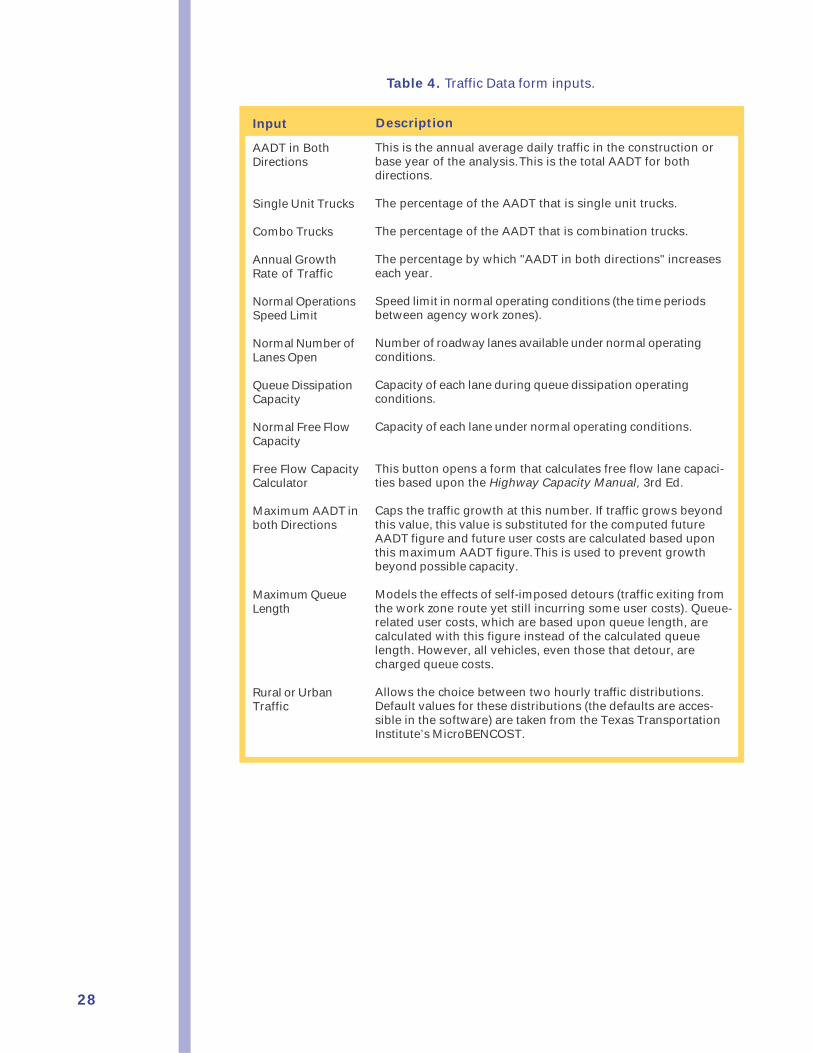
Value of User Time
The Value of User Time form, shown in Figure 14, allows editing of thevalues applied to an hour of user time. The dollar value of user time is differ-ent for each vehicle type and is used to calculate user costs associated withdelay during work zone operations.
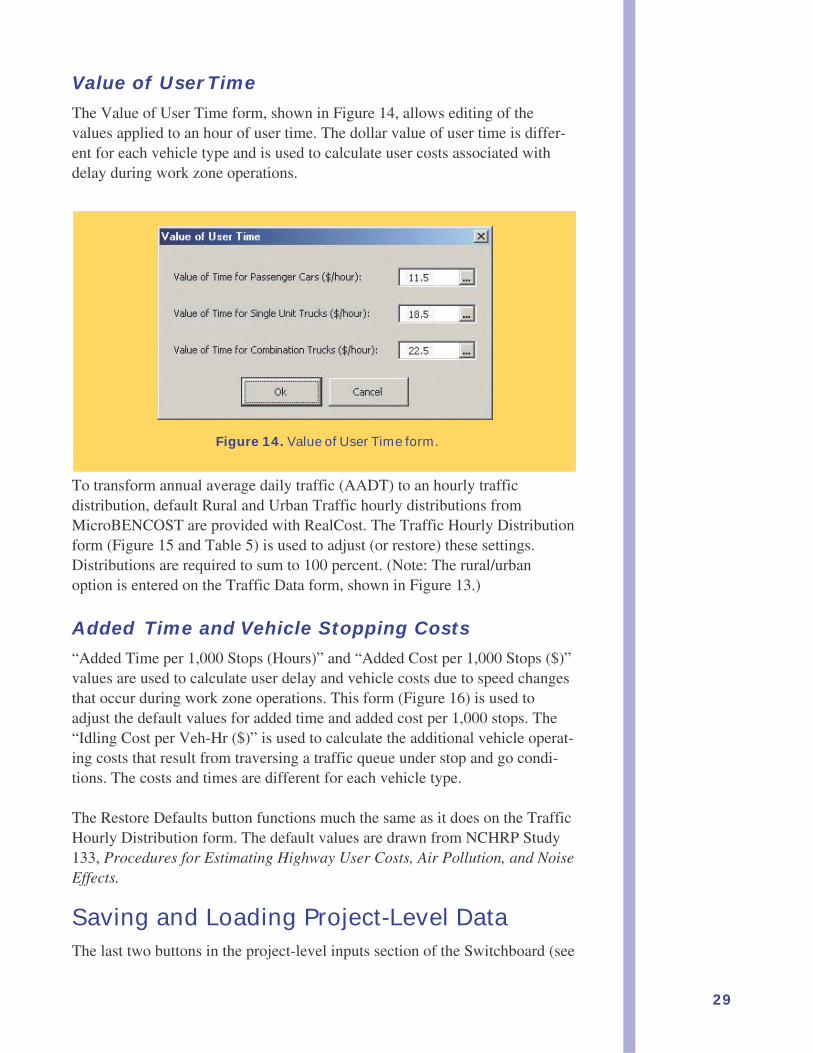
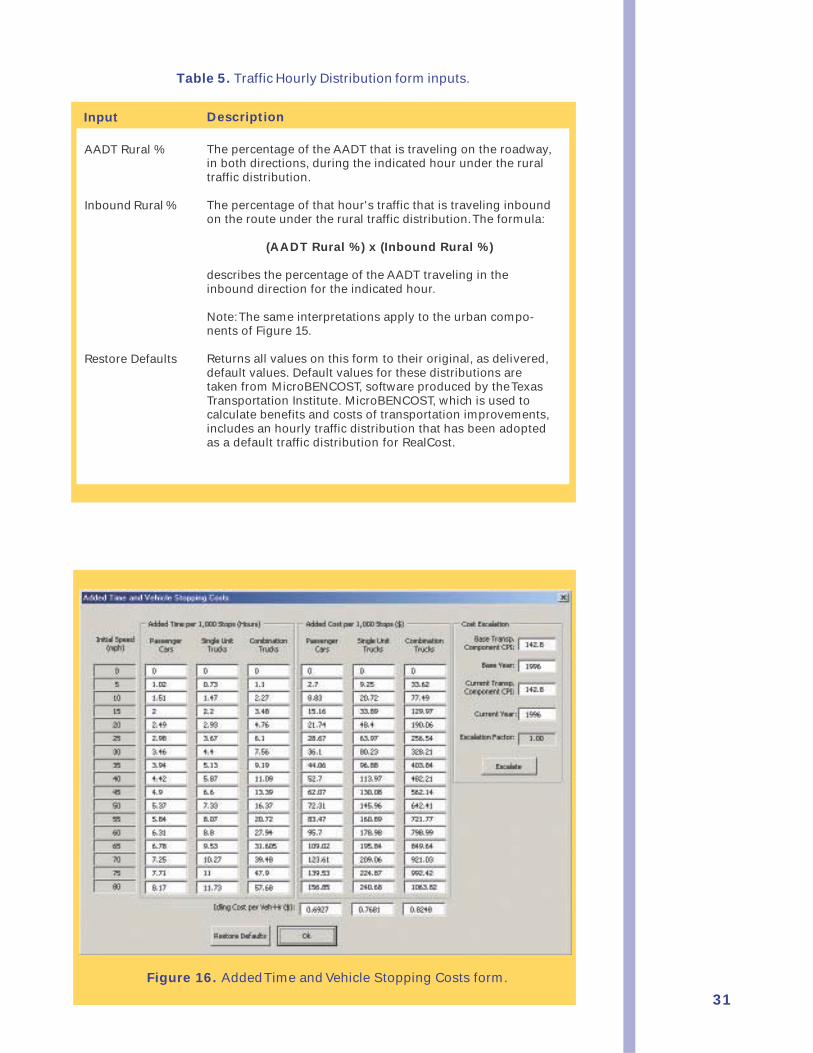
Traffic Hourly DistributionTo transform annual average daily traffic (AADT) to an hourly trafficdistribution, default Rural and Urban Traffic hourly distributions fromMicroBENCOST are provided with RealCost. The Traffic Hourly Distributionform (Figure 15 and Table 5) is used to adjust (or restore) these settings.Distributions are required to sum to 100 percent. (Note: The rural/urbanoption is entered on the Traffic Data form, shown in Figure 13.)
Added Time and Vehicle Stopping Costs“Added Time per 1,000 Stops (Hours)” and “Added Cost per 1,000 Stops ($)”values are used to calculate user delay and vehicle costs due to speed changesthat occur during work zone operations. This form (Figure 16) is used toadjust the default values for added time and added cost per 1,000 stops. The“Idling Cost per Veh-Hr ($)” is used to calculate the additional vehicle operat-ing costs that result from traversing a traffic queue under stop and go condi-tions. The costs and times are different for each vehicle type.
The Restore Defaults button functions much the same as it does on the TrafficHourly Distribution form. The default values are drawn from NCHRP Study133, Procedures for Estimating Highway User Costs, Air Pollution, and NoiseEffects.
Saving and Loading Project-Level DataThe last two buttons in the project-level inputs section of the Switchboard (see
Figure 14. Value of User Time form.
30
Figure 15. Traffic Hourly Distribution form.
31
Table 5. Traffic Hourly Distribution form inputs.
Input Description
AADT Rural %
Inbound Rural %
Restore Defaults
The percentage of the AADT that is traveling on the roadway,in both directions, during the indicated hour under the ruraltraffic distribution.
The percentage of that hour's traffic that is traveling inboundon the route under the rural traffic distribution. The formula:
(AADT Rural %) x (Inbound Rural %)
describes the percentage of the AADT traveling in theinbound direction for the indicated hour.
Note: The same interpretations apply to the urban compo-nents of Figure 15.
Returns all values on this form to their original, as delivered,default values. Default values for these distributions aretaken from MicroBENCOST, software produced by the TexasTransportation Institute. MicroBENCOST, which is used tocalculate benefits and costs of transportation improvements,includes an hourly traffic distribution that has been adoptedas a default traffic distribution for RealCost.
Figure 16. Added Time and Vehicle Stopping Costs form.
32
Figure 17) are used to save and to retrieve (load) project-level inputs. NOTE:Alternative-level inputs are saved separately from project-level inputs. Themechanism to save and open alternative-level inputs is found on the Alterna-tive 1 and Alternative 2 forms.
Project-level inputs are saved in a small, comma-delimited file. This file maybe named via ordinary Windows conventions and is automatically saved withthe *.LCC extension. Changing the file extension will prevent RealCost fromrecognizing the file. Warning: Opening an *.LCC file will overwrite data inthe Project-Level Inputs section.
Alternative-Level Data Input Forms
Figure 17. Switchboard buttons to save and open project-level inputs.
33
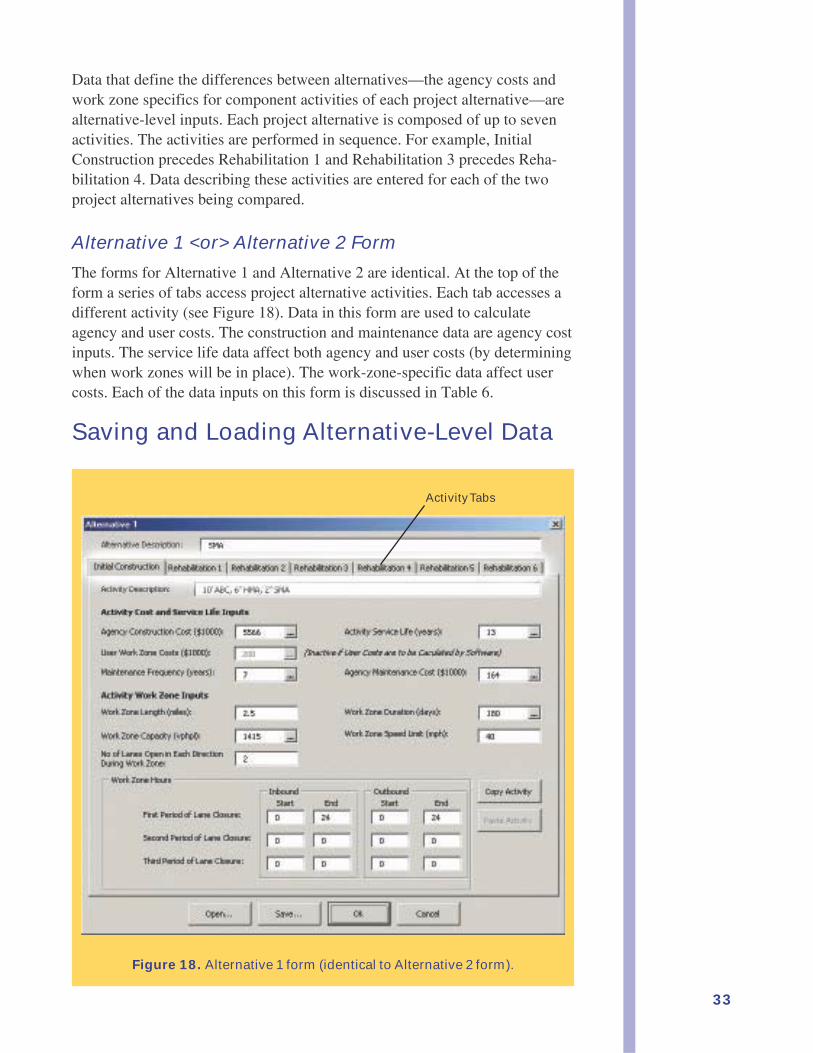
Data that define the differences between alternatives—the agency costs andwork zone specifics for component activities of each project alternative—arealternative-level inputs. Each project alternative is composed of up to sevenactivities. The activities are performed in sequence. For example, InitialConstruction precedes Rehabilitation 1 and Rehabilitation 3 precedes Reha-bilitation 4. Data describing these activities are entered for each of the twoproject alternatives being compared.
Alternative 1 <or> Alternative 2 Form
The forms for Alternative 1 and Alternative 2 are identical. At the top of theform a series of tabs access project alternative activities. Each tab accesses adifferent activity (see Figure 18). Data in this form are used to calculateagency and user costs. The construction and maintenance data are agency costinputs. The service life data affect both agency and user costs (by determiningwhen work zones will be in place). The work-zone-specific data affect usercosts. Each of the data inputs on this form is discussed in Table 6.
Saving and Loading Alternative-Level Data
Figure 18. Alternative 1 form (identical to Alternative 2 form).
Activity Tabs
34
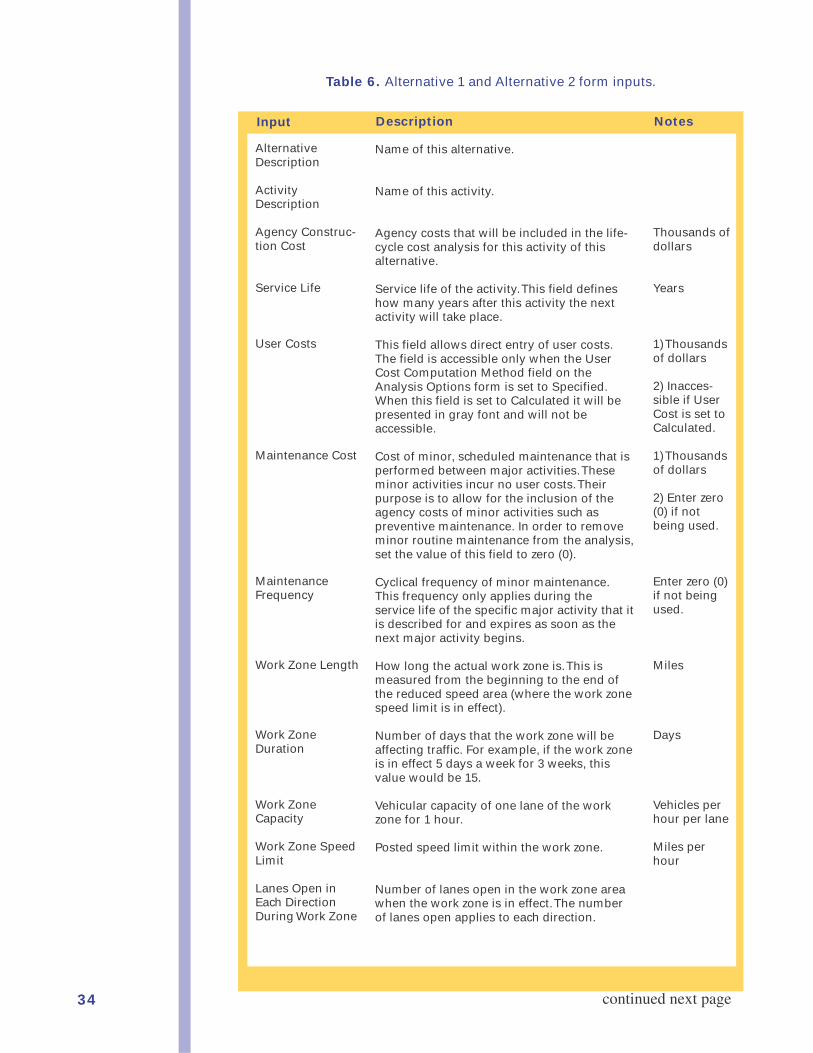
Table 6. Alternative 1 and Alternative 2 form inputs.
Input Description Notes
continued next page
AlternativeDescription
ActivityDescription
Agency Construc-tion Cost
Service Life
User Costs
Maintenance Cost
MaintenanceFrequency
Work Zone Length
Work ZoneDuration
Work ZoneCapacity
Work Zone SpeedLimit
Lanes Open inEach DirectionDuring Work Zone
Name of this alternative.
Name of this activity.
Agency costs that will be included in the life-cycle cost analysis for this activity of thisalternative.
Service life of the activity. This field defineshow many years after this activity the nextactivity will take place.
This field allows direct entry of user costs.The field is accessible only when the UserCost Computation Method field on theAnalysis Options form is set to Specified.When this field is set to Calculated it will bepresented in gray font and will not beaccessible.
Cost of minor, scheduled maintenance that isperformed between major activities. Theseminor activities incur no user costs. Theirpurpose is to allow for the inclusion of theagency costs of minor activities such aspreventive maintenance. In order to removeminor routine maintenance from the analysis,set the value of this field to zero (0).
Cyclical frequency of minor maintenance.This frequency only applies during theservice life of the specific major activity that itis described for and expires as soon as thenext major activity begins.
How long the actual work zone is. This ismeasured from the beginning to the end ofthe reduced speed area (where the work zonespeed limit is in effect).
Number of days that the work zone will beaffecting traffic. For example, if the work zoneis in effect 5 days a week for 3 weeks, thisvalue would be 15.
Vehicular capacity of one lane of the workzone for 1 hour.
Posted speed limit within the work zone.
Number of lanes open in the work zone areawhen the work zone is in effect. The numberof lanes open applies to each direction.
Thousands ofdollars
Years
1) Thousandsof dollars
2) Inacces-sible if UserCost is set toCalculated.
1) Thousandsof dollars
2) Enter zero(0) if notbeing used.
Enter zero (0)if not beingused.
Miles
Days
Vehicles perhour per lane
Miles perhour
35
The Open… and Save... buttons at the bottom of the Alternative form are usedto open and save alternative-level data. These data files may be named viaordinary Windows conventions and are automatically saved with the *.LCAextension. A name that is descriptive of the alternative should be used. Datafor the alternative name and its seven major activities are saved in the LCAfile. Saving alternatives individually allows different alternatives to be loaded,analyzed, and stored for use in future analy-ses. Warning: Opening an *.LCA file over-writes all existing data for the alternativeactive in memory. To avoid losing data, savenew data to an *.LCA file before loadinganother alternative.
The Copy Activity and Paste Activitybuttons allow data to be copied from one activity to another within the samealternative. Begin at the activity which has the data to be copied, press theCopy button, move to the activity that is to receive the data, and press thePaste button. All existing data in the receiving activity will be overwritten.
Probabilistic Input
Opening an *.LCA file overwrites all existing
data for the alternative active in memory.
To avoid losing data, save new data to an
*.LCA file before loading another alternative.
TIP
Description Notes
Table 6, continued
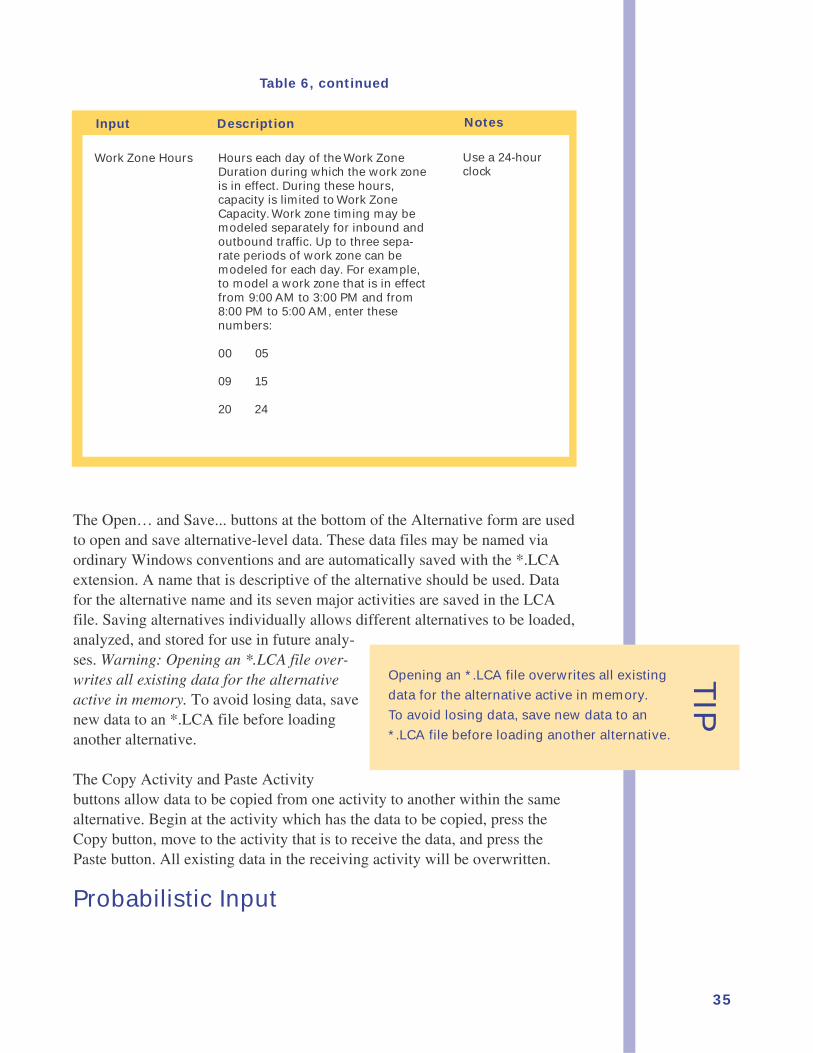
Hours each day of the Work ZoneDuration during which the work zoneis in effect. During these hours,capacity is limited to Work ZoneCapacity. Work zone timing may bemodeled separately for inbound andoutbound traffic. Up to three sepa-rate periods of work zone can bemodeled for each day. For example,to model a work zone that is in effectfrom 9:00 AM to 3:00 PM and from8:00 PM to 5:00 AM, enter thesenumbers:
00 05
09 15
20 24
Input
Work Zone Hours Use a 24-hourclock
36
RealCost encourages the consideration of variability (i.e., uncertainty) inanalysis inputs. Input variability can be addressed by using probabilisticallydefined inputs.
Probability Functions
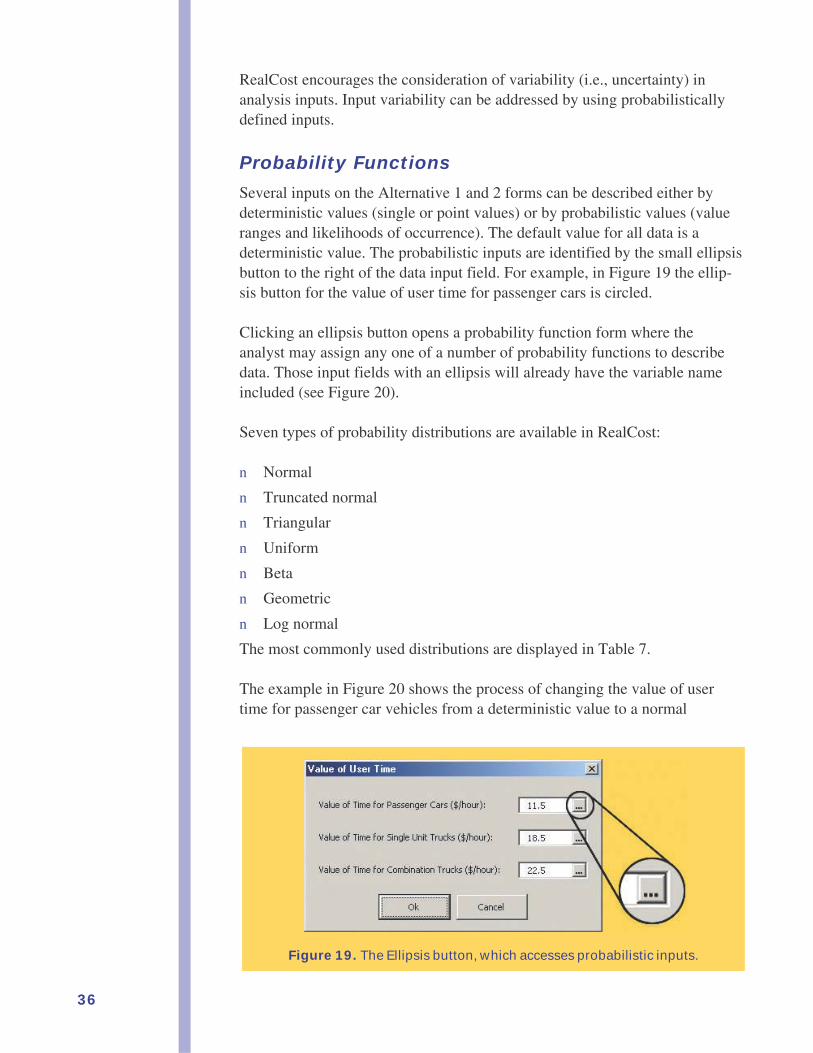
Several inputs on the Alternative 1 and 2 forms can be described either bydeterministic values (single or point values) or by probabilistic values (valueranges and likelihoods of occurrence). The default value for all data is adeterministic value. The probabilistic inputs are identified by the small ellipsisbutton to the right of the data input field. For example, in Figure 19 the ellip-sis button for the value of user time for passenger cars is circled.
Clicking an ellipsis button opens a probability function form where theanalyst may assign any one of a number of probability functions to describedata. Those input fields with an ellipsis will already have the variable nameincluded (see Figure 20).
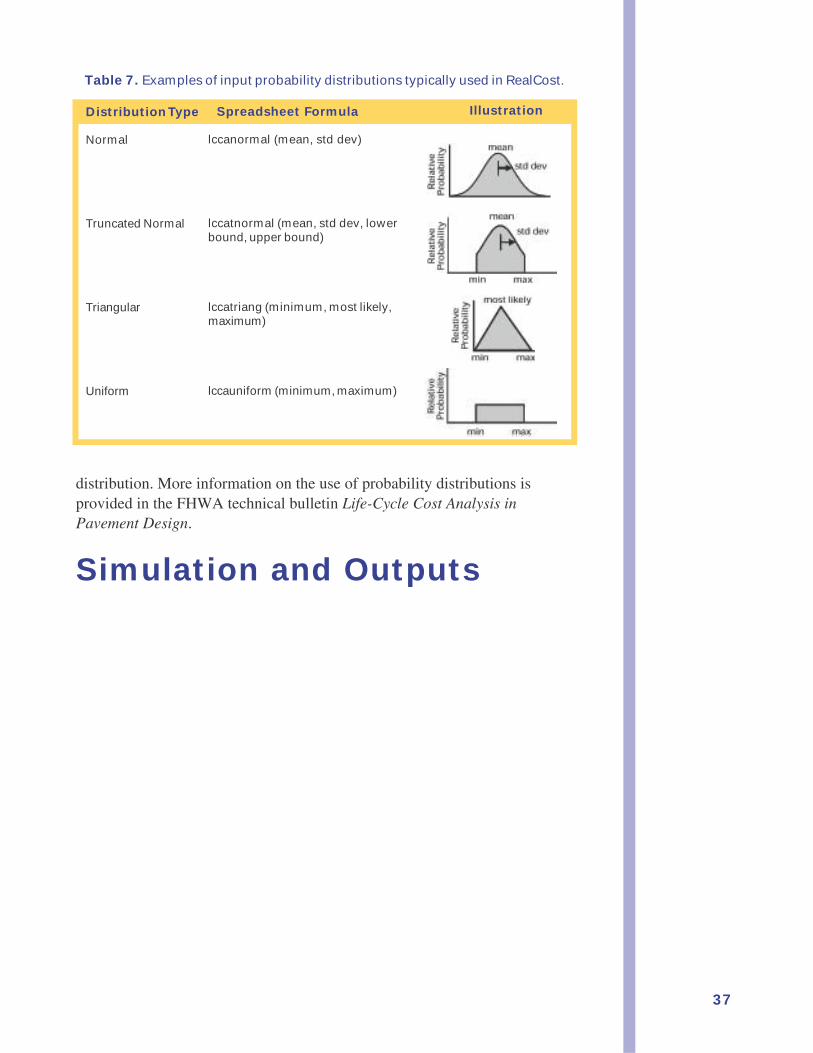
Seven types of probability distributions are available in RealCost:
n Normal
n Truncated normal
n Triangular
n Uniform
n Beta
n Geometric
n Log normal
The most commonly used distributions are displayed in Table 7.
The example in Figure 20 shows the process of changing the value of usertime for passenger car vehicles from a deterministic value to a normal
Figure 19. The Ellipsis button, which accesses probabilistic inputs.
37
Distribution Type Spreadsheet Formula
Normal
Truncated Normal
Triangular
Uniform
lccanormal (mean, std dev)
lccatnormal (mean, std dev, lowerbound, upper bound)
lccatriang (minimum, most likely,maximum)
lccauniform (minimum, maximum)
Illustration
Table 7. Examples of input probability distributions typically used in RealCost.
distribution. More information on the use of probability distributions isprovided in the FHWA technical bulletin Life-Cycle Cost Analysis inPavement Design.
Simulation and Outputs
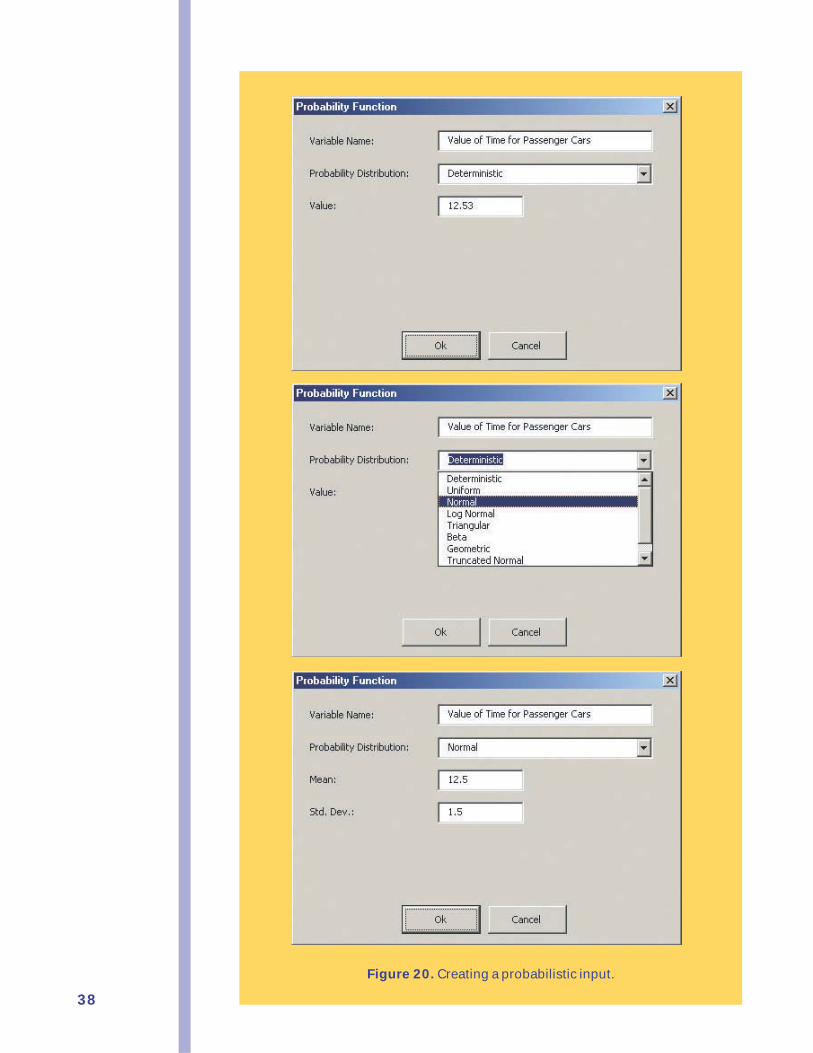
38FIGURE 21 HEREFigure 20. Creating a probabilistic input.
39
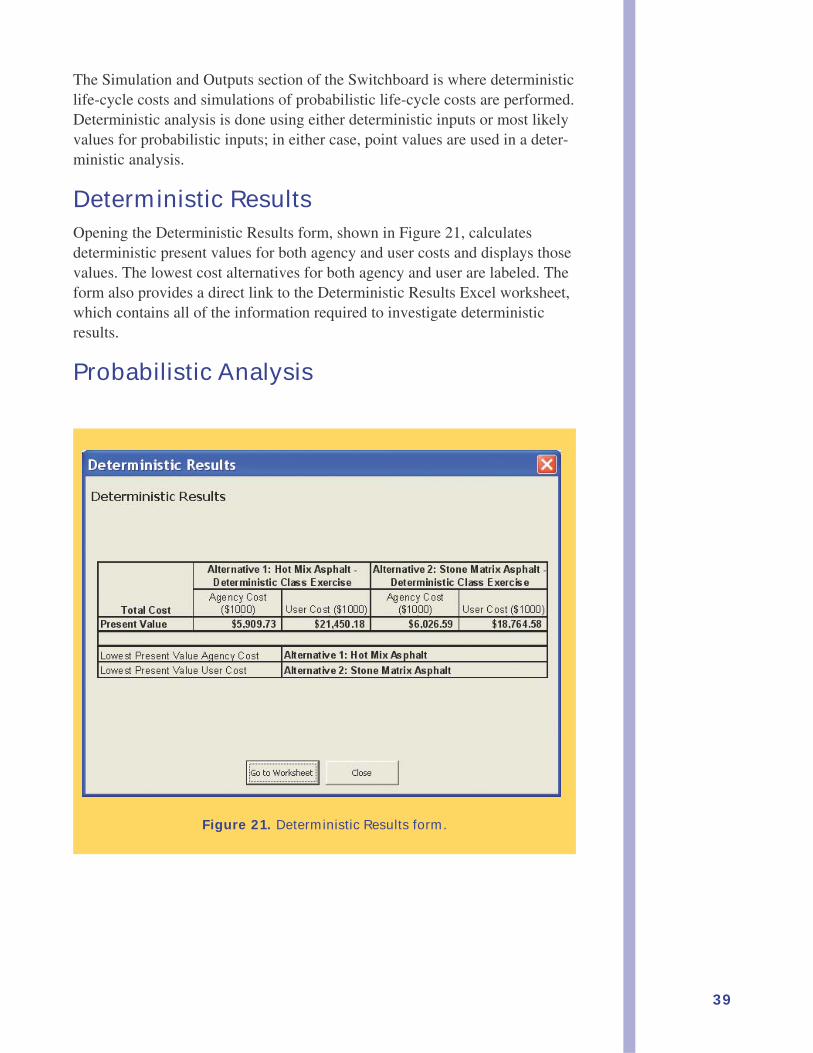
Figure 21. Deterministic Results form.
The Simulation and Outputs section of the Switchboard is where deterministiclife-cycle costs and simulations of probabilistic life-cycle costs are performed.Deterministic analysis is done using either deterministic inputs or most likelyvalues for probabilistic inputs; in either case, point values are used in a deter-ministic analysis.
Deterministic ResultsOpening the Deterministic Results form, shown in Figure 21, calculatesdeterministic present values for both agency and user costs and displays thosevalues. The lowest cost alternatives for both agency and user are labeled. Theform also provides a direct link to the Deterministic Results Excel worksheet,which contains all of the information required to investigate deterministicresults.
Probabilistic Analysis
40
Figure 22. Simulation form.
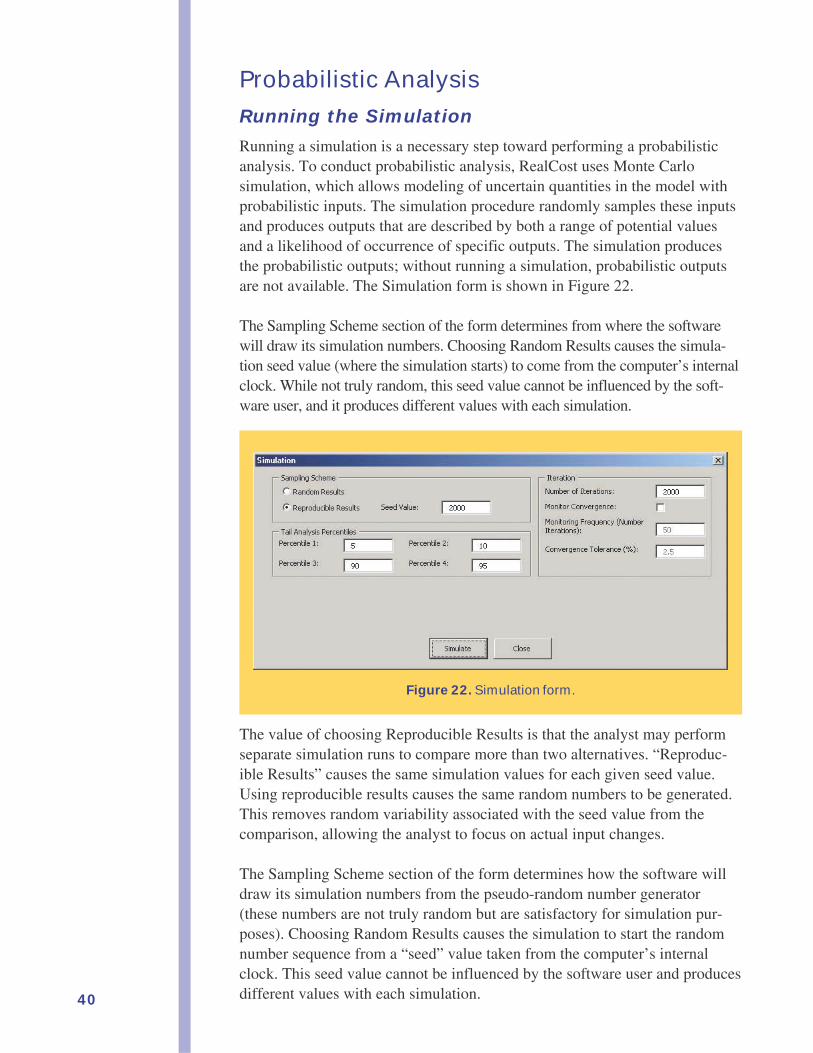
Probabilistic AnalysisRunning the SimulationRunning a simulation is a necessary step toward performing a probabilisticanalysis. To conduct probabilistic analysis, RealCost uses Monte Carlosimulation, which allows modeling of uncertain quantities in the model withprobabilistic inputs. The simulation procedure randomly samples these inputsand produces outputs that are described by both a range of potential valuesand a likelihood of occurrence of specific outputs. The simulation producesthe probabilistic outputs; without running a simulation, probabilistic outputsare not available. The Simulation form is shown in Figure 22.
The Sampling Scheme section of the form determines from where the softwarewill draw its simulation numbers. Choosing Random Results causes the simula-tion seed value (where the simulation starts) to come from the computer’s internalclock. While not truly random, this seed value cannot be influenced by the soft-ware user, and it produces different values with each simulation.
The value of choosing Reproducible Results is that the analyst may performseparate simulation runs to compare more than two alternatives. “Reproduc-ible Results” causes the same simulation values for each given seed value.Using reproducible results causes the same random numbers to be generated.This removes random variability associated with the seed value from thecomparison, allowing the analyst to focus on actual input changes.
The Sampling Scheme section of the form determines how the software willdraw its simulation numbers from the pseudo-random number generator(these numbers are not truly random but are satisfactory for simulation pur-poses). Choosing Random Results causes the simulation to start the randomnumber sequence from a “seed” value taken from the computer’s internalclock. This seed value cannot be influenced by the software user and producesdifferent values with each simulation.
41
The Reproducible Results option allows the analyst to specify the specificseed value to be used in all simulations. This causes the same set of randomnumbers to be generated from the pseudo-random number generator. Choos-ing Reproducible Results allows the analyst to perform separate simulationruns to compare multiple alternatives, knowing that variations from run to runwill be caused by actual input changes and not variability associated withdifferent seed values.
Tail Analysis Percentiles are used to conduct analysis on the total cost prob-ability distribution graphics provided by RealCost, discussed on page 44.Percentile values should be entered in ascending order.
The Iteration section is used to determine the number of iterations to beperformed and whether the simulation will be monitored for convergence.Output convergence can be used by the analyst to determine that a simulationhas run a sufficient number of iterations to properly define its outputs.Convergence is monitored by comparing the change in the mean and standarddeviation of the cumulative outputs each time a specified number of iterationsis completed (specified in the Monitoring Frequency box). Once the level ofchange falls below the specified Convergence Tolerance, RealCost will endthe simulation run without completing any remaining iterations—yieldingprobabilistic results while significantly shortening the time it takes tocomplete the analysis. The number of iterations should be 2,000 at aminimum. Monitoring Frequency is adequate at 100 iterations, and, whenused, a Convergence Tolerance of 2.5 (percent) should provide appropriateprobabilistic outputs.
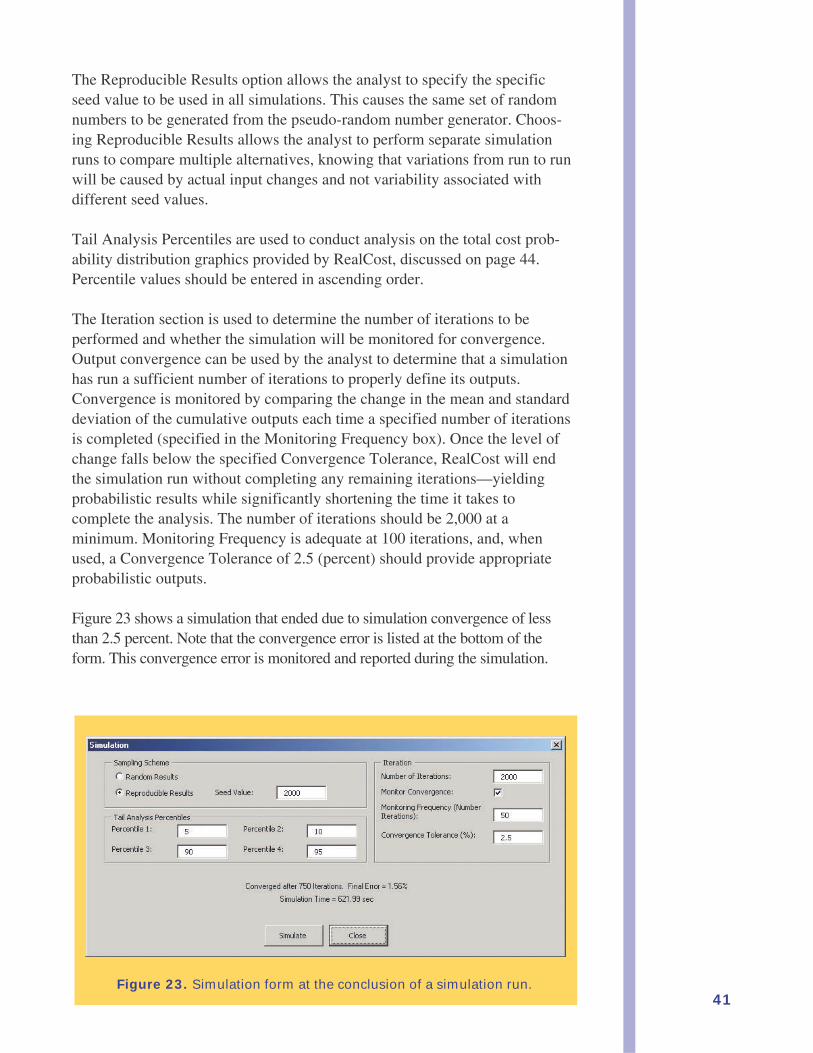
Figure 23 shows a simulation that ended due to simulation convergence of lessthan 2.5 percent. Note that the convergence error is listed at the bottom of theform. This convergence error is monitored and reported during the simulation.
Figure 23. Simulation form at the conclusion of a simulation run.
42
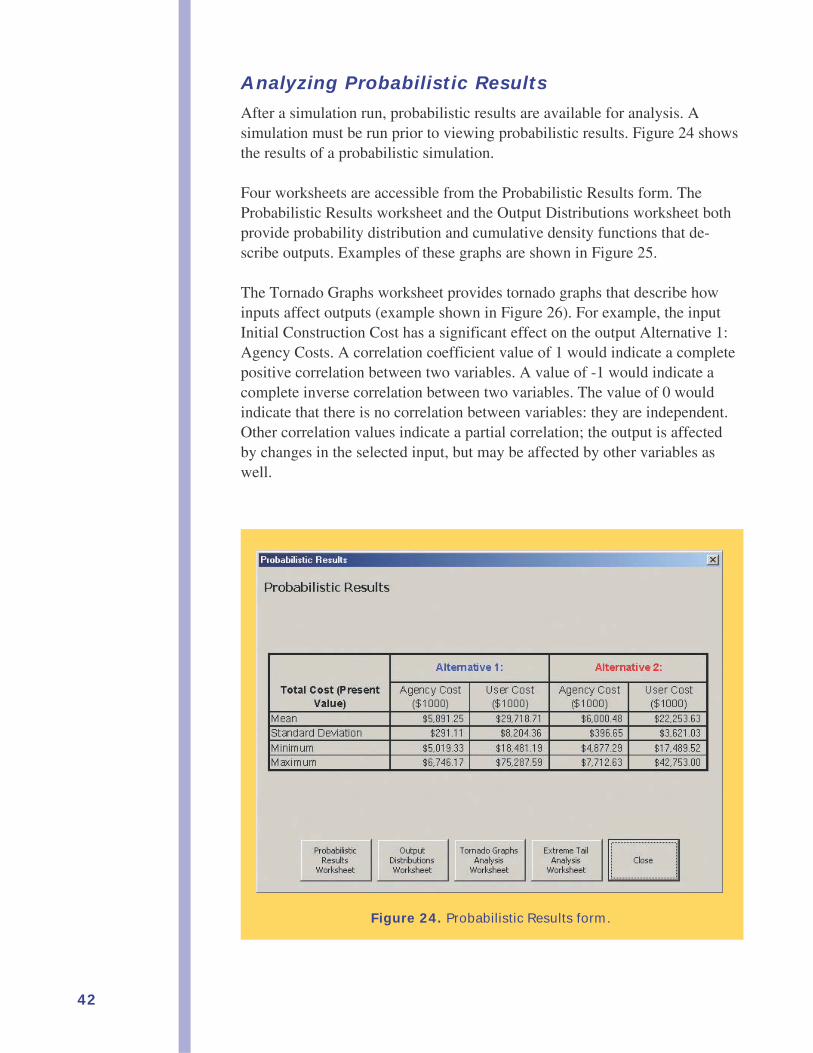
Figure 24. Probabilistic Results form.
Analyzing Probabilistic Results
After a simulation run, probabilistic results are available for analysis. Asimulation must be run prior to viewing probabilistic results. Figure 24 showsthe results of a probabilistic simulation.
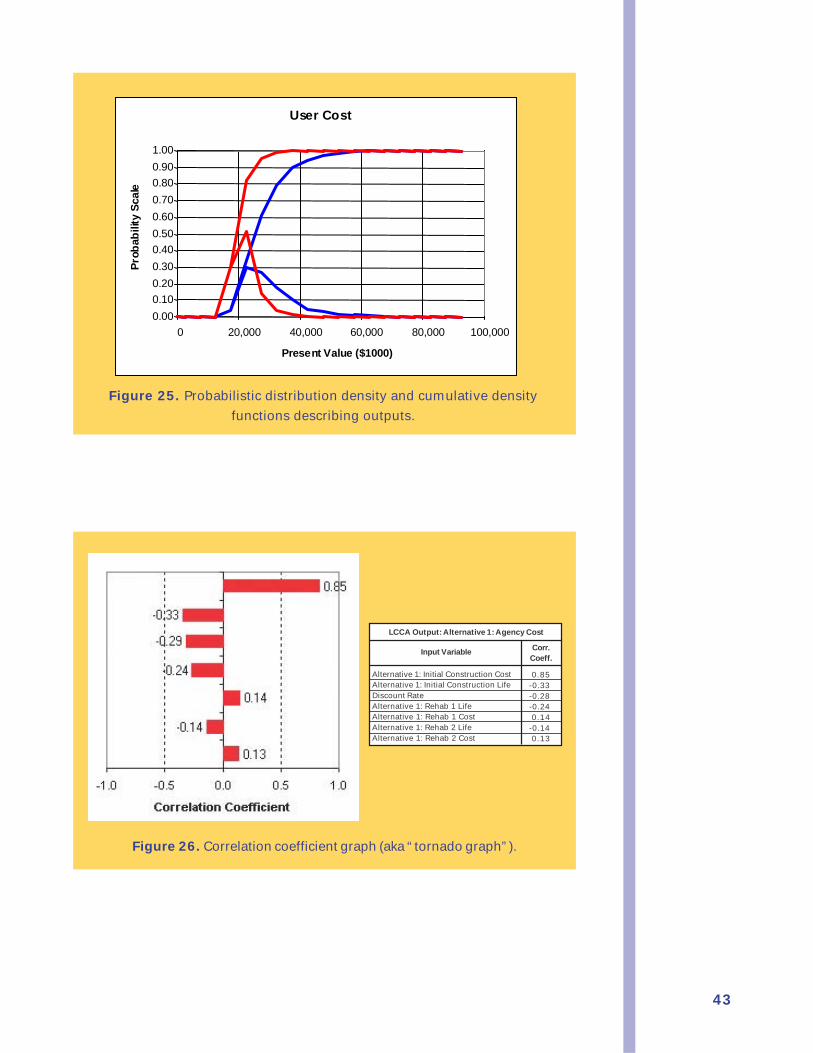
Four worksheets are accessible from the Probabilistic Results form. TheProbabilistic Results worksheet and the Output Distributions worksheet bothprovide probability distribution and cumulative density functions that de-scribe outputs. Examples of these graphs are shown in Figure 25.
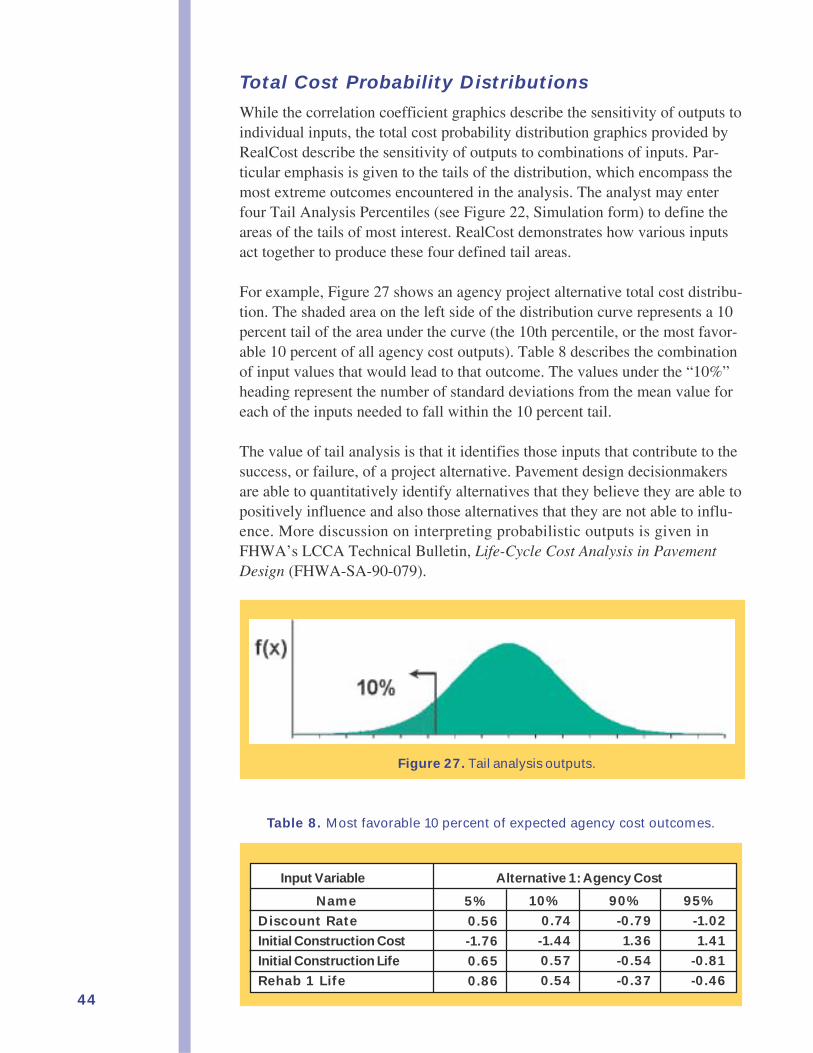
The Tornado Graphs worksheet provides tornado graphs that describe howinputs affect outputs (example shown in Figure 26). For example, the inputInitial Construction Cost has a significant effect on the output Alternative 1:Agency Costs. A correlation coefficient value of 1 would indicate a completepositive correlation between two variables. A value of -1 would indicate acomplete inverse correlation between two variables. The value of 0 wouldindicate that there is no correlation between variables: they are independent.Other correlation values indicate a partial correlation; the output is affectedby changes in the selected input, but may be affected by other variables aswell.
43
User Cost
0.000.100.200.300.400.500.600.700.800.901.00
0 20,000 40,000 60,000 80,000 100,000
Present Value ($1000)
Prob
abili
ty S
cale
User Cost
0.000.100.200.300.400.500.600.700.800.901.00
0 20,000 40,000 60,000 80,000 100,000
Present Value ($1000)
Prob
abili
ty S
cale
Figure 26. Correlation coefficient graph (aka “tornado graph”).
Figure 25. Probabilistic distribution density and cumulative density
functions describing outputs.
LCCA Output: Alternative 1: Agency Cost
Input Variable Corr.Coeff.
Alternative 1: Initial Construction CostAlternative 1: Initial Construction LifeDiscount RateAlternative 1: Rehab 1 LifeAlternative 1: Rehab 1 CostAlternative 1: Rehab 2 LifeAlternative 1: Rehab 2 Cost
0.85-0.33-0.28-0.240.14
-0.140.13
44
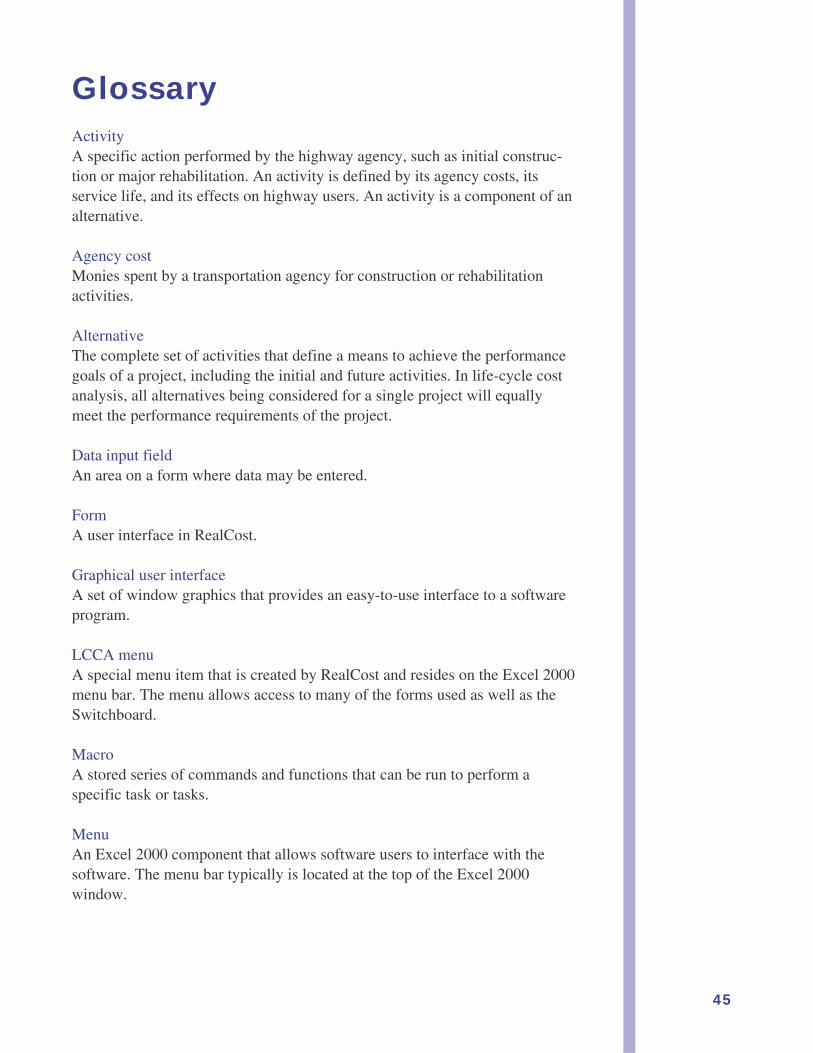
Figure 27. Tail analysis outputs.
Table 8. Most favorable 10 percent of expected agency cost outcomes.
Input Variable Alternative 1: Agency Cost
NameDiscount RateInitial Construction CostInitial Construction LifeRehab 1 Life
5%0.56-1.760.650.86
10%0.74-1.440.570.54
90%-0.791.36
-0.54-0.37
95%-1.021.41
-0.81-0.46
Total Cost Probability Distributions
While the correlation coefficient graphics describe the sensitivity of outputs toindividual inputs, the total cost probability distribution graphics provided byRealCost describe the sensitivity of outputs to combinations of inputs. Par-ticular emphasis is given to the tails of the distribution, which encompass themost extreme outcomes encountered in the analysis. The analyst may enterfour Tail Analysis Percentiles (see Figure 22, Simulation form) to define theareas of the tails of most interest. RealCost demonstrates how various inputsact together to produce these four defined tail areas.
For example, Figure 27 shows an agency project alternative total cost distribu-tion. The shaded area on the left side of the distribution curve represents a 10percent tail of the area under the curve (the 10th percentile, or the most favor-able 10 percent of all agency cost outputs). Table 8 describes the combinationof input values that would lead to that outcome. The values under the “10%”heading represent the number of standard deviations from the mean value foreach of the inputs needed to fall within the 10 percent tail.
The value of tail analysis is that it identifies those inputs that contribute to thesuccess, or failure, of a project alternative. Pavement design decisionmakersare able to quantitatively identify alternatives that they believe they are able topositively influence and also those alternatives that they are not able to influ-ence. More discussion on interpreting probabilistic outputs is given inFHWA’s LCCA Technical Bulletin, Life-Cycle Cost Analysis in PavementDesign (FHWA-SA-90-079).
45
GlossaryActivityA specific action performed by the highway agency, such as initial construc-tion or major rehabilitation. An activity is defined by its agency costs, itsservice life, and its effects on highway users. An activity is a component of analternative.
Agency costMonies spent by a transportation agency for construction or rehabilitationactivities.
AlternativeThe complete set of activities that define a means to achieve the performancegoals of a project, including the initial and future activities. In life-cycle costanalysis, all alternatives being considered for a single project will equallymeet the performance requirements of the project.
Data input fieldAn area on a form where data may be entered.
FormA user interface in RealCost.
Graphical user interfaceA set of window graphics that provides an easy-to-use interface to a softwareprogram.
LCCA menuA special menu item that is created by RealCost and resides on the Excel 2000menu bar. The menu allows access to many of the forms used as well as theSwitchboard.
MacroA stored series of commands and functions that can be run to perform aspecific task or tasks.
MenuAn Excel 2000 component that allows software users to interface with thesoftware. The menu bar typically is located at the top of the Excel 2000window.
46
ProjectFor the purposes of RealCost, a project is the provision of a specific level ofperformance to the motoring public. All design alternatives being consideredfor a project will provide the same level of performance for road users.
Service LifeThe period of time during which the product of a construction or rehabilita-tion activity is able to meet the performance requirements of a roadway. Thisperiod defines the time of normal operations between agency activities.
SwitchboardThe primary interface mechanism in RealCost. The Switchboard appearsautomatically when the software is started and may also be accessed throughthe RealCost menu.
Tab (worksheet tab)A selection device at the bottom of a displayed Excel 2000 workbook file thatallows the software user to select and move between different worksheetswithin the workbook.
Visual Basic for Applications (VBA)A tool used to automate tasks ranging from adding together two inputtednumbers to performing multistep, complex operations that use multipleinputs. Visual Basic code is also used to create the form interface forRealCost.
WorksheetA single page of an Excel 2000 workbook; a spreadsheet.
WorkbookAn Excel 2000 file composed of one or more worksheets and additionalVisual Basic for Applications code. The RealCost software is a workbook.
Work zoneAn area of reduced roadway capacity due to agency construction or rehabili-tation activities.
47
ReferencesHighway Capacity Manual, 3rd ed. (TRB Special Report 209).Washington, DC: Transportation Research Board, 1994.
Life-Cycle Cost Analysis in Pavement Design, Interim Technical Bulletin,(FHWA-SA-98-079).Washington, DC: Federal Highway Administration, September 1998.Available at www.fhwa.dot.gov/infrastructure/asstmgmt/lcca.htm.
Life-Cycle Cost Analysis Primer (FHWA-IF-02-047).Washington, DC: Federal Highway Administration, August 2002.Available at www.fhwa.dot.gov/infrastructure/asstmgmt/lcca.htm.
MicroBENCOST (NCHRP 7-12, MicroBENCOST User’s Manual and software).College Station, TX: Texas Transportation Institute, 1993.See tti.tamu.edu/product/ror/microbencost.stm.
Procedures for Estimating Highway User Costs, Air Pollution, and NoiseEffects, National Cooperative Highway Research Program, Study 133.D. A. Curry, D. G. Anderson. Washington, DC: National Research Council,Highway Research Board, 1972.
Office of Asset Management
Federal Highway Administration
400 Seventh Street, SW
Washington, DC 20590
Tel. 202-366-0392
Fax 202-366-9981
www.fhwa.dot.gov/infrastructure/asstmgmt/lcca.htm
For assistance in implementing a life-cycle cost analysis
program or to learn more about RealCost, please contact the
Office of Asset Management at 202-366-0392.