life cycle assessment of tap water: analysis and...
TRANSCRIPT
Life Cycle Assessment of Tap Water: Analysis and Comparison
with Mineral Water and other Beverages
Niels Jungbluth, Regula Keller, Alex König
Margrit-Rainer-Strasse 11c, CH-8050 Zürich
* Author to whom correspondence should be addressed; E-Mail: [email protected];
Tel.: +044 940 61 32
Abstract: This article evaluates the environmental impacts of tap and mineral water in a
broad context. The work is based on a study commissioned by the Swiss Gas and Water
Association (SVGW). A first step is an investigation of the entire life cycle from water
catchment/extraction to serving it up in a glass in a life cycle assessment (LCA). A variety
of scenarios including different ways of tap water consumption in Switzerland as a
beverage are assessed. They are compared with different scenarios for drinking mineral
water and other beverages. The study shows that from an environmental point of view, tap
water is preferable to other beverages if the investigated necessity is satisfying ones thirst.
The study then broadens the view and evaluates the environmental importance of the total
Swiss tap and mineral water consumption. It investigates the heating to get warm water in
households and the treatment of used tap water. In this part of the analysis it is shown that
other aspects such as waste water treatment and warming of water in households are much
more relevant than the use of tap water (or mineral water) for drinking. Therefore
switching from tap water to mineral water as a beverage contributes only a small potential
for the reduction of total environmental impacts of consumption.
Keywords: life cycle assessment, tap water, beverage, mineral water, environmental
impacts, global warming potential
Abbreviation
CH Switzerland
DE Germany
FJ Fiji
FR France
IT Italy
MW Mineral water
PET Polyethylene terephthalate
SVGW Swiss Gas and Water Association
SWG Seeländische Wasserversorgung
TW Tap water ZH Zurich
2
1. Introduction
Drinking is a basic necessity. We should drink at least two litres of beverage a day. One option is
water that can be provided to consumers directly from the tap or it can be bottled and transported
home. Furthermore there are many more beverage options to satisfy thirst. But how can we satisfy this
basic need in a manner that is as environmentally friendly as possible and what contribution can tap
water make in this context?
Average tap water consumption in Switzerland has dropped slightly during the past couple of years,
after rising slowly but steadily until well into the 1980s. Today 142 litres of tap water is consumed on
average per person and day in private households in Switzerland [1]. Of this amount, only a small
fraction is drunk.
The per capita consumption of bottled mineral water in Switzerland has grown continuously until
2003. From 2003 until 2007 it was stable at around 120 litres per year and capita. In 2011 it dropped
and is currently amounting to 111 litres per year [2]. Imports of bottled water have more than tripled
during the past decade, now accounting for almost one third of Swiss consumption of bottled water.
The most used method for investigating environmental impacts of products is a life cycle
assessment (LCA). The environmental impact is examined throughout a product's entire life cycle from
cradle to grave, i.e. from resource extraction, production and usage until the disposal of the product
and production waste.
The first LCA studies on single tap water supplies in Switzerland have been elaborated in 1998 [3,
4]. ESU-services Ltd. investigated the environmental impacts of Swiss tap water and compared it with
mineral water for the first time in an LCA in 2005 [5, 6]. In 2014 the Swiss Gas and Water Association
(SVGW) has commissioned an in-depth update and extension of this study including many further
beverages with reference to the year 2013 [7]. In this study several scenarios including home
transportation of beverages and in-house distribution of tap water have been included. Furthermore, the
study outlines the relevance of the environmental impact of water consumption in relation to the
impacts of total private consumption in Switzerland. The study also investigates reduction potentials in
different scenarios dealing with the reduction of water consumption or a shift in consumption patterns.
Several other studies have been published on the environmental impacts of tap water and on single
other beverages. A good overview on LCA case studies for tap water is given e.g. in [8, 9]. Most of
these studies focus on a comparison with mineral water. A comparison of all types of beverages has
not been made so far to our knowledge.
In this article we provide further information related to different environmental aspects of tap water,
mineral water and other beverages. The full LCA study in German summarized for this article with a
special focus on the following themes:
Tap water and water infrastructure
Mineral Water and other beverages
Therefore the following questions are addressed in this article:
What are the environmental impacts of tap water supply and which relevance has the
infrastructure in this?

3
How compare different beverages including tap and mineral water from an environmental
point of view?
How relevant is the drinking of tap and mineral water compared to the total impacts of tap
water supply?
How relevant is the heating of tap water compared to the heat water supply?
How relevant is the treatment of used tap water compared to the total tap water supply?
Which potentials for reduction of environmental impacts exist in these areas of private water
consumption?
The LCA study for water is following most of the basic rules laid down in ISO 14040ff [10]. But
there are some deviations from this standard, especially the use of a single score weighting for the
impact assessment.
2. System boundaries
2.1. Comparison of tap water with mineral water and other beverages
The LCA investigates a range of different scenarios for the provision of tap water, mineral water
and other beverages for drinking. The basis of this comparison is the functional unit of 1 kg of
beverage available to consumers. For the definition of this functional unit only the provision of liquid,
stilling ones thirst, has been taken as a necessity for the investigation. Beverages can supply many
more functions, e.g. provision of further nutrients such as fats, proteins, vitamins etc. which are
necessary for nutrition. They can therefore partly replace other food items like fruits ore meat. Some
beverages such as coffee, wine or beer are also drunk for pleasure and thus fulfil an additional function
besides nutrition. Thus, there might be further functions delivered by a beverage which are not
addressed with the functional unit investigated in this study.
In this study, the entire life cycle of the beverage is traced from water catchment/extraction to
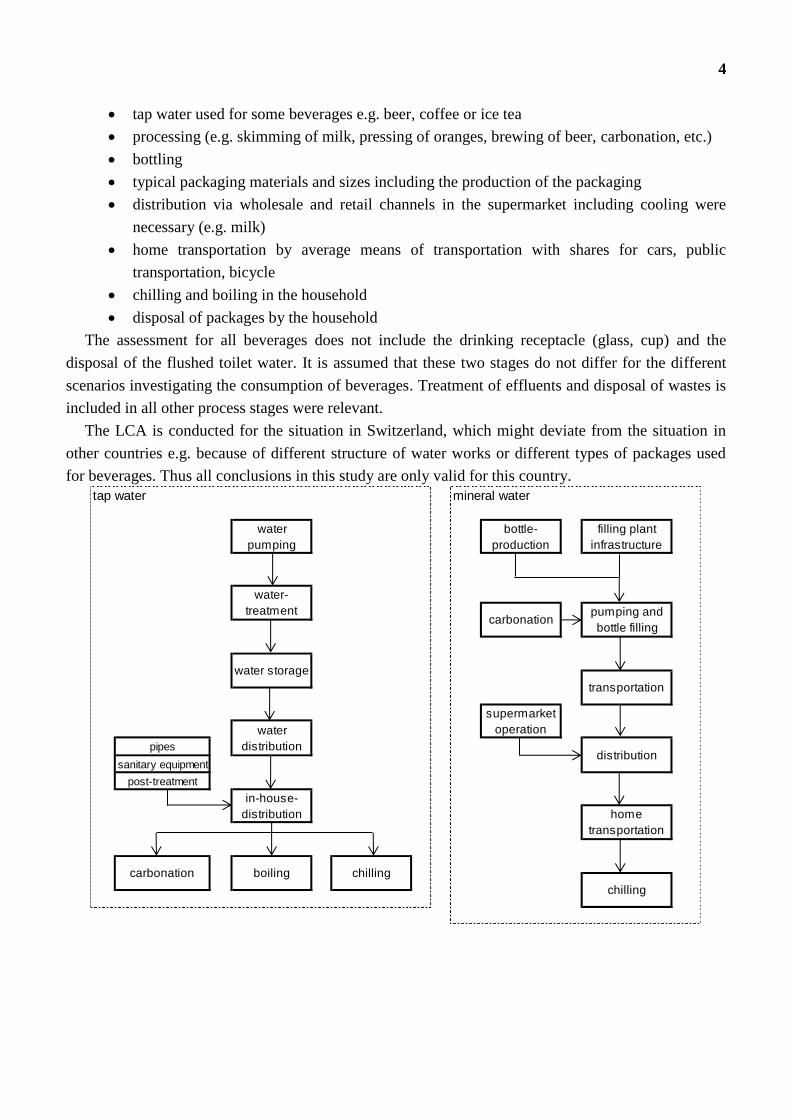
serving it in a glass. Figure 1 shows a simplified flow charts for the main process stages involved in
the supply of tap and mineral water. The life cycle of tap water as a beverage includes:
water pumping during catchment and extraction
treatment at the water works including chemicals used and necessary infrastructure
central water storage
distribution to the household via water pipes including the necessary infrastructure and
energy use
post-treatment of tap water at the consumption site (further purification in the house before
the water reaches the tap)
sanitary equipment, plumbing and house installations
in some scenarios refrigeration, soda maker, boiling to make tea and coffee)
pre-flow of tap water and treatment of this part of tap water that is not drunken in an effluent
treatment plant
The life cycle of mineral water and other beverage includes
production of agricultural raw materials like oranges, grapes, raw milk
water catchment for mineral water
4
tap water used for some beverages e.g. beer, coffee or ice tea
processing (e.g. skimming of milk, pressing of oranges, brewing of beer, carbonation, etc.)
bottling
typical packaging materials and sizes including the production of the packaging
distribution via wholesale and retail channels in the supermarket including cooling were
necessary (e.g. milk)
home transportation by average means of transportation with shares for cars, public
transportation, bicycle
chilling and boiling in the household
disposal of packages by the household
The assessment for all beverages does not include the drinking receptacle (glass, cup) and the
disposal of the flushed toilet water. It is assumed that these two stages do not differ for the different
scenarios investigating the consumption of beverages. Treatment of effluents and disposal of wastes is
included in all other process stages were relevant.
The LCA is conducted for the situation in Switzerland, which might deviate from the situation in
other countries e.g. because of different structure of water works or different types of packages used
for beverages. Thus all conclusions in this study are only valid for this country.
tap water mineral water
pipes
sanitary equipment
post-treatment
chilling
water
distribution
transportation
supermarket
operation
carbonation boiling chilling
home
transportation
in-house-
distribution
distribution
water-
treatment pumping and
bottle filling
water
pumping
water storage
bottle-
production
filling plant
infrastructure
carbonation

5
Figure 1. Overview on life cycle stages investigated for tap water and mineral water
2.2. Analysis of tap water in a broader context
In the analysis of tap water in a broader context some more issues are considered. One scenario
evaluates the typical energy use for providing warm water in the household. Another scenario
investigates the total impacts due to the treatment of polluted water from household. Furthermore it is
evaluated which reduction potentials exist due to consumer choices e.g. for drinking tap instead of
mineral water or using less warm water.
3. Life cycle inventory data
In the main study, life cycle inventory data is collected on material and energy flows for all
essential process steps. All foreground data investigated for this study are documented in the
background report [7] which is not published. All life cycle inventory data used for the assessments in
this article are available with the ESU data-on-demand database [11] and with publicly available
background data [12-14]. In the following sub-chapters the key assumptions are reported.
Background data
As to including background processes in the LCA, e.g. sewage disposal, packaging materials,
transportation and construction materials, data is taken from the ecoinvent database v2.2 and updates
publicly available [12-14]. Calculations for the LCA are made with the SimaPro software [15].
Foreground data for tap water supply
The following areas were taken as examples for tap water supply: an urban area (the city of Zurich
(ZH)) and a rural area (Seeländische Wasserversorgung (SWG), a regional water supply facility
located in the Canton of Bern). Furthermore the average supply in Switzerland (CH) is investigated.
Data have been provided by these organizations and the SVGW.
Scenarios for tap water as a beverage
A series of scenarios were analyzed for the use of tap water as a beverage (Table 1). This always
includes some losses with first running of tap water e.g. because of waiting for cooler or fresher water
and for cleaning the containers. Scenarios 1 to 5 examine the impacts of consumer behavior (cooling in
a refrigerator or water dispenser, soda maker) as based on the Swiss water supply. Various water
supplies are compared with each another in scenarios 1, 6, 7. In scenario 8, boiled water is
investigated. Scenario 9 considers warm water with 40°C used e.g. for hand washing and mixed from
hot and cold water at the tap. Scenario 10 considers the delivery of water from the tap without the first
running.

6
Table 1. Scenarios investigated for the provision of tap water as a beverage
Scenarios for mineral water as a beverage
The consumption of bottled mineral water is examined using the following scenarios: production in
Switzerland (CH) and imported from several different countries, 1.5-litre PET bottles, 1-litre glass
returnable bottles and gallons accommodating 18.9 litres, carbonated or non-carbonated, refrigerated
or unrefrigerated. These distinguishing features were used to create the scenarios shown in Table 2.
They cover the possible spectrum between minimum and maximum values without taking into
consideration every product available in a Swiss supermarket.
For bottled water in gallons, a distribution distance by van of 10 km to the consumer is assumed.
The water is served via a water dispenser and might be drunk e.g. in office buildings. Scenario 13
models a minimum situation with local mineral water consumed directly after purchase in the shop
(and thus no home transportation).
The data for pumping, filling and carbonization of mineral water is based on various environmental
reports [16-23]. The LCA of packages is based on ecoinvent background data and literature [24-27].
For transporting mineral water to a shop in Berne (Switzerland), real transport distances for different
well-known brands and origins have been investigated. The home transport is modelled with average
data for purchasing in Switzerland considering the share and distance of common transport modes. The
disposal of packages is assessed with standard scenarios. Packages which are not recycled are normally
incinerated in Switzerland. According to the cut-off approach used in ecoinvent the recycling of
packages (e.g. PET or glass bottles) is not considered as an environmental burden or benefit. In some
scenarios also refillable bottles or containers are considered. In these cases the washing prior to refill is
considered in the life cycle inventory analysis.
Scenario 1 Scenario 2 Scenario 3 Scenario 4 Scenario 5 Scenario 6 Scenario 7 Scenario 8 Scenario 9 Scenario 10
TW, at tap, CHTW, chilled,
at tap
TW,
carbonated,
chilled, at
soda device
TW,
carbonated,
at soda
device
TW, chilled, at
water
dispenser
TW, at tap,
SWGTW, at tap, ZH
TW, boiling,
at boiler
TW, 40°C, at
tap
TW, direct at
tap
Region CH CH CH CH CH SWG ZH CH CH CH
Provision tap tap soda device soda device water dispenser tap tap boiler tap tap
Carbonation still still carbonated carbonated still still still still still still
First running no yes yes yes no no no no no no
Temperature unchilled chilled chilled unchilled chilled unchilled unchilled boiling 40°C unchilled

7
Table 2. Scenarios investigated for the provision of mineral water as a beverage
RE Returnable bottle
MW Mineral water
NON-RE Non-returnable bottle
CH Switzerland
DE Germany
FJ Fiji
FR France
IT Italy
Background data for other beverages
The life cycle inventory analysis (LCI) for other beverages such as milk, orange juice, apple juice,
beer, ice tea, black tea, coffee and wine is taken from the ESU data-on-demand database [11, 28-31].
The LCI includes the life stages as described in chapter 2.1. For milk, juices, beer and ice tea chilled
scenarios are used. For all beverages, assumptions equivalent to those for mineral water are used
concerning chilling and home transportation.
4. Impact assessment
Within this article, the environmental impacts are assessed according to the ecological scarcity
method 2013. This method evaluates the inventory results on a distance to target principle. The
calculation of the eco-factors is based on one hand on the actual emissions (actual flow) and on the
other hand on Swiss environmental policy and legislation goals (critical flows). The weighting is
therefore based on the Swiss environmental policy goals, whereby global and local impact categories
are normalized to Swiss conditions. Final results of the impact assessment are presented in eco-points
[32].
In addition to this, the total results of all scenarios are separately presented according to the global
warming potential [33]. It has to be noted that presenting comparative LCA results with such a full
Scenario 1 Scenario 2 Scenario 3 Scenario 4 Scenario 5 Scenario 6 Scenario 7
MW, glass-RE,
at restaurantMW, PET
MW, gallon,
at office
MW, PET,
carbonated
MW, PET,
chilled
MW, PET,
carbonated,
chilled
MW, chilled,
gallon, at
office
Production CH CH CH CH CH CH CH
Transport truck [km] 162 162 162 162 162 162 162
Transport train [km] 42 42 42 42 42 42 42
Transport Schiff [km] 0 0 0 0 0 0 0
Distribution [km] 10 home transport 10 home transport home transport home transport 10
Carbonation still still still carbonated still carbonated still
Temperature unchilled unchilled unchilled unchilled chilled chilled chilled
Packaging Glass-RE PET-NON-RE container PET-NON-RE PET-NON-RE PET-NON-RE container
Scenario 8 Scenario 9 Scenario 10 Scenario 11 Scenario 12 Scenario 13
MW,
production mix
CH
MW, PET,
Production FR
MW, PET,
Production IT
MW, PET,
Production
GB
MW, PET,
Production FJ
MW, PET, at
shop
Production mix FR IT UK FJ CH
Transport truck [km] 373 325 547 1204 510 50
Transport train [km] 45 0 130 0 0 0
Transport Schiff [km] 102 0 0 0 20330 0
Distribution [km] home transport home transport home transport home transport home transport none
Carbonation Mix still still still still still
Temperature unchilled unchilled unchilled unchilled unchilled unchilled
Packaging PET/Glass PET-NON-RE PET-NON-RE PET-NON-RE PET-NON-RE PET-NON-RE
8
weighting of different types of environmental impacts is not allowed according to ISO 14040 [10, 34]
but it is very common in Switzerland. Therefore it is also recommended for communicating LCA
results to consumers [35]. In the figures presented in this article, the total results with the ecological
scarcity method are split showing the contribution of single indicator. Therefore also the importance of
single indicators like the global warming potential can be estimated and compared to each other.
Within the detailed study [7], the results are also presented and discussed according to the
cumulative energy demand [33, 36].
4.1. Share of life cycle stages
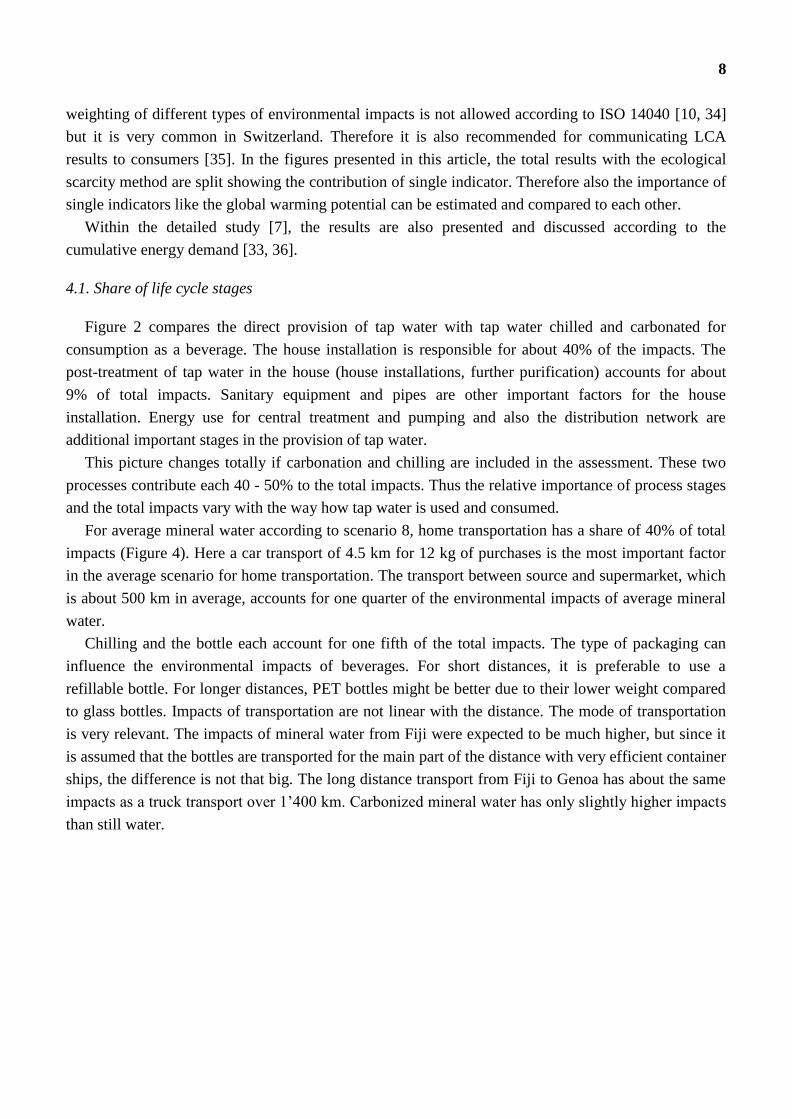
Figure 2 compares the direct provision of tap water with tap water chilled and carbonated for
consumption as a beverage. The house installation is responsible for about 40% of the impacts. The
post-treatment of tap water in the house (house installations, further purification) accounts for about
9% of total impacts. Sanitary equipment and pipes are other important factors for the house
installation. Energy use for central treatment and pumping and also the distribution network are
additional important stages in the provision of tap water.
This picture changes totally if carbonation and chilling are included in the assessment. These two
processes contribute each 40 - 50% to the total impacts. Thus the relative importance of process stages
and the total impacts vary with the way how tap water is used and consumed.
For average mineral water according to scenario 8, home transportation has a share of 40% of total
impacts (Figure 4). Here a car transport of 4.5 km for 12 kg of purchases is the most important factor
in the average scenario for home transportation. The transport between source and supermarket, which
is about 500 km in average, accounts for one quarter of the environmental impacts of average mineral
water.
Chilling and the bottle each account for one fifth of the total impacts. The type of packaging can
influence the environmental impacts of beverages. For short distances, it is preferable to use a
refillable bottle. For longer distances, PET bottles might be better due to their lower weight compared
to glass bottles. Impacts of transportation are not linear with the distance. The mode of transportation
is very relevant. The impacts of mineral water from Fiji were expected to be much higher, but since it
is assumed that the bottles are transported for the main part of the distance with very efficient container
ships, the difference is not that big. The long distance transport from Fiji to Genoa has about the same
impacts as a truck transport over 1’400 km. Carbonized mineral water has only slightly higher impacts
than still water.

9
Figure 2. Share of process stages in the provision of tap water for total environmental
impacts according to the ecological scarcity method 2013
4.2. Comparison of tap water supplies
Figure 3 compares some scenarios for tap water. The description starts at the bottom. The first 3
scenarios for ZH, CH, SWG compare the provision of tap water in different supply areas and only
including the public supply network. Impacts between different tap water suppliers in Switzerland
differ. A relevant factor is the length of the distribution network and differences in the electricity
consumption. Impacts at the provider SWG are slightly higher as this it supplies a rural area with a
higher demand for infrastructure than the supply in the city of Zurich.
The scenario “tap water, direct at tap” includes the in-house infrastructure and post treatment as
evaluated in Figure 2. The rise of impacts compared to tap water at house is due to the inclusion of in-
house distribution. The upper 3 scenarios compare the provision of tap water as a beverage and have
higher impacts due to the assumed pre-flow of tap water before filling it in the glass.

10
Figure 3. Comparison of different scenarios for tap water with the ecological scarcity
method 2013 (ZH – Zürich, CH – Switzerland, SWG – Seeländische
Wasserversorgung, TW – tap water). The impact categories with highest values are in
bold.
4.3. Comparison of carbonized water
The comparison of carbonized beverages in Figure 3 shows clear advantages for the use of soda
devices to carbonize tap water compared to the purchase of carbonated mineral water. The main
aspects for mineral water are transports and bottles. This is also visible in Figure 3, were the air
emissions of trucks cause considerable impacts in the areas of global warming and main air pollutants.
A prerequisite for the reduction of environmental impacts with a soda device is its usage frequency.
Here it was calculated with 2 litres per day and a life time of the device of 5 years. It the device is used
less frequently, the impacts would be higher.

11
Figure 3. Comparison of different scenarios for the provision of carbonized water
with the ecological scarcity method 2013 (MW – mineral water, TW – tap water). The
impact categories with highest values are in bold.
4.3. Comparison of still beverages
Tap water is also the most environmentally friendly option even if it is compared with a range of
different still beverages (Figure 4).
The average mineral water causes impacts that are about 450 times higher than the impacts of Swiss
tap water. Environmental impacts of tap water without carbonation are remarkable lower compared to
the carbonized version. For mineral water, there is not a large difference between the still and
carbonized option.
Most other beverages cause higher impacts than the mineral water. Black tea prepared from boiling
tap water is an option with impacts between tap and mineral water. Coffee has considerable higher
impacts per litre than tea due to the higher impacts in its agricultural production and the necessary
processing. For all beverages produced from agricultural raw materials, the impacts are higher than for
mineral water since impacts from agriculture have to be added to those of packaging and
transportation. The highest impacts have been found for red wine (more than 9500 eco-points per kg).
This is mainly due to the use of copper and pesticides in the grape production.
It has to be kept in mind that the beverages compared here can fulfil sometimes additional
functions. While tap and mineral water mainly satisfy the thirst, other options might also provide
nutritional value (e.g. vitamins in fruit juice or proteins in milk). Alcoholic beverages are rather used
for pleasure.

12
Figure 4. Comparison of different scenarios for the provision of still beverages with
the ecological scarcity method 2013. The impact categories with highest values are in
bold. Red wine out of scale (about 9500 eco-points).
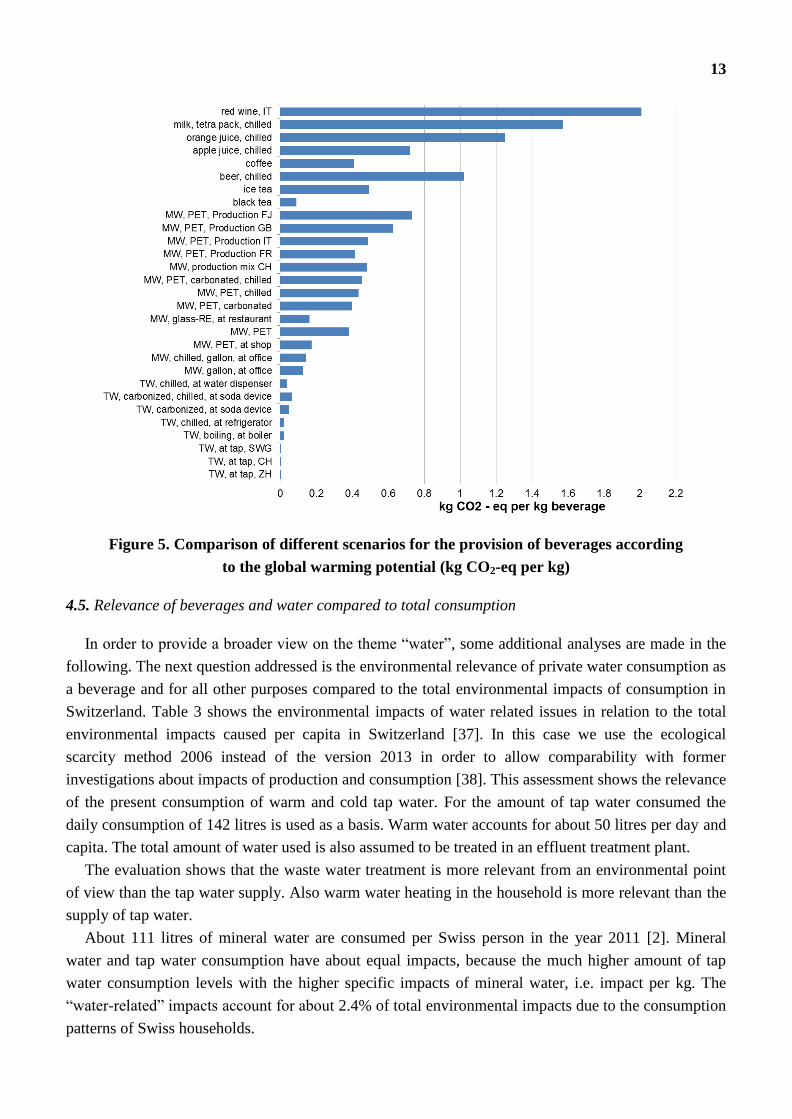
4.4. Comparison of beverages according to global warming potential
In Figure 5 the results of the different water and beverage scenarios are revealed according to the
global warming potential. Therefore it can be shown that there are no significant changes in the result
according to this impact assessment method except for the result of coffee. Different from the other
scenarios, the total environmental impact of coffee is highly influenced by the heavy metal emissions
in the cultivation stage. Since this is not reflected by the global warming potential, its result for coffee
is notably lower in comparison to other options.
13
Figure 5. Comparison of different scenarios for the provision of beverages according
to the global warming potential (kg CO2-eq per kg)
4.5. Relevance of beverages and water compared to total consumption
In order to provide a broader view on the theme “water”, some additional analyses are made in the
following. The next question addressed is the environmental relevance of private water consumption as
a beverage and for all other purposes compared to the total environmental impacts of consumption in
Switzerland. Table 3 shows the environmental impacts of water related issues in relation to the total
environmental impacts caused per capita in Switzerland [37]. In this case we use the ecological
scarcity method 2006 instead of the version 2013 in order to allow comparability with former
investigations about impacts of production and consumption [38]. This assessment shows the relevance
of the present consumption of warm and cold tap water. For the amount of tap water consumed the
daily consumption of 142 litres is used as a basis. Warm water accounts for about 50 litres per day and
capita. The total amount of water used is also assumed to be treated in an effluent treatment plant.
The evaluation shows that the waste water treatment is more relevant from an environmental point
of view than the tap water supply. Also warm water heating in the household is more relevant than the
supply of tap water.
About 111 litres of mineral water are consumed per Swiss person in the year 2011 [2]. Mineral
water and tap water consumption have about equal impacts, because the much higher amount of tap
water consumption levels with the higher specific impacts of mineral water, i.e. impact per kg. The
“water-related” impacts account for about 2.4% of total environmental impacts due to the consumption
patterns of Swiss households.

14
It has to be noted that Table 3 (and Table 4) only consider the central warm water supply, but not
cooking of water e.g. for tea, coffee or meals nor heating of rooms. Also heating of water in washing
machines and dish washers is not yet included in this assessment. Taking this into account, impacts of
tap water heating would even be higher than assumed here.
Table 3. Relevance of water related impacts compared to total environmental impacts
of consumption in Switzerland. Eco-points 2006 for the present situation, share of
eco-points and amounts of water consumed.
4.6. Reduction potentials
The annual environmental impacts due to the use of tap and mineral water are shown in Table 4
together with possible reduction potentials. The methodology for calculating the reduction potentials
has been developed by ESU-services for different projects [39, 40]. The highest reduction potential
could be achieved by a 25% reduction of the tap water consumption using e.g. water saving
installations and appliances. By doing so, the total environmental impacts in Switzerland could be
reduced by 0.5%. Drinking tap water instead of mineral water would reduce the total impacts by about
0.3%. A reduction of the warm water consumption by 25% (replaced by cold water) could potentially
reduce the total impacts by 0.4%. Adding these different options would lead to a potential reduction of
1.1% of total environmental impacts per person (or 47% of the water related impacts).
Table 4. Reduction potentials of different behavioral changes related to water
consumption
4.7. Comparison to previous study
Comparing the results of the updated study with the first version published in 2006 [6] shows
generally higher results for tap water and mineral water. This is not caused by an increase of certain
energy or material uses in the life cycle but mainly due to a more complete investigation of
environmental impacts. For tap water, the installations in the house have been investigated in more
eco-points 2006 per person and year
present
situationshare
amount
(litre/a)
tap water use 40'128 0.2% 51'830
water heating 174'648 0.9% 17'276
waste water treatment 201'243 1.0% 51'830
consumption of mineral water 63'053 0.3% 111
total impacts related to water 479'072 2.4% -
total impacts of consumption 20'000'000 100% -
eco-points 2006 per person and yearpresent
situationsaving water
tap instead of
mineral water
cold instead
of warm
water
combination
of options
In relation to the impacts related to water 479'072 -20% -13% -18% -47%
In relation to total environmental impacts 20'000'000 -0.48% -0.31% -0.44% -1.12%
15
detail. For mineral water, the study shows that the home transportation is a quite relevant factor which
so far has not been considered sufficiently in the previous study. Thus the higher impacts compared to
the former study are not an indicator for a worse situation.
5. Conclusions
In this article we evaluated the environmental impacts of water in a broad context. Therefore we
investigated its use as beverage, but also evaluated the importance of the total tap and mineral water
consumption, heating for warm water in households and treatment of used tap water.
Tap water is the most environmentally friendly beverage if compared for the function of stilling
ones thirst. Unchilled and still mineral water causes about 450-times the environmental impacts of
drinking tap water. Cooling and carbonation increases the environmental impacts of tap water
considerable, but still it causes less impacts than the comparable mineral water options bought in a
shop. Thus carbonation in a soda device is the recommended option if the consumers like this type of
water more. For such positive results the device should be used frequently (at least for 1 kg a day) and
over a reasonable period (more than five years) in order to pay-back the environmental investment for
its production.
The origin and thus transports are more relevant than the packaging of mineral water. Thus, mineral
water coming from nearby is preferable compared to mineral water transported over longer distances.
Refillable bottles and containers only make sense if they are not transported over long distances.
Bringing purchased beverages home can be very relevant if a car is used for transportation.
The agricultural production of raw materials is often the main impact for other beverages such as
milk, fruit juice or wine. These impacts have to be added to the impacts of packaging and
transportation and therefore these options have higher impacts than tap and mineral water. But they
serve often also further function such as nutrients or pleasure.
The consumption of tap and mineral water is responsible for only a very small share of total impacts
due to Swiss final consumption. Thus, a replacement of mineral water with tap water or reducing the
use of tap water would only slightly decrease the total environmental impacts caused by Swiss
inhabitants. But, food and beverages often lead to discussions about general environmental aspects and
can raise interest in environmental issues. The recommendations for shorter transport distances, less
use of private cars or efficient cooling are valid for all types of food purchases and not only relevant
for the consumption of water.
Considering the general water use at home, a very relevant aspect is the heating of warm water in
households. A reduction of the used warm water (e.g. taking a shower instead of a full bath, lower
temperatures for washing and hand washing with cold water) can reduce the environmental impacts
much more than a reduction of the cold water use.
For the operators of water supply networks and for house owners the following recommendations
can be derived from this study. The infrastructure and especially the distribution network are quite
relevant for the water supply. Installations in the consumer’s house also have a remarkable share of the
total impacts due to tap water supply. Thus, environmentally friendly materials and processes should
be used during construction and maintenance of this infrastructure. Further important issues are the
electricity use for pumping and the loss of water. Losses of water increase the impacts per m3 of water

16
sold. Internal use e.g. for public water sources are counted as losses in this study. This makes it
difficult to directly compare the different water suppliers investigated in this study.
The system boundaries of this study are only valid for Switzerland. The situation in other countries
might be quite different. Thus, e.g. the impacts form electricity use and the necessary pumping energy
for tap water differs between different countries. The distance between the water source and the
consumer can be different. Also systems used for beverage bottles are not the same. In Germany, e.g.,
a refill system for PET-bottles is common while this is not known in Switzerland.
Acknowledgments
Various parties supported us with data and information for the study. Therefore we would like to
thank the following people:
• Paul Sicher, Schweizerischer Verein des Gas- und Wasserfachs SVGW
• Matthias Freiburghaus, Schweizerischer Verein des Gas- und Wasserfachs SVGW
• Adrian Rieder, Wasserversorgung Zürich WVZ
• Martin Rotter, Wasserversorgung Zürich WVZ
• Roman Wiget, Seeländische Wasserversorgung SWG
• Urs Jäger, Soda Fresh Schweiz AG
Author Contributions
Niels Jungbluth drafted the first version of this paper and has the overall responsibility for the
research project. Alex König elaborated many parts of the full LCA and helped for the revision of the
paper. Regula Keller gave feedback in different stages of this study and the preparation of the paper.
Conflicts of Interest
The authors declare no conflict of interest.
References and Notes
1. SVGW, Statistische Erhebungen der Wasserversorgungen in der Schweiz zum Betriebsjahr
2012. 2013, Schweizerischer Verein des Gas- und Wasserfaches: Zürich.
2. SVGW, Der Trinkwasserkonsum in der Schweiz. 2013, Schweizer Verein des Gas- und
Wasserfaches: Zürich. p. 2.
3. Crettaz P, Jolliet O, Cuanillon J-M, & Orlando S, Analyse du cycle de l'eau et récupération de
l'eau pluviale. 1998, Ecole polytechnique fédérale de Lausanne, Laboratoire de Gestion des
Ecosystèmes (GECOS), Groupe du Développement Durable: Lausanne, CH.
4. Jolliet O, Bronchi V, Crettaz P, & Lopes P-M, Analyse du cycle de l’eau et récupération de
l’eau pluie. 2000, Rapport final du projet cycleaupe, Ecole polytechnique fédérale de
Lausanne, Laboratoire de Gestion des Ecosystèmes (GECOS), Groupe du Développement
Durable: Lausanne, CH.
5. Jungbluth N & Faist Emmenegger M, Ökobilanz Trinkwasser - Mineralwasser. 2005, ESU-
services Gmbh im Auftrag des Schweizerischer Verein des Gas- und Wasserfaches SVGW.
6. Jungbluth N, Comparison of the Environmental Impact of Drinking Water vs. Bottled Mineral
Water. 2006, ESU-services Ltd. Retrieved from www.esu-services.ch/projects/lcafood/water/.
17
7. Jungbluth N & König A, Ökobilanz Trinkwasser: Analyse und Vergleich mit Mineralwasser
sowie anderen Getränken. 2014, ESU-services Gmbh im Auftrag des Schweizerischer Verein
des Gas- und Wasserfaches SVGW: Zürich. p. 90.
8. Fantin V, Scalbi S, Ottaviano G, & Masoni P, A method of improving reliability and relevance
of LCA reviews: The case of life-cycle greenhouse gas emissions of tap and bottled water.
Science of the Total Environment, 2014: p. 228-241.
9. Del Borghi A, Strazza C, Gallo M, Messineo S, et al., Water supply and sustainability: life
cycle assessment of water collection, treatment and distribution service. Int J LCA, 2012.
10. International Organization for Standardization (ISO), Environmental management - Life cycle
assessment - Principles and framework. 2006, ISO 14040:2006; Second Edition 2006-06:
Geneva.
11. Jungbluth N, Keller R, König A, Doublet G, et al., Life cycle inventory database on demand:
EcoSpold LCI database of ESU-services. 2015, ESU-services Ltd.: Zürich, CH. Retrieved from
www.esu-services.ch/data/data-on-demand/.
12. ecoinvent Centre, ecoinvent data v2.2, ecoinvent reports No. 1-25. 2010, CD-ROM, Swiss
Centre for Life Cycle Inventories: Duebendorf, Switzerland. Retrieved from
www.ecoinvent.org.
13. LC-inventories, Corrections, updates and extensions of ecoinvent data v2.2. 2015, BAFU.
Retrieved from www.lc-inventories.ch.
14. ESU, The ESU database 2015. 2015, ESU-services Ltd. Retrieved from www.esu-
services.ch/data/database/.
15. PRé Consultants, SimaPro 8.0.4. 2014, PRé Consultants: Amersfoort, NL. www.simapro.ch.
16. Brau und Brunnen, Umweltbericht 2002. 2003.
17. Apollinaris, Aktualisierung der Umwelterklärung. 2004, Appolinaris & Schweppes GmbH: Bad
Neuenahr.
18. Siegsdorfer Petrusquelle, Umwelterklärung 2000. 2000, Umwelterklärung: Siegsdorf,
Deutschland. Retrieved from www.petrusquelle.de.
19. Gerolsteiner, Umweltbericht 2003 der Gerolsteiner Brunnen GmbH & Co. KG. 2003.
20. Gerolsteiner, Umweltbericht 2011 der Gerolsteiner Brunnen GmbH & Co. KG. 2011.
21. Benedetto S, Environmental Product Declaration Acqua Minerale Naturale Oligominerale San
Benedetto. 2012.
22. Cerelia, Environmental Product Declaration of Cerelia Natural Mineral Water 2013.
23. Ferrarelle, Environmental Product Declaration of Ferrarelle Mineral Water. 2013.
24. Plinke E, Schonert M, Meckel H, Detzel A, et al., Ökobilanz für Getränkeverpackungen II.
2000, Texte, 37/00, Umweltbundesamt: Berlin. Retrieved from www.umweltbundesamt.de/uba-
info-daten/daten/bil.htm.
25. Detzel A, Giegrich J, Krüger M, Möhler S, et al., Ökobilanz für PET-Einwegsysteme unter
Berücksichtigung der Sekundärprodukte. 2004, IFEU GmbH for PETCORE, Brüssel:
Heidelberg, DE.
26. Plinke E, Schonert M, Schorb A, Meyer U, et al., Ökobilanz für die leichte PET-
Mehrwegflasche. 1999, Prognos, Basel, CH und IFEU GmbH for Gerolsteiner Brunnen:
Heidelberg, DE.
27. Wagner K, Einweg- und Mehrweg-Verpackungen für karbonisierte Getränke im ökologischen
Vergleich ("EW-MW-Studie"). 2003, Wagner & Partner SA: Montreux.
28. Büsser S & Jungbluth N, The role of flexible packaging in the life cycle of coffee and butter.
Int. J. LCA, 2009. 14(Supplement 1): p. 80-91.
www.springerlink.com/content/lq36370821267713/, DOI: 10.1007/s11367-008-0056-2.
29. Doublet G & Jungbluth N, Life cycle assessment of drinking Darjeeling tea: Conventional and
organic Darjeeling tea. 2010, ESU-services Ltd.: Uster, CH. www.esu-
services.ch/publications/food/.
18
30. Doublet G, Jungbluth N, Flury K, Stucki M, et al., Life cycle assessment of orange juice. 2013,
SENSE - Harmonised Environmental Sustainability in the European food and drink chain,
Seventh Framework Programme: Project no. 288974. Funded by EC. Deliverable D 2.1 ESU-
services Ltd.: Zürich. Retrieved from www.esu-services.ch/projects/lcafood/sense/.
31. Jungbluth N, Flury K, & Doublet G, Umweltsünde Weinbau? Ökobilanz eines Genussmittels, in
Wädenswiler Weintage 2013. 2013, ZHAW - Zürcher Hochschule für angewandte
Wissenschaften. www.esu-services.ch/de/projekte/lcafood/getraenke/.
32. Frischknecht R, Büsser Knöpfel S, Flury K, & Stucki M, Ökofaktoren Schweiz 2013 gemäss der
Methode der ökologischen Knappheit: Methodische Grundlagen und Anwendung auf die
Schweiz. 2013, Umwelt-Wissen Nr. 1330, treeze und ESU-services GmbH im Auftrag des
Bundesamt für Umwelt (BAFU): Bern. Retrieved from www.bafu.admin.ch/uw-1330-d.
33. IPCC, The IPCC fourth Assessment Report. 2007, Cambridge University Press.: Cambridge.
34. International Organization for Standardization (ISO), Environmental management - Life cycle
assessment - Requirements and guidelines. 2006, ISO 14044:2006; First edition 2006-07-01:
Geneva.
35. Jungbluth N, Büsser S, Frischknecht R, Flury K, et al., Feasibility of environmental product
information based on life cycle thinking and recommendations for Switzerland. Journal of
Cleaner Production, 2012. 28(June 2012): p. 187–197. www.esu-
services.ch/publications/methodology/.
36. Frischknecht R, Jungbluth N, Althaus H-J, Bauer C, et al., Implementation of Life Cycle Impact
Assessment Methods. 2007, CD-ROM, ecoinvent report No. 3, v2.0, Swiss Centre for Life Cycle
Inventories: Dübendorf, CH. Retrieved from www.esu-services.ch/data/ecoinvent/.
37. Jungbluth N, Nathani C, Stucki M, & Leuenberger M, Environmental impacts of Swiss
consumption and production: a combination of input-output analysis with life cycle assessment.
2011, Environmental studies no. 1111, ESU-services Ltd. & Rütter+Partner, commissioned by
the Swiss Federal Office for the Environment (FOEN): Bern, CH. p. 171. Retrieved from
www.esu-services.ch/projects/ioa/ or www.umwelt-schweiz.ch.
38. Frischknecht R, Steiner R, & Jungbluth N, The Ecological Scarcity Method - Eco-Factors
2006: A method for impact assessment in LCA. 2009, Federal Office for the Environment
FOEN: Zürich und Bern. Retrieved from
www.bafu.admin.ch/publikationen/publikation/01031/index.html?lang=en.
39. Jungbluth N, Itten R, & Stucki M, Umweltbelastungen des privaten Konsums und
Reduktionspotenziale. 2012, ESU-services Ltd. im Auftrag des BAFU: Uster, CH. Retrieved
from www.esu-services.ch/projects/lifestyle/.
40. Jungbluth N, Flury K, & Doublet G. Environmental impacts of food consumption and its
reduction potentials. in 6th International Conference on Life Cycle Management. 2013,
Gothenburg. Retrieved from www.esu-services.ch/publications/.