life cycle assessment of resource effectiveness in a
TRANSCRIPT

Life Cycle Assessment of Resource
Effectiveness in a Business Ecosystem
of Heavy-Duty Truck Tires
Simon Andersson, IVL Derek L. Diener, RISE Sustainable Business
Abstract Is tire retreading worth it from an environmental perspective? Could sensors be used to
increase resource productivity of heavy-duty truck tires? This report explores these questions

Abstract This study aims at assessing the environmental impacts related to heavy-duty (truck) tyres. Results
shall inform stakeholders on benefits (or impacts) related to four main outcomes (or combinations
thereof): (1) retreading and reuse, (2) recycling (of carbon black), (3) maintaining continuous tyre
pressure and extending tyre use life, something that may be possible with enhanced monitoring, e.g.
with use of sensors, and (4) use of shredded tyres in playing surfaces.
This report includes three main works. First, a literature review is presented. Next, a life cycle
assessment conducted focused on the first three outcomes (retread, recycle, tyre pressure) is
presented. Then, an assessment of the toxicity related to the fourth outcome, use of shredded tyres,
is presented. Finally, results are considered together to garner final thoughts and recommendations.

Contents Abstract ................................................................................................................................................... 1
Introduction ............................................................................................................................................. 3
Background: Literature review ................................................................................................................ 3
Life cycle assessment .............................................................................................................................. 9
Goal ..................................................................................................................................................... 9
Scope ................................................................................................................................................. 10
The tyre product system ............................................................................................................... 10
System boundaries ........................................................................................................................ 10
End-of-life methodology ............................................................................................................... 10
Impact categories .......................................................................................................................... 11
Data quality requirements and sources of data ............................................................................ 11
Limitations of the study ................................................................................................................. 11
Life cycle inventory analysis .............................................................................................................. 12
Raw material production ............................................................................................................... 12
Tyre production ............................................................................................................................. 13
Usage ............................................................................................................................................. 13
Tread production ........................................................................................................................... 15
Retreading ..................................................................................................................................... 15
Tyre recycling ................................................................................................................................. 15
Transports...................................................................................................................................... 18
Results ............................................................................................................................................... 18
Retreading ..................................................................................................................................... 18
Use of sensors ............................................................................................................................... 24
Breakdown of tyre production and retreading results ................................................................. 25
Recycling results ............................................................................................................................ 26
Toxicity ............................................................................................... Fel! Bokmärket är inte definierat.
Discussion: Method considerations ...................................................................................................... 27
Conclusions/recommendations ............................................................................................................ 28
References ............................................................................................................................................. 28
Tyre LCI .............................................................................................................................................. 30
Appendix 2 – Transport distances ......................................................................................................... 32
Introduction
This study aims at assessing the environmental impacts related to heavy-duty (truck) tyres. Results
shall inform stakeholders on benefits (or impacts) related to four main outcomes (or combinations
thereof): (1) retreading and reuse, (2) recycling (of carbon black), (3) maintaining continuous tyre
pressure and extending tyre use life, something that may be possible with enhanced monitoring, e.g.
with use of sensors, and (4) use of shredded tyres in playing surfaces.
This report includes three main works. First, a literature review is presented. Next, a life cycle
assessment conducted focused on the first three outcomes (retread, recycle, tyre pressure) is
presented.
Background: Literature review This report summarizes previous LCA studies of manufacturing, retreading, and recycling of heavy-
duty tyres. The purpose of the literature review is:
1) to provide an overview of the current knowledge against which the LCA results produced
in this project can be compared,
2) to identify ‘hot spots’ in the LCA on heavy duty tyres that require attention during the
environmental modelling, and
3) to establish ‘correct’ ways of modelling retreading and recycling based on the available
literature.
Since the literature on retreading of heavy-duty tyres is scant, studies that addresses the
environmental impact of retreading car tyres are included in this literature review. Even then, not
many LCA studies on retreading versus the production of new tyres are available and data and
assumptions taken in these studies varies considerably (Gutowski et al., 2011). Retreading requires
new material and energy (Gutowski et al., 2011). On the other hand, retreading extends the lifespan
of the tyre, saving embedded energy (Boustani et al., 2010; van Beukering and Janssen, 2001) and
reducing the production energy demand for tyres (Boustani et al., 2010). The environmental impacts
of retreaded tyres along the various steps (manufacturing, usage, retreading, and recycling) are
assessed based on a literature review and the findings summarized in this report.
The manufacturing process
The environmental impact of extraction raw materials and manufacturing tyres depends largely on
the tyre specifications (van Beukering and Janssen, 2001). Besides relative large amounts of rubber
(natural and synthetic), synthetic elastomers, zinc oxide (a chemical additive), and carbon black are
used to produce tyres (van Beukering and Janssen, 2001). One kg of tyre consists of roughly 2/3
rubber and 1/3rd steel (GREET, 2017). Raw materials are mixed to create a rubber compound. Thick
slabs of rubbers are fed between a pair of rollers, called milling. The tyre compounds are then
extruded to create various components (e.g. tread, sidewall). The rubber is finally coated to increase
strength. The manufacturing of tyres requires around 11.7 MJ per produced kg of tyre (Amari et al.,
1999 cited in Boustani et al., 2010).
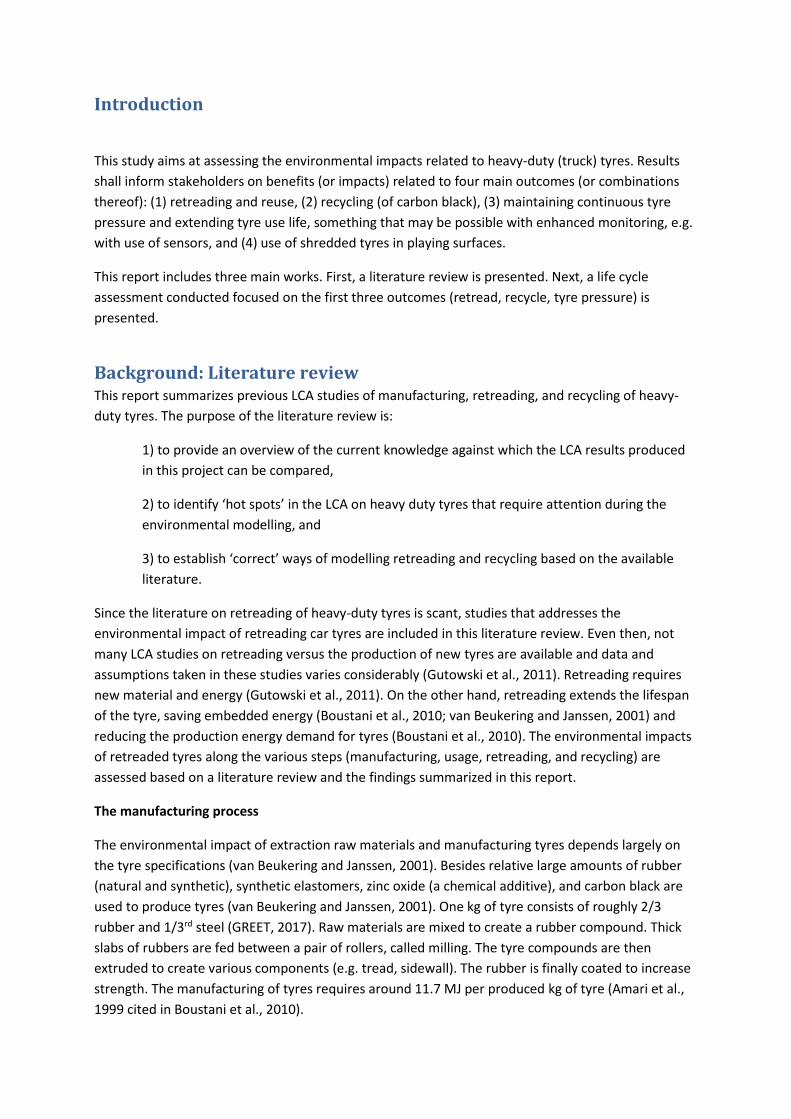
Table 1: Well-to-use emissions of a tyre (GREET, 2017).
The use phase
Most studies only look at the production process and assume that the tyres in the use phase lead to
equal emissions and can therefore be excluded. However, a few studies argue that the retreaded
tyres usually have a worse tyre rolling resistance leading to higher fuel consumption (Boustani et al.,
2010; Continental, 1999, Gutowski et al., 2011). The quality of the retreaded tyre varies significantly,
yet it is estimated that retreaded tyres have 7 to 9% increase in rolling resistance compared to new
tyres (Michelin, 2009 cited by Gutowski et al., 2011). Continental (1999) argues that the rolling
resistance of a retreaded car tyre is at least 3% higher than new car tyres (using the best
technologies) and is on average 10% higher. This higher rolling resistance and consequential higher
fuel consumption can (partly) offset the environmental benefits of retreading. Gutowski et al. (2011)
argue therefore that the results are inconclusive.
When including the impacts of the use phase, a significant share (95%) of the environmental impact
of tyres occur can be attributed to this phase, mainly due to fuel consumption to overcome tyre
rolling resistance (van Beukering and Janssen, 2001). According to the authors, monitoring tyre
pressure would therefore lead to the largest saving. Proper maintenance, in particular having the
right inflation pressure, positively impact the retreading success rate and will therefore have an
impact on the overall environmental impact (Boustani et al., 2010).
The retreading process
An environmental assessment of retreaded tyres should include the original manufacturing process
of the new tyre since changes in the design / manufacturing will have an effect on the scrap tyre that
will be used for retreading (Pehlken and Roy, 2006). Not all tyres can be retreaded and a selection
process is the first step of the retreading process. This also means that more tyres are transported to
the retreading facility than that are actually successfully retreaded. This transport of non-successfully
retreaded tyres should be included in the life cycle assessment (Pehlken and Roy, 2006).
Each tyre is first labelled and visually inspected. Tyres which does not show any defects are
transferred to rigorous testing using equipment to assess defects and damages that are not visible to
the eye, for example fluoroscopic x-rays, ultrasounds, or shearography (Boustani et al., 2010). Buffing
entails the removal of the old tread. The old tread is shaved off until the desired tyre radius, profile,
and crown width are reached. Another inspection of the saved casing is performed (Boustani et al.,

2010). In the new tread application step, new tread is aligned and centered to the casing. The applied
tread and casing are then wrapped around a rubber envelope and a vacuum is created (Boustani et
al., 2010). In hot retreading, a layer of unvulcanised rubber is combined with the buffed tyre and
vulcanized in a heating press, usually around 150 °𝐶 (Rafique, 2012). In cold retreading, a precured
tread is combined with the tyre and adhesive to paste the tread on the tyre. A temperature of
around 95 to 110 °𝐶 is normally used in the cold retreading process (Rafique, 2012). Final inspection
and preparation for shipping is the last step in the retreading process (Boustani et al., 2010).
Recycling
On a larger scale, retreading tyres will result in less tyres available for other applications such as
construction. Depending on the purpose of the LCA, these effects might have to be included in the
assessment. Tyres that are not retreaded are used in different applications. The process starts with
shredding to reduce the volume of the tyres with 75% (Rafique, 2012). Shredding requires 19.2 KWh
energy per 1000 Kg of waste tyres shredded (Ogilvie et al., 2004 cited in Rafique, 2012). Depending
on the size required (which differs for different applications), further shredding in smaller sizes might
be needed. Smaller sizes have a higher environmental benefit due to a larger possibility to substitute
virgin materials (Genan Business, 2009 cited by Pehlken et al., 2014).
Production of ground rubber from used tyres entails the following process steps (Li et al., 2014):
• Rubber powder preparation: pulverizing the tyres to a fine powder and removing steel from
the tyres.
• Devulcanization: to improve the plasticity of the rubber powder, pine tar and rosin are added
during the devulcanization process. Coal-fired oil furnace can be applied for keeping a high
temperature and pressure in the desulfurization tank (Li et al., 2014). During this process,
waste gases are produced.
• Refining

Figure 1: Producing ground rubber from scrap tyres (Li et al., 2014).
Devulcanization contributes the most to the environmental impact of tyre recycling (66% on the eco-
indicator 99 due to the high amount of heat needed in the process) while the recycling of coal cinder
has a negative environmental impact (credit) which offset the impacts on the ozone layer (Li et al.,
2014). The positive effects of coal cinder are however not large enough to offset the other
environmental impact categories (Li et al., 2014). The results are based on the situation in China. In
environments with less dependence on coal as energy source, the environmental benefits might be
larger.
When calculating the environmental impacts of tyre recycling, the avoided impacts of the replaced
product and material should be included (Clauzade et al., 2010). For example, recycling of tyres for
cement works avoids the extraction, preparation, transportation, and shredding of fuels. It further
avoids emissions associated with the combustion of these fuels. Clauzade et al. (2010) assigns the
environmental benefits of this to the recycling of used tyres and not to the downstream products

that uses the recovered used tyres. They conclude that all recovery applications assessed (synthetic
turf, moulded objects, cement works, steelworks, urban heating, equestrian floors, retention basins,
and foundries) lead to a positive significant impact on the environment (except for infiltration basins
which has both positive and negative impacts depending on the impact category). Most beneficial is
“the productions of synthetic, ELT-based turf, the manufacturing of moulded objects from ELT and
energy recovery in cement works” (Clauzade et al., 2010). The avoided impacts outweigh the
environmental impacts of collecting, sorting, and shredding the tyres. Genan (2009) reports similar
findings arguing that recycling for artificial turf and asphalt is better for the environment than using
old tyres for drainage layers. The general LCA guidelines on the allocation of credits due to recycling
of materials need to be followed.
One other issue in recycling is the achieved (compared to guaranteed) quality of the crushed tyres
(Pehlken et al., 2014). “A complete separation of water material components is not possible” and
different quality grades are reached (Pehlken et al., 2014). Depending on the quality grade, certain
applications might not be possible. The authors argue that this should be included in the
environmental impact assessment, although LCA might not be the most suitable method to include
this type of uncertainty and dynamic modeling. The authors propose a combined LCA with material
flow analysis (MFA) to assess decisions in waste flows.
Output emissions
Emissions / impact Manufacturing New car tyre
Production process of Retreated car tyre (excluding higher rolling resistance)
Energy 332 MJ per car tyre 147 MJ per car tyre
Air 66 kg per car tyre 36 kg per car tyre
water 579 kg per car tyre 23 kg per car tyre
Atmospheric emissions
25 kg per car tyre 11 kg per car tyre
Emissions into water
2 kg per car tyre 0.01 kg per car tyre
Global warming potential
20 kg per car tyre 11 kg per car tyre
Acidification potential
0.007 kg per car tyre 0.006 kg per car tyre
Nitrification potential
0.09 kg per car tyre 0.06 kg per car tyre
Table 2: Emissions of new and retreaded car tyres (Continental, 1999).
Including the higher rolling resistance, the energy consumption of a retreaded car tyre over its
lifetime increases to 7838 – 8429 MJ. Comparing this to the total energy consumption of a new tyre
(7852 MJ), the results are less conclusive (Continental, 1999). Continental concludes that “the
resource savings attained in retreading is virtually canceled out by the higher petroleum (fuel)
consumption” and that it leads to an increase in global warming potential and nutrification potential
(Continental, 1999). The effect on acidification potential depends on the increase in rolling resistance
(Continental, 1999). However, technological advance of retreaded tyres since 1999 might diminish
this negative effect of higher rolling resistance. A new LCA study on retreading tyres in the current
environment is beneficial.
Retreaded versus new tyres

Boustani et al. (2010) argue that retreaded tyres should be compared against new tyres available at
that moment for purchase. Since tyres and their rolling resistance are improved constantly, the
retreaded tyre will have to be compared against the improved new tyre. The rolling resistance is
continuously improving and many tyre manufacturers offer special eco-tyres nowadays. When
retreading tyres, the older tyres need to be compared to the new (more efficient) tyres available on
the market and which the customers would have bought if not bought a retreaded one (van
Beukering and Janssen, 2001).
During usage, tyres lose about 15% of their total weight (Pehlken and Roy, 2006). It is therefore only
possible to retreat a car tyre once in its entire life (Rafique, 2012). On the other hand, Michelin
argues that the lifetime of the tyre can be doubled or even tripled by retreading although their tests
show a 97% lifespan compared to a new tyre (Michelin, 2017). Most LCA studies assume equal
lifetimes for the new and retreaded tyre (for example Boustani et al., 2010; van Beukering and
Janssen, 2001). However, according to TRIB (cited in Boustani et al., 2010), retreaded tyres last
between 75 to 100% of the lifetime of a new truck tyre. On the other hand, a report by EY (2016)
argues that a retreaded truck tyre lasts for about 220 000 km while a new truck tyre in Europe lasts
usually for 600 000 km. The lifespan depends on the inflation practice and associated tyre pressure.
The lifespan of tyres is increasing over the years and can be further increased by improved driving
behaviour and monitoring tyre pressure (van Beukering and Janssen, 2001). For example, properly
inflated car tyres might even have a lifetime of 95000 to 1280000 km (van Beukering and Janssen,
2001), compared to the average lifespan of passenger car tyres of 30000 to 80000 km depending on
mechanical load (Pehlken et al., 2014). There is still uncertainty regarding the actual lifespan of new
versus retreaded tyres.
Conclusions
• Rolling resistance of tyres should be included in the LCA as well as the lifespan of new versus
new tyres. Access to industry data is needed to make realistic assumptions.
• The moment of purchase is important, i.e. the tyre that is replaced by using retreaded tyres.
This means that potential future changes in rolling resistance should be included in the
assessment.
• Transport and activities performed to tyres that cannot be retreaded should be included in
the LCA. Industry data on the retreading yield rate is needed.

Life cycle assessment The life cycle assessment described here was tailored to the tyre system at hand and with
consideration to the conclusions from the literature review. It was facilitated by actors in the Swedish
tyre “business ecosystem”, represented by Volvo Group (trucks manufacturer and service provider),
Galdax (retreader) and SDAB (recycling company administrating the producer responsibility for tyres
in Sweden).
Goal The goal of this study is to quantify the environmental benefit (impact reduction) of retreading. In
addition, there is an interest to assess the possible benefits related to the use of sensors to detect
e.g. low tyre pressure (a key determinant in vehicle fuel efficiency and in tyre life length) and hence
reduce the use of tyres when they are underinflated.
The study will identify, develop and evaluate methodology and principles which will be incorporated
in the final LCA model. This model could then be used for different types of analyses related to the
tyre product system including the following questions:
1. What is the difference, in terms of environmental impact, between tyre cores retreaded and
tyre cores not retreaded?
2. To what extent can the environmental impact decrease by using sensors ensuring optimal
tyre pressure and timing of tyre exchange?
The results can inform actors in the tyre product chain, from producers to users, and help identify
opportunities to reduce environmental impact. The results will be communicated internally within
the project which includes a tyre retreader, tyre material recycler and tyre customers. Results will
allow more generic lessons learned and will be part of the final project deliverables.

Scope
The tyre product system
A schematic flowchart of the heavy duty tyre product system is shown in Fel! Hittar inte
referenskälla.. After a tyre is used it can either be recycled or retreaded. A tyre core can be
retreaded up to three times (Galdax, 2018).
The functional unit is defined as one km of usage of a tyre in a heavy-duty truck with a diesel
powertrain. The truck is assumed to operate in Sweden (long haul transport).
System boundaries
The study covers the life cycle of the tyre from extraction of raw materials from nature to a delivered
product, used at a customer and finally disposed. The boundary between nature and the product life
cycle is crossed when materials, such as crude oil and iron ore, are extracted from the ground or
when emissions occur to soil, air or water.
The following activities are not included in the study:
• Production, use and end-of-life of packaging materials
• Production and maintenance of capital goods and infrastructure (buildings, machines,
vehicles etc.) used within the different activities in the life cycle
• Personnel-related environmental impact (travel to work, business travels, food etc.)
• Maintenance of tyres (inflating tyres, repairing flat tyre etc.)
End-of-life methodology
The study applies system expansion in the tyre recycling phase, meaning that the tyre product
system is given credits representing avoided impacts related to products which are replaced by
products made from recycled tyres.
Figure 2: Flowchart (material flows and main activities) of the heavy duty tyre product system. Material losses exist in production and retreading processes, e.g. chips from turning used tyres, but these flows are not indicated in this figure.
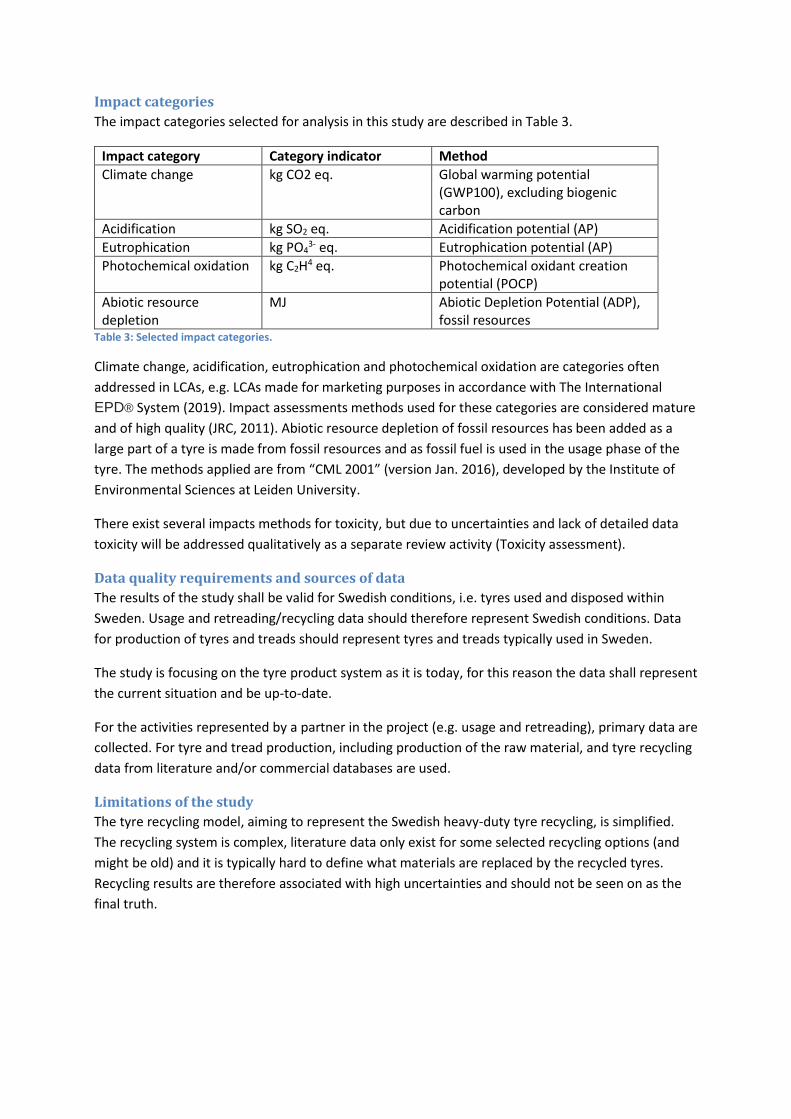
Impact categories
The impact categories selected for analysis in this study are described in Table 3.
Impact category Category indicator Method
Climate change kg CO2 eq. Global warming potential (GWP100), excluding biogenic carbon
Acidification kg SO2 eq. Acidification potential (AP)
Eutrophication kg PO43- eq. Eutrophication potential (AP)
Photochemical oxidation kg C2H4 eq. Photochemical oxidant creation potential (POCP)
Abiotic resource depletion
MJ Abiotic Depletion Potential (ADP), fossil resources
Table 3: Selected impact categories.
Climate change, acidification, eutrophication and photochemical oxidation are categories often
addressed in LCAs, e.g. LCAs made for marketing purposes in accordance with The International
EPD® System (2019). Impact assessments methods used for these categories are considered mature
and of high quality (JRC, 2011). Abiotic resource depletion of fossil resources has been added as a
large part of a tyre is made from fossil resources and as fossil fuel is used in the usage phase of the
tyre. The methods applied are from “CML 2001” (version Jan. 2016), developed by the Institute of
Environmental Sciences at Leiden University.
There exist several impacts methods for toxicity, but due to uncertainties and lack of detailed data
toxicity will be addressed qualitatively as a separate review activity (Toxicity assessment).
Data quality requirements and sources of data
The results of the study shall be valid for Swedish conditions, i.e. tyres used and disposed within
Sweden. Usage and retreading/recycling data should therefore represent Swedish conditions. Data
for production of tyres and treads should represent tyres and treads typically used in Sweden.
The study is focusing on the tyre product system as it is today, for this reason the data shall represent
the current situation and be up-to-date.
For the activities represented by a partner in the project (e.g. usage and retreading), primary data are
collected. For tyre and tread production, including production of the raw material, and tyre recycling
data from literature and/or commercial databases are used.
Limitations of the study
The tyre recycling model, aiming to represent the Swedish heavy-duty tyre recycling, is simplified.
The recycling system is complex, literature data only exist for some selected recycling options (and
might be old) and it is typically hard to define what materials are replaced by the recycled tyres.
Recycling results are therefore associated with high uncertainties and should not be seen on as the
final truth.

Life cycle inventory analysis Data collection was performed during 2018 and 2019. Generally, the LCA is using primary data for the
processes which are represented by a partner in the project (e.g. retreading), and secondary data for
remaining processes (e.g. tyre production), see summary of data sources in Table 4 below.
Process Source
Raw material production (tyres and treads)
LCA databases + primary data collected from Volvo Group/Galdax
Tyre production LCA databases/literature
Usage LCA databases/literature + primary data collected from Volvo Group
Tread production LCA databases/literature
Retreading LCA databases + primary data collected from Galdax
Tyre recycling LCA databases/literature + primary data collected from SDAB
Transportation LCA databases/literature Table 4: Summary of data sources.
Modelling of the product system was made in the LCA software GaBi. Results from GaBi were later
extracted into an Excel calculation sheet used to calculate and illustrate results depending on a set of
parameters that could be changed. Data collection and modelling for each process are briefly
described in sub-sections below.
Raw material production
A specification of the tyre material composition from Volvo Group were selected as the basis for
modelling the tyre product system. This material composition represents the average of heavy-duty
tyres that are used by Volvo Group for long haul trucks. The tyre weight used here is 63 kg, weights
of tyres used for long haul typically varies between 54 and 67 kg.
Detailed material composition of the treads could not be obtained from Galdax, the share of raw
materials in the treads were instead assumed to be the same as the share of raw materials for the
rubber compound in a whole tyre.
Tyre Tread
Raw material Weight [kg] Share Weight [kg] Share
Natural rubber 23,3 37% 5,0 47%
Synthetic rubber 5,7 9% 1,3 12%
Carbon black 15,1 24% 3,3 31%
Organic chemicals 5,0 8% 1,1 10%
Steel cord 13,9 22% - -
Total 63,0 10,7 Table 5: Material composition of a whole tyre and a tread.
The production of the raw materials in tyres and treads was modelled using data sets from
commercial LCA databases. Table 6 describes the data sets used to represent raw material
production.
Raw material Data set Data source

Natural rubber DE: Natural rubber (NR) thinkstep
Synthetic rubber DE: Styrene-Butadiene Rubber (SBR) Mix thinkstep
Carbon black DE: Carbon black (furnace black; general purpose) thinkstep
Organic chemicals GLO: chemical production, organic ecoinvent 3.4
Steel cord EU: Steel wire rod worldsteel Table 6: Data sets used to represent raw material production.
Tyre production
As no LCA data was obtained representing production of heavy-duty tyres, data in an LCA of a
passenger car tyre (Sun et al., 2016) was used as an approximation. This study identified four main
processes in tyre production: compound blending, rolling and extrusion, cutting and forming, and
vulcanizing and testing. Amounts of resources consumed (electricity, steam, water) and emissions
released during these processes were taken from Sun et al. (2016), production of the resources were
modelled by using thinkstep datasets.
Usage
Impacts from using a tyre could be divided into impacts due to production and combustion of fuel to
overcome the rolling resistance and other, tyre specific, impacts. As seen in the literature review,
several other studies excluded the fuel related impacts. As suggested after the literature review, and
as this study will consider differences in fuel consumption, they have been included. However, results
will be presented both with excluded and included usage phase.
Lifespan of tyre
The maximum lifespan of a long-haul truck tyre is around 250 000 km. Typically tyres are changed
before it is necessary, on average when there is an additional 22% of mileage left in the tyre (Volvo,
2018). Thus, the average lifespan of a tyre made from virgin materials is set to 200 000 km.
According to Volvo tyre suppliers retreaded tyres have a lower maximum lifespan, around 80% of the
maximum lifespan of a tyre made from virgin materials (Volvo, 2018). It is then assumed that
retreaded tires are also changed earlier, in relation to this difference, after 160 000 km.
Fuel consumption
The fuel consumption of a long-haul truck can differ significantly, depending on e.g. load and vehicle
combination. In this study, average figures were used (Volvo Truck Corporation, 2018), 32 l/100km
for a tractor and semi-trailer (common in Europe) and 48 l/100km for a truck with trailer (common in
Sweden). The figures represent fully loaded vehicles.
Figure 3: Tractor and semi-trailer (left) and truck with trailer (right).
According to Volvo the retreading of a tyre should not affect its rolling resistance, and by that the
fuel consumption, comparing the unused tyres. As was found in the literature review, some tyre
manufacturers have indicated an increase though: Michelin have for example stated an increase in
rolling resistance of 7-9% (Gutowski et al., 2011), and Continental an increase for passenger car tires
of 3% (best technologies) to 10% (average) (Continental, 1999).

As tyre pressure is one major factor affecting the fuel consumption, it is important to regularly check
it. If tyres are not checked for 48 weeks the pressure is lowered significantly, leading to a fuel
consumption increase of 14% (Bridgestone). As an average scenario it assumed that tyre pressure is
checked (and corrected) every 8 weeks leading to a fuel consumption increase of on average 1%
compared to tires checked every journey. Low tyre pressure is also influencing the lifespan of the
tyre, a tyre pressure of 80% of optimal pressure is decreasing the lifespan with 75%.
Driving with fully worn tires is reducing the rolling resistance and by that decreasing the fuel
consumption with a few percent (Volvo, 2018). This factor is not considered in the LCA though.
Allocation of fuel consumption to tyres
As the study focuses on tyres, only the fraction of fuel used to overcome the rolling resistance in the
tyres is considered. Gutowski at el. (2011) found figures for this fraction in literature that varies
between 13% and 47% and used an average value of 24% as a baseline in their study. Fuel consumed
per km allocated to one tyre is calculated as:
𝐹𝐶𝑜𝑛𝑒 𝑡𝑖𝑟𝑒 =𝐹𝐶𝑡𝑜𝑡𝑎𝑙 ∗ 𝑅𝑜𝑙𝑙𝑖𝑛𝑔 𝑟𝑒𝑠. 𝑓𝑟𝑎𝑐𝑡𝑖𝑜𝑛
𝑁𝑢𝑚𝑏𝑒𝑟 𝑜𝑓 𝑡𝑖𝑟𝑒𝑠
The number of tyres also varies depending on combination, based on input from Volvo 10 tyres is
assumed for a tractor and semi-trailer and 24 for a truck with trailer.
Impacts due to combustion and production of fuel
If tyres are used on a diesel truck operating in Sweden, MK1 diesel will likely be used. See Table 7 for
share of components in MK1 diesel (Energimyndigheten, 2019) and the data sets used to represent
their production.
MK1 diesel component
Share Data set Data source
Fossil diesel 79% (volume) EU-28: Diesel mix at filling station (100% fossil) thinkstep
HVO 17% (volume) FI: Hydrotreated Vegetable oil (HVO) from beef tallow thinkstep
FAME 4% (volume) EU-28: Biodiesel based on rape seed methyl ester (RME) thinkstep Table 7: Shares of components in MK1 diesel and data sets used to represent production.
Data representing fossil carbon dioxide emissions from combustion of MK 1 diesel are calculated
based on fossil carbon content in the diesel components. Data representing emissions of regulated
emissions as well as nitrous oxide and sulphur oxide are from Hallberg et al. (2013).
Emission g/l MK1 diesel
CO2 (fossil) 2080
N2O 0,216
CO 17,3
NOx 1,98
NMVOC 0,621
SO2 0,00489 Table 8: Emissions from combustion of MK1 diesel.
Other impacts
The obvious tyre specific impact from usage is release of particles due to tyre abrasion. As the LCA is

only considering impact categories where particulate matter has no influence, this emission is not
modelled. Impacts from tyre particles are instead discussed in the toxicity evaluation.
There are also impacts related to maintenance of the tyres, such as the electricity used for the
compressor when inflating the tyres. These impacts are considered negligible in this study.
Tread production
Due to lack of data for tread production, tyre production data was used to represent this, but with
the processes unique to tyre production excluded (cutting and forming, and vulcanizing and testing).
The tyre production data was also downscaled, by mass, due to the lower mass of a tread compared
to a whole tyre.
Retreading
Data representing retreading has been collected from Galdax, see Appendix 1 – Collected data for
retreading. The process starts with an inspection, and if the tyre is approved for retreading the old
tread is removed in a machining process. The tyre is then sprayed with cement, working as adhesive,
and if there are holes in the tyre these are filled. The tyre is then built in a machine where the new
tread is attached. After that the tyre is put in vacuum for an hour to release stress, before going to
vulcanization. The tyres are painted before final inspection.
Production of ingoing products, as well as water and electricity, has been modelled using thinkstep or
ecoinvent datasets. The actual material content of the products was not possible to obtain for some
of them (e.g. the rubber), due to confidentiality, but safety data sheets and other sources were used
to estimate the content. Fumes from the solvent based cement were not measured, these were
estimated based on that the solvent (heptane) is completely evaporated and released to air.
Probably this flow is lower in reality.
Tyre recycling
In accordance with Pehlken and Roy (2006), it is assumed that 15% of the tyre materials are lost as
particles due to tyre abrasion, 85% of the tyre material are modelled going to final tyre recycling. This
corresponds to 53,55 kg.
The model aims to represent the average Swedish truck tyre recycling situation. Data from SDAB
(2019) were collected representing recycling of truck tyres in 2018, see Table 9.
Type of recycling Tonnes Share of recycled tyres*
Material recycling, blasting mats 8894 49%
Material recycling, granulates 1384 8%
Material recycling, other 850 5%
Energy recovery 3100 17%
Energy recovery, cement industry 3100 17%
Material replacement (filling/drainage etc.) 800 4%
Table 9: Recycling of truck tyres in Sweden 2018. *90857 tonnes of tyres were recycled in Sweden 2018, 20% of these were by SDAB assumed to be truck tyres.
Primary data were not collected for the different types of tyre recycling, instead data from literature
were used together with assumptions, leading to a simplified model of the truck tyre recycling
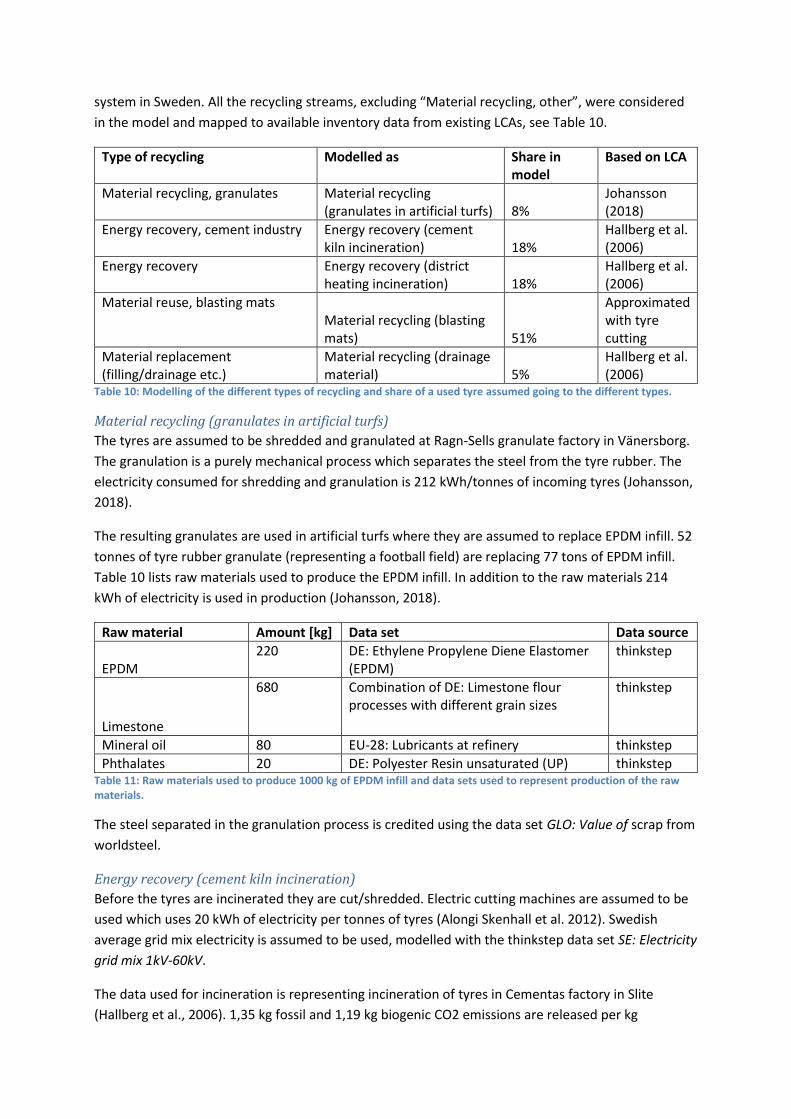
system in Sweden. All the recycling streams, excluding “Material recycling, other”, were considered
in the model and mapped to available inventory data from existing LCAs, see Table 10.
Type of recycling Modelled as Share in model
Based on LCA
Material recycling, granulates Material recycling (granulates in artificial turfs) 8%
Johansson (2018)
Energy recovery, cement industry Energy recovery (cement kiln incineration) 18%
Hallberg et al. (2006)
Energy recovery Energy recovery (district heating incineration) 18%
Hallberg et al. (2006)
Material reuse, blasting mats Material recycling (blasting mats) 51%
Approximated with tyre cutting
Material replacement (filling/drainage etc.)
Material recycling (drainage material) 5%
Hallberg et al. (2006)
Table 10: Modelling of the different types of recycling and share of a used tyre assumed going to the different types.
Material recycling (granulates in artificial turfs)
The tyres are assumed to be shredded and granulated at Ragn-Sells granulate factory in Vänersborg.
The granulation is a purely mechanical process which separates the steel from the tyre rubber. The
electricity consumed for shredding and granulation is 212 kWh/tonnes of incoming tyres (Johansson,
2018).
The resulting granulates are used in artificial turfs where they are assumed to replace EPDM infill. 52
tonnes of tyre rubber granulate (representing a football field) are replacing 77 tons of EPDM infill.
Table 10 lists raw materials used to produce the EPDM infill. In addition to the raw materials 214
kWh of electricity is used in production (Johansson, 2018).
Raw material Amount [kg] Data set Data source
EPDM 220 DE: Ethylene Propylene Diene Elastomer
(EPDM) thinkstep
Limestone
680 Combination of DE: Limestone flour processes with different grain sizes
thinkstep
Mineral oil 80 EU-28: Lubricants at refinery thinkstep
Phthalates 20 DE: Polyester Resin unsaturated (UP) thinkstep Table 11: Raw materials used to produce 1000 kg of EPDM infill and data sets used to represent production of the raw materials.
The steel separated in the granulation process is credited using the data set GLO: Value of scrap from
worldsteel.
Energy recovery (cement kiln incineration)
Before the tyres are incinerated they are cut/shredded. Electric cutting machines are assumed to be
used which uses 20 kWh of electricity per tonnes of tyres (Alongi Skenhall et al. 2012). Swedish
average grid mix electricity is assumed to be used, modelled with the thinkstep data set SE: Electricity
grid mix 1kV-60kV.
The data used for incineration is representing incineration of tyres in Cementas factory in Slite
(Hallberg et al., 2006). 1,35 kg fossil and 1,19 kg biogenic CO2 emissions are released per kg

incinerated tyre shreds, based on a natural rubber content of 47% in the rubber compound. In line
with the previous IVL study no other emissions are accounted for in the model.
1 MJ of tyre shreds are assumed to replace 0,75 MJ hard coal and 0,25 MJ petrol coke. Hard coal and
petrol coke production are modelled with the data sets SE: Hard coal mix and EU-28: Petrol coke at
refinery from thinkstep. Carbon dioxide emissions from combustion of these fuels are calculated
based on CO2 emission factors and heat values.
Energy recovery (district heating incineration)
The tyres are first cut, this is modelled as in the case with cement kiln incineration.
In 2004 two district heating plants in Sweden incinerated tyres, the data used is based on the plant of
Sydkraft ÖstVärme in Norrköping (Händelöverket). 57% of the tyres going to district heating plants in
2004 were incinerated in renewable fuel boilers and 43% in coal boilers (Hallberg et al., 2006). These
numbers were considered old due to recent investments in renewable fuel boilers. Instead 75% were
assumed going to renewable fuel boilers and 25% to coal boilers. Emissions from incineration of tyre
shreds are from the study by Hallberg et al. (2006).
In the coal boiler 1 MJ tyre shreds are assumed to replace 1 MJ hard coal, in the renewable fuel
boiler 1 MJ tyre shreds replace 1 MJ solid biomass. Hard coal and solid biomass production and
combustion are modelled with the data sets SE: Thermal energy from hard coal and SE: Thermal
energy from biomass (solid) from thinkstep.
Material recycling (blasting mats)
Blasting mats are made from tyres which are sliced up and bound together with ropes, cables or
chains. As no data were found representing production of blasting mats, this was approximated with
the tyre cutting/shredding process used in the other modelled recycling scenarios.
The blasting mats are assumed to be worn out when the tyre material is worn down to 75% of the
original weight. The mats are then assumed to be incinerated in district heating plants, modelled
with the bio boiler model explained in the previous section.
How to apply system expansion in this scenario is not obvious, i.e. what would be used instead if
there were no blasting mats made of truck tyres. Here it has been assumed that blasting mats would
have been produced from virgin materials (same material mix as in the tyres today, see Table 5). This
assumption makes recycling truck tyres to blasting mats very beneficial and is rather hypothetical, no
example of producing blasting mats from virgin materials has been found. An alternative assumption
could be that blasting is done without blasting mats, or that some other waste material, accounted
with low environmental impact, is used.
Material recycling (drainage material)
In this type of recycling tyre cuts are used in the drainage layers when a landfill is finished and final
covered. The cutting process is the same as for the other recycling scenarios, 20 kWh of electricity is
used per tonnes of tyres.
1 tonnes of tyre shreds replaces 2,5 tonnes of crushed stone, which is another material common to
use in drainage layers (Hallberg et al., 2006). Production of crushed stone is modelled with the data
set DE: Crushed stone 16/32 from thinkstep.

Transports
Transports of raw materials to production plants, e.g. tyre production, are assumed to be 500 km.
More upstream transports than that, e.g. transport of crude oil to refinery which ultimately will
become synthetic rubber, are generally included in the raw material production data sets used.
Transport of tyres and ingoing materials to retreading are longer, 1500 km, assuming they are
produced in Europe with truck production and retreading located in Sweden. Transports between
tyre workshops and the retreading facility are assumed to 150 km as an average, based on the fact
that Galdax collects tyres in Sweden from Skåne up to Stockholm.
Transports in the recycling phase are mainly taken from the literature sources used to model the
recycling. For details about the transports modelled, see Appendix 2 – Transport distances. As no
information was found for recycling as blasting mats, it is assumed that the transports are equal for
blasting mats produced from truck tyres and blasting mats produced from virgin materials, thus
balancing out each other in the calculations.
Results
Retreading
The following charts presents results per delivered kilometre for the selected input categories.
Results are provided for a tyre never retreaded and tyre cores retreaded one, two or three times.
The results are valid for a tractor and semi-trailer, assuming no difference in fuel consumption
between tyres made from virgin materials and retreaded ones and assuming the fraction of fuel used
to overcome the rolling resistance to be 24%.
Figure 4: Global Warming Potential per delivered kilometre for a tyre never retreaded and tyre cores retreaded one, two or three times.

Figure 5: Acidification Potential per delivered kilometre for a tyre never retreaded and tyre cores retreaded one, two or three times.
Figure 6: Eutrophication Potential per delivered kilometre for a tyre never retreaded and tyre cores retreaded one, two or three times.

Figure 7: Photochemical Ozone Creation Potential per delivered kilometre for a tyre never retreaded and tyre cores retreaded one, two or three times.
Figure 8: Abiotic Depletion Potential (fossil resources) per delivered kilometre for a tyre never retreaded and tyre cores retreaded one, two or three times.
For all impact categories except Photochemical Ozone Creation Potential there is a slight decrease in
impact per delivered kilometre as the tyre is retreaded more times. For Photochemical Ozone
Creation Potential there is an increase instead, because of the retreading. Almost all of this impact is
caused by the modelled release of heptane from the rubber cement.

Sensitivity analysis: Increased fuel consumption for retreaded tyres
Figure 9 illustrates the case where retreading the tyres leads to a 10% increase in fuel consumption.
The additional impacts from the extra fuel consumed becomes larger than the savings made by
retreading the tyres.
Figure 9: Differences in Global Warming Potential per delivered kilometre for a tyre core retreaded one, two or three times in relation a tyre never retreaded, assuming 10% increase in fuel consumption for retreaded tyres.
Even for only a 1% increase in fuel consumption the retreaded tyre cores would be associated with a
higher GWP100 impact, assuming the fraction of fuel used to overcome the rolling resistance is 24%.
If this fraction is set low (13%), it would require around 2% increase in fuel consumption for the
additional impacts to balance out the savings from retreading the tyres.
Sensitivity analysis: Influence of vehicle combination and rolling resistance fraction on use phase
The type of vehicle combination and assumed fraction of fuel used to overcome the rolling resistance
has a large influence on the resulting impact from the use phase, see Figure 10. The use phase impact
becomes lower for tyres on a truck with trailer. This is because the fuel consumed (fuel consumption
is actually higher) is allocated to 24 tyres instead of 10.

Figure 10: Global Warming Potential per delivered kilometre for a tractor and semi-trailer and a truck with trailer. The error bars represent variation of the fraction of fuel used to overcome the rolling resistance (min: 13%, average: 24%, max: 47%).
Sensitivity analysis: Influence of electrification
The use phase is very dominant when comparing the life cycle phases. An analysis was made to see
how this change for a truck with an electric driveline. It is assumed that the electric truck would
require the same amount of energy to overcome rolling resistance. The truck is using Swedish
average grid mix (44 g CO2-eq./kWh). Figure 11 shows the result, the dominance of the use phase is
now not that extreme as for the diesel trucks.
Figure 11: Global Warming Potential per delivered kilometre for an electrified truck.

Sensitivity analysis: Influence of recycling option and blasting mats recycling model
In the previous figures the tyre recycling result represented the average truck tyre recycling. How the
tyre actually is recycled has an impact on the result, see Figure 12.
Figure 12: Global Warming Potential per delivered kilometre (use phase excluded). Worst case represents incineration in district heating plants (replacing biomass), best case incineration in cement kilns.
The assumption that blasting mats made from truck tyres replaces blasting mats from virgin
materials also has an influence. Figure 13 represents the alternative assumption, that blasting is done
without blasting mats if truck tyres are not used for this purpose, or that some other waste material
is used instead. The benefit from retreading is now more obvious.

Figure 13: Global Warming Potential per delivered kilometre, without credit for blasting mats replacing blasting mats made from virgin materials. To be compared against Figure 4.
Use of sensors
The charts in this section presents GWP100 results per delivered kilometre, now for an average
scenario and a scenario where sensors are used to optimise tyre exchange and tyre pressure, see
differences in Table 12. The results are also here valid for a tractor and semi-trailer, assuming no
difference in fuel consumption between tyres made from virgin materials and retreaded ones and
assuming the fraction of fuel used to overcome the rolling resistance to be 24%.
Average Optimal
Fuel consumption [l/100 km] 32 31,68
Driven distance, “virgin” tyre [km] 200 000 244 000
Driven distance, retreaded tyre [km] 160 000 195 200 Table 12: Definitions of average and optimal scenario, when analyzing use of sensors.

Figure 14: Global Warming Potential per delivered kilometre, average scenario vs. optimal scenario. The result is presented both for the case were no retreading takes place and when the tyre is maximally retreaded (3 times).
Breakdown of tyre production and retreading results
The charts in this section brakes down tyre production and retreading results into the different
activities modelled. In Figure 15 it could be seen that the largest contribution of impact in tyre
production is from production of the raw materials.
Figure 15: Tyre production results broken down into the different activities modelled.
Also for retreading the production of raw materials (for the tread) is dominant, see Figure 16. The
exception here is POCP where the retreading activity itself is dominant due to modelled release of
heptane from the rubber cement.
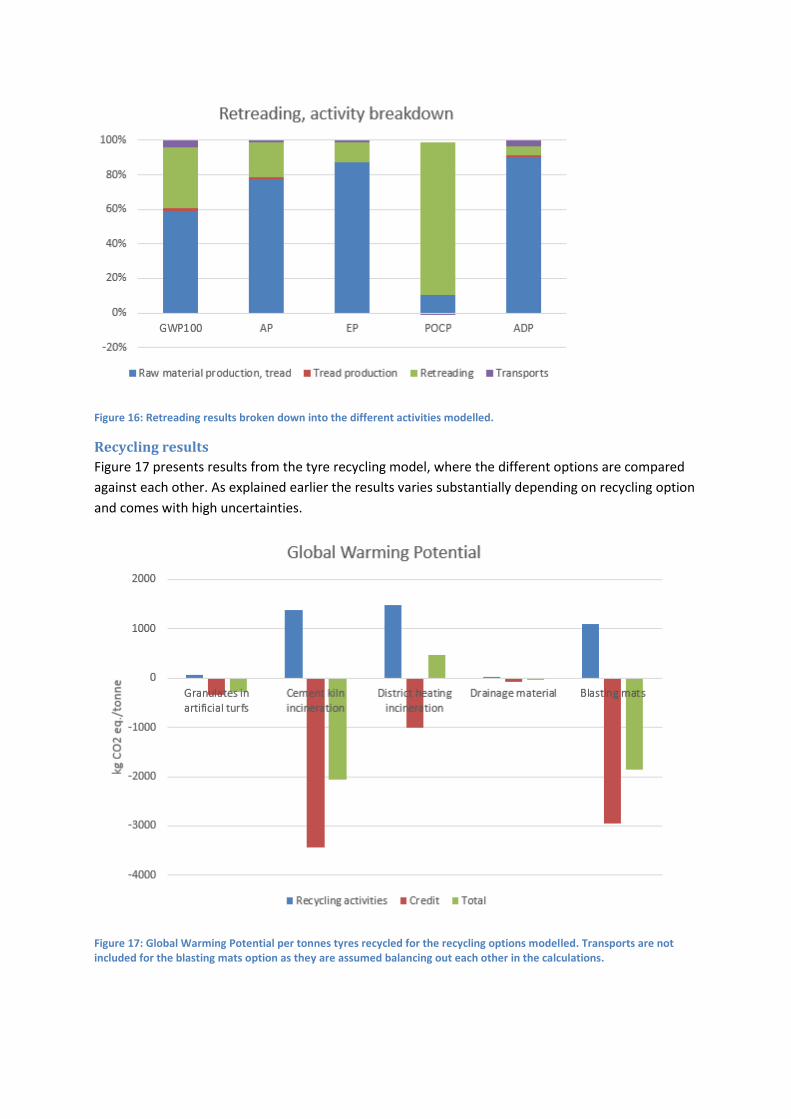
Figure 16: Retreading results broken down into the different activities modelled.
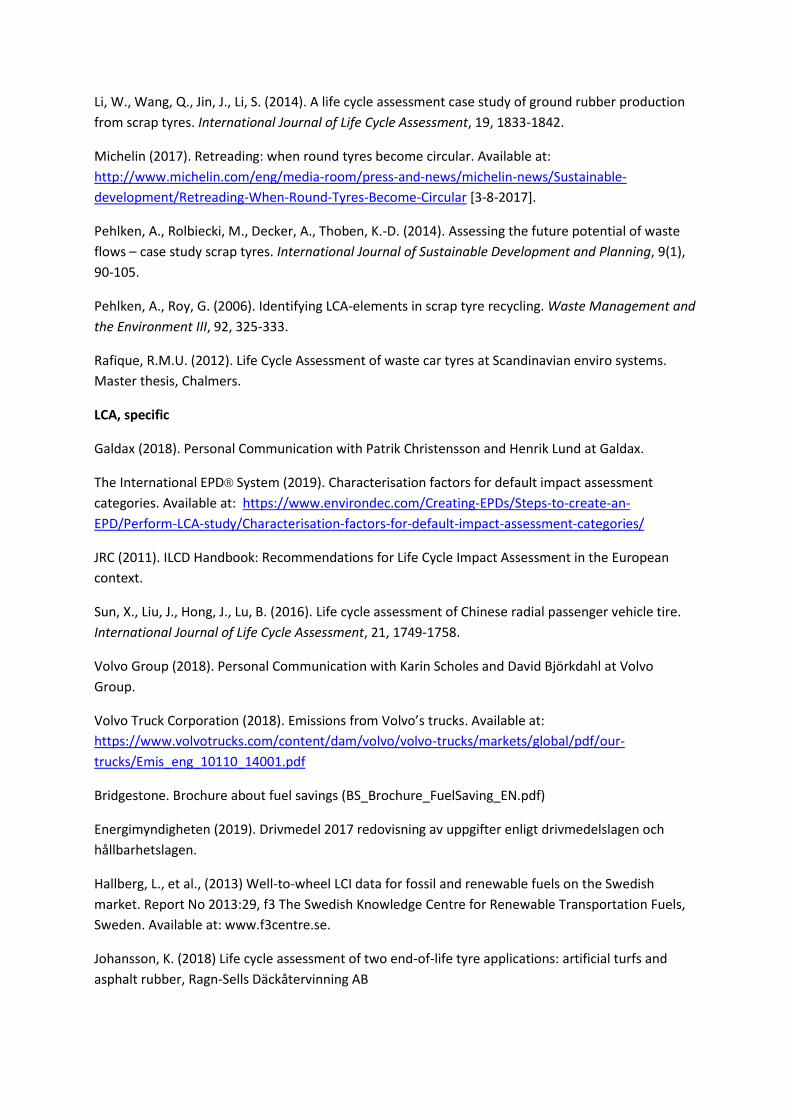
Recycling results
Figure 17 presents results from the tyre recycling model, where the different options are compared
against each other. As explained earlier the results varies substantially depending on recycling option
and comes with high uncertainties.
Figure 17: Global Warming Potential per tonnes tyres recycled for the recycling options modelled. Transports are not included for the blasting mats option as they are assumed balancing out each other in the calculations.

Discussion: Method considerations As usual, a number of interesting challenges related to ‘properly’ representing the system with the
LCA arose during the course of the project. One challenge was identified even before the project,
how to model cascading use of retreaded tyres. Cascading refers to the reuse of a product in another
use, and while it implies a downcycle, it can result in a upcycle (Sirken and ten Houten 1994, actually
refer to upcycling as relinking).
Assessing product life cycles in which materials are shared is not new. It is, in fact, one of the most
defining challenges of LCA. Peters 2016 highlights some implications of goal and scope definition and
assesses how goal and scope of LCAs of remanufactured products leads to great differences in
results. Specifically, system boundaries are perhaps the most defining decision.
Some other insights can be gathered from circular products in general. Guvendik (2014), under
supervision of Guinée, applied LCA to assess circular product designs of a smartphone. Assuming that
a circular smartphone would be used twice as long as the current smartphone with a refurbishment
step half way and where end-of-use phones will be used to harvest still functioning parts to be used
in the production of new phones, they apply a replacement chain method to calculate the
environmental impact of using the phones over a period of six years. First, an estimation is made on
the usage duration of the various components and parts and consequently how many components
will be used in six years. Second, an estimation of the reusability of the components at their end-of-
use is made. The reuse of components would mean that less components need to be produced as
‘new’ phones are assembled from a combination of new and reused parts. Third, the environmental
impact is calculated of all components linked to the usage of the phone for 6 years.
McLaren et al 2000 emphasize that static, linear analyses usually conducted as part of LCA or MFAs
may lead to false conclusions. This may be related to the applicability of LCAs for use at the system
level. LCAs assess environmental impacts at the product-level, for a functional unit, and system-level
affects, including rebound, can be difficult to include.
How cascading is to be handled in LCA is essentially, an allocation problem, which is, as always,
dependent on system boundaries drawn. Difficulties depend on choice of functional unit and how
well it fits with each use. For example, utilizing a FU of kilometer for use of a tyre first used on a long-
haul truck and then on a fork lift could skew results as the amount of kms logged over time for a
forklift is substantially less than that of a long-haul truck. Moreover, a forklift’s primary function is
not necessarily distance focused. Specifically, a second use in a forklift would not greatly reduce the
amount of environmental impact per kilometer for that product system. In cases in which
environmental impacts are to be allocated to different uses, such a FU (km) is, for the same reasons,
is not ‘fair’. The long-haul use would likely be allocated the large majority of the environmental
impact (even if it were to be after the forklift use). Thus, for some cascades, basic availability
(measured by time) or economic measure (cost as measure of value) may be appropriate functional
unit as these measures could better represent the uses relative to each other, like done with
economic allocation (Ardente & Cellura 2012).

Conclusions
Tire rolling resistance drives the majority of tire-related emission, that during the use phase. As such,
substantial reductions in emissions from long-haul transport (and other types) could be made if the
right tire pressure were to be maintained. Tire monitoring systems, such as tire pressure sensors,
offer a solution. Nonetheless, retreading represents an opportunity to reduce emissions and tire
material use and becomes more fruitful for an electrified fleet.
Repurposing of tire material in public spaces (such as playing fields) does represent less
environmental impact than producing new material, and it appears to result in risk to human health
that is comparable to other daily exposures (e.g. cosmetics, shampoo) and likely much less than
exposures of tire particles that are released during use. However, studies on this question are limited
and doubt remains.
Recycling of carbon black results in tangible environmental impact reductions for the input of carbon
black, so from the tire producer’s perspective, this source holds promise. Even incineration of tires is
beneficial when compared with using other virgin petroleum-based inputs instead. In the end, the
main challenge related to making the tire more truly sustainable is that its production depends on
fossil fuels and it is embedded in today’s fossil system.
References Ardente, F., Cellura, M., 2012. Economic allocation in life cycle assessment: state of the art and discussion of some examples. J. Ind. Ecol. 16 (3), 387e398.
Boustani, A., Sahni, S., Gutowski, T., Graves, S. (2010). Tyre remanufacturing and energy savings.
Available at: http://web.mit.edu/ebm/www/Publications/MITEI-1-h-2010.pdf [accessed 2-8-2017].
Clauzade, C., Osset, P., Hugrel, C., Chappert, A., Durande, M., Palluau, M. (2010). Life cycle
assessment of nine recovery methods for end-of-life tyres. International Journal of Life Cycle
assessment, 15, 883-892.
Continental (1999). Life Cycle Assessment of a car tyre. Available at: https://www.continental-
corporation.com/resource/blob/47500/b64cfd62d7c37b31e0141cb618756f86/oekobilanz-en-
data.pdf [accessed 2-8-2017].
EY (2016). The socio-economic impact of truck tyre retreading in Europe: The circular economy of
tyres in danger. Available at: http://www.etrma.org/uploads/Modules/Documentsmanager/201611-
ey_retreading_lr.pdf [accessed 3-8-2017].
Genan (2009). Comparative life cycle assessment of two options for waste tyre treatment: material
recycling in asphalt and artificial turf vs. civil engineering applications for drainage layers in landfills.
Available at: http://www.genan.eu/wp-
content/uploads/2017/04/LCA_Material_recycling_vs._civil_engineering_applications.pdf [accessed
8-8-2017].
Gutowski, T.G., Sahni, S., Boustani, A., Graves, S.C. (2011). Remanufacturing and energy savings.
Environmental Science and Technology, 45, 4540-4547.
Li, W., Wang, Q., Jin, J., Li, S. (2014). A life cycle assessment case study of ground rubber production
from scrap tyres. International Journal of Life Cycle Assessment, 19, 1833-1842.
Michelin (2017). Retreading: when round tyres become circular. Available at:
http://www.michelin.com/eng/media-room/press-and-news/michelin-news/Sustainable-
development/Retreading-When-Round-Tyres-Become-Circular [3-8-2017].
Pehlken, A., Rolbiecki, M., Decker, A., Thoben, K.-D. (2014). Assessing the future potential of waste
flows – case study scrap tyres. International Journal of Sustainable Development and Planning, 9(1),
90-105.
Pehlken, A., Roy, G. (2006). Identifying LCA-elements in scrap tyre recycling. Waste Management and
the Environment III, 92, 325-333.
Rafique, R.M.U. (2012). Life Cycle Assessment of waste car tyres at Scandinavian enviro systems.
Master thesis, Chalmers.
LCA, specific
Galdax (2018). Personal Communication with Patrik Christensson and Henrik Lund at Galdax.
The International EPD® System (2019). Characterisation factors for default impact assessment
categories. Available at: https://www.environdec.com/Creating-EPDs/Steps-to-create-an-
EPD/Perform-LCA-study/Characterisation-factors-for-default-impact-assessment-categories/
JRC (2011). ILCD Handbook: Recommendations for Life Cycle Impact Assessment in the European
context.
Sun, X., Liu, J., Hong, J., Lu, B. (2016). Life cycle assessment of Chinese radial passenger vehicle tire.
International Journal of Life Cycle Assessment, 21, 1749-1758.
Volvo Group (2018). Personal Communication with Karin Scholes and David Björkdahl at Volvo
Group.
Volvo Truck Corporation (2018). Emissions from Volvo’s trucks. Available at:
https://www.volvotrucks.com/content/dam/volvo/volvo-trucks/markets/global/pdf/our-
trucks/Emis_eng_10110_14001.pdf
Bridgestone. Brochure about fuel savings (BS_Brochure_FuelSaving_EN.pdf)
Energimyndigheten (2019). Drivmedel 2017 redovisning av uppgifter enligt drivmedelslagen och
hållbarhetslagen.
Hallberg, L., et al., (2013) Well-to-wheel LCI data for fossil and renewable fuels on the Swedish
market. Report No 2013:29, f3 The Swedish Knowledge Centre for Renewable Transportation Fuels,
Sweden. Available at: www.f3centre.se.
Johansson, K. (2018) Life cycle assessment of two end-of-life tyre applications: artificial turfs and
asphalt rubber, Ragn-Sells Däckåtervinning AB

Hallberg, L., Strömberg, K., Rydberg, T. Eriksson, E. (2006). Comparative life cycle assessment of the
utilisation of used tyres
Alongi Skenhall S., Hallberg. L., Rydberg, T. (2012). Livscykelanalys på återvinning av däck -
Jämförelser mellan däckmaterial och alternativa material i konstgräsplaner, dräneringslager och
ridbanor
SDAB (2019). Personal Communication with Jonad Roupé and Fredrik Ardefors at SDAB.
Tyre LCI Rubber Manufacturers Association. Typical Materials Composition of a Truck Tyre. Retrieved
07/22/2009, from http://www. rma.org/scrap_tyres/scrap_tyre_markets/scrap_tyre_characteristics/
#anchor135840. (32) Brown, H. L.; Hamel, B. B.; Hedman, B. A. Energy Analysis of
One Hundred and Eight Industrial Processes; Fairmont Press: Lilburn, GA, 1985.
(33) Gaines, L.; Stodolsky, F.; Cuenca, R.; Eberhardt, J. Lifecycle
Analysis for Heavy Vehicles; Center for Transportation Research, Argonne National Laboratory:
Argonne, IL, 1998. (34) Boustani, A. Remanufacturing and Energy Savings. Master of
Science Thesis, Mechanical Engineering, Massachusetts Institute of Technology, Cambridge, MA,
2010
(35) Bradley, R. Technology Roadmap for the 21st Century Truck Program: AGovernment-Industry
Research Partnership; 21CT-001, Office of Heavy Vehicles Technologies ofU.S. Department ofEnergy;
OakRidge, TN, December, 2000; http://www.osti. gov/fcvt/21stcenturytruck.pdf

Appendix 1 – Collected data for retreading
Data collection: Retreading
Reference unit: The data should be collected based on a reference unit e.g. 1 year or per tonne of product output. Please state the reference unit below.
Reference unit: 1 year (2016)
Enter the use of raw materials, energy etc. per reference unit. Energy such as e.g. electricity, natural gas etc. Note that we need to know the fuel input and not energy in terms of "heat" or "steam" (internally produced from a fuel). If you use externally produced heat such as district heat this should be entered as well. Apply the unit you prefer e.g. kWh, MJ, Nm3 etc. Auxiliary materials are materials which are not part of the final product, but used in the production e.g. chemicals. Emissions to air could either be from combustion of fuels or process specific.
Unit
Retreading Data source Modelled as (by IVL)
Amount [Unit/Year]
Materials/Products
Slitbanor T 245 Kontrollprogram för Galdax AB Natural rubber: 47% Synthetic rubber (SBR): 12% Carbon black: 31% Organic chemicals: 10%
Rågummi/ovulkat gummi T 25 Kontrollprogram för Galdax AB Natural rubber: 61,98% Synthetic rubber: 15,07% Carbon black: 17,50% Zinc oxide: 1,25% Organic chemicals: 4,20%
Cement T 4,24 Kontrollprogram för Galdax AB Heptan
Gummi sealer L 15,04 Galdax - Patrik Christensson Organic chemicals
Vattenbaserad färg L 2 400 Galdax - Patrik Christensson Water based paint white
Water use
Vatten m3 263 Galdax - Patrik Christensson
Energy use
El kWh 489 619 Galdax - Patrik Christensson
Emissions
AIR
- Process specific emissions
Ångor från utsug T 3,56 Estimation based on Kontrollprogram för Galdax AB
Waste
Däckspån T 192 Kontrollprogram för Galdax AB
Production: Main product
Regummerade däck Antal 23 000 Galdax - Patrik Christensson

Appendix 2 – Transport distances
Transports: Tyre production Transport 1
Cargo Weight Origin Destination Est. distance [km] GaBi dat set
Raw materials 63 Raw material production plants Tyre production plant 500 TruckTrailer 34-40 t, MPL 27 t, Euro 5
Tyre 63 Tyre production plant Truck production plant 1500 TruckTrailer 34-40 t, MPL 27 t, Euro 5
Transports: Retreading
Raw materials, for tread 10,65 Raw material production plants Tread production plant 500 TruckTrailer 34-40 t, MPL 27 t, Euro 5
Tread 10,65 Tread production plant Retreading 1500 TruckTrailer 34-40 t, MPL 27 t, Euro 5
Raw materials, for non-vulcanized rubber 1,09 Raw material production plants Rubber production plant 500 TruckTrailer 34-40 t, MPL 27 t, Euro 5
Non-vulcanized rubber 1,09 Rubber production plant Retreading 1500 TruckTrailer 34-40 t, MPL 27 t, Euro 5
Other raw materials 0,29 Raw material production plants Retreading 1500 TruckTrailer 34-40 t, MPL 27 t, Euro 5
Used tyre 53,55 Tyre workshop Retreading 150 TruckTrailer 34-40 t, MPL 27 t, Euro 5
Retreaded tyre 63,00 Retreading Tyre workshop 150 TruckTrailer 34-40 t, MPL 27 t, Euro 5
Tyre shreds 8,35 Retreading Recycling facility Used scaled Transports: Tyre recycling plan
Transports: Tyre recycling
Used tyre 53,55 Tyre workshop Tyre shredding 150 TruckTrailer 34-40 t, MPL 27 t, Euro 5
Tyre shreds 16,07 Tyre shredding Cement kiln 26 TruckTrailer 34-40 t, MPL 27 t, Euro 5
Tyre shreds 14,46 Tyre shredding Distric heating plant 285 TruckTrailer 34-40 t, MPL 27 t, Euro 5
Tyre rubber granulate 16,60 Tyre shredding/granulation Football fields 1000 TruckTrailer 34-40 t, MPL 27 t, Euro 5
Tyre shreds 2,14 Tyre shredding Landfill 200 TruckTrailer 34-40 t, MPL 27 t, Euro 5
Transports, replaced materials
Hard coal 13,23 Hard coal production plant Cement kiln 3860 TruckTrailer 34-40 t, MPL 27 t, Euro 5
Petrol coke 3,84 Petrol coke production plant Cement kiln 10058 Ship, bulk, ocean
Hard coal 3,97 Hard coal production plant Distric heating plant 3860 TruckTrailer 34-40 t, MPL 27 t, Euro 5
Biomass 36,15 Biomass suppliers Distric heating plant 254 TruckTrailer 34-40 t, MPL 27 t, Euro 5
Raw materials, for EPDM infill 18,22 Raw material production plants EPDM infill production plant 500 TruckTrailer 34-40 t, MPL 27 t, Euro 5
EPDM infill 18,22 EPDM infill production plant Football fields 1500 TruckTrailer 34-40 t, MPL 27 t, Euro 5
Crushed stone 5,36 Crushed stone production Landfill 300 TruckTrailer 34-40 t, MPL 27 t, Euro 5