life-cycle assessment of in situ thermal remediation
TRANSCRIPT
REMEDIATION Autumn 2012
Life-Cycle Assessment of In Situ ThermalRemediation
Angela Fisher
A detailed cradle-to-grave life-cycle assessment (LCA) of an in situ thermal treatment remedy for
a chlorinated-solvent-contaminated site was performed using process LCA. The major materials
and activities necessary to install, operate, monitor, and deconstruct the remedy were included
in the analysis. The analysis was based on an actual site remedy design and implementation
to determine the potential environmental impacts, pinpoint major contributors to impacts, and
identify opportunities for improvements during future implementation.
The Electro-Thermal Dynamic Stripping Process (ET-DSPTM) in situ thermal technology coupled
with a dual-phase extraction and treatment system was evaluated for the remediation of 4,400 yd3
of tetrachloroethene- and trichloroethene-impacted soil, groundwater, and bedrock. The analysis
was based on an actual site with an estimated source mass of 2,200 lbs of chlorinated solvents.
The remedy was separated into four stages: remedy installation, remedy operation, monitoring,
and remedy deconstruction. Environmental impacts were assessed using Sima Pro software, the
ecoinvent database, and the ReCiPe midpoint and endpoint methods.
The operation stage of the remedy dominated the environmental impacts across all categories
due to the large amount of electricity required by the thermal treatment technology. Alternate
sources of electricity could significantly reduce the environmental impacts of the remedy across all
impact categories. Other large impacts were observed in the installation stage resulting from the
large amount of diesel fuel, steel, activated carbon, and asphalt materials required to implement
the technology. These impacts suggest where opportunities for footprint reductions can be found
through best management practices such as increased materials reuse, increased recycled-content
materials use, and clean fuels and emission control technologies. Smaller impacts were observed
in the monitoring and deconstruction stages. Normalized results show the largest environmental
burdens to fossil depletion, human toxicity, particulate matter formation, and climate-change cate-
gories resulting from activities associated with mining of fossil fuels for use in electricity production.
In situ thermal treatment can reliably remediate contaminated source areas with contaminants
located in low-permeability zones, providing complete destruction of contaminants in a short
amount of time, quick return of the site to productive use, and minimized quantities of hazardous
materials stored in landfills for future generations to remediate. However, this remediation strategy
can also result in significant emissions over a short period of time. It is difficult to quantify the overall
value of short-term cleanups with intense treatment emissions against longer-term cleanups with
lower treatment emissions because of the environmental, social, and economic trade-offs that need
to be considered and understood. LCA is a robust, quantitative tool to help inform stakeholder
discussions related to the remedy selection process, trade-off considerations, and environmental
footprint-reduction opportunities, and to complement a broader toolbox for the evaluation of
sustainable remediation strategies. Oc 2012 Wiley Periodicals, Inc.
c© 2012 Wiley Periodicals, Inc.Published online in Wiley Online Library (wileyonlinelibrary.com). DOI: 10.1002/rem.21331 75

Life-Cycle Assessment of In Situ Thermal Remediation
INTRODUCTION
Many professionals within the remediation community have come to understand thatwhile the cleanup of a contaminated site should inherently have positive environmentalimpacts, many activities conducted for site cleanup generate environmental burdensthemselves. Consequently, the tendency to invoke a more holistic view of siteremediation, sustainable remediation, has emerged (Sustainable Remediation Forum[SURF], 2009, Interstate Technology & Regulatory Council [ITRC], 2011a). Althoughformal definitions have not yet been accepted throughout the remediation community, theconcept is to attain a balance among the environmental, social, and economic benefits of aremediation project while minimizing the negative impacts to the local, regional, andglobal environment, communities, and economy. For these types of balancing andtrade-off decisions to be properly informed, the remediation community needs additionaldata and quantitative results about the impacts of remediation technologies to determinewhere, how, and when opportunities for improvements can be made.
Life-cycle assessment (LCA) is an International Organization for Standardization(ISO) standardized and widely accepted method for identifying and calculatingenvironmental impacts across the life cycle of products and services (such as remediationprojects). It includes the definition of the goal, scope, functional unit, and systemboundary, followed by the inventory analysis, impact assessment, and interpretation (ISO,2006). Application of LCA in the field of soil and groundwater remediation technologiesis beginning to increase, has been evaluated in two recent literature reviews (Lemminget al., 2010a; Suer et al., 2004), and can be traced back to as early as the late 1990s(Bender et al., 1998; Page et al., 1999; Volkwein et al., 1999). Not only is LCA a robusttool for quantifying the potential environmental impacts of remediation projects across avariety of impact categories, but it can also identify opportunities within specific processesor phases of the remedy to meaningfully reduce the remedy’s environmental footprint.
Not only is LCA a ro-bust tool for quantifyingthe potential environmen-tal impacts of remediationprojects across a variety ofimpact categories, but itcan also identify opportu-nities within specific pro-cesses or phases of theremedy to meaningfully re-duce the remedy’s environ-mental footprint.
Early LCA studies focused mainly on ex situ remediation methods, while in morerecent years, LCAs for in situ remediation technologies have been published. Recent in situremediation LCAs include comparative studies of permeable reactive barriers versuspump and treat (Higgins et al., 2009; Mak & Lo, 2011), capping options for sedimentremediation (Sparrevik et al., 2011); electron donors for in situ bioremediationapplications (Hong & Li, 2012); and in situ bioremediation versus in situ thermaldesorption versus excavation and disposal (Lemming et al., 2010b).
Within the remediation-LCA framework, environmental impacts have beencategorized into the following: those resulting from local impacts of the residual sitecontamination (primary impacts); those resulting from the actual remediation activities(secondary impacts); and, in one study, those consequences associated with future reuse ofthe site or avoided use of greenfield sites (tertiary impacts) (Lesage et al., 2007). The aimof the study discussed in this article is to use LCA for a detailed cradle-to-grave analysis ofthe secondary environmental impacts of an in situ thermal remediation technology for thetreatment of a tetrachloroethene- (PCE) and trichloroethene- (TCE) contaminated sourcearea. Primary environmental impacts in groundwater are neglected due to the ability ofthe thermal technology to rapidly remove contamination from the source area. Tertiaryimpacts have also been excluded because the site reuse after remedy completion willremain commercial/industrial and, therefore, is expected to have no net change in service.
76 Remediation DOI: 10.1002/rem c© 2012 Wiley Periodicals, Inc.

REMEDIATION Autumn 2012
A methodology to conduct LCAs for remediation projects (Favara et al., 2011) wasfollowed for this analysis. It should be noted that LCA is an effective quantitative tool foridentifying potential environmental impacts of remedial projects, but from the perspectiveof sustainability, social and economic impacts should also factor into the decision-makingprocess. The integration of methods such as life cycle costing, cost-benefit analysis, andsocial LCA with environmental LCA may provide avenues to explore the more holisticview of impacts and provide additional insight for decision making. An extensive list ofsustainability metrics applicable to remediation projects was compiled by SURF (Butleret al., 2011) and ITRC (2011b).
This work was motivated by a desire to provide the remediation community with anobjective demonstration of the process and capabilities of LCA to identify and quantify theoverall environmental impacts of a site remedy. Additional detailed, quantitativeenvironmental impact information about the technologies employed is necessary forremediation professionals to more wholly evaluate the relative sustainability of technologyoptions. Fully informed remedy-selection discussions, trade-off considerations, andidentification of improvement opportunities can only proceed after a more holisticunderstanding of the relevant environmental impacts and magnitude of emissions has beenachieved.
METHODOLOGY
Thermal Remedy Overview
The Electro-Thermal Dynamic Stripping Process (ET-DSPTM) is an in situ thermal soil andgroundwater remediation technology that combines the three dominant heat-transfermechanisms of electrical heating, conductive heating, and convective heat transfer.ET-DSPTM uniformly heats the subsurface and volatilizes the contaminants for recoveryusing standard vacuum extraction techniques. This process involves heating soil withinand across both saturated and unsaturated zones by passing electrical current viaelectrodes placed at calculated depths and distances (Exhibit 1). Water is also circulatedthrough the electrodes to assist with convective heat transfer. The combination ofheat-transfer mechanisms is intended to address contamination in both low- andhigh-permeability zones (McMillan-McGee Corporation, 2011). Dual-phase extraction(DPE) wells are installed within the target treatment area to recover volatilized VOCs andgroundwater. The wells in this case study also recover residual mass in the aqueous phasefor aboveground treatment and reinjection into the formation. The recovered vapor andliquid are separated and treated with activated carbon prior to reinjection or discharge.
Site Overview
The remediation site is located in the northeastern United States in a mixed commercial,light industrial area. The in situ thermal remedy was chosen based on an evaluationthat compared short-term effectiveness, long-term effectiveness, implementability,community impact, sustainability, time frame, and cost. Elevated source areaconcentrations, low-permeability materials, and short cleanup time frames weremajor contributors to the remedy selection. Destruction of contaminants, low risk of
c© 2012 Wiley Periodicals, Inc. Remediation DOI: 10.1002/rem 77

Life-Cycle Assessment of In Situ Thermal Remediation
Exhibit 1. Diagram of ET-DSPTM thermal remedy (McMillan-McGee Corporation, 2011)
failure, cost, minimization of long-term storage in a landfill, and rapid reuse of the sitewere also important stakeholder objectives.
Goal, Scope, and System Boundary
The goal of this study was to evaluate the potential environmental impacts from theapplication of an in situ thermal remedy for the destruction of contamination in twochlorinated solvent source areas. The functional unit was defined as the treatment of4,400 yd3 of contaminated media via ET-DSPTM thermal technology for the removal ofgreater than 99 percent of the estimated 2,200 lbs of source mass. The duration of theremedy was estimated to be 180 days, followed by two years of performance monitoring.
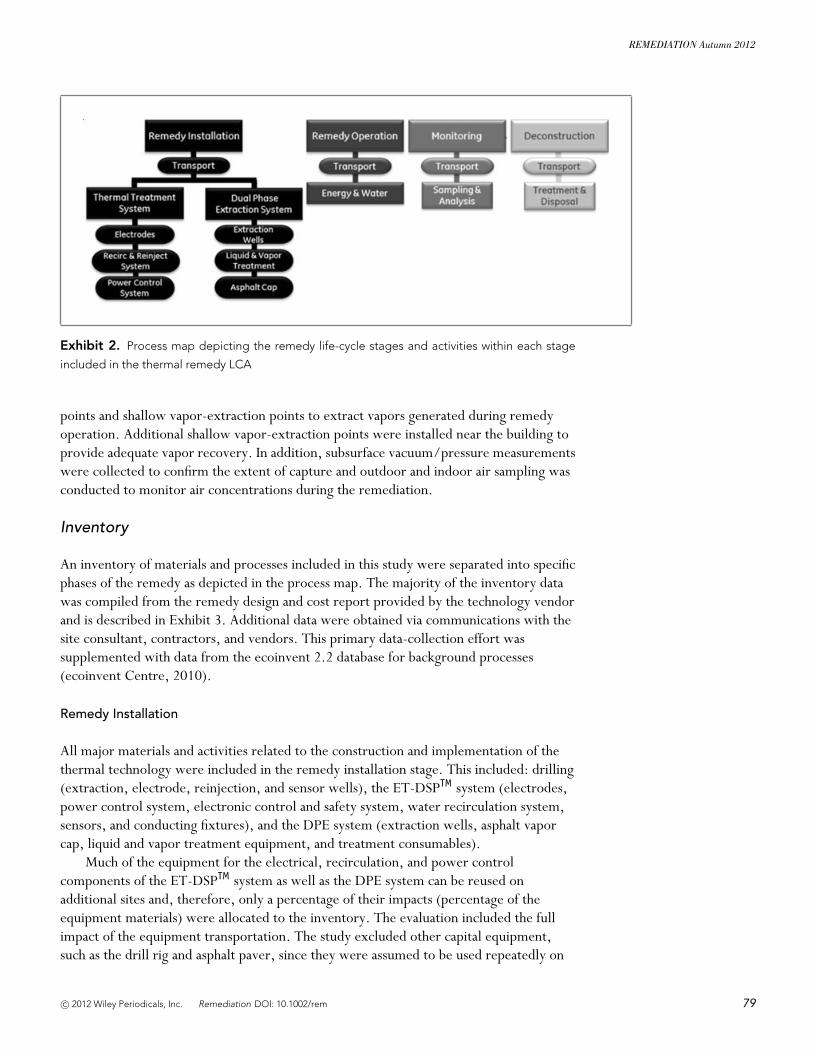
The scope of this study included the major inputs and emissions related to the in situthermal technology, including raw materials acquisition, materials processing, transport(labor, equipment, and wastes), resource use (electricity and water), monitoring(transport and sample analysis), and waste treatment and disposal. Exhibit 2 presents thesystem boundary (shown as a process map). For discussion and optimization purposes, theremedy was separated into four life-cycle stages: remedy installation, remedy operation,monitoring, and deconstruction (waste transport and disposal).
Pre-remedy site activities not considered in this study included: initial sitegroundwater, soil, bedrock, and surface water investigation; monitoring well installation;hydrogeologic evaluation; and the tracer study that was conducted to evaluate thefeasibility of other in situ remedies. The study also excluded relocation of undergroundutilities because it was outside the scope of this analysis.
Given that the remedy-volatilized chlorinated VOCs from soil and groundwater tosoil vapor, measures were developed to mitigate the potential for vapor migration toimpact outdoor air and the indoor air quality (of an adjacent building). These measuresincluded repaving the treatment area to serve as a cap for vapor migration, and using DPE
78 Remediation DOI: 10.1002/rem c© 2012 Wiley Periodicals, Inc.
REMEDIATION Autumn 2012
Exhibit 2. Process map depicting the remedy life-cycle stages and activities within each stage
included in the thermal remedy LCA
points and shallow vapor-extraction points to extract vapors generated during remedyoperation. Additional shallow vapor-extraction points were installed near the building toprovide adequate vapor recovery. In addition, subsurface vacuum/pressure measurementswere collected to confirm the extent of capture and outdoor and indoor air sampling wasconducted to monitor air concentrations during the remediation.
Inventory
An inventory of materials and processes included in this study were separated into specificphases of the remedy as depicted in the process map. The majority of the inventory datawas compiled from the remedy design and cost report provided by the technology vendorand is described in Exhibit 3. Additional data were obtained via communications with thesite consultant, contractors, and vendors. This primary data-collection effort wassupplemented with data from the ecoinvent 2.2 database for background processes(ecoinvent Centre, 2010).
Remedy Installation
All major materials and activities related to the construction and implementation of thethermal technology were included in the remedy installation stage. This included: drilling(extraction, electrode, reinjection, and sensor wells), the ET-DSPTM system (electrodes,power control system, electronic control and safety system, water recirculation system,sensors, and conducting fixtures), and the DPE system (extraction wells, asphalt vaporcap, liquid and vapor treatment equipment, and treatment consumables).
Much of the equipment for the electrical, recirculation, and power controlcomponents of the ET-DSPTM system as well as the DPE system can be reused onadditional sites and, therefore, only a percentage of their impacts (percentage of theequipment materials) were allocated to the inventory. The evaluation included the fullimpact of the equipment transportation. The study excluded other capital equipment,such as the drill rig and asphalt paver, since they were assumed to be used repeatedly on
c© 2012 Wiley Periodicals, Inc. Remediation DOI: 10.1002/rem 79

Life-Cycle Assessment of In Situ Thermal Remediation
# of Reuses
--)reppoc ,leets fo desopmoc( hcae gk 05 ,)04 x( sedortcelE2)acilis ,reppoc ,citsalp fo desopmoc( hcae gk 5 ,srosneS 9
Power Delivery System, 10,000 kg (composed of steel, copper, aluminum, plastic) 30Water Circulation System, 2000 kg (composed of steel, brass, plastic) 15Electronic Control Equipment, 3500 kg (composed of steel, copper, plastic) 30
--)reppoc fo desopmoc( hcae gk 5 ,stnioP dnuorGSub-Station Transformer, 5000 kg (composed of steel, copper, plastic) 30
2)scitsalp ,reppoc fo desopmoc( gk 088 ,srotcudnoC5)scitsalp ,leets ,munimula fo desopmoc( gk 573 :gnilbaC
Hoses: 760 kg (composed of ethylene-propylene-diene-terpolymer) ----)kcap eloherob edortcele( gk 0051 :etihparG
ET-DSP Personnel Transport: 3800 km one way; 5 trips; passenger vehicle --ET-DSP Equipment Transport: 3800 km one way; 1 trip; 56,000 kg --
--)reppoc ,leets fo desopmoc( hcae gk 05 :sedortcelE 042)acilis ,reppoc ,citsalp fo desopmoc( hcae gk 5 :srosneS 9
Power Delivery System: 10,000 kg; (composed of steel, copper, aluminum, plastic) 30Water Circulation System: 2000 kg (composed of steel, brass, plastic) 15Electronic Control Equipment: 3500 kg (composed of steel, copper, plastic) 30Ground Points: 5 kg each (c --)reppoc fo desopmoSub-Station Transformer: 5000 kg (composed of steel, copper, other) 30
2)scitsalp ,reppoc fo desopmoc( gk 088 :rotcudnoC5)leets fo desopmoc( gk 062 :stinu CAG--)5002 ,.la te reyaB morf epicer( gk 0063 :CAG
DPE Personnel Transport: 1250 km one way; 5 trips; passenger vehicle --DPE Equipment Transport: 1250 km one way; 1 trip; 56,000 kg --
MonitoringSampling Technician Transport: 50 km one way, 12 tripsSample Transport: 52.6 km one way, 12 tripsSample Analysis: 435 samples (includes lab electricity, chemicals, and water use)
Deconstruction (End of Life)
Deconstruction
Thermal Equipment Transport (reuse): 3800 km; 1 trip; 22,400 kg Thermal Equipment Transport (landfill): 499 km one way; 1 trip; 1300 kg DPE Equipment Transport (reuse): 1250 km; 1 trip; 12900 kg DPE Equipment Transport (landfill): 499 km one way; 1 trip; 5000 kg Transport to Recycling: 100 km; 5000 kgWaste Transport & Disposal (Non-Haz Landfill): 499 km, 600 tonsWastewater Treatment: 25,000 gallonsWaste Drums: 1100 kg (steel)
Monitoring
Asphalt: 180,000 kgPolyvinyl chloride piping: 230 kgGalvanized Steel Fencing: 275 kgDrilling & Site Prep Personnel Transport, 38,400 km, passenger vehicleSite Prep Equipment Transport: 39,000 tkmDrill Rig Transport: 766km one way, 5.5mpgConsultant Transport: 4280 km, passenger vehicle
Remedy Operation
OperationGrid Electricity Demand: 1400 MWh; RFC East subregionWater Demand: 518,000 kg
Project Inventory: Materials and Processes by Remedial Life Cycle Stage
Remedy Installation
ET_DSP System
DPE System
Site Prep
Drilling (boreholes & wells): 1890 gal dieselSand (well packs): 26,000 kgConcrete (well caps): 300 kgStainless Steel (wells): 2800 kgPaver, roller, trucks: 1050 gal diesel
Exhibit 3. ET-DSPTM in situ thermal project inventory
80 Remediation DOI: 10.1002/rem c© 2012 Wiley Periodicals, Inc.
REMEDIATION Autumn 2012
other sites and in other applications and reported to have little contribution to the overallresults (Cadotte et al., 2007). Exhibit 3 presents a summary of the project inventory andthe number of reuses for major pieces of equipment.
Remedy Operation
The inventory included the electricity demand and water usage inputs for the remedyoperation stage. The RFC East US subregion supplied electricity to the site. The followingis the composition of the grid mix used for this analysis: 42.2 percent coal, 40.3 percentnuclear, 13.1 percent natural gas, 0.2 percent wind, 1.2 percent biomass, 0.9 percenthydro, and 1.1 percent oil (US EPA, 2010a). Performance monitoring was performedremotely during the active heating stages; therefore, this stage included minimal oversighttransport. All water extracted from the active system was treated at the surface, thenreused in the active treatment zone or reinjected into the subsurface nearby.
Monitoring
The monitoring stage of the remedy included the following activities: technician transportto and from the site for sampling, transport of the samples to the analytical laboratory, andlaboratory analysis and reporting (electricity, chemicals, and water). This includedsampling and analysis before, during, and after remedy implementation.
Deconstruction
The deconstruction (or end-of-life) stage included waste disposal and the transport ofmaterials to recycling, to reuse, or to landfill. Wastes included materials such as drillcuttings, concrete, wastewater, and other nonhazardous solid wastes. It also included theimpacts associated with landfilling but not impacts associated with recycling the materialsper the cut-off allocation method (no benefit taken or burden incurred for recycling)(Frischknecht, 2010). A large portion of the thermal and DPE equipment was scheduledfor reuse on multiple sites before ultimately being recycled (at a rate of 90 percent). Theelectrodes, associated graphite pack, and the copper grounding points were left in placeafter the cleanup was completed, and, thus, the study included the full impact of thesematerials. Drill cuttings and other solid wastes were disposed of in a landfill, andwastewater was sent to a treatment facility.
Impact Assessment Methods
The inventory was compiled using Sima Pro 7.3.3 LCA software and utilized backgroundprocesses from the ecoinvent 2.2 database and the modified version of those ecoinventprocesses [US-EI 2.2 database] to account for the influence of the US electricity grid(Product Ecology Consultants, 2011). The primary impact assessment (IA) methodapplied to the inventory was ReCiPe Midpoint (World H version 1.06, 2011) forassessment of the following 13 environmental impact categories: fossil depletion, metaldepletion, climate change, particulate matter (PM) formation, human toxicity, terrestrialacidification, water depletion, ecotoxicity, ozone depletion, photochemical oxidant(smog) formation, marine eutrophication, freshwater eutrophication, and ionizing
c© 2012 Wiley Periodicals, Inc. Remediation DOI: 10.1002/rem 81

Life-Cycle Assessment of In Situ Thermal Remediation
Impact category Total Unit Installation Operation Monitoring Deconstruction Installation Operation Monitoring Deconstruction
Climate change 1,107,000 kg CO2 eq 195,500 827,700 1,600 82,000 17.7% 74.8% 0.1% 7.4%Ozone depletion 0.08 kg CFC-11 eq 0.03 0.04 0.00 0.01 33.7% 51.3% 0.1% 14.9%Human toxicity 592,700 kg 1,4-DB eq 205,200 375,400 700 11,500 34.6% 63.3% 0.1% 1.9%Photochemical smog 3,800 kg NMVOC 900 2,100 5 800 23.7% 55.3% 0.1% 21.1%PM formation 1,900 kg PM10 eq 400 1,300 2 200 21.1% 68.4% 0.1% 10.5%Ionising radiation 591,700 kg U235 eq 12,200 575,700 1,000 2,800 2.1% 97.3% 0.2% 0.5%Terrestrial acidification 6,700 kg SO2 eq 1,000 5,200 9 500 14.9% 77.6% 0.1% 7.5%Freshwater eutrophication 523 kg P eq 100 400 1 9 19.1% 76.5% 0.2% 1.7%Marine eutrophication 220 kg N eq 40 150 0 30 18.2% 68.2% 0.0% 13.6%Ecotoxicity 23,400 kg 1,4-DB eq 7,600 15,200 30 500 32.5% 65.0% 0.1% 2.1%Water depletion 9,500 m3 900 8,200 7 300 9.5% 86.3% 0.1% 3.2%Metal depletion 147,300 kg Fe eq 108,400 33,700 70 5,000 73.6% 22.9% 0.0% 3.4%Fossil depletion 341,300 kg oil eq 82,300 227,700 400 30,900 24.1% 66.7% 0.1% 9.1%
Characterization Results by Remedy Stage Percent Contribution of Remedy Stage
Exhibit 4. Characterization results by remedy life-cycle stage, including percent contribution to
each impact category
radiation (Goedkoop et al., 2009). The ReCiPe endpoint method (World H/A) was alsoused to normalize the results within each damage category (human health, ecosystems,and resources) to determine which impact categories were most relevant to this analysis.Land transformation and occupation impact categories in ReCiPe were not included basedon uncertainties in these models and limited flows to these impact categories (Favaraet al., 2011).
RESULTS AND DISCUSSION
Characterization results for the environmental impact categories evaluated with theReCiPe midpoint IA method are presented in Exhibit 4. The exhibit includes the percentcontribution of each remedy stage to the total for each impact category. The remedyoperation stage, specifically the electricity usage, was clearly the dominant stage,impacting nearly all of the environmental categories with an average contribution of67 percent across all categories (range of 20.4 percent to 97.3 percent). The remedyinstallation stage also played a significant role in environmental impacts across mostcategories with an average contribution of 25 percent. The monitoring stage showed verylittle impact relative to the other stages of the remedy (average contribution of0.1 percent across impact categories). The remedy deconstruction stage accounted for anaverage of 7.4 percent of the impacts.
The results were normalized to provide context to the relative magnitude of oneimpact category to another (within a damage category). Within the human health damagecategory, climate change, PM formation, and human toxicity had the largest relativeimpacts and were carried forward for further investigation (Exhibit 5). Within theecosystems damage category, climate change was identified for further analysis, and fossildepletion was retained within the resources damage category. Detailed results were thenanalyzed for these four key impact categories using the ReCiPe midpoint characterizationoutputs. The distribution of impacts from each remedy life-cycle stage within each of thefour selected impact categories is depicted in Exhibit 6, which shows that the majority ofthe impacts were due to the operation stage.
82 Remediation DOI: 10.1002/rem c© 2012 Wiley Periodicals, Inc.

REMEDIATION Autumn 2012
Exhibit 5. Normalized (ReCiPe endpoint) results for relative importance of impact categories
Exhibit 6. Distribution of impacts from the remedy life-cycle stages within fossil
depletion, PM formation, human toxicity, and climate change
c© 2012 Wiley Periodicals, Inc. Remediation DOI: 10.1002/rem 83

Life-Cycle Assessment of In Situ Thermal Remediation
Exhibit 7. Contribution of remedy installation activities to environmental impact
categories
Major Contributors and Potential Improvement Opportunities
Remedy Installation
The materials and activities associated with site preparation and drilling within theinstallation stage accounted for the majority of emissions to climate change, PMformation, and fossil depletion (Exhibit 7). The major impacts to these categories can betraced back to the production and combustion of fuel necessary to operate and transportthe equipment and transport personnel and materials to the site, as well as the asphalt andsteel materials. The ET-DSPTM system accounted for the majority of the impacts to thehuman toxicity category stemming from the use of copper (impacts due largely toupstream copper-mining activities). Impacts from the DPE systems were driven by theuse of granular activated carbon (GAC) and steel materials.
Opportunities for improvement in this stage of the remedy can be realized throughthe utilization of local resources (e.g., equipment, labor, materials, etc.) to reducetransportation impacts, increased use of high-recycled-content materials (e.g., copper,asphalt, and GAC), increasing the reuse potential for equipment, retrieval/reuse ofcopper grounding points, efficient drilling and paving equipment, cleaner fuels andemissions controls, and lower-impact transport modes (e.g., rail or barge). The asphaltcap, although a large contributor to impacts, will be utilized as a paved surface in thefuture reuse of the site.
84 Remediation DOI: 10.1002/rem c© 2012 Wiley Periodicals, Inc.
REMEDIATION Autumn 2012
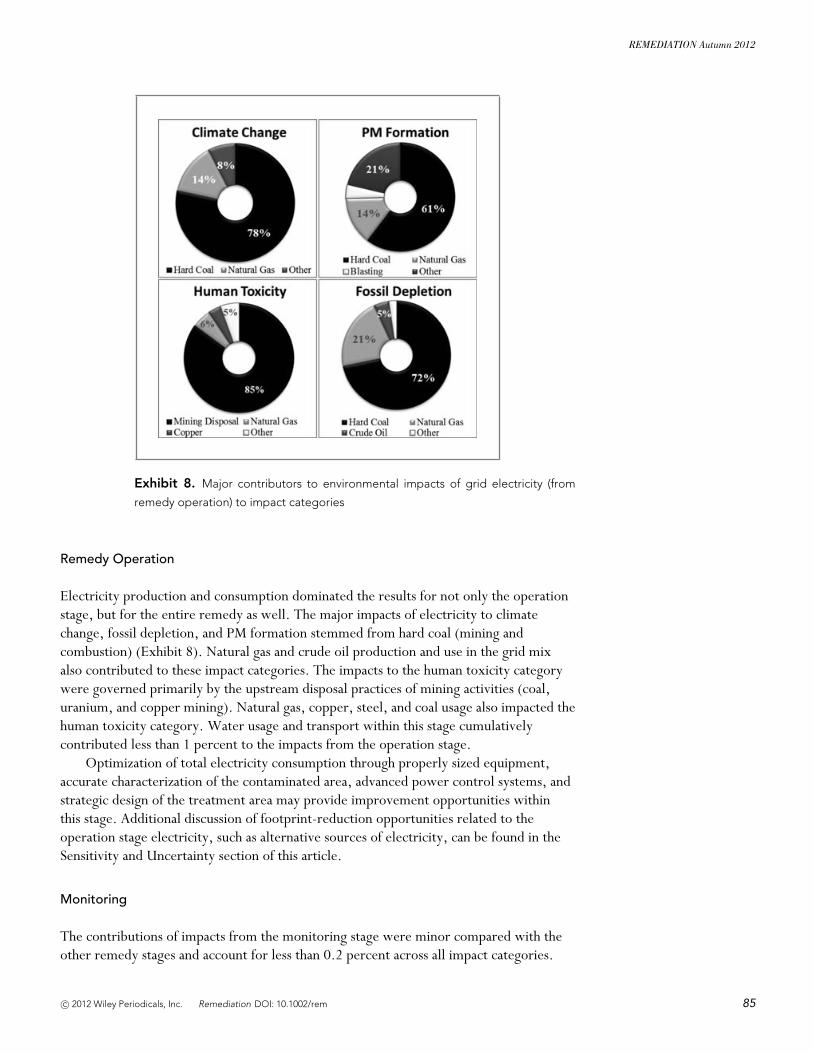
Exhibit 8. Major contributors to environmental impacts of grid electricity (from
remedy operation) to impact categories
Remedy Operation
Electricity production and consumption dominated the results for not only the operationstage, but for the entire remedy as well. The major impacts of electricity to climatechange, fossil depletion, and PM formation stemmed from hard coal (mining andcombustion) (Exhibit 8). Natural gas and crude oil production and use in the grid mixalso contributed to these impact categories. The impacts to the human toxicity categorywere governed primarily by the upstream disposal practices of mining activities (coal,uranium, and copper mining). Natural gas, copper, steel, and coal usage also impacted thehuman toxicity category. Water usage and transport within this stage cumulativelycontributed less than 1 percent to the impacts from the operation stage.
Optimization of total electricity consumption through properly sized equipment,accurate characterization of the contaminated area, advanced power control systems, andstrategic design of the treatment area may provide improvement opportunities withinthis stage. Additional discussion of footprint-reduction opportunities related to theoperation stage electricity, such as alternative sources of electricity, can be found in theSensitivity and Uncertainty section of this article.
Monitoring
The contributions of impacts from the monitoring stage were minor compared with theother remedy stages and account for less than 0.2 percent across all impact categories.
c© 2012 Wiley Periodicals, Inc. Remediation DOI: 10.1002/rem 85

Life-Cycle Assessment of In Situ Thermal Remediation
Exhibit 9. Contribution of monitoring activities to environmental impact categories
The electricity needs for sample analysis and reporting are the primary source of impactsto climate change, PM formation, human toxicity, and fossil depletion within themonitoring stage of the remedy (Exhibit 9). Again, the causes of these impacts can betraced back to the same disposal practices of mining activities that contributed to theimpacts from the operation electricity usage. The remaining causes of impacts to theselected four impact categories were attributed to the production and combustion of fuelneeded for transport of the technician and the samples. Although overall the contributionsto impacts in this stage were small, the potential for making footprint reductions shouldstill be considered.
Opportunities for footprint reductions in the monitoring stage in this and many otherremedies are related to the frequency and extent of sampling activities. Strategic samplingplans and efficient scheduling would allow for fewer technician trips to and from the site,less sample transport to the laboratory, and less analytical energy needs. Althoughsampling plans are not often amenable to changes at all times, the number and frequencyof sampling events should be reviewed when opportunities to modify remedial activitiesarise. Although not explored in this assessment, lower-cost and lower-impact passivesampling techniques are becoming more popular and could reduce labor time and cost,waste generation, and fuel consumption (Parsons, 2005).
Deconstruction
Transport processes were the major contributors of emissions to climate change, PMformation, human toxicity, and fossil depletion in the deconstruction, or end-of-life,
86 Remediation DOI: 10.1002/rem c© 2012 Wiley Periodicals, Inc.

REMEDIATION Autumn 2012
Exhibit 10. Contribution of deconstruction activities to environmental impact cat-
egories
stage. Greater than 50 percent of the impacts were due to the transport of site equipmentand materials for reuse on other remediation sites or to recycling facilities (Exhibit 10).The transport of project wastes for disposal at a landfill was also significant within thisstage and contributed an average of 42 percent of the impacts. Smaller impacts in thisstage were attributed to the ultimate disposal of wastes in a landfill.
Much of the in situ thermal and DPE treatment equipment is reused at the completionof the project, which significantly cuts down on materials being sent to landfill as well asthe virgin materials necessary to manufacture new equipment. Other opportunities forfootprint reductions in this stage may exist by using best management practices such asalternative modes of transport (e.g., rail or barge), cleaner fuels, and/or emission controldevices (US EPA, 2010b), closer disposal facilities, and onsite reuse of project wastes.
The results of this analysis are specific to the goal and scope and boundary conditionsof this LCA. The results are not meant for comparison to other technologies but asawareness-building information to help identify significant contributors to theenvironmental footprint of this in situ thermal remedy so environmentalfootprint-reduction opportunities can be understood and applied on future projects.
Sensitivity and Uncertainty
The in situ thermal technology industry has worked to minimize its electricity usage, butcurrent and future thermal applications can realize improvements in the environmentalfootprint-reduction efforts. One example of an improvement option is the use of cleaner
c© 2012 Wiley Periodicals, Inc. Remediation DOI: 10.1002/rem 87

Life-Cycle Assessment of In Situ Thermal Remediation
Exhibit 11. Percent contribution of operational electricity to the overall impacts of
the thermal remedy
Exhibit 12. Comparison of environmental impacts from wind-generated electricity,
natural gas–generated electricity, and RFC East US subregion electricity (in BTUs).
Ecoinvent processes used: electricity, low voltage, production RFCE, at grid/RFCE
U; Electricity, natural gas, at power plant/US with US electricity U; Electricity, at wind
power plant/RER with US electricity U
electricity in addition to the opportunities highlighted in the Results and Discussionsection. The results of this analysis were tested for sensitivity by analyzing the potentialchanges in impacts when a different source of electricity is utilized. The current state ofthe practice relies on purchasing energy from the grid. However, as renewable energyincreases its contribution to regional electricity grid mixes, the inherent impactsassociated with electricity production and usage for in situ thermal applications will likelydecrease across all impact categories (Exhibit 11). Exhibit 12 presents an example of therelative distributions in impacts (and potential impact reductions) across all categories
88 Remediation DOI: 10.1002/rem c© 2012 Wiley Periodicals, Inc.

REMEDIATION Autumn 2012
between powering 100 percent of the thermal system with wind-generated electricity,electricity generated by natural gas, and the RFC East US subregion.
To determine if the key impact categories identified in this analysis were sensitive tothe dominant contributor (electricity), the model was reanalyzed without electricity usageas an input. When electricity was removed from the model, the key impact categories(PM formation, climate change, human toxicity, and fossil depletion) based on endpointnormalization remained the same. The materials and processes responsible for theemissions changed from fossil fuel–mining activities for electricity production to fossilfuel–mining activities for fuel production (to operate equipment and for transportation).It is clear that the impacts from this remedy were driven by the activities related to fossilfuels irrespective of the ultimate product (electricity or fuel).
Uncertainty in LCA is a multifaceted issue. The majority of the data used in thismodel is primary data (actual, site-specific quantities). The input data were supplementedwith data from the ecoinvent database. Input data have variability, and known error on thedata was used where available. To assess the variability in the results of the model, theinput parameters to the model were sampled 1,000 times using a Monte Carlo samplingscheme. The output of this analysis yielded estimates of variation in the four key impactcategories: climate change, fossil depletion, particulate matter formation, and humantoxicity. It should be noted that the variability estimates represent propagation of erroronly from the input parameters through to the impact category of interest.
For this thermal LCA study, there were 753 substances included in the inventory.Once the impact assessment was applied, climate change, fossil depletion, particulatematter formation, and human toxicity were found to be the most significant impactcategories. The errors in the estimates for these impact categories can be traced to theirmost significant substance source. The error in climate change is driven mainly byvariability in carbon dioxide emissions to air. The fossil depletion impact error can betraced to hard coal. For the PM formation impact category, sulfur dioxide and nitrogenoxide emissions to air dominated variability in the result. Finally, variability in humantoxicity was governed by manganese, zinc, and barium emissions to water. This variabilitymay be due to the inherent error in assessing toxicological fate.
CONCLUSIONS
A detailed cradle-to-grave LCA was performed to identify and quantify the majorcontributors to environmental impacts from an in situ thermal remedy. The remedyoperation stage, specifically the electricity use, dominated the overall impacts. The sourceof these emissions was traced to the fossil fuels used in the electricity grid mix and themining activities (and disposal practices) associated with extracting the fossil fuels fromthe ground. Other significant impacts were observed in the remedy installation stage dueto the steel, GAC, copper, and asphalt materials (and associated mining disposalactivities), as well as the diesel fuel for equipment operation and transport. Smallerburdens were attributed to the monitoring and deconstruction stages of the remedy. PMformation, fossil depletion, human toxicity, and climate change were found to be the keyenvironmental categories impacted by the remedy.
Opportunities for reducing the environmental footprint within each remedy stagewere suggested. Utilizing a cleaner or renewable source of electricity in place of the
c© 2012 Wiley Periodicals, Inc. Remediation DOI: 10.1002/rem 89
Life-Cycle Assessment of In Situ Thermal Remediation
regional grid mix was identified as a major opportunity for improvement. Other potentialfootprint-reduction strategies included: using local resources to reduce transportationimpacts, increasing the use of high-recycled-content materials, increasing the reusepotential for treatment equipment, efficient drilling and paving equipment, cleaner fuelsand emissions controls, on-site reuse of wastes, and lower-impact modes of transport.
In situ thermal treatment can reliably remediate contaminated source areas withcontaminants present in low-permeability zones, providing complete destruction ofcontaminants in a short amount of time, quick return of the site to productive use, andminimized quantities of hazardous materials stored in landfills for future generations tomanage. However, this remediation strategy can also result in higher emissions over ashorter period of time. It is difficult to quantify the overall value of short-term cleanupswith intense treatment emissions versus longer-term cleanups with lower treatmentemissions because of the environmental, social, and economic trade-offs that need to beconsidered and understood. Decisions are generally made with significant input fromstakeholders such as the nearby community, government agencies, and others. LCA is arobust, quantitative tool to help inform these discussions and to complement a broadertoolbox for the evaluation of sustainable remediation strategies.
This work represents a recent fusion of two disciplines, LCA and environmentalremediation. Performing direct comparisons of the environmental footprints of a varietyof remediation technologies is sometimes difficult due to uncertainty in actual cleanuptime frames (e.g., is the cleanup time frame for pump and treat 10 years, 30 years, 100years, or more?) and ultimate extent of the site cleanup (e.g., complete destruction ofcontaminants, residuals having limitations on reuse, etc.). For comparative assertions, thescope, boundary, and function (functional unit) of the remedy must be equivalent. Theappropriate application of LCA can influence the remedy selection process, revealtrade-off considerations, and identify environmental footprint-reduction opportunities.
ACKNOWLEDGMENTS
Many thanks to Bill Flanagan and Matt Pietrzykowski at the GE Ecoassessment Center ofExcellence, Roy Blickwedel at GE Corporate Environmental Programs, and Rich Royerand Matt Petersen at GE Global Research, as well as McMillan-McGee, MKEnvironmental, and Arcadis.
REFERENCES
Bayer, P., Heuer, E., Karl, U., & Finkel, M. (2005). Economical and ecological comparison of granular activated
carbon (GAC) adsorber refill strategies. Water Research, 39, 1719–1728.
Bender, A., Volkwein, S., Battermann, G., Hurtig, H. W., Klopffer, W., & Kohler, W. (1998). Life cycle
assessment for remediation techniques: Methodology and application. In Proceedings of ConSoil ’98:
Sixth International FZK/TNO Conference on Contaminated Soil (pp. 367–376). London, UK: Thomas
Telford.
Butler, P. B., Larson-Hallock L., Lewis, R. Glenn, C., & Armstead, R. (2011). Metrics for integrating
sustainability evaluations into remediation projects. Remediation, 21(3), 81–87.
90 Remediation DOI: 10.1002/rem c© 2012 Wiley Periodicals, Inc.

REMEDIATION Autumn 2012
Cadotte, M., Deschenes, L., & Samson, R. (2007): Selection of a remediation scenario for a
diesel-contaminated site using LCA. International Journal of Life Cycle Assessment, 12,
239–251.
ecoinvent Centre. (2010). The life cycle inventory database version 2.2. Dubendorf, Switzerland: Swiss Centre
for Life Cycle Inventories.
Favara, P. J., Krieger, T. M., Boughton, B., Fisher, A. S., & Bhargava, M. (2011). Guidance for performing
footprint analyses and life-cycle assessments for the remediation industry. Remediation, 21(3),
39–79.
Frischknecht, R. (2010). LCI modeling approaches applied on recycling of materials in view of environmental
sustainability, risk perception and eco-efficiency. International Journal of Life Cycle Assessment, 15,
666–671.
Goedkoop, M., Heijungs, R., Huijbregts, M., Schryver, A. D., Struijs, J., & van Zelm, R. (2009). ReCiPe 2008: A
life cycle impact assessment method which comprises harmonised category indicators at the midpoint
and the endpoint level. First edition. Report 1: Characterisation; Ministry of Housing, Spatial Planning
and Environment (VROM). Retrieved from http://www.lcia-recipe.net
Higgins, M., & Olson, T. (2009). Life-cycle case study comparison of permeable reactive barrier versus
pump-and-treat remediation. Environmental Science & Technology, 43, 9432–9438.
Hong, J., & Li, X. (2012). Life cycle assessment comparison of substrates for the bioremediation of
pentachloroaniline under acidogenic/methanogenic conditions. International Journal of Life Cycle
Assessment, 17(1), 79–88.
Interstate Technology & Regulatory Council (ITRC), Green and Sustainable Remediation Team. (2011a).
Green and sustainable remediation: State of the science and practice, GSR-1. Washington, DC: Author.
Interstate Technology & Regulatory Council (ITRC), Green and Sustainable Remediation Team. (2011b).
Green and sustainable remediation: A practical framework, GSR-2. Washington, DC: Author.
International Organization for Standardization (ISO). (2006). 14040 International Standard: Environmental
management—Life cycle assessment—Principles and framework. Geneva, Switzerland: Author.
Lemming, G., Hauschild, M. Z., & Bjerg, P. L. (2010a). Life cycle assessment of soil and groundwater
remediation technologies: literature review. International Journal of Life Cycle Assessment, 15(1),
115–127.
Lemming, G., Hauschild, M. Z., Chambon, J., Binning, P. J., Bulle, C., Margni, M., & Bierg, P. L. (2010b).
Environmental impacts of remediation of a trichloroethene-contaminated site: Life cycle assessment of
remediation alternatives. Environmental Science & Technology, 44, 9163–9169.
Lesage, P., Ekvall, T., Deschenes, L., & Samson, R. (2007). Environmental assessment of Brown?eld
rehabilitation using two different life cycle inventory models—Part 2: Case study. International Journal of
Life Cycle Assessment, 12, 497–513.
Mak, M. S. H., & Lo, M. C. (2011). Environmental life cycle assessment of permeable reactive barriers: Effects
of construction methods, reactive materials, and groundwater constituents. Environmental Science &
Technology, 45, 10148–10154.
McMillan-McGee Corporation. (2011). ET-DSPTM—Technical description. Retrieved from
http://www.mcmillan-mcgee.com/mcmillan-mcgee/
c© 2012 Wiley Periodicals, Inc. Remediation DOI: 10.1002/rem 91
Life-Cycle Assessment of In Situ Thermal Remediation
Page, C. A., Diamond, M. L., Campbell, M., & McKenna, S. (1999). Lifecycle framework for assessment of site
remediation options: Case study. Environmental Toxicology & Chemistry, 18, 801–810.
Parsons. (2005). Results report for the demonstration of no-purge groundwater sampling devices at former
McClellan Air Force Base, California. Prepared for US Army Corps of Engineers Omaha District. Contract
F44650-99-D-0005.
Product Ecology Consultants. (2011). Sima Pro software version 7.3.3. Retrieved from
http://www.presustainability.com/content/simapro-lca-software
Sparrevik, M., Saloranta, T., Cornelissen, G., Eek, E., Fet, A. M., Breedveld, G. D., & Linkov, I. (2011). Use of
life cycle assessments to evaluate the environmental footprint of contaminated sediment remediation.
Environmental Science & Technology, 45, 4235–4241.
Suer, P., Nilsson-Paledal, S., & Norrman, J. (2004). LCA for site remediation: a literature review. Soil and
Sediment Contamination, 13, 415–425.
Sustainable Remediation Forum (SURF). (2009). Integrating sustainable principles, practices, and metrics into
remediation projects. Remediation Journal, 19(3), 5–114.
US Environmental Protection Agency (US EPA). (2010a). Emissions & generation resource integrated
database (eGRID). eGRID2010 Version 1.1. Year 2007 eGRID Subregion Resource Mix. Retrieved from
http://www.epa.gov/cleanenergy/documents/egridzips/eGRID2010V1 1 year07 SummaryTables.pdf
US Environmental Protection Agency (US EPA). (2010b). Green remediation best management practices:
Clean fuel & emission technologies for site cleanup. EPA 542-F-10-008. Retrieved from
http://www.clu-in.org/greenremediation/docs/Clean FuelEmis GR fact sheet 8-31-10.pdf
Volkwein S., Hurtig, H. W., & Klopffer, W. (1999). LCA concepts and methods—Life cycle assessment of
contaminated sites remediation. International Journal of Life Cycle Assessment, 4, 263–273.
Angela Fisher is an environmental engineer in the Ecoassessment Center of Excellence, which is part
of the Environmental Technology Laboratory at GE’s Global Research Center in Niskayuna, New York. She
focuses most of her efforts on product LCA and sustainability analyses, as well as the development and
promotion of sustainability approaches and life-cycle thinking for site remediation activities. She leads GE’s
Sustainable Remediation Team and serves on the board of trustees for the Sustainable Remediation Forum
(SURF). She received her undergraduate degree in environmental resource management and graduate degree in
environmental engineering from The Pennsylvania State University in University Park, Pennsylvania.
92 Remediation DOI: 10.1002/rem c© 2012 Wiley Periodicals, Inc.